
Submitted:
17 February 2024
Posted:
20 February 2024
Read the latest preprint version here
Abstract
In the field of railroad safety, effective detection of surface cracks is critical, necessitating reliable, high-speed non-destructive testing (NDT) methods. This study introduces a hybrid Eddy Current Testing (ECT) probe, specifically engineered for railroad inspection, to address the common issue of 'lift-off noise' due to varying distances between the probe and test material. Unlike traditional ECT methods, this probe integrates transmit and differential receiver coils, aiming to enhance detection sensitivity and minimize lift-off impact. The research involves optimizing the ECT probe through various driver coils, focusing on three key aspects: a) explains methodology of real-time data processing algorithm; b) probing the frequency range near the receiver coil's electrical resonance, c) assessing sensitivity changes across different lift-off distances. The experimental outcomes indicate that the newly designed probe with figure 8-shape driver coil significantly improves sensitivity in detecting surface cracks on railroads. It achieves an impressive signal-to-noise ratio (SNR) exceeding 60 for defects with minimal dimensions of 0.8 mm in width and depth. This study represents a notable advancement in NDT techniques, with profound implications for enhancing railroad safety by improving crack detection efficiency.
Keywords:
Eddy current testing
; lift-off
; real-time inspection
; probe optimization
; signal-to-noise ratio
1. Introduction
Non-destructive testing (NDT) plays a crucial role in ensuring the safety and reliability of engineering structures across various sectors, including automotive, aerospace, and civil engineering. A critical component in the railway system is the railway track, which is susceptible to various types of cracks. Current standards for railway inspection predominantly rely on visual testing (VT) methods, which are time-consuming, qualitative, and the VT remain limited by top surface inspection and the need for expertise. Monitoring surface and sub-surface defects, including burns, squat-like rail cracks, and others type of local damages costs for the millions of pounds every year in U.K. [1] railway inspection and capability of real-time inspection of these defects presents significant challenges, with only a limited array of NDT techniques available. Among these, Ultrasonic Testing (UT) is frequently utilized due to its ability to penetrate the bulk material of the track. However, this technique encounters a notable limitation in identifying both surface and subsurface anomalies [2]. While it is possible to detect surface imperfections through the reflective echoes of ultrasonic waves once they reach a particular size, UT is not capable of assessing the extent of these defects nor can it differentiate among various defect categories. Thus, there is an urgent need for a more efficient and reliable surface and sub-surface inspection method to ensure structural integrity of rail tracks. Consequently, Eddy Current Testing (ECT) has been identified as an appropriate NDT technique for in-line railway inspection. To realize this application and facilitate full automation of the inspection process, the integration of various distinct technologies is imperative. This integration is essential to address the complex requirements of real-time, efficient, and accurate railway inspection. This project aims to substantially enhance the efficiency of real-time railroad inspection, as illustrated in Figure 1.
The primary challenge in measurements of this nature is not inherently linked to the limitations of sensor technology but rather pertains to the management and processing of the data collected [3]. There were many attempts to embed the similar ECT systems for online detection and location of rails defects published before [4,5,6]. However, the lack of available EC probe optimization studies for real-time inspection [7] of rail tracks motivated to current project. Specific online data processing algorithm is provided to manage with the huge amount of data effectively associated with the nature of this type of inspection. During each inspection, the system aboard the train accumulates a substantial volume of data, within which only a fraction is of significant relevance. Identifying and extracting these pertinent data segments is crucial for determining their precise locations along the track. Typically, specialized research groups are dedicated to the management of such data, employing strategies that involve either transmitting the data for remote analysis or conducting local analysis onboard to detect anomalies that surpass predefined thresholds. Despite the fact that based on the proposed improved system as is shown in Figure 1 this project needs to characterize the different types of actual types of railroads damages this initial research is limited to search and identification parts.
This initial research aims to optimize the proposed ECT probe designs to develop inspection system integrated within train systems, capable for a real-time inspection in dynamic conditions. Further studies will be more focused on investigation the characterization of localized rail track defects, particularly quats. The goal is to optimize the sensor design, enhancing its sensitivity to these specific defects under varying inspection conditions, including factors like speed and vibration. In response to these operational challenges, the study has developed a new hybrid ECT probe, tailored to fulfill the unique requirements of real-time, accurate rail track inspection.
A substantial body of research has been dedicated to the optimization of eddy current probes, with various studies focusing on enhancing their efficacy in diverse applications. In an exploration of the efficacy of ECT for in-plane fiber waviness detection in unidirectional carbon fiber reinforced plastic (CFRP), [8] employed a diverse set of probes: circular driving, symmetrical driving, and uniform driving. This study is distinguished by its methodical comparative analysis and the integration of sophisticated image processing techniques, including the Canny filter and Hough transform, to ascertain the probes’ precision and accuracy against X-ray CT imaging benchmarks. The research notably identifies the uniform driving probe as superior in accurately detecting fiber waviness angles above 2° in unidirectional CFRP, evidenced by a root mean square error of 1.90° and a standard deviation of 4.49°. However, the study’s applicability may be constrained by its focused examination of specific waviness angles and CFRP types.
Expanding on ECT probe optimization, [9] investigates the Near Electrical Resonance Signal Enhancement (NERSE) phenomenon. This study reveals that operating an absolute EC probe near its electrical resonance, particularly in the 1 to 5 MHz frequency range, significantly amplifies defect signals in aerospace superalloy Titanium 6Al-4V. The research reports Signal-to-Noise Ratio (SNR) peaks up to 3.7 times higher near resonance frequencies, attributed to defect-induced resonant frequency shifts. This finding posits a straightforward yet efficacious approach to enhancing the sensitivity of standard industrial EC testing through the NERSE frequency band.
The investigation in [10] introduces a novel sensor design aimed at advancing nondestructive testing methods, with a specific focus on delamination detection in CFRP. Experimental validation on cross-ply CFRP laminates supports the method’s effectiveness, though its broad applicability may be limited by certain conditions and assumptions inherent in the study.
In the realm of real-time EC inspection, [11] focuses on giant magnetoresistive (GMR) field sensors, juxtaposing finite-element model (FEM) predictions with experimental findings to underscore the development of a swift and flexible inspection system. Concurrently, [12] details the optimization of a low-frequency EC technique for internal defect detection in steel structures, analyzing a custom-designed magnetic sensor system in tandem with FEM results. This study explores the fine-tuning of probes using magnetoresistive sensors, supported by simulations with CIVA software.
In [13] delineates the development of a flexible planar EC sensor array, targeting microcrack inspection in critical airplane components. The study details the sensor design, measurement mechanics, and correlates these with FEM outcomes.
In a significant advancement, in [14] present a differential coupling double-layer coil for eddy current testing, achieving notable improvements in sensitivity and lift-off tolerance. This coil’s innovative double-layer structure and differential coupling energy mechanism demonstrate the potential of strategic coil design and frequency optimization in overcoming traditional limitations of eddy current probe sensitivity, especially in scenarios with high lift-off. An extended literature review about applications and advantages of planar rectangular receiver in ECT provided in this study.
Further progress is reported in [15], which proposes a novel figure 8-shaped coil for transmitter-receiver (T-R) probes. This unique design effectively counters signal distortion due to lift-off variation and maintains consistent output when aligned with the CFRP’s fiber orientation. The probe is characterized by its insensitivity to lift-off variations and enhanced sensitivity to defects in CFRPs.
Lastly, authors in [16] present an analytical model for a figure 8-shaped coil comprising two oblique elliptical coils. This model enables the manipulation of the electromagnetic concentrative region and the eddy current density. Adjustments in the elliptical shape or the spread angle between the coils lead to intensified and expanded eddy currents, concentrating under the coil’s symmetric center. This innovative design and analytical methodology significantly elevate the accuracy in detecting conductive material defects, marking a pivotal development in nondestructive testing methods.
While each study substantially enriches the field of ECT probe optimization and nondestructive testing, their practical application varies based on specific conditions, material types, and defect characteristics. These advancements lay the groundwork for exploring the applicability of novel EC probes in railroad inspection.
The objective of this paper is the development of ECT sensors tailored for real-time surface inspection of rail tracks, exploring design parameters of a novel directional ECT probe for detecting surface-breaking cracks and common railway flaws. This research, aimed at optimizing eddy current probes presented in [17], seeks to significantly enhance real-time inspection effectiveness, potentially marking a breakthrough in railroad inspection methodologies.
2. Methodology
The development of the proposed inspection system, as depicted in Figure 1, necessitates comprehensive studies to verify the feasibility and reliability of integrating the probe into the inspection train. This integration must account for variations in speed and vibrations from both the train and rail tracks, necessitating probe optimization. However, the current experimental setup is primarily aimed at optimizing the probe design for heightened sensitivity to common defects in ferromagnetic materials, rather than replicating the exact operational environment.
The directional probe design previously outlined in references [8] has not yet been tested on metallic components. Studies in [8,17,18] have demonstrated optimum sensitivity beyond the receiver’s resonance for CFRP materials, which now requires validation for ferromagnetic materials. Therefore, our methodology involves multiple studies focusing on real-time eddy current (EC) probe optimization.
This research utilizes the signal-to-noise ratio (SNR) for quantitative evaluation, comparing the sensitivity of the best probe configuration from earlier research [17] with the two novel sensor designs proposed in this study. Investigating the optimal frequency is crucial for boosting sensitivity to specific defects. This study delves into the proximity frequency range, resonating the receiver coil to elevate SNR levels. Similar research [3] analyzed phase shifts with frequency variations to identify the optimal operational frequency, noting that increased phase shifts improve defect depth resolution and decrease detection errors. Another critical aspect of this research is determining the optimal lift-off distance, ranging from 0.25 to 1 mm, as lift-off variation is a key parameter before in-situ inspection. This involves balancing sensitivity against lift-off distance, an essential factor in eddy current probe optimization. Related research [4] conducted fixed-distance (1 mm) inspections from the rail track surface by integrating EC instrumentation into a grinding train for early detection of surface damages. This highlights the importance of understanding the trade-offs between sensitivity and lift-off distance for effective EC probe deployment in real-world applications.
2.1. Sensor Design
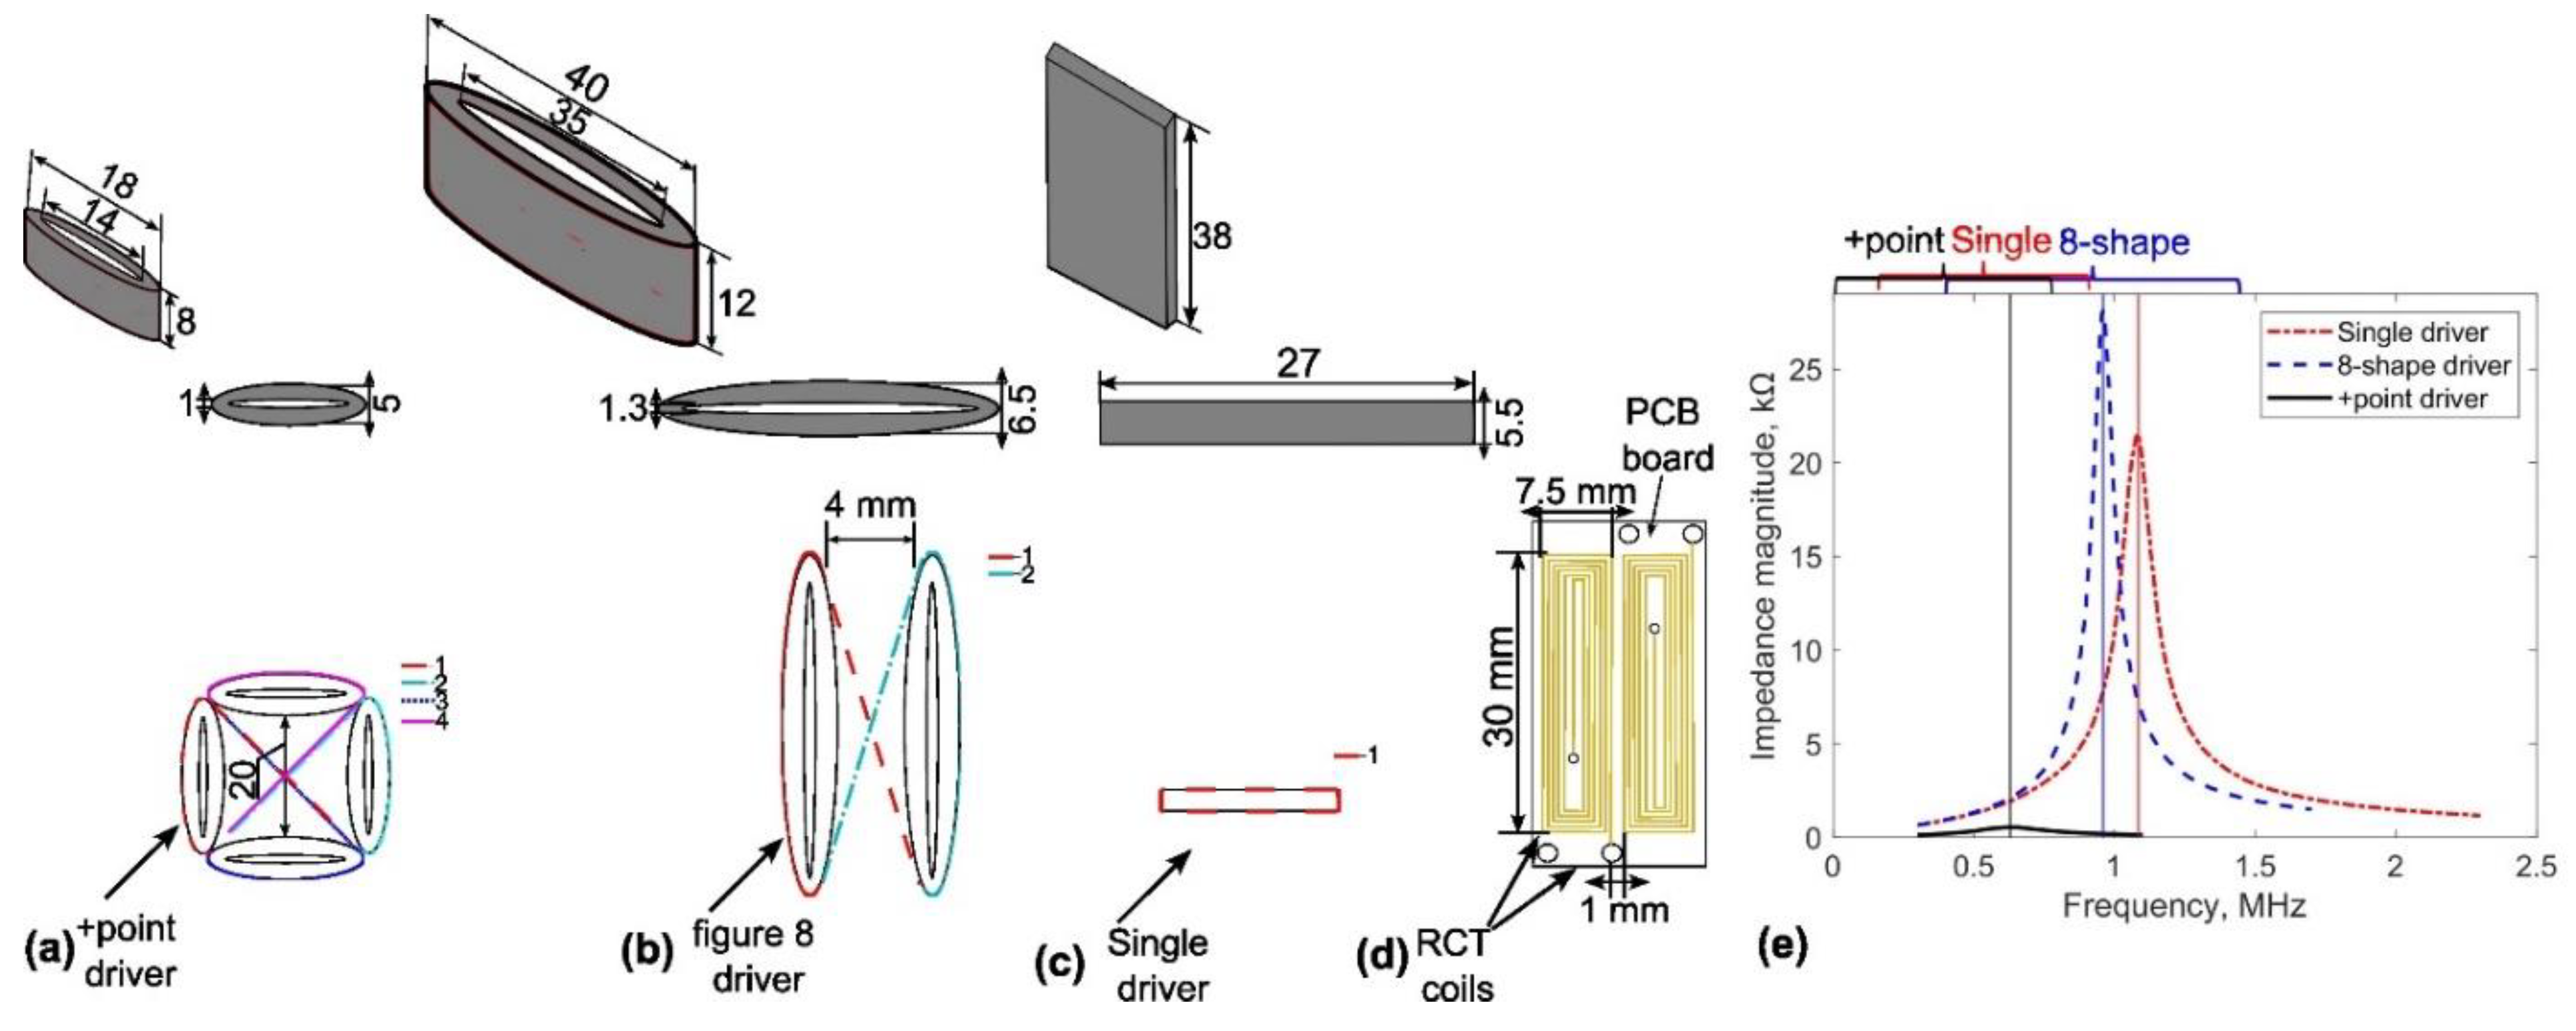
The paper presents a frequency selection study focusing on three sensor designs, depicted in Figure 2. To minimise the lift off noise differentially winded two adjacent rectangular sensors and to increase the induced eddy currents (ECs) density and concentrative area within the material single driver, special figure 8-shape elliptical and four figure 8-shape (+point) driver coils were designed and manufactured. The initial design utilizes singular excitation driver coils, while subsequent modifications involve altering the aspect ratio of the previous non-uniform configuration [17], as depicted in Figure 2(a), tailored for the inspection requirements of railroad infrastructure. Drawing upon principles from eddy current (EC) theory, the inclusion of winding +point [3] and 8-shape [15] configurations aims to amplify the sensitivity of pickup signals. However, it is noteworthy that similar driver designs have not been previously manufactured to address the specific needs of the targeted application.
2.2. Driver Coil Design
To optimize performance under the distributed magnetic field of the driver coil, the width of the coil recommended to be equal or exceed the length of the pickup coil. Increasing the number of turns in the driver coil strengthens the magnetic field but raises inductance, consequently lowering resonance frequency. The fabrication of driver coils with 62, 72, and 66 turns on ferrite, corresponding to single, +point, and 8-shape configurations, respectively, ensures the generation of a suitably robust magnetic field to produce the desired excitation frequency signal. Table 1 provides driver and pickup coils parameters.
Peak frequencies of the driver coil vary based on winding quality and turn count. Figure 3 shows three driver winding methods along with their dimensions and resonance frequencies. The driver coils’ impedance spectra were assessed employing a Network Analyzer (TE3001, Trewmac Systems, Australia). Resonant frequencies of approximately 1.1, 0.6, and 1 MHz were observed for the single, +point, and figure 8-shape drivers, respectively.
2.3. Planar Rectangular Pickup Coils
The planar rectangular pickup coils advantages and some limitations along with its application challenges is reviewed by study in [14]. The consistency of detected signals and the flexibility to manufacture with various dimensions to accommodate for different track widths make printed PCB-based technology ideal candidate for manufacturing. The sensor parameters and dimensions are presented in Table 2 and Figure 3 respectively.
Figure 3.
Directional EC probe design: (a) winding method of the +Point, (b) figure 8-shape, (c) rectangular single drivers d) rectangular (RCT) pickup coil dimensions (top-down view) and resonant frequencies of different driver coils.
Figure 3.
Directional EC probe design: (a) winding method of the +Point, (b) figure 8-shape, (c) rectangular single drivers d) rectangular (RCT) pickup coil dimensions (top-down view) and resonant frequencies of different driver coils.
2.4. Amplifier
In eddy current testing (ECT) non-destructive evaluation (NDE), limitations arise from noise sources like sample electromagnetic property variations, vibration, temperature changes, and probe lift-off and tilt. Utilizing signal-to-noise ratio (SNR) as a metric for probe performance evaluation is advisable. The low-pass filtering effect of the feedback amplifiers is characterized by the closed-loop bandwidth, which is the unity gain-bandwidth product divided by the closed-loop gain. While further reducing bandwidth at a specific gain value is feasible, it introduces phase lags at target frequencies, impacting gain.
Figure 4 illustrates the fundamental components of the amplifier and the coil input circuits. In the simplified circuit diagram, all external circuitry is situated left of the “Input 1” & “Input 2” terminals, with onboard components to their right. Coils L1 & L2 function as pickup coils, inducing emfs in series opposition, yielding a differential voltage output. L3 and L4, the drive coils, wound in a “figure of eight” pattern around ferrite bar cores, generate opposing AC fields at adjacent poles. The drive coil tuning capacitor, chosen for resonance, amplifies coil currents and voltages, enhancing sensitivity and signal-to-noise ratio. The combined output of the pickup coils serves as a differential input signal for the amplifier, connected to Input 1 & 2 terminals. The input circuit features switch-selectable capacitors for coil tuning and various loading resistors, with the option to disconnect the center ground connection. Implementing a non-earth referenced input via a signal isolation transformer is preferred, offering cost-effective common mode rejection. The amplifier circuit, inclusive of the isolation transformer, delivers a gain of 10 (or +20dB) into an infinite resistance load, with a flat frequency response between 100kHz and 2MHz. Beyond 5MHz, gain reduces to 19.3 dB with a 40° phase lag, with a 3dB drop at 11.25MHz. For remote signal transmission, 50 ohm coaxial cable is advised, with a 50 ohm termination for cables longer than approximately 3 meters, typically reducing gain by 6dB. Capacitor switchers were integrated into the amplifier board to adjust the receiver coil’s resonant frequency within a specified range. Equation 1 provides a formula for calculating the required capacitance for desired resonance based on probe coil inductance and target frequency.
where ω₀ = 2πf₀. Here, f₀ represents the desired resonant frequency (1.5 MHz), C is the tuning capacitance in farads, and L denotes the probe inductance (1.0 × 10⁻⁶ H).
2.5. Methodology for Estimating SNR
The evaluation of three probe design sensitivities and identification section in Figure 1 is quantitatively assessed using SNR. Figure 5 depicts the proposed methodology for identification based on a 0.4MHz exemplar sensor signal using an EC probe with a figure 8-shaped driver coil. Data collection begins from 0 to 50 mm over a large non-damaged area of the rail track (as shown in Figure 5). This data is utilized for automatic calculation of twice the root-mean-squared (RMS) value of background structural noise as a threshold to distinguish sensor signals (indicated by the horizontal dashed line in Figure 5). Any signal exceeding twice the mean RMS noise voltage is considered a sensor signal and undergoes peak value detection. Upon passing the defective zone, the algorithm automatically provides information about the estimated SNR calculated using the equation:
3. Experiments
3.1. Rail Track with Induced Artificial Defect
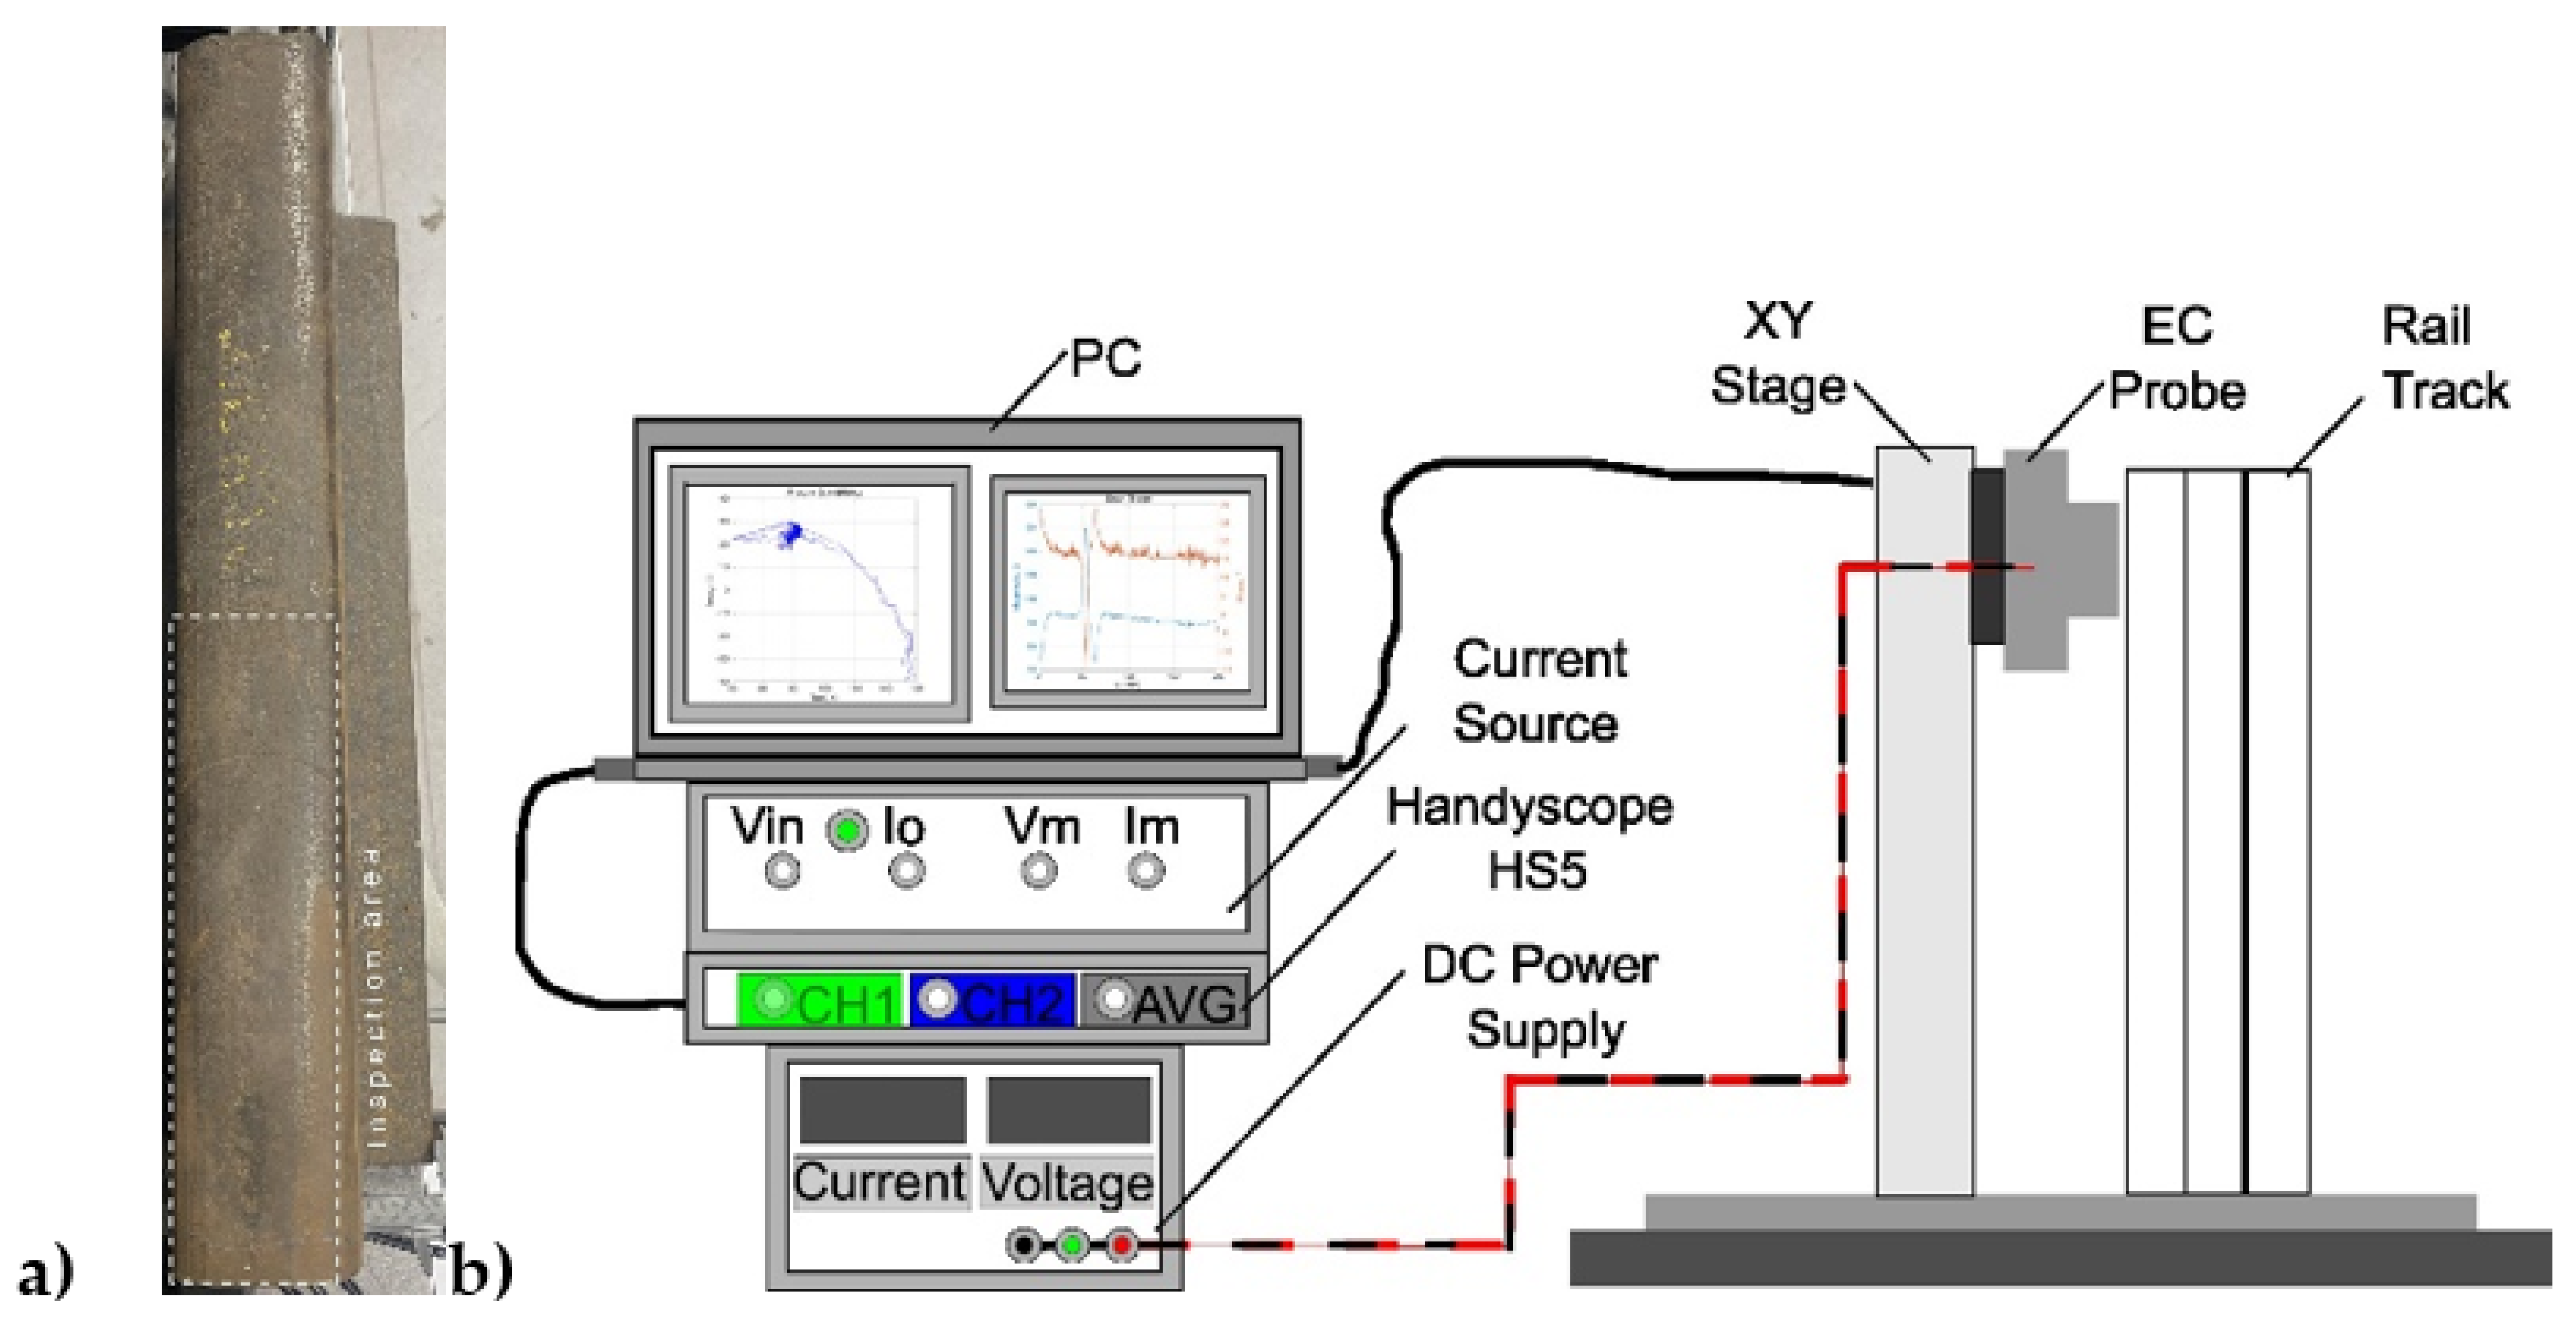
A series of sore cuts introduced on the top surface of rail track specimen for proposed inspection system’s optimization study as is shown in Figure 6 a). The material of the sample is made from the standard R260 grade rails. The probe capabilities can be evaluated best by inspecting one artificial defect over the relatively large non-defected area. The dimensions of sore cut are 40x0.8x0.8 mm.
3.2. Measurement Set-Up
The experimental set-up is illustrated in Figure 6 b). It comprises an handyscope (TiePie Engineering) generating a sinusoidal signal, linked to a Holland current source (Sonemat). One output from the current source supplies a consistent current to the driver coil for magnetic field excitation. The other output is connected to the handyscope to serve as a stable voltage reference for voltage difference comparison with received pickup signals from the probe. The DC power supply HY 3003 provides a ±9.5 V DC supply to the differential amplifier. Real-time control and post-processing of measurements are handled by a MATLAB script interfacing the handyscope with the computer.
Figure 6.
a) Experimental set-up b) Rail track sample.
4. Results
4.1. Frequency Selection Study
The experimental setup involved conducting at least three repeated independent measurements across a 200 mm range for each specimen to enhance precision in real-time using MATLAB. The movement increment was set at 0.125 mm, resulting in a maximum of 1600 data points. The collected data underwent post-processing to detrend signal amplitudes, followed by smoothing using MATLAB’s built-in filtering, and subsequent calculation of the signal-to-noise ratio (SNR). Further details on post-processing methods can be found in Appendix A1 of Ref. [17].
The experimental investigation into optimum frequency selection for eddy current (EC) probes utilized frequency ranges of 0.2÷0.7 MHz with a single driver, 0.4÷1.3 MHz with a +point driver, and 0.15÷0.6 MHz with a figure 8-shape driver. The selection of frequency ranges was influenced by observed noise levels. Higher frequency ranges near the resonant frequency of the pickup coil were avoided due to challenges posed by factors such as magnetic hysteresis, complex microstructure, and high permeability in ferromagnetic materials, except for the EC probe with the +point driver. Optimizing EC probes necessitates careful control of factors affecting measurement noise levels and adjustment of the resonant frequency. Capacitors of 10 nF were used to tune the pickup coil’s resonant frequency, each coil having an inductance of approximately 1µH, tuned for resonance at the operational frequency. Resonance at 1.5 MHz could be achieved by calculating the required capacitance using Equation 1.
Figure 7 displays the raw EC data for each probe alongside overall sensitivity results, while Figure 8 illustrates SNR estimation outcomes around the sensor coil resonant frequency, demonstrating improved signal strength and reduced uncertainty across various frequency ranges. Among the three EC probes, the figure 8-shape configuration outperformed the other two, nearly doubling its SNR, with the maximum SNR recorded at 65 at 0.25 MHz. The EC probe with the single driver exhibited real-time inspection capability, achieving an SNR of approximately 13 at 0.5 MHz, while the +point driver probe doubled the performance, achieving around 27 SNR at 0.6 MHz.
Further investigation into varying lift-off distances and their impact on ECT sensitivity will focus on the probe with the figure 8-shape configuration.
4.2. D.Lift-Off Distance and Optimum Probe Sensitivity
A minimum of three independent measurements were conducted, with variations in both frequency and lift-off distance within a range of 0.1 to 1 mm. MATLAB software was utilized to ensure real-time accuracy in data acquisition and analysis. Figure 9, Figure 10 and Figure 11 present the electromagnetic (EC) probe with an 8-shaped sensitivity profile, demonstrating its response as a function of varying lift-off distances. A general trend was observed: as the lift-off distance between the sensor and the material surface increased, a significant decrease in the signal-to-noise ratio (SNR) was recorded. The rationale for maintaining a constant frequency range was to evaluate the noise level at different lift-off distances. This approach is critical for future studies, where the integration of this probe configuration might be necessary under varying operational frequencies.
Commencing at the upper frequency ranges of 0.55-0.6 MHz, a notable decline in the sensitivity of the electromagnetic (EC) probe was observed at a lift-off distance of 0.5 mm, as depicted in Figure 10. Even when the lift-off distance was increased to 1 mm, the probe exhibited the lowest sensitivity in terms of voltage magnitude, yet it maintained a relatively high signal-to-noise ratio (SNR) of approximately 32. The mean signal voltage values from three measurements were analyzed, along with the root mean square (RMS) noise associated with each, and plotted as a function of lift-off distance at a frequency of 0.25 MHz, as illustrated in Figure 12. These results indicate that the EC probe, featuring a figure-8-shaped driver, demonstrates a high voltage magnitude at lift-off distances ranging from 0.25 to 0.5 mm, while still maintaining excellent detection sensitivity, with an SNR exceeding 30, within a specific lift-off range.
5. Conclusions
The study explored various combinations of excitation coil designs in conjunction with a rectangular planar receiver coil, assessing their potential integration into an inspection train for a real-time, high-speed, and reliable rail track inspection system. The sensitivity of detection as a function of lift-off was also scrutinized. It was concluded that detectability could be enhanced using a figure-8-shaped driver coil at a frequency of 0.25 MHz, while maintaining a lift-off distance of approximately 0.5 mm. The results from both case studies indicated that the Tx-Rx sensor exhibits superior signal-to-noise ratio (SNR) in detecting ferromagnetic material structures. Measurements revealed that ferromagnetic material structures are more readily detected at relatively low frequencies (~0.3MHz), facilitating in-line electronics and data acquisition. The probe with the figure-8-shaped driver coil demonstrated optimal SNR near the resonant frequency peak of the pickup coil.
The enhanced inspection system represents an innovative and fundamentally promising application, closely aligning with the criteria requisite for integration in Industry 4.0. To fully harness the potential of this advanced inspection system and optimize its use, it is imperative to include real rail track defect characterization and demonstrate its effectiveness in detecting manufacturing flaws in authentic environments. Consequently, future work will involve validating the effectiveness of a new Eddy Current (EC) instrument, integrated into a track inspection trolley at the Scunthorpe plant of British Steel. This future research will focus on detecting squats and other localized types of damage.
Author Contributions
Writing – original draft, Meirbek Mussatayev; Writing – review & editing, Mohammed Alanesi. All authors have read and agreed to the published version of the manuscript.
Acknowledgments
I extend my sincere gratitude to my supervisors, R. Hughes and P. Wilcox, for their invaluable suggestions and guidance. Special thanks are due to Prof R. Lewis from Sheffield University, U.K., for his expert advice. Additionally, I acknowledge the financial support provided by the Bolashak International Scholarship, Kazakhstan, which enabled my research in this field.
Conflicts of Interest
The authors declare no conflict of interest.
References
- Muhamedsalih, Y.; Hawksbee, S.; Tucker, G.; Stow, J.; Burstow, M. Squats on the Great Britain rail network: Possible root causes and research recommendations. Int. J. Fatigue 2021, 149, 106267. [Google Scholar] [CrossRef]
- Xiong, L.; Jing, G.; Wang, J.; Liu, X.; Zhang, Y. Detection of Rail Defects Using NDT Methods. Sensors 2023, 23, 4627. [Google Scholar] [CrossRef] [PubMed]
- Kwon, S.-G.; Lee, T.-G.; Park, S.-J.; Park, J.-W.; Seo, J.-M. Natural rail surface defect inspection and analysis using 16-channel eddy current system. Appl. Sci. 2021, 11, 8107. [Google Scholar] [CrossRef]
- Pohl, R.; Krull, R.; Ag, D.B.; Meierhofer, R.; Sa, S.I. A new Eddy Current Instrument in a Grinding Train. pp. 1–7, 2006.
- Dey, A.; Thomas, H.-M.; Pohl, R. The Important Role of Eddy Current Testing in Railway Track Maintenance. p. 4, 2008.
- Alvarenga, T.A.; Carvalho, A.L.; Honorio, L.M.; Cerqueira, A.S.; Filho, L.M.A.; Nobrega, R.A. Detection and Classification System for Rail Surface Defects Based on Eddy Current. Sensors 2021, 21, 7937. [Google Scholar] [CrossRef] [PubMed]
- AbdAlla, A.N.; A Faraj, M.; Samsuri, F.; Rifai, D.; Ali, K.; Al-Douri, Y. Challenges in improving the performance of eddy current testing: Review. Meas. Control. 2018, 52, 46–64. [Google Scholar] [CrossRef]
- Kosukegawa, H.; Kiso, Y.; Hashimoto, M.; Uchimoto, T.; Takagi, T. Evaluation of detectability of differential type probe using directional eddy current for fibre waviness in CFRP: Advanced Eddy Current Testing for CFRP. Philos. Trans. R. Soc. A: Math. Phys. Eng. Sci. 2020, 378, 20190587. [Google Scholar] [CrossRef] [PubMed]
- Hughes, R.; Dixon, S. Performance analysis of single-frequency near electrical resonance signal enhancement (SF-NERSE) defect detection. NDT E Int. 2019, 102, 96–103. [Google Scholar] [CrossRef]
- Mizukami, K.; bin Ibrahim, A.S.; Ogi, K.; Matvieieva, N.; Kharabet, I.; Schulze, M.; Heuer, H. Enhancement of sensitivity to delamination in eddy current testing of carbon fiber composites by varying probe geometry. Compos. Struct. 2019, 226, 111227. [Google Scholar] [CrossRef]
- Nair, N.; Melapudi, V.; Jimenez, H.; Liu, X.; Deng, Y.; Zeng, Z.; Udpa, L.; Moran, T.; Udpa, S. A GMR-based eddy current system for NDE of aircraft structures. IEEE Trans. Magn. 2006, 42, 3312–3314. [Google Scholar] [CrossRef]
- Lee, K.H.; Park, I.H. Low frequency eddy current method for internal defect inspection of steel structure. 2012 6th Int. Conf. Electromagn. F. Probl. Appl. ICEF’2012, pp. 1–4, 2012. [CrossRef]
- Chen, D.; Xie, R.; Zhou, W.; Hu, H.; Pan, M. Multi-channel transimpedance measurement of a planar electromagnetic sensor array. Meas. Sci. Technol. 2015, 26. [Google Scholar] [CrossRef]
- Chen, K.; Gao, B.; Tian, G.Y.; Yang, Y.; Yang, C.; Ma, Q. Differential Coupling Double-Layer Coil for Eddy Current Testing with High Lift-Off. IEEE Sensors J. 2021, 21, 18146–18155. [Google Scholar] [CrossRef]
- Wu, D.; Cheng, F.; Yang, F.; Huang, C. Non-destructive testing for carbon-fiber-reinforced plastic (CFRP) using a novel eddy current probe. Compos. Part B: Eng. 2019, 177, 107460. [Google Scholar] [CrossRef]
- Xiao, C.-Y.; Zhang, J. Analytical solutions of transient pulsed eddy current problem due to elliptical electromagnetic concentrative coils. Chin. Phys. B 2010, 19. [Google Scholar] [CrossRef]
- Mussatayev, M.; Yi, Q.; Fitzgerald, M.; Maes, V.K.; Wilcox, P.; Hughes, R. Directional eddy current probe configuration for in-line detection of out-of-plane wrinkles. Compos. Part B: Eng. 2024, 268, 111048. [Google Scholar] [CrossRef]
- Kosukegawa, H.; Kiso, Y.; Horibe, J.; Hashimoto, M.; Takagi, T. Electromagnetic Nondestructive Inspection of Fiber Misalignment in CFRP with Directional Eddy Current. 2019. Available online: http://www.ndt.net/?id=25069 (accessed on 7 June 2022).
Figure 1.
Improved efficiency of current railroad inspection.
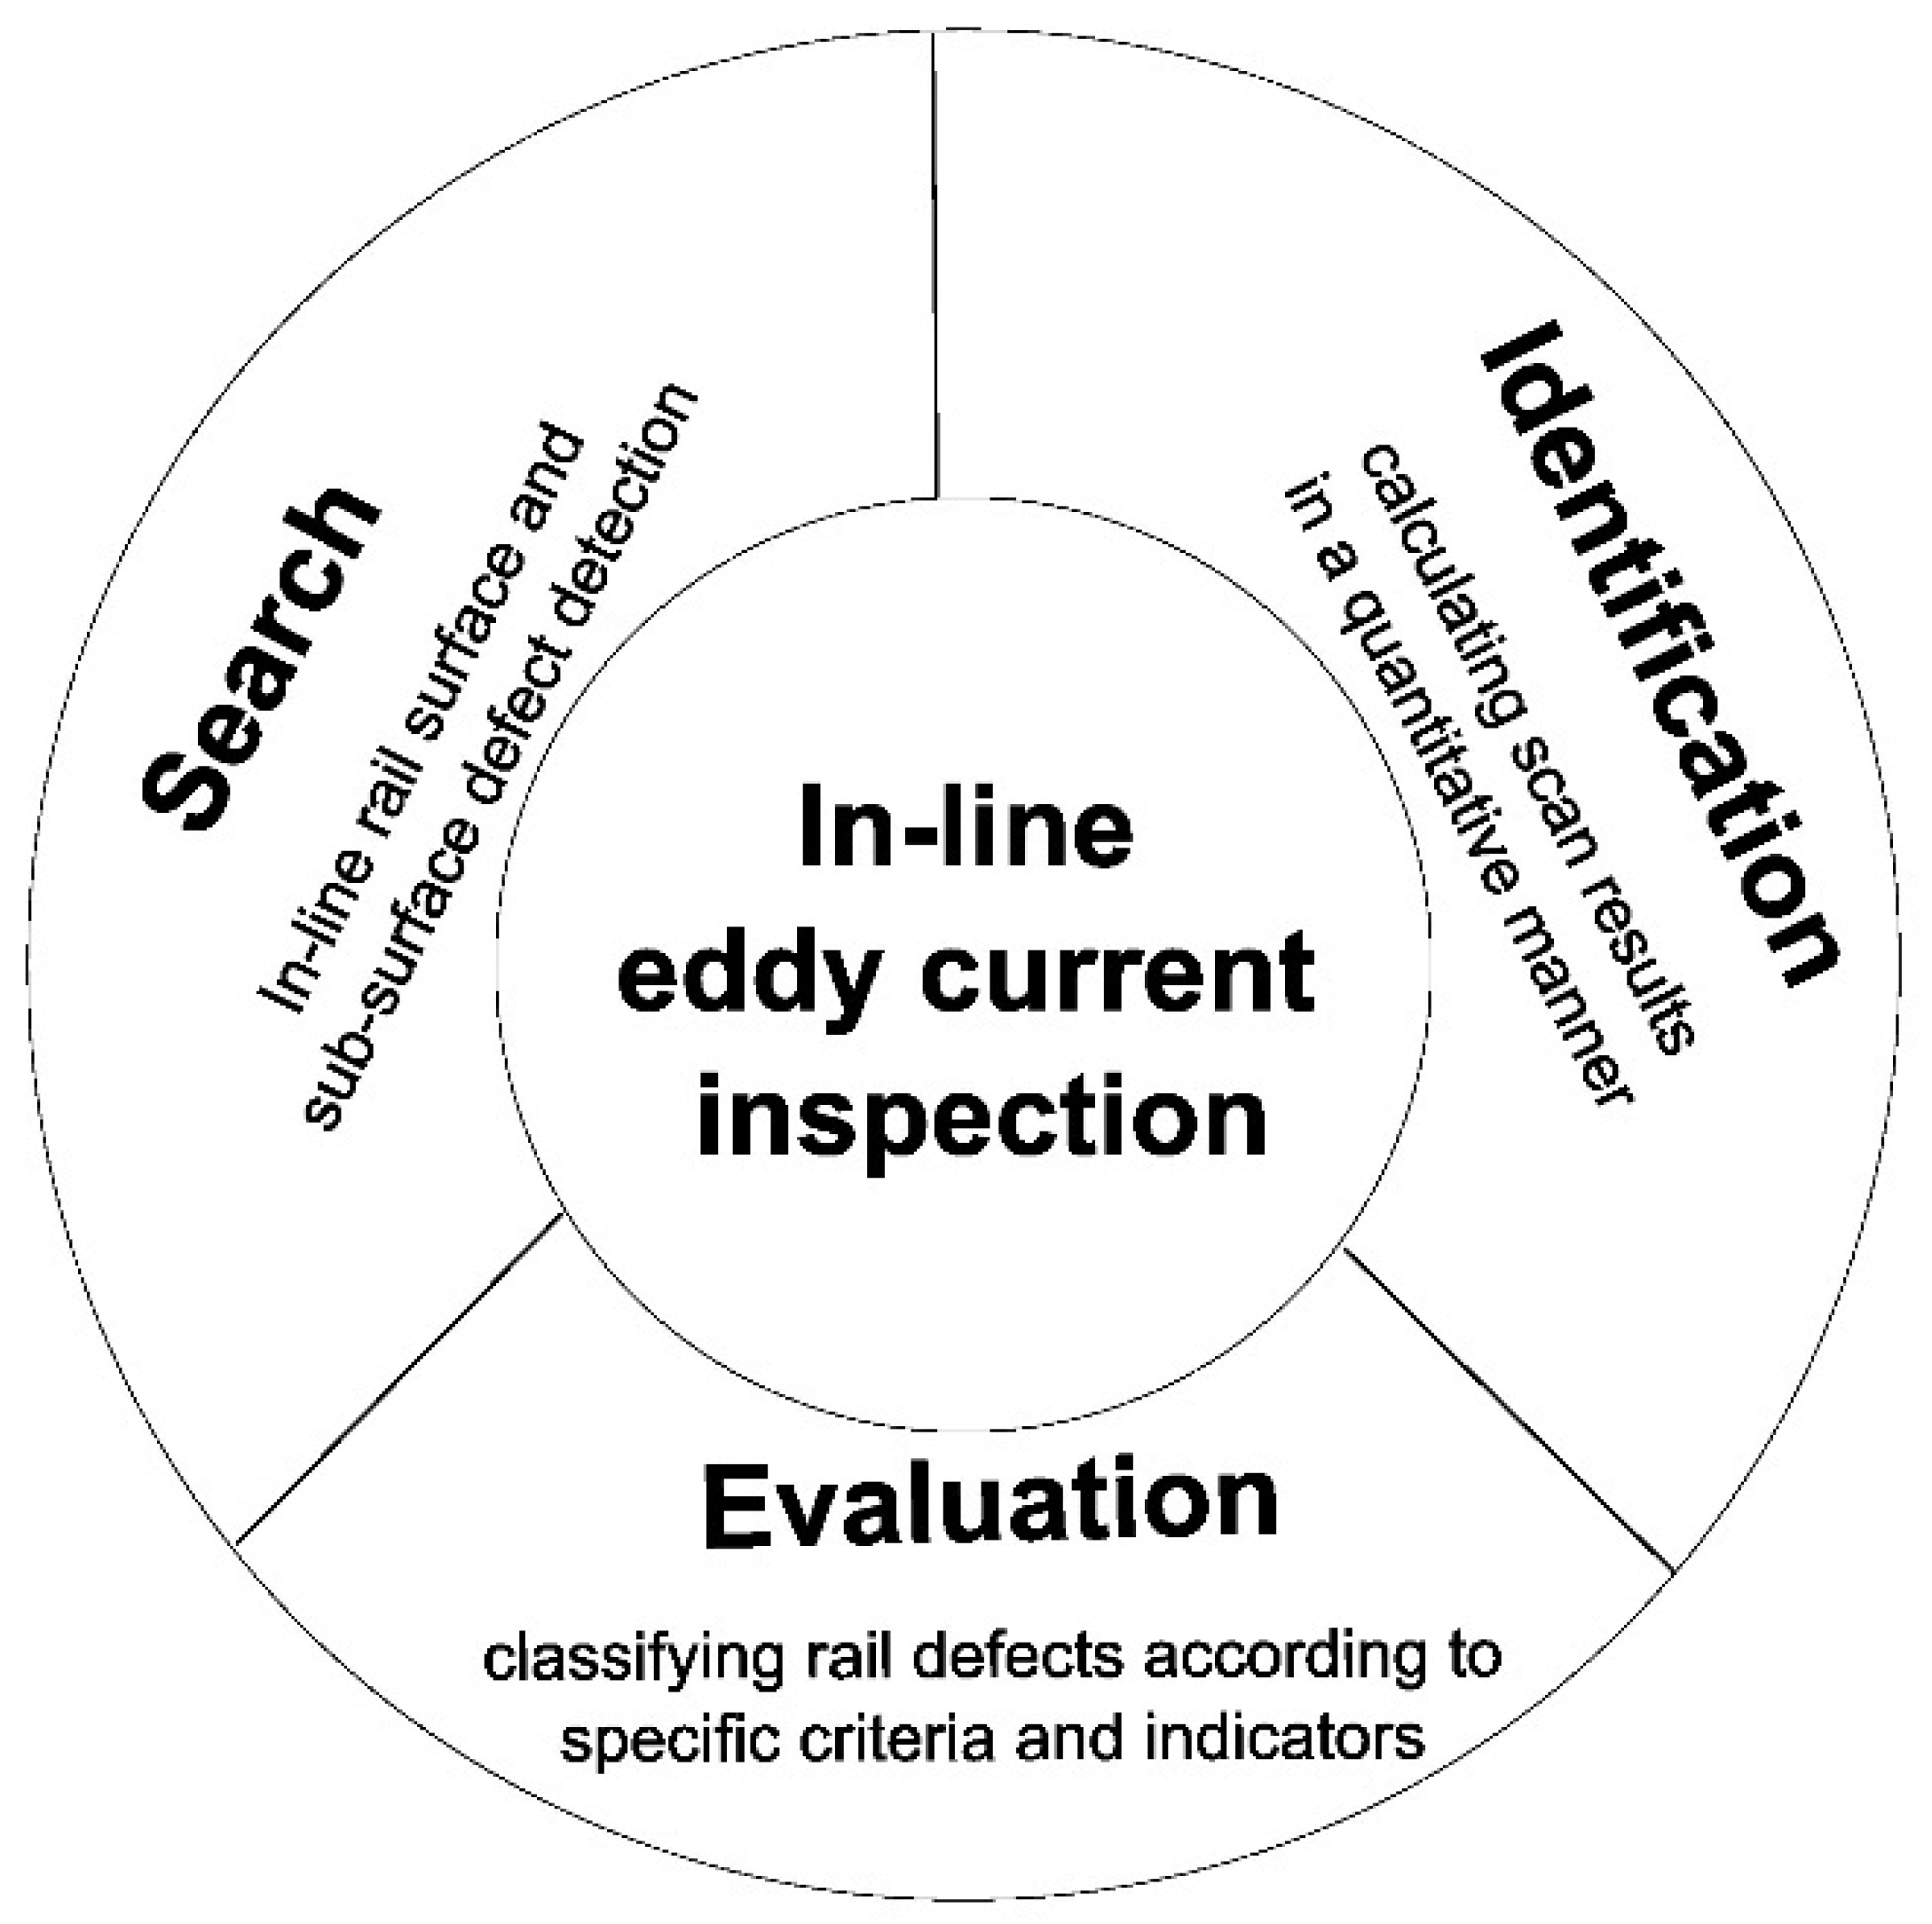
Figure 2.
Three eddy current probe configurations with: (a) singular; (b) +point and (c) figure 8-shape.
Figure 2.
Three eddy current probe configurations with: (a) singular; (b) +point and (c) figure 8-shape.
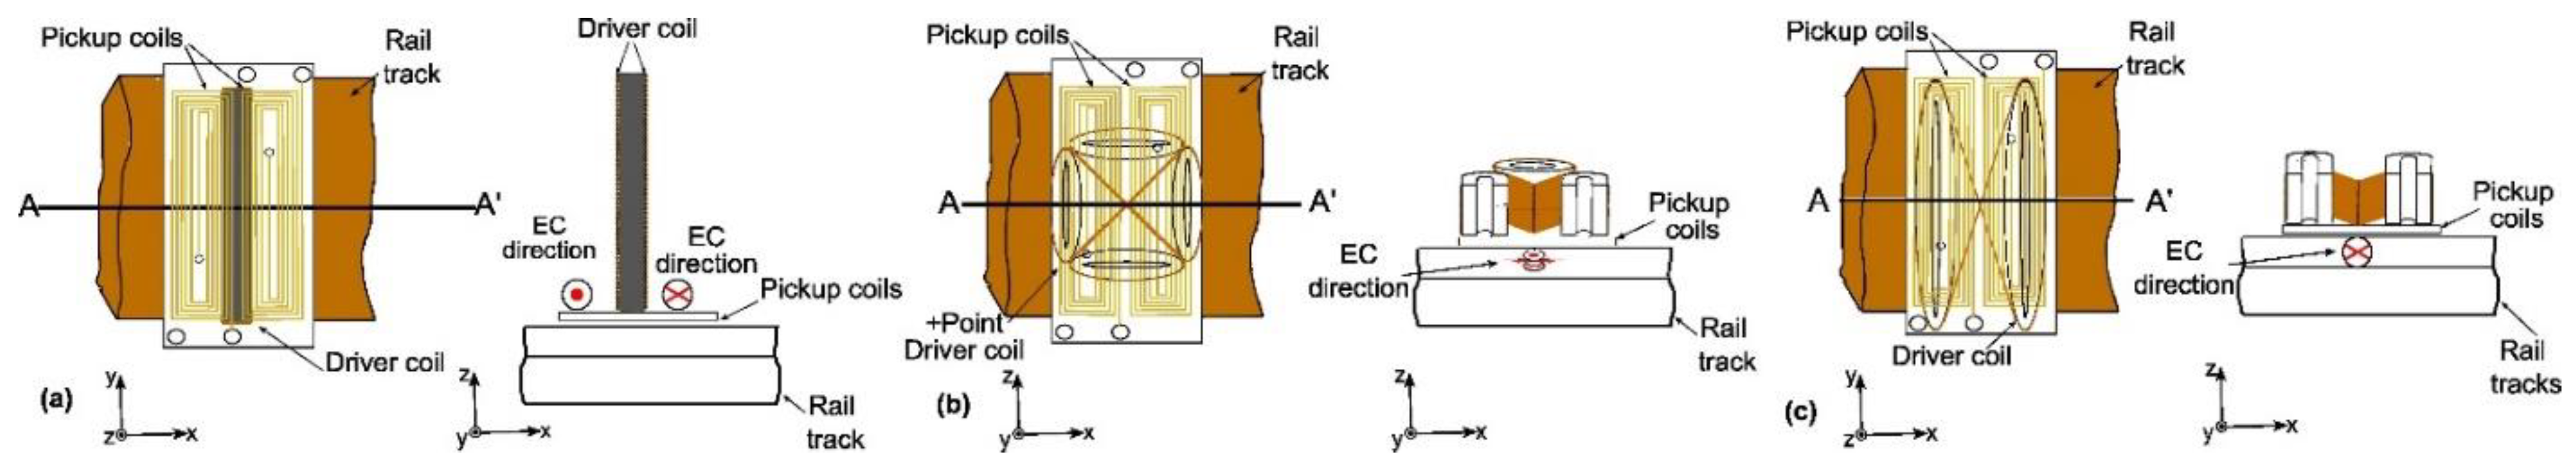
Figure 4.
Simplified diagram of amplifier with tuning caps and drive coils.
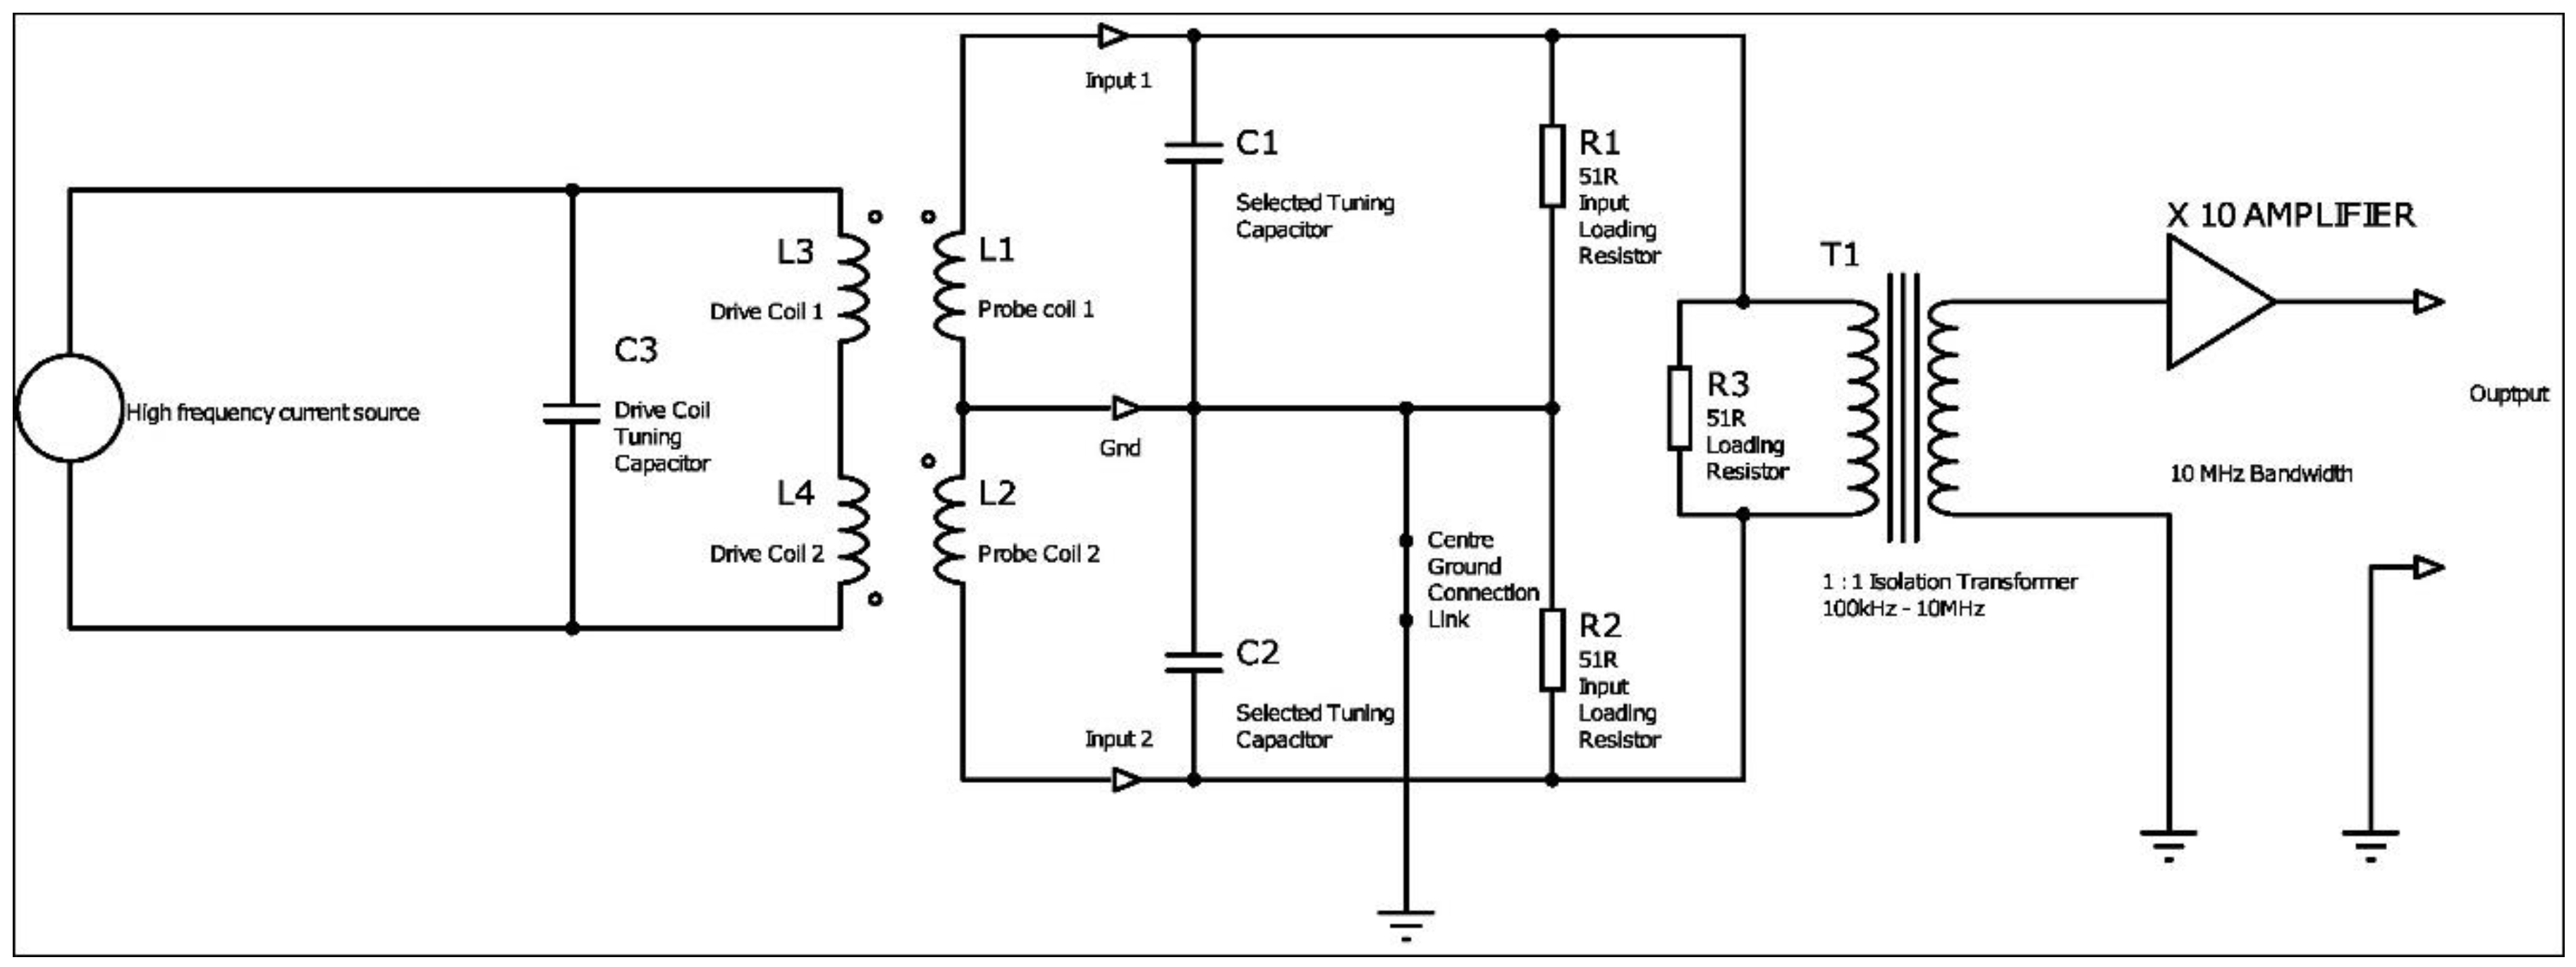
Figure 5.
Exemplar plot of identification process of proposed system.
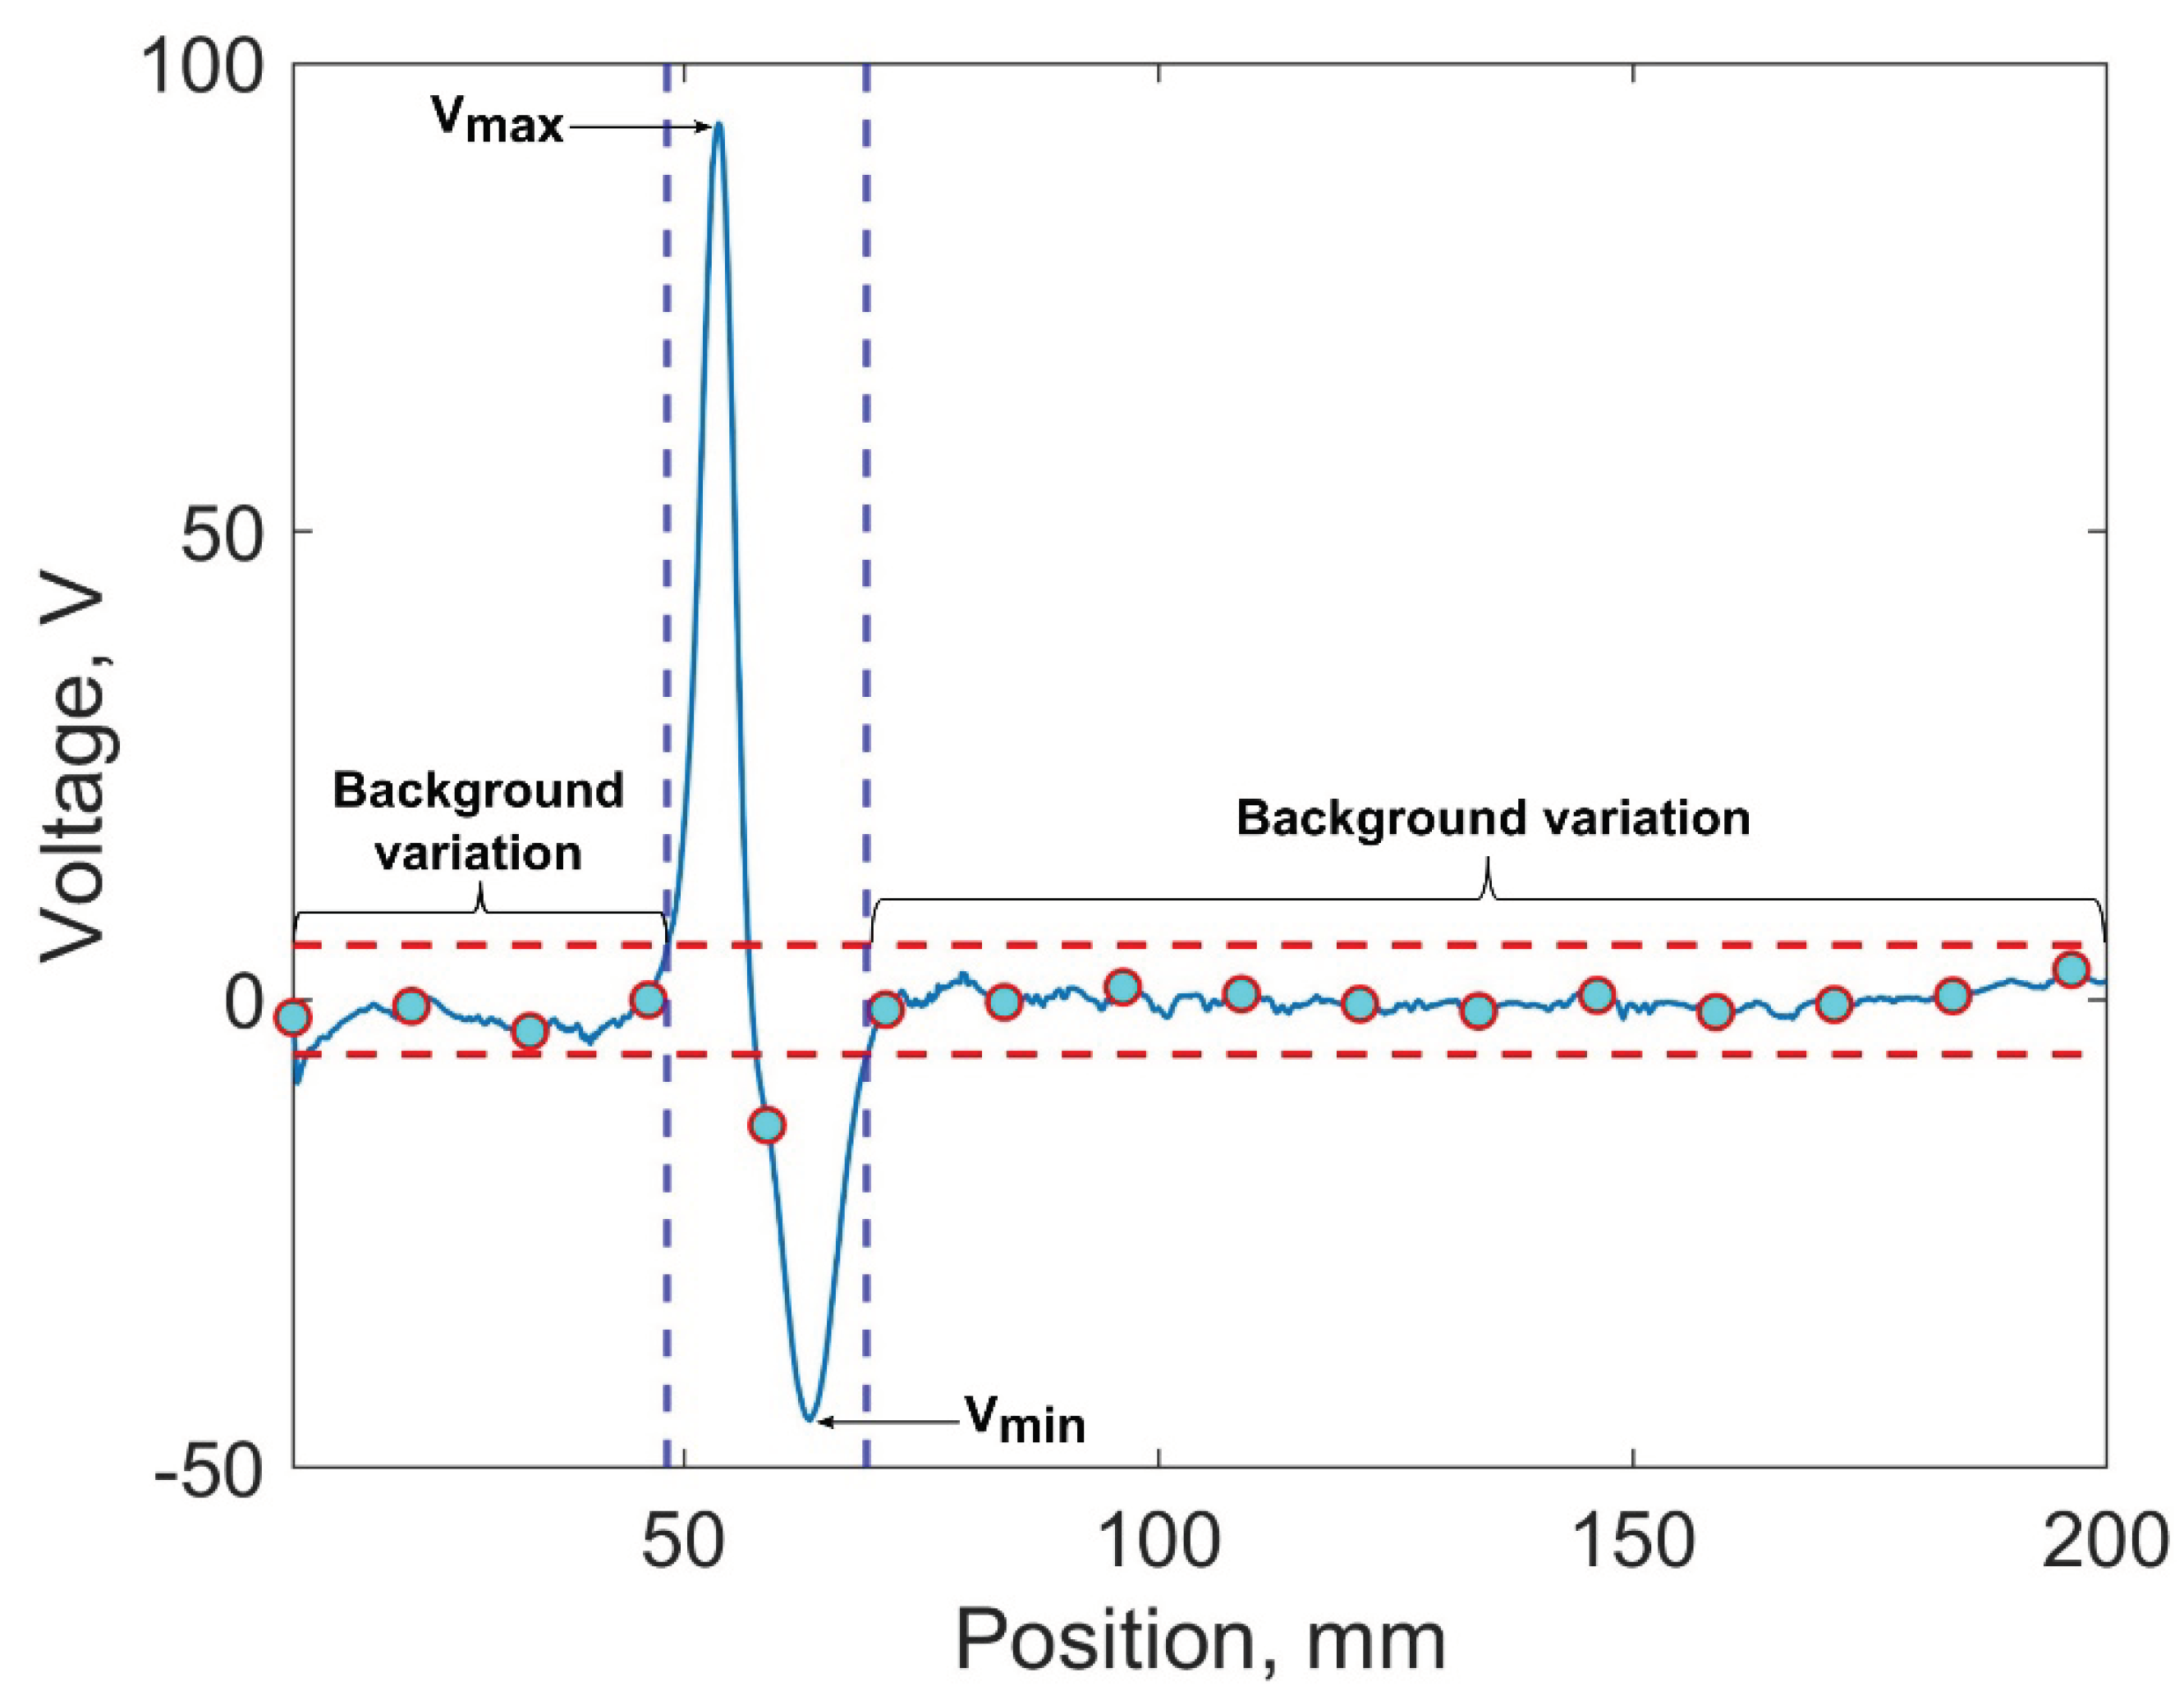
Figure 7.
Measurement resuts for optimum frequency selection study forEC probes using: a) single, b) +point and c) figure 8-shape driver coils.
Figure 7.
Measurement resuts for optimum frequency selection study forEC probes using: a) single, b) +point and c) figure 8-shape driver coils.
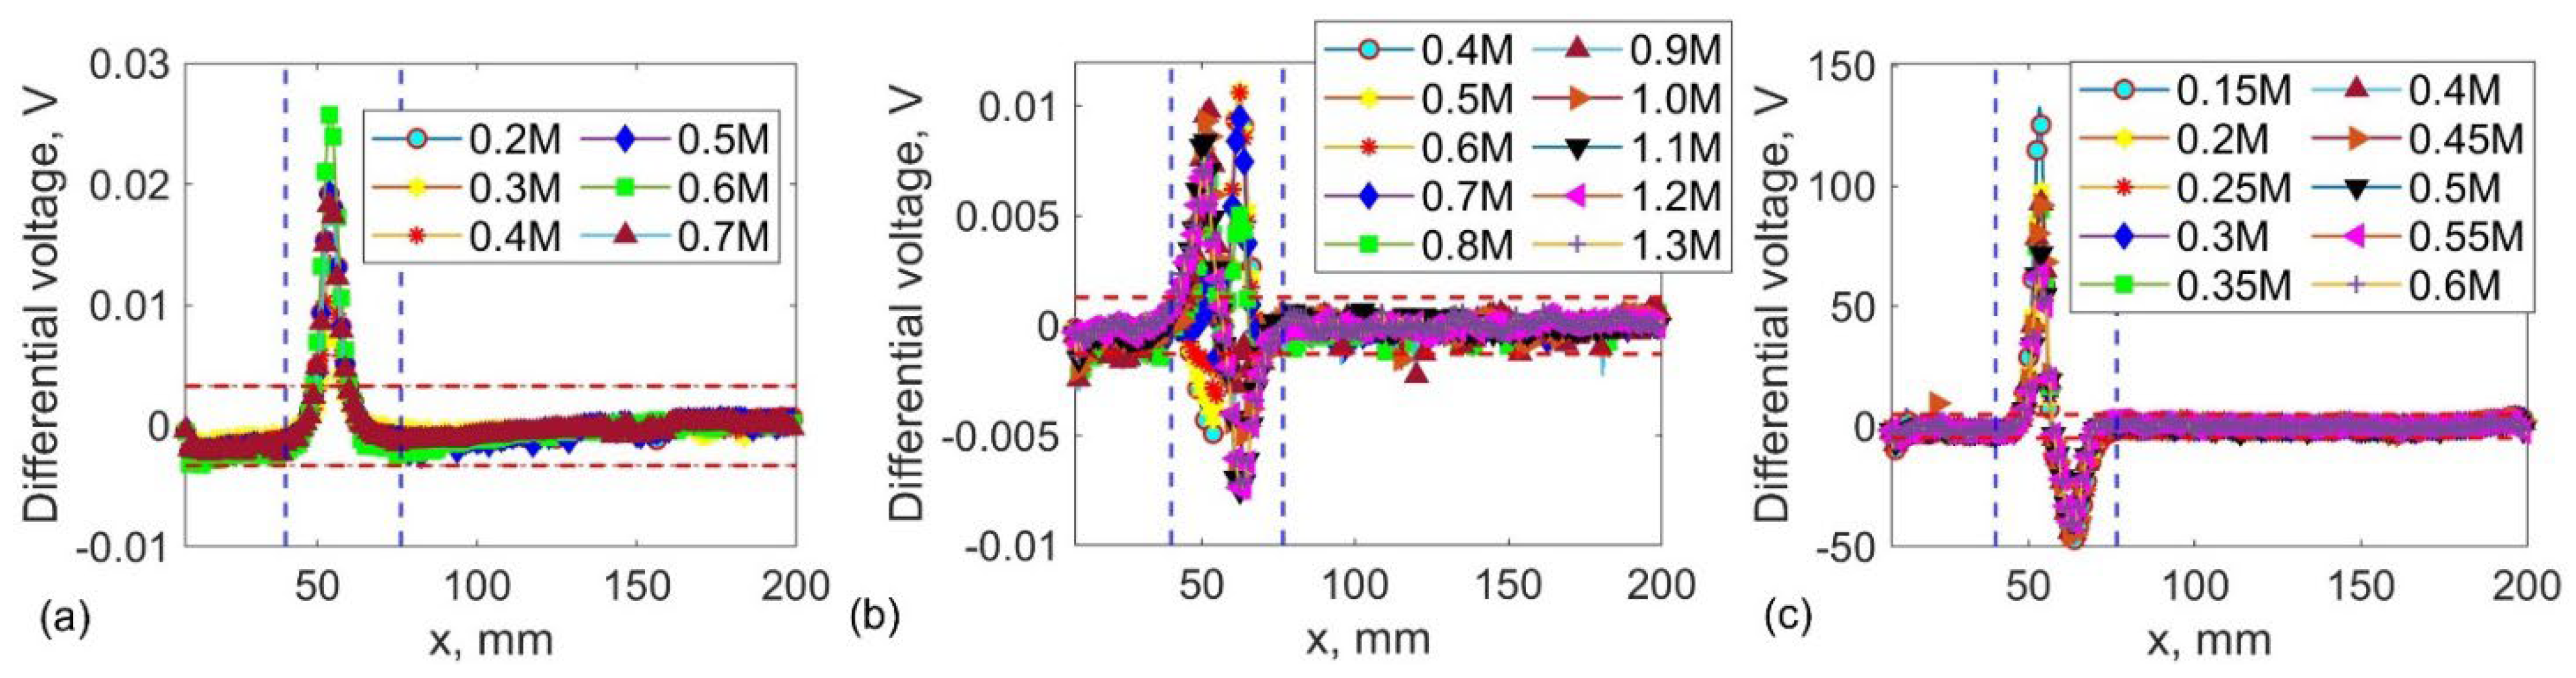
Figure 8.
Comparative analysis of probe sensitivity across various frequency ranges.
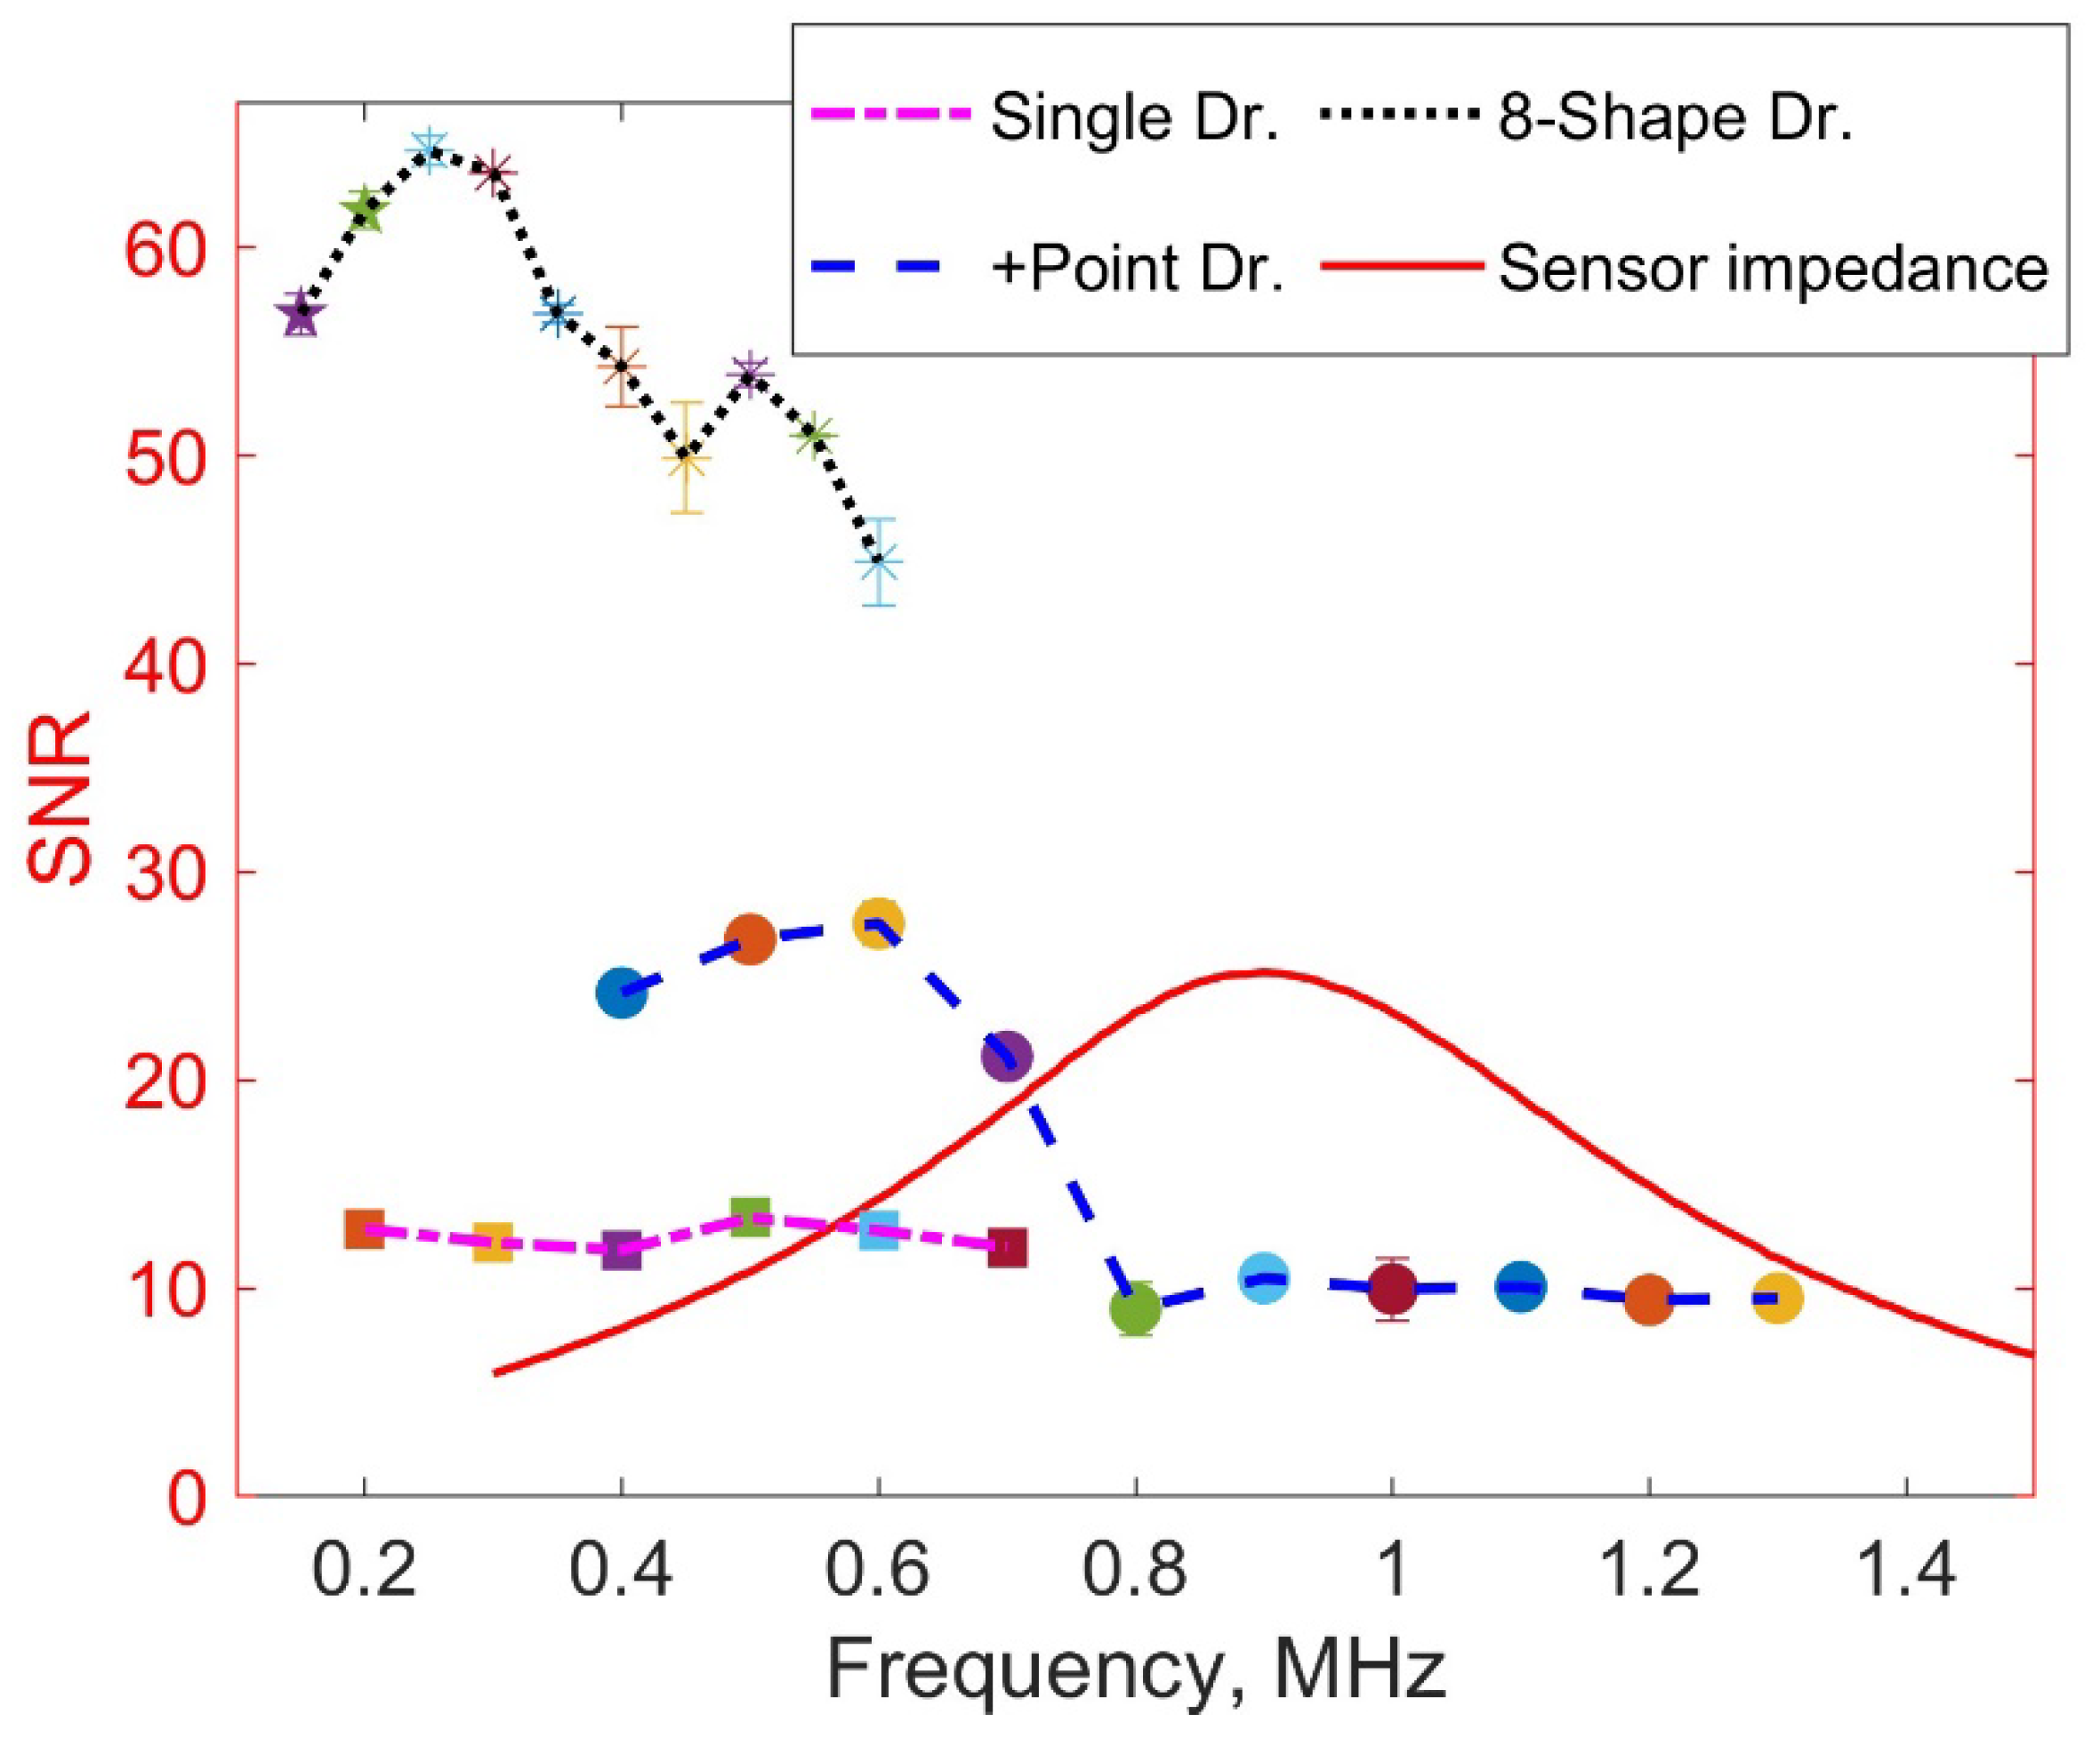
Figure 9.
EC scan data obtained at a lift-off of 0.25 mm and the estimated SNR.
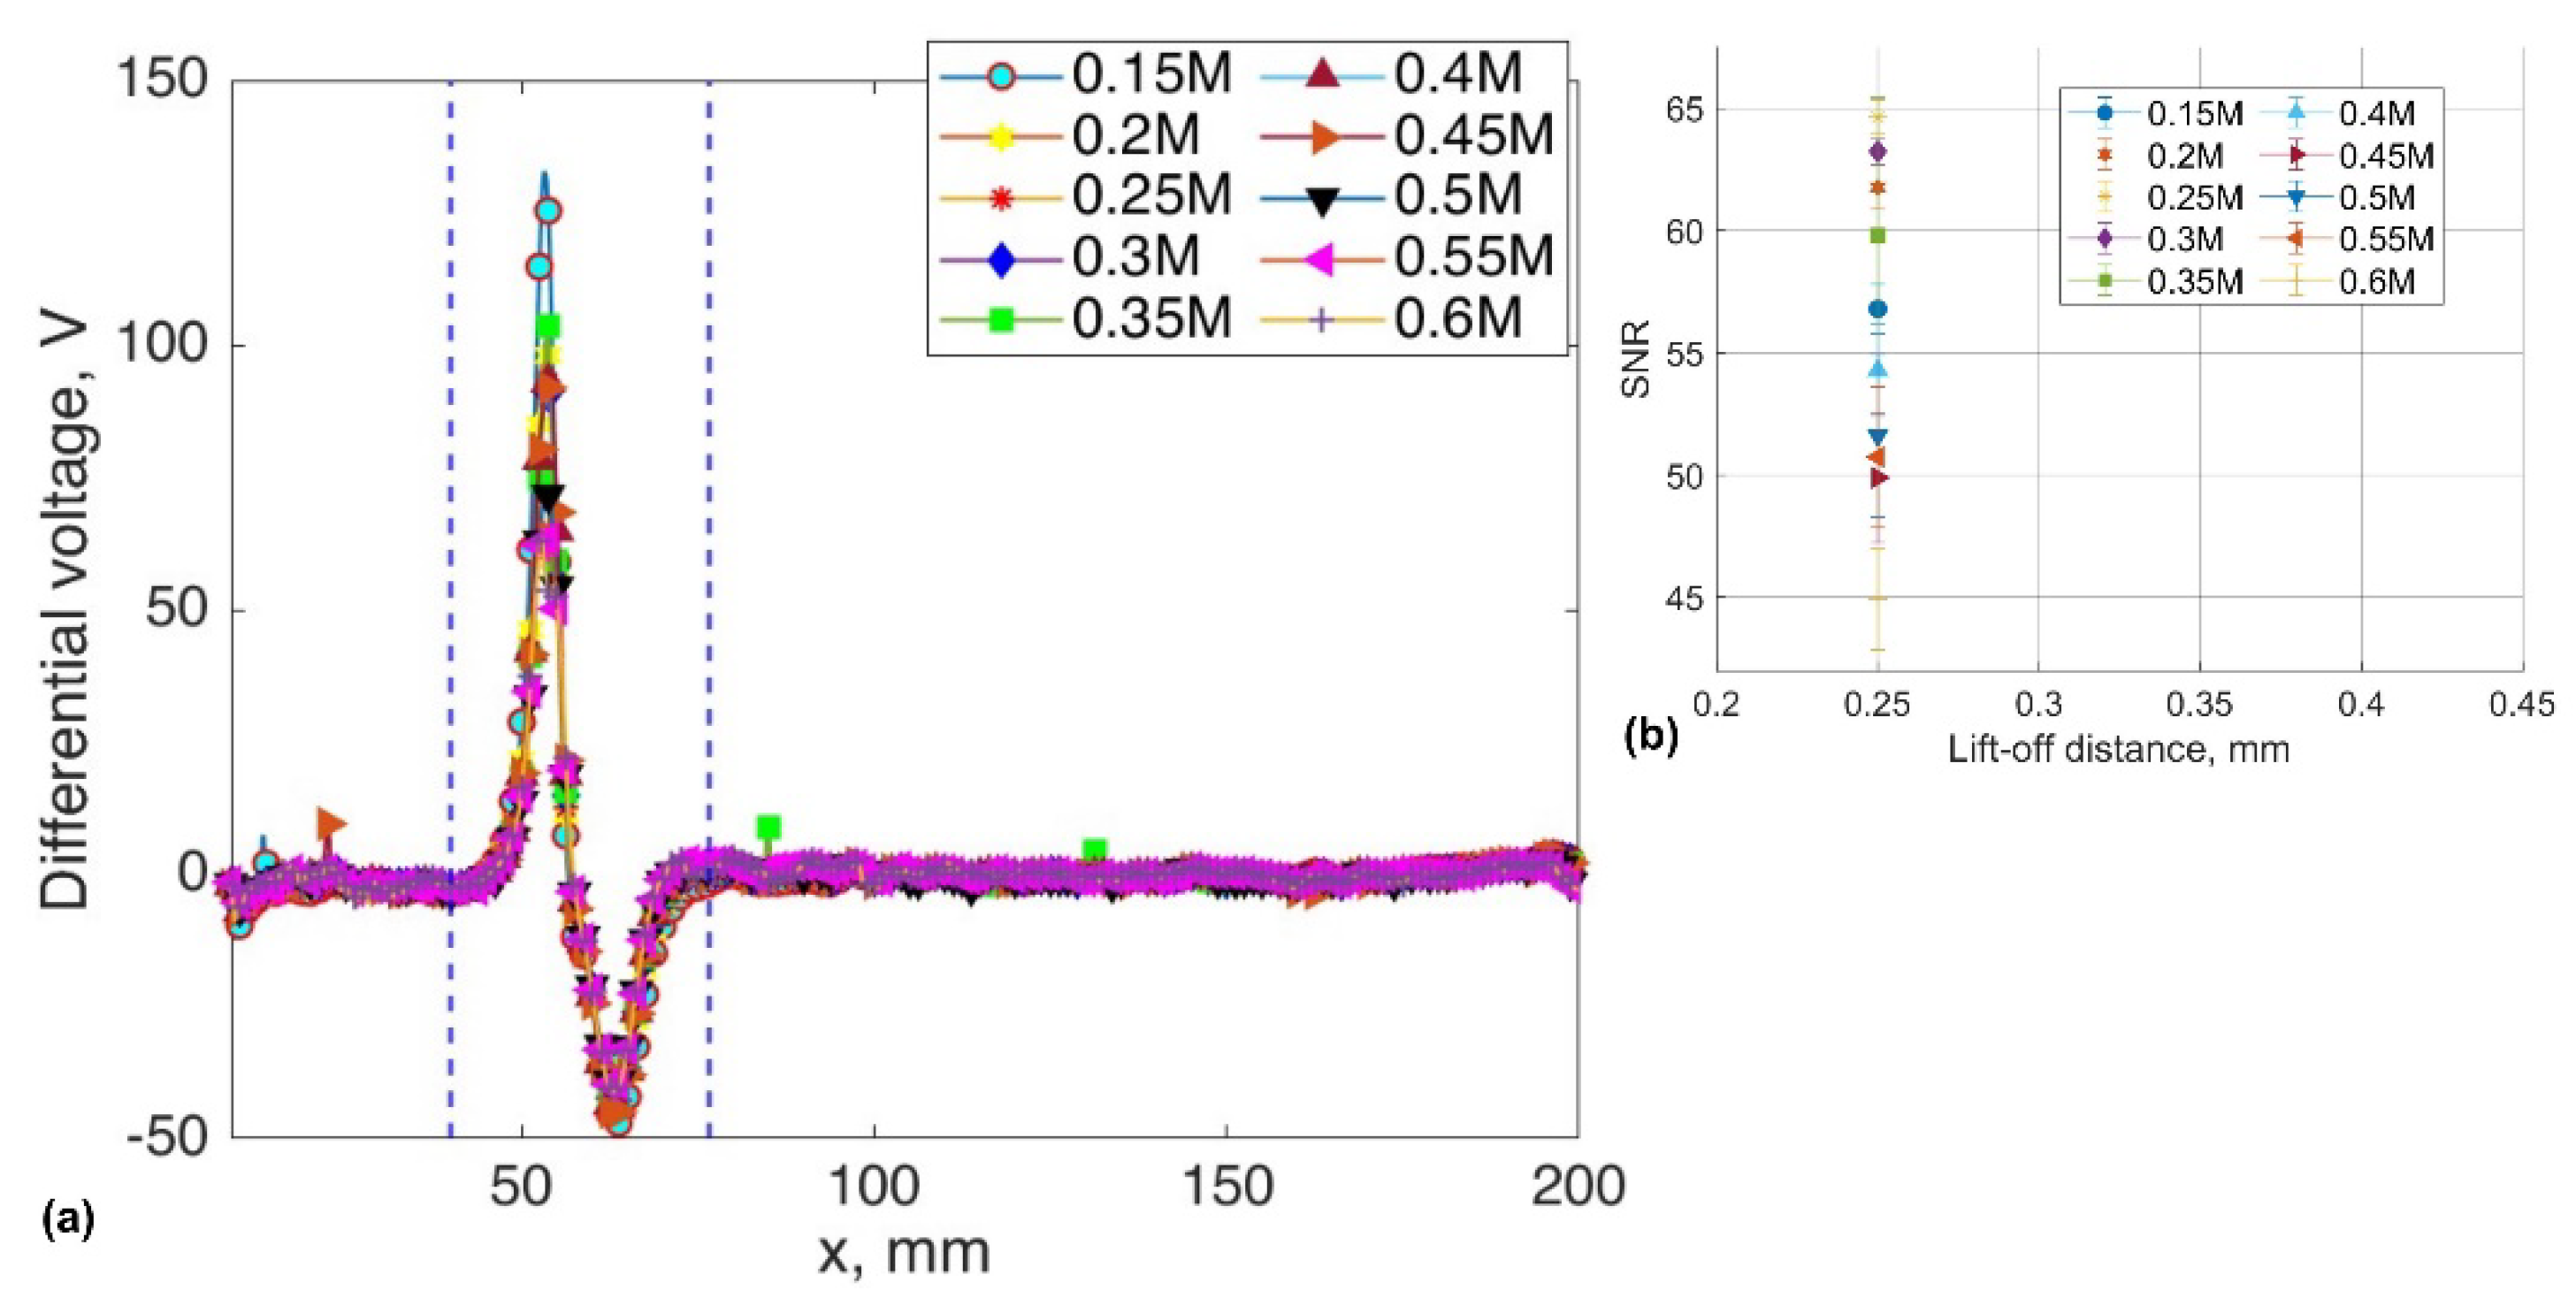
Figure 10.
EC scan data obtained at a lift-off of 0.25 mm and the estimated SNR.
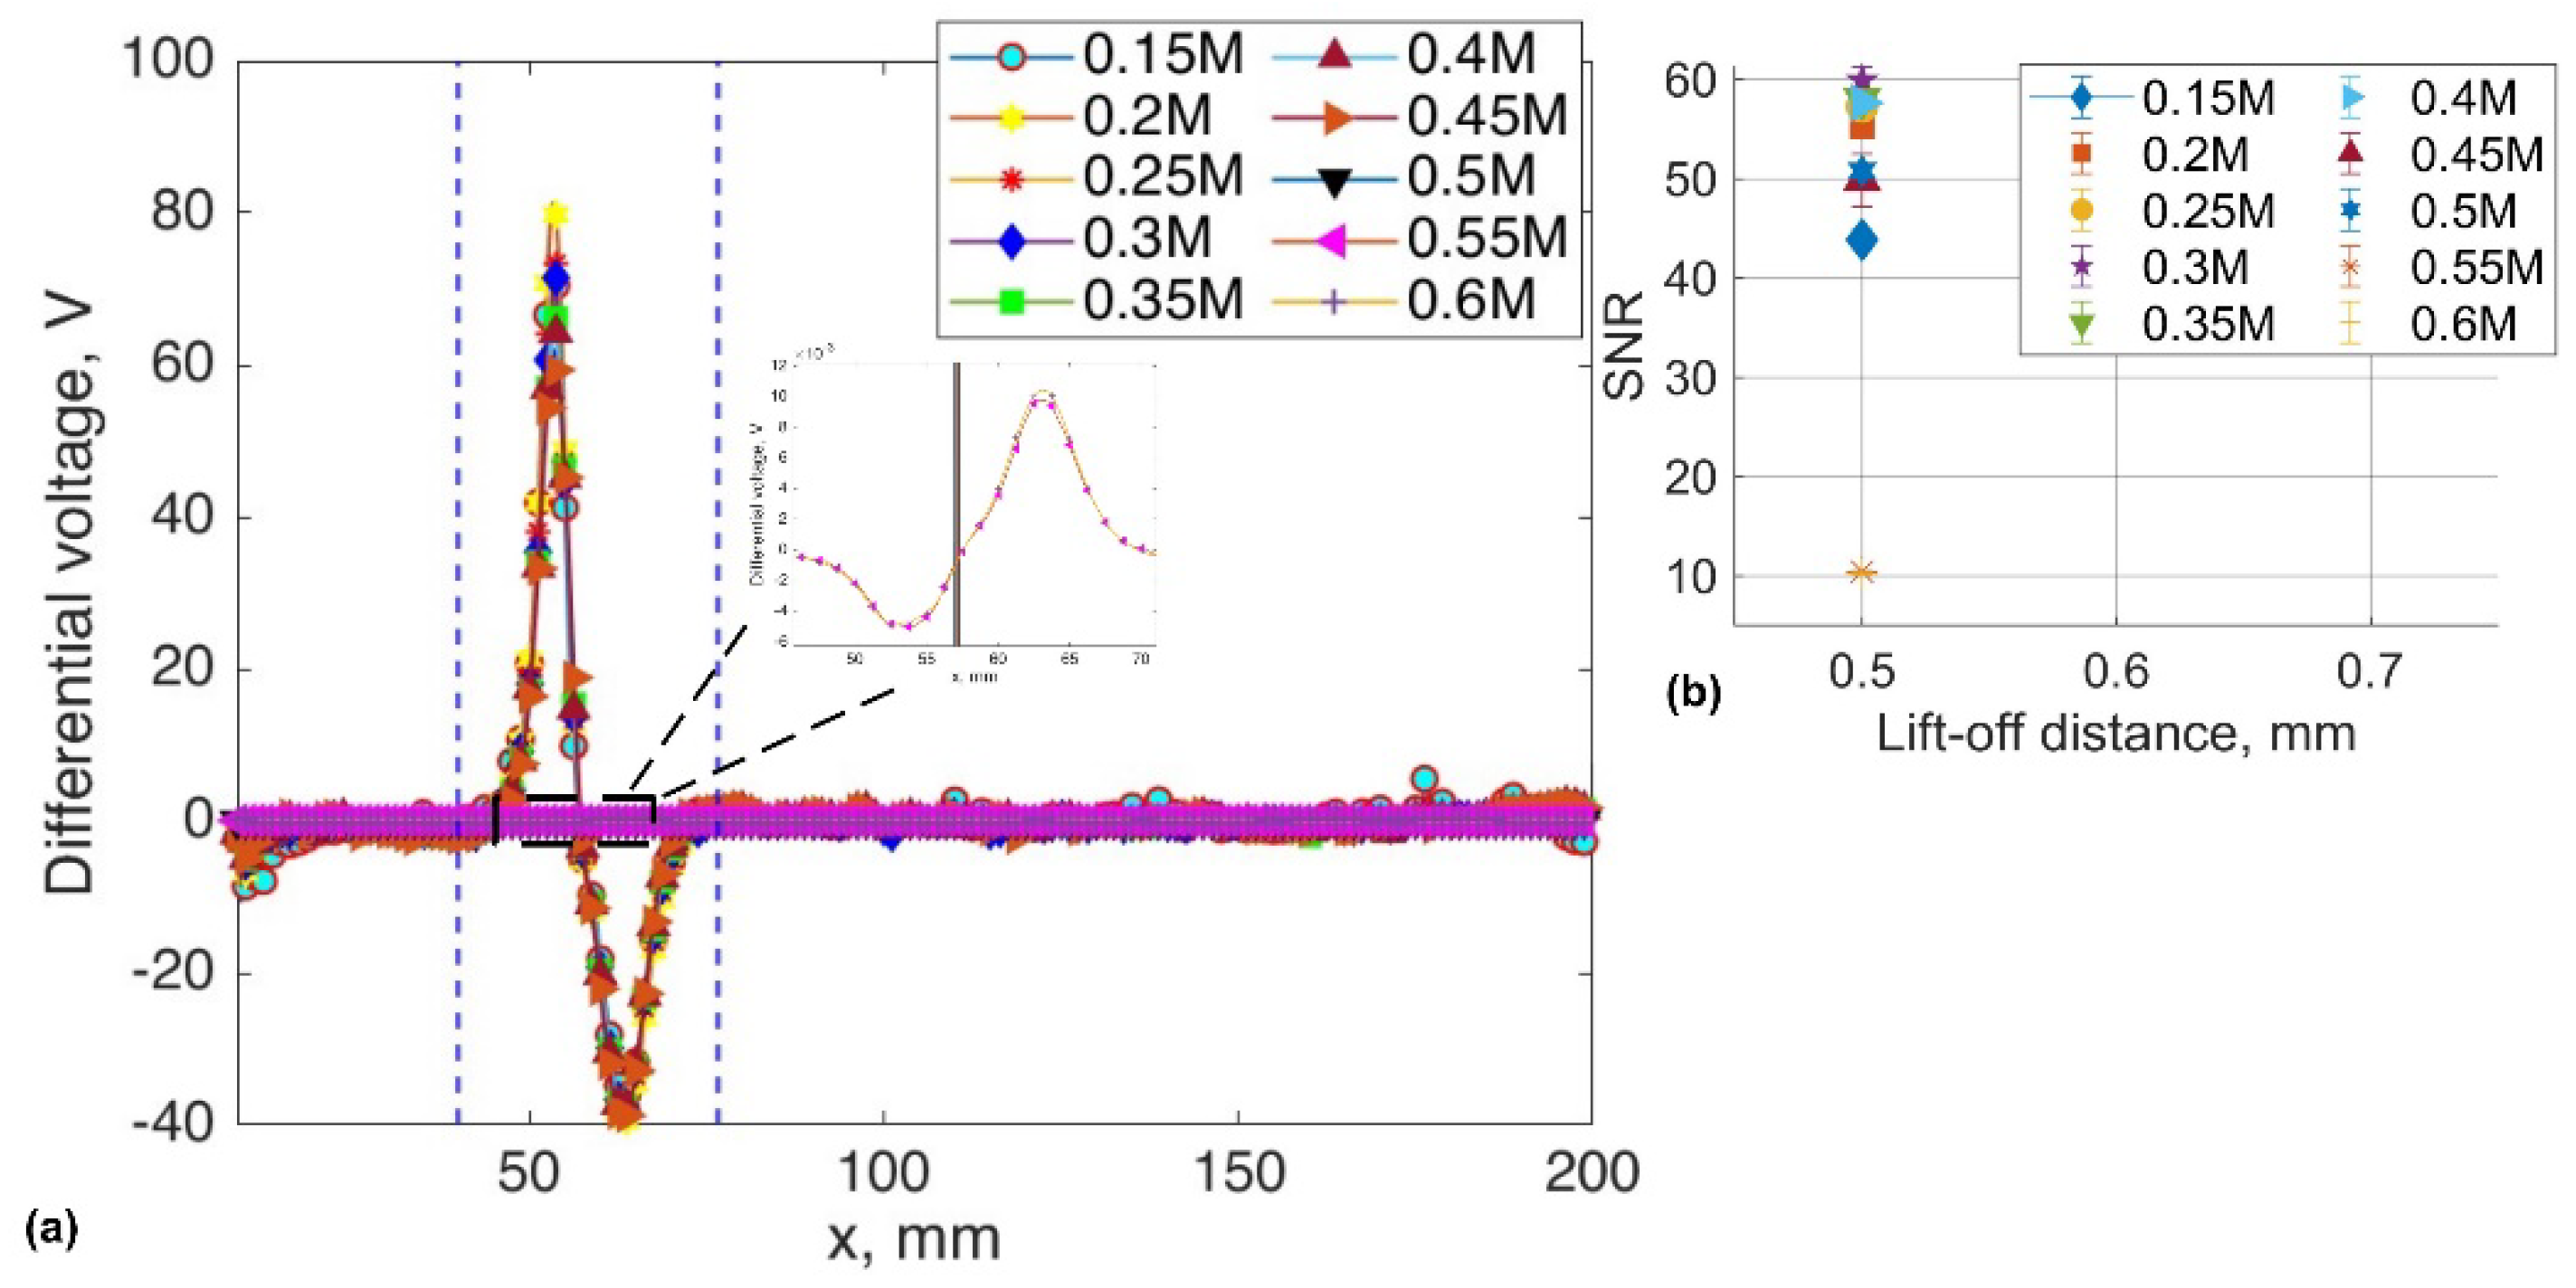
Figure 11.
EC scan data obtained at a lift-off of 1 mm and the estimated SNR.
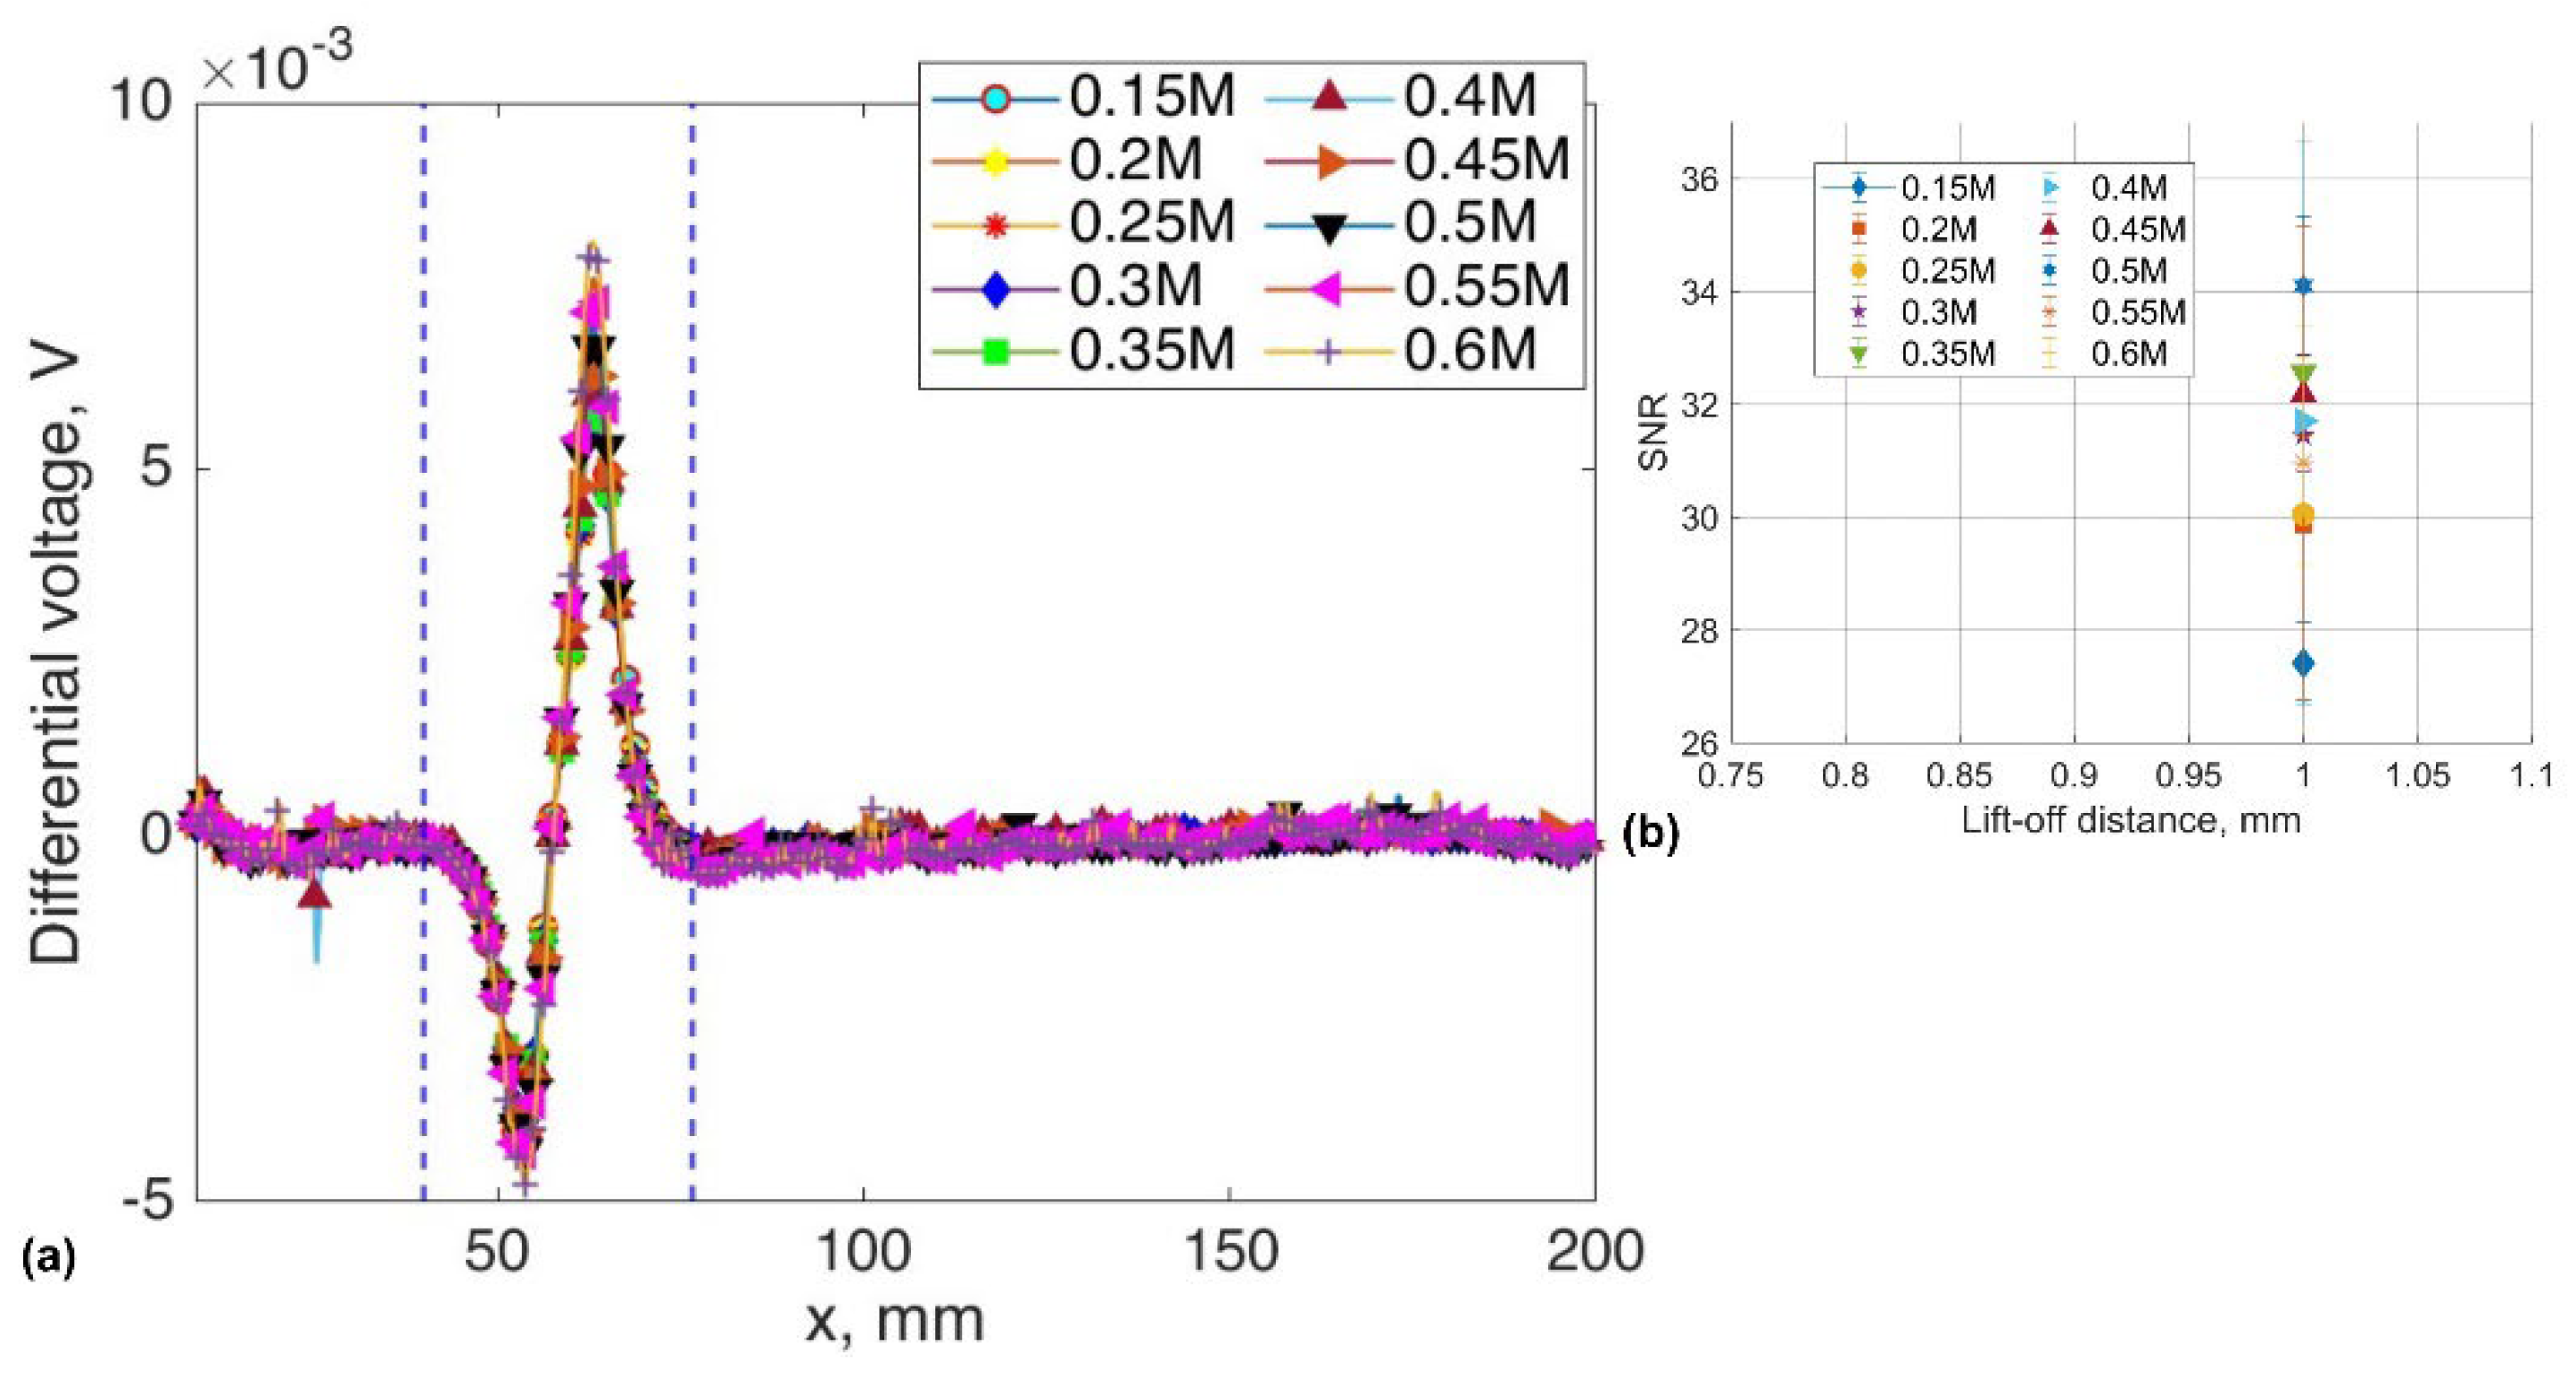
Figure 12.
Estimated mean value of voltage and RMS noise at various lift-off distances.
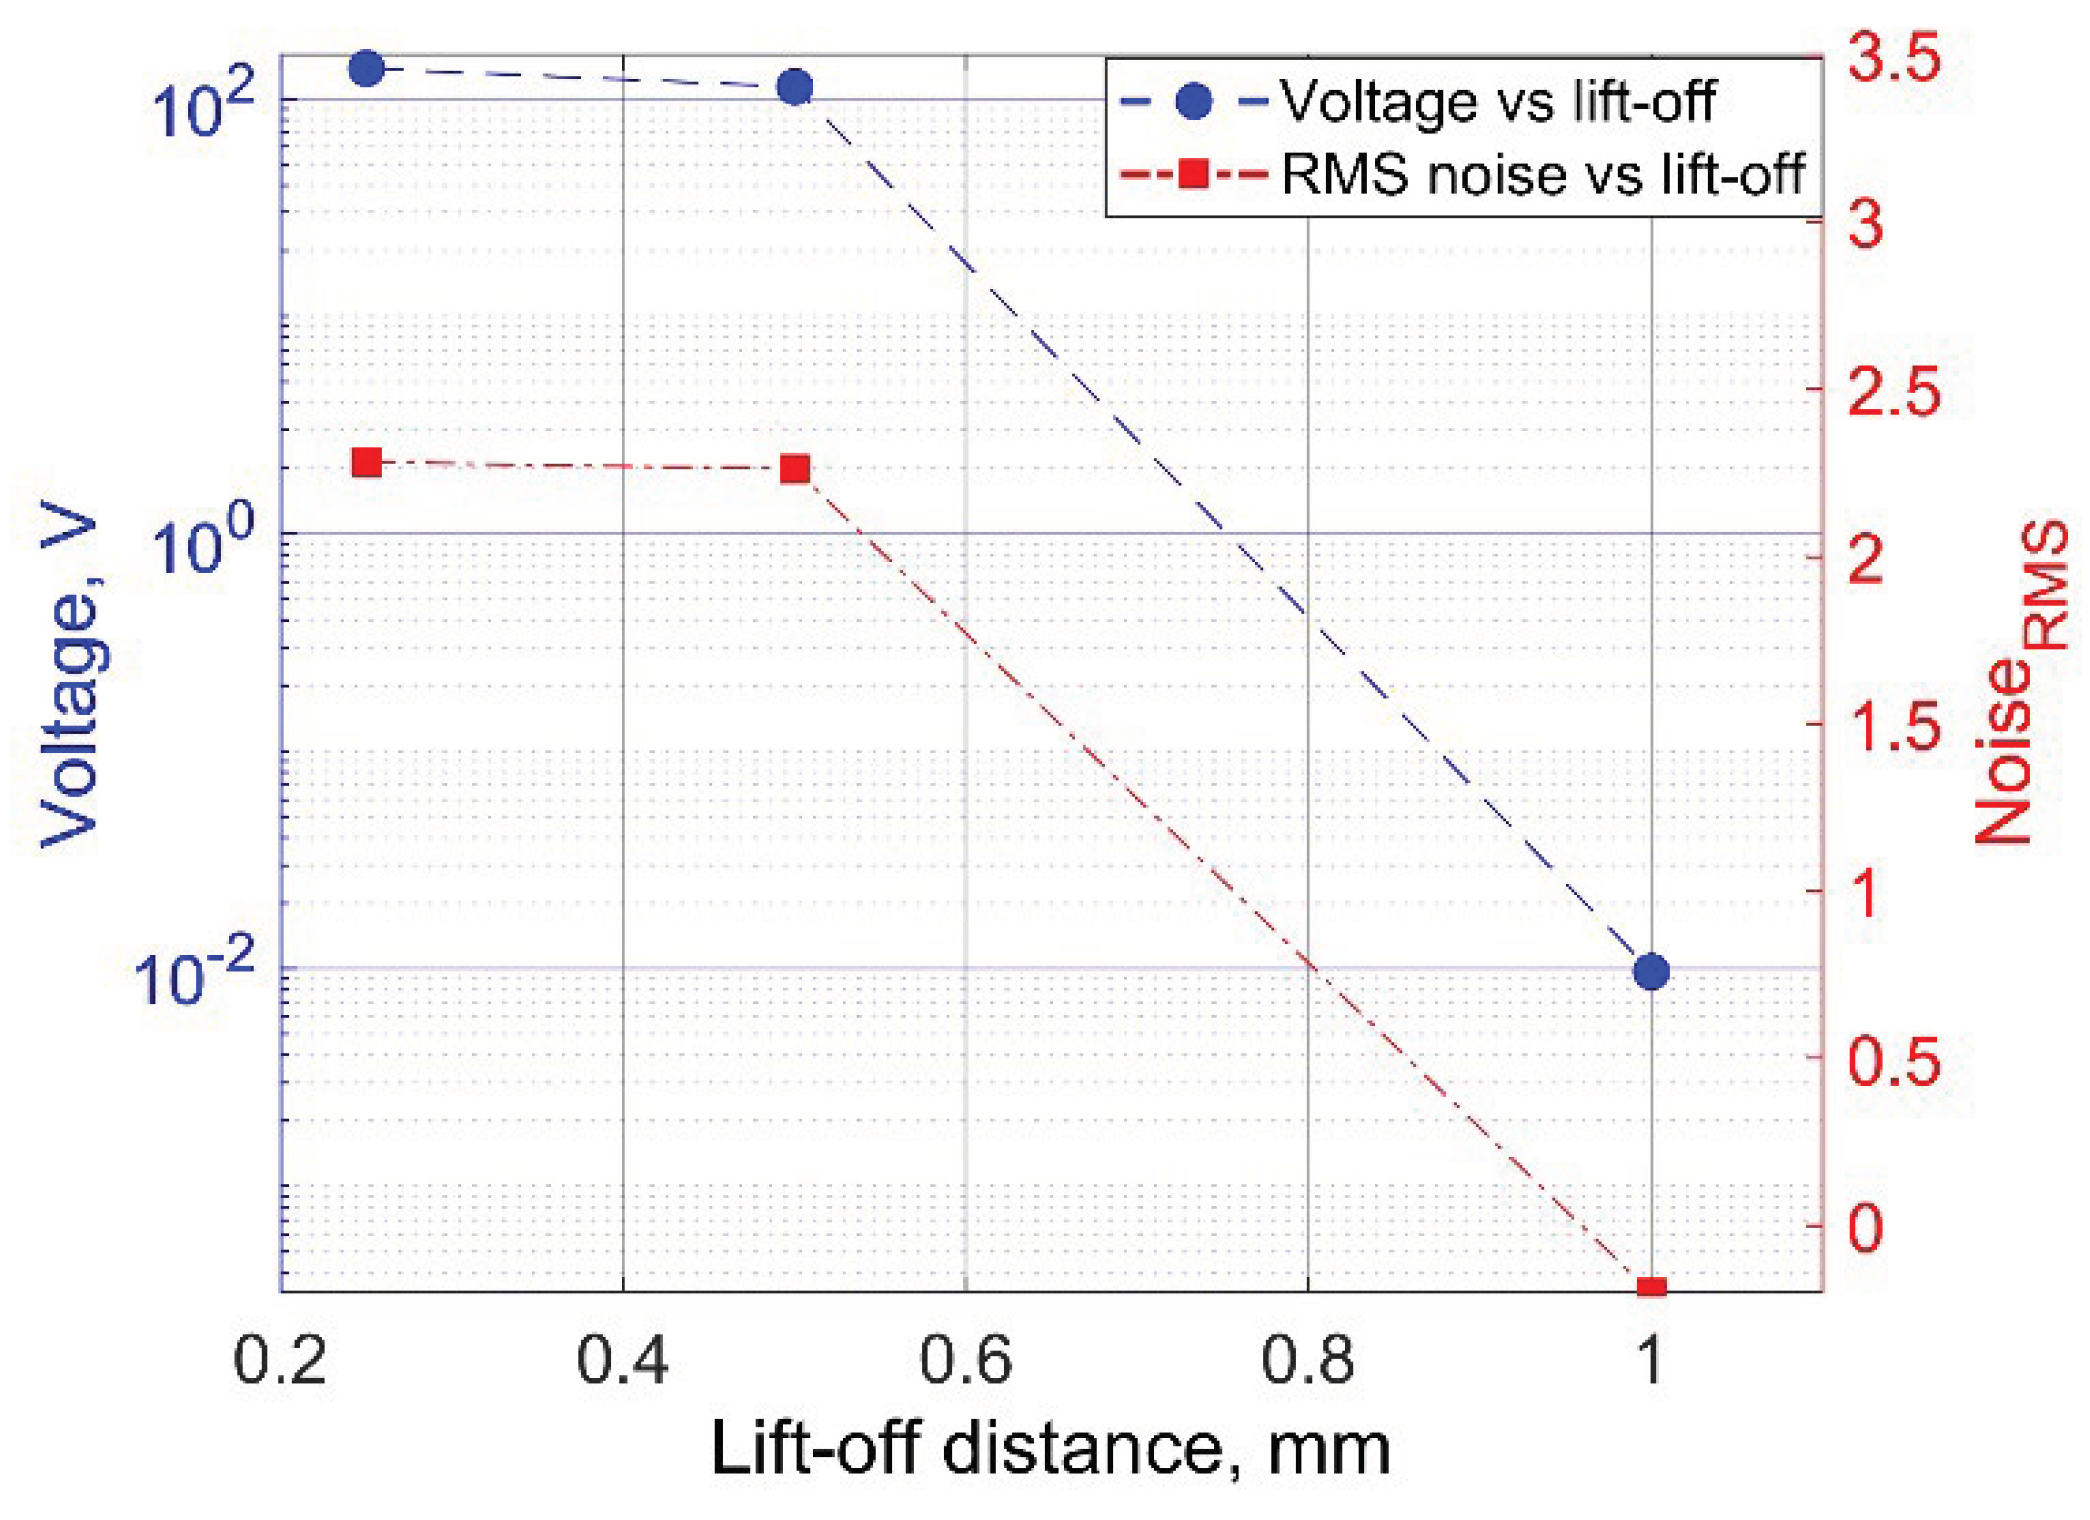

Table 1.
Material properties and dimensions of the driver coil.
| Driver coil name | Parameters and dimensions |
|---|---|
| Single +point |
62 turns, 05 mm diamter, 38X27X5.5 mm 72 turns, 0.2 mm diameter, 18X5X8 |
| Figure 8-shape | 66 turns, 0.2 mm diameter, 40X12X6.5 mm |
Table 2.
Material properties and dimensions of the sensing coil.
| Driver coils | Parameters and dimensions |
|---|---|
| Number of turns Product Family |
12 2 layer |
| Copper Weight | 35 |
| Thickness | 1.6mm |
| Material | FR4 (150 deg C) middle Tg |
| Circuit Size X | 30 mm |
| Circuit Size Y | 16 mm |
Disclaimer/Publisher’s Note: The statements, opinions and data contained in all publications are solely those of the individual author(s) and contributor(s) and not of MDPI and/or the editor(s). MDPI and/or the editor(s) disclaim responsibility for any injury to people or property resulting from any ideas, methods, instructions or products referred to in the content. |
© 2024 by the authors. Licensee MDPI, Basel, Switzerland. This article is an open access article distributed under the terms and conditions of the Creative Commons Attribution (CC BY) license (http://creativecommons.org/licenses/by/4.0/).
Copyright: This open access article is published under a Creative Commons CC BY 4.0 license, which permit the free download, distribution, and reuse, provided that the author and preprint are cited in any reuse.


