Submitted:
19 February 2024
Posted:
19 February 2024
You are already at the latest version
Abstract
Genetic enhancement of grain production and quality is a priority in wheat breeding projects. In this study, we assessed two key agronomic traits - grain protein content (GPC) and thousand kernel weight (TKW) - across 179 Bulgarian contemporary and historic varieties, and landraces in three growing seasons. Significant phenotypic variation existed for both traits among genotypes and seasons, and no discernible difference was evident between the old and modern accessions. To understand the genetic basis of the traits, we conducted a genome-wide association study with MLM using phenotypic data from the crop seasons, best linear unbiased estimators, genotypic data from the 25K Infinium iSelect array, and a Bonferroni-adjusted p-value. As a result, 776 significant quantitative trait nucleotides (QTNs) organized into quantitative trait loci were discovered, including 25 loci associated with GPC, and 35 loci linked to TKW. Additionally, 14 environmentally stable QTNs were identified for TKW. Certain loci on chromosomes 2A, 3A, and 6B favorably in-fluenced GPC, while the locus on chromosome 6D impacted TKW positively. These loci may reflect novel associations to the two traits. Annotations for proteins involved in the remobilization of carbon and nitrogen from vegetative tissues to developing grain during senescence, as well as in the following buildup of resources required for seed germination, have been found for selected pu-tative candidate genes. These include genes coding for 11S globulin seed storage protein, glutamine synthetase, metalloendopeptidase, components of the ubiquitin/proteasome system, sucrose transporter, alpha-amylase, NAC and bZIP transcription factors. Our findings highlight promising genomic regions for targeted breeding programs aimed at improving grain yield and protein content.
Keywords:
association mapping
; candidate genes
; grain protein content
; TKW
; grain quality
; grain yield
; Triticum aestivum L.
1. Introduction
Wheat is a unique cereal crop due to the baking qualities of its flour and occupies a central strategic role in broad-scale food security. Increasing yield and protein content in wheat grain is essential for safeguarding the human rights to sufficient and nutritious food. The quality and nutritional value of food products made from wheat flour largely depend upon the type and concentration of grain proteins [1,2]. As a consequence, total grain protein content (GPC) is one of the main determinants of both baking quality and the international market price of wheat [3]. The range of protein in wheat grains is usually between 8 and 20%, accounting for less than 8-15% of the grain dry weight. Thousand kernel weight (TKW) is a measure of grain weight and, along with spike number per unit area and grain number per spike, is a main component of wheat total yield. Grain weight and, respectively, grain yield, is formed mainly by the starch accumulation in the developing grain and, therefore, any starch gain in the endosperm if not accompanied by an adequate rise in nitrogen (N)/protein accumulation has a dilution effect that influences the concentration of grain protein and micronutrients [4]. Due to this important interaction, breeders frequently encounter conundrums when aiming for genotypes that combine high yield and high protein content in the grain [5,6,7,8].
Comparative studies on changes that have occurred in wheat varieties released or introduced since the middle of the 19th century showed increased grain yield and decreased protein over time [4,9]. This suggests that old germplasm (landraces and traditional varieties) can be screened for new genetic diversity and targeted for the construction of new varieties. Old germplasm grown in Bulgaria has some desirable traits, such as consistent yield, resistance to drought, high protein content, or good quality for making bread [10]. The semi-dwarf high-yielding varieties that emerged in the 1970s replaced the landraces and the tall varieties that were previously grown [11]. Most of this germplasm is now extinct, but some seed samples are preserved and reproduced in the major European seed gene banks [12].
Both GPC and TKW are quantitatively inherited and are controlled by multiple genes or quantitative trait loci (QTL) [13,14]. The impact of the environmental conditions on gene expression and the genotype by environment interactions further complicates the precise evaluation of these traits [15].
Genome-wide association studies (GWAS) detect genetic effects based on linkage disequilibrium (LD) in natural germplasm collections and have become effective tools for modern plant breeding [16]. Following the rapid development of DNA marker technologies, and in particular the advent of single nucleotide polymorphism (SNP) chips, association mapping has been used progressively to establish a strong connection between a genome-wide SNP and a trait of interest. Identifying marker-trait associations (MTAs) or quantitative trait nucleotides (QTNs) can make it easier for breeders to choose the best genotypes, reduce the breeding cycle and achieve higher genetic gains. A number of recent GWAS studies reported genomic regions associated with GPC and yield components [14,17,18,19,20,21,22,23,24,25,26,27,28,29,30,31].
The association panels employed in these studies varied in terms of diversity level, genetic relatedness, and the nature of accessions. For instance, Kartseva et al. [27] used a diverse population of 255 accessions from 27 countries on 5 continents, and revealed novel stable genomic regions harboring GPC-associated markers on chromosomes 3A and 3B. QTL hotspots containing 165 significant MTAs for quality and agronomic traits were mapped on almost all chromosomes in an association panel of 170 diverse landraces from the Mediterranean region [31]. Using a set of 93 spring common wheat varieties and breeding lines adapted for cultivation in the Siberian region of the Russian Federation, another study reported eleven genomic regions associated with GPC, of which nine were physically mapped on chromosome 6A harboring the NAM-A1 gene, homoeologous to the Gpc-B1 (NAM-B1) gene [23]. Another recent investigation by Tyrka et al. [30] screened 168 Polish breeding lines of common winter wheat for a number of agronomic traits, and identified trait-associated markers for heading time, lodging resistance, plant height, and TKW. Therefore, it is essential to evaluate new large mapping populations with different underlying sub-structure, extents of genetic relatedness among individuals, and LD decays, to identify novel QTNs or QTL for yield and quality traits. Additionally, these traits are influenced by environmental factors, therefore, detecting MTAs in multi-environment or multi-year studies is crucial for their application in marker-assisted breeding.
For this study, we assembled an association panel of advanced and historic varieties, and local accessions from Bulgaria. Our fundamental focus was to explore the natural genetic variation for protein content in wheat grain and thousand kernel weight, and to reveal the associated genetic determinants. We found a considerable amount of phenotypic variation for GPC and TKW with no apparent differences between modern high-productive varieties and old germplasm, nor did the traits significantly correlate with one another. Based on GWAS findings, we identified promising genomic regions for wheat improvement and uncovered possible candidate genes. These results provide information about the genetic resources available to breeders to improve grain yield and nutritional properties of wheat products, as well as an opportunity to develop closely associated markers to aid molecular breeding of new varieties.
2. Results
2.1. Phenotypic Variation
Descriptive statistics, frequency distribution, and boxplots showed wide phenotypic variation for both GPC and TKW under three growing seasons (harvests 2014, 2017, 2021) within the set of 179 wheat accessions with total average over the crop seasons of 13.4 % ± 1.34 for GPC, and 45.2 g ± 4.28 for TKW (Table 1, Tables S1 and S2, Figure 1). The range of coefficients of variation (CV, %) across the individual years was similar for the two traits. Estimates of high broad-sense heritability (h2) for both traits showed moderate to high values in the individual growing seasons (from 0.64 to 0.78), and high values over the environments (0.82 for GPC and 0.81 for TKW). To exclude the impact of the growing season, we computed BLUE values for each accession, treating genotype as fixed and growing season as random effects. BLUEs varied across the years from 11.6 to 14.7 %, on average 13.4 % for GPC, and from 39.5 to 51.8 g, on average 45.4 g for TKW (Table 1, Tables S1 and S2, Figure 1).
The ANOVA results explained the presence of broad phenotypic variation among genotypes for GPC and TKW, revealing highly significant effects of genotype, environment (growing season), and their interaction (Table 2). For both traits, no significant differences were noted only between 2014 and 2017 (Table S3).
To assess the trait consistency across the environments and to explain the relationships between GPC and TKW, Pearson’s correlation coefficient approach was used. Low to high positive Pearson’s correlation coefficients (r) over the years were computed for GPC (spanning from 0.50 to 0.92) and TKW (ranging from 0.30 to 0.79) (Table 3). In general, consistency was noted across the growing seasons, with one exception – GPC in 2017 was not correlated with that in 2021. From the perspective of the data desirability for GWAS, correlation analysis was performed also with the BLUE mean values. The Pearson’s correlation coefficients (r) computed based on the BLUEs were positively significant (p<0.05) for both GPC and TKW. The two grain characteristics were not correlated across the growing seasons, as well as based on the BLUEs (Table 3).
According to [32], the studied population has a distinct structure, encompassing three sub-populations (SPs), of which SP1 (109 accessions) and SP3 (16 accessions) included predominantly modern releases, while the old germplasm formed a separate cluster, SP2 (49 accessions), and 5 genotypes were considered as admixed. Taking into account the distinct population structure, we tested the hypothesis of whether the old accessions differ significantly and consistently from the modern releases. Therefore, we compared the three SPs across the growing seasons. While the two sub-groups containing modern varieties did not differ significantly across the years and with the BLUEs concerning both GPC and TKW, the sub-group of old accessions (SP2) displayed variability across the environments. Sub-population SP2 had significantly lower GPC compared to the SP3-varieties in 2021, but did not differ from both groups of modern releases in 2014, 2017 and with the BLUEs (Figure 2a). The group of old germplasm showed a higher TKW mean value in 2017 but a lower value in 2021 when compared to SP1, whereas the TKW mean BLUE of SP2 was significantly lower than that of SP3 (Figure 2b).
To distinguish genotypes that could be used for improving grain protein content in breeding programs, the accessions were classified according to [2] into five groups with protein ≥13% (Group 1), ≥12% (Group 2), ≥11% (Group 3), and >10% (Group 4), <10 (Group 5). The prevailing part of the accessions (90 and 94% of SP1 and SP3 modern releases, 84% of SP2 old accessions, or 89% of the entire population) fall into Groups 1 and 2 (Figure 3).
In order to evaluate the phenotypic variability of the population throughout the crop seasons, we initially determined the deviations from the respective yearly average GPC and TKW. Subsequently, these discrepancies were averaged for each accession throughout the three seasons. The influence of genotypes fluctuated per the environmental gradient, with the variance extending from 0.012 (2014) to 0.025 (2017) for GPC (Table S4), and from 0.011 (2017) to 0.022 (2014) for TKW (Table S5). The variance within the entire population over the years spanned from 0.0 to 0.108 for GPC, and from 0.0 to 0.101 for TKW.
2.2. Linkage Disequilibrium (LD) Estimation, Significant Quantitative Trait Nucleotides (QTNs) and Quantitative Trait Loci (QTL)
From the perspective of GWAS, LD was considered. This is essential to define the interval of highly associated SNPs and to identify the most significant loci [16]. Here, we calculated LD decay using the whole association panel irrespective of the genotype status (old vs modern). The LD decay values varied from 1.5 to 3.0 Mbp on the individual chromosomes, with the highest value of LD decay in the D-genome (2.54 Mbp) and homoeologous group 3 (2.27 Mbp), on average 1.98 Mbp (Table S6).
For GPC, no significant QTNs were detected across the growing seasons (data not shown). However, based on BLUEs, a total of 293 significant QTNs were identified at -log10 (p) > 5.53, distributed on 18 chromosomes with the highest number (84) on chromosome 3A (Figure 4a).
We combined the adjacent significantly associated markers into 25 LD blocks as trait-associated QTL. These loci were positioned on 13 chromosomes (1A, 1B, 1D, 2A, 2B, 2D, 3A, 5A, 5B, 5D, 6A, 6B, and 7A), with the highest number of QTLs (5) on chromosome 3A (Table 4 and Table S7, Figure 5). If we assume that the adjacent significant SNPs are independent and there is no interaction between them, and therefore, their effect is additive, the total effect of the detected QTL represents a sum of the individual SNP effects [33]. The results underscored the presence of 13 QTL with positive additive effects on protein content ranging from 5.28 to 49.26, while the rest loci had negative summary effects ranging from -0.91 to -40.52, thus reducing the protein content. The proportion of phenotypic variance explained by the significant SNPs within QTL (R2 in %) ranged from 13 to 23% (Table 4). Locus QGpc.ippg-1A.2 with the highest number of individual SNPs with positive effect (11 out of 15), 14 to 20% individual markers contribution to the variation, and a total effect of 49.26 is promising for increasing the protein content.
For the yield-related trait TKW, a total of 483 significant QTNs (-log10 (p) > 5.53) were identified on all chromosomes (Figure 6a). Twenty-nine of them were detected in two growing seasons (2017 and 2021), and the rest 454 were based on BLUEs. Clustering of adjacent significant trait-associated SNPs/QTNs within LD blocks formed 35 QTL on 13 chromosomes (1A, 1B, 2B, 3A, 3B, 4B, 5A, 5B, 6A, 6B, 6D, 7A, 7B) with the highest number on chromosomes 2B (6), 3B (5) and 6A (5) (Table 5 and Table S8, Figure 5). Based on the additive assumption, most of the QTL associated with TKW displayed neutral, slightly negative, or slightly positive effects on the trait. Our findings emphasized one QTL (on 6A) with а strong negative effect, and two loci with a high positive impact (on 6D and 7A) on the trait (Table 5). Noteworthy, 14 SNPs distributed across chromosomes 1A, 1B, 2B, 6A, and 6B were deemed environmentally stable because of their strong association (-log10 (p) > 5.53) with TKW BLUE values and with phenotypic data gathered throughout at least one growing season (Table 5, Figure 5). Eight of them (on chromosomes 1A, 2B, 6A and 6B) were not included in LD blocks (Table 5). Both types of TKW-associated loci (QTL and independent stable QTNs) explained between 8 and 22% of the trait variance. The highest total additive effect (26.55) and the highest additive positive effect (50.01) on the trait was calculated for locus QTkw.ippg-6D having 28 positive SNPs out of 40, with the individual amount of variation 16 to 21% indicating that this region may be a relatively major QTL.
Collectively for the two traits, the majority of loci were mapped on A (26) and B (30) sub-genomes, while the D sub-genome carried a minor portion of QTL (4) (Table 4 and Table 5). The Q-Q plots supported the detected strong association signals for GPC and TKW (Figure 4b and Figure 6b).
Two genomic regions were shared between GPC and TKW (Figure 5). A short overlapping region on chromosome 2B (length of 55,849 bp) includes the interval from 646.9 to 647.0 Mbp and represent an intersection of QGpc.ippg-2B.1 and QTkw.ippg-2B.4, located in the support region of the flanking SNPs. The second one is a larger region on chromosome 6A extending from 607,9 to 613.0 Mbp (length of 5,087,923 bp), and includes the entire loci QGpc.ippg-6A.2 and QTkw.ippg-6A.5 (Table 4 and Table 5). The overlapping QTL in the chromosome 2B common region showed negative effects on both traits, while the loci in the shared region on chromosome 6A had high negative effect on protein content and slightly positive effect on TKW.
2.3. Potential Candidate Genes
To hypothesize potential candidate genes underlying the analyzed traits, we explored the 25 and 35 QTL detected for GPC and TKW, respectively, as well as the eight environmentally stable QTNs for TKW that were outside LD blocks. The search for candidate genes was performed based on the physical position of the flanking QTNs on T. aestivum L. cv. Chinese Spring reference genome extended by LD interval estimated for each chromosome based on LD decay. Within the defined QTL, we found a total of 1,460 high-confidence genes associated with GPC (Table 4 and Table S9). For TKW, a total of 2,477 high-confidence annotated genes within the 35 QTL, and 215 genes in the vicinity of the stable independent QTNs were evaluated as potential candidate genes (Table 5, Table S10).
In Table 6 and Table 7, we assembled shorter lists of selected potential candidate genes based on gene annotations and a literature survey. Relevant candidate genes associated with GPC and TKW encoded proteins involved in senescence-associated proteolysis, in nutrient remobilization and allocation from leaves to grains; storage proteins; a variety of transporter proteins; proteins involved in starch metabolism; the components of the ubiquitin-protease proteolytic system, and a number of transcription factors, such as NAC-domain proteins. Certain genes associated with early seed germination, such as subtilisin-like serine protease, alpha-amylase, thioredoxin and germin-like proteins, were shown to be specific to GPC. Regarding TKW, genes were found that code for proteins controlling grain size and weight, including expansins, cell wall invertase, and serine carboxypeptidase.
3. Discussion
3.1. Phenotypic Variation
To meet the growing demand for sufficient amounts and quality of food and overcome the challenges posed by environmental changes, it is essential to effectively utilize the available genetic resources of bread wheat [34]. Here, we used a collection of old and modern bread wheat accessions, and explored the genetic variation of TKW and GPC, the two most important characters determining yield and end-use quality, and eventually, the economic value of bread wheat. The study revealed large phenotypic variability for the target traits with highly significant contributions of genotype, environment, and genotype by environment interaction. The observed moderate to high values of broad-sense heritability and the consistency of trait records evidenced by the significant correlations between the crop seasons suggest that a considerable part of the variation is due to inherent genetic differences among the accessions. These results agree with similar findings in bread and durum wheat for GPC [19,25,27,35], and TKW [13,36]. Given that the panel contains historical and contemporary varieties released or collected between 1925 and 2010, it is possible that the recorded genetic variance—especially for TKW—is inflated. This is because throughout the course of nearly nine decades, genetic factors have contributed significantly to increases in yield and yield-related attributes. The landmark of these genetic gains for the Bulgarian wheat collection is the introduction of semi-dwarfing genes in the 1970s [11]. The pleiotropic effects that these genes exert on plant responsiveness to N applications, on photosynthetic rates, and on the accumulation of carbohydrates in the grain ultimately have improved grain yield.
This study shows that a large proportion (89%) of the accessions have protein above 12%, and are suitable for preparing leavened breads [2]. The average grain protein values (13.4%) are similar to or higher than the reported information on protein contents in other bread wheat collections [19,27,28,31,37]. Additional research revealed that some accession sets had greater protein values (up to 20%), demonstrating the impact of genotype by environment interactions [22,23,38].
Wheat yield and quality are affected by climatic factors (temperature, precipitation, drought type) [39]. In contrast to the abundant rainfall that was recorded from April to July in 2014, stretching from heading time to maturity, the amount of rain that fell in May and June 2017 was consistently less than the average for the climate (Figure S1), which suggests a sustained moderate drought during anthesis and grain filling. Prolonged water insufficiency early in grain development reduces the number of amyloplasts and endosperm cells, which lowers the capacity of starch accumulation, and ultimately lowers grain weight [40,41]. In 2021, a modest drought during anthesis and a more severe final drought were seen (Figure S1). Minor water stress following anthesis can speed up grain filling in wheat by boosting the activity of key catalytic enzymes that convert sucrose to starch, and by remobilizing nonstructural carbohydrates from the vegetative tissues to the grain [41]. The effects of these patterns of drought (timing and severity) explain well the significantly higher mean TKW value obtained in 2021 than that in 2017. The considerably lower mean TKW recorded in 2014 is consistent with research showing that prolonged soil wetness after anthesis restricts the amount of assimilates available to growing grains, hence diminishing the development of grain yield [42]. The observed variance in the protein content in the collection under study may potentially be explained by the precipitation oscillations among the three crop seasons. In our study, we found a significant difference (p < 0.001, Table 1) in the average protein values for 2014 (13.2%) and 2021 (14.2%), when prolonged waterlogging or terminal drought periods, respectively, were suggested during late vegetation. A decline in GPC has been associated with waterlogging [43]. Conversely, during a drought an increase in the seed proteins has been shown [44], possibly connected to modified carbon (C) partitioning and, hence, to a shift in the C/N ratio, that favors greater N-assimilation [45].
Significant genotype by environment interaction was seen (Table 2), and the genotypic effects varied along with the environmental gradient (Tables S4 and S5). It is interesting to note, that throughout the growing seasons varieties Mustang, Bozhana and Levent displayed consistently high positive deviation from the average GPC and high values of TKW. These accessions are potential sources for concurrent improvement of the two traits. Ancestral history indicates that the Mustang variety is descended from the old accession Yubilejna-3, which also exhibits consistently high protein levels in the grain. Additionally, its pedigree involves a hybrid derived from Agropyron sp., a wheatgrass that has been shown to contribute to seed storage proteins in wheat-Agropyron introgressions [46,47].
The lack of association between TKW and GPC in our data using Pearson’s approach shows that there is little to no decrease in seed weight in the presence of the identified loci for GPC. Similarly, no significant correlations were found between GPC and TKW across environments in studies of wheat lines derived from wild emmer [48,49]. This observation is consistent with findings by Oury and Godin [6] that genotype by environment interactions for grain yield and GPC may obscure the strong genetic background of the yield-protein interrelationship. Thus, Lindeque et al. [50] detected limited significant correlations between grain yield and protein content in a study of wheat accessions of various yielding capacities grown in environments of different precipitation trends. This result holds promise for the simultaneous genetic enhancement of the two traits.
Historical germplasm, such as landraces and traditional varieties, are an important source for bringing new genes into contemporary crops [31,51,52]. Therefore, it is strategically important to characterize these genetic resources in order to properly utilize them in pre-breeding. Our comparative analysis of variation for GPC showed that although the old germplasm (SP2) was characterized in general by high values of grain protein concentrations (Figure 3, Table S1), these values were lower than those of modern releases or did not differ notably from them (Figure 2). Moreover, the percentage of high-protein genotypes (≥ 12%) was higher in the two modern sub-populations, SP1 (90%) and SP3 (94%), compared to the old accessions of SP3 (84%). The idea that the older germplasm had superior yield-related metrics than the more recent varieties was also not supported by the observed variability in mean TKW values of SP2-accessions across the growing seasons. One likely reason is that a lot of contemporary Bulgarian varieties are either descended from old accessions, or have highly productive and high-protein Russian and Serbian ancestors in their pedigrees as Table S1 and the research by Kartseva et al. [27] show. These results suggest that wheat breeders have managed to construct improved varieties in terms of the studied traits.
3.2. Genomic Regions Associated with Grain Protein Content (GPC) and Thousand Kernel Weight (TKW)
Significant verified SNPs or genomic regions linked to GPC and TKW have been detected on all wheat chromosomes, according to recent research [14,53,54,55]. We compared the strongly associated SNPs found in this study to previously published loci or markers using the IWGSC RefSeq v.1.0 map as a reference. Our analysis identified four loci linked to GPC (QGpc.ippg-1A.2, -1A.3, -3A.2, and -3A.3) that include known QTNs [27,37,56,57], while QGpc.ippg-1A.2 and additional three loci were situated in close proximity (0.3 to 6 Mb distance) to other previously published genomic regions [19,28,57,58] (Table 4). Five SNP clusters and seven stable SNPs associated with TKW overlapped with previously reported QTL [21,53,58,59] (Table 5). Meanwhile, 14 TKW-linked SNP clusters were close (0.5 to 10 Mb distance) to reported QTL in both durum and bread wheat collections [30,36,53,58,59,60,61,62,63] (Table 5).
To our knowledge, the remaining QTL and/or stable QTNs associated with GPC and TKW detected in this study have not been previously linked to the studied traits suggesting that these loci are novel. Hence, we can say with a fair degree of confidence that some of the noteworthy loci associations with GPC on chromosomes 1A, 1B, 1D, 2A, 2B, 2D, 3A, 5A, 5B, 5D, 6A, 6B, and 7A found in the current research are unprecedented. Certain SNP/QTL related to TKW on chromosomes 1A, 1B, 3B, 5B, 6A, 6B, 6D, and all six QTL on 2B are also considered novel. The loci QGpc.ippg-1A.2, -2A, -3A.1, and -6B.2, and QTkw.ippg-6D with the highest additive positive effects and a high proportion of phenotypic variance explained are potentially distinct or close to known QTNs (QGpc.ippg-1A.2) trait-associated genomic regions that hold promise for use in breeding programs aimed at improving GPC and TKW, respectively.
3.3. Putative Candidate Genes Related to Grain Protein Content (GPC) and Thousand Kernel Weight (TKW)
We searched for potential candidate genes not only at suggestively novel loci, but also in genomic regions that validated previously established associations, given the wider genome coverage of the detected regions. The most well-known putative candidate genes that encode for various protein types related to GPC and TKW are summarized in Table 6 and Table 7, and the complete lists of all high-confidence genes are given in Tables S9 and S10. Grain production and nutrient content of cereal crops are governed by the buildup of nutrients in the grain near the end of the plant lifespan [64]. The quantity and quality of these nutrients is greatly affected by the remobilization of C and N from vegetative tissues to developing grain during senescence, as well as by the subsequent accumulation of resources for seed germination. All these processes are accompanied by expressional changes in a vast number of genes that ultimately impact both grain output and protein content [65]. Therefore, it is not surprising that we detected common putative candidate genes in the genomic regions that seemed to affect GPC and TKW in the studied association panel. The next section covers potential genes that may impact both traits and those that may affect only one.
3.3.1. Genes Related to Senescence-Associated Proteolysis, Nutrient Remobilization and Allocation from Source to Sink
Senescence-associated proteolysis in leaves results in hydrolysed transportable products which is essential for the source-to-sink allocation of nutrients. Within the GPC-related loci, we identified genes encoding cysteine-, aspartyl-, and serine-proteases, metalloproteases, and senescence-associated family proteins (DUF581). Several genes encoding the main constituents of the ubiquitin/26S proteasome system (UPS), particularly the proteasome subunit alpha type, 26S proteasome regulatory subunit family proteins, ubiquitin-activating enzyme E1, ubiquitin-conjugating enzyme E2, and E3 ubiquitin-protein ligase, were also found in the GPC-associated regions (Table 6). As for TKW, we found 23 putative genes for E3 ubiquitin-protein ligase (Table 7). TaGW2, a wheat gene that codes for E3 RING-type ubiquitin ligase, has two SNP polymorphisms that indicate its relationship to TKW, suggesting it as a potential candidate for grain development [66]. Within the TKW-associated loci, we retrieved six putative candidate genes translated into NRT1/PTR (Nitrate transporter 1/peptide transporter) proteins, and 13 genes annotated as high-affinity nitrate transporter proteins (Table 7). Products of the NRT1/PTR genes, together with the high-affinity transporter genes NRT2 (Nitrate transporter 2) are known for the uptake and translocation of nitrates and small peptides, thereby being involved in the N remobilization from source leaves to reservoir organs [67]. In the GPC-coding regions, we found genes encoding amino acid and peptide transporter proteins that are known to facilitate the transfer of amino acids across membranes and from source to sink. One gene, encoding glutamine synthetase, a key enzyme in the N assimilation, was detected on chromosome 6B (Table 6). The wheat glutamine synthetase genes were suggested to have functions for protein accumulation in grains [68], and for grain size traits, including TKW [69].
3.3.2. Genes Coding for Storage Proteins
The output of our search for GPC-related candidate genes includes three genes on chromosome 1A encoding for 11S globulin seed storage proteins. In wheat, the 11-12S globulins, called ‘triticins’, account for about 5% of the total seed protein [70], but are considered to be nutritionally rich due to the presence of a unique lysine-rich repeat motif [71]. Interestingly, six putative candidate genes with the annotated function of gamma gliadins and low-molecular-weight glutenins were discovered in the TKW-associated loci QTkw.ippg-1A.1 and -1A.2. Similarly, Giancaspro et al. [72] and Schierenbeck et al. [73] identified candidate genes for the key prolamins in TKW-coding regions. This finding is not surprising given that gliadins and glutenins make up the majority of endosperm reserve proteins in wheat grain. Two putative candidate genes for GPC and four genes for TKW were annotated as bifunctional inhibitors/lipid transfer protein/seed storage helical domain. Others also reported on such function of suggestive candidate genes underlying marker associations with grain architecture traits and TKW [59,73]. Although these genes might represent breeding interest for boosting yield components, it should be noted that the gene products, including lipid transfer proteins, inhibitors and seed reserve proteins, especially 2S albumins, are recognized as food allergens [74].
3.3.3. Genes Related to Sugar Transport and Starch Metabolism
Starchy endosperm makes up over 80% of cereal grains, hence increasing starch synthesis can improve TKW and yield. Starch synthesis in wheat grain requires the cooperation of numerous proteins with enzymatic and transporter functions [75,76]. In GPC-associated chromosome regions we detected putative candidate genes encoding sucrose transporter protein and PROTEIN TARGETING TO STARCH (PTST), while in TKW-related loci we found genes coding for SWEET (Sugars will eventually be exported transporters) proteins, sucrose synthase, and ADP-glucose pyrophosphorylase (AGPase) (Table 6 and Table 7). The gene TraesCS3A02G289800 translated into PTST (Table 6) has been recognized as putative candidate for grain protein in a recent study in a highly diverse population [27]. Candidate genes coding for SWEET sugar transporter [77] and AGPase [78] that may impact grain weight per spike and TKW, respectively, have also been proposed. Interestingly, we discovered a TKW candidate gene on chromosome 6B, which translated into cytokinin oxidase/dehydrogenase (CKX), an enzyme that controls cytokinin levels. An intriguing hypothesis suggests that a grain weight-associated locus (TaGW2-6A), which codes for E3 ubiquitin ligase, modulates the cytokinins’ expression levels through CKXs and the AGPase gene expression, which indirectly alters the rate of starch accumulation, size of endosperm cells, and ultimately the size and weight of grains [79].
3.3.4. Regulatory Genes
Regulatory networks during grain filling stage in cereals include differentially expressed transcription factors mainly enriched in NAC, WRKY, MYB, bZIP and others [64,65,80]. The output of our candidate gene search for GPC involved 11 genes encoding NAC-domain-containing proteins, seven genes for proteins with WRKY domain, and five genes for bZIP transcription factor family proteins (Table 6). As for TKW, we discovered 17 putative candidate genes encoding NAC-domain-containing proteins, and two genes for a SQUAMOSA promoter binding protein-like transcription factor (Table 7). NAC genes have been shown to regulate the transcriptional changes during early leaf senescence in wheat, including genes associated with the N and nutrient remobilization from source to sink [81,82], and with the grain accumulation of glutenin and starch [83,84], thereby presenting candidates for improved yield and quality breeding. Previous studies in rice [85] and wheat [72] reported on putative candidate genes for grain size and TKW, encoding for SQUAMOSA promoter binding protein-like, a star player for plant growth and development [86].
3.3.5. Genes Related to Early Seed Germination
In this work, we found prospective candidate genes related with GPC translated into subtilisin-like serine protease, alpha-amylase, thioredoxin, and germin-like protein (Table 6). Subtilisin-like proteases contribute to the degradation of reserve proteins during germination [87]. Genes for subtilisin-like proteases have been proposed as possible candidates for GPC [19] and seed longevity [88] in wheat. Alpha-amylase is one of the primary enzymes responsible for starch degradation to fuel early germinating grain [89]. Thioredoxins are ubiquitous tiny proteins (about 12 kDa) that can regulate the redox environment in the cell and play a key role in preharvest sprouting resistance and seed germination [90]. Germins and germin-like proteins are a broad and diverse class of plant proteins that were first identified in germinating wheat grains [91].
3.3.6. Genes Related to the Regulation of Grain Size and Weight
In TKW-associated regions, we detected two putative candidate genes coding for cell wall invertase (CWI), four genes coding for serine carboxypeptidase, and three expansin-coding genes. CWI is an enzyme that is essential for sink tissue formation and C partitioning, and has a strong correlation with kernel weight [92,93]. Orthologous genes encoding serine carboxypeptidase in rice (OsGS5) and wheat (TaGS5) have been associated with changes in grain size and weight [94,95]. Expansins affect the structure of the cell wall, cell growth, and grain tissue extension, and so play a crucial role in determining grain size [96].
4. Materials and Methods
4.1. Plant Material
The plant material consisted of 179 winter wheat (Triticum aestivum L.) accessions that originated from Bulgaria, of which 129 were modern varieties, and 50 were old accessions (historic varieties of tall stature and landraces). Seeds from the old accessions were procured from the seed gene banks at the Leibniz Institute for Plant Genetics and Crop Research (IPK), Gatersleben, Germany, and the Crop Research Institute, Prague, Czech Republic. According to the available information, the period of early breeding and research expeditions to aggregate seeds from landraces and historic varieties for gene bank collections expands from 1925 to 1970. Seeds from the contemporary varieties released until 2010 were made available from the two major breeding centers in Bulgaria (Dobrudzha Agricultural Institute, General Toshevo and the Institute of Plant Genetic Resources, Sadovo), as well as by breeders. Information about botanical variety, status (modern vs old), year of release and known genealogy is given in Table S1.
4.2. Phenotyping
The seed material was collected from field experiments conducted in Sofia, Bulgaria (42o41´N, 23o19´E) during three crop seasons (2013/14, 2016/17 and 2020/21), denoted by the year of harvest (2014, 2017 and 2021). For each growing season, the accessions were sown in a random design in double 1 m-long rows and two replications. The soil type at the experimental field is leached vertisol, pH 6.1, with 3.1 % humus, 1,420 mg total N per kg soil, of which 18 mg inorganic N. Plants received 120 kg N/ha as ammonium nitrate in two split doses, 40 kg/ha two weeks after sowing and 80 kg/ha before stem extension growth stage. For pest control, standard agricultural practices were applied. The average monthly temperature ranged between -5.8°C and 23.2°C, during the vegetation cycles (October-July). The monthly precipitation ranged from 4.7 mm to 150.5 mm, with average annual precipitation of 682 mm, which is ca. 20 % higher than the climate norm for Sofia. Information on the monthly weather statistics for the region of the experimental field is presented in Figure S1.
Plant material was hand-harvested and hand-threshed. For each genotype and crop season, the thousand kernel weight (TKW) was determined based on grain number and grain mass of 10 main spikes per replication. The grain protein content (GPC) was measured in three pooled whole-grain powder samples (1.0 g each) for each accession and year. Before analyses, seeds were dried to a constant weight and ground to a fine powder with IKA Tube Mill Control (IKA Werke GmbH & Co, Staufen, Germany). The total N concentration was determined using a UDK 159 Automatic Kjeldahl Nitrogen Protein Analyzer (Velp Scientifica, Italy), and the corresponding GPC values (in %) were automatically inferred from the N values, according to [97].
4.3. Statistical Analyses
The significant differences in GPC and TKW among accessions, growing seasons, and interaction effects between genotype and environment were tested by analysis of variance (ANOVA). The Best Linear Unbiased Estimators (BLUEs) for each accession across the growing seasons were obtained to eliminate the environmental impact by assuming the genotype as a fixed effect and the growing season as a random effect. The relationships for GPC and TKW among the growing seasons and with the BLUEs of these traits were tested by Pearson correlation coefficients (r).
Broad sense heritability h2 for GPC and TKW was calculated using the formula:
where is the genotype variance, is the variance of the residual, and nE is the number of environments (growing seasons). Heritability in each environment was estimated using the same formula, where nE in the denominator is the number of replications in a given environment.
All phenotypic data analyses were accomplished using STATISTICA 14 [98].
4.4. Association Mapping and Candidate Gene Search
Before performing marker-trait association analysis, the population stratification, the genetic relatedness among population entries and the LD were considered. The genotypic data for the association panel of 179 accessions were already available from the 25K Infinium iSelect array (SGS Institut Fresenius GmbH TraitGenetics Section, Gatersleben, Germany) and described in [32]. Population structure was modeled using the Bayesian clustering algorithm in STRUCTURE 2.3.4, and the membership coefficients (Q-values) were determined [32]. Kinship was estimated as a similarity matrix (K) from 17,083 SNPs in TASSEL v. 5 (https://tassel.bitbucket.io/, accessed on 10 December 2023). The values of LD decay (in Mbp) were determined for each chromosome as described in [32]. Considering the distinctive population structure and high genetic relatedness among population individuals, GWAS was undertaken with a mixed linear model (MLM), Q+K model, to control pseudo associations [99,100,101]. Hence, the filtered set of 17,083 SNPs, phenotypic data from the three crop seasons, and the calculated BLUE mean values for the traits, along with population structure (Q values) and kinship similarity matrix (K) as covariates were used for association mapping analysis in TASSEL v.5. Additive effects and R2 (percent phenotypic variation) of QTNs were estimated in TASSEL v.5 and Excel (Microsoft). The percentage of phenotypic variation explained by each QTN (R2) was calculated as the difference of R2 with and without the strongest associated SNP.
The threshold of statistically significant QTNs was set by the Bonferroni algorithm. Bonferroni corrected p-value was calculated with the formula: p-value =, here α=0.05 and n is the number of SNPs. The threshold above which the significant markers on the Manhattan plots are located was calculated by -log10 (corrected p-values). According to our data, for the 17,083 SNP markers, the estimated Bonferroni threshold is 5.53. On quantile-quantile (Q-Q) plots, distributions of important p-values (expected vs. observed -log10 (p-values)) for GPC and TKW were shown. To draw the Manhattan plots and Q-Q plots, R package qqman was employed [102]. Clusters of three or more SNPs were considered as suggestive QTL, when the flanking markers met the above criteria for significance, and the adjacent SNPs were located within a support interval based on the LD decay values estimated for each chromosome. Trait-associated SNPs obtained with BLUEs that were shared with at least one individual growing season, and at least one of them was significant (-log10 (p)>5.53) were considered as environmentally stable ones.
Candidate gene regions were defined as LD blocks harboring significant flanking trait-associated markers (-log10(p)>5.53) and their extension to the left and right within the LD-estimated interval. For significant trait-associated SNPs outside of LD blocks (referred to as independent QTNs), flanking regions within the LD interval on either side of the marker were searched for candidate genes. Within these regions, high-confidence putative candidate genes were predicted by blasting against the cv. Chinese Spring reference genome IWGSC RefSeq v1.0. [103]. Gene annotations, gene ontologies (GOs), InterPros and details for the potential candidate genes were obtained using EnsemblPlants, and Persephone web-based platforms (http://plants.ensembl.org/Triticum_aestivum/Info/Index; https://web.persephonesoft.com/?data) (accessed on 10 January 2024).
5. Conclusions
The GWAS analysis revealed a number of QTL underlying both studied traits. Additionally, 14 environmentally stable QTNs on chromosomes 1A, 1B, 2B, 6A, and 6B were found for TKW. While some of the loci confirmed already published ones, others might be new. Among these, four loci for GPC (QGpc.ippg-1A.2, -2A, 3A.1 and -6B.2) and one locus for TKW (QTkw.ippg-6D) had notably positive effect on the traits, thereby representing promising genomic regions for use in breeding projects aiming at improving grain protein and yield, respectively. Besides, to our knowledge all of the targeted regions except for QGpc.ippg-1A.2, have not been previously linked to the studied traits. Based on their gene ontology and annotation, a few of the many high-confidence genes that were retrieved from the trait-associated genomic areas were selected as intriguing candidates. Annotations to senescence-associated proteolysis, nutrient remobilization and source-to-sink allocation, synthesis of storage proteins, starch metabolism, seed germination, and regulatory transcription factors are present in these genes.
Supplementary Materials
The following supporting information can be downloaded at the website of this paper posted on Preprints.org, Figure S1: Climate characteristics at the experimental site, Sofia, Bulgaria (42o41´N, 23o19´E) during three crop seasons (2013/14, 2016/17 and 2020/21). The precipitation is related to the climate norm (1961–90) accepted by the Bulgarian National Institute of Meteorology and Hydrology, Ministry of Environment and Water; Table S1: Information about the 179 wheat accessions from Bulgaria and summary statistics for grain protein content (GPC) from three crop seasons (harvests 2014, 2017, 2021), average over the seasons, and the average best linear unbiased estimator (BLUE) values; Table S2: Information about the 179 wheat accessions from Bulgaria and summary statistics for thousand kernel weight (TKW) from three crop seasons (harvests 2014, 2017, 2021), average over the seasons, and the average best linear unbiased estimator (BLUE) values; Table S3: Analysis of variance of the single factor “Growing season” of grain protein content (GPC) and thousand kernel weight (TKW) in a set of 179 bread wheat accessions in three growing seasons (harvests 2014, 2017, 2021); Table S4: Variability and stability of grain protein content (GPC ) in a set of 179 bread wheat accessions; Table S5: Variability and stability of thousand kernel weight (TKW) in a set of 179 bread wheat accessions; Table S6: Values of linkage disequilibrium (LD) decay for each chromosome, homoeologous group and genome in a set of 179 old and modern bread wheat accessions from Bulgaria; Table S7: Quantitative trait loci (QTL) for grain protein content (GPC) identified by GWAS analysis in a set of 179 old and modern bread wheat accessions from Bulgaria; Table S8: Quantitative trait loci (QTL) for thousand kernel weight (TKW) identified by GWAS analysis in a set of 179 old and modern bread wheat accessions from Bulgaria; Table S9: Candidate genes inside QTL for grain protein content (GPC); Table S10: Candidate genes inside QTL and in the LD-supported interval of the stable QTNs for thousand kernel weight (TKW).
Author Contributions
Conceptualization, S.M. and T.K.; formal analysis, V.A.; investigation, T.K., K.K. and D.D.; resources, T.K., K.P., S.M. and A.B.; data curation, T.K. and V.A.; writing—original draft preparation, S.M.; writing—review and editing, A.M.A., M.A.R.A., A.B. and K.K.; visualization, V.A., T.K., S.M. and M.A.R.A.; supervision, S.M. and A.M.A.; project administration, S.M.; funding acquisition, S.M. All authors have read and agreed to the published version of the manuscript.
Funding
This research was funded by the Bulgarian National Science Fund, grant number KP-06-N31/17.
Data Availability Statement
Data are contained within the article and its Supplementary Materials.
Conflicts of Interest
The authors declare no conflicts of interest. The funders had no role in the design of the study; in the collection, analyses, or interpretation of data; in the writing of the manuscript; or in the decision to publish the results.
References
- Veraverbeke, W.S.; Delcour, J.A. Wheat protein composition and properties of wheat glutenin in relation to breadmaking functionality. Crit. Rev. Food Sci. Nutr. 2002, 42, 179–208. [Google Scholar] [CrossRef] [PubMed]
- Peña, R.J. Wheat for bread and other foods. In Bread Wheat. Improvement and Production. FAO Plant Production and Protection Series No. 30; Curtis, B.S.; Rajaram, S.; Gómez Macpherson, H., Eds.; Food and Agriculture Organization of the United Nations, Rome, 2002. (https://www.fao.org/3/y4011e/y4011e0w.htm#bm32).
- Barneix, A.J. Physiology and biochemistry of source-regulated protein accumulation in the wheat grain. J. Plant Physiol. 2007, 164, 581–590. [Google Scholar] [CrossRef] [PubMed]
- Shewry, P.R.; Hassall, K.L.; Grausgruber, H.; Andersson, A.A.M.; Lampi, A.-M.; Piironen, V.; Rakszegi, M.; Ward, J.L.; Lovegrove, A. Do modern types of wheat have lower quality for human health? Nutrition Bulletin 2020, 45, 362–373. [Google Scholar] [CrossRef] [PubMed]
- Cooper, M.; Woodruff, D.R.; Philips, I.G.; Basford, K.E.; Gilmour, A.R. Genotype-by-management interactions for grain yield and grain protein concentration of wheat. Field Crop. Res. 2001, 70, 87–88. [Google Scholar] [CrossRef]
- Oury, F.X.; Godin, C. Yield and grain protein concentration in bread wheat: how to use the negative relationship between the two characters to identify favourable genotypes? Euphytica 2007, 157, 45–57. [Google Scholar] [CrossRef]
- Laidig, F.; Piepho, H.P.; Rentel, D.; Drobek, T.; Meyer, U.; Huesken, A. Breeding progress, environmental variation and correlation of winter wheat yield and quality traits in german official variety trials and on-farm during 1983–2014. Theor. Appl. Genet. 2017, 130, 223–245. [Google Scholar] [CrossRef] [PubMed]
- Geyer, M.; Mohler, V.; Hartl, L. Genetics of the inverse relationship between grain yield and grain protein content in common wheat. Plants 2022, 11, 2146. [Google Scholar] [CrossRef]
- Poudel, R.; Bhinderwala, F.; Morton, M.; Powers, R.; Rose, D.J. Metabolic profiling of historical and modern wheat cultivars using proton nuclear magnetic resonance spectroscopy. Sci. Rep. 2021, 11, 3080. [Google Scholar] [CrossRef] [PubMed]
- Majdrakov, P. For wheat from Pavlikeni. Seed Prod. 1945, 4, 132–141. (In Bulgarian) [Google Scholar]
- Ganeva, G.; Korzun, V.; Landjeva, S.; Tsenov, N.; Atanasova, M. Identification, distribution and effects on agronomic traits of the semi-dwarfing Rht alleles in Bulgarian bread wheat cultivars. Euphytica 2005, 145, 305–315. [Google Scholar] [CrossRef]
- Börner, A.; Landjeva, S.; Nagel, M.; Rehman Arif, M.A.; Allam, M.; Agacka, M.; Doroszewska, T.; Lohwasser, U. Plant genetic resources for food and agriculture (PGRFA) – maintenance and research. Genet. Plant Physiol. 2014, 4, 13–21. [Google Scholar]
- Garcia, M.; Eckermann, P.; Haefele, S.; Satija, S.; Sznajder, B.; Timmins, A.; Baumann, U.; Wolters, P.; Mather, D.E.; Fleury, D. Genome-wide association mapping of grain yield in a diverse collection of spring wheat (Triticum aestivum L.) evaluated in southern Australia. PLoS ONE 2019, 14, e0211730. [Google Scholar] [CrossRef]
- Paina, C.; Gregersen, P.L. Recent advances in the genetics underlying wheat grain protein content and grain protein deviation in hexaploid wheat. Plant Biol. 2023, 25, 661–670. [Google Scholar] [CrossRef]
- Robert, N.; Hennequet, C.; Berard, P. Dry matter and nitrogen accumulation in wheat kernel: genetic variation in rate and duration of grain filling. J. Genet. Breed. 2001, 55, 297–306. [Google Scholar]
- Alqudah, A.M.; Sallam, A.; Baenziger, P.S.; Börner, A. GWAS: Fast-forwarding gene identification and characterization in temperate cereals: Lessons from barley—A review. J. Adv. Res. 2020, 22, 119–135. [Google Scholar] [CrossRef] [PubMed]
- Daba, S.D.; Tyagi, P.; Brown-Guedira, G.; Mohammadi, M. Genome-wide association studies to identify loci and candidate genes controlling kernel weight and length in a historical United States wheat population. Front. Plant Sci. 2018, 9, 1045. [Google Scholar] [CrossRef] [PubMed]
- Muhammad, A.; Hu, W.; Li, Z.; Li, J.; Xie, G.; Wang, J.; Wang, L. Appraising the genetic architecture of kernel traits in hexaploid wheat using GWAS. Int. J. Mol. Sci. 2020, 21, 5649. [Google Scholar] [CrossRef]
- Muqaddasi, Q.H.; Brassac, J.; Ebmeyer, E.; Kollers, S.; Korzun, V.; Argillier, O.; Stiewe, G.; Plieske, J.; Ganal, M.W.; Röder, M.S. Prospects of GWAS and predictive breeding for European winter wheat’s grain protein content, grain starch content, and grain hardness. Sci. Rep. 2020, 10, 12541. [Google Scholar] [CrossRef] [PubMed]
- Alemu, A.; El Baouchi, A.; El Hanafi, S.; Kehel, Z.; Eddakhir, K.; Tadesse, W. Genetic analysis of grain protein content and dough quality traits in elite spring bread wheat (Triticum aestivum) lines through association study. J. Cereal Sci. 2021, 100, 103214. [Google Scholar] [CrossRef]
- Rufo, R.; López, A.; Lopes, M.S.; Bellvert, J.; Soriano, J.M. Identification of quantitative trait loci hotspots affecting agronomic traits and high-throughput vegetation indices in rainfed wheat. Front. Plant Sci. 2021, 12, 735192. [Google Scholar] [CrossRef]
- Suliman, S.; Alemu, A.; Abdelmula, A.A.; Badawi, G.H.; Al-Abdallat, A.; Tadesse, W. Genome-wide association analysis uncovers stable QTLs for yield and quality traits of spring bread wheat (Triticum aestivum) across contrasting environments. Plant Gene 2021, 25C, 100269. [Google Scholar] [CrossRef]
- Leonova, I.N.; Kiseleva, A.A.; Berezhnaya, A.A.; Stasyuk, A.I.; Likhenko, I.E.; Salina, E.A. Identification of QTLs for grain protein content in Russian spring wheat varieties. Plants 2022, 11, 437. [Google Scholar] [CrossRef]
- White, J.; Sharma, R.; Balding, D.; Cockram, J.; Mackay, I.J. Genome-wide association mapping of Hagberg falling number, protein content, test weight, and grain yield in U.K. wheat. Crop Sci. 2022, 62, 965–981. [Google Scholar] [CrossRef] [PubMed]
- Alomari, D.Z.; Schierenbeck, M.; Alqudah, A.M.; Alqahtani, M.D.; Wagner, S.; Rolletschek, H.; Borisjuk, L.; Röder, M.S. Wheat grains as a sustainable source of protein for health. Nutrients 2023, 15, 4398. [Google Scholar] [CrossRef] [PubMed]
- Guo, Y.; Wang, G.; Guo, X.; Chi, S.; Yu, H.; Jin, K.; Huang, H.; Wang, D.; Wu, C.; Tian, J.; Chen, J.; Bao, Y.; Zhang, W.; Deng, Z. Genetic dissection of protein and starch during wheat grain development using QTL mapping and GWAS. Front. Plant Sci. 2023, 14, 1189887. [Google Scholar] [CrossRef] [PubMed]
- Kartseva, T.; Alqudah, A.M.; Aleksandrov, V.; Alomari, D.Z.; Doneva, D.; Arif, M.A.R.; Börner, A.; Misheva, S. Nutritional genomic approach for improving grain protein content in wheat. Foods 2023, 12, 1399. [Google Scholar] [CrossRef] [PubMed]
- Krishnappa, G.; Khan, H.; Krishna, H.; Devate, N.B.; Kumar, S.; Mishra, C.N.; Parkash, O.; Kumar, S.; Kumar, M.; Mamrutha, H.M.; Singh, G.P.; Singh, G. Genome-wide association study for grain protein, thousand kernel weight, and normalized difference vegetation index in bread wheat (Triticum aestivum L.). Genes 2023, 14, 637. [Google Scholar] [CrossRef]
- Sharma, A.; Arif, M.A.R.; Shamshad, M.; Rawale, K.S.; Brar, A.; Burgueño, J.; Shokat, S.; Ravinder Kaur, R.; Vikram, P.; Srivastava, P.; Sandhu, N.; Singh, J.; Kaur, S.; Chhuneja, P.; Singh, S. Preliminary dissection of grain yield and related traits at differential nitrogen levels in diverse pre-breeding wheat germplasm through association mapping. Mol. Biotechnol. 2023, 65, 116–130. [Google Scholar] [CrossRef]
- Tyrka, M.; Krajewski, P.; Bednarek, P.T.; Rączka, K.; Drzazga, T.; Matysik, P.; Martofel, R.; Woźna-Pawlak, U.; Jasińska, D.; Niewińska, M.; Ługowska, B.; Ratajczak, D.; Sikora, T.; Witkowski, E.; Dorczyk, A.; Tyrka, D. Genome-wide association mapping in elite winter wheat breeding for yield improvement. J. Appl. Genet. 2023, 64, 377–391. [Google Scholar] [CrossRef]
- Yannam, V.R.R.; Lopes, M.; Guzman, C.; Soriano, J.M. Uncovering the genetic basis for quality traits in the Mediterranean old wheat germplasm and phenotypic and genomic prediction assessment by cross-validation test. Front. Plant Sci. 2023, 4, 1127357. [Google Scholar] [CrossRef]
- Aleksandrov, V.; Kartseva, T.; Alqudah, A.M.; Kocheva, K.; Tasheva, K.; Börner, A.; Misheva, S. Genetic diversity, linkage disequilibrium and population structure of Bulgarian bread wheat assessed by genome-wide distributed SNP markers: from old germplasm to semi-dwarf cultivars. Plants 2021, 10, 1116. [Google Scholar] [CrossRef]
- Nelson, R.M.; Pettersson, M.E.; Carlborg, O. A century after Fisher: Time for a new paradigm in quantitative genetics. Trends Genet. 2013, 29, 669–676. [Google Scholar] [CrossRef] [PubMed]
- Arif, M.A.R.; Waheed, M.Q.; Lohwasser, U.; Shokat, S.; Alquddah, A.M.; Volkmar, C.; Börner, A. Genetic insight into the insect resistance in bread wheat exploiting the untapped natural diversity. Front. Genet. 2022, 13, 898905. [Google Scholar] [CrossRef]
- Rathan, N.D.; Krishnappa, G.; Singh, A.-M.; Govindan, V. Mapping QTL for phenological and grain-related traits in a mapping population derived from high-zinc-biofortified wheat. Plants 2023, 12, 220. [Google Scholar] [CrossRef]
- Mulugeta, B.; Tesfaye, K.; Ortiz, R.; Johansson, E.; Hailesilassie, T.; Hammenhag, C.; Hailu, F.; Geleta, M. Marker-trait association analyses revealed major novel QTLs for grain yield and related traits in durum wheat. Front. Plant Sci. 2023, 13, 1009244. [Google Scholar] [CrossRef]
- Rathan, N.D.; Krishna, H.; Ellur, R.K.; Sehgal, D.; Govindan, V.; Ahlawat, A.K.; Krishnappa, G.; Jaiswal, J.P.; Singh, J.B.; Saiprasad, S.V.; Ambati, D.; Singh, S.M.; Bajpai, K.; Mahendru-Singh, A. Genome-wide association study identifies loci and candidate genes for grain micronutrients and quality traits in wheat (Triticum aestivum L.). Sci. Rep. 2022, 12, 7037. [Google Scholar] [CrossRef] [PubMed]
- Yang, Y.; Chai, Y.; Zhang, X.; Lu, S.; Zhao, Z.; Wei, D.; Chen, L.; Hu, Y.-G. Multi-locus GWAS of quality traits in bread wheat: mining more candidate genes and possible regulatory Network. Front. Plant Sci. 2020, 11, 1091. [Google Scholar] [CrossRef]
- Akram, S.; Arif, M.A.R.; Hameed, A. A GBS-based GWAS analysis of adaptability and yield traits in bread wheat (Triticum aestivum L.). J. Appl. Genet. 2020, 62, 27–41. [Google Scholar] [CrossRef] [PubMed]
- Wan, C.; Dang, P.; Gao, L.; Wang, J.; Tao, J.; Qin, X.; Feng, B.; Gao, J. How does the environment affect wheat yield and protein content response to drought? A meta-analysis. Front. Plant Sci. 2022, 13, 896985. [Google Scholar] [CrossRef]
- Teng, Z.; Chen, Y.; Meng, S.; Duan, M.; Ye, N.; Zhang, J. Environmental stimuli: A major challenge during grain filling in cereals. Int. J. Mol. Sci. 2023, 24, 2255. [Google Scholar] [CrossRef]
- Ma, S.; Hou, J.; Wang, Y.; Wang, M.; Zhang, W.; Fan, Y.; Huang, Z. Post-flowering soil waterlogging curtails grain yield formation by restricting assimilates supplies to developing grains. Front. Plant Sci. 2022, 13, 944308. [Google Scholar] [CrossRef]
- Herzog, M.; Striker, G.G.; Colmer, T.D.; Pedersen, O. Mechanisms of waterlogging tolerance in wheat – a review of root and shoot physiology. Plant, Cell Environ. 2016, 39, 1068–1086. [Google Scholar] [CrossRef] [PubMed]
- Gooding, M.J.; Ellis, R.H.; Shewry, P.R.; Schofield, J.D. Effects of restricted water availability and increased temperature on the grain filling, drying and quality of winter wheat. J. Cereal Sci. 2003, 37, 295–309. [Google Scholar] [CrossRef]
- Sehgal, D.; Mondal, S.; Guzman, C.; Garcia Barrios, G.; Franco, C.; Singh, R.; Dreisigacker, S. Validation of candidate gene-based markers and identification of novel loci for thousand-grain weight in spring bread wheat. Front. Plant Sci. 2019, 10, 1189. [Google Scholar] [CrossRef] [PubMed]
- Han, F.; Liu, B.; Fedak, G.; Liu, Z. Genomic constitution and variation in five partial amphiploids of wheat—Thinopyrum intermedium as revealed by GISH, multicolor GISH and seed storage protein analysis. Theor. Appl. Genet. 2004, 109, 1070–1076. [Google Scholar] [CrossRef] [PubMed]
- Georgieva, M.; Sepsi, A.; Tyankova, N.; Molnár-Láng, M. Molecular cytogenetic characterization of two high protein wheat-Thinopyrum intermedium partial amphiploids. J. Appl. Gen. 2011, 52, 269–277. [Google Scholar] [CrossRef]
- Fatiukha, A.; Filler, N.; Lupo, I.; Lidzbarsky, G.; Klymiuk, V.; Korol, A.B.; Pozniak, C.; Fahima, T.; Krugman, T. Grain protein content and thousand kernel weight QTLs identified in a durum × wild emmer wheat mapping population tested in five environments. Theor. Appl. Genet. 2020, 133, 119–131. [Google Scholar] [CrossRef]
- Liu, J.; Huang, L.; Wang, C.; Liu, Y.; Yan, Z.; Wang, Z.; Xiang, L.; Zhong, X.; Gong, F.; Zheng, Y.; et al. Genome-wide association study reveals novel genomic regions associated with high grain protein content in wheat lines derived from wild emmer wheat. Front. Plant Sci. 2019, 10, 464. [Google Scholar] [CrossRef]
- Lindeque, R.C.; van Biljon, A.; Labuschagne, M.T. Defining associations between grain yield and protein quantity and quality in wheat from the three primary production regions of South Africa. J. Cereal Sci. 2018, 79, 294e302. [Google Scholar] [CrossRef]
- Cseh, A.; Poczai, P.; Kiss, T.; Balla, K.; Berki, Z.; Horváth, A.; Kuti, C.; Karsai, I. Exploring the legacy of Central European historical winter wheat landraces. Sci. Rep. 2021, 11, 23915. [Google Scholar] [CrossRef]
- López-Fernández, M.; Pascual, L.; Faci, I.; Fernández, M.; Ruiz, M.; Benavente, E.; Giraldo, P. Exploring the end-use quality potential of a collection of spanish bread wheat landraces. Plants 2021, 10, 620. [Google Scholar] [CrossRef] [PubMed]
- Cao, S.; Xu, D.; Hanif, M.; Xia, X.; He, Z. Genetic architecture underpinning yield component traits in wheat. Theor. Appl. Genet. 2020, 33, 1811–1823. [Google Scholar] [CrossRef] [PubMed]
- Liu, H.; Mullan, D.; Zhang, C.; Zhao, S.; Li, X.; Zhang, A.; Lu, Z.; Wang, Y.; Yan, G. Major genomic regions responsible for wheat yield and its components as revealed by meta-QTL and genotype–phenotype association analyses. Planta 2020, 252, 65. [Google Scholar] [CrossRef] [PubMed]
- Saini, P.; Sheikh, I.; Saini, D.K.; Mir, R.R.; Dhaliwal, H.S.; Tyagi, V. Consensus genomic regions associated with grain protein content in hexaploid and tetraploid wheat. Front. Genet. 2022, 13, 1021180. [Google Scholar] [CrossRef] [PubMed]
- Lou, H.; Zhang, R.; Liu, Y.; Guo, D.; Zhai, S.; Chen, A.; Zhang, Y.; Xie, C.; You, M.; Peng, H.; Liang, R.; Ni, Z.; Sun, Q.; Li, B. Genome-wide association study of six quality-related traits in common wheat (Triticum aestivum L.) under two sowing conditions. Theor. Appl. Genet. 2021, 134, 399–418. [Google Scholar] [CrossRef] [PubMed]
- Sandhu, K.S.; Mihalyov, P.D.; Lewien, M.J.; Pumphrey, M.O.; Carter, A.H. Genomic selection and genome-wide association studies for grain protein content stability in a nested association mapping population of wheat. Agronomy 2021, 11, 2528. [Google Scholar] [CrossRef]
- López-Fernández, M.; García-Abadillo, J.; Uauy, C.; Ruiz, M.; Giraldo, P.; Pascual, L. Genome wide association in Spanish bread wheat landraces identifies six key genomic regions that constitute potential targets for improving grain yield related traits. Theor. Appl. Genet. 2023, 136, 244. [Google Scholar] [CrossRef] [PubMed]
- Eltaher, S.; Sallam, A.; Emara, H.A.; Nower, A.A.; Salem, K.F.M.; Börner, A.; Baenziger, P.S.; Mourad, A.M.I. Genome-wide association mapping revealed SNP alleles associated with spike traits in wheat. Agronomy 2022, 12, 1469. [Google Scholar] [CrossRef]
- Sun, C.; Zhang, F.; Yan, X.; Zhang, X.; Dong, Z.; Cui, D.; Chen, F. Genome-wide association study for 13 agronomic traits reveals distribution of superior alleles in bread wheat from the Yellow and Huai Valley of China. Plant Biotechnol J. 2017, 15, 953–969. [Google Scholar] [CrossRef]
- Alqudah, A.M.; Haile, J.K.; Alomari, D.Z.; Pozniak, C.J.; Kobiljski, B.; Börner, A. Genome-wide and SNP network analyses reveal genetic control of spikelet sterility and yield-related traits in wheat. Sci. Rep. 2020, 10, 1–2. [Google Scholar] [CrossRef]
- Kumar, S.; Kumari, J.; Bhusal, N.; Pradhan, A.K.; Budhlakoti, N.; Mishra, D.C.; Chauhan, D.; Kumar, S.; Singh, A.K.; Reynolds, M.; Singh, G.P.; Singh, K.; Sareen, S. Genome-wide association study reveals genomic regions associated with ten agronomical traits in wheat under late-sown conditions. Front. Plant Sci. 2020, 11, 549743. [Google Scholar] [CrossRef] [PubMed]
- Chidzanga, C.; Daniel Mullan, D.; Roy, S.; Baumann, U.; Garcia, M. Nested association mapping-based GWAS for grain yield and related traits in wheat grown under diverse Australian environments. Theor. Appl. Genet. 2022, 135, 4437–4456. [Google Scholar] [CrossRef]
- Borrill, P.; Harrington, S.A.; Simmonds, J.; Uauy, C. Identification of transcription factors regulating senescence in wheat through gene regulatory network modelling. Plant Physiol. 2019, 180, 1740–1755. [Google Scholar] [CrossRef] [PubMed]
- Sultana, N.; Islam, S.; Juhasz, A.; Ma, W. Wheat leaf senescence and its regulatory gene network. Crop J. 2021, 9, 703–717. [Google Scholar] [CrossRef]
- Su, Z.; Hao, C.; Wang, L.; Dong, Y.; Zhang, X. Identification and development of a functional marker of TaGW2 associated with grain weight in bread wheat (Triticum aestivum L.). Theor. Appl. Genet. 2011, 122, 211–223. [Google Scholar] [CrossRef] [PubMed]
- Puccio, G.; Ingraffia, R.; Giambalvo, D.; Frenda, A.S.; Harkess, A.; Sunseri, F.; Mercati, F. Exploring the genetic landscape of nitrogen uptake in durum wheat: genome-wide characterization and expression profiling of NPF and NRT2 gene families. Front. Plant Sci. 2023, 14, 1302337. [Google Scholar] [CrossRef] [PubMed]
- Gadaleta, A.; Nigro, D.; Giancaspro, A.; Blanco, A. The glutamine synthetase (GS2) genes in relation to grain protein content of durum wheat. Funct. Integr. Genomics 2011, 11, 665–670. [Google Scholar] [CrossRef] [PubMed]
- Guo, Y.; Sun, J.; Zhang, G.; Wang, Y.; Kong, F.; Zhao, Y.; Sishen Li, S. Haplotype, molecular marker and phenotype effects associated with mineral nutrient and grain size traits of TaGS1a in wheat. Field Crops Res. 2013, 154, 119–125. [Google Scholar] [CrossRef]
- Shewry, P.R.; Halford, N.G. Cereal seed storage proteins: Structures, properties and role in grain utilization. J. Exp. Bot. 2002, 53, 947–958. [Google Scholar] [CrossRef]
- Yadav, D.; Singh, N.K. Wheat triticin: A potential target for nutritional quality improvement. Asian J. Biotech. 2011, 3, 1–21. [Google Scholar] [CrossRef]
- Giancaspro, A.; Giove, S.L.; Zacheo, S.A.; Blanco, A.; Gadaleta, A. Genetic variation for protein content and yield-related traits in a durum population derived from an inter-specific cross between hexaploid and tetraploid wheat cultivars. Front. Plant Sci. 2019, 10, 1509. [Google Scholar] [CrossRef] [PubMed]
- Schierenbeck, M.; Alqudah, A.M.; Ulrike Lohwasser, U.; Tarawneh, R.A.; Simón, M.R.; Börner, A. Genetic dissection of grain architecture related traits in a winter wheat population. BMC Plant Biol. 2021, 21, 417. [Google Scholar] [CrossRef]
- Mills, E.N.C.; Johnson, P.E.; Alexeev, Y. Food Antigens. In Food Allergy: Expert Consult Basic; James, J.M., Burks, B., Eigenmann, P., Eds.; Elsevier: Edinburgh, London, New York, Oxford, Philadelphia, St Louis, Sydney, Toronto, 2012; pp. 15–32. [Google Scholar] [CrossRef]
- Wang, Y.; Hou, J.; Liu, H.; Li, T.; Wang, K.; Hao, C.; Liu, H.; Zhang, X. TaBT1, affecting starch synthesis and thousand kernel weight, underwent strong selection during wheat improvement. J. Exp. Bot. 2019, 70, 1497–1511. [Google Scholar] [CrossRef] [PubMed]
- Gu, Y.; Han, S.; Chen, L.; Mu, J.; Duan, L.; Li, Y.; Yan, Y.; Li, X. Expression and regulation of genes involved in the reserve starch biosynthesis pathway in hexaploid wheat (Triticum aestivum L.). Crop J. 2021, 9, 440–455. [Google Scholar] [CrossRef]
- Malik, P.; Kumar, J.; Sharma, S.; Sharma, R.; Sharma, S. Multi-locus genome-wide association mapping for spike-related traits in bread wheat (Triticum aestivum L.). BMC Genomics 2021, 22, 597. [Google Scholar] [CrossRef] [PubMed]
- Hou, J.; Li, T.; Wang, Y.; Hao, C.; Liu, H.; Zhang, X. ADP-glucose pyrophosphorylase genes, associated with kernel weight, underwent selection during wheat domestication and breeding. Plant Biotechnol. J. 2017, 15, 1533–1543. [Google Scholar] [CrossRef]
- Geng, J.; Li, L.; Lv, Q.; Zhao, Y.; Liu, Y.; Zhang, L.; Li, X. TaGW2-6A allelic variation contributes to grain size possibly by regulating the expression of cytokinins and starch-related genes in wheat. Planta 2017, 246, 1153–1163. [Google Scholar] [CrossRef]
- Hajibarat, Z.; Saidi, A. Senescence-associated proteins and nitrogen remobilization in grain filling under drought stress condition. J. Genet. Engin. Biotechnol. 2022, 20, 101. [Google Scholar] [CrossRef]
- Uauy, C.; Distelfeld, A.; Fahima, T.; Blechl, A.; Dubkovsky, J.A. NAC gene regulating senescence improves grain protein, zinc, and iron content in wheat. Science 2006, 314, 1298–1301. [Google Scholar] [CrossRef]
- Andleeb, T.; Borrill, P. Wheat NAM genes regulate the majority of early monocarpic senescence transcriptional changes including nitrogen remobilisation genes. G3 Genes Genomes Genet. 2023, 13, jkac275. [Google Scholar] [CrossRef]
- Gao, Y.; An, K.; Guo, W.; Chen, Y.; Zhang, R.; Zhang, X.; Chang, S.; Rossi, V.; Jin, F.; Cao, X.; Xin, M.; Peng, H.; Hu, Z.; Guo, W.; Du, J.; Ni, Z.; Sun, Q.; Yao, Y. The endosperm-specific transcription factor TaNAC019 regulates glutenin and starch accumulation and its elite allele improves wheat grain quality. Plant Cell 2021, 33, 603–622. [Google Scholar] [CrossRef] [PubMed]
- Majeed, U.; Hou, J.; Hao, C.; Zhang, X. TaNAC020 homoeologous genes are associated with higher thousand kernel weight and kernel length in Chinese wheat. Front. Genet. 2022, 13, 956921. [Google Scholar] [CrossRef] [PubMed]
- Si, L.; Chen, J.; Huang, X.; Gong, H.; Luo, J.; Hou, Q.; Zhou, T.; Lu, T.; Zhu, J.; Shangguan, Y.; Chen, E.; Gong, C.; Zhao, Q.; Jing, Y.; Zhao, Y.; Li, Y.; Cui, L.; Fan, D.; Lu, Y.; Weng, Q.; Wang, Y.; Zhan, Q.; Liu, K.; Wei, X.; An, K.; An, G.; Han, B. OsSPL13 controls grain size in cultivated rice. Nat. Genet. 2016, 48, 447–456. [Google Scholar] [CrossRef] [PubMed]
- Chen, X.; Zhang, Z.; Liu, D.; Zhang, K.; Li, A.; Mao, L. SQUAMOSA promoter-binding protein-like transcription factors: star players for plant growth and development. J. Integr. Plant Biol. 2010, 52, 946–951. [Google Scholar] [CrossRef]
- Diaz-Mendoza, M.; Diaz, I.; Martinez, M. Insights on the proteases involved in barley and wheat grain germination. Int. J. Mol. Sci. 2019, 20, 2087. [Google Scholar] [CrossRef]
- Arif, M.A.R.; Börner, A. An SNP based GWAS analysis of seed longevity in wheat. Cereal Res. Comm. 2020, 48, 149–156. [Google Scholar] [CrossRef]
- Whan, A.; Dielen, A.-S.; Mieog, J.; Bowerman, A.F.; Robinson, H.M.; Byrne, K.; Colgrave, M.; Larkin, P.J.; Howitt, C.A.; Morell, M.K.; Ral, J.-P. Engineering α-amylase levels in wheat grain suggests a highly sophisticated level of carbohydrate regulation during development. J. Exp. Bot. 2014, 65, 5443–5457. [Google Scholar] [CrossRef] [PubMed]
- Guo, H.; Wang, S.; Xu, F.; Li, Y.; Ren, J.; Wang, X.; Niu, H.; Yin, J. The role of thioredoxin h in protein metabolism during wheat (Triticum aestivum L.) seed germination. Plant Physiol. Biochem 2013, 67, 137–143. [Google Scholar] [CrossRef]
- Bernier, F.O.; Berna, A. Germins and germin-like proteins: plant do-all proteins. But what do they do exactly? Plant Physiol. Biochem. 2001, 39, 545–554. [Google Scholar] [CrossRef]
- Ma, D.Y.; Yan, J.; He, Z.H.; Wu, L.; Xia, X.C. Characterization of a cell wall invertase gene TaCwi-A1 on common wheat chromosome 2A and development of functional markers. Mol. Breed. 2012, 29, 43–52. [Google Scholar] [CrossRef]
- Long, Y.; Wang, C.; Liu, C.; Li, H.; Pu, A.; Dong, Z.; Wei, X.; Wan, X. Molecular mechanisms controlling grain size and weight and their biotechnological breeding applications in maize and other cereal crops. J. Adv. Res. 2023, S2090-1232(23)00265-5. [Google Scholar] [CrossRef]
- Li, Y.B.; Fan, C.C.; Xing, Y.Z.; Jiang, Y.H.; Luo, L.J.; Sun, L.; Shao, D.; Xu, C.; Li, X.; Xiao, J.; He, Y.; Zhang, O. Natural variation in GS5 plays an important role in regulating grain size and yield in rice. Nat. Genet. 2011, 43, 1266–1269. [Google Scholar] [CrossRef]
- Ma, L.; Li, T.; Hao, C.; Wang, Y.; Chen, X.; Zhang, X. TaGS5-3A, a grain size gene selected during wheat improvement for larger kernel and yield. Plant Biotechnol. J. 2016, 14, 1269–1280. [Google Scholar] [CrossRef] [PubMed]
- Tillett, B.J.; Hale, C.O.; Martin, J.M.; Giroux, M.J. Genes impacting grain weight and number in wheat (Triticum aestivum L. ssp. aestivum). Plants 2022, 11, 1772. [Google Scholar] [CrossRef] [PubMed]
- Mossé, J.; Huet, J.C.; Baudet, J. The amino acid composition of wheat grain as a function of nitrogen content. J. Cereal Sci. 1985, 3, 115–130. [Google Scholar] [CrossRef]
- STATISTICA, version 14; StatSoft Inc.: Tulsa, OK, USA, 2020.
- Yu, J.; Buckler, E.S. Genetic association mapping and genome organization of maize. Curr. Opin. Biotechnol. 2006, 17, 155–160. [Google Scholar] [CrossRef]
- Zhu, C.; Yu, J. Nonmetric multidimensional scaling corrects for population structure in association mapping with different sample types. Genetics 2009, 182, 875–888. [Google Scholar] [CrossRef] [PubMed]
- Yang, X.; Yan, J.; Shah, T.; Warburton, M.L.; Li, Q.; Li, L.; Gao, Y.; Chai, Y.; Fu, Z.; Zhou, Y.; Xu, S.; Bai, G.; Meng, Y.; Zheng, Y.; Li, J. Genetic analysis and characterization of a new maize association mapping panel for quantitative trait loci dissection. Theor. Appl. Genet. 2010, 121, 417–431. [Google Scholar] [CrossRef]
- Turner, S. qqman: an R package for visualizing GWAS results using Q-Q and manhattan plots. J. Open Source Software 2018, 3, 731. [Google Scholar] [CrossRef]
- Alaux, M.; Rogers, G.; Letellier, T.; Flores, R.; Alfama, F.; Pommier, C.; Mohellibi, N.; Durand, S.; Kimmel, E.; Michotey, C.; et al. Linking the International Wheat Genome Sequencing Consortium bread wheat reference genome sequence to wheat genetic and phenomic data. Genome Biol. 2018, 19, 111. [Google Scholar] [CrossRef]
Figure 1.
Probability density and box-plots for (a, c) grain protein content (GPC) and (b, d) thousand kernel weight (TKW) across three growing seasons and based on best linear unbiased estimators (BLUEs) in a set of 179 Bulgarian bread wheat accessions.
Figure 1.
Probability density and box-plots for (a, c) grain protein content (GPC) and (b, d) thousand kernel weight (TKW) across three growing seasons and based on best linear unbiased estimators (BLUEs) in a set of 179 Bulgarian bread wheat accessions.
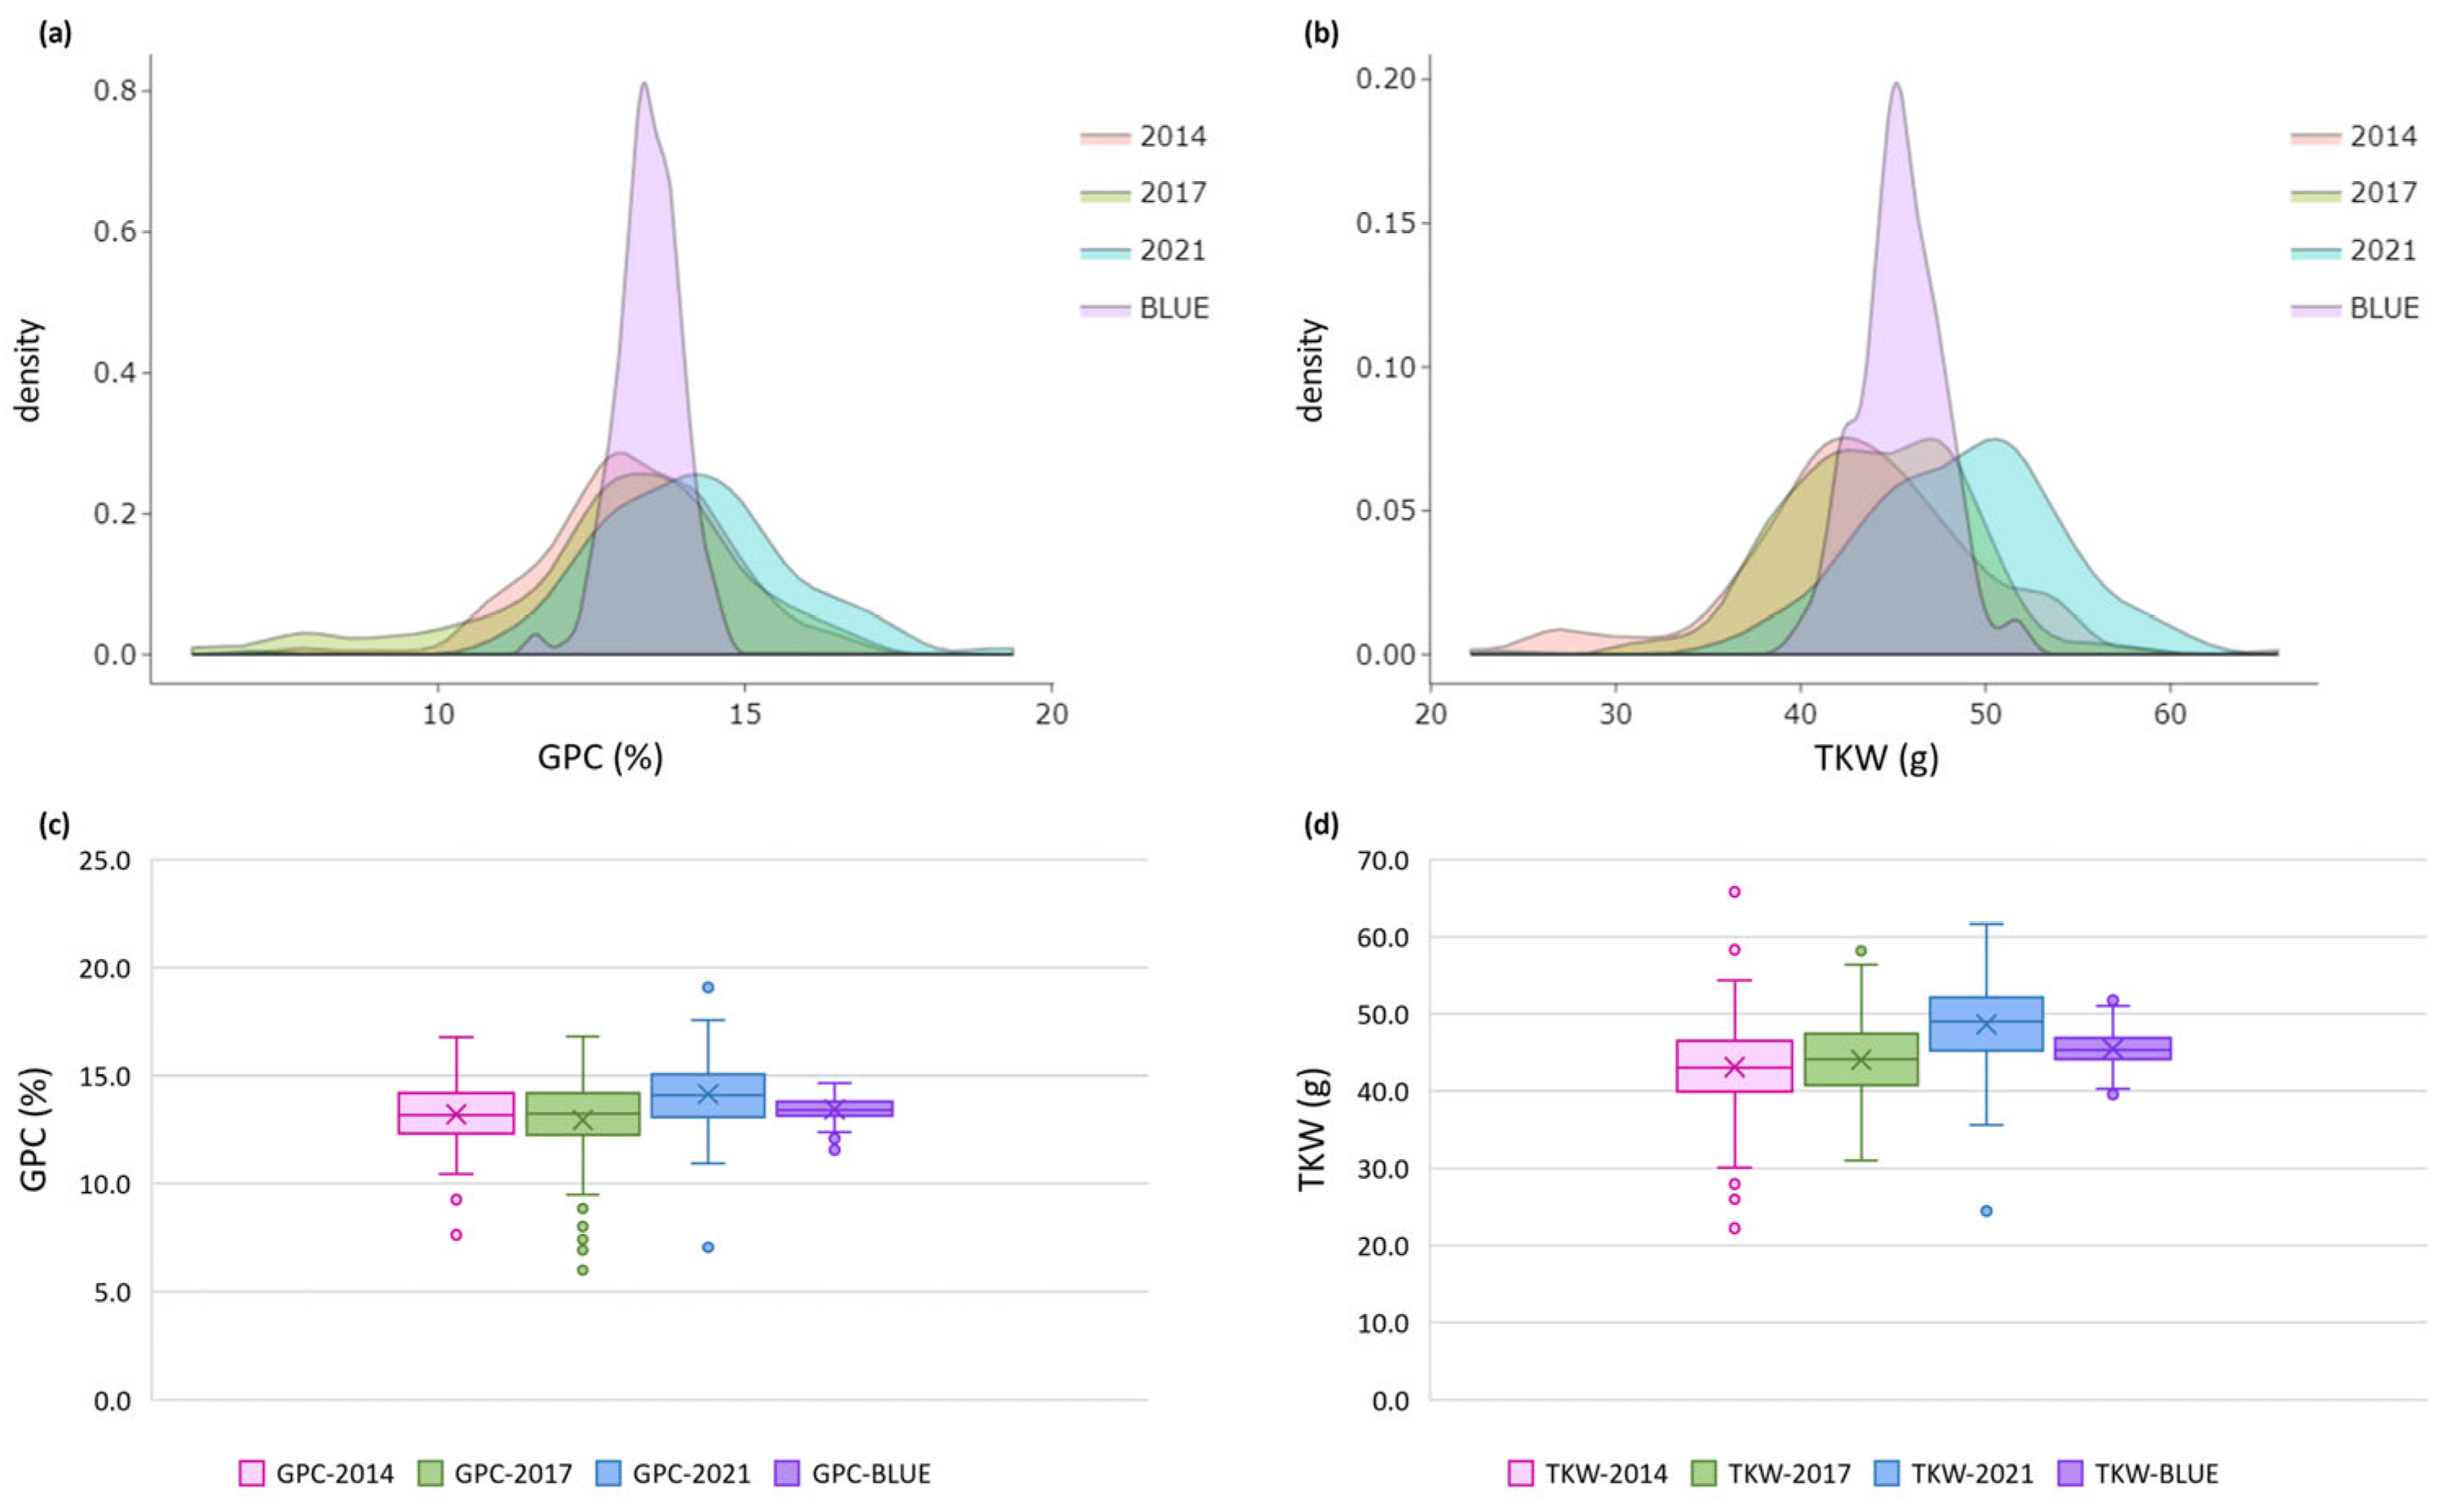
Figure 2.
Box-plots for (a) grain protein content (GPC, in %) and (b) thousand kernel weight (TKW, in g) (B) across three growing seasons and based on best linear unbiased estimators (BLUEs) in sub-populations (SPs) within a population of 179 Bulgarian bread wheat accessions.
Figure 2.
Box-plots for (a) grain protein content (GPC, in %) and (b) thousand kernel weight (TKW, in g) (B) across three growing seasons and based on best linear unbiased estimators (BLUEs) in sub-populations (SPs) within a population of 179 Bulgarian bread wheat accessions.
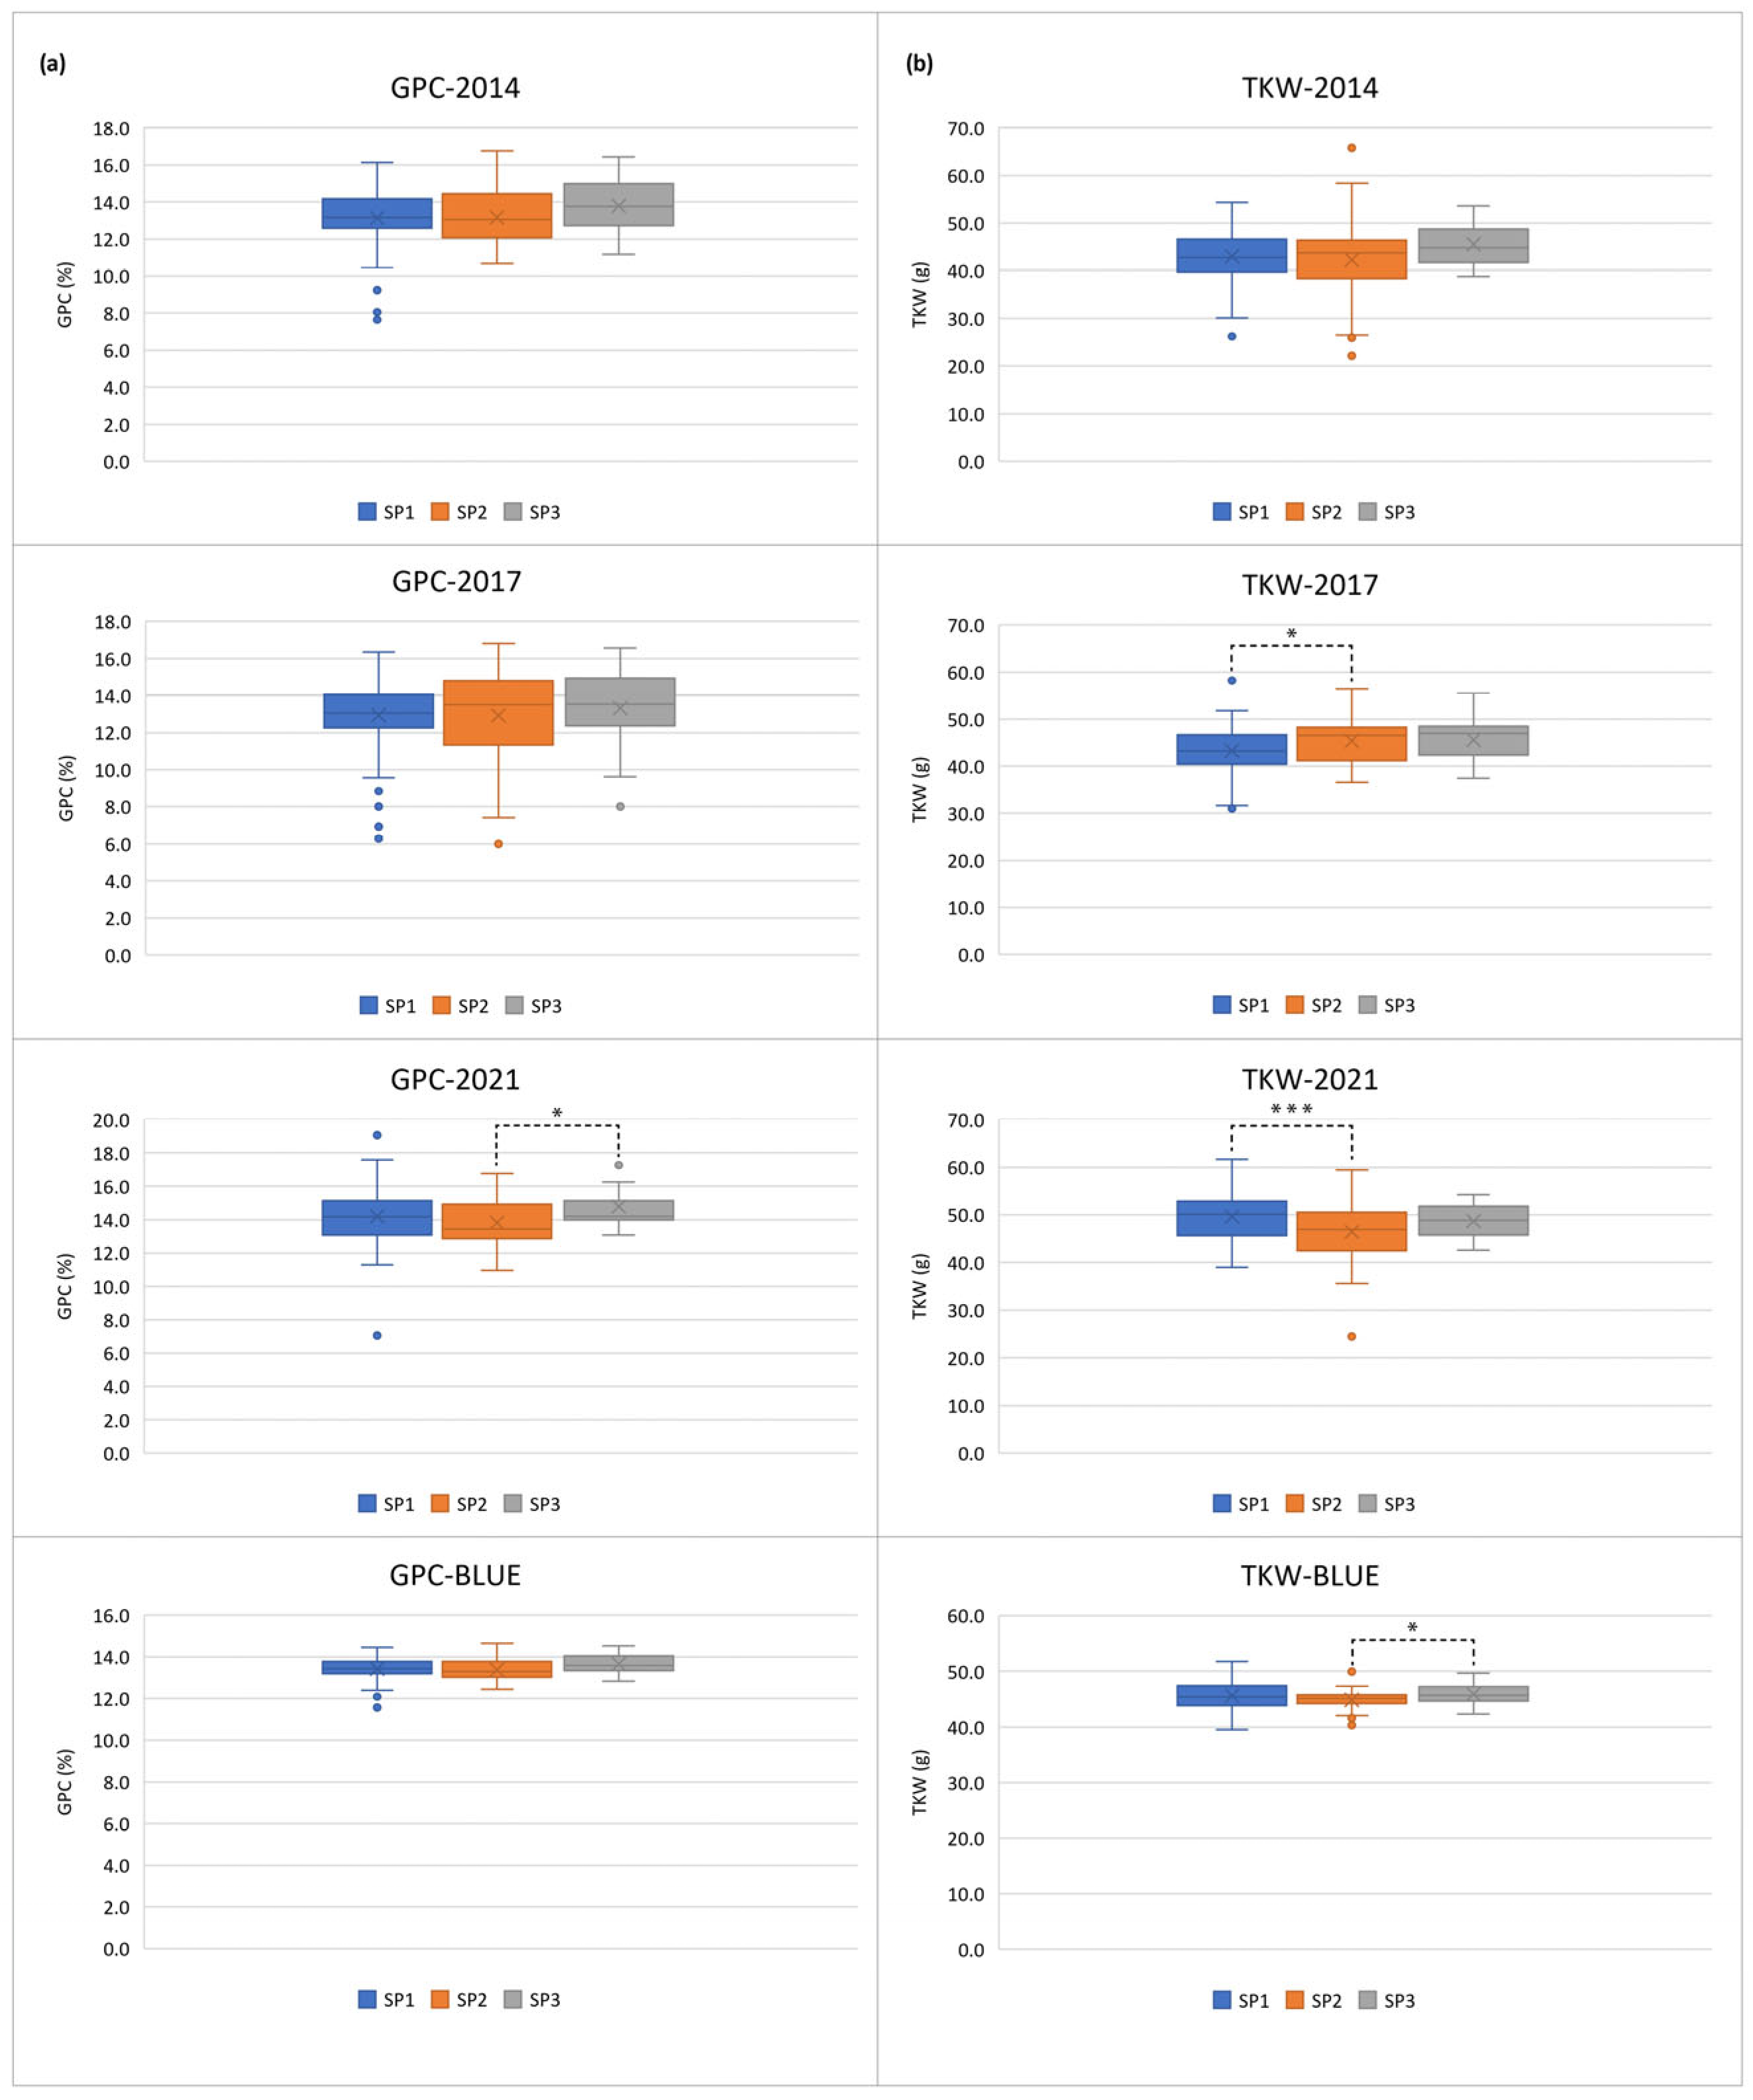
Figure 3.
Proportion of accessions (a-c) from the three sub-populations and (d) within the entire population of 179 Bulgarian bread wheat accessions with respect to grain protein content (GPC); classification is according to [2].
Figure 3.
Proportion of accessions (a-c) from the three sub-populations and (d) within the entire population of 179 Bulgarian bread wheat accessions with respect to grain protein content (GPC); classification is according to [2].
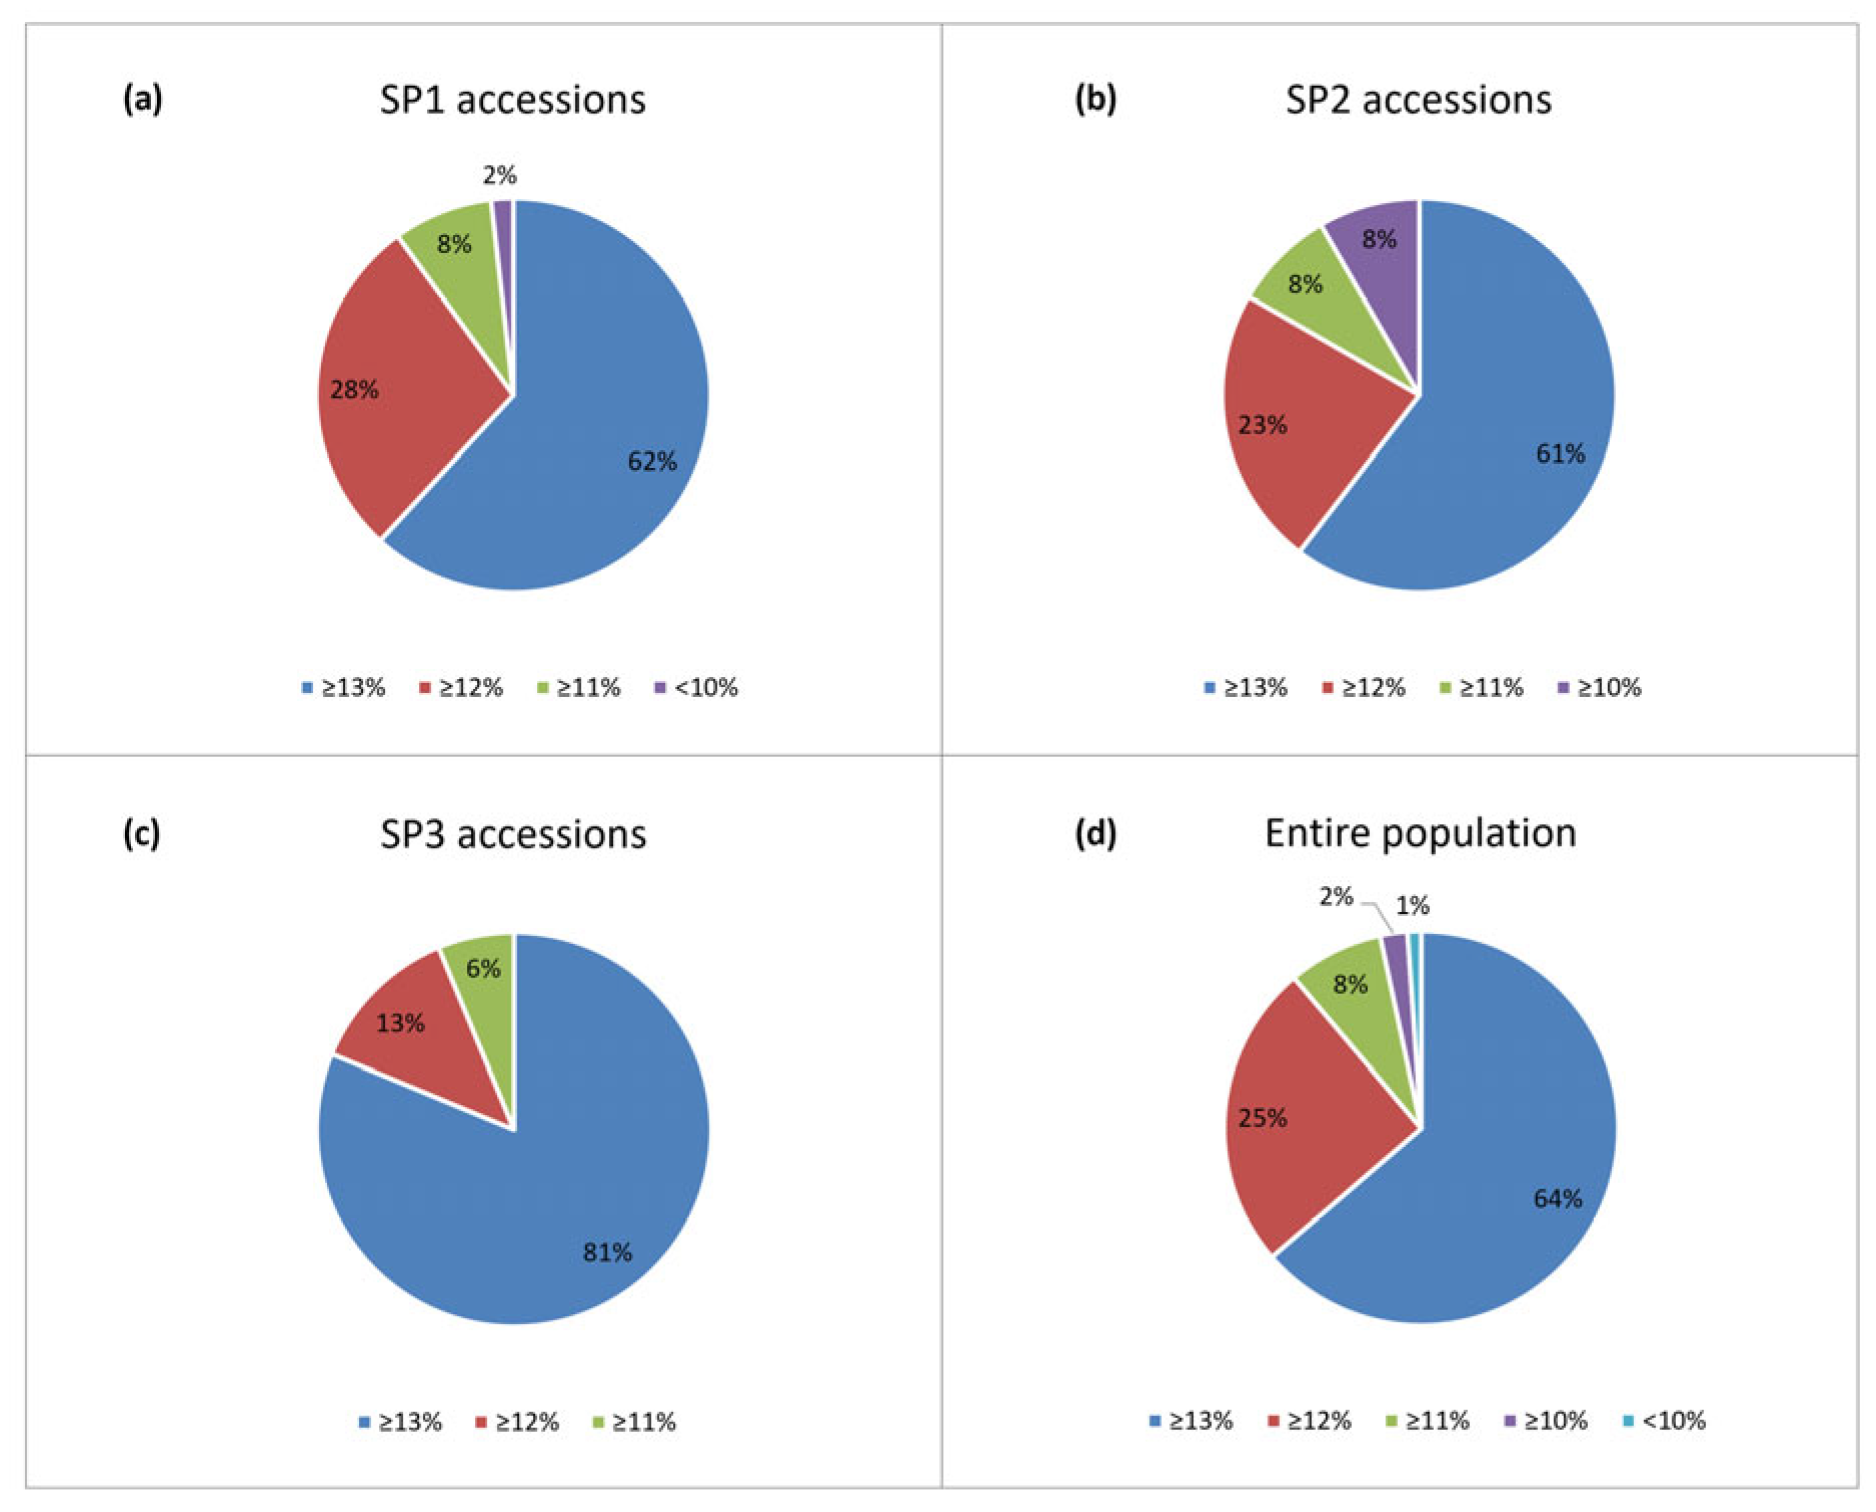
Figure 4.
(a) Manhattan and (b) Q-Q plots of the genome-wide association scan for grain protein content based on MLM (Q+K) model and mean BLUE values in a set of 179 Bulgarian bread wheat accessions calculated with the phenotypic data from three growing seasons. For the Manhattan plot, the red line depicts the threshold of –log10 (p) = 5.53. The significant quantitative trait nucleotides (QTNs) are above the red line; for the Q-Q plots, the red line corresponds to the expected values.
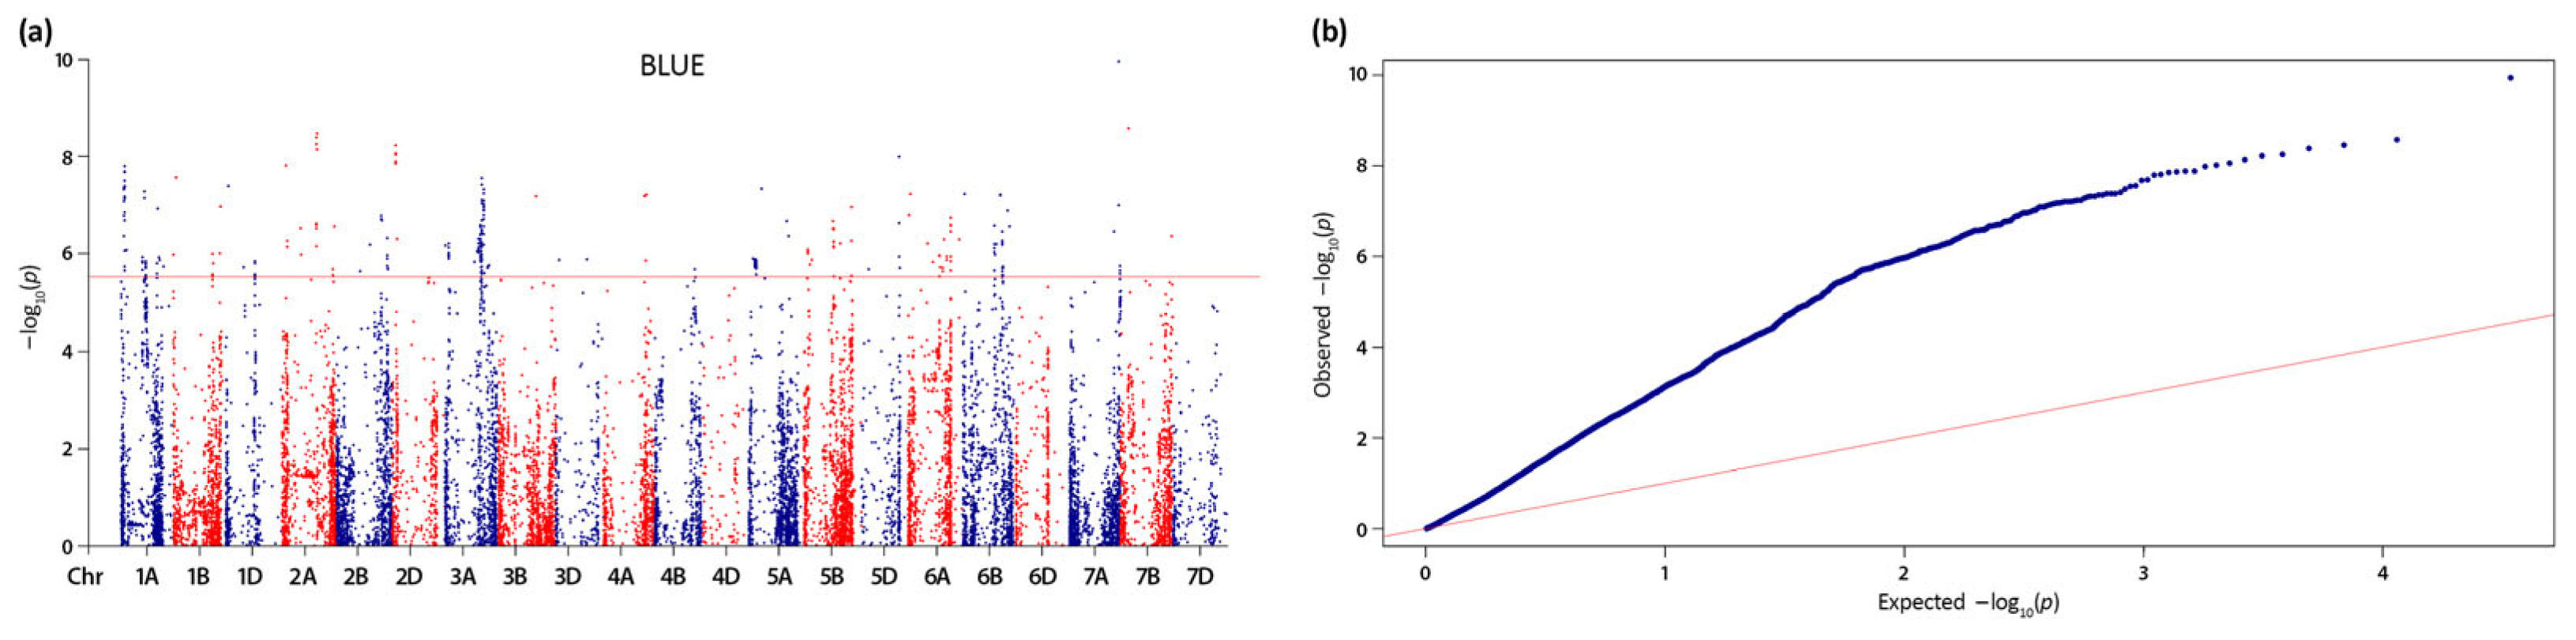
Figure 5.
Distribution of the detected trait-associated genomic loci along the wheat chromosomes. Red bars represent quantitative trait loci (QTL), associated with grain protein content (GPC); blue bars and circles represent QTL and stable quantitative trait nucleotides (QTN), associated with thousand kernel weight (TKW), respectively. On the right side of chromosomes, the flanking significant SNPs are depicted; the numbers to the left of the chromosomes indicate the position of the flanking markers (in Mbp).
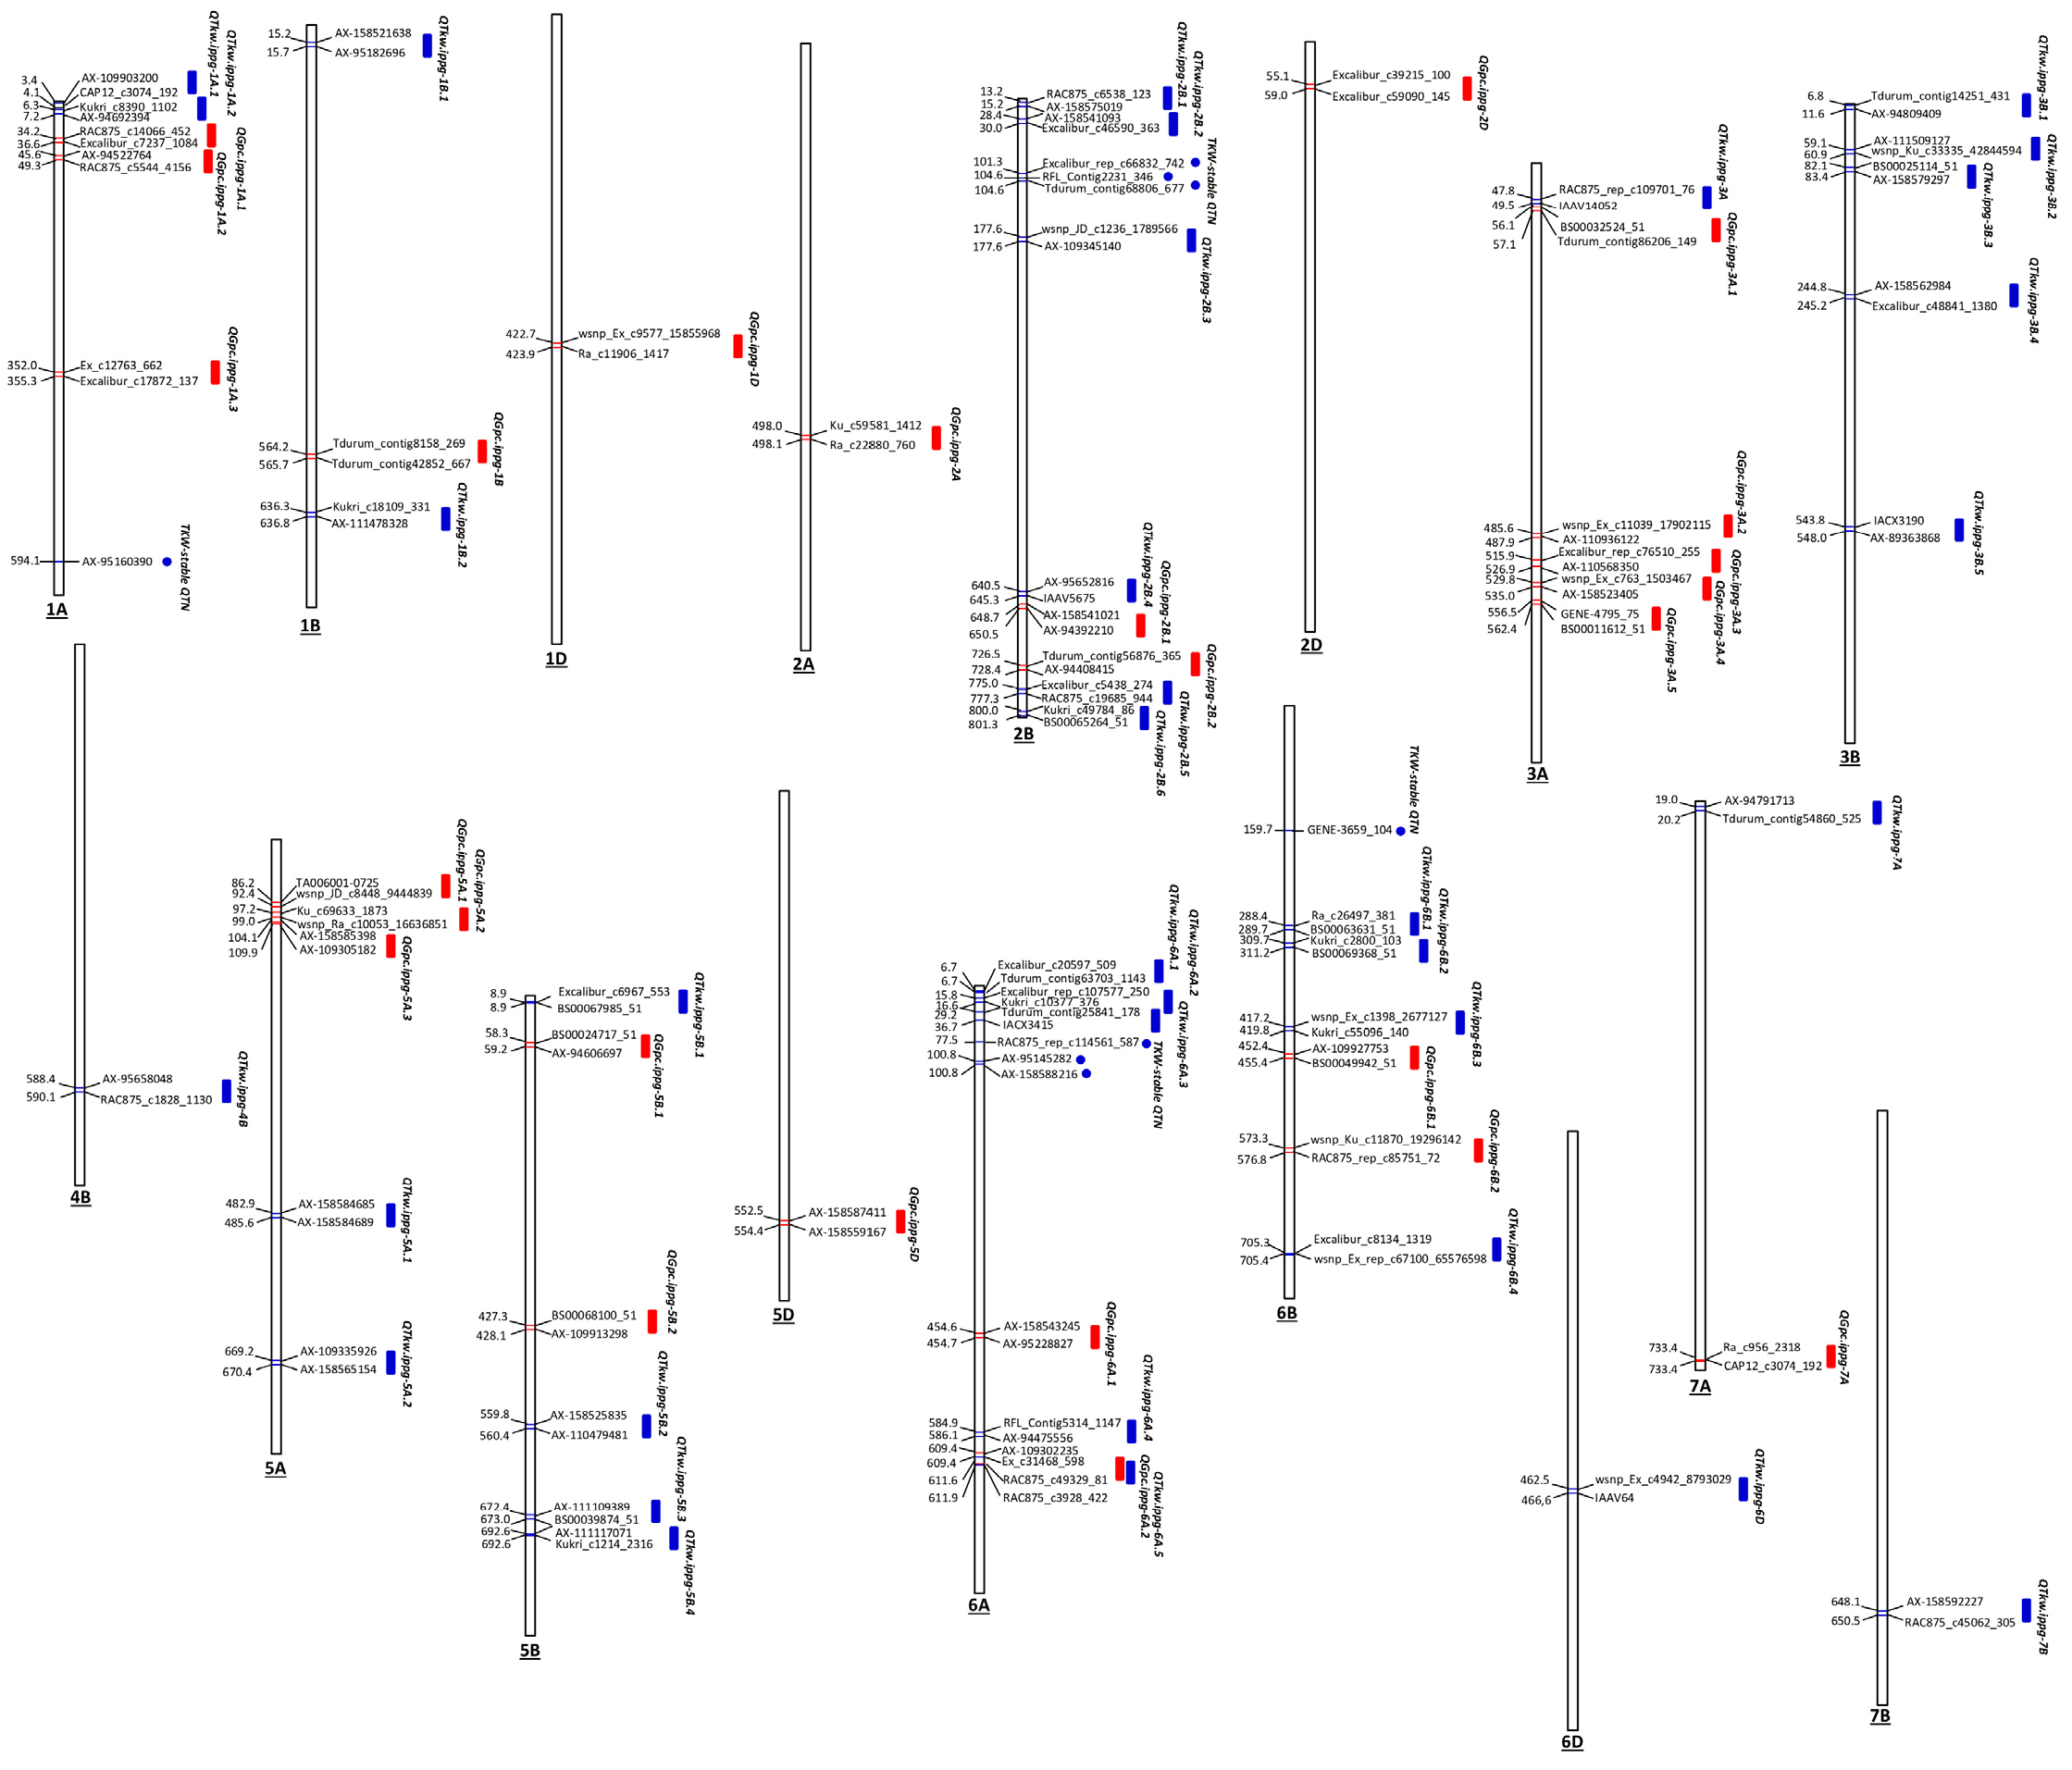
Figure 6.
(a) Manhattan and (b) Q-Q plots of the genome-wide association scan for thousand kernel weight based on MLM (Q+K) model and the phenotypic data from three growing seasons, along with the calculated BLUE values in a set of 179 Bulgarian bread wheat accessions. For the Manhattan plot, the red line depicts the threshold of –log10 (p) = 5.53. The significant quantitative trait nucleotides (QTNs) are above the red line; for the Q-Q plots, the red line corresponds to the expected values.
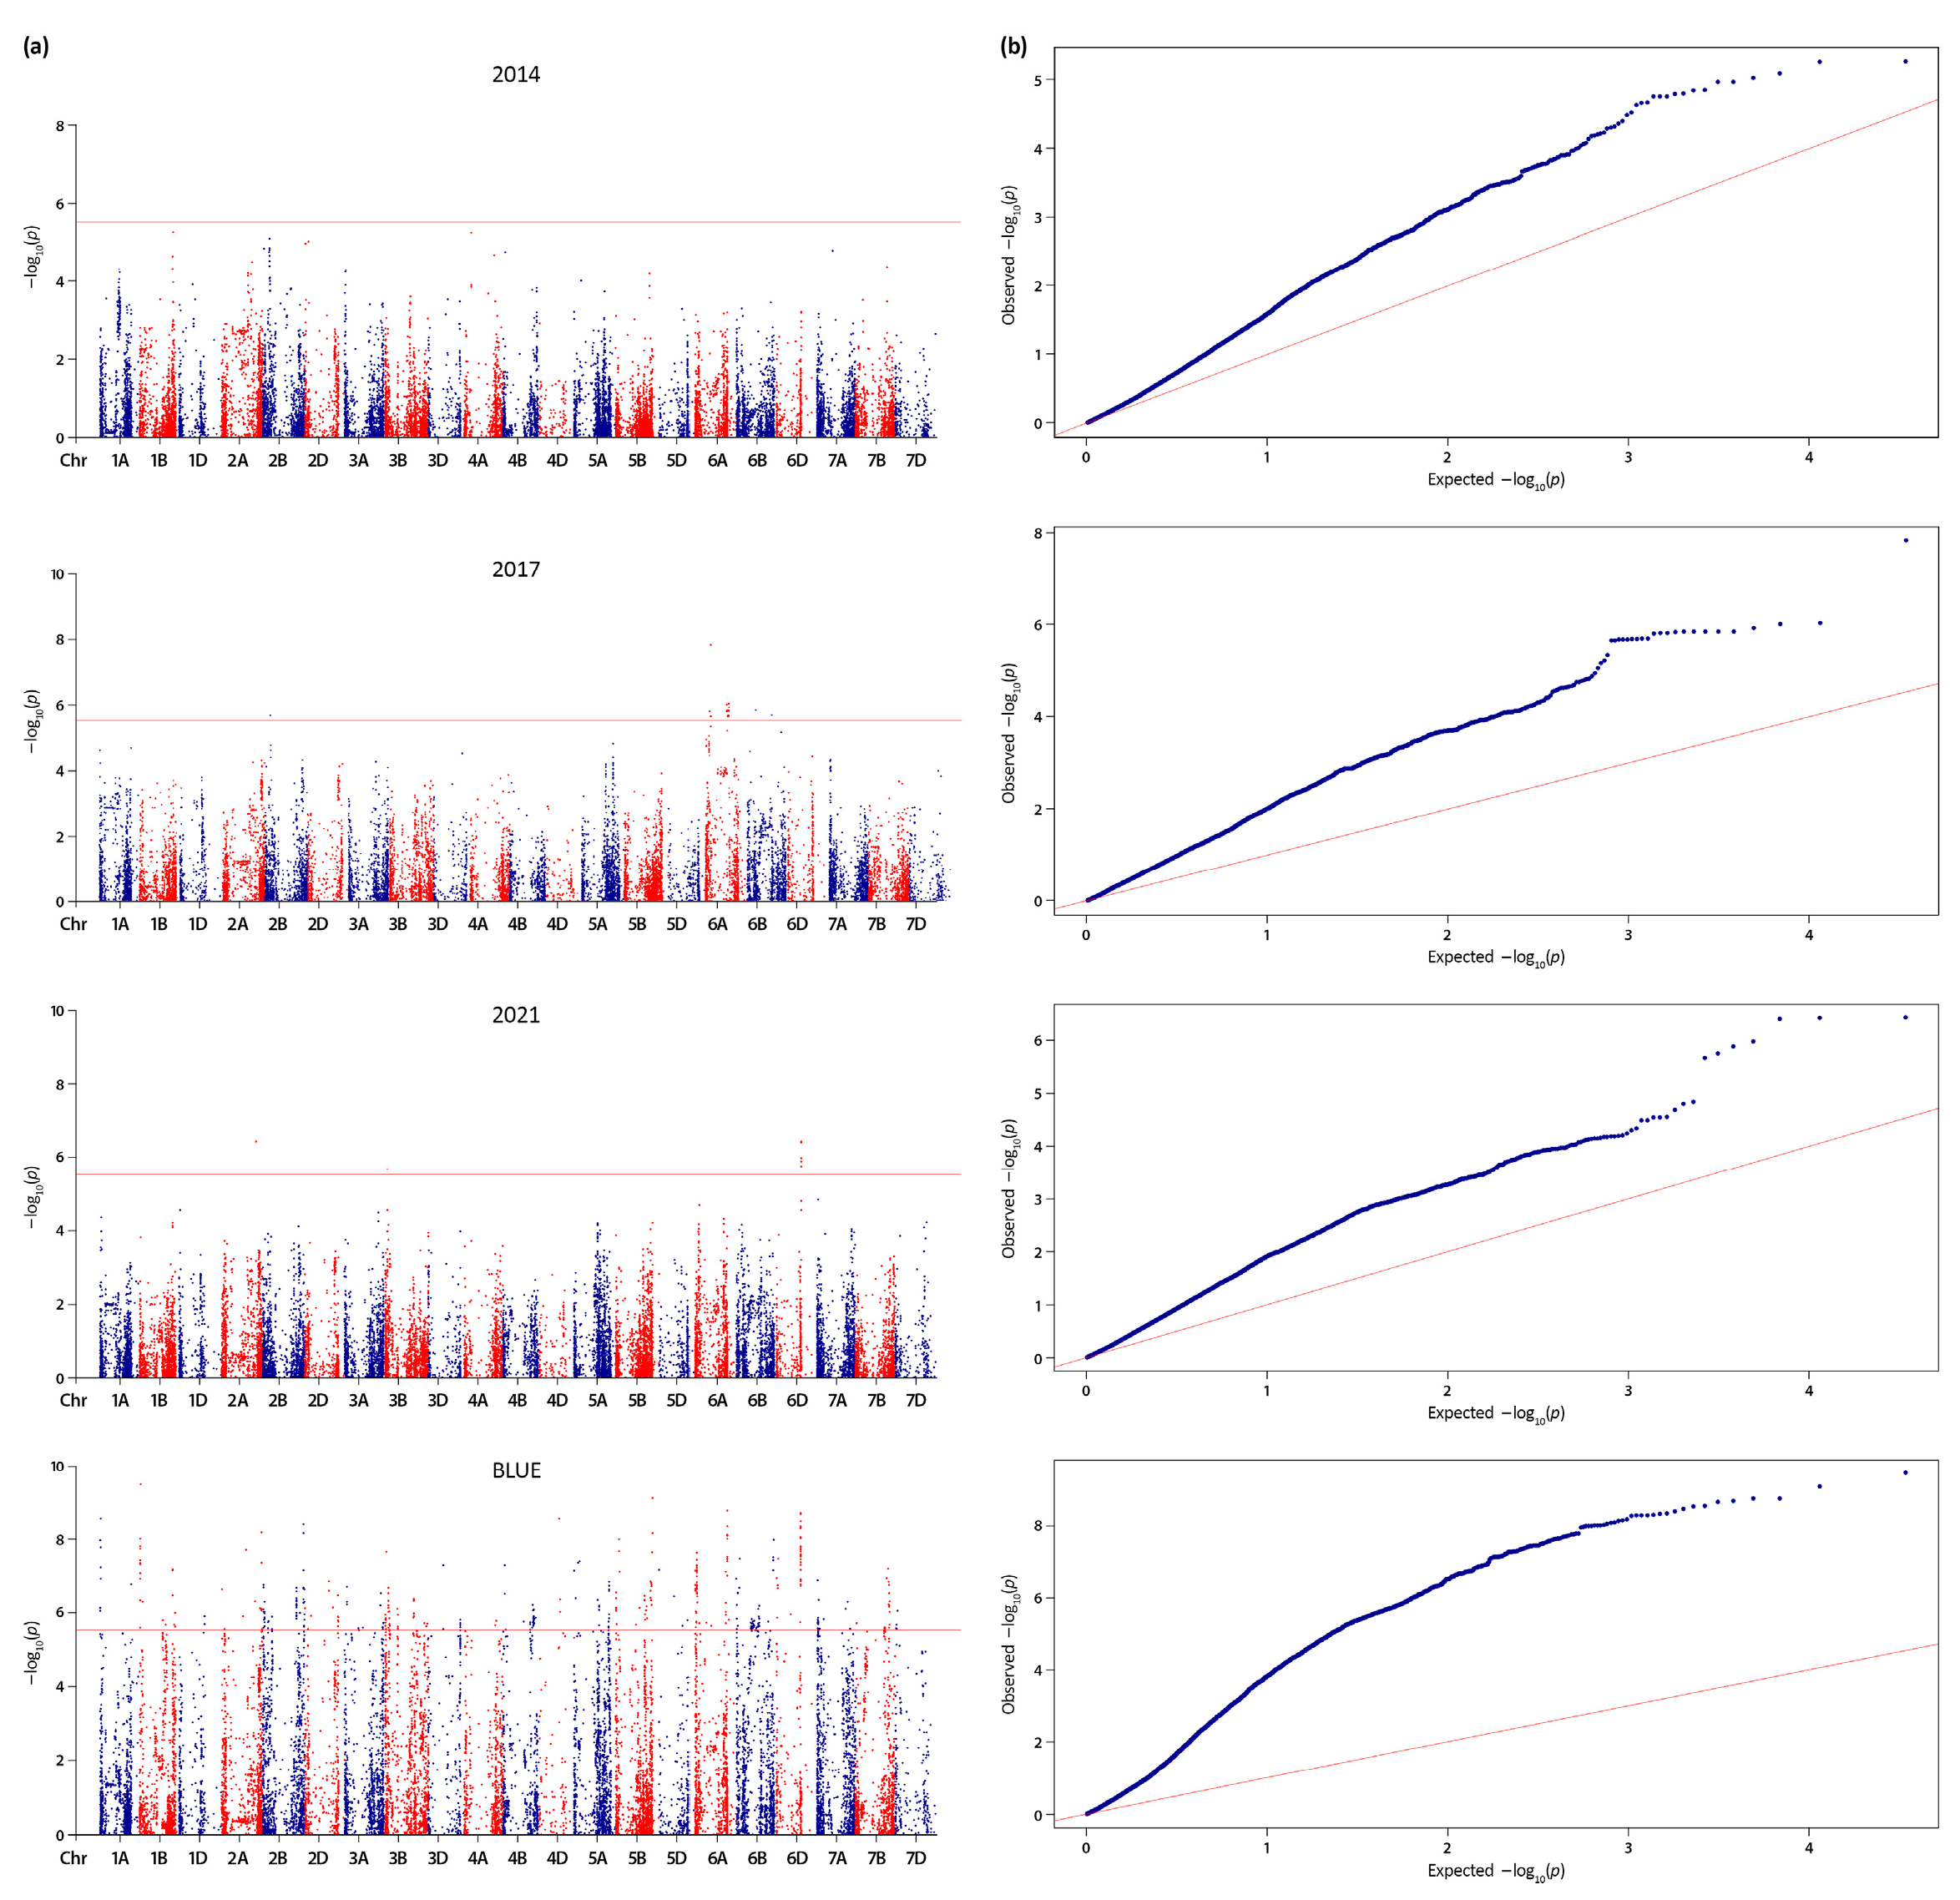

Table 1.
Descriptive statistics for grain protein content (GPC) and thousand kernel weight (TKW) in a set of 179 Bulgarian bread wheat accessions evaluated in three growing seasons (environments). Std. Dev., standard deviation; CV, coefficient of variation; h2, broad-sense heritability; BLUE, best linear unbiased estimator.
| Trait | Env. | Mean* | Std. Dev. | Min. | Max. | CV % | h2 |
|---|---|---|---|---|---|---|---|
| GPC (%) | Sofia 2014 | 13.2b | 1.46 | 7.6 | 16.8 | 11.09 | 0.64 |
| Sofia 2017 | 12.9b | 2.06 | 6.0 | 16.8 | 15.90 | 0.78 | |
| Sofia 2021 | 14.2a | 1.62 | 7.1 | 19.4 | 11.43 | 0.69 | |
| Average | 13.4 | 1.34 | 9.4 | 16.8 | 10.00 | 0.82 | |
| BLUE | 13.4 | 0.51 | 11.6 | 14.7 | 3.81 | ||
| TKW (g) | Sofia 2014 | 43.1b | 6.43 | 22.2 | 65.8 | 14.92 | 0.77 |
| Sofia 2017 | 44.0b | 4.72 | 31.0 | 58.2 | 10.73 | 0.64 | |
| Sofia 2021 | 48.6a | 5.42 | 24.4 | 61.6 | 11.14 | 0.70 | |
| Average | 45.2 | 4.28 | 33.7 | 55.0 | 9.46 | 0.81 | |
| BLUE | 45.4 | 2.25 | 39.6 | 51.8 | 4.94 |
*different letters denote significant difference between the mean values at p<0.001.
Table 2.
Factorial analysis of variance (ANOVA) for (a) grain protein content (GPC) and (b) thousand kernel weight (TKW) from three environments (growing seasons) for a set of 179 Bulgarian bread wheat accessions.
Table 2.
Factorial analysis of variance (ANOVA) for (a) grain protein content (GPC) and (b) thousand kernel weight (TKW) from three environments (growing seasons) for a set of 179 Bulgarian bread wheat accessions.
| (a) | ||||||
|---|---|---|---|---|---|---|
| Source of Variation | SS | df | MS | F | P-value | F crit |
| Genotype (G) | 962.685 | 178 | 5.408 | 3.010 | 0.0000 | 1.233 |
| Environment (E) | 145.483 | 2 | 72.741 | 40.485 | 0.0000 | 3.021 |
| G × E | 639.638 | 356 | 1.797 | 7.210 | 0.0000 | 3.320 |
| Total | 1747.805 | 536 | ||||
| (b) | ||||||
| Source of Variation | SS | df | MS | F | P-value | F crit |
| Genotype (G) | 9792.257 | 178 | 55.013 | 2.897 | 0.0000 | 1.233 |
| Environment (E) | 3128.650 | 2 | 1564.325 | 82.375 | 0.0000 | 3.021 |
| G × E | 6760.582 | 356 | 18.990 | 4.3643 | 0.0000 | 4.092 |
| Total | 19681.49 | 536 | ||||
Table 3.
Pearson correlation coefficients (r) for grain protein content (GPC) and thousand kernel weight (TKW) among growing seasons (harvests in 2014, 2017 and 2021) and with the mean best linear unbiased estimator (BLUE) values in a set of 179 Bulgarian bread wheat accessions.
Table 3.
Pearson correlation coefficients (r) for grain protein content (GPC) and thousand kernel weight (TKW) among growing seasons (harvests in 2014, 2017 and 2021) and with the mean best linear unbiased estimator (BLUE) values in a set of 179 Bulgarian bread wheat accessions.
| GPC-2017 | GPC-2021 | GPC-BLUE | TKW-2014 | TKW-2017 | TKW-2021 | TKW-BLUE | |
| GPC-2014 | 0.69*** | 0.50*** | 0.93*** | 0.00 | -0.09 | -0.08 | -0.05 |
| GPC-2017 | 0.10 | 0.61*** | 0.04 | 0.01 | -0.01 | -0.02 | |
| GPC-2021 | 0.47*** | 0.16* | -0.01 | 0.12 | 0.06 | ||
| GPC-BLUE | -0.01 | -0.10 | -0.07 | 0.02 | |||
| TKW-2014 | 0.39*** | 0.30*** | 0.60*** | ||||
| TKW-2017 | 0.53*** | 0.42*** | |||||
| TKW-2021 | 0.38*** |
*, *** significant at p<0.05 and 0.001, respectively.
Table 4.
Information about Quantitative Trait Loci (QTL) associated with grain protein content (GPC) detected by GWAS analysis in a population of 179 Bulgarian bread wheat accessions.
Table 4.
Information about Quantitative Trait Loci (QTL) associated with grain protein content (GPC) detected by GWAS analysis in a population of 179 Bulgarian bread wheat accessions.
| QTL | Position range (Mbp)a | SNPs | Peak SNP | Peak SNP -log10(p) | Allele | Total QTL effect | R2 range | High confidence genes | Co- located locib |
| QGpc.ippg-1A.1 | 32.17 – 38.57 | 4 | Excalibur_c7237_1084 | 7.36 | A/G | 16.10 | 17-19% | 81 | |
| QGpc.ippg-1A.2 | 43.58 – 51.29 | 15 | AX-94522764 | 7.79 | A/G | 49.26 | 14-20% | 59 | [28,57] |
| QGpc.ippg-1A.3 | 350.01 – 357.34 | 7 | wsnp_JD_c40990_29127031 | 5.85 | A/G | -18.06 | 13-14% | 55 | [37] |
| QGpc.ippg-1B | 562.66 – 567.17 | 3 | Tdurum_contig8158_269 | 6.00 | A/G | 17.22 | 13-15% | 37 | |
| QGpc.ippg-1D | 420.18 – 426.36 | 5 | wsnp_Ex_c9577_15855968 | 5.84 | T/C | -5.74 | 13-14% | 74 | |
| QGpc.ippg-2A | 496.54 – 499.61 | 5 | Ra_c22880_760 | 8.38 | A/G | 22.58 | 16-22% | 16 | |
| QGpc.ippg-2B.1 | 646.95 – 652.19 | 5 | Kukri_c4294_371 | 6.78 | A/G | -18.69 | 17% | 44 | [19] |
| QGpc.ippg-2B.2 | 724.85 – 730.10 | 3 | Tdurum_contig56876_365 | 5.96 | T/C | -5.81 | 14% | 10 | |
| QGpc.ippg-2D | 52.54 – 61.61 | 7 | D_contig28346_467 | 8.22 | T/C | -40.52 | 20-22% | 111 | |
| QGpc.ippg-3A.1 | 54.14 – 59.01 | 10 | BS00032524_51 | 6.21 | T/C | 25.95 | 14-15% | 88 | |
| QGpc.ippg-3A.2 | 483.60 – 489.86 | 6 | wsnp_Ex_c11039_17902115 | 6.31 | A/G | -13.00 | 15% | 46 | [56] |
| QGpc.ippg-3A.3 | 513.89 – 521.21 | 15 | BobWhite_c9468_453 | 6.58 | A/G | -7.27 | 14-16% | 62 | [27] |
| QGpc.ippg-3A.4 | 519.31 – 537.00 | 27 | AX-158523405 | 7.55 | T/C | -4.95 | 13-19% | 120 | |
| QGpc.ippg-3A.5 | 554.46 – 564.35 | 16 | BS00011612_51 | 7.33 | A/G | 12.44 | 15-18% | 69 | |
| QGpc.ippg-5A.1 | 84.17 – 94.44 | 10 | Tdurum_contig81753_70 | 5.87 | A/G | 12.05 | 14% | 46 | |
| QGpc.ippg-5A.2 | 95.23 – 101.02 | 3 | wsnp_Ex_rep_c110023_92574403 | 5.89 | T/C | 17.72 | 14% | 25 | |
| QGpc.ippg-5A.3 | 102.15 – 111.94 | 13 | wsnp_Ku_c328_679106 | 5.86 | A/G | 6.45 | 14% | 47 | |
| QGpc.ippg-5B.1 | 56.83 – 60.66 | 5 | BS00024717_51 | 6.08 | T/C | -5.90 | 15% | 29 | |
| QGpc.ippg-5B.2 | 425.77 – 429.63 | 5 | BS00068100_51 | 6.25 | A/G | -6.40 | 15% | 35 | [57] |
| QGpc.ippg-5D | 550.49 – 556.35 | 4 | Kukri_c15823_196 | 7.99 | T/C | -0.91 | 14-23% | 107 | [28] |
| QGpc.ippg-6A.1 | 453.14 – 456.16 | 3 | Tdurum_contig78006_158 | 5.96 | A/G | 5.28 | 13-14% | 32 | |
| QGpc.ippg-6A.2 | 607.88 – 613.01 | 8 | wsnp_Ex_c1153_2213588 | 6.74 | T/C | -12.62 | 14-17% | 136 | |
| QGpc.ippg-6B.1 | 450.41 – 457.45 | 4 | AX-158552532 | 6.57 | A/G | -12.03 | 14-16% | 33 | |
| QGpc.ippg-6B.2 | 571.32 – 578.81 | 8 | wsnp_Ku_c11870_19296142 | 6.45 | T/C | 23.87 | 13-16% | 57 | |
| QGpc.ippg-7A | 732.36 – 734.37 | 3 | AX-158589978 | 5.75 | T/C | 5.63 | 13-14% | 41 | |
| In total: | 1,460 | ||||||||
aQTL position range includes LD supported flanking intervals; bPreviously reported significant markers/QTL coinciding with (bold) or in close proximity to the QTL identified in the current study.
Table 5.
Information about (a) Quantitative Trait Loci (QTL) and (b) environmentally stable Quantitative Trait Nucleotides (QTNs) associated with thousand kernel weight (TKW) detected by GWAS analysis of a population of 179 Bulgarian bread wheat varieties.
Table 5.
Information about (a) Quantitative Trait Loci (QTL) and (b) environmentally stable Quantitative Trait Nucleotides (QTNs) associated with thousand kernel weight (TKW) detected by GWAS analysis of a population of 179 Bulgarian bread wheat varieties.
| (a) | |||||||||
|---|---|---|---|---|---|---|---|---|---|
| QTL | Position range (Mbp)a | SNPs | Peak SNP | Peak SNP -log10 (p) |
Allele | Total QTL effect | R2 range | High confidence genes | Co- located locib |
| QTkw.ippg-1A.1 | 1.38 - 6.06 | 3 | CAP12_c3074_192 | 7.96 | A/G | 1.31 | 14-19% | 70 | |
| QTkw.ippg-1A.2 | 4.32 – 9.19 | 4 | AX-94692394 | 8.54 | T/C | 3.11 | 11-21% | 91 | [53] |
| QTkw.ippg-1B.1 | 13.74 – 17.25 | 11 | BS00108057_51 | 8.01 | T/C | -1.76 | 14-22% | 74 | |
| QTkw.ippg-1B.2 | 634.73 – 638.30 | 4 | BS00039135_51 | 7.17 | A/C | -3.55 | 9-17% | 47 | [21] |
| QTkw.ippg-2B.1 | 11.47 – 16.91 | 4 | BobWhite_c26803_89 | 6.75 | T/C | 0.17 | 14-16% | 99 | [53] |
| QTkw.ippg-2B.2 | 26.67 – 31.69 | 9 | Excalibur_c46590_363 | 6.29 | T/C | -2.00 | 13-15% | 104 | |
| QTkw.ippg-2B.3 | 175.95 – 180.40 | 3 | wsnp_Ex_c51461_55394646 | 5.88 | A/G | -4.70 | 12-13% | 23 | |
| QTkw.ippg-2B.4 | 638.79 – 647.01 | 16 | AX-95652816 | 6.67 | A/G | -5.76 | 13-16% | 73 | |
| QTkw.ippg-2B.5 | 773.26 – 779.03 | 7 | Excalibur_c5438_274 | 8.40 | T/C | 2.39 | 15-21% | 76 | |
| QTkw.ippg-2B.6 | 798.33 – 802.95 | 4 | BS00065264_51 | 6.62 | T/G | -3.38 | 13-16% | 45 | |
| QTkw.ippg-3A | 45.83 – 51.48 | 3 | BS00011111_51 | 6.70 | T/G | -1.57 | 14-16% | 61 | [53] |
| QTkw.ippg-3B.1 | 4. 54 -13.40 | 6 | AX-94783816 | 5.93 | A/T | 0.71 | 13-16% | 186 | [59] |
| QTkw.ippg-3B.2 | 58.06 – 62.67 | 5 | RAC875_c34484_67 | 6.67 | A/G | -4.47 | 13-16% | 49 | [36] |
| QTkw.ippg-3B.3 | 80.27 – 85.23 | 4 | wsnp_Ex_c1097_2105209 | 6.03 | A/G | 2.88 | 13-14% | 41 | |
| QTkw.ippg-3B.4 | 242.98– 246.79 | 4 | CAP8_rep_c4453_136 | 5.94 | T/C | 0.04 | 13-14% | 28 | [58] |
| QTkw.ippg-3B.5 | 542.04 – 549.85 | 4 | BS00062734_51 | 6.38 | A/G | -0.10 | 13-15% | 69 | |
| QTkw.ippg-4B | 586.73 – 592.55 | 6 | Ex_c25467_851 | 6.07 | T/C | 0.01 | 13-14% | 39 | [63] |
| QTkw.ippg-5A.1 | 480.95 – 487.60 | 4 | AX-158584685 | 6.18 | A/G | -0.09 | 13-14% | 69 | [30] |
| QTkw.ippg-5A.2 | 667.20 – 672.45 | 6 | AX-109335926 | 6.83 | T/G | 3.89 | 13-16% | 57 | [58,63] |
| QTkw.ippg-5B.1 | 7.41 – 10.45 | 4 | BS00067985_51 | 6.12 | T/C | -3.91 | 14% | 45 | |
| QTkw.ippg-5B.2 | 558.27 – 561.94 | 5 | AX-110484654 | 6.45 | A/G | 4.57 | 14-15% | 28 | |
| QTkw.ippg-5B.3 | 670.94 – 674.45 | 3 | CAP12_c2231_114 | 6.84 | A/C | 5.33 | 8-16% | 42 | [63] |
| QTkw.ippg-5B.4 | 691.13 – 694.14 | 3 | Kukri_c1214_2316 | 6.75 | T/C | -5.44 | 14-16% | 37 | [53,63] |
| QTkw.ippg-6A.1 | 5.23 – 8.23 | 4 | Tdurum_contig63703_1143 | 6.75 | T/C | 6.49 | 15-16% | 56 | [60] |
| QTkw.ippg-6A.2 | 14.27 – 18.07 | 4 | RAC875_c2253_2011 | 5.99 | T/C | 0.61 | 11-14% | 91 | [59] |
| QTkw.ippg-6A.3 | 27.71 – 38.19 | 38 | BS00023140_51 | 7.62 | T/C | -16.71 | 14-18% | 165 | |
| QTkw.ippg-6A.4 | 583.44 – 587.60 | 5 | AX-94475556 | 7.11 | T/C | 4.28 | 13-17% | 51 | [53,58] |
| QTkw.ippg-6A.5 | 607.93 – 613.36 | 11 | Kukri_c11902_580 | 8.76 | T/C | 1.50 | 17-22% | 163 | [53,61,63] |
| QTkw.ippg-6B.1 | 286.42 – 291.69 | 4 | Kukri_c26279_503 | 5.71 | T/C | -0.04 | 13% | 23 | |
| QTkw.ippg-6B.2 | 307.75 – 313.20 | 4 | RAC875_c41604_1001 | 5.75 | T/C | -0.11 | 13% | 10 | |
| QTkw.ippg-6B.3 | 415.23 – 421.77 | 3 | Kukri_c55096_140 | 5.69 | A/C | -1.54 | 13% | 19 | |
| QTkw.ippg-6B.4 | 703.28 – 707.38 | 3 | wsnp_Ex_rep_c67100_65576598 | 7.50 | A/G | -1.69 | 17-18% | 112 | [53] |
| QTkw.ippg-6D | 459.54 – 469.55 | 40 | AX-158600736 | 8.70 | T/C | 26.55 | 16-22% | 211 | |
| QTkw.ippg-7A | 18.01 – 21.17 | 9 | AX-94791713 | 5.80 | T/C | 10.51 | 13% | 70 | [53] |
| QTkw.ippg-7B | 646.65 – 652.04 | 8 | AX-158592437 | 6.75 | A/G | 0.15 | 13% | 53 | [62] |
| In total: | 2,477 | ||||||||
| (b) | |||||||||
| QTL/Chr. | Position (Mbp) | Env. | SNP | -log10 (p) | Allele | Effect | R2 | High confidence genes |
Co- located locib |
| Stable QTNs within a LD blockc | |||||||||
| QTkw.ippg-1A.2 | 6.32 | 2017, BLUE | Kukri_c8390_1102 | 6.92 | A/G | -5.01 | 11% | ||
| QTkw.ippg-1B.2 | 636.75 | 2021, BLUE | BS00039135_51 | 7.17 | A/C | -2.00 | 17% | [21] | |
| QTkw.ippg-1B.2 | 636.75 | 2021, BLUE | BobWhite_c2844_569 | 7.15 | A/C | -2.00 | 17% | [21] | |
| QTkw.ippg-1B.2 | 636.80 | 2021, BLUE | AX-111478328 | 7.14 | A/G | -1.99 | 17% | [21] | |
| QTkw.ippg-6A.2 | 16.57 | 2017, BLUE | RAC875_c2253_2011 | 5.99 | T/C | -1.49 | 14% | ||
| QTkw.ippg-6A.2 | 16.57 | 2017, BLUE | Kukri_c10377_376 | 5.74 | A/G | -1.45 | 13% | ||
| Stable QTNs not in a LD block | |||||||||
| 1A | 594.10 | 2017, BLUE | AX-95160390 | 6.77 | C/G | 1.56 | 17% | 21 | |
| 2B | 101.30 | 2017, BLUE | Excalibur_rep_c66832_742 | 5.68 | T/G | 4.10 | 13% | 27 | [53] |
| 2B | 104.57 | 2017, BLUE | RFL_Contig2231_346* | 5.57 | A/G | 1.94 | 13% | 38 | [53] |
| 2B | 104.58 | 2017, BLUE | Tdurum_contig68806_677* | 5.74 | T/C | -1.95 | 13% | [53] | |
| 6A | 77.53 | 2017, 2021, BLUE | RAC875_rep_c114561_587 | 5.81 | A/G | 4.24 | 14% | 29 | [58] |
| 6A | 100.77 | 2017, BLUE | AX-95145282** | 7.84 | A/G | 4.78 | 20% | 49 | |
| 6A | 100.80 | 2017, BLUE | AX-158588216** | 5.65 | A/G | 4.09 | 13% | ||
| 6B | 159.70 | 2017, BLUE | GENE-3659_104 | 5.84 | T/C | -4.24 | 14% | 51 | |
| In total: | 215 | ||||||||
aQTL position range includes LD supported flanking intervals; bPreviously reported significant markers/QTL coinciding with (bold) or in close proximity to the QTL/QTNs identified in the current study; cFor stable QTNs, detected with BLUEs and at least one other environment, the higher -log10 (p) values, and the corresponding effects and R2 values are given; the presented number of high confidence genes is within the LD supported intervals of the markers; *, **Marked SNPs are adjacent.
Table 6.
Selected candidate genes residing within the QTL intervals and associated with Grain Protein Content (GPC).
Table 6.
Selected candidate genes residing within the QTL intervals and associated with Grain Protein Content (GPC).
| QTL | Gene ID | Anotation function |
|---|---|---|
| QGpc.ippg-1A.1 | TraesCS1A01G052600 | Germin-like protein |
| TraesCS1A01G052700 | Germin-like protein | |
| TraesCS1A01G052900 | Germin-like protein | |
| TraesCS1A01G053000 | Germin-like protein | |
| TraesCS1A01G053100 | Germin-like protein | |
| TraesCS1A01G053700 | Ubiquitin activating enzyme E1 | |
| QGpc.ippg-1A.2 | TraesCS1A01G063600 | Ubiquitin-conjugating enzyme E2 |
| TraesCS1A01G066100 | 11S globulin seed storage protein | |
| TraesCS1A01G069000 | bZIP transcription factor family protein | |
| QGpc.ippg-1A.3 | TraesCS1A01G196300 | 26S proteasome regulatory subunit family protein |
| TraesCS1A01G197400 | WRKY family transcription factor | |
| TraesCS1A01G197600 | Peptide transporter | |
| TraesCS1A01G197700 | Peptide transporter | |
| QGpc.ippg-1B | TraesCS1B01G338500 | Cysteine protease family protein |
| TraesCS1B01G338800 | Thioredoxin | |
| TraesCS1B01G339000 | Thioredoxin | |
| QGpc.ippg-1D | TraesCS1D01G330800 | E3 ubiquitin-protein ligase MARCH6 |
| TraesCS1D01G331800 | Bifunctional inhibitor/lipid-transfer protein/seed storage 2S albumin superfamily | |
| TraesCS1D01G331900 | Bifunctional inhibitor/lipid-transfer protein/seed storage 2S albumin superfamily | |
| TraesCS1D01G332200 | Basic-leucine zipper (BZIP) transcription factor family | |
| TraesCS1D01G332500 | Thioredoxin | |
| TraesCS1D01G333100 | E3 ubiquitin-protein ligase | |
| QGpc.ippg-2A | TraesCS2A01G289800 | Alpha-amylase |
| TraesCS2A01G289800 | Alpha-amylase | |
| QGpc.ippg-2B.1 | TraesCS2B01G453000 | Ubiquitin-specific protease family C19-related protein |
| TraesCS2B01G453100 | Ubiquitin-specific protease family C19 protein | |
| TraesCS2B01G454300 | WRKY transcription factor | |
| QGpc.ippg-2B.2 | TraesCS2B01G533300 | Sucrose transporter |
| QGpc.ippg-2D | TraesCS2D01G100500 | Thioredoxin, putative |
| TraesCS2D01G100600 | NAC domain protein | |
| TraesCS2D01G100900 | NAC domain protein, | |
| TraesCS2D01G100700 | NAC domain protein, | |
| TraesCS2D01G100800 | NAC domain protein, | |
| TraesCS2D01G101300 | NAC domain protein | |
| TraesCS2D01G101400 | NAC domain protein | |
| TraesCS2D01G102300 | Cysteine protease | |
| TraesCS2D01G104400 | E3 ubiquitin-protein ligase SHPRH | |
| TraesCS2D01G104500 | WRKY transcription factor | |
| TraesCS2D01G104600 | WRKY transcription factor | |
| TraesCS2D01G104700 | WRKY transcription factor | |
| TraesCS2D01G105400 | Basic-leucine zipper domain | |
| TraesCS2D01G106200 | Cysteine proteinase | |
| TraesCS2D01G109300 | Germin-like protein 1 | |
| QGpc.ippg-3A.1 | TraesCS3A01G085500 | bZIP transcription factor, putative (DUF1664) |
| TraesCS3A01G090700 | E3 ubiquitin-protein ligase SINA-like 10 | |
| QGpc.ippg-3A.3 | TraesCS3A01G285600 | Proteasome subunit alpha type |
| TraesCS3A01G287800 | Eukaryotic aspartyl protease family protein | |
| TraesCS3A01G289000 | Senescence-associated family protein (DUF581) | |
| TraesCS3A01G289700 | WRKY transcription factor | |
| TraesCS3A01G289800 | PROTEIN TARGETING TO STARCH (PTST) | |
| QGpc.ippg-3A.4 | TraesCS3A01G293700 | BZIP transcription factor family protein, putative |
| TraesCS3A01G297600 | Subtilisin-like protease | |
| TraesCS3A01G299400 | NAM-like protein | |
| QGpc.ippg-3A.5 | TraesCS3A01G318700 | 26S proteasome regulatory subunit S2 1B |
| TraesCS3A01G319300 | Cysteine protease | |
| TraesCS3A01G319800 | Eukaryotic aspartyl protease family protein | |
| QGpc.ippg-5A.1 | TraesCS5A01G073000 | Amino acid transporter, putative |
| TraesCS5A01G076000 | Cysteine protease | |
| QGpc.ippg-5A.3 | TraesCS5A01G081500 | Amino acid transporter family protein, putative |
| QGpc.ippg-5B.1 | TraesCS5B01G054200 | NAC domain-containing protein |
| TraesCS5B01G054600 | E3 ubiquitin-protein ligase | |
| TraesCS5B01G054700 | Serine-protease HtrA-like | |
| QGpc.ippg-5B.2 | TraesCS5B01G245300 | Peptide transporter |
| QGpc.ippg-5D | TraesCS5D01G543600 | 26S proteasome non-ATPase regulatory subunit |
| QGpc.ippg-6A.1 | TraesCS6A01G242000 | WRKY transcription factor |
| TraesCS6A01G243100 | bZIP transcription factor (DUF630 and DUF632) | |
| QGpc.ippg-6A.2 | TraesCS6A01G394200 | Thioredoxin |
| TraesCS6A01G402200 | Mitochondrial metalloendopeptidase OMA1 | |
| TraesCS6A01G402300 | Mitochondrial metalloendopeptidase OMA1 | |
| TraesCS6A01G406700 | NAC domain protein | |
| QGpc.ippg-6B.1 | TraesCS6B01G253400 | Oligopeptide transporter, putative |
| QGpc.ippg-6B.2 | TraesCS6B01G325700 | Senescence-associated family protein, putative (DUF581) |
| TraesCS6B01G325800 | Senescence-associated family protein, putative (DUF581) | |
| TraesCS6B01G327400 | Mitochondrial metalloendopeptidase OMA1 | |
| TraesCS6B01G327500 | Glutamine synthetase | |
| TraesCS6B01G329200 | NAC domain-containing protein | |
| TraesCS6B01G329400 | NAC domain-containing protein 29 | |
| QGpc.ippg-7A | TraesCS7A01G561400 | Cysteine protease, putative |
| TraesCS7A01G562100 | Thioredoxin | |
| TraesCS7A01G563600 | Thioredoxin |
Table 7.
Selected putative candidate genes residing within the linkage disequilibrium (LD) supported intervals of the detected QTL and stable independent QTNs associated with Thousand Kernel Weight (TKW).
Table 7.
Selected putative candidate genes residing within the linkage disequilibrium (LD) supported intervals of the detected QTL and stable independent QTNs associated with Thousand Kernel Weight (TKW).
| QTL/stable QTN | Gene ID | Annotation function |
|---|---|---|
| QTkw.ippg-1A.1 | TraesCS1A01G005700 | E3 ubiquitin-protein ligase ORTHRUS 2 |
| TraesCS1A01G007200 | Gamma-gliadin | |
| TraesCS1A01G007300 | Gamma-gliadin | |
| TraesCS1A01G007400 | Gamma-gliadin | |
| TraesCS1A01G007700 | Gamma-gliadin | |
| TraesCS1A01G008000 | Low molecular weight glutenin subunit | |
| QTkw.ippg-1A.2 | TraesCS1A01G010900 | Low molecular weight glutenin subunit |
| QTkw.ippg-1B.1 | TraesCS1B01G029300 | E3 ubiquitin-protein ligase pellino homolog 3 |
| QTkw.ippg-1B.2 | TraesCS1B01G407700 | Protease inhibitor/seed storage/lipid transfer protein family |
| TraesCS1B01G407800 | Protease inhibitor/seed storage/lipid transfer protein family | |
| TraesCS1B01G407900 | Protease inhibitor/seed storage/lipid transfer protein family | |
| TraesCS1B01G408000 | Protease inhibitor/seed storage/lipid transfer protein family | |
| QTkw.ippg-2B.1 | TraesCS2B01G025900 | Subtilisin-like protease 6 |
| QTkw.ippg-2B.2 | TraesCS2B01G057600 | NRT1/PTR family protein 2.2 |
| TraesCS2B01G057700 | NRT1/PTR family protein 2.2 | |
| TraesCS2B01G058400 | Serine carboxypeptidase family protein, expressed | |
| TraesCS2B01G062700 | Sucrose transporter-like protein | |
| TraesCS2B01G055700 | Bidirectional sugar transporter SWEET | |
| TraesCS2B01G055800 | Bidirectional sugar transporter SWEET | |
| TraesCS2B01G055900 | Bidirectional sugar transporter SWEET | |
| TraesCS2B01G056000 | Bidirectional sugar transporter SWEET | |
| TraesCS2B01G056100 | Bidirectional sugar transporter SWEET | |
| QTkw.ippg-2B.6 | TraesCS2B01G626000 | Protein NRT1/ PTR FAMILY 5.5 |
| TraesCS2B01G626100 | Protein NRT1/ PTR FAMILY 5.5 | |
| TraesCS2B01G626600 | Protein NRT1/ PTR FAMILY 5.5 | |
| TraesCS2B01G626700 | Protein NRT1/ PTR FAMILY 5.5 | |
| TraesCS2B01G627000 | NAC domain-containing protein, putative | |
| TraesCS2B01G627100 | NAC domain-containing protein, putative | |
| TraesCS2B01G627200 | NAC domain-containing protein, putative | |
| TraesCS2B01G629700 | E3 ubiquitin-protein ligase SINA-like 10 | |
| QTkw.ippg-3A | TraesCS3A01G077900 | NAC domain-containing protein |
| TraesCS3A01G078400 | NAC domain protein | |
| TraesCS3A01G078500 | E3 ubiquitin ligase family protein | |
| QTkw.ippg-3B.1 | TraesCS3B01G018000 | E3 ubiquitin-protein ligase |
| TraesCS3B01G018100 | E3 ubiquitin-protein ligase | |
| TraesCS3B01G018200 | E3 ubiquitin-protein ligase | |
| TraesCS3B01G019600 | E3 ubiquitin-protein ligase | |
| TraesCS3B01G026900 | E3 ubiquitin-protein ligase | |
| TraesCS3B01G027000 | E3 ubiquitin-protein ligase | |
| TraesCS3B01G027400 | E3 ubiquitin-protein ligase | |
| TraesCS3B01G027500 | E3 ubiquitin-protein ligase | |
| TraesCS3B01G028000 | E3 ubiquitin-protein ligase | |
| TraesCS3B01G028800 | E3 ubiquitin-protein ligase | |
| TraesCS3B01G028900 | E3 ubiquitin-protein ligase | |
| TraesCS3B01G014300 | Expansin protein | |
| TraesCS3B01G014400 | Expansin protein | |
| TraesCS3B01G028100 | Cell wall invertase | |
| TraesCS3B01G028500 | Cell wall invertase | |
| QTkw.ippg-3B.2 | TraesCS3B01G092800 | NAC domain-containing protein |
| TraesCS3B01G092900 | NAC domain-containing protein | |
| TraesCS3B01G093300 | NAC domain protein | |
| TraesCS3B01G093400 | E3 ubiquitin ligase family protein | |
| QTkw.ippg-3B.3 | TraesCS3B01G116800 | E3 ubiquitin-protein ligase |
| TraesCS3B01G116200 | Serine carboxypeptidase, putative | |
| TraesCS3B01G116300 | Serine carboxypeptidase, putative | |
| TraesCS3B01G116400 | Serine carboxypeptidase, putative | |
| QTkw.ippg-3B.4 | TraesCS3B01G208300 | NAC domain-containing protein |
| TraesCS3B01G209300 | Sucrose synthase 3 | |
| QTkw.ippg-3B.5 | TraesCS3B01G336200 | E3 ubiquitin-protein ligase |
| TraesCS3B01G336900 | ADP-glucose pyrophosphorylase small subunit 2 | |
| TraesCS3B01G339100 | Subtilisin-like protease | |
| QTkw.ippg-5A.1 | TraesCS5A01G271500 | NAC domain protein |
| TraesCS5A01G275900 | NAC domain-containing protein | |
| QTkw.ippg-5A.2 | TraesCS5A01G507500 | E3 ubiquitin-protein ligase SINA-like 10 |
| QTkw.ippg-5B.1 | TraesCS5B01G007600 | E3 ubiquitin-protein ligase |
| QTkw.ippg-5B.2 | TraesCS5B01G382100 | E3 ubiquitin protein ligase DRIP2 |
| QTkw.ippg-6A.2 | TraesCS6A01G030700 | High affinity nitrate transporter |
| TraesCS6A01G030800 | High affinity nitrate transporter | |
| TraesCS6A01G030900 | High affinity nitrate transporter | |
| TraesCS6A01G031000 | High affinity nitrate transporter | |
| TraesCS6A01G031100 | High affinity nitrate transporter | |
| TraesCS6A01G031200 | High affinity nitrate transporter | |
| TraesCS6A01G032400 | High affinity nitrate transporter | |
| TraesCS6A01G032500 | High affinity nitrate transporter | |
| TraesCS6A01G032800 | High affinity nitrate transporter | |
| TraesCS6A01G032900 | High affinity nitrate transporter | |
| TraesCS6A01G033000 | High affinity nitrate transporter | |
| TraesCS6A01G033100 | High affinity nitrate transporter | |
| TraesCS6A01G033200 | High affinity nitrate transporter | |
| TraesCS6A01G028800 | Subtilisin-like protease | |
| TraesCS6A01G036800 | Subtilisin-like protease | |
| TraesCS6A01G032700 | Expansin protein | |
| QTkw.ippg-6A.3 | TraesCS6A01G057400 | NAC domain-containing protein, putative |
| TraesCS6A01G065600 | NAC domain | |
| TraesCS6A01G065700 | NAC domain | |
| QTkw.ippg-6A.5 | TraesCS6A01G406700 | NAC domain protein |
| QTkw.ippg-6B.1 | TraesCS6B01G214700 | Cytokinin oxidase/dehydrogenase |
| QTkw.ippg-6B.3 | TraesCS6B01G238700 | High affinity nitrate transporter |
| TraesCS6B01G238800 | High affinity nitrate transporter | |
| QTkw.ippg-6D | TraesCS6D01G390200 | NAC domain protein |
| TraesCS6D01G396300 | E3 ubiquitin-protein ligase | |
| TraesCS6D01G393600 | Sucrose transporter | |
| QTkw.ippg-7A | TraesCS7A01G040900 | Sucrose synthase |
| Stable QTN not in a LD block | ||
| Excalibur_rep_c66832_742 | TraesCS2B01G136000 | E3 ubiquitin-protein ligase |
| RFL_Contig2231_346* | TraesCS2B01G136200 | Subtilisin-like protease |
| Tdurum_contig68806_677* | TraesCS2B01G137200 | Subtilisin-like protease |
| RAC875_rep_c114561_587 | TraesCS6A01G108300 | NAC domain-containing protein, putative |
| TraesCS6A01G110100 | Squamosa promoter-binding-like protein | |
| AX-95145282**AX-158588216** | TraesCS6A01G125900 | Squamosa promoter-binding protein-like transcription factor |
Disclaimer/Publisher’s Note: The statements, opinions and data contained in all publications are solely those of the individual author(s) and contributor(s) and not of MDPI and/or the editor(s). MDPI and/or the editor(s) disclaim responsibility for any injury to people or property resulting from any ideas, methods, instructions or products referred to in the content. |
© 2024 by the authors. Licensee MDPI, Basel, Switzerland. This article is an open access article distributed under the terms and conditions of the Creative Commons Attribution (CC BY) license (http://creativecommons.org/licenses/by/4.0/).
Copyright: This open access article is published under a Creative Commons CC BY 4.0 license, which permit the free download, distribution, and reuse, provided that the author and preprint are cited in any reuse.


