
Submitted:
19 February 2024
Posted:
19 February 2024
You are already at the latest version
Abstract
Heart failure is a prevalent cardiovascular condition with significant health implications, necessitating effective diagnostic strategies for timely intervention. This study explores the potential of continuous monitoring of non-invasive signals, specifically integrating Photoplethysmogram (PPG) and Electrocardiogram (ECG), for enhancing early detection and diagnosis of heart failure. Leveraging a dataset from the MIMIC-III database, encompassing 682 heart failure patients and 954 controls. Feature selection techniques were used to systematically select key features which were identified for their clinical relevance and significance in capturing cardiovascular dynamics and to reduce computational complexity and to decrease the chance of overfitting the ML algorithms. These features are then utilized to train and evaluate machine learning algorithms, resulting in a model with an impressive accuracy of 98%, sensitivity of 97.60%, specificity of 96.90%, and precision of 97.20%. The integrated approach outperforms single-signal strategies, showcas-ng its potential for early, precise, and non-invasive heart failure diagnosis. Furthermore, the study underscores the significance of continuous monitoring through wearables, emphasizing the benefits of integrating multiple signals for a comprehensive evaluation of cardiovascular health. The proposed approach holds promise for implementation in hardware systems to enable continuous monitoring, aiding in early detection and prevention of critical health conditions.
Keywords:
Heart Failure
; Photoplethysmogram
; Echocardiogram
; Machine Learning
1. Introduction
Around 65 million people worldwide suffer from heart failure, a chronic, progressive, and incurable illness that causes about 7 million deaths annually [1]. Heart failure can manifest due to various factors, including inadequate myocardial relaxation, impaired ejection, or a combination of these issues. Furthermore, several underlying disorders such as coronary artery disease, hypertension, atrial fibrillation, heart valve irregularities, excessive alcohol consumption, infections, and idiopathic cardiomyopathy, in addition to structural heart abnormalities, can precipitate heart failure [2]. In individuals with heart failure, the heart loses its ability to effectively pump a sufficient volume of blood to meet the body's organ and tissue oxygenation requirements [3].
The global incidence of heart failure is experiencing an upward trend, particularly in developed nations, constituting a significant public health concern [4]. In the United States, the present count of adults afflicted by heart failure stands at approximately 6.2 million, with a projected 46% increase anticipated by 2030 [5]. Factors contributing to this surge encompass an aging population, enhanced management of chronic illnesses, advancements in acute coronary syndrome treatments, and improved care for heart failure patients [6]. Europe is similarly affected, with an estimated 15 million individuals grappling with heart failure, leading to over 3 million hospitalizations annually. The substantial prevalence and recurrent hospitalization patterns associated with heart failure impose noteworthy economic burdens on both healthcare systems and society, with annual healthcare expenditures in the United States exceeding $30 billion [4].
Preventing heart failure and other cardiovascular diseases (CVDs) are significantly more successful when prevention and therapy are initiated promptly. Unfortunately, in the early stages of heart failure, many patients are asymptomatic, leading to missed opportunities for optimal treatment and an increased risk of complications. Nevertheless, certain physiological signals, such as electrocardiogram (ECG) and photoplethysmography (PPG), undergo alterations influenced by blood pressure levels [7,8]. These changes primarily manifest as morphological shifts in physiological signals, providing insights into the functional status of the heart and vascular system.
The integration of Photoplethysmography (PPG) and Electrocardiography (ECG) signals in our study serves to address the complementary nature of these modalities in assessing cardiovascular health. ECG signals primarily focus on the electrical activity of the heart, providing detailed information about arrhythmias, electrical abnormalities, and cardiac rhythm. However, ECG may lack direct insights into peripheral vascular resistance and the pulsatile component of blood flow. In contrast, PPG signals are sensitive to changes in peripheral vascular resistance and offer information about the pulsatile nature of blood flow [9]. By combining both signals, our assessment model aims to compensate for the limitations of each modality. The integration allows us to comprehensively evaluate both electrical and hemodynamic features, providing a more accurate assessment and understanding of heart function and contributing to the accuracy of heart failure assessment. The rationale behind using both signals lies in their synergistic ability to capture a broader spectrum of physiological features, ensuring a more robust evaluation compared to relying on either signal independently. For instance, in the case of heart failure, ECG might indicate arrhythmias, while PPG could unveil signs of impaired cardiac output. By coalescing these insights, the clinician gains a more comprehensive understanding of the heart's performance and potential issues. Combining the attributes of both ECG and PPG signals is imperative to harness the comprehensive advantages derived from their respective features. Figure 1 shows the ECG and PPG signals graphically. The waveforms of the ECG signals are shown in Figure 1(a), where the primary ECG peaks are indicated by dark circles. The PPG signal and associated waveforms are shown in Figure 1(b), and the peaks corresponding to systole and diastole are shown by the dark circles in Subfigure (b).
Although so many researches have been conducted on heart failure, most of them apply either echocardiogram or photoplethysmogram signals in their study. A paper introduced the concept of a non-invasive assessment method for the detection of ischemic heart disease patients from fingertip Photoplethysmogram (PPG) signal. A unified feature set pertaining to heart rate variability (HRV) and PPG waveform morphologies was established to differentiate between individuals with and without CAD. For classification, they employed the Support Vector Machine (SVM). Using a corpus of 112 people chosen from the MIMIC II dataset, their methodology achieves sensitivity and specificity ratings of 82% and 88%, respectively, in identifying CAD patients. They also obtained 73% and 87% sensitivity and specificity ratings on a different dataset of 30 patients that was gathered from an urban hospital utilizing a commercial oximeter device [10]. A conditional Generative Adversarial Network (GAN) model (P2E-WGAN) was designed to reconstruct/synthesize realistic ECG signals from PPG signals, the results demonstrate the model’s potential for providing a paradigm shift in telemedicine by bringing ECG based clinical diagnoses of cardiovascular disease to individuals via simple PPG assessment by wearables [11]. The synthesis of ECG waveforms from PPG signals using the P2E-WGAN approach has several potential applications and implications for clinical practice and medical device development such as enabling wearable devices equipped with PPG sensors to potentially provide continuous and long-term monitoring of ECG signals in daily life settings leading to the development of intelligent healthcare systems for clinical diagnoses of cardiac diseases and anomalies in real time through machine learning and cloud computing.
In another study, authors introduced a non-invasive and cost-effective method for detecting coronary artery disease (CAD) through photoplethysmography (PPG), suitable for at-home monitoring. The analysis focuses on extracting distinguishing features from the time domain of the PPG signal and its second derivative. CAD patients were classified using a Support Vector Machine-based classifier. The study evaluated the approach using ICU patient data from the MIMIC-II dataset and achieved a sensitivity of 85% and a specificity of 78% in identifying CAD patients [12]. A study conducted on time-domain features from PPG signals to differentiate between subjects with and without diseases using various classification methods. The study evaluated ten metrics from the confusion matrix, and the Boosted Trees classifier outperformed others, achieving an accuracy of 94%, sensitivity of 95%, specificity of 95%, and precision of 97% [13].
The UCI dataset repository was utilized to extract ECG features for use in a study that focused on heart failure prediction using the multi-criteria weighted vote-based classifier. The experimental outcomes validate the efficacy of the proposed ensemble classifier in handling a wide range of attribute types, with a notable high diagnostic accuracy of 87.37%. Furthermore, the classifier demonstrated impressive sensitivity at 93.75%, specificity at 92.86%, and an F-measure of 82.17%. These findings underscore the potential of this classifier as a valuable tool for accurate and comprehensive heart disease prediction [14]. A cross-domain joint dictionary learning (XDJDL) framework for synthesizing ECG waveforms from PPG signals was suggested in a study, the experimental results demonstrated the possibility of providing an affordable preliminary diagnosis screening from PPG signals and long-term, user-friendly ECG monitoring to help with early identification and screening for specific heart illnesses [15]. A Heart Disease Prediction System (HDPS) was developed aimed at assisting medical practitioners in diagnosing heart diseases. The system selects 13 relevant features from clinical data, constructs an artificial neural network based on these features, and creates a user-friendly interface. The HDPS offers output through various means, including ROC curve displays, execution time, accuracy, sensitivity, and specificity. Impressively, the HDPS achieved an 80% classification accuracy, indicating its potential as a valuable tool for heart disease diagnosis [16]. The detrended fluctuation analysis (DFA) method was used by Kamath et al., [17] to compute the short-term (20 s) ECG segments for CHF and normal hearts. The method produced 98.4% and 98% average sensitivity and specificity rates, respectively.
This study bridges a notable research gap by introducing a novel approach that integrates PPG and ECG signals for heart failure assessment. While previous studies have traditionally analyzed these signals independently, our innovative methodology leverages their combined power, offering a comprehensive evaluation of cardiac health. This approach not only enhances diagnostic accuracy but also holds the potential to detect heart failure at an earlier stage, promising to transform the field of cardiac healthcare. The contribution of this paper can be summarized in the following three points:
- This paper introduces an innovative approach by integrating Photoplethysmography (PPG) and Electrocardiogram (ECG) signals for heart failure assessment. This integration leverages the unique strengths of both non-invasive monitoring methods to enhance diagnostic accuracy and enable early detection of heart failure.
- The study underscores the clinical relevance of this integrated approach, emphasizing its potential to improve patient care, offer personalized treatment plans, and reduce healthcare costs. By preventing advanced heart failure complications, it has the potential to generate substantial cost savings for healthcare systems.
- The significant improvements achieved by the proposed integrated method in contrast to the results obtained from individual ECG and PPG signals underscore the potency of combining these two modalities. This not only enhances diagnostic accuracy but also highlights the potential for early detection in the assessment and management of heart failure.
The rest of this paper follows this structure: The study's methodology, which includes data collecting, signal processing, feature extraction, feature importance analysis and selection, and classification is covered in detail in Section 2. Section 3 is dedicated to presenting the outcomes and discussions of various classification models and distinct feature sets. Finally, Sections 4 provide an in-depth exploration of the strengths and limitations of this work, while Section 5 offers a comprehensive conclusion that highlights the clinical relevance of our study's findings.
2. Materials and Methods
The foundational block diagram of our proposed approach for heart failure assessment is shown in Figure 2, which involves the integration of PPG and ECG signals and employs machine learning algorithms for classification. The methodology encompasses the following steps: i) Acquisition of ECG and PPG signals as the primary inputs of the algorithm ii) preprocessing the ECG and PPG signals which include denoising and eliminating artefacts iii) extraction of informative features from the preprocessed signals iv) normalization of the dimension of the extracted features v) feature importance analysis and selection, vi) Partitioning and classification of the data; and, ultimately, vii) Comparative evaluation with prior research and studies. The subsequent subsections go into further depth about each of these blocks.
2.1. Dataset and Signal Pre-processing
The data utilized in this research were sourced from the MIMIC-III (Medical Information Mart for Intensive Care) database, a comprehensive repository containing information from a large cohort of Intensive Care Unit (ICU) patients [18]. We obtained proper consent for data extraction from MIMIC-III for research purposes, as indicated by Record ID 51903504, and adhered to ethical guidelines by completing the web-based training course provided by the National Institutes of Health Protecting Human Research Participants. The dataset for this study, comprising a total of 1636 instances, included 682 patients with 25 types of heart failure were extracted using ICD-9 codes (Table 1) and 954 control subjects. The inclusion criteria involved patients aged 20 years or older at the time of ICU admission. Exclusions were made for patients below this age, those lacking an ICU record, or missing data for echocardiography or photoplethysmogram. The mean age of the included patients was 53.5 ± 9.9 years, with 40.95% being women and 59.05% men.
Three main sources of interference are generally endangering to the quality of the ECG signal: A) The power-line noise at 50 or 60 Hz, which makes up the majority of the noise power in these signals and is essentially stationary. B) The signal's base-line wandering, which is referred to as the breathing artefact and manifests as a low-frequency component in the time domain. This can cause analogue circuitry to become saturated or lose some of its effective precision, which can erode the accuracy of digitalization. C) Non-stationary, high-frequency noises resulting from muscle contractions. We created a preprocessing block to filter and denoise the signals in order to eliminate the degrading impacts of noise and artefacts from the raw signals. First, we addressed baseline wander and motion artifacts by applying a high-pass filter with a cut-off frequency of 150Hz. This filter effectively removed low-frequency components related to baseline drift and motion artifacts while retaining the higher-frequency components essential for heart function and cardiac event analysis. Notably, recordings with abnormalities or noise, such as missing peaks, pulsus bisferiens, no signal (sensor-off), etc., were excluded. The retained signal fragments had more than 30000 points, equivalent to 4 minutes of data at a 125 Hz adoption rate.

Table 1.
Classes of HF in the study and the corresponding ICD-9 codes.
| ICD-9 codes | Name |
|---|---|
| 39891 | Rheumatic heart failure (congestive) |
| 40201 | Malignant hypertensive heart disease with heart failure |
| 40211 | Benign hypertensive heart disease with heart failure |
| 40291 | Unspecified hypertensive heart disease with heart failure |
| 40401 | Hypertensive heart and chronic kidney disease, malignant, with heart failure and with chronic kidney disease stage I through stage IV, or unspecified |
| 40403 | Hypertensive heart and chronic kidney disease, malignant, with heart failure and with chronic kidney disease stage V or end stage renal disease |
| 40411 | Hypertensive heart and chronic kidney disease, benign, with heart failure and with chronic kidney disease stage I through stage IV, or unspecified |
| 40413 | Hypertensive heart and chronic kidney disease, benign, with heart failure and chronic kidney disease stage V or end stage renal disease |
| 40491 | Hypertensive heart and chronic kidney disease, unspecified, with heart failure and with chronic kidney disease stage I through stage IV, or unspecified |
| 40493 | Hypertensive heart and chronic kidney disease, unspecified, with heart failure and chronic kidney disease stage V or end stage renal disease |
| 4280 | Congestive heart failure, unspecified |
| 4281 | Left heart failure |
| 42820 | Systolic heart failure, unspecified |
| 42821 | Acute systolic heart failure |
| 42822 | Chronic systolic heart failure |
| 42823 | Acute on chronic systolic heart failure |
| 42830 | Diastolic heart failure, unspecified |
| 42831 | Acute diastolic heart failure |
| 42832 | Chronic diastolic heart failure |
| 42833 | Acute on chronic diastolic heart failure |
| 42840 | Combined systolic and diastolic heart failure, unspecified |
| 42841 | Acute combined systolic and diastolic heart failure |
| 42842 | Chronic combined systolic and diastolic heart failure |
| 42843 | Acute on chronic combined systolic and diastolic heart failure |
| 4289 | Heart failure, unspecified |
2.2. Feature Extraction
Feature extraction constitutes the procedure of uncovering meaningful patterns and insights within raw data, thereby crafting a more informative representation that refines the accuracy of prognosis and diagnosis [19]. In the realm of machine learning and data analysis, feature extraction revolves around the conversion of input data into a collection of features suitable for utilization as inputs in models or algorithms. In the present study, MATLAB software (version R2022b), designed and distributed by MathWorks (Natick, MA, USA), was employed for conducting the feature extraction process.
The feature extractor block is responsible for extracting three distinct categories of informative features from both PPG and ECG signals. The features extracted are broadly classified into three groups: The first category is centered on physiological parameters, including metrics such as Augmentation Index, Heart Rate, Arterial Stiffness Index, and Heart Rate Variability parameters (pNN50, NN50, RMSSD, SDNN), physiological features delve into parameters related to the body's physiological responses. The second group of features encompasses amplitude-related attributes, such as Pulse Pressure, Systolic pressure, Diastolic pressure, and P-wave characteristics, these features provide insights into the signal's strength and intensity. The third category involves interval-related features, including Peak to peak interval, QRS interval, and RR interval, the interval features offer information about the durations between specific points within the signal.
In accordance with the physiological underpinnings of heart failure and its relationship with ECG and PPG signals, we identified and extracted 13 pivotal features. These features encapsulate essential cardiovascular information and were extracted from both ECG and PPG signals within each cardiac cycle to facilitate heart failure evaluation. The extracted characteristics are represented visually in Figure 3, while Table 2 furnishes a comprehensive overview of each feature's class and the clinical importance/implications. It's essential to highlight that the PPG features extracted in this study are solely based on the identification of three readily discernible points, specifically the peak of the first derivative of PPG, foot and peak of the PPG waveform.
The morphological changes in cardiovascular features serve as indicators of structural or functional irregularities in the heart. In individuals with chronic heart failure (CHF) and acute myocardial infarction (AMI), heart rate variability in the time domain provides valuable prognostic information. Key parameters include the standard deviation of normal beat intervals (SDNN) and pNN50, representing the percentage of adjacent NN intervals differing by more than 50ms. A SDNN value of less than 50 ms or pNN50 lower than 3% is indicative of high risk, 50 to 100 suggests moderate risk, and a value over 100 ms or a pNN50 greater than 3% is considered normal [20]. The QRS interval, another predictor of heart failure, generally ranges between 0.06 – 0.12 ms in healthy individuals. A prolonged QRS interval may indicate delays in the ventricular depolarization process. The R-R interval, denoting the time between consecutive R waves in the QRS signal, is a critical parameter for assessing ventricular rate. In healthy individuals, normal ECG values for the R-R interval typically range between 0.6-1.2 seconds. Prolonged R-R intervals, defined as > 1.5 s, are commonly observed in patients with atrial fibrillation [21].
Pulse pressure, representing the difference between systolic and diastolic blood pressure, and Systolic pressure, an indicator of pulsatile changes in blood volume due to arterial blood flow, typically range between 0.5 – 10 mmHg and 80 – 120 mmHg, respectively, in healthy subjects. In heart failure, the arterial system undergoes changes, leading to increased stiffness. Elevated Augmentation Index values are indicative of increased wave reflections, reduced arterial compliance, and impaired vascular function, all of which are associated with heart failure. Structural and electrical changes in the heart can affect atrial function which in turn causes P-wave abnormalities, such as increased duration or altered shape, may signify atrial remodeling, a common feature in heart failure patients.
Heart rate (HR) also serves as a predictor of cardiovascular, cerebrovascular, and all-cause mortality [22]. A normal resting heart rate for adults ranges between 60 and 100 beats per minute. Increased heart rate has been associated with elevated cardiovascular risk and total mortality. The relationship between increased heart rate and adverse cardiovascular events remains significant even after adjusting for major cardiovascular risk factors, indicating the independent prognostic value of heart rate in various populations and clinical conditions.
Table 3.
Features and the Normal Values for a Healthy Adult.
| Feature | Description | Duration | Disease Diagnosis |
|---|---|---|---|
| Pulse pressure | Difference between the systolic and diastolic blood pressure | 0.5 - 10 mmHg | Atherosclerosis Congestive Heart failure |
| Systolic pressure | Indicator of the pulsatile changes in blood volume caused by arterial blood flow | 80 – 120 mmHg | Artery stiffness. Heart Failure |
| P-wave | Atrial depolarization | 0.08 – 0.11s | Heart Failure |
| Diastolic Pressure | Represents the amplitude of the signal during the diastolic phase of the cardiac cycle | <80 mm | Ischemic heart disease Cardiomyopathy |
| Peak to peak interval | Represents the duration between successive peaks in a signal | 0.6 – 1.2s | Atrial fibrillation Heart failure |
| RR interval | The interval between two successive R-waves of the QRS complex ventricular rate | 0.6 – 1.2s | Paroxysmal atrial fibrillation Congestive heart failure |
| Augmentation Index | The difference between systolic and diastolic blood pressure | 20-80 | Heart Failure |
| Heart Rate | A measure of the number of times the heart contracts or beats within a specific time frame, usually one minute | 60 – 100 bpm | Heart Failure Atrial fibrillation |
| QRS interval | Ventricular depolarization | 0.08 – 0.11s | Heart failure Tachycardia Acute Coronary Syndrome |
| RMSSD NN50 pNN50 |
Shows how active the parasympathetic system is relative to the sympathetic nervous system | 19 – 48 ms 5 – 25ms 5% - 18% |
Heart failure Hypertension Arrhythmia Coronary artery disease |
2.3. Feature Normalization
To address the scale differences in features extracted from PPG and ECG signals, which represent distinct heart failure indicators, the study utilized min-max normalization on the entire dataset. This crucial preprocessing step ensured that all feature values were uniformly scaled within a range of 0 to 1, preventing analytical inaccuracies and anomalies during model training. The normalization method employed followed a straightforward mapping equation to achieve this standardization:
This process not only promotes model stability and efficiency but also mitigates the impact of outliers, enhancing the reliability of our heart failure evaluation model.
2.4. Feature Importance Analysis and Feature Selection
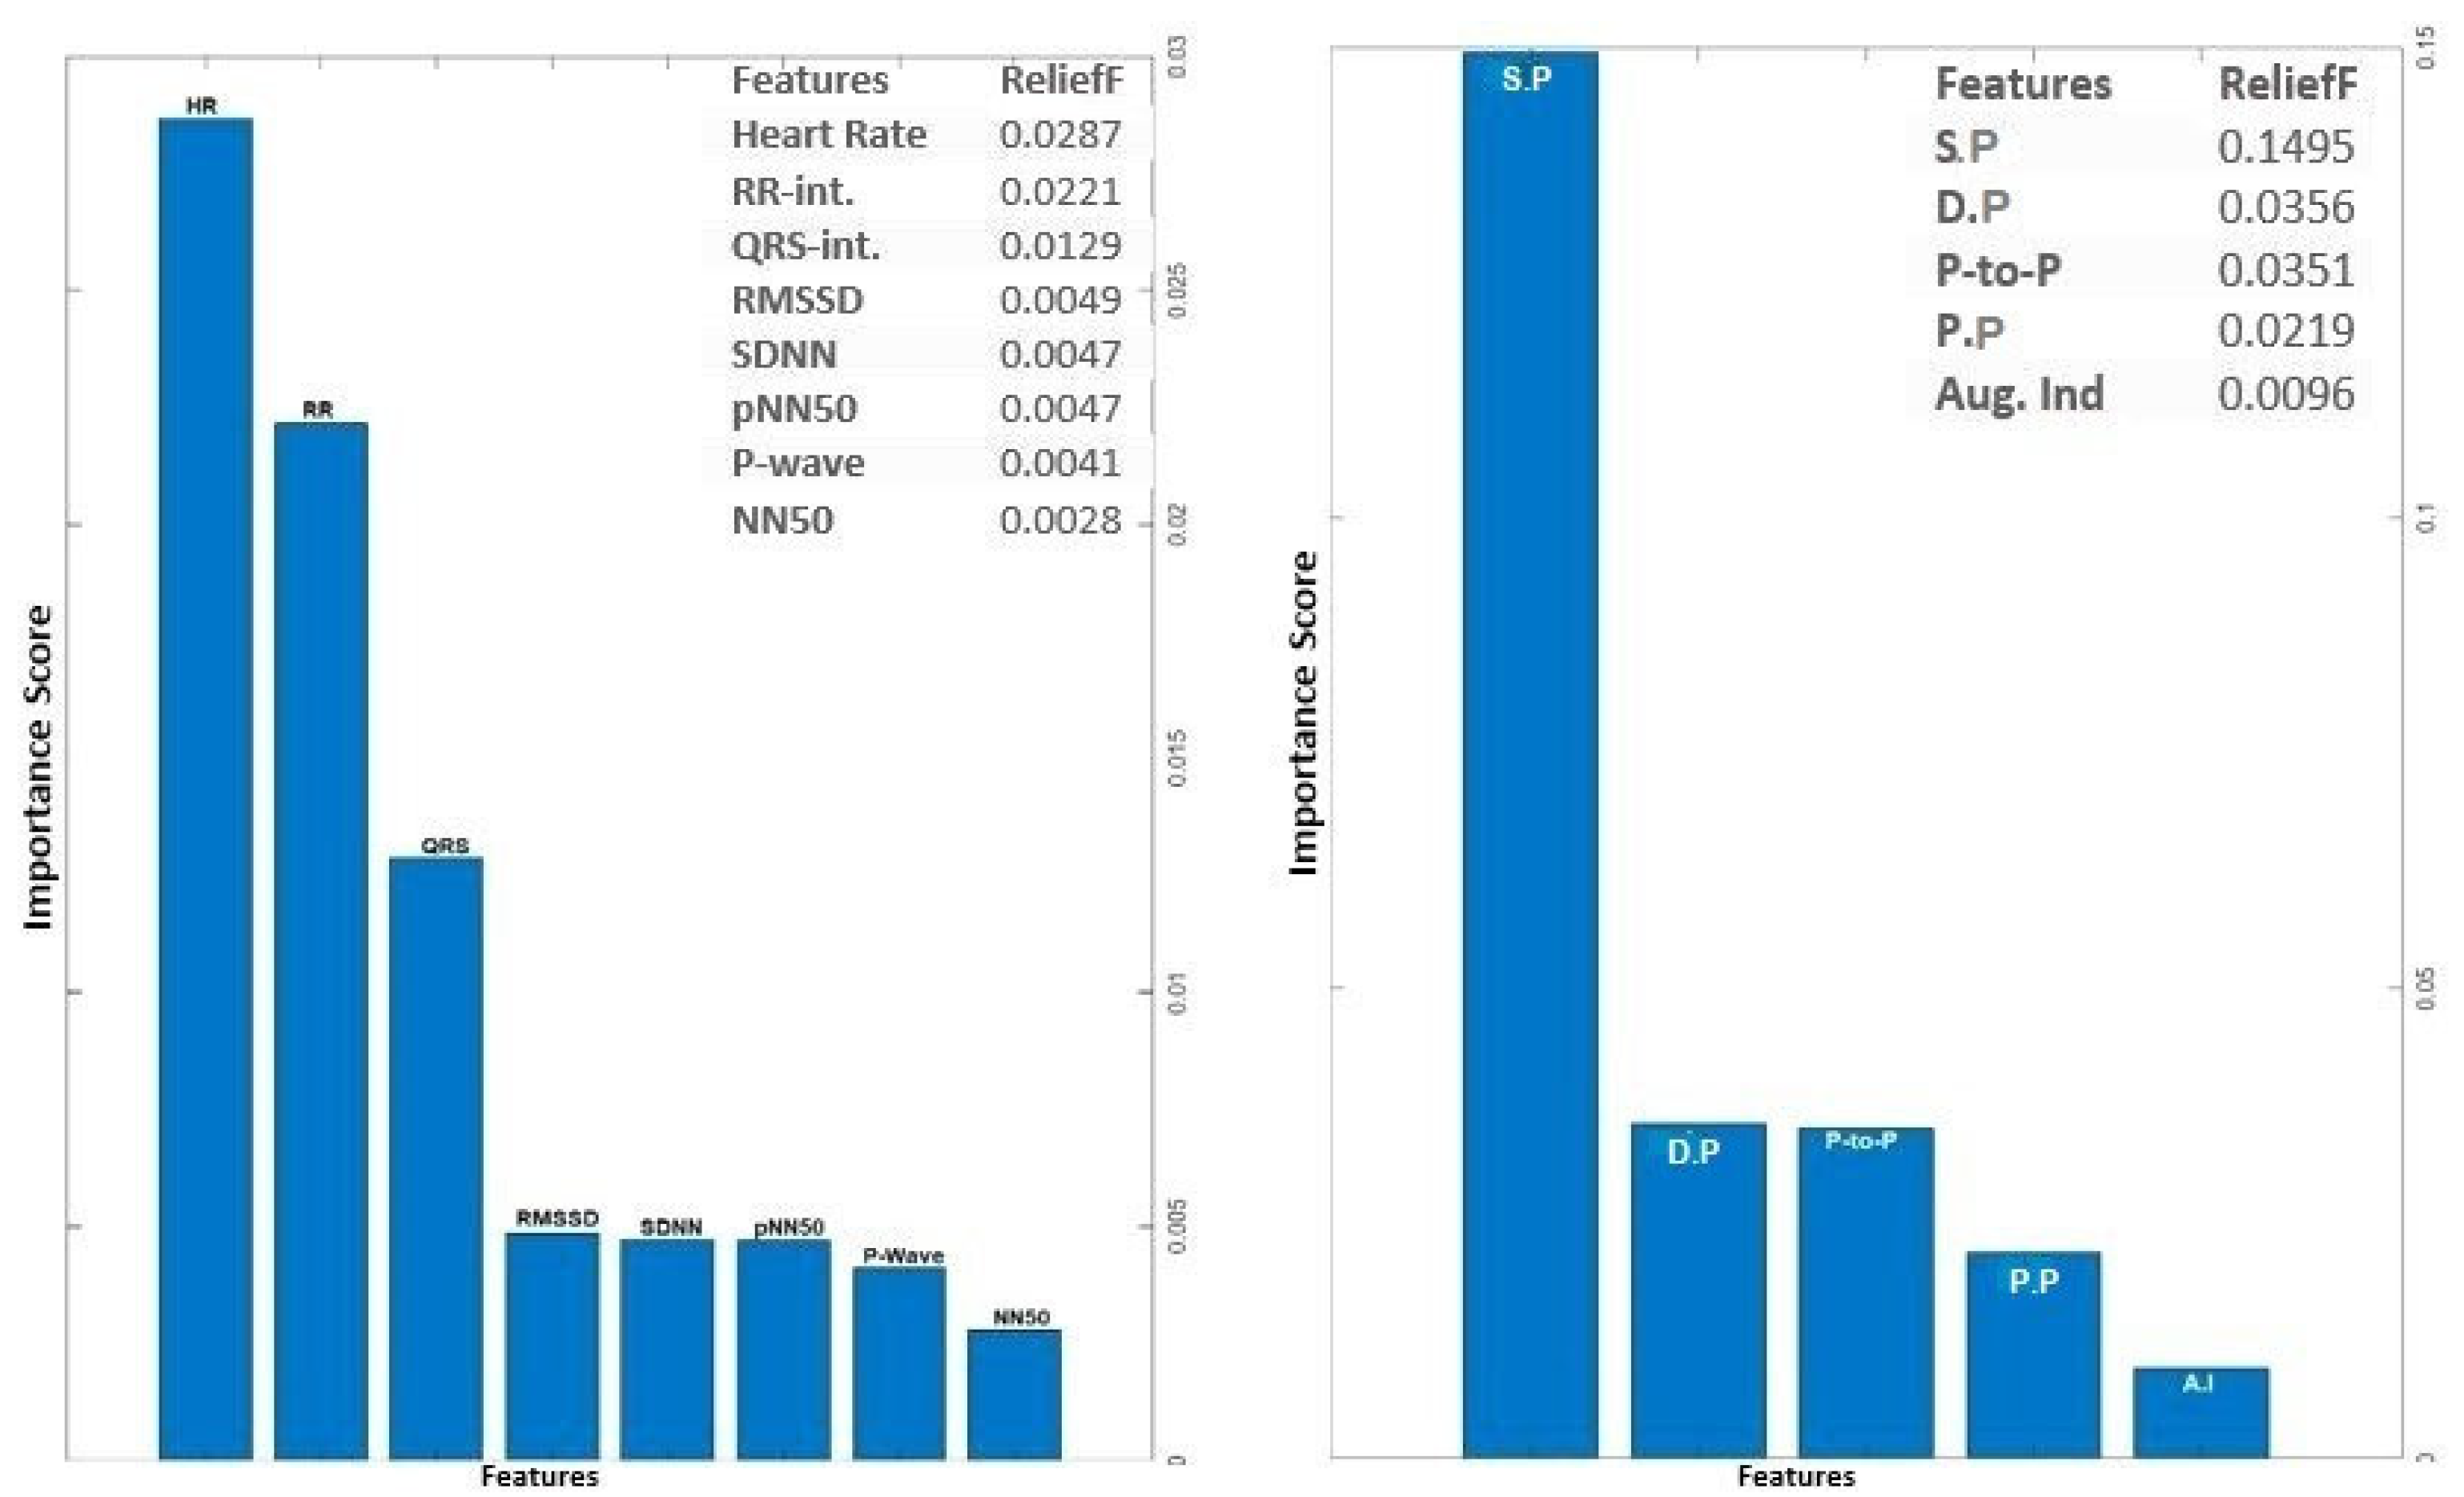
The input feature vectors for both PPG and ECG were further reduced using the relief feature algorithm (ReliefF) [23,24]. The ReliefF algorithm is a filter-style feature selection technique that estimates weights by taking the nearest neighbor into account. In practical applications, this enhanced Relief derivative, referred to as ReliefF, is the most frequently utilized version [25]. The study employed the ReliefF algorithm to further reduce input feature vectors derived from both PPG and ECG signals. ReliefF is a well-established feature selection method known for its robust performance in multi-class classification scenarios and its capacity to handle noisy datasets with missing values. This improved variant, ReliefF, incorporates k nearest neighbors (KNN) from each class to estimate feature weights, enhancing the accuracy of weight estimation, particularly in noisy dataset settings [26]. The study initially used the ReliefF algorithm to assess the relevance of features within PPG and ECG signals separately. This analysis identified key features within each modality for heart failure assessment, aiding in the determination of which modality (ECG or PPG) offered better discriminatory power. However, this individual analysis had a limitation in that it might not capture interactions or synergies between PPG and ECG features. To overcome this limitation, the study conducted a combined feature importance analysis on a feature set that included both ECG and PPG data. This holistic approach provided a comprehensive view of feature importance, taking into account the contributions of both modalities. This comprehensive perspective offered insights into the significance of individual features within each signal and the collective impact of combining features from both PPG and ECG. Ultimately, this holistic view shed light on the roles of each modality and highlighted the potential advantages of integrating them in the context of heart failure evaluation.
The analysis of ECG data illuminates the pivotal role played by several key features as discriminators among different classes, particularly in individuals with heart failure. The heartbeat feature, reflecting the frequency of heartbeats, serves as a fundamental indicator of cardiac activity, with deviations signaling disruptions in pumping function. The RR interval, indicative of the time between successive R-peaks, offers insights into heart rate variability, highlighting irregularities in cardiac rhythm. The QRS interval, representing ventricular depolarization duration, provides information on the heart's electrical conduction system. Features such as RMSSD, SDNN, and pNN50, which gauge short-term variability, overall variability, and the percentage of significant variations, respectively, offer crucial information on autonomic function and cardiovascular regulatory mechanisms. Altered patterns in these features among individuals with heart failure contribute to a comprehensive understanding of the physiological changes associated with the condition. The examination of feature importance derived from PPG signals accentuates the clinical relevance of Systolic Pressure, Diastolic Pressure, Peak-to-Peak Interval, and pulse pressure in the PPG waveform for heart failure assessment. These features bear intricate connections to heart function. In the realm of heart failure, where cardiac function is frequently compromised, alterations in the morphology of these features serve as indicative markers of the physiological changes associated with the condition. Systolic pressure, representing the maximum arterial pressure during systole, and Diastolic pressure, indicating the minimum arterial pressure during diastole, offer a comprehensive view of blood pressure dynamics. The Peak to Peak Interval captures variations between consecutive peaks, reflecting the pulsatile nature of blood flow. Pulse Pressure, as a fundamental feature in the PPG waveform, provides information about the strength and regularity of the pulsatile signal. Comprehending the subtle variations in these characteristics greatly enhances the clinical applicability of PPG-based assessments by contributing to the nuanced assessment of heart failure. The above selected features for PPG (4 features) and ECG (6 features) were used for classifications involving the analysis of independent signals.
Figure 4.
Feature Importance Score for ECG and PPG signal using ReliefF algorithm.
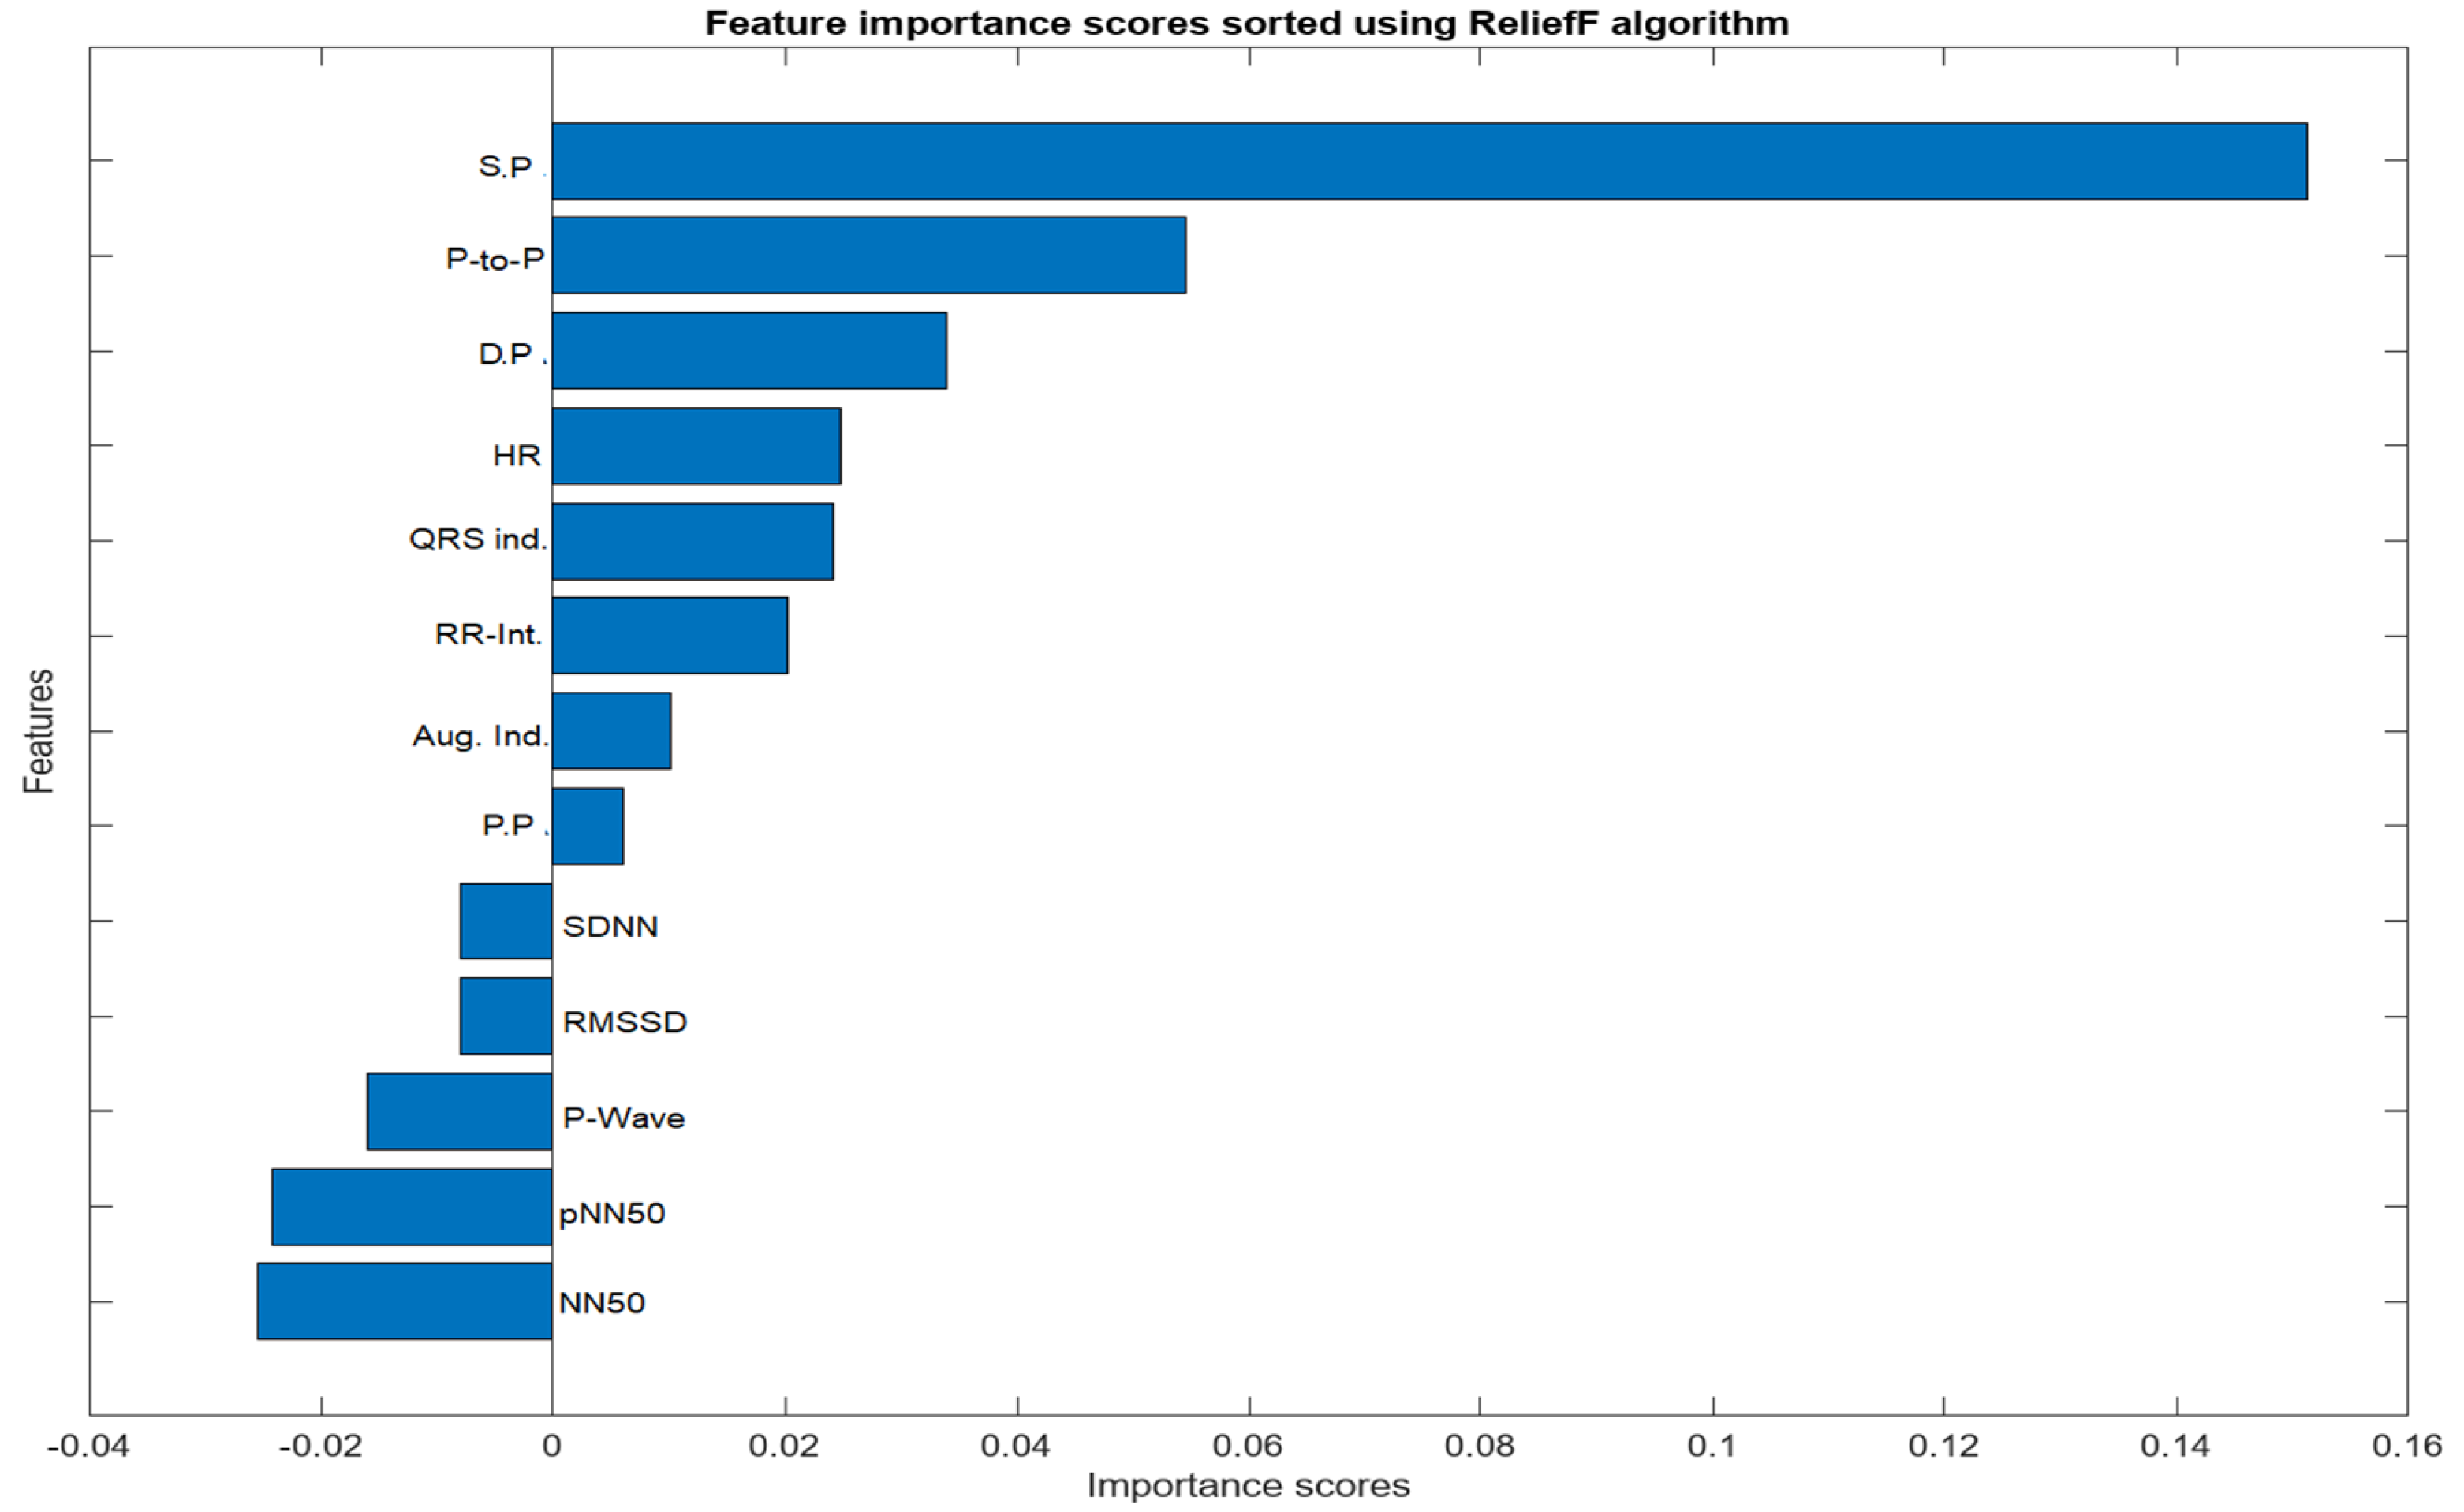
The feature selection process for the integration of PPG and ECG signals involved a meticulous examination of absolute values to identify features of substantial significance in the context of heart failure assessment. From the initial pool of extracted features, a refined set of ten (10) features was selected. Notably, Systolic Pressure, Diastolic Pressure, Peak to Peak Interval, NN50, pNN50, P-wave, Heart Rate, QRS Complex, RR Interval, Pulse Pressure, and Augmentation Index emerged as pivotal contributors to the classification task. The consideration of absolute values was paramount, ensuring a comprehensive evaluation of these features and capturing the essential dynamics of the cardiovascular system. These selected features exhibit notable clinical relevance, aligning with established physiological indicators of heart failure. ReliefF played a key role in highlighting their importance, emphasizing their ability to distinguish patterns associated with heart failure. The chosen features contribute to the overall effectiveness and clinical relevance of the heart failure assessment model, enhancing its interpretability and accuracy in classifying instances of the condition.
Figure 5.
Importance score for Combined Features from PPG and ECG Signals.
2.5. Data Partitioning and Classical Machine learning
Data partitioning is a crucial step in supervised machine learning, aiding in the training, optimization, and validation of predictive models. Various techniques exist for partitioning datasets into subsets, each suited to different dataset sizes. In this study, the datasets (n = 1636) was split into 75% (1227) train and 25% (409) test sets. The intentional design of the control group with a larger sample size aimed to provide a more balanced representation of the real-world distribution, enhancing the reliability and accuracy of our analysis. To ensure the model's stability and generalization, a 10-fold cross-validation (CV) procedure was applied to the training data before model optimization. During this process, the training data was divided into ten equal-sized 'folds.' The model was trained and validated ten times, with each fold taking turns as the validation set while the others were used for training. By evaluating the model's performance across different training data subsets, this method helped prevent overfitting. Also an extensive hyper-parameter tuning to optimize the model's performance while guarding against overfitting and under-fitting was done. The utilization of cross-validation strategy mentioned earlier and ensemble methods further contributed to the robustness of our model. Our commitment to avoiding over-parametrization was manifested in the comprehensive evaluation of various training aspects, emphasizing a balanced trade-off between model complexity and generalization. This meticulous approach allows for a fair and reliable comparison between the integrative and single-input models. The performance of the resulting model was evaluated on a different test set, giving an assessment of its generalization to completely unknown data.
In this study, Nine (9) machine learning algorithms were implemented for classification and performance analysis using the Weka software. Weka (Waikato Environment for Knowledge Analysis) is a cross-platform open source, renowned for its popularity in the realm of machine learning. Developed by the University of Waikato, this Java-based software offers a versatile platform for various data analysis and machine learning tasks [27].
- Random Forest (RF): Random Forest (RF) stands out as a well-known nonparametric tree-based supervised machine learning method, proficient in handling classification and regression tasks [28]. RF algorithms create numerous machine learning models and consolidate their results to arrive at more robust decisions or estimations than what individual models could achieve in isolation [28]. In comparison to various other machine learning techniques, RF offers distinct advantages. The base estimators within a random forest are trained independently, reducing the training process required for these models [29].
- Adaptive Boost (Adaboost): AdaBoost represents yet another powerful ensemble learning technique applicable to both classification [30]. This appraoch operates by amalgamating multiple weak learners, which individually perform sub-optimally, into a robust learner [31]. AdaBoost is particularly suitable for scenarios with a large number of features, efficiently selecting the most informative ones. Additionally, it effectively addresses class imbalance by adjusting training sample weights, ensuring fair attention to both positive and negative cases during training.
- Naïve Bayes: Naïve Bayes classifiers employ Bayes' probability theorem for data classification. They make an assumption that all features are independent of each other, even though this assumption is simplified, which is why they are referred to as 'naïve.' Bayes' rule calculates the probability of an event based on its relationship with another variable, with a basic representation as follows:Naïve Bayes is computationally efficient, suitable for large datasets and real-time applications.
- Decision Tree (DT): Decision Trees are an intuitive, tree-like structured, non-parametric approach used for classification. To prevent overfitting, Decision Trees use pruning techniques to simplify the tree structure. They accommodate both categorical and numerical features, necessitating minimal data preprocessing and displaying proficiency in handling missing values. This robustness in the face of missing data is especially valuable for real-world situations where data incompleteness and noise are common.
- Support Vector Machine (SVM): SVM accomplishes classification by identifying the optimal hyperplane that improves the gap between classes [32]. In the case of combining non-invasive signals like PPG and ECG, the resulting feature space can be complex and high-dimensional. SVM can handle such data by finding an optimal hyperplane that maximally separates the different classes, even in high-dimensional feature spaces. This capability allows SVM to capture complex relationships and patterns in the data, which can be crucial for accurately classifying heart failure patients.
- K-Nearest Neighbors (KNN): KNN classifies data points by taking a vote based on the class types of their k nearest neighbors in multi-dimensional space. This localized approach is advantageous in scenarios where nearby data points hold significant influence. In the context of heart failure evaluation, KNN can uncover subtle patterns in PPG and ECG signals, aiding in diagnosis. In its basic form, KNN assigns a class depending on the largest class within the k nearest neighbors.
- Multilayer Perceptron (MLP): MLPs are a class of feedforward neural networks [33]. MLPs excel at modeling complex, nonlinear data relationships but require careful design of architecture, including hidden layer count, neuron numbers, and activation functions for optimal performance. It can be applied in a range of domains including image and speech recognition, natural language processing, and medical diagnosis, showcasing their versatility in machine learning [34,35].
- Random Tree (RT): In practice, Random Tree algorithms offer a good balance between simplicity and performance and are a valuable tool for various machine learning tasks [28]. The Random Tree algorithm is built on the foundation of decision trees, which are known for their ability to recursively partition data into subsets based on feature values. However, Random Trees introduce an element of randomness into the decision tree construction process through random feature selection and Bootstrap Aggregating (Bagging).
- Bayesian Net (BayesNet): Bayesian Network is a probabilistic graphical model widely used for various machine learning tasks, especially in fields like healthcare, finance, and natural language processing. It's based on Bayesian probability theory and graph theory, offering a compact and intuitive way to represent complex probabilistic relationships among variables. The effectiveness of BayesNets in managing uncertainty is one of its main advantages.BayesNets offer interpretable results, allowing you to understand how variables influence each other. This is crucial for decision-making in sensitive areas like healthcare.
Each machine learning algorithms mentioned above were implemented in this study based on its specific strengths and suitability for the study's goals, including handling complex features, dealing with noisy data, and providing insights into feature importance or relationships within the dataset, also the combination of these diverse algorithms allows for a comprehensive evaluation of heart failure using the extracted PPG and ECG features. The Table below gives tabular representation of this selection rationale
Table 4.
Summary of Machine Learning Algorithms and their Selection Rationale.
| Algorithm | Strength’s | Reasons for selection |
|---|---|---|
| SVM (Support Vector Machine) |
• Effective in high-dimensional spaces • Works well with complex datasets • Good generalization capabilities |
Chosen for its ability to handle complex feature spaces and its effectiveness in classification tasks. [36,37] |
| Random Forest | • High predictive accuracy • Handles both numerical and categorical data • Reduces overfitting |
Selected for its robustness and ability to deal with noisy data, which is common in medical datasets [28,29]. |
| K-nearest Neighbor (KNN) | • Simple and intuitive • Non-parametric and adaptable |
Employed for its simplicity and adaptability in classifying data points based on their proximity to neighbors [38,39,40]. |
| Random Tree | • Ensemble method combining decision trees • Resistant to overfitting • Handles mixed data types |
Utilized for its robustness and versatility in handling various data types and potential for accurate classification and can handle missing values efficiently [41,42,43]. |
| AdaBoost | • Sequential ensemble learning • Combines weak learners for a stronger model • Good at handling imbalanced data |
Chosen for its ability to improve model accuracy by sequentially learning from previous models' mistakes [30,43]. |
| BayesNet (Bayesian Network) | • Probabilistic graphical model • Good for modeling dependencies among variables |
Employed for its ability to model complex relationships and dependencies between features in medical data [44,45]. |
| Decision Tree | • Intuitive and easy to understand • Interpretability |
Selected for its simplicity and interpretability, making it useful for gaining insights into feature importance [46,47]. |
| NaiveBayes | • Simple and computationally efficient • Performs well with limited data |
Chosen for its efficiency in handling datasets with limited samples and has a short computational data training time [48,49]. |
| MLP (Multilayer Perceptron) | • Deep learning architecture • Can model complex non-linear relationships • Suitable for large datasets |
Adopted because of its deep architecture, which enables it to recognize complex connections and trends in the data [50,51]. |
3. Results and Discussion
As previously described, the evaluation of each model involves a 10-fold cross-validation (CV) of dataset samples, ensuring that there is no overlap between the training and test data. To assess the classification performance, precision, recall, accuracy, and F-measure were computed using the following metrics:
In this context, TP denotes a set of correctly identified test results, FP represents a set of test results incorrectly identified, TN signifies a set of correctly rejected test results, and FN stands for a set of test results incorrectly rejected. For this study, we computed and compared the results from a single ECG signal and a single PPG signal with the results obtained from the integration of both PPG and ECG signals for heart failure evaluation.
3.1. Result from Classification with Features Extracted from Single PPG Signal
The features extracted from the PPG signals were employed to compute the performance metrics using the various machine learning algorithms discussed in the previous section. PPG signals inherently capture dynamic alterations in blood volume and vascular attributes, thus providing distinctive insights into cardiovascular health from an alternative vantage point. The outcomes of this approach were highly promising, as evident below.
Figure 6.
Heart failure (HF) classification performance (Specificity, Sensitivity, accuracy, precision, AUC and F1-score) with features extracted from single PPG signal.
Figure 6.
Heart failure (HF) classification performance (Specificity, Sensitivity, accuracy, precision, AUC and F1-score) with features extracted from single PPG signal.
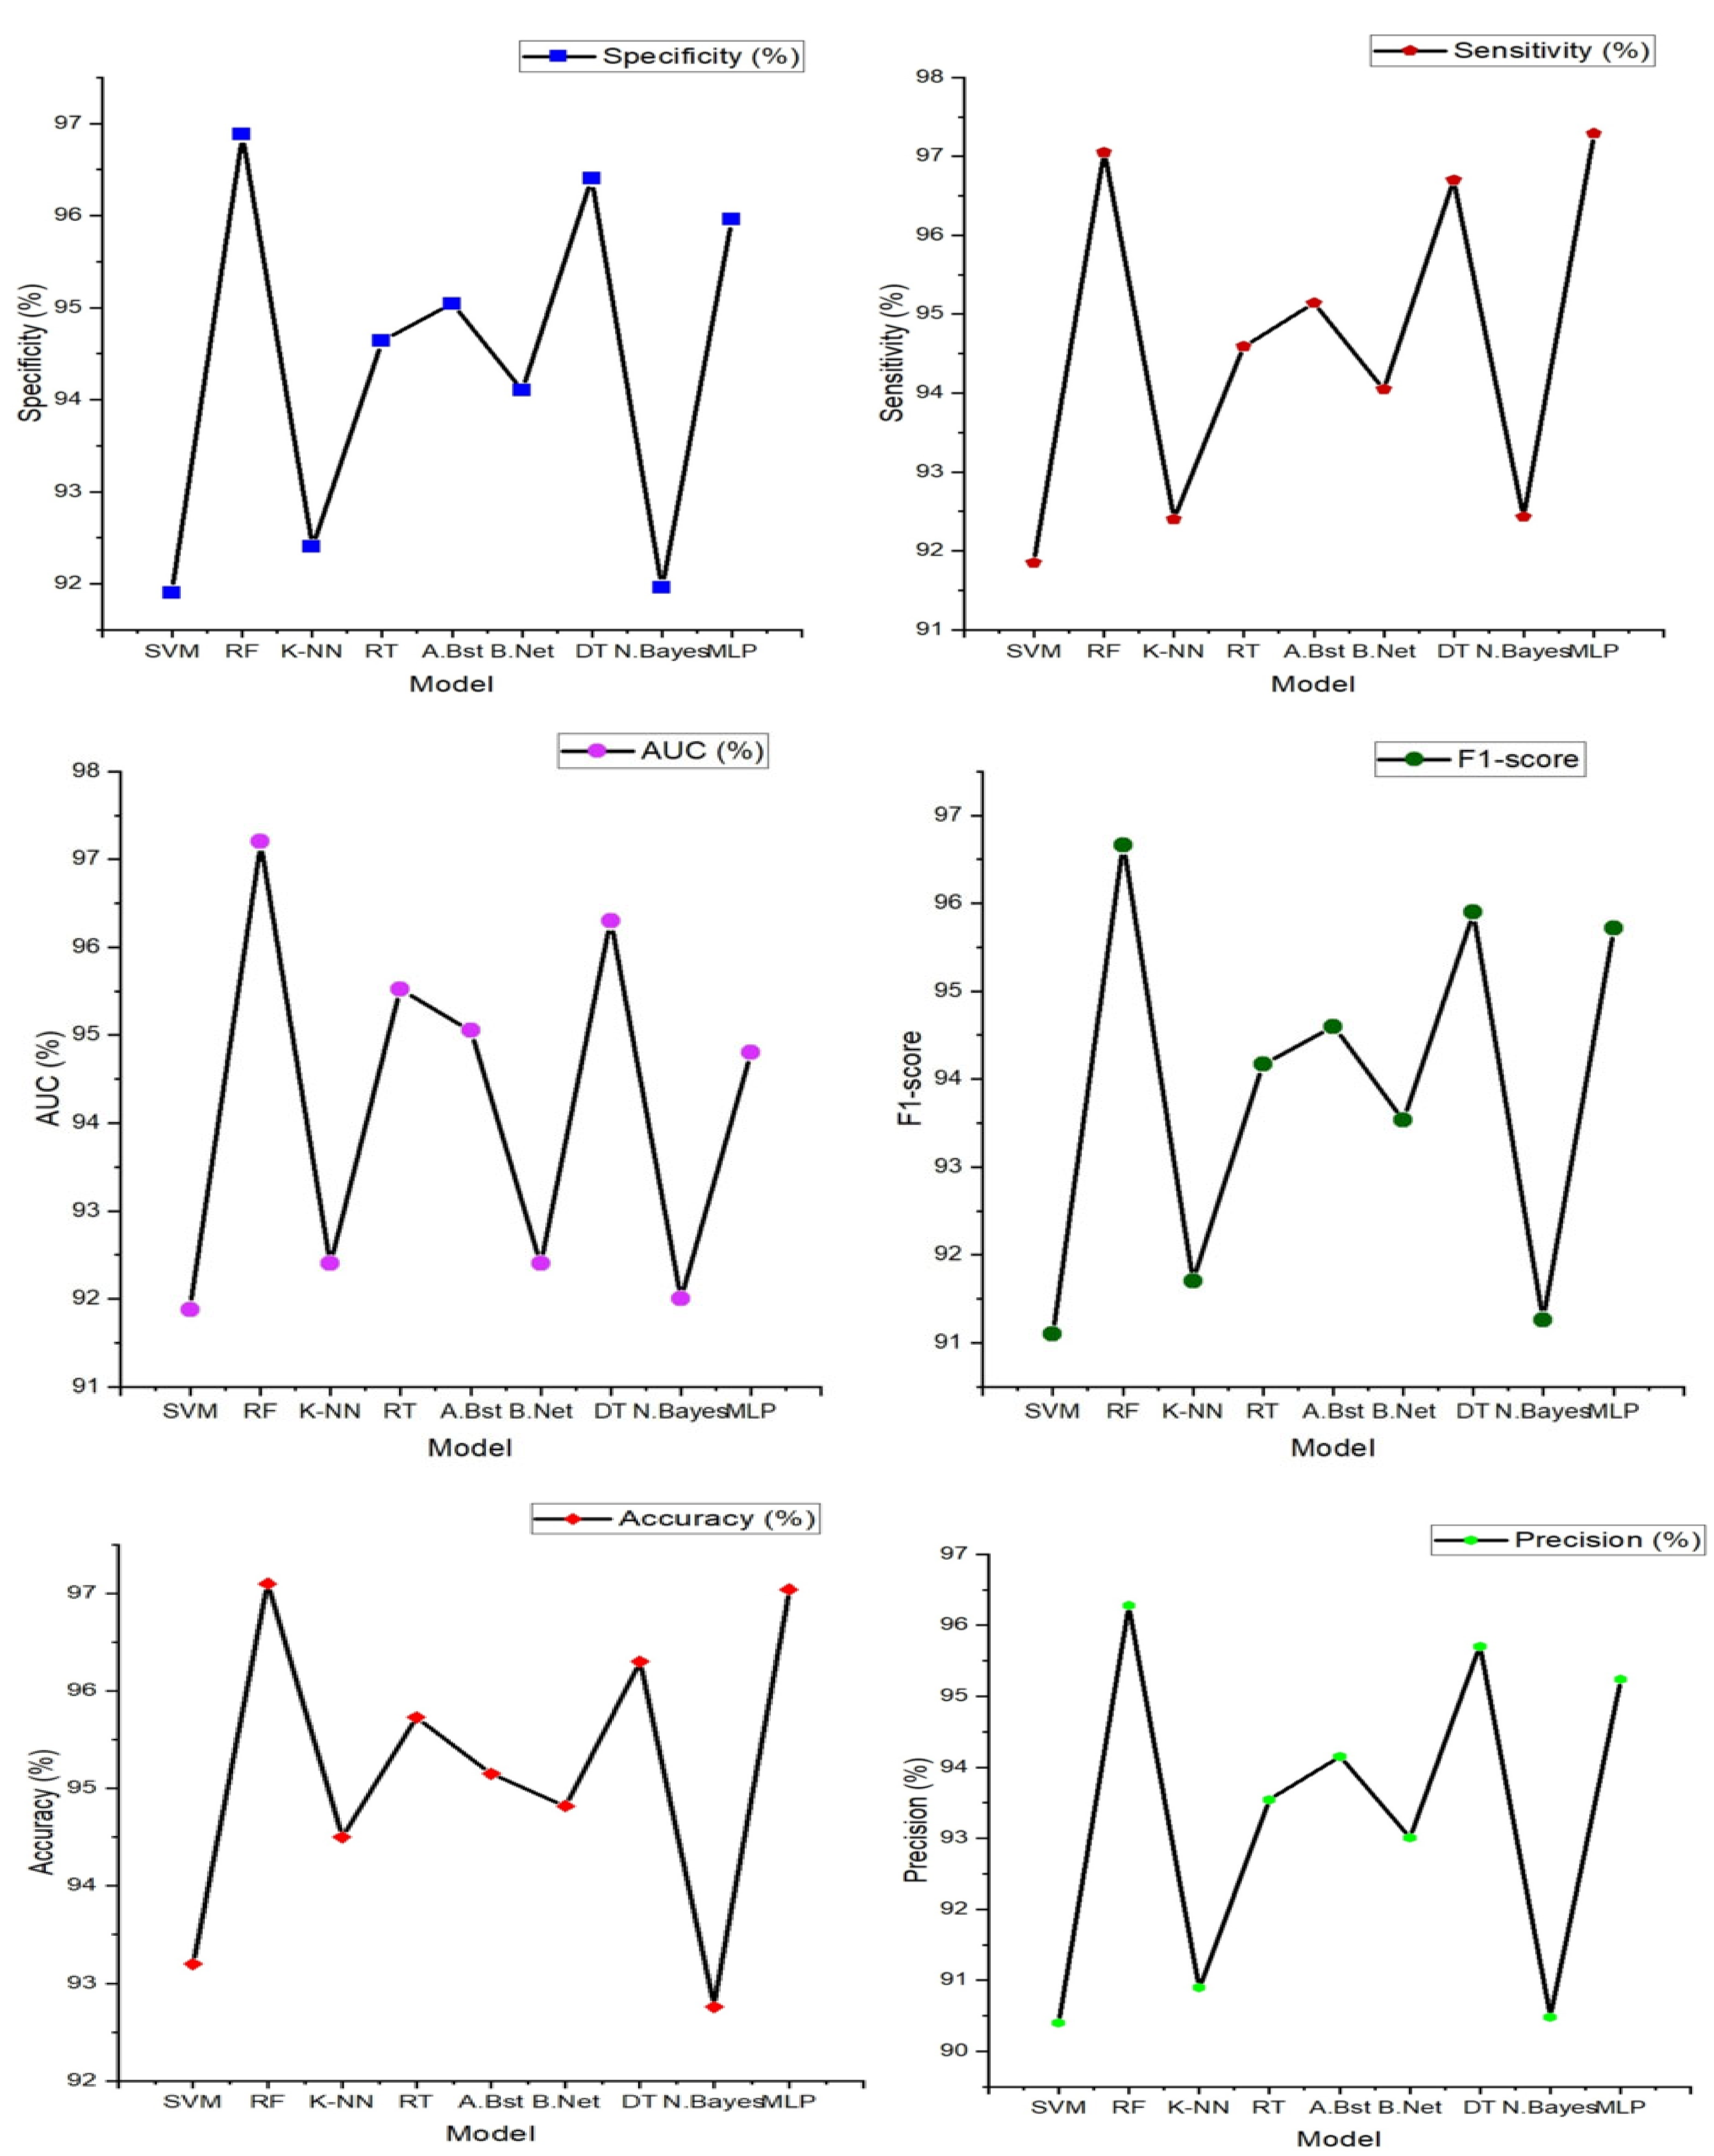
From the figure above, Random Forest stands out as the top performer with an impressive accuracy of 97.10%, sensitivity of 97.05%, specificity of 96.88%, precision of 96.28%, AUC value of 97.20% and F1-score of 96.66% indicating its strong ability to correctly classify individuals with and without heart failure. It also excels in sensitivity, specificity, precision, and AUC, demonstrating its comprehensive effectiveness in evaluating heart failure. While Random Forest takes the lead, it's worth noting that other models, such as Support Vector Machine (SVM), K-Nearest Neighbor, and Decision Tree, also deliver commendable performances with accuracies ranging from 93% to 96%. However, Random Forest consistently outperforms these alternatives in most performance metrics, reinforcing its position as the optimal choice for heart failure classification.
3.2. Result from Classification with Features Extracted from Single ECG Signal
The result presented in the figure below shows the various machine learning models' performance obtained from the classification of features extracted from a single ECG signal.
In Figure 7 (below), the findings prominently highlight the exceptional performance of the multi-layer perceptron (MLP), a feedforward artificial neural network characterized by its multiple layers of interconnected nodes. It showcases the highest accuracy at 96.40%, underscoring its impressive capability in accurately discerning individuals with and without heart failure. Furthermore, the MLP model excels across various evaluation metrics, including sensitivity (96.70%), specificity (96.00%), precision (95.30%), and F1-Score (95.60%). These results signify its comprehensive effectiveness in classifying heart failure cases with precision. Notably, other models such as K-nearest neighbor, AdaBoost, and Random tree also deliver commendable performances, achieving accuracies in the range of 84% to 92%. These models exhibit a balanced trade-off between sensitivity and specificity, demonstrating their ability to identify heart failure cases while keeping false positives at a minimum.
3.3. Result from classification of integrated features extracted from PPG and ECG signals.
Integrating ECG and PPG signals offers a significant advantage, as it harnesses the wealth of complementary information they provide. ECG, being a gold standard for assessing heart rate and rhythm irregularities, is adept at capturing electrical activity. On the other hand, PPG captures changes in blood volume and vascular characteristics, offering insights into cardiovascular health from a different perspective. By combining these signals, we amalgamate intricate details of the circulatory system, resulting in a more holistic evaluation that transcends the limitations of individual signals. The result obtained from the classification of the novel approach of combining these signals is represented below.
Table 5 (above) shows the comparison of these evaluation/performance metrics on the selected machine learning models. From displayed result, Support vector machine model outperforms other machine learning models. The evaluation/performance metrics; Accuracy, sensitivity, specificity, precision, AUC and F1-score obtained are 98%, 97.60%, 96.90%, 97.20%, 98.40%, and 97.70%. Figure 6 displays the radar plot of these performance metrics achieved in the various machine learning algorithms.
3.4. Comparison OF Results Obtained
Performance metrics obtained from this novel approach of the integration of the PPG and ECG signal was also tested and compared to the results gotten from the performance of PPG and ECG signals independently. Figure 6 and Figure 7 illustrate the performance results obtained from the classification performed on these signals independently.
In comparison with the performance result obtained from the integration of these features, it is evident that the integration of these signals for heart failure study provides a unique insights into cardiovascular health from an alternative vantage point.
Figure 8.
Classification performance (accuracy, precision, sensitivity, specificity, f1-score and AUC) of various machine learning algorithms on single signals and on integrated features from signals.
Figure 8.
Classification performance (accuracy, precision, sensitivity, specificity, f1-score and AUC) of various machine learning algorithms on single signals and on integrated features from signals.
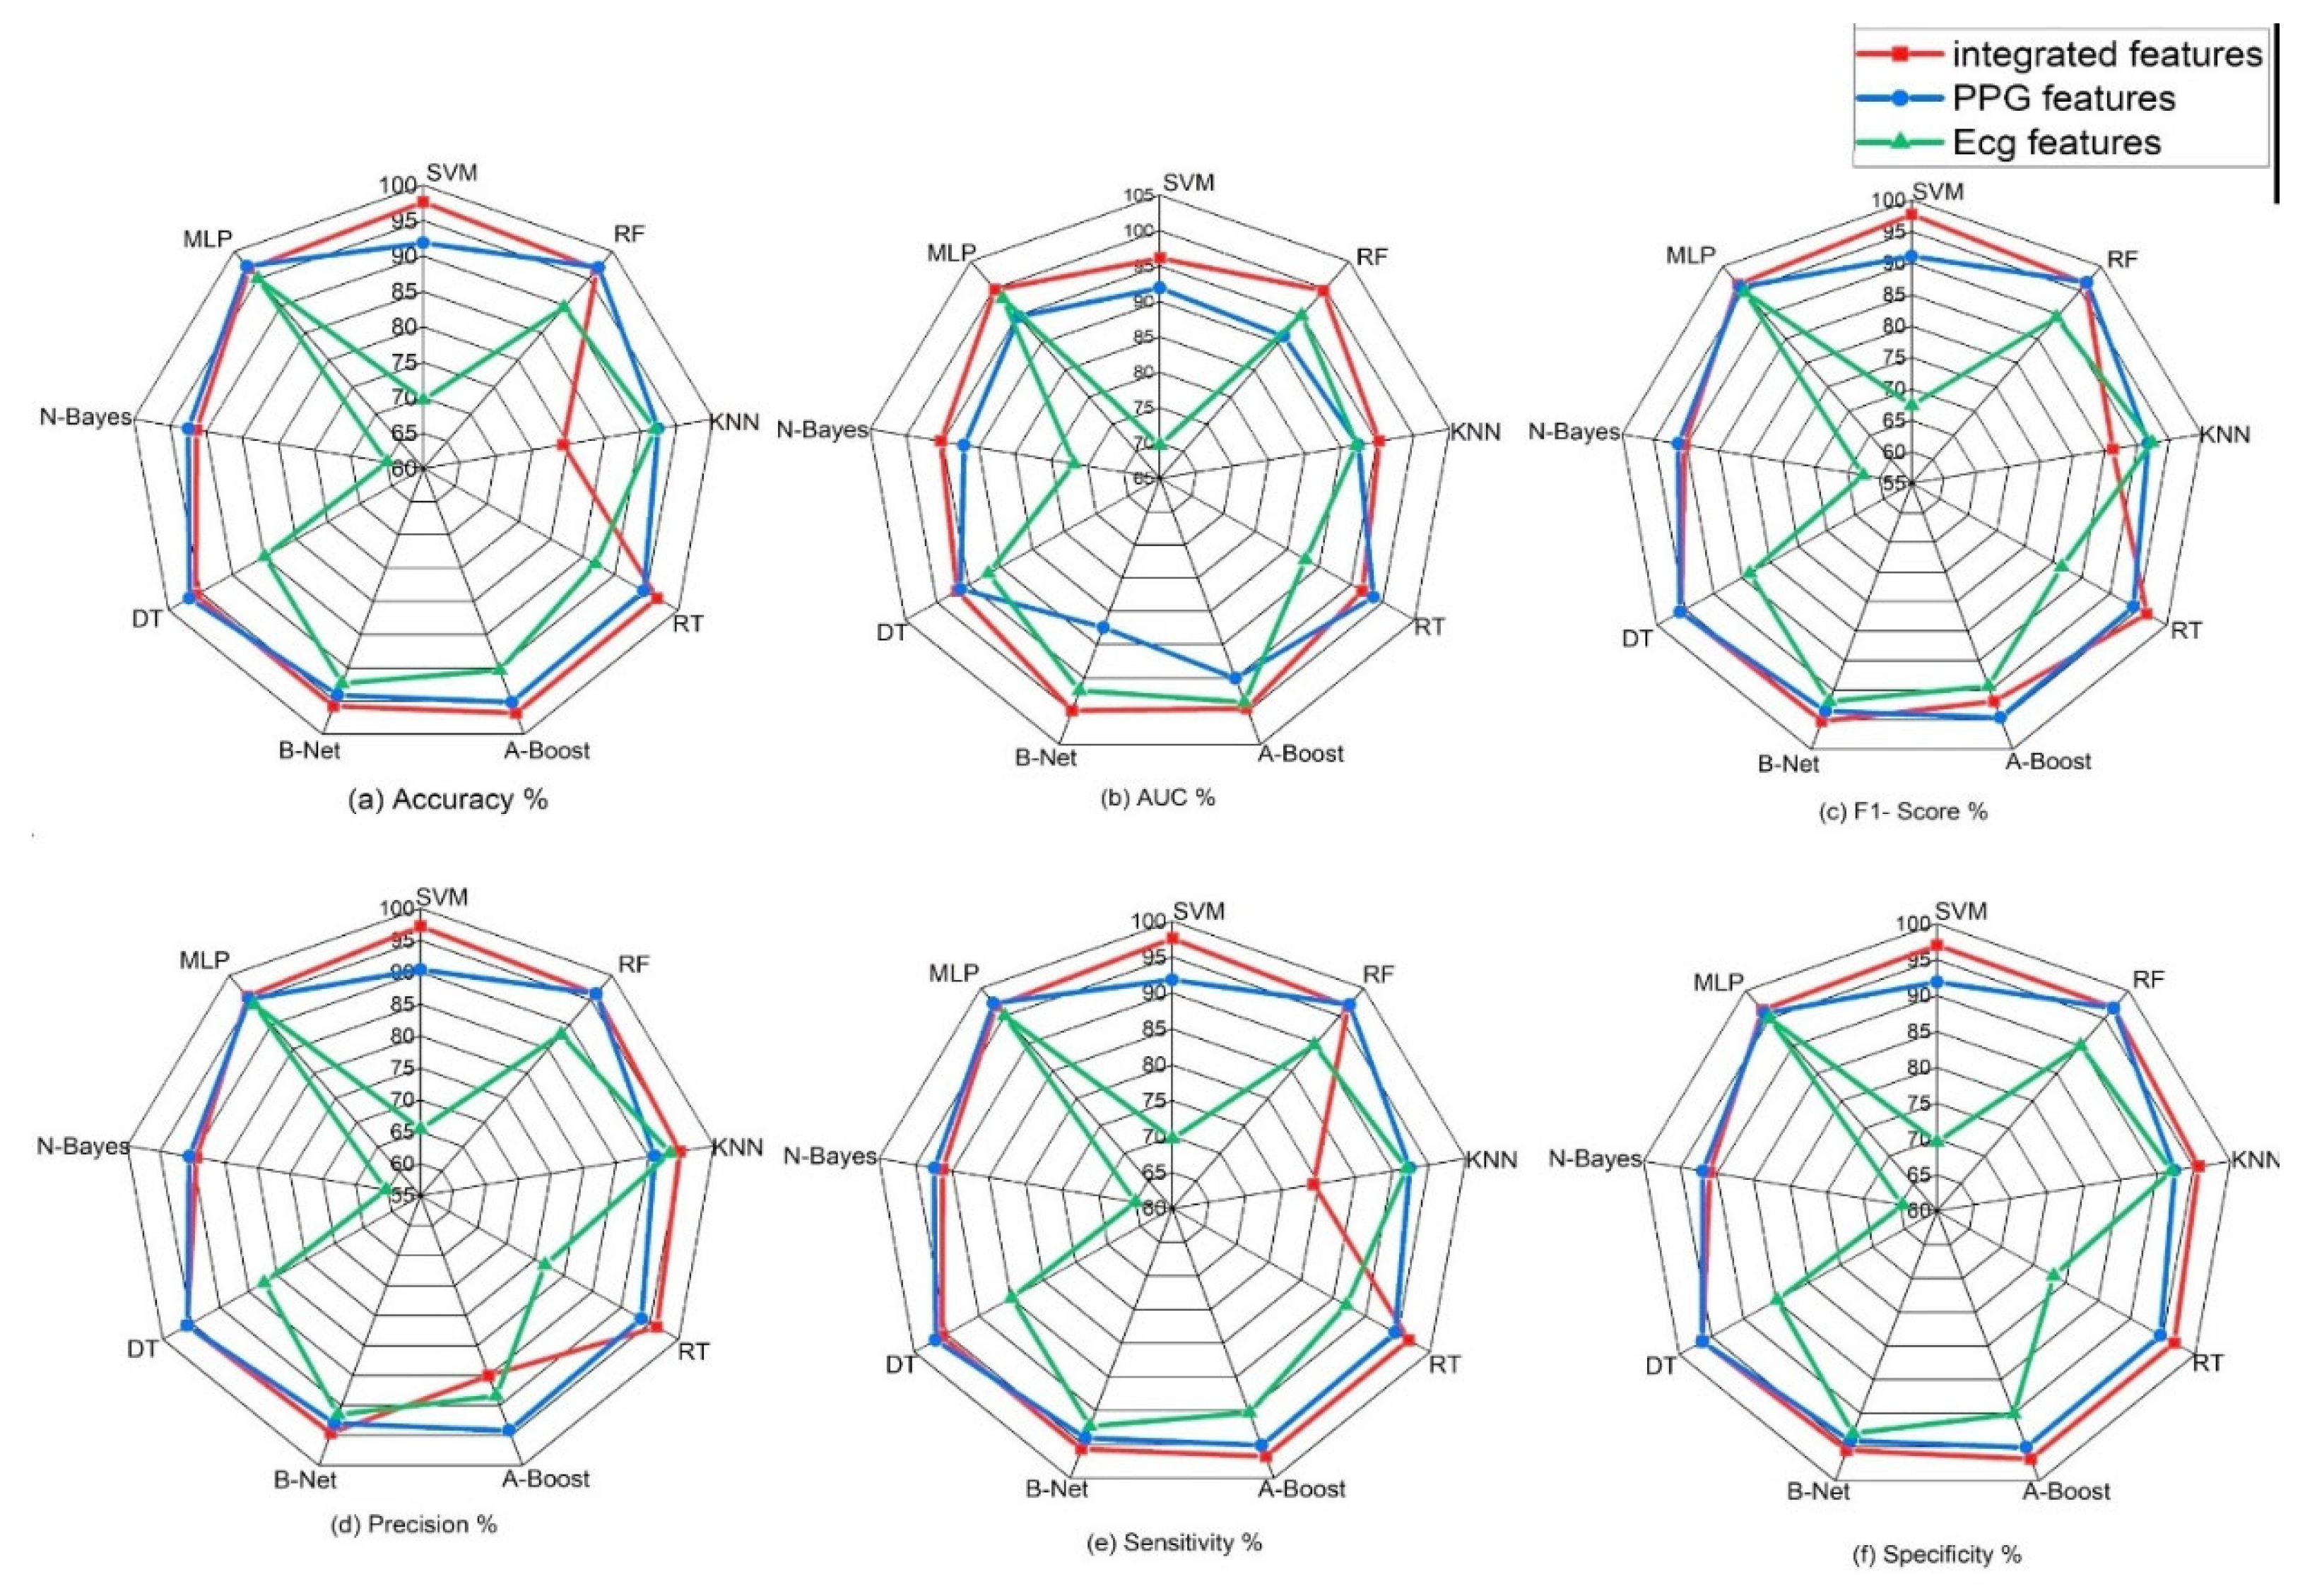
The table above and figure demonstrates the comparison between the results obtained from the analysis of the integration of PPG and ECG signals versus the results obtained from the ECG and PPG signals in isolation. When PPG data was considered in isolation, the Random Forest model emerged as the top performer, achieving an accuracy of 97.10%. This model demonstrated remarkable sensitivity, specificity, precision, and an F1-Score, all hovering around the 96-97% range. These metrics collectively indicated its strong potential for accurate heart failure classification.
In contrast, the ECG data was effectively evaluated using the MLP (Multilayer Perceptron) model, yielding an accuracy of 96.40%. While its accuracy was slightly lower than that of PPG, MLP exhibited a well-balanced trade-off between sensitivity and specificity, making it a valuable contender in heart failure assessment.
It can also be noted that the result obtained from using the PPG signal outperformed the result from using only the ECG signals, this can be attributed to some factors such as PPG signals being less susceptible to interference from electrical sources and electronic equipment compared to ECG, This characteristic ensures that PPG measurements remain reliable and consistent in various environments, this is particularly beneficial in settings where electrical interference may be present, allowing for dependable monitoring and accurate assessment of heart failure without external disruptions. Also, PPG excels in evaluating peripheral hemodynamics, offering valuable insights into blood circulation beyond the heart, it effectively measures changes in blood volume in peripheral blood vessels, shedding light on the efficiency of circulation and peripheral perfusion. Given that HF often affects peripheral blood flow, this capability is pivotal for understanding the broader cardiovascular dynamics associated with the condition. Also, in terms of motion tolerance, PPG's resilience to motion artifacts is a notable advantage, particularly for individuals with heart failure. Patients with HF may experience limited mobility or discomfort, and PPG's ability to maintain measurement accuracy even during subtle movements ensures that vital data can be reliably collected. This motion tolerance enables continuous monitoring without undue disruption, a crucial aspect in assessing HF patients' condition.
However, the most notable findings arose from the integration of both PPG and ECG signals, where the Random Forest model demonstrated exceptional performance. This integrated approach resulted across various evaluation metrics, including accuracy (98.00%) sensitivity (97.60%), specificity (96.90%), precision (97.20%), AUC (97.70%), and F1-Score (98.40%), suggesting that the combination of these signals significantly enhanced the model's capability for heart failure detection. Moreover, an outstanding AUC of 97.70%, indicates a superior ability to discern heart failure cases while minimizing false positives.
These outcomes highlight the potential of integrating PPG and ECG data for more accurate heart failure assessment. These results reveals superior performance compared to the use of these signals independently. Particularly, when assessed using the Random Forest model, the integrated approach exhibited exceptional accuracy and overall effectiveness, highlighting its potential significance in heart failure evaluation.
3.5. Comparison with Other Works
The performance of the proposed approach was also assessed in comparison to prior studies that independently employed ECG and PPG for various applications. Our findings indicate that the proposed method exhibited superior performance when contrasted with these studies, which separately utilized ECG and PPG modalities for their distinct analyses. The results of this comparative analysis are detailed in Table 6 below.
From the result below (Table 7), In comparison to previous ECG-focused studies, the current study achieved a high performance metrics ranging from 96.40%, 96.70%, 96.00%, 95.130% and 95.90%. Notably, the Multi-layer Perceptron (MLP) model in the current study outperformed the majority of previous ECG-based studies in terms of accuracy, sensitivity, Specificity, and precision.
For PPG analysis, the current study achieved high accuracy, Specificity, and Sensitivity, with values ranging from 96.88% to 97.10%. These results outperform several previous PPG-focused studies in terms of accuracy, sensitivity and specificity. The Random Forest (RF) model stood out with the highest accuracy.
The integration of PPG and ECG signals in the current study demonstrated promising results, with accuracy ranging from 91.20% to 98.00%. These results surpassed the majority of both ECG and PPG-focused studies, indicating that the combination of these signals provides a substantial benefit in heart failure assessment. The Random Forest (RF) model achieved the highest accuracy in this integrated approach, further emphasizing its effectiveness in comprehensive heart failure evaluation.
Table 7.
Comparison of Results obtained with existing Literature.
| Author | Dataset | Signal | Features extracted | Algorithm | Acc. (%) |
Sens. (%) |
Spec (%) |
Pre. (%) |
F1Score | ||
|---|---|---|---|---|---|---|---|---|---|---|---|
| Simge et al. [52] | UCI 300 |
ECG | Chol, trestbps, fbs, restecg, slope | Cubic SVM Linear SVM DT Ensemble |
52.3 67.3 67.7 67.0 |
- |
- |
- |
- |
||
| Ali et al. [53] | UCI | ECG | RestECG, Trestbps, Chol, fbs | KNN SVM NaïveBayes |
80 83 84 |
- |
75 77 80 |
80 82 83 |
- |
||
| Shouman et al [54] | CHDD | ECG | Chol, trestbps, fbs, restecg | GRDT NaïveBayes KNN |
79.1 83.5 83.2 |
75.6 78.0 76.7 |
81.6 80.8 85.1 |
- - - |
- - - |
||
| Tu et al. [55] | CI |
ECG |
Chol, trestbps, fbs, restecg | Bagging DT |
81.41 78.91 |
74.93 72.01 |
86.64 84.48 |
- - |
- - |
||
| Bashir et al. [56] | CHDD 303 |
ECG | Chol, trestbps, fbs, restecg | Ensemble NaïveBayes DT SVM |
81.82 78.79 76.57 86.67 |
73.68 68.49 63.58 73.68 |
92.86 92.86 71.24 79.51 |
- - - - |
82.17 73.61 71.51 65.10 |
||
| Pal et al. [13] | 50 | PPG | Crest-time, Augmentation index, pulse pressure, SA/DA | BT SVM KNN LR |
94 85 83 83 |
95 83 79 83 |
5 87 82 85 |
97 83 97 82 |
96 87 89 85 |
||
| Banerjee et al. [57] | MIMIC II 112 |
PPG | Systolic peak,NN-interval,HRV | SVM |
- |
82 |
88 |
- |
- |
||
| Paradhker et al. [58] | MIMIC II 55 |
PPG |
Augmentation index, stiffness index | SVM |
- |
85 |
78 |
- |
- |
||
| Current Study |
MIMIC III 1636 |
ECG | QRS interval, RR-Interval, HRV, Heart Rate, P-wave |
MLP |
96.40 |
96.70 |
96.00 |
95.30 |
95.90 |
||
|
PPG |
S.P, NN-interval, D.A, P.A, A.I |
RF |
97.10 |
97.05 |
96.88 |
91.20 |
96.66 |
||||
| Integration of PPG and ECG signal | SVM | 98.00 | 7.60 | 96.90 |
97.20 |
97.70 | |||||
Note: Acc.: Accuracy, Spec.: Specificity, Sens.: Sensitivity, Pre.: Precision, KNN.: K-nearest Neighbor, BT.: Boosted Tree, SVM: Support Vector Machine, MLP.: Multi-layer Perceptron, LR.: Logistic Regression, DT.: Decision Tree, RF.: Random Forest, RT.: Random Tree. GRDT.: Gain ratio decision tree, CHDD.: Cleveland Heart Disease Dataset. S.A; Systolic Pressure, D.P; Diastolic Pressure, P-to-P; peak to peak amplitude, P.P: Pulse Pressure.
4. Limitations of the Study
Despite its merits, the integration of PPG and ECG signals faces several limitations. The quality and availability of PPG and ECG data can vary, impacting the reliability of the approach. Technical expertise is required for implementing and interpreting this integrated approach, which may not be readily available in all healthcare settings. Access to the necessary equipment for data collection can be limited in certain healthcare facilities, particularly in resource-constrained settings. Additionally, PPG and ECG signals are sensitive to motion artifacts and environmental interference, which can affect data quality. The generalization of this approach to diverse populations and clinical settings may necessitate further validation. Moreover, the handling of patient data raises concerns about data privacy and security, and the associated costs of equipment and expertise need to be considered by healthcare facilities.
5. Clinical Application Prospect, Future Work and Conclusion
This study presents substantial clinical relevance, by combining the unique strengths of these non-invasive monitoring methods, healthcare providers can significantly enhance the accuracy and timeliness of heart failure diagnosis. The results obtained from our study demonstrate the significant potential benefits of integrating PPG and ECG signals for heart failure evaluation. With an impressive accuracy of 98%, sensitivity of 97.60%, specificity of 96.90%, and precision of 97.20%, the integrated approach outperforms the results obtained from individual ECG and PPG signals. These findings suggest that the integrated approach holds promise for early, precise, and non-invasive diagnosis of heart failure. The high sensitivity implies effective identification of individuals with heart failure, contributing to early intervention and improved patient outcomes. This non-invasive evaluation method not only enhances patient care through timely diagnosis but also has the potential to reduce healthcare costs by enabling more targeted interventions. Furthermore, the accurate classification of heart failure cases paves the way for personalized treatment strategies, tailoring medical interventions based on individual patient needs. Overall, our study provides compelling evidence supporting the potential benefits of integrating PPG and ECG signals for heart failure assessment, aligning with the envisioned advantages mentioned in the abstract.
Moreover, the non-invasive nature of PPG and ECG signals allows for telemedicine and remote monitoring, enhancing patient accessibility and addressing healthcare challenges in remote areas. It also has the potential to reduce healthcare costs by preventing advanced heart failure complications. Additionally, this integrated approach fosters ongoing research and development in cardiac healthcare, promising advanced diagnostic and monitoring tools. In summary, the integration of PPG and ECG signals has the potential to revolutionize heart failure diagnosis and management, offering early detection, personalized care, cost savings, and improved patient outcomes.
However, it is importance to note that the exploration of deep learning methods stands as a potential avenue for future research, balancing advancements with the unique demands of interpretability in medical applications. With the development of deep learning and other algorithms that need high computing power, it’s learning capacity to automatically learn intricate features from data could be advantageous, which not only enable the analysis process no longer to require a feature extraction with hand-crafted techniques, but also have great advantages in accuracy and robustness particularly given sufficient training data. However, we emphasize the importance of interpretability in the medical domain and the challenges associated with acquiring extensive labeled datasets.
Author Contributions
O.V and D.X contributed to the study's design and shared the responsibility for composing the initial draft of the manuscript. W.W and C.Y were actively engaged in the manuscript revision process, providing critical input, and giving their approval for the final version.
Funding
This work was supported in part by National Natural Science Foundation of China (82102178), in part by the Fundamental Research Funds for the Central Universities (ZYGX2021YGLH005), and in part by Sichuan Science and Technology Program (2021YFH0179). The work of Y. Chen was supported in part by Sichuan Science and Technology Program (2021JDRC0036), and in part by Incubation Program for Innovative Science and Technology of UESTC (Y03023206100209).
Informed Consent Statement
Not applicable.
Data Availability Statement
The authors do not have permission to share data.
Acknowledgments
In this section, you can acknowledge any support given which is not covered by the author contribution or funding sections. This may include administrative and technical support, or donations in kind (e.g., materials used for experiments).
Conflicts of Interest
The authors declare no conflicts of interest.
References
- Groenewegen, A.; Rutten, F.; Mosterd, A.; Hoes, A. Epidemiology of heart failure. European Journal of Heart Failure 2020, 22, 1342–1356. [Google Scholar] [CrossRef] [PubMed]
- An B, Shin J, Kim S, et al. Smart Sensor Systems for Wearable Electronic Devices. Polymers (Basel) 2017, 9, 1–41. [Google Scholar]
- Roger, Veronique L. Epidemiology of heart failure. Circulation Research 2013, 113, 646–659. [Google Scholar] [CrossRef]
- Go A, Mozaffarian D, Roger V, et al. American Heart Association Statistics Committee and Stroke Statistics Subcommittee. Heart disease and stroke statistics--2013 update: a report from the American Heart Association. Circulation 2013, 127, e6–e245. [Google Scholar]
- Yancy C, Jessup M, Bozkurt B, et al. Guideline for the management of heart failure. A report of the American College of Cardiology Foundation/American Heart Association Task Force on Practice Guidelines. Journal of the American College of Cardiology 2013, 62, e147–e239. [Google Scholar]
- Heart Failure by Maheedhar Gedela, MD; Muhammad Khan, MD; and Orvar Jonsson, MD. https://www.researchgate.net/publication/283899687.
- Pielmuş A, Osterland D, Klum, M, et al. Correlation of arterial blood pressure to synchronous piezo, impedance and photoplethysmographic signal features. Current Directions in Biomedical Engineering 2017, 3, 749–753. [Google Scholar] [CrossRef]
- Bruno R, Duranti E, Ippolito C, et al. Different Impact of Essential Hypertension on Structural and Functional Age-Related Vascular Changes. Hypertension 2017, 69, 71–78. [Google Scholar] [CrossRef]
- Allen, J. Photoplethysmography and its application in clinical physiological measurement. Physiol Measur 2007, 28, R1. Available online: http://stacks.iop.org/0967-3334/28/i=3/a=R01. [CrossRef]
- Banerjee R, Vempada R, Mandana K, et al. Identifying coronary artery disease from photoplethysmogram. ACM International Joint Conference 2016, 1084–1088. [Google Scholar] [CrossRef]
- Vo K, Kasaeyan N, Emad N, Amir J, et al., ECG waveform synthesis from PPG with conditional wasserstein generative adversarial networks. 2021, 1030-1036. [CrossRef]
- Paradkar, N.; Chowdhury, S. Coronary artery disease detection using photoplethysmography. Annual International Conference of the IEEE Engineering in Medicine and Biology Society. IEEE Engineering in Medicine and Biology Society. Annual International Conference. 2017, 2017, 100–103. [Google Scholar] [CrossRef]
- Pal P, Ghosh S, Chattopadhyay B, et al. Screening of Ischemic Heart Disease based on PPG Signals using Machine Learning Techniques [C]. 42nd Annual International Conference of the IEEE Engineering in Medicine & Biology Society (EMBC), Montreal, QC, Canada. 2020, 2020, 5980–5983. [CrossRef]
- Bashir, S.; Usman, Q.; Farhan, H. A Multicriteria Weighted Vote Based Classifier Ensemble for Heart Disease Prediction. Computational Intelligence 2016, 32, 615–645. [Google Scholar] [CrossRef]
- Tian, X.; Zhu, Q.; Li, Y.; Wu, M. Cross-Domain Joint Dictionary Learning for ECG Reconstruction from PPG.2020. 936-940. [CrossRef]
- Chen A, Huang S, Hong P, Cheng C, Lin E. HDPS: heart disease prediction system. In Computing in Cardiology. IEEE: Hangzhou, 2022. pp. 557–560.
- Kamath, C. A new approach to detect congestive heart failure using detrended fluctuation analysis of electrocardiogram signals. J Eng Sci Technol 2015, 10, 145–59. [Google Scholar] [CrossRef]
- Moody B, Moody G, Villarroel M, Clifford G, Silva I. MIMIC-III Waveform Database (version 1.0). PhysioNet, 2020. [CrossRef]
- https://www.mathworks.com/discovery/feature-extraction. 2: (Accessed, 5 February 2024.
- Task Force of the European Society of Cardiology and the North American Society of Pacing and Electrophysiology. Heart rate variability: Standards of measurement, physiological interpretation and clinical use. Circulation 1996, 93, 1043–1065. [Google Scholar] [CrossRef]
- Xu H, Li J, Zhong G, et al. Characteristics of the Dynamic Electrocardiogram in the Elderly with Nonvalvular Atrial Fibrillation Combined with Long R-R Intervals. Evidence Based Complement Alternate Medicine 2021, 2021, 4485618. [Google Scholar] [CrossRef]
- Woodward M, Webster R, Murakami Y, et al. The association between resting heart rate, cardiovascular disease and mortality: evidence from 112,680 men and women in 12 cohorts. European Journal of Preventive Cardiology 2014, 21, 719–726. [Google Scholar] [CrossRef]
- Kira, K.; Rendell, L. The feature selection problem: Traditional methods and a new algorithm. In: AAAI, 1992, 129‐134. [CrossRef]
- Kira, K.; Rendell, L. A practical approach to feature selection. In: Proceedings of the ninth international workshop on machine learning (ML92) 1992, 249-256.
- Urbanowicz, R.; Meeker, M.; Cava, W.; Olson, R.; Moore, J. Relief-based feature selection: Introduction and review. Journal of Biomedical Informatics 2018, 85, 189–203. [Google Scholar] [CrossRef]
- Kononenko, I. Estimating attributes: Analysis and extensions of RELIEF. European Conference on Machine Learning 1994, 784, 171–182. [Google Scholar] [CrossRef]
- Witten, I.; Frank, E. Data Mining: Practical machine learning tools and techniques, 2nd Edition, Morgan Kaufmann, San Francisco, 2005.
- Leo Breiman. Random forests. Machine learning 2001, 45, 5–32. [Google Scholar] [CrossRef]
- Liaw, A.; Wiener, M. Classification and regression by random Forest. R News 2001, 2, 18–22. [Google Scholar]
- Freund, Y.; Schapire, R. Experiments with a new boosting algorithm. In ICML, 1996, 2, 148–156. [Google Scholar]
- Freund Y, Schapire R, Abe N. A short introduction to boosting. Journal of Japan Soceity for Artificial Intelligence 1999, 14, 1612. [Google Scholar]
- Corinna, C.; Vapnik, V. Support-vector networks. Journal of Machine Learning 1995, 20, 273–297. [Google Scholar]
- Kurt H, Maxwell S, Halbert White. Multilayer feedforward networks are universal approximators. Neural networks 1989, 2, 359–366. [Google Scholar] [CrossRef]
- Bishop, C. Neural networks for pattern recognition. Oxford university press 1995, 1, 145–164. [Google Scholar]
- Goodfellow I, Bengio Y, Courville A, Bengio Y. Deep learning. MIT Press Cambridge 2016, 8, 170–224. [Google Scholar]
- Yinglin, X. Correlation and association analyses in microbiome study integrating multiomics in health and disease, Editor(s): Jun Sun, Progress in Molecular Biology and Translational Science, Academic Press 2016, (171): 309 – 491. [CrossRef]
- Bhavsar, H.; Ganatra, A. Comparative Study of Training Algorithms for Supervised Machine Learning. International Journal of Soft Computing and Engineering 2012, 2, 2231–2307. [Google Scholar]
- An, Q.; Rahman, S.; Zhou, J.; Kang, J. A Comprehensive Review on Machine Learning in Healthcare Industry: Classification, Restrictions, Opportunities and Challenges. Sensors. 2023, 23, 4178. [Google Scholar] [CrossRef]
- Duneja, A.; Puyalnithi, T. Enhancing classification accuracy of k-nearest neighbors algorithm using gain ratio. Int. Res. J. Eng. Technol 2017, 4, 1385–1388. [Google Scholar]
- Shouman, M.; Turner, T.; Stocker, R. Applying k-nearest neighbour in diagnosing heart disease patients. Int. J. Inf. Educ. Technol. 2012, 2, 220–223. [Google Scholar] [CrossRef]
- Kulkarni, V.; Sinha, P. Efficient Learning of Random Forest Classifier using Disjoint Partitioning Approach. Proceedings of the World Congress on Engineering 2013, 20132, 1–5. [Google Scholar]
- Ying, Mi. Imbalanced Classification Based on Active Learning SMOTE, Research Journal of Applied Sciences, Engineering and Technology 2013, 5, 944-949.
- More, A.; Rana, S.; Dipti, P. Review of random forest classification techniques to resolve data imbalance. 72–78. [CrossRef]
- Friedman N, Geiger D, Goldszmidt Moises. Bayesian Network Classifiers. Machine Learning 2003, 29, 131–163. [Google Scholar] [CrossRef]
- Uusitalo Laura. Advantages and challenges of Bayesian networks in environmental modeling. Ecological Modelling 2006, 203, 312–318. [Google Scholar] [CrossRef]
- Song, Y.; Lu, Y. Decision tree methods: applications for classification and prediction. Shanghai archives of psychiatry 2015, 27, 130–135. [Google Scholar] [CrossRef] [PubMed]
- Vijay, K.; Bala, D. Data Science (Second Edition), Morgan Kaufmann 2019, Pages 65-163, ISBN 9780128147610. [CrossRef]
- De S, Gilberto F, et al. Engineering Systemsʹ Fault Diagnosis Methods. Reliability Analysis and Asset Management of Engineering Systems. 2021; 165-187, Accessed 16 Dec. 2023. [CrossRef]
- Dulhare, U. Prediction system for heart disease using Naive Bayes and particle swarm optimization. Biomed. Res. 2018, 29, 2646–2649. [Google Scholar] [CrossRef]
- Akkaya B, Çolakoğlu N Comparison of Multi-class Classification Algorithms on Early Diagnosis of Heart Diseases. 2019, 3, 261 -311.
- Bikku, T. Multi-layered deep learning perceptron approach for health risk prediction. J Big Data 2020, 7, 50. [Google Scholar] [CrossRef]
- Ekiz, S.; Pakize, E. Comparative study of heart disease classification. 2017 Electric Electronics, Computer Science, Biomedical Engineerings' Meeting (EBBT) (2017): 1 N/A4.
- Nassif, A.; Mahdi, O.; Nasir, Q.; Talib, M.; Azzeh, M. Machine learning classifications of coronary artery disease. In Proceedings of the 2018 International Joint Symposium on Artificial Intelligence and Natural Language Processing (iSAI N/ANLP), Pattaya, Thailand, 15–18 November 2018; IEEE: New York, NY, USA. pp. 1–6. [Google Scholar]
- Shouman, M.; Turner, T.; Stocker, R. Integrating Naive Bayes and K-means clustering with different initial centroid selection methods in the diagnosis of heart disease patients. Computer Science and Information Technology.
- Chau, T.; Dongil, S.; Dongkyoo, S. Effective Diagnosis of Heart Disease through Bagging Approach. IEEE 2nd International Conference on Biomedical Engineering and Informatics - Tianjin, China 2009, 10, 1–4. [Google Scholar] [CrossRef]
- Bashir S, et al. A Multicriteria Weighted Vote N/ABased Classifier Ensemble for Heart Disease Prediction. Computational Intelligence 2016, 32, 615. [Google Scholar] [CrossRef]
- Banerjee, R.; Vempada, R.; Mandana, K.; Choudhury, A.; Dutta, P. Identifying coronary artery disease from photoplethysmogram. Proceedings of the 2016 ACM International Joint Conference on Pervasive and Ubiquitous Computing Adjunct 1084–1088. 1084–1088. [CrossRef]
- Paradkar, N.; Chowdhury, S. Coronary artery disease detection using photoplethysmography. Annual International Conference of the IEEE Engineering in Medicine and Biology Society. IEEE Engineering in Medicine and Biology Society. Annual International Conference, 2017; 2017, 100–103. [Google Scholar] [CrossRef]
Figure 1.
An ECG signal along with its corresponding PPG signal.
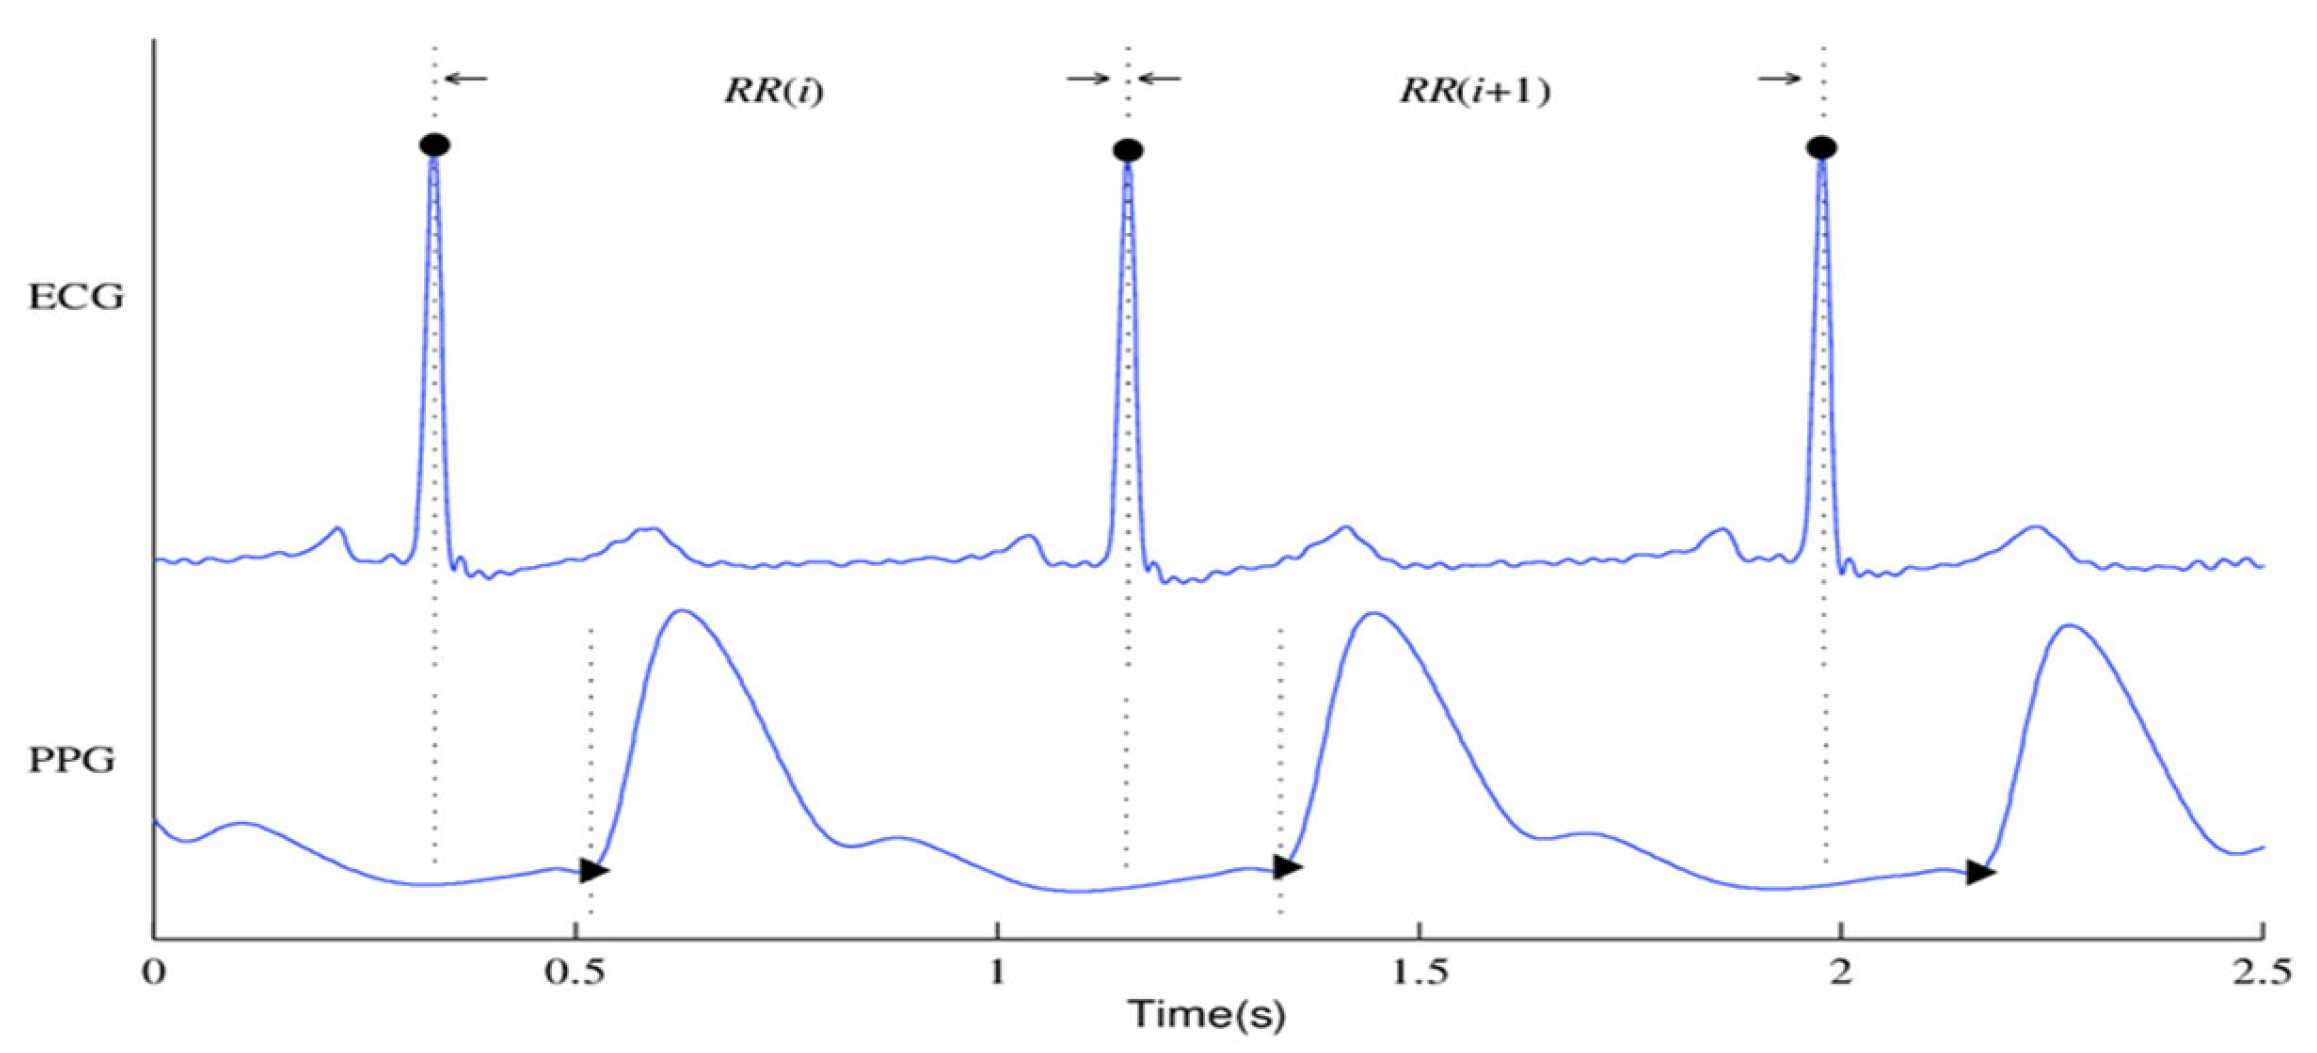
Figure 2.
General Framework/Architecture of the Proposed Study.
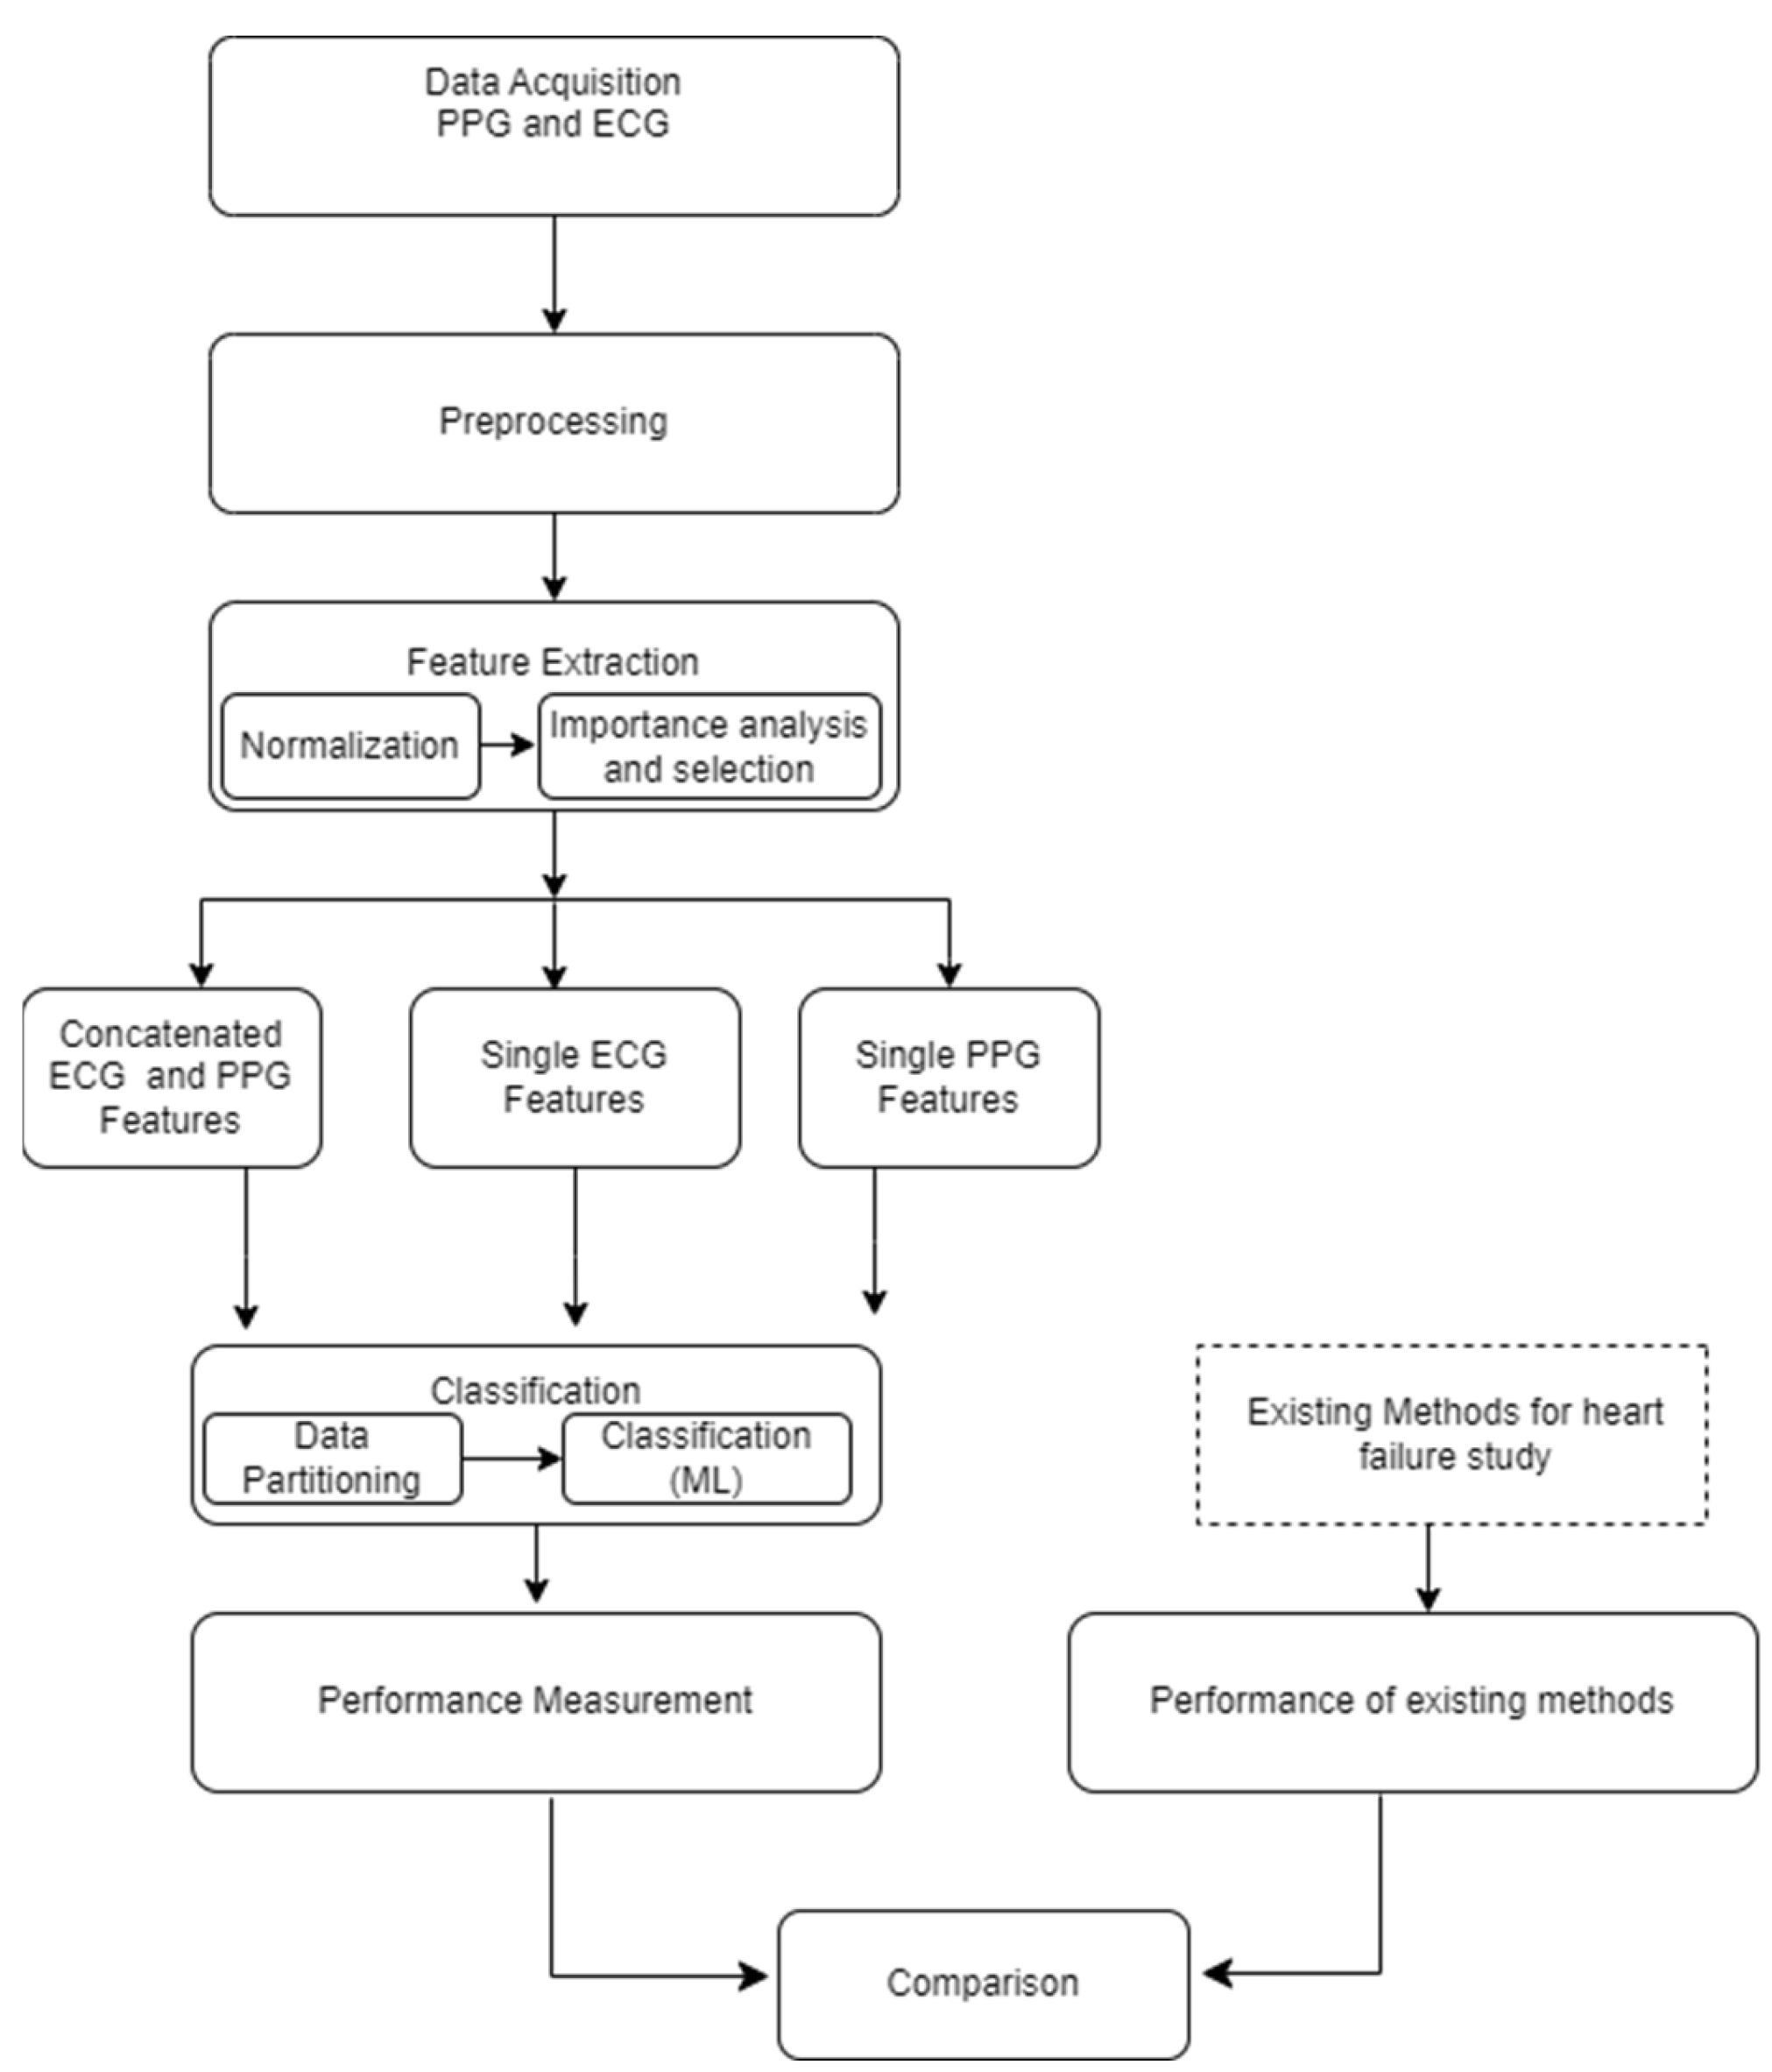
Figure 1.
Visual representation of the extracted features: (a) Visual representation of features extracted from a single ECG signal; (b) Visual representation of features extracted from a single PPG signal.
Figure 1.
Visual representation of the extracted features: (a) Visual representation of features extracted from a single ECG signal; (b) Visual representation of features extracted from a single PPG signal.
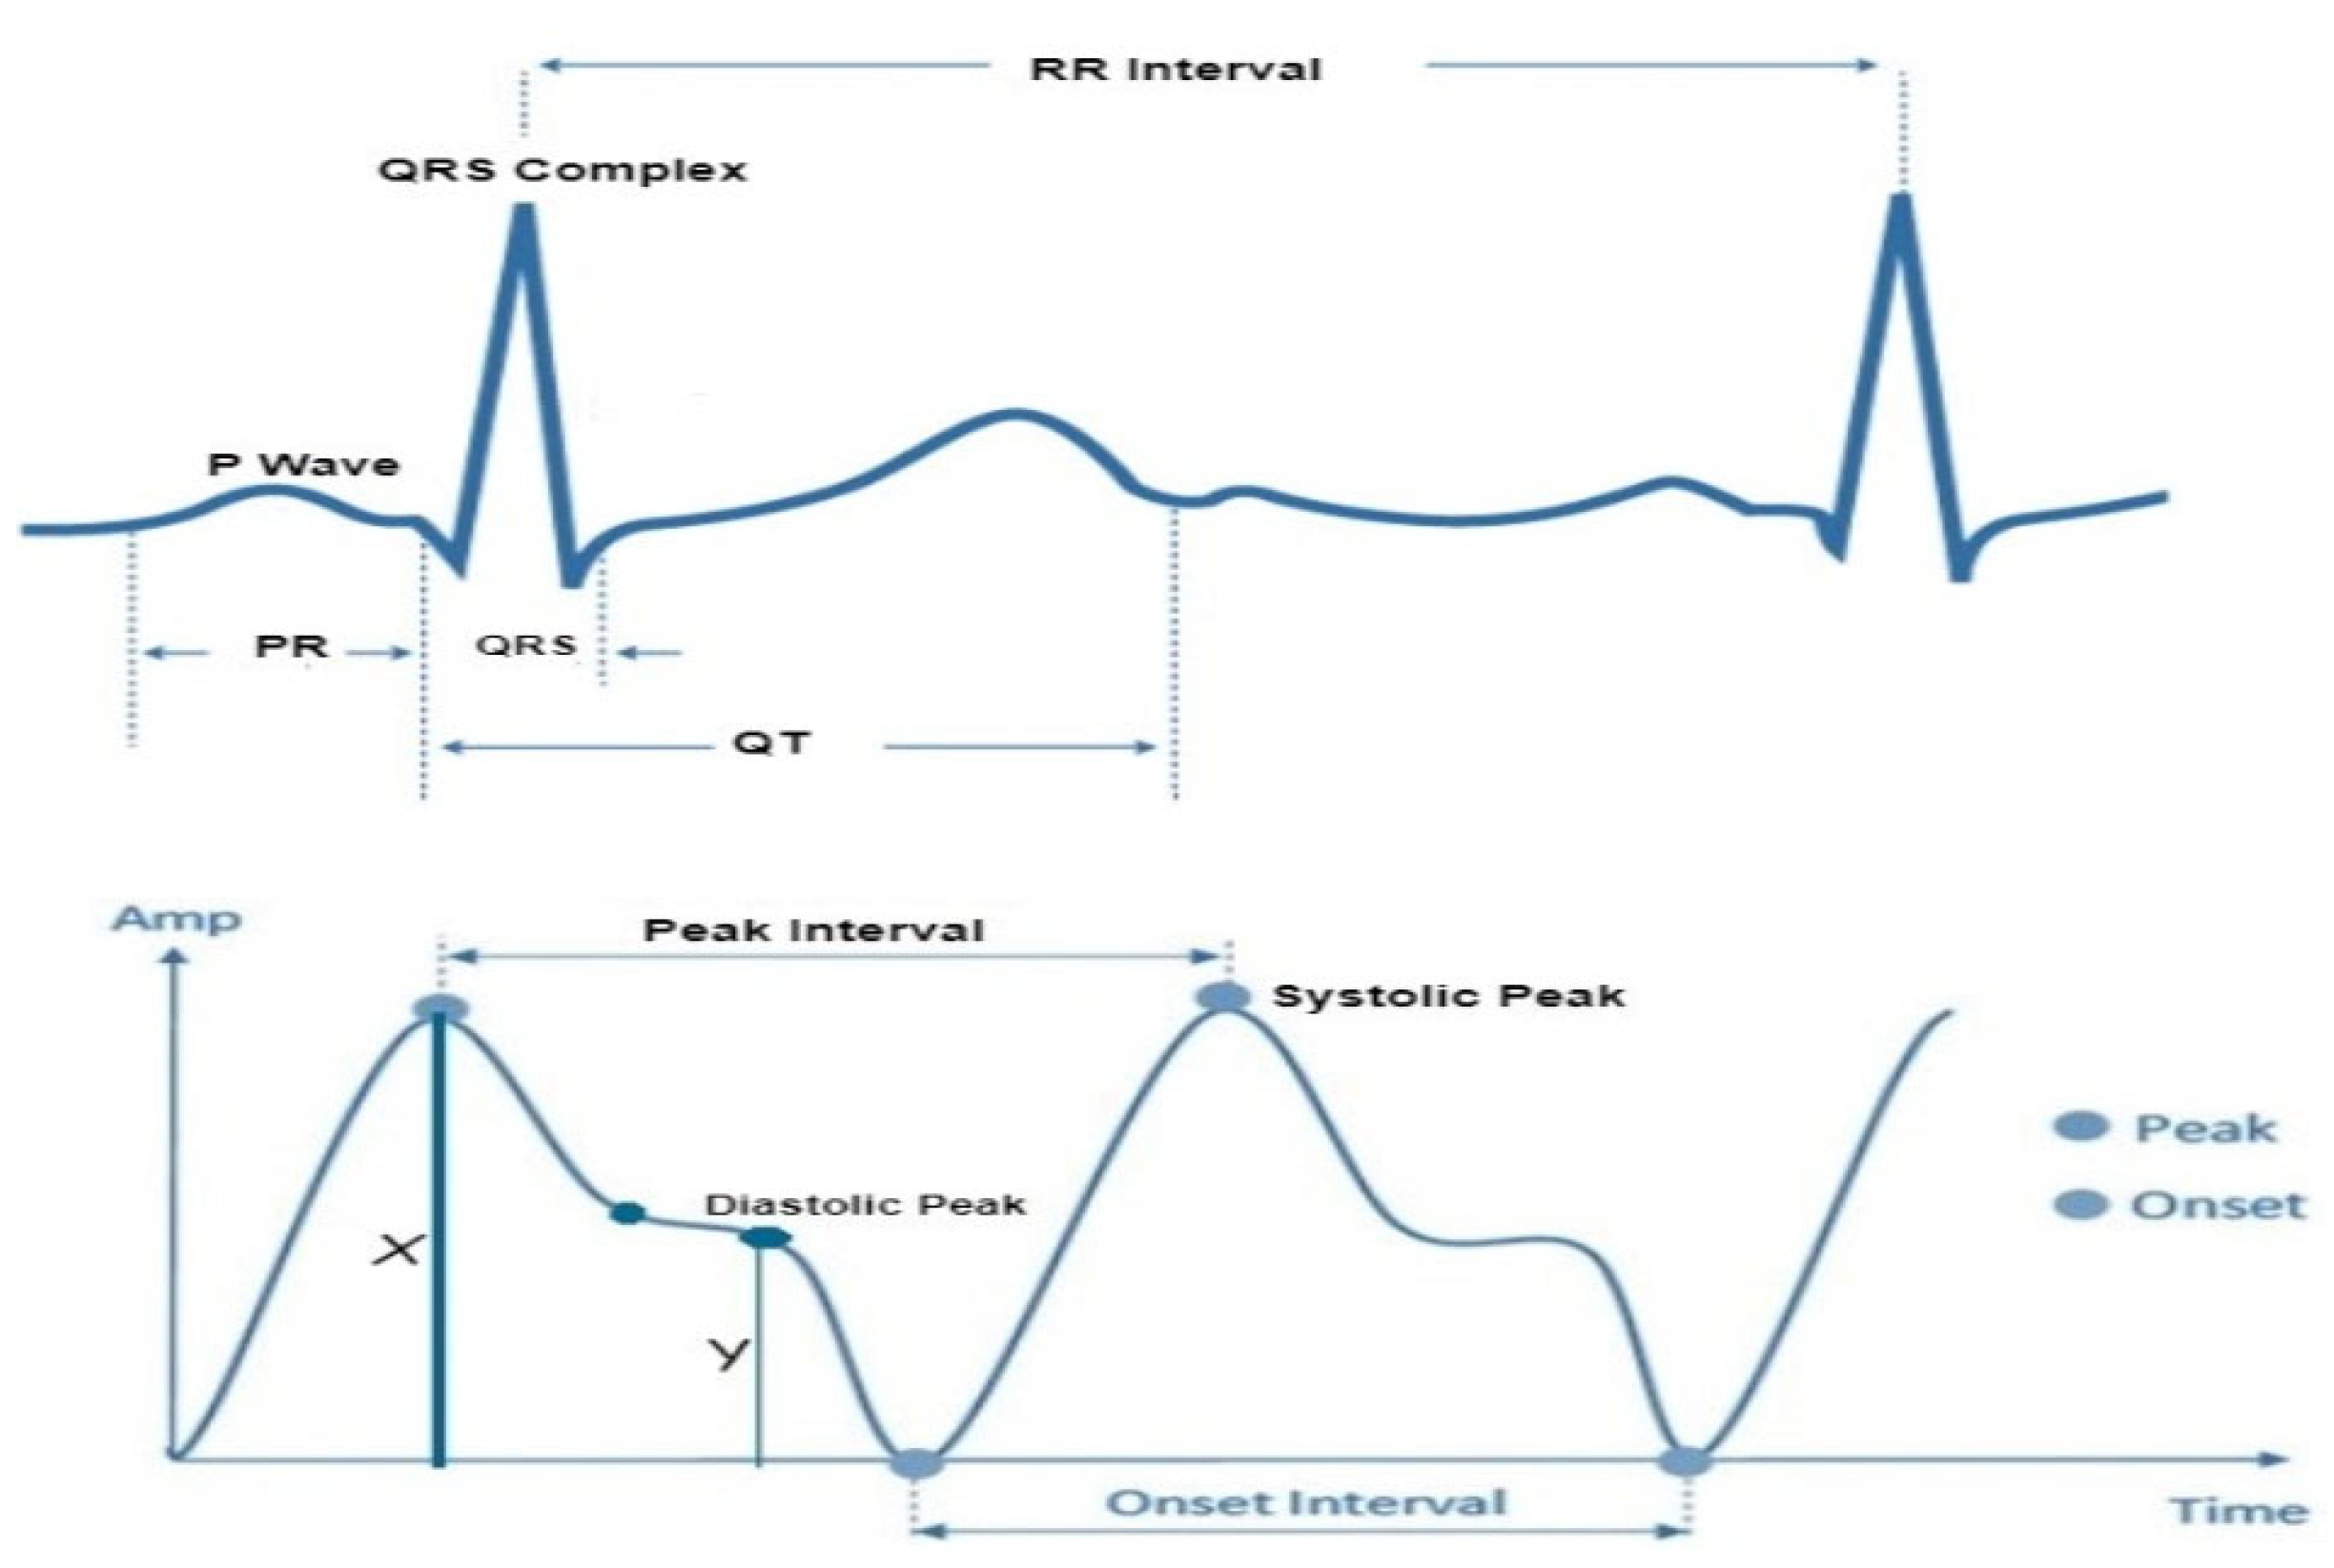
Figure 7.
Classification performance (Specificity, Sensitivity, accuracy, precision, AUC and F1-socre) with features extracted from single ECG signal.
Figure 7.
Classification performance (Specificity, Sensitivity, accuracy, precision, AUC and F1-socre) with features extracted from single ECG signal.
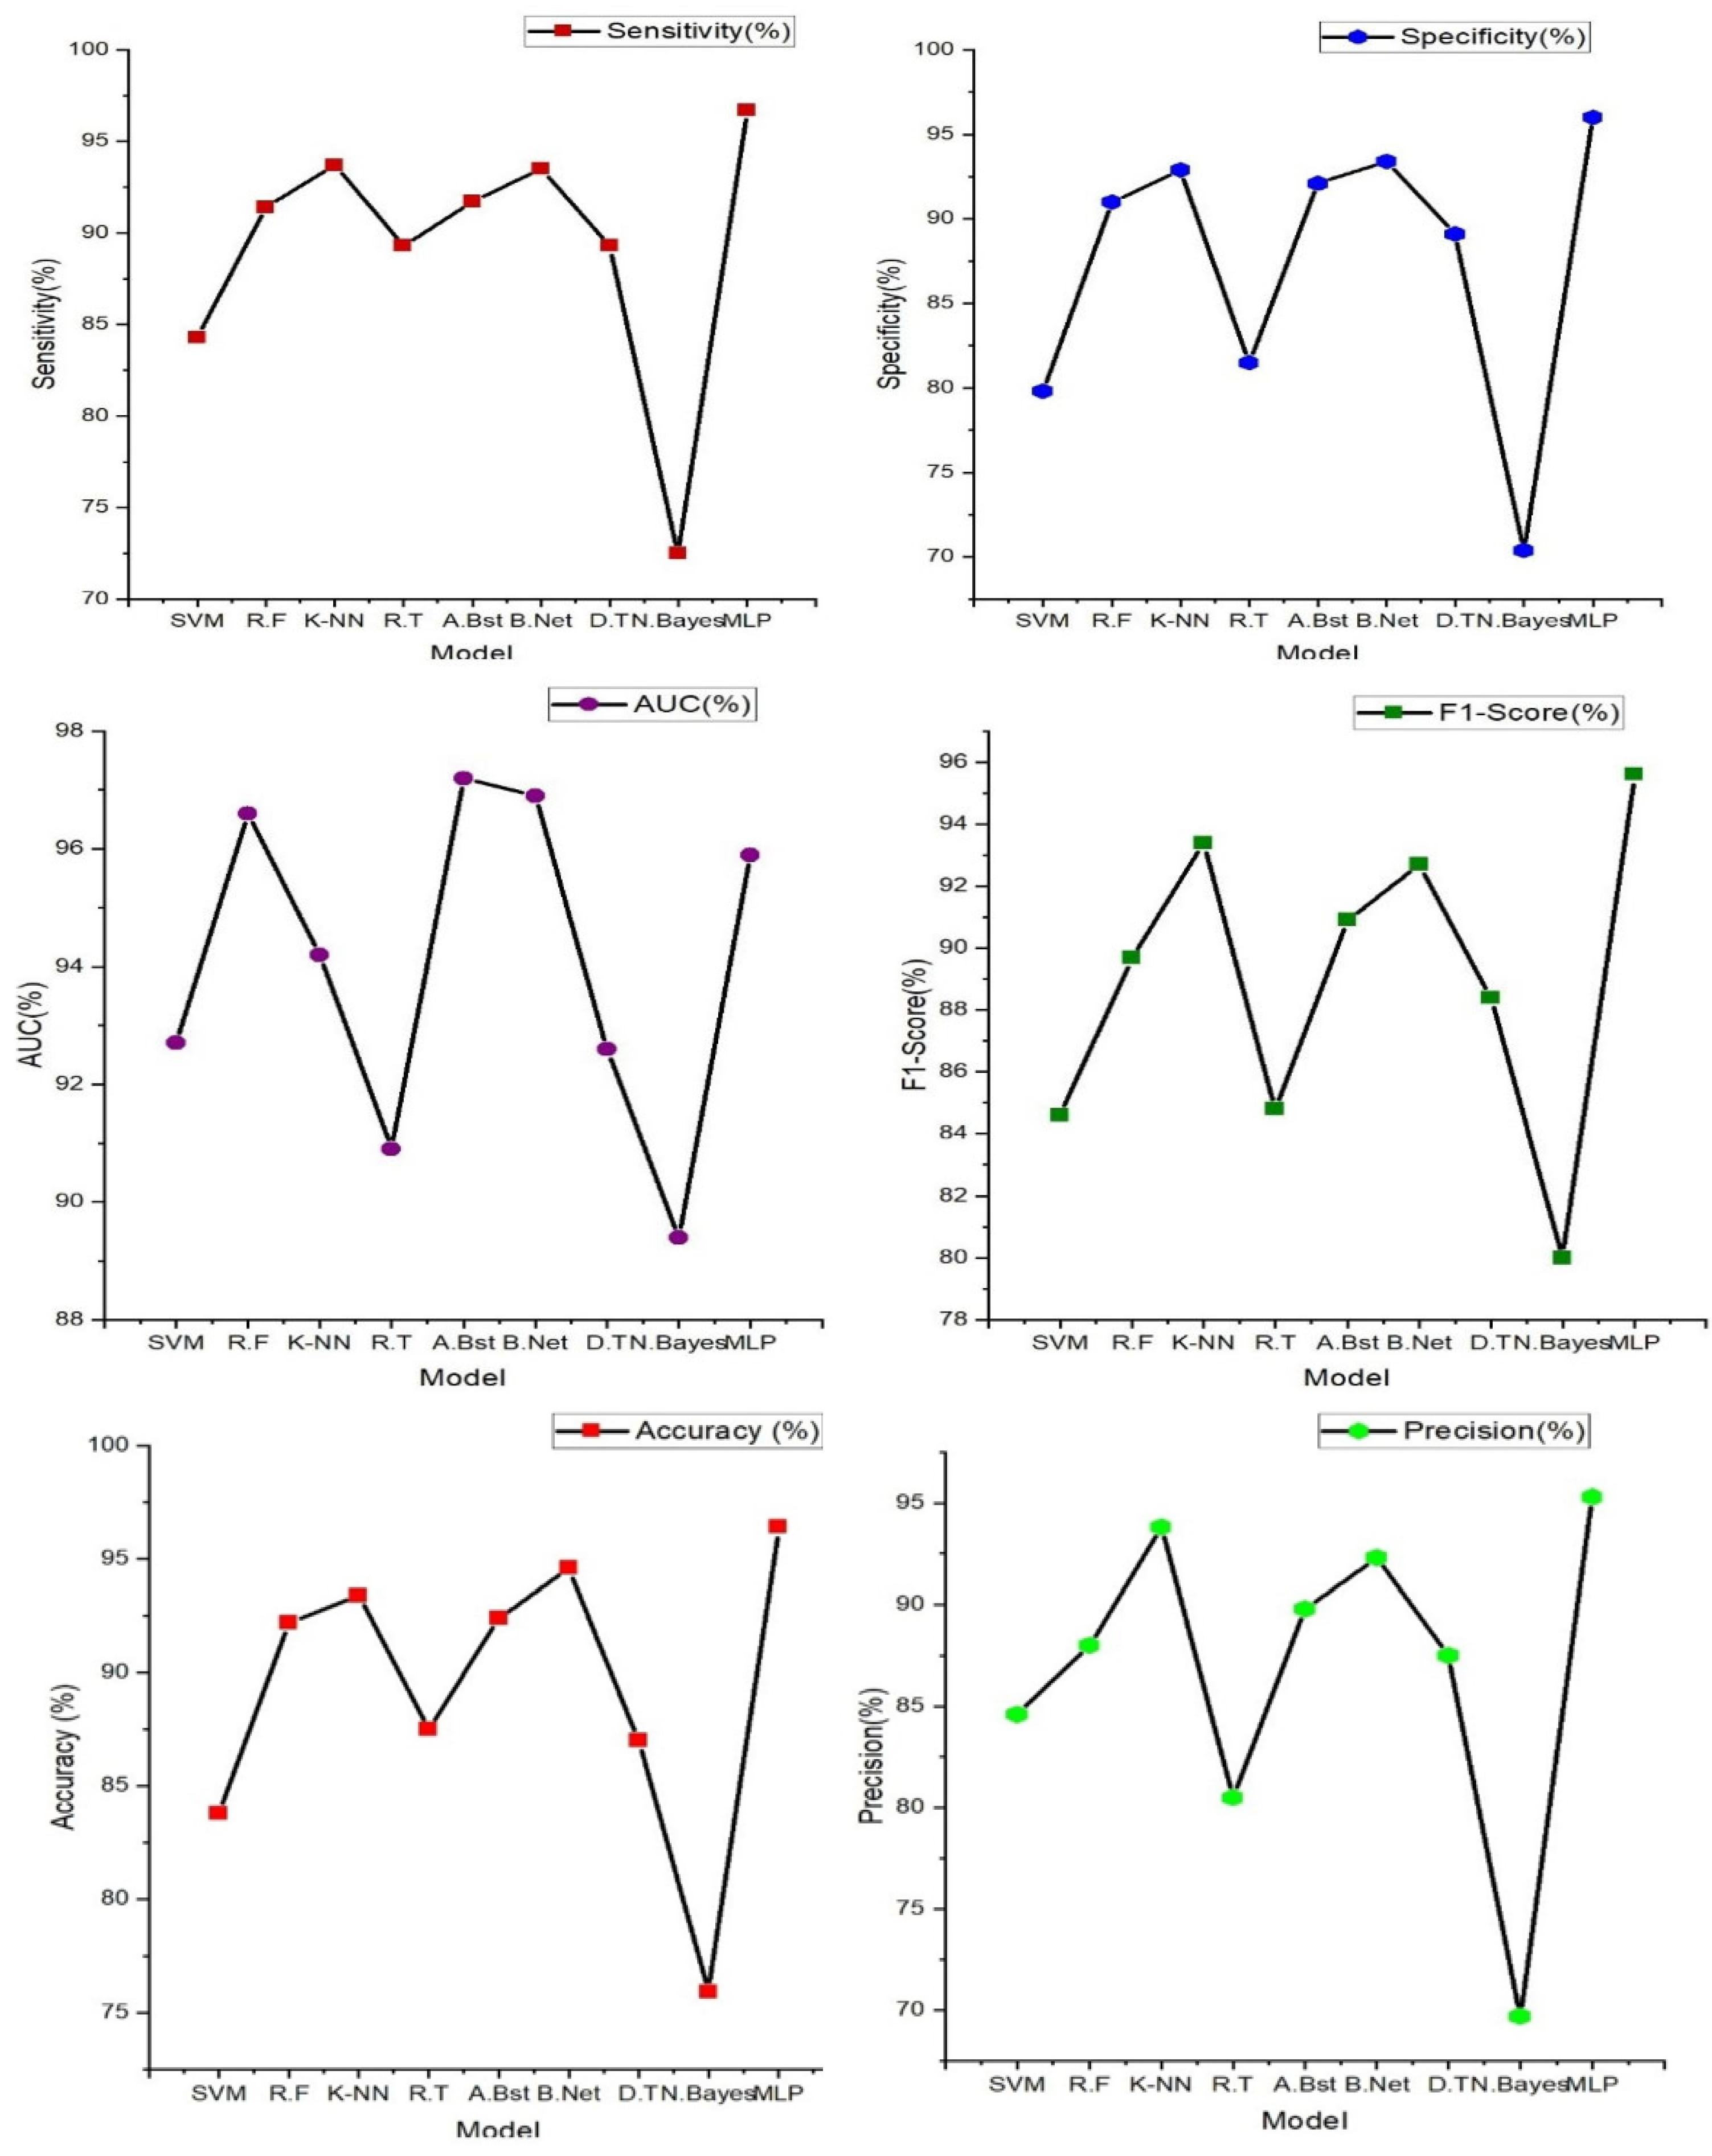
Table 2.
Summary of the Features and the Clinical Importance/Implications.
| Class of Feature | Features | Information provided |
|---|---|---|
| Class 1 (Amplitude features) |
Pulse Pressure Systolic Pressure Diastolic Pressure P-wave |
Monitoring these amplitude features over time can provide insights into the progression of heart failure and the effectiveness of therapeutic interventions aimed at managing vascular resistance. |
| Class 2 (Interval Information) |
Peak to peak interval QRS interval RR interval |
Changes in these intervals can indicate alterations in cardiac function and hemodynamics associated with heart failure. Researchers can gain insights into the pathophysiology of heart failure and assess the severity of the condition. |
| Class 3 (Physiological features) |
Augmentation Index HRV Parameters (pNN50, NN50, RMSSD, SDNN) Heart Rate |
They offer insights into heart function, blood flow, arterial stiffness, and autonomic nervous system activity. |
Table 5.
Performance of various machine learning models for heart failure (HF) classification with the integration ECG and PPG signals.
Table 5.
Performance of various machine learning models for heart failure (HF) classification with the integration ECG and PPG signals.
| Model | Performance Metrics | |||||
|---|---|---|---|---|---|---|
| Accuracy (%) |
Sensitivity (%) |
Specificity (%) |
Precision (%) |
AUC (%) | F1-Score (%) |
|
| SVM | 98.00 | 97.60 | 96.90 | 97.20 | 98.80 | 97.70 |
| Random Forest | 96.80 | 96.70 | 96.90 | 96.20 | 99.60 | 96.40 |
| K-NN | 94.90 | 79.30 | 95.70 | 94.80 | 95.30 | 86.20 |
| Random Tree | 96.90 | 96.70 | 96.80 | 96.20 | 96.80 | 98.50 |
| AdaBoost | 96.90 | 96.80 | 96.80 | 85.10 | 99.60 | 91.87 |
| BayesNet | 95.50 | 95.70 | 95.50 | 94.60 | 96.80 | 95.20 |
| Decision Tree | 96.00 | 95.70 | 96.40 | 95.70 | 96.80 | 95.70 |
| NaiveBayes | 91.20 | 91.30 | 91.00 | 89.40 | 95.20 | 90.30 |
| MLP | 96.50 | 96.80 | 96.50 | 95.70 | 99.80 | 96.30 |
Table 6.
Comparison between the best performing models from isolated signals Vs performance from the integration of both signals.
Table 6.
Comparison between the best performing models from isolated signals Vs performance from the integration of both signals.
| Model | Performance Metrics | ||||||
|---|---|---|---|---|---|---|---|
| Accuracy (%) |
Sensitivity (%) |
Specificity (%) |
Precision (%) |
F1Score (%) |
AUC (%) |
||
| PPG | Random Forest | 97.10 | 97.05 | 96.88 | 96.28 | 97.20 | 96.66 |
| ECG | MLP | 96.40 | 96.70 | 96.00 | 95.30 | 95.90 | 95.60 |
| Integration | SVM | 98.00 | 97.60 | 96.90 | 97.20 | 98.40 | 97.70 |
Disclaimer/Publisher’s Note: The statements, opinions and data contained in all publications are solely those of the individual author(s) and contributor(s) and not of MDPI and/or the editor(s). MDPI and/or the editor(s) disclaim responsibility for any injury to people or property resulting from any ideas, methods, instructions or products referred to in the content. |
© 2024 by the authors. Licensee MDPI, Basel, Switzerland. This article is an open access article distributed under the terms and conditions of the Creative Commons Attribution (CC BY) license (http://creativecommons.org/licenses/by/4.0/).
Copyright: This open access article is published under a Creative Commons CC BY 4.0 license, which permit the free download, distribution, and reuse, provided that the author and preprint are cited in any reuse.


