Submitted:
16 February 2024
Posted:
19 February 2024
You are already at the latest version
Abstract
Genome-wide association studies (GWAS) have successfully revealed numerous susceptibility loci for obesity. PREDATORR study (2014) shows that in Romania, 34,6% of adults aged 20-79 y/o are overweight, 31,4% are obese with a high risk of cardiometabolic complications, a number that puts almost 67% of Romania's population in the abnormal weight group. Our study aims to investigate the current staus of genetic foundation in metabolic disease associated with obesity, applied to a pilot group of patients specifically examining the impact of known polymorphisms and their haplotype of six food intake-regulating genes: leptin (LEP), leptin receptor (LEP-R), serotonin receptor (5HTR2A), ghrelin (GHRL), neuropeptide Y (NPY) and fat-mass and obesity-associated (FTO) with the following polymorphisms: LEP A-2548G, LEPR A-223G, 5HTR2A G-1439A, GHRL G-72T, NPY T-29063C, FTO A-T and body mass index (BMI). A notable link between the LEP-2548 rs7799039 gene's AG genotype and the risk of obesity was observed, particularly pronounced in males aged 40-49, with an approximately sevenfold increased likelihood of obesity. The 5HTR2A rs6311 AA genotype was associated with a higher BMI, not statistically significant. The FTO rs9939609 gene's AA genotype emerged as a significant predictor of obesity risk. Besides these significant findings, no substantial associations were observed with the LEPR, 5HTR2A, GHRL and NPY genes. Haplotype association analysis showed a suggestive indication of GRGMLA (rs7799039, rs1137101, rs6311, rs696217, rs16139, rs9939609 sequence) haplotype with susceptibility effect towards obesity predisposition. Linkage disequilibrium (LD) analysis showed statistically significant associations between LEP and LEPR gene (p = 1e-04), LEP and GHRL gene (p = 0.0047), GHRL and FTO gene (p=0.03). The outcomes of this study, to our knowledge, one of the very few on the Romanian population, aimed to be a starting point for further research on the targeted interventional strategies to reduce cardiometabolic risks.
Keywords:
genes
; LEP
; LEPR
; GHRL
; 5HTR2A
; NPY
; FTO
; obesity
; genotype
; risk
; cardiometabolic
1. Introduction
Obesity is a chronic disease, a pandemic with one out of eight individuals worldwide having body mass index (BMI) ≥ 30 kg/m2 that has multifactorial determinants related to lifestyle (sedentary lifestyle, inadequate eating habits) with a ground on genetic, hereditary, psychological, cultural and ethnic factors [1]. When obesity is present, the weight loss process is slow and complex and involves lifestyle changes based on nutritional, physical activity, psychological, and pharmacological interventions or surgical treatments [2].
Today, a growing body of evidence underlines the influential role of genetic factors in determining individual susceptibility to weight gain [3]. Genetic profiling has emerged as a promising tool for the therapeutic and nutritional management of metabolic premorbid states, consisting of disturbances of the body's ability to regulate and utilize energy [4]. These mechanisms precede the onset of metabolic disorders such as obesity, type 2 diabetes and cardiovascular disease.
Lately, genome-wide association studies (GWAS) have identified several gene variants that predispose to overweight and obesity; however, these risk variants explain only a modest proportion of the genetic basis of obesity [5]. Genetic polymorphisms, which represent variations in specific genes, are one missing piece of the obesity puzzle [6]. The analysis of these genetic differences and their impact on Body Mass Index (BMI) has become the new target in obesity research, holding the potential to improve our understanding of obesity's underlying mechanisms and offer more precise, individualized interventions using innovative targeted therapies [7,8] or natural biomolecules [9]. Genetic profiling methods, including whole-genome sequencing, targeted genotyping, and gene expression analysis, effectively identified genetic variants associated with metabolic premorbid states [10,11,12].
A genetic variation within a gene associated with obesity is known as a single nucleotide polymorphism (SNP). During the cell's DNA replication process, occasional 'typos' can occur, leading to these variations in the DNA sequence at specific sites [13,14]. SNPs are variations in a single base pair within the DNA sequence, which can arise in genes related to specific conditions, such as obesity. These SNPs have the potential to alter gene function or expression, thereby impacting various metabolic processes, appetite regulation, and energy expenditure. The classification of SNPs is based on their occurrence frequency in the population. The most common type is the 'wild type' (WT), which refers to the most prevalent form of a gene in a population. This is followed by the 'heterozygous' type (HET), where an individual has two different alleles of a gene. The 'mutant' type (MUT), characterized by a less frequent variation, occurs in less than 0.1% of the population. Each SNP type plays a distinct role in genetic variation and can contribute differently to the study of obesity and related metabolic disorders [15].
Clinical interpretation of these variations requires careful consideration, ideally integrating them with other clinical and lifestyle data for a comprehensive analysis. For a thorough understanding and accurate application of this genetic information, it is advisable to seek genetic counseling and consult with healthcare professionals or genetic specialists who are well-versed in this field.
Leptin and leptin receptor gene polymorphisms may contribute to individual variability in obesity risk, body weight regulation, and response to weight-loss interventions. [16] Leptin, interacting with its receptor, plays a multifaceted role beyond appetite regulation, including the modulation of immune and inflammatory responses, hematopoiesis, angiogenesis, reproduction, bone formation and wound healing. However, the genetic aspects of leptin are just one component in a broad network of genetic, environmental, and behavioral factors that collectively contribute to the development and management of obesity [17]. The leptin receptor gene LEPR rs1137101 SNP involves a transition from adenine (A) to guanine (G) at codon 223, resulting in an amino acid change from glutamine (Q) to arginine (R). This alteration is thought to impact the signaling capacity of the leptin receptor, potentially affecting body weight and energy balance regulation [18,19].
The 5-HT2A receptor is instrumental in the early differentiation of human primary subcutaneous preadipocytes into adipocytes. Throughout this differentiation process, the 5-HT2A receptor actively influences the expression of crucial genes that drive adipogenesis. These genes include the peroxisome proliferator-activated receptor gamma (PPAR-γ), adipocyte protein 2 (aP2), adiponectin, and serine/threonine-protein kinase 1 (SGK1) [20]. The SNP in the 5-HT2A gene represents a specific change in the DNA sequence, which is integral to the biological mechanisms previously discussed. In particular, the 1438 GG genotype of this SNP has been linked to variations in the waist-to-hip (W/H) ratio and central adiposity. [21]. Moreover, research has indicated a link between the rs6311 (A1438G) polymorphism in the 5-HTR2A gene and the development of eating disorders. The presence of these polymorphic variants may elevate the likelihood of associated psychiatric conditions [22].
The GHRL polymorphism rs696217 involves a guanine (G) to thymine (T) substitution, resulting in an amino acid change from leucine (Leu) to methionine (Met) at position 72 in exon 2 of the GHRL gene (L72M amino acid change corresponding to the G72T SNP). This alteration in the ghrelin hormone, secreted by enteroendocrine cells in the stomach and binding to the growth hormone secretagogue receptor (GHSR), may influence metabolic processes and obesity. Mutations in the GHRL gene, responsible for regulating ghrelin hormone production—a key player in appetite control—have been shown to heighten the risk of developing metabolic disorders, obesity, and type 2 diabetes. [23].
Single nucleotide polymorphisms (SNPs) in the NPY gene, linked to neuropeptide Y and its interactions with serotonin pathways, play a significant role in regulating appetite and energy balance [24,25]. These genetic variations in the NPY gene are associated with obesity, dietary preferences, and the metabolism of glucose and lipids, as well as with blood pressure regulation. The different variants of the NPY gene can influence an individual's predisposition to obesity and other metabolic disorders. Variants of the NPY gene, specifically rs16139 and rs17149106, have been linked to a higher Body Mass Index (BMI) and an elevated risk of obesity in individuals of Caucasian European descent, affecting both genders. Additionally, the rs16139 variant, known for its functional impact, is associated with an increased tendency for weight gain starting from a young age [26]. This influence is exerted through modulating eating behaviors and metabolic efficiency, primarily driven by serotonin-mediated appetite regulation [27].
The Fat Mass and Obesity-associated protein (FTO), alternatively referred to as alpha-ketoglutarate-dependent dioxygenase is an enzyme encoded by the FTO gene located on chromosome 16. The FTO gene, discovered initially through studies on mutant mice, has gained significant attention in obesity research [28]. Among its 21 identified single nucleotide polymorphisms (SNPs), 18 have been strongly linked to obesity, especially in populations of European descent [29]. The FTO SNP rs9939609 was significantly associated with obesity risk. This particular SNP is located within the first intron of the FTO gene (in the non-protein-coding area). Numerous studies have demonstrated that individuals carrying the risk allele (typically the A allele) of rs9939609 are more likely to have a higher BMI and an increased likelihood of obesity than those with the non-risk allele [30,31]. This association has been consistently observed across various populations but is particularly pronounced in individuals of European descent [32]. Research suggests that this SNP may influence energy balance and fat mass through its impact on energy intake and appetite regulation. The FTO gene, including the rs9939609 SNP, is considered one of the most robust genetic predictors of obesity risk identified to date [33]. It was documented that body weight was 3–4 kg higher, and the obesity risk was 1.67 times higher in those patients who were homozygous (AA genotype) for the risk allele than those who were not [34].
Given the notable variability in individual biological responses to increased food intake or decreased energy expenditure, and considering the growing popularity of genetic studies, it has become essential to investigate the genetic influences on body weight [35]. Particularly in our geographical region there is a lack of published data exploring the connections between genetic nucleotide polymorphisms and their role as predisposing factors in cardio-metabolic alterations [36]; this region exhibits a significant prevalence of overweight and obesity, with rates of 21.1% and 21.8%, respectively [37] These figures are noteworthy when compared to European statistics, where overweight and obesity affect nearly 60% of adults and approximately one in three children [38].
This article researched obesity-related genetic polymorphisms, scrutinizing how these genetic variations within our study participants are correlated to Body Mass Index (BMI) and susceptibility to obesity. We incorporated insights from the latest research, underscoring the potential of these findings in crafting personalized weight loss strategies and combating the global obesity epidemic. The burgeoning field of cardio-metabolic and obesity genetics is emerging as a pivotal avenue for advancing their management in the 21st century toward a personalized intervention.
2. Materials and Methods
In the present study, we retrospectively analyzed the prevalence of specific genetic polymorphisms and correlation with the body weight profile (body weight and body mass index) for six genes involved in body weight and metabolic balance by processing the genetic test data for 55 patients, in the order of presentation, with age 16-68 years (n=55), referred to our clinic for cardio metabolic risk evaluation and weight control (Age Management Clinic®, Romania, EU).
Exclusion criteria: Patients with cancer, liver and kidney failure, hypothyroidism and hyperthyroidism, Type 2 diabetes mellitus, and those with alcohol and substance addiction were not included in the study. All the data used in the study was previously approved by the patients (or legal tutors) before testing and processing according to the laboratory standards and the current regulations (Ehtics Committee approval C4/2022).
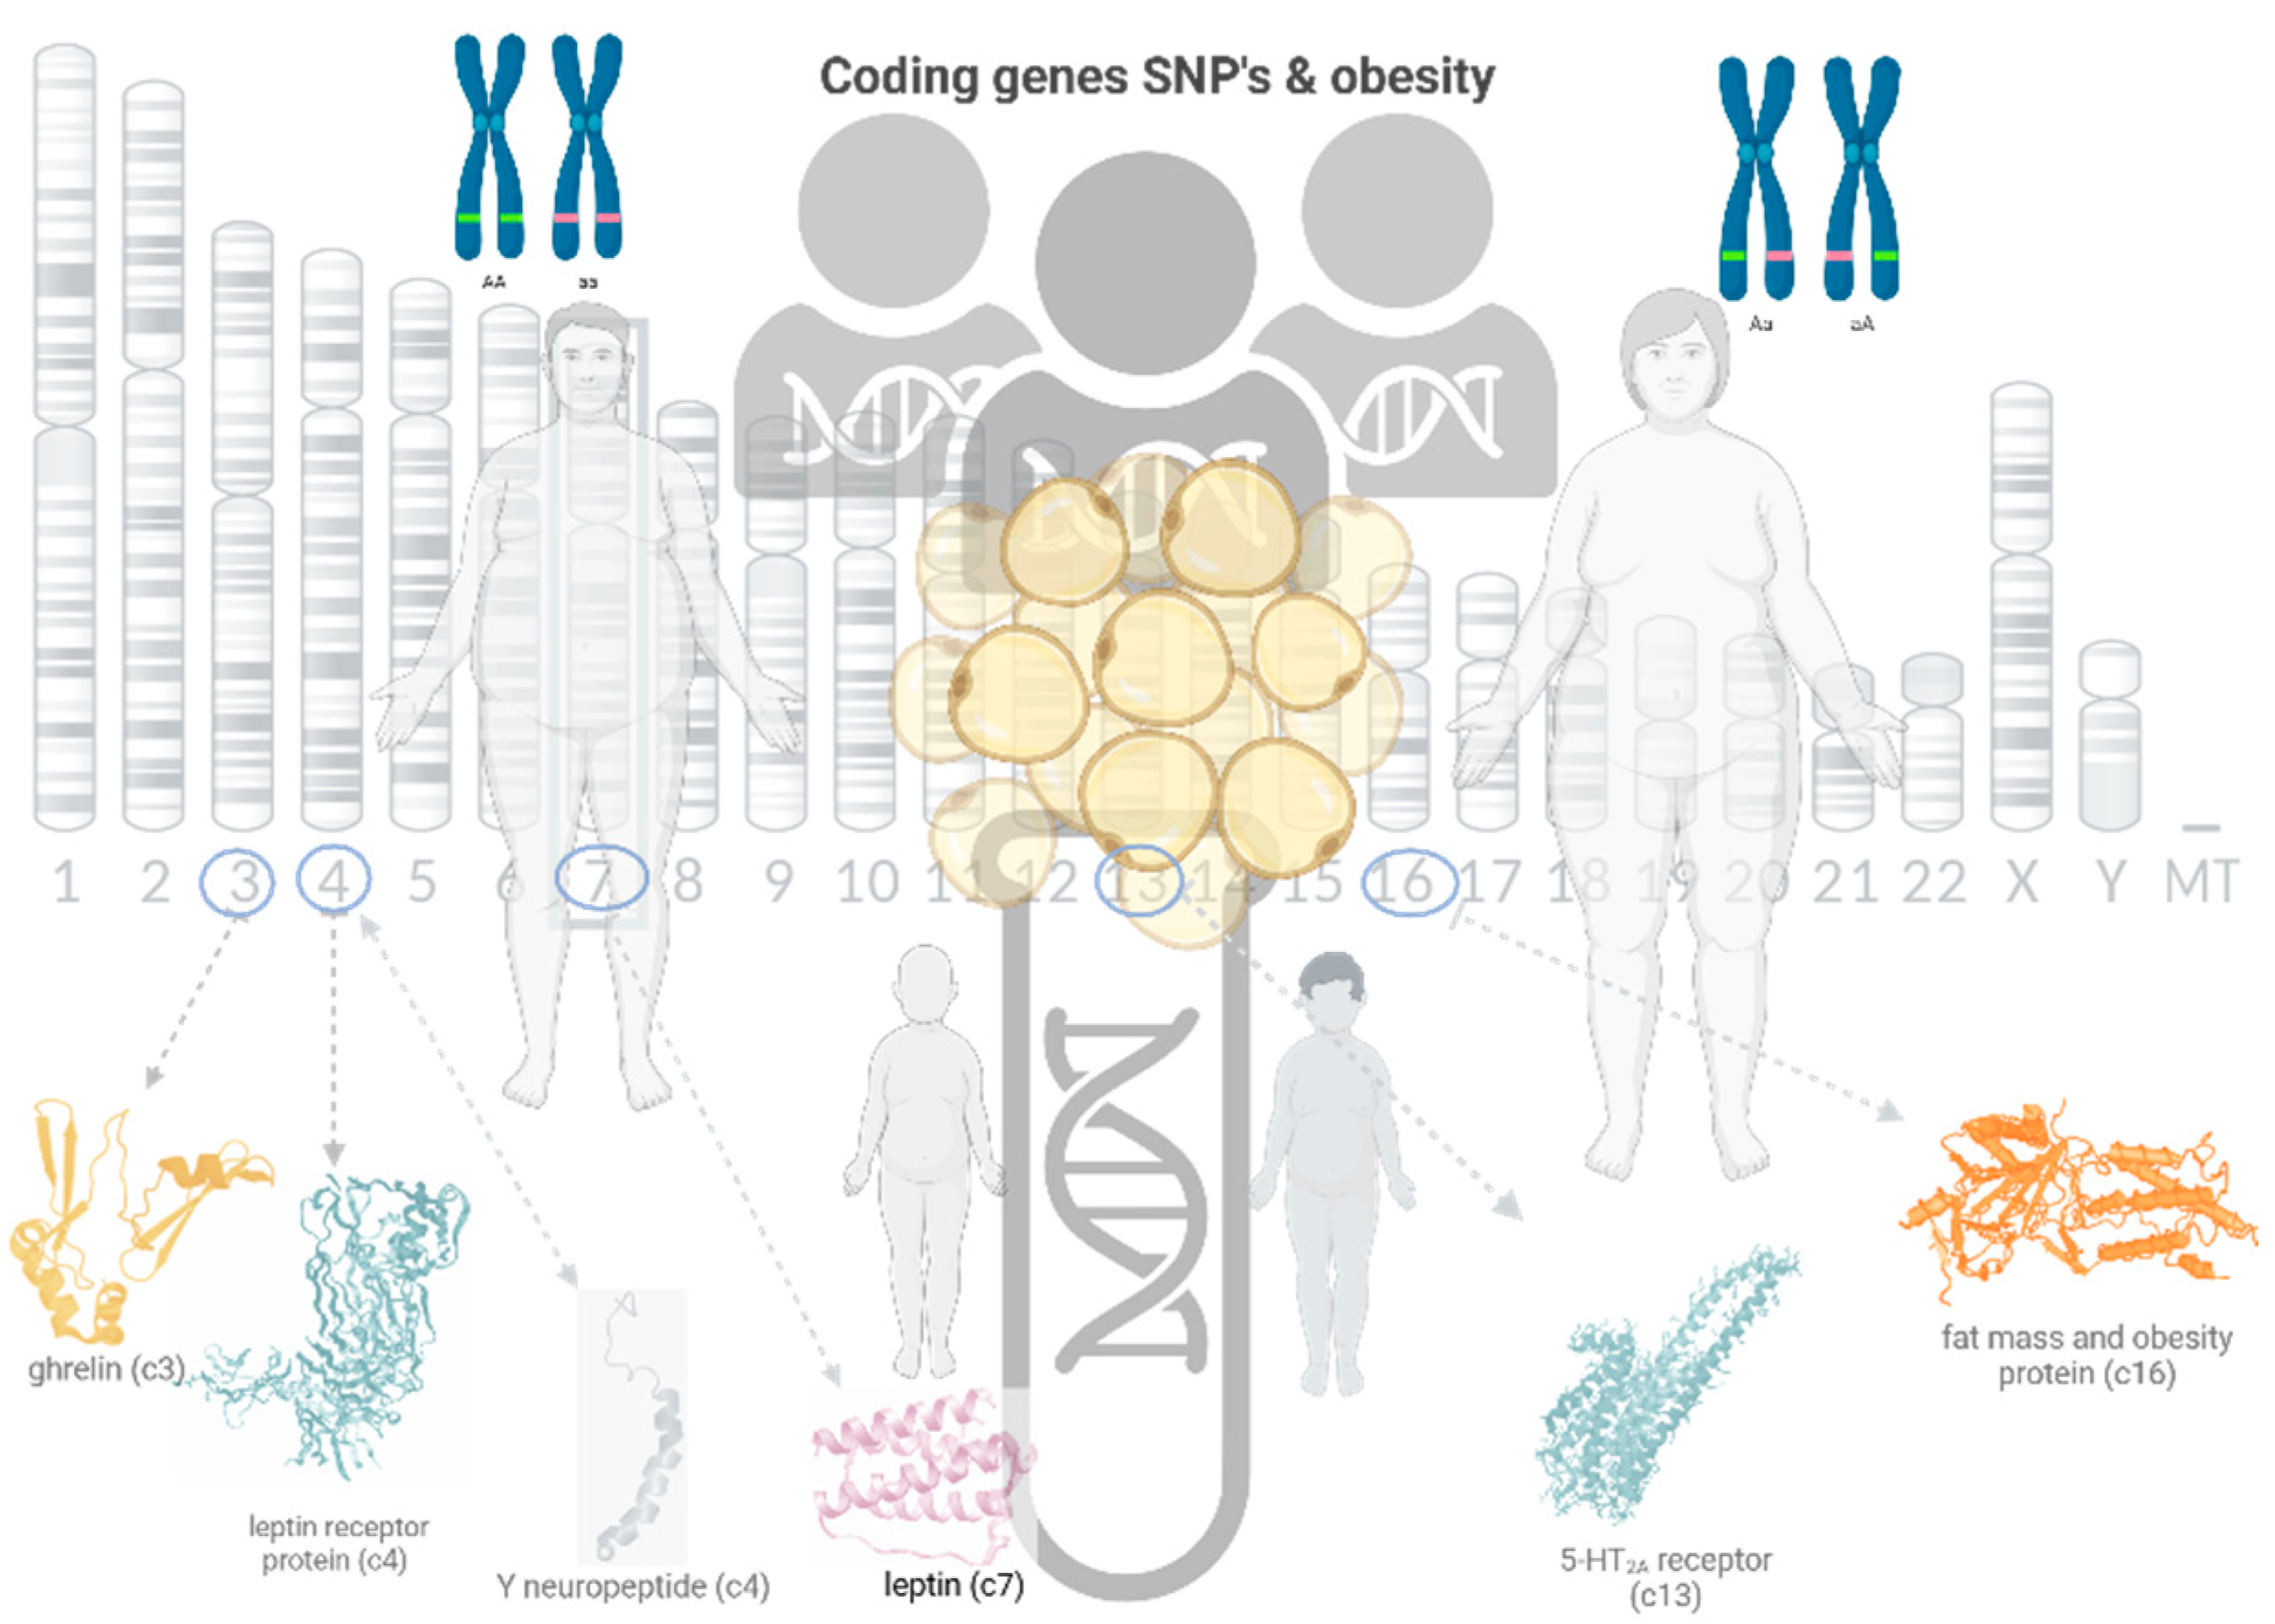
Figure 1.
Graphical representation of the study (created with BioRender.com, 2023).
Anthropometric parameters were directly measured by standard protocols. Anthropometric measurements: body weight (kg) and body height (cm) were measured, and BMI (body mass index) was calculated using the "body weight/height2" (kg/m2) formula. Height was measured in cm, feet close together, with the head in Frankfort plane with a stadiometer with 0.1 cm accuracy. The body weight was measured using the Tanita BC 545 N Inner Scan® (Balance TM®, Tokyo, Japan) while the subjects were hungry and wearing light clothes, no metals. According to the BMI classification of the World Health Organization (WHO), The BMI values of the participants were grouped into four categories: underweight (BMI < 18.5 kg/m2), normal weight (18.5–24.9 kg/m2), overweight (25.0 kg/m2 – 29.9 kg/m2), and obese (30.0 ≤ BMI kg/m2).
Figure 2.
Study diagram.
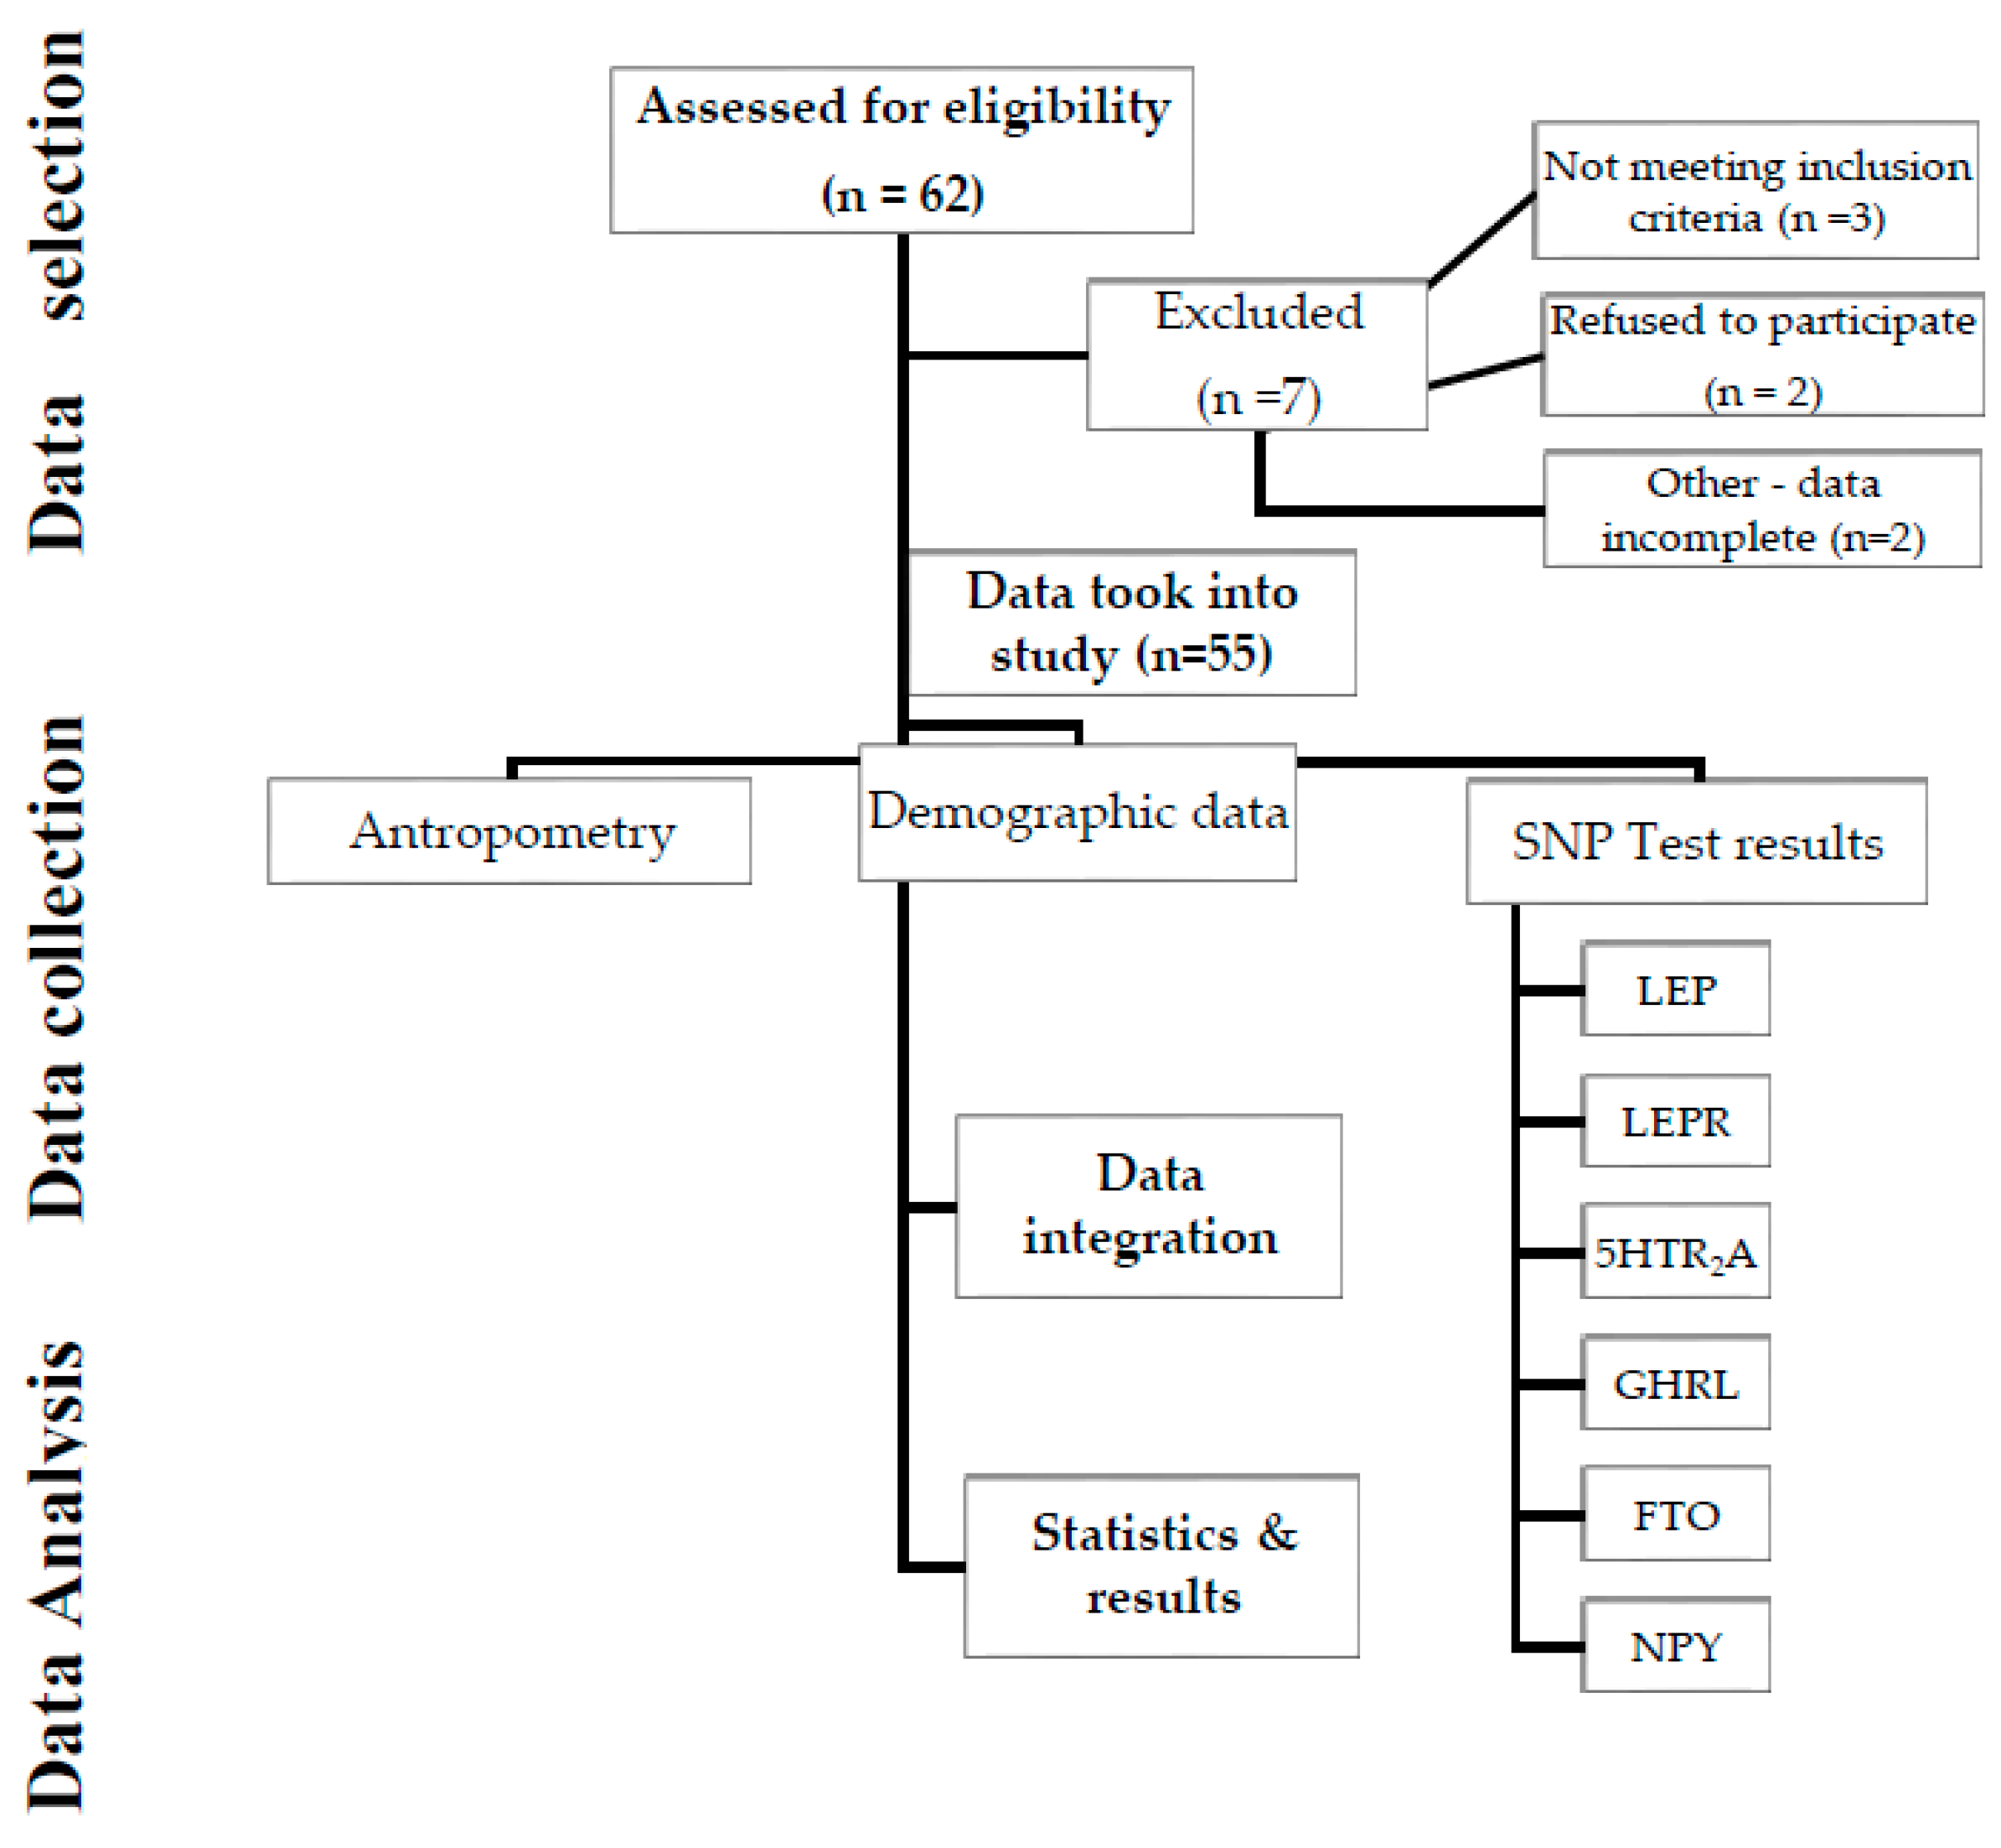
DNA extraction and genotyping
Genotyping was performed using the SNP (Single Nucleotide Polymorphism) scan genotyping protocol, based on a double ligation reaction and multiplex fluorescence PCR, using salivary samples (LRJ®, Luxembourg, EU). We have investigated the LEP, LEPR; 5HTR2A, GHRL, NPY and FTO genes. We took into analysis the genotype: wtwt= wildtype (absence of the variation); wtvt = heterozygous genotype (presence of the variation); vtvt = homozygous variant genotype (presence of the variation). Genotype susceptibility – can be associated with a negative or positive impact on weight control as described: red = increased risk, yellow= susceptibility associated with the average population and green = protective genotype or decreased susceptibility;

Table 1.
Investigated genes and corresponding SNP s and amino acid sequence change.
| Gene | Chromosome | SNP | rsID | Aminoacid | Biochemical structure |
|---|---|---|---|---|---|
| LEP | 7 | A-2548G | rs7799039 | - | Leptin |
| LEPR | 4 | A-223G | rs1137101 | Q223R | Leptin receptor |
| 5HTR2A | 13 | G-1439A | rs6311 | - | Serotonin 2A receptor |
| GHRL | 3 | G-72T | rs696217 | L72M | Ghrelin |
| NPY | 4 | T-29063C | rs16139 | L7P | Neuropeptide Y |
| FTO | 16 | A-T | rs9939609 | - | Fat mass and obesity protein |
* rs - rs ID number, a unique identifier for a specific SNP in a gene; AA – amino acid change in the specified position; A – adenine, G – guanine; T – timine; amino acids – L- leucine, M – methionine, P- Q - glutamine, R – arginine, L72M - methionine for leucine at the 72nd position - in Ghrelin protein.
Statistical analysis
We statistically analyzed the data using Statistical Package for the Social Sciences IBM SPSS Statistics®, version 20 (Armonk, New York, USA). We calculated descriptive statistics, the means and standard deviations for continuous variables or frequencies, and percentages for categorical variables. The association between the presence or absence of an allele and categories of BMI was analyzed using a chi-square (χ2) statistical test. Testing for Hardy-Weinberg equilibrium has been performed for each gene. SNP Stats was used to test for statistical models and analyze haplotype associations.
The clinical characteristics were reported by frequencies and percentages for the categorical variables and with means and standard deviations for the continuous variables. Categorical variables were analyzed using the chi-square test. Odds ratio (OR) with a 95% confidence interval (95% CI) was reported for allelic comparisons and BMI. We used logistic regression for allele data as the predictor (independent variable) and BMI as the outcome (dependent variable), with BMI dichotomized (obese vs. non-obese). Logistic regression is suitable for modeling the probability of an event (e.g., being obese) occurring given the presence or absence of a specific allele.
3. Results
3.1. Socio-demographical data
The study included 55 participants, 54.5% females (n=30) and 45.5% males (n=25). The mean age in both groups was 37.4 +/- 12 y/o. Regarding body mass index 23.6%(n=13) patients had a BMI in the norm weight limits (18.5–24.9 kg/m2), while 41.8% of the total study group (n=23) were overweight (BMI 25.0 kg/m2 – 29.9 kg/m2), and 34.6% obese with a BMI ⩾ 30.0 kg/m2 (n=19) (Figure 1). The mean BMI in females was 29.1 kg/m2, while the mean BMI in males was 29.62 kg/m2. These results suggest a slight difference in mean BMI between genders, with females having a slightly lower mean BMI compared to males. All studied gene polymorphisms satisfied the Hardy–Weinberg equilibrium as follows: LEP rs7799039 [p=0.78], LEPR rs1137101 [p=0.78], 5HTR2A rs6311 [p=0.091], GHRL rs696217 [p=1], NPY rs16139 [p=1] and FTO rs9939609 [p=0.59].
Figure 3.
(a) gender distribution; (b) weight distribution of the studied group.
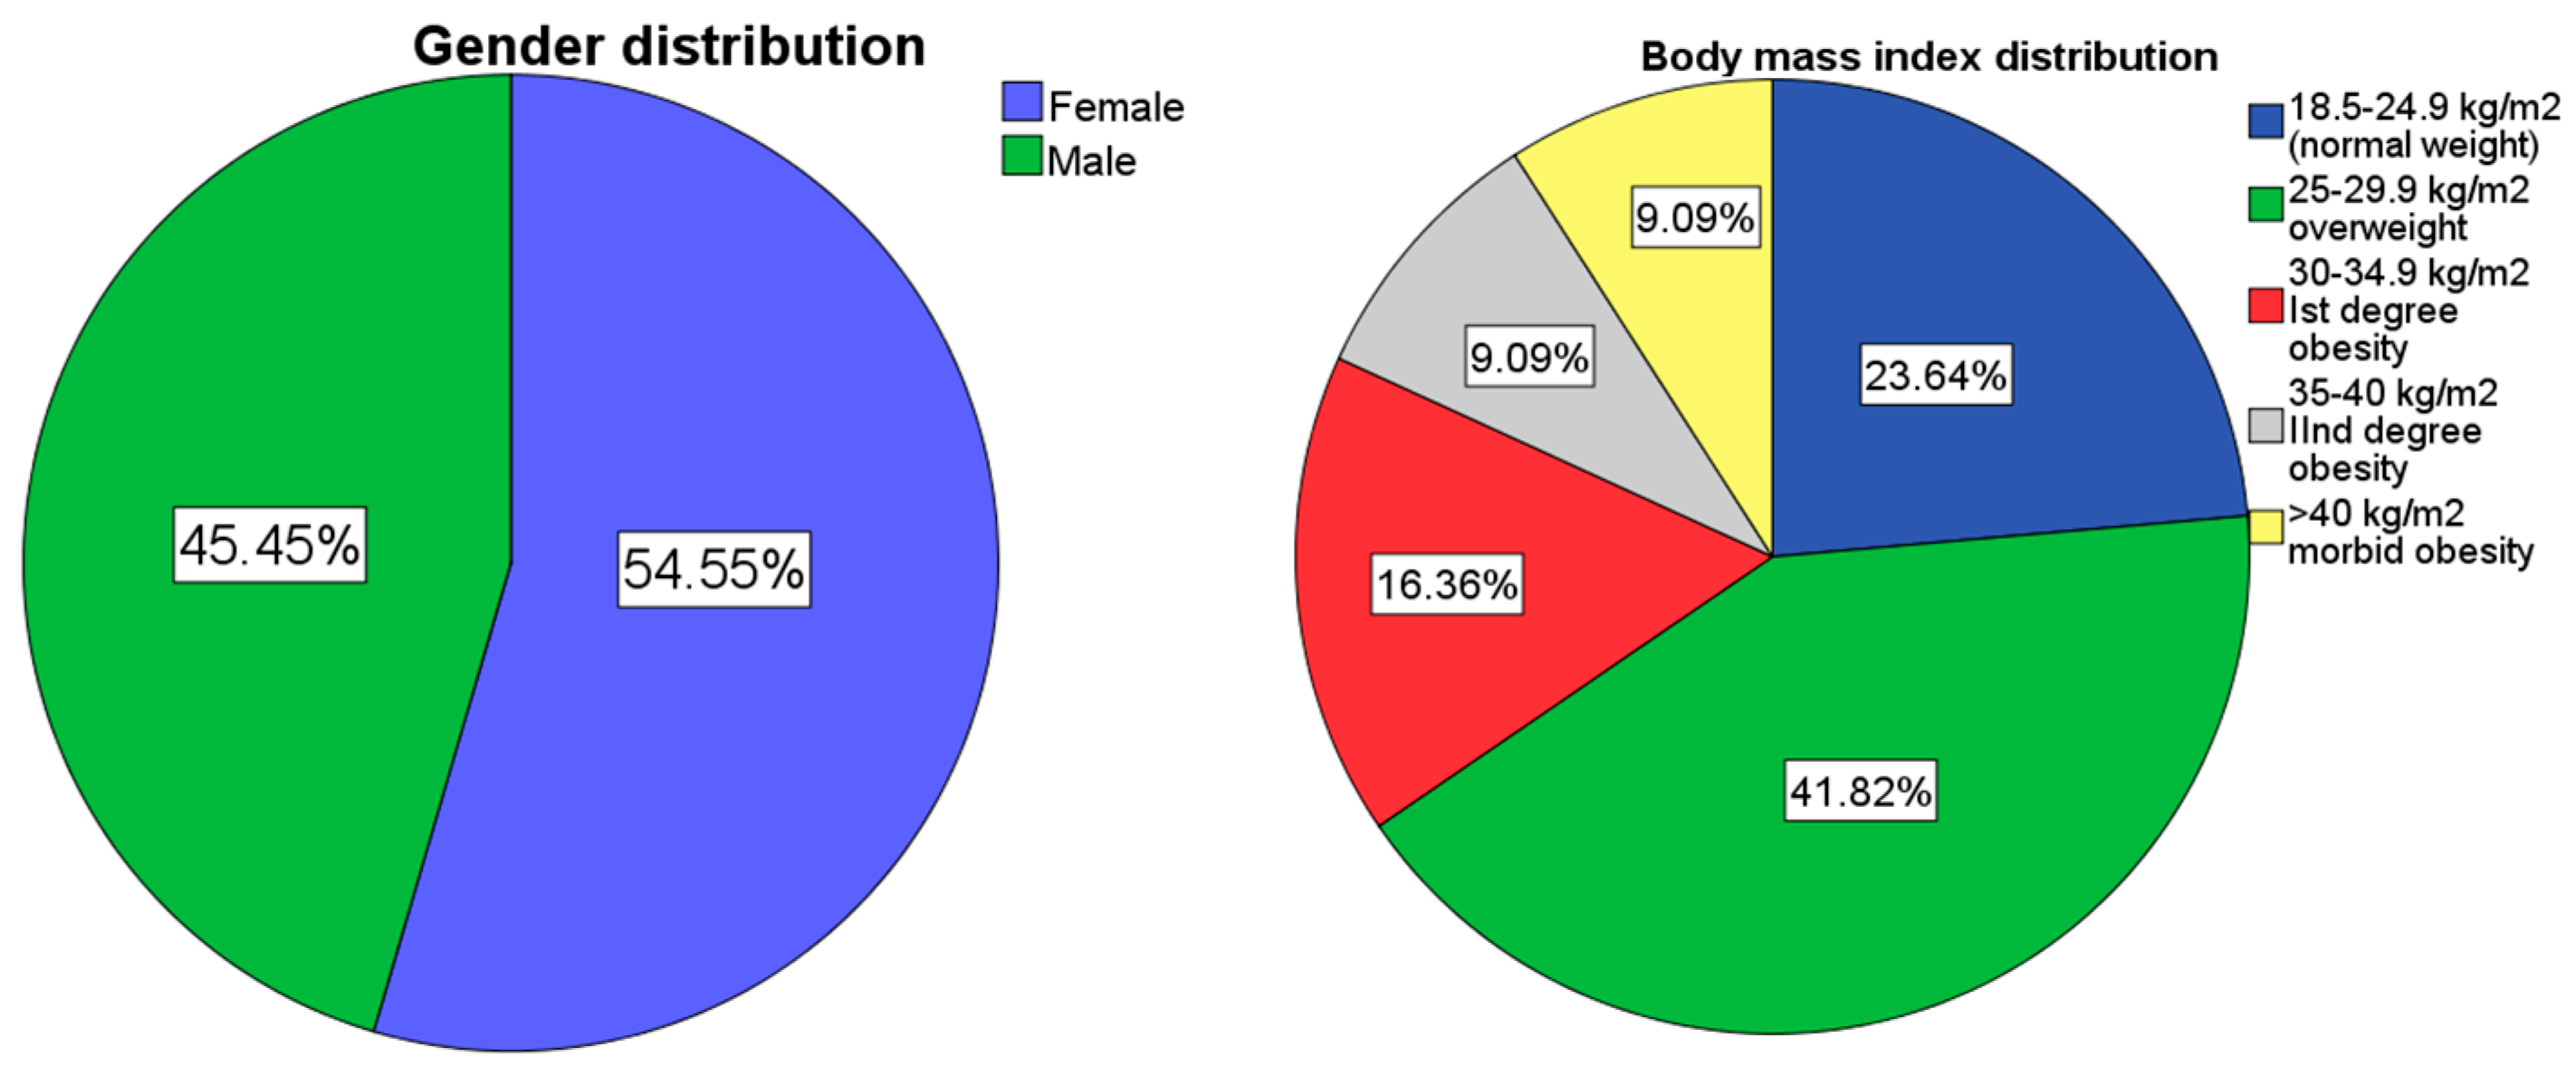
Table 2.
Study group's characteristics.
| Total (N) | 55 | ||
|---|---|---|---|
| Age (X±SD, y/o.) | 37.4±12 | ||
| Gender (n) | M=25, F=30 | ||
| Weight (X±SD, kg) | 87±27 kg | ||
| Height (X±SD, cm)rrrrBMI (X±SD, kg/m2) | 172±11.4 cmrrrr29.4±8 kg/m2 | ||
| BMI (kg/m2) | 18.6 - 24.9 | 25 – 29.9 | >30 |
| BMI subgroups (N/%) | 13 (23.6%) | 23 (41.8%) | 19 (34.6%) |
* BMI – body mass index; y/o – years old; X±SD - average±standard deviation.
In the studied group, both genders had a predominant heterozygote (wtvt) variant of LEP gene polymorphism: 52.7% (n=29, 14 females, 15 males) (p=0.9, r=0.001), with no statistically significant difference between groups.
Table 3.
Study population gene characteristics.
| Gene | SNP | Genotype frequencies | *Susceptibility | ||||
|---|---|---|---|---|---|---|---|
| wtwt | wtvt | vtvt | increased | intermediate | decreased | ||
| LEP (n/%) | rs7799039 | 8 (14.5%) | 29 (52.7%) | 17 (30.9%) | 32 (58.2%) | 9 (16.4%) | 13 (23.6%) |
| LEPR (n/%) | rs1137101 | 17 (30.9) | 29 (52.7%) | 9 (16.4%) | 38 (69.1%) | 17 (30.9%) | 0 |
| 5HTR2A (n/%) | rs6311 | 23 (41.8%) | 20 (36.4%) | 12 (21.8%) | 32 (58.2%) | 23 (41.8%) | 0 |
| GHRL (n/%) | rs696217 | 45 (81.8%) | 9 (16.4%) | 1 (1.8%) | 0 | 45 (81.8%) | 10 (18.2%) |
| NPY (n/%) | rs16139 | 53 (96.4%) | 2 (3.6%) | 0 | 2 (3.6%) | 53 (96.4%) | 0 |
| FTO (n/%) | rs9939609 | 15 (27.3%) | 25 (45.5%) | 15 (27.3%) | 40 (72.7%) | 15 (27.3%) | 0 |
Allele type: wtwt= wildtype (absence of the variation); wtvt = heterozygous (presence of the variation); vtvt = homozygous variant (presence of the variation). rs - rsID number, a unique identifier for a specific SNP in a gene. *Genotype susceptibility – can be associated with a negative or positive impact on weight control as described: red = increased risk, yellow= susceptibility associated with the average population, and green = protective genotype or decreased susceptibility.
Table 4.
Allele predominance and frequency in the studied population.
| Gene | Allele frequencies | |
|---|---|---|
| LEP | A = 46 (43%) | G=62 (57%) |
| LEPR | Q= 63 (57%) | R=47 (43%) |
| 5HTR2A | G=66 (60%) | A=44 (40%) |
| GHRL | L=100 (91%) | M=10 (9%) |
| NPY | L=108 (98%) | P=2 (2%) |
| FTO | T=55 (50%) | A=55 (50%) |
3.2. LEP gene
LEP gene A2548G mutation alleles AA, GA and GG showed no statistically significant difference in gender. The test for interaction in the trend was not significant (p = 0.42), suggesting that the trends observed in the association between genotypes and the response variable did not significantly differ between genders. The most prevalent LEP genotype observed in our study was LEP GA (N=28, 52% of all participants). Men had a five times higher incidence of carrying the GA genotype. OR=4.9 {95%CI [1.4-16]}. The incidence of male gender, with GA allele, was highest in the 40-49 y/o age group (n=8, 34.8%).
When we analyzed the correlation between BMI (body mass index) and the incidence and type of LEP genotype A254G SNP (AA, AG or GG), the results were as follows: GG genotype was associated mainly with normal weight (11.3%) while GA genotype correlated with overweight and obese patients (47.2%). For the GA allele in the LEP gene, the coefficient is 1.950 with a standard error of 0.845, associating a statistically significant risk of obesity (p=0.02), with OR=7.031, CI 95% [1.3 - 36.8], consistent with literature data that found a higher prevalence of the GA allele in overweight and obese patients [39]. However when we adjusted the data for gender and age, statistical significance was lost. These data provide a closer look at the relationship between the GA allele and genotype susceptibility within the study population and underline the need for an extensive population study. The association between the presence of the GG allele in the LEP gene A2548G SNP and the risk of obesity is not statistically significant (p=0.06), with an OR=0.269, 95/CI [0.067 - 1.073].
3.3. Leptin receptor gene
The A223G SNP had the highest prevalence in the overweight group (n=14, 28%), but there was no statistically significant difference between weight groups (p=0.4).
In our analysis of the potential association between LEPR AG, AA, and GG genotypes and obesity risk, binary logistic regression indicated that the LEPR-A223G genotype's presence is not a statistically significant predictor of obesity risk (p=0.4), with an odds ratio (OR) of 0.571, 95% CI [0.145 - 2.247]. Neither the AA nor the GG genotype of LEPR-A223G showed a statistically significant association with obesity risk (p=0.7 and p=0.2, respectively). However, patients with the AA genotype had a 2.5-fold higher risk of obesity compared to those with AG or GG genotypes.
3.4. HTR2A gene
Statistical analysis of 5HTR2A-G1439A gene with GA, AA and GG genotypes and BMI for five inherited models that analyzed the relationship between each genotype and BMI adjusted for gender and age showed a significant association of three models from five. In codominant model analysis, AA genotype had a mean BMI of 33.48 kg/m2 exhibiting a significant difference with OR=5.54 (95% CI: 0.37 to 10.71) compared to GG, but with p value of 0.06. GA genotype showed no significant difference regarding BMI compared to GG. (GA mean BMI =27.87 kg/m2).
The log-additive model suggests a significant linear trend (p = 0.088) that indicates a trend in BMI increase, with each additional copy of the A allele. The recessive model also showed a significant association of AA genotype compared with GG and GA genotypes [mean BMI=33.48, OR=5.91 (95% CI: 1.11 to 10.72)]
3.5. GHRL gene
In our study, the GG allele of the GHRL gene mutation showed the highest prevalence in overweight patients (N=19, 38.8%), yet no statistically significant difference was observed between weight groups. Associations between GHRL gene mutation polymorphisms GT (p=0.3), GG (p=0.4), and obesity risk were not statistically significant. The GG polymorphism group had an OR of 1.875, which was not statistically significant.
Genotype analysis in rs696217 SNP confirmed no association in alleles, genotypes, or any other forms of genetic models.
3.6. NPY gene
Leucine (L) to Proline (P) amino acid change at position 7 (L7P) in the Neuropeptide Y related to SNP in NPY gene had the highest incidence of LL allele (N=21, 42.9%) in overweight patients' group, with a p=0.2. In the group with the NPY LL genotype, an OR=4.1 was recorded without statistical significance (p=0.3). Genotype analysis in rs16139 SNP confirmed no association in alleles, genotypes, or any other forms of genetic models.
3.7. FTO gene
In our study examining the FTO A-T genotypes in relation to BMI and the risk of overweight and obesity, the analysis of homozygote T, homozygote A, and heterozygote TA alleles revealed the highest prevalence in the heterozygote group (N=10, 20.4%) within the overweight patient category (p=0.1). However, no statistically significant association was found between the presence of the FTO (rs9939609) TA allele (OR=2.4) and the risk of obesity (p=0.2). Conversely, the FTO (rs9939609) homozygote A allele was a significant predictor of obesity risk (B=1.48, S.E.=0.713, Wald=4.3, df=1, p=0.03), indicating a fourfold higher risk of obesity compared to the heterozygote or homozygote T alleles (OR=, 95% CI [1.08-17]). The results suggest that, after adjusting for Id, Gender, and Age, the FTO genetic variant is not significantly associated with BMI in this study population. Also, none of the measured models showed statistically significant differences.
The test for interaction in the trend yielded a p-value of 0.021, suggesting a statistically significant interaction effect between the FTO genetic variant and gender on the BMI response variable after adjusting for age. This implies that the effect of the FTO genetic variant on BMI significantly differs between females and males [40].
Linkage disequilibrium (LD) analysis (the statistical method used in genetics to study non-random association or correlation between alleles at different loci on a chromosome) showed statistically significant associations between LEP and LEPR gene (p = 1e-04), LEP and GHRL gene (p = 0.0047), GHRL and FTO gene (p=0.03). The findings provide insights into the patterns of LD between these genetic loci, helping to understand potential genetic associations and interactions between gene polymorphisms. No strong correlation has been found on LD analysis between alleles at different loci on a chromosome. Moderate or weak correlations had not been shown. (See Table. Linkage disequilibrium).
The association between haplotypes and obesity was analyzed via logistic regression.
Haplotype association analysis showed a suggestive indication of GRGMLA haplotype (rs7799039, rs1137101, rs6311, rs696217, rs16139, rs9939609 sequence) with susceptibility effect towards obesity predisposition [P<0.0001, OR=30.53 (18.3-42.7)] with a 0.0091 (rare) frequency. Also, ARGLLT haplotype (rs7799039, rs1137101, rs6311, rs696217, rs16139, rs9939609 sequence) showed the lowest incidence towards obesity predisposition p=0.03, [OR=-9.27 (-17.9--0.58)] with a 0.0205 (moderate) frequency.
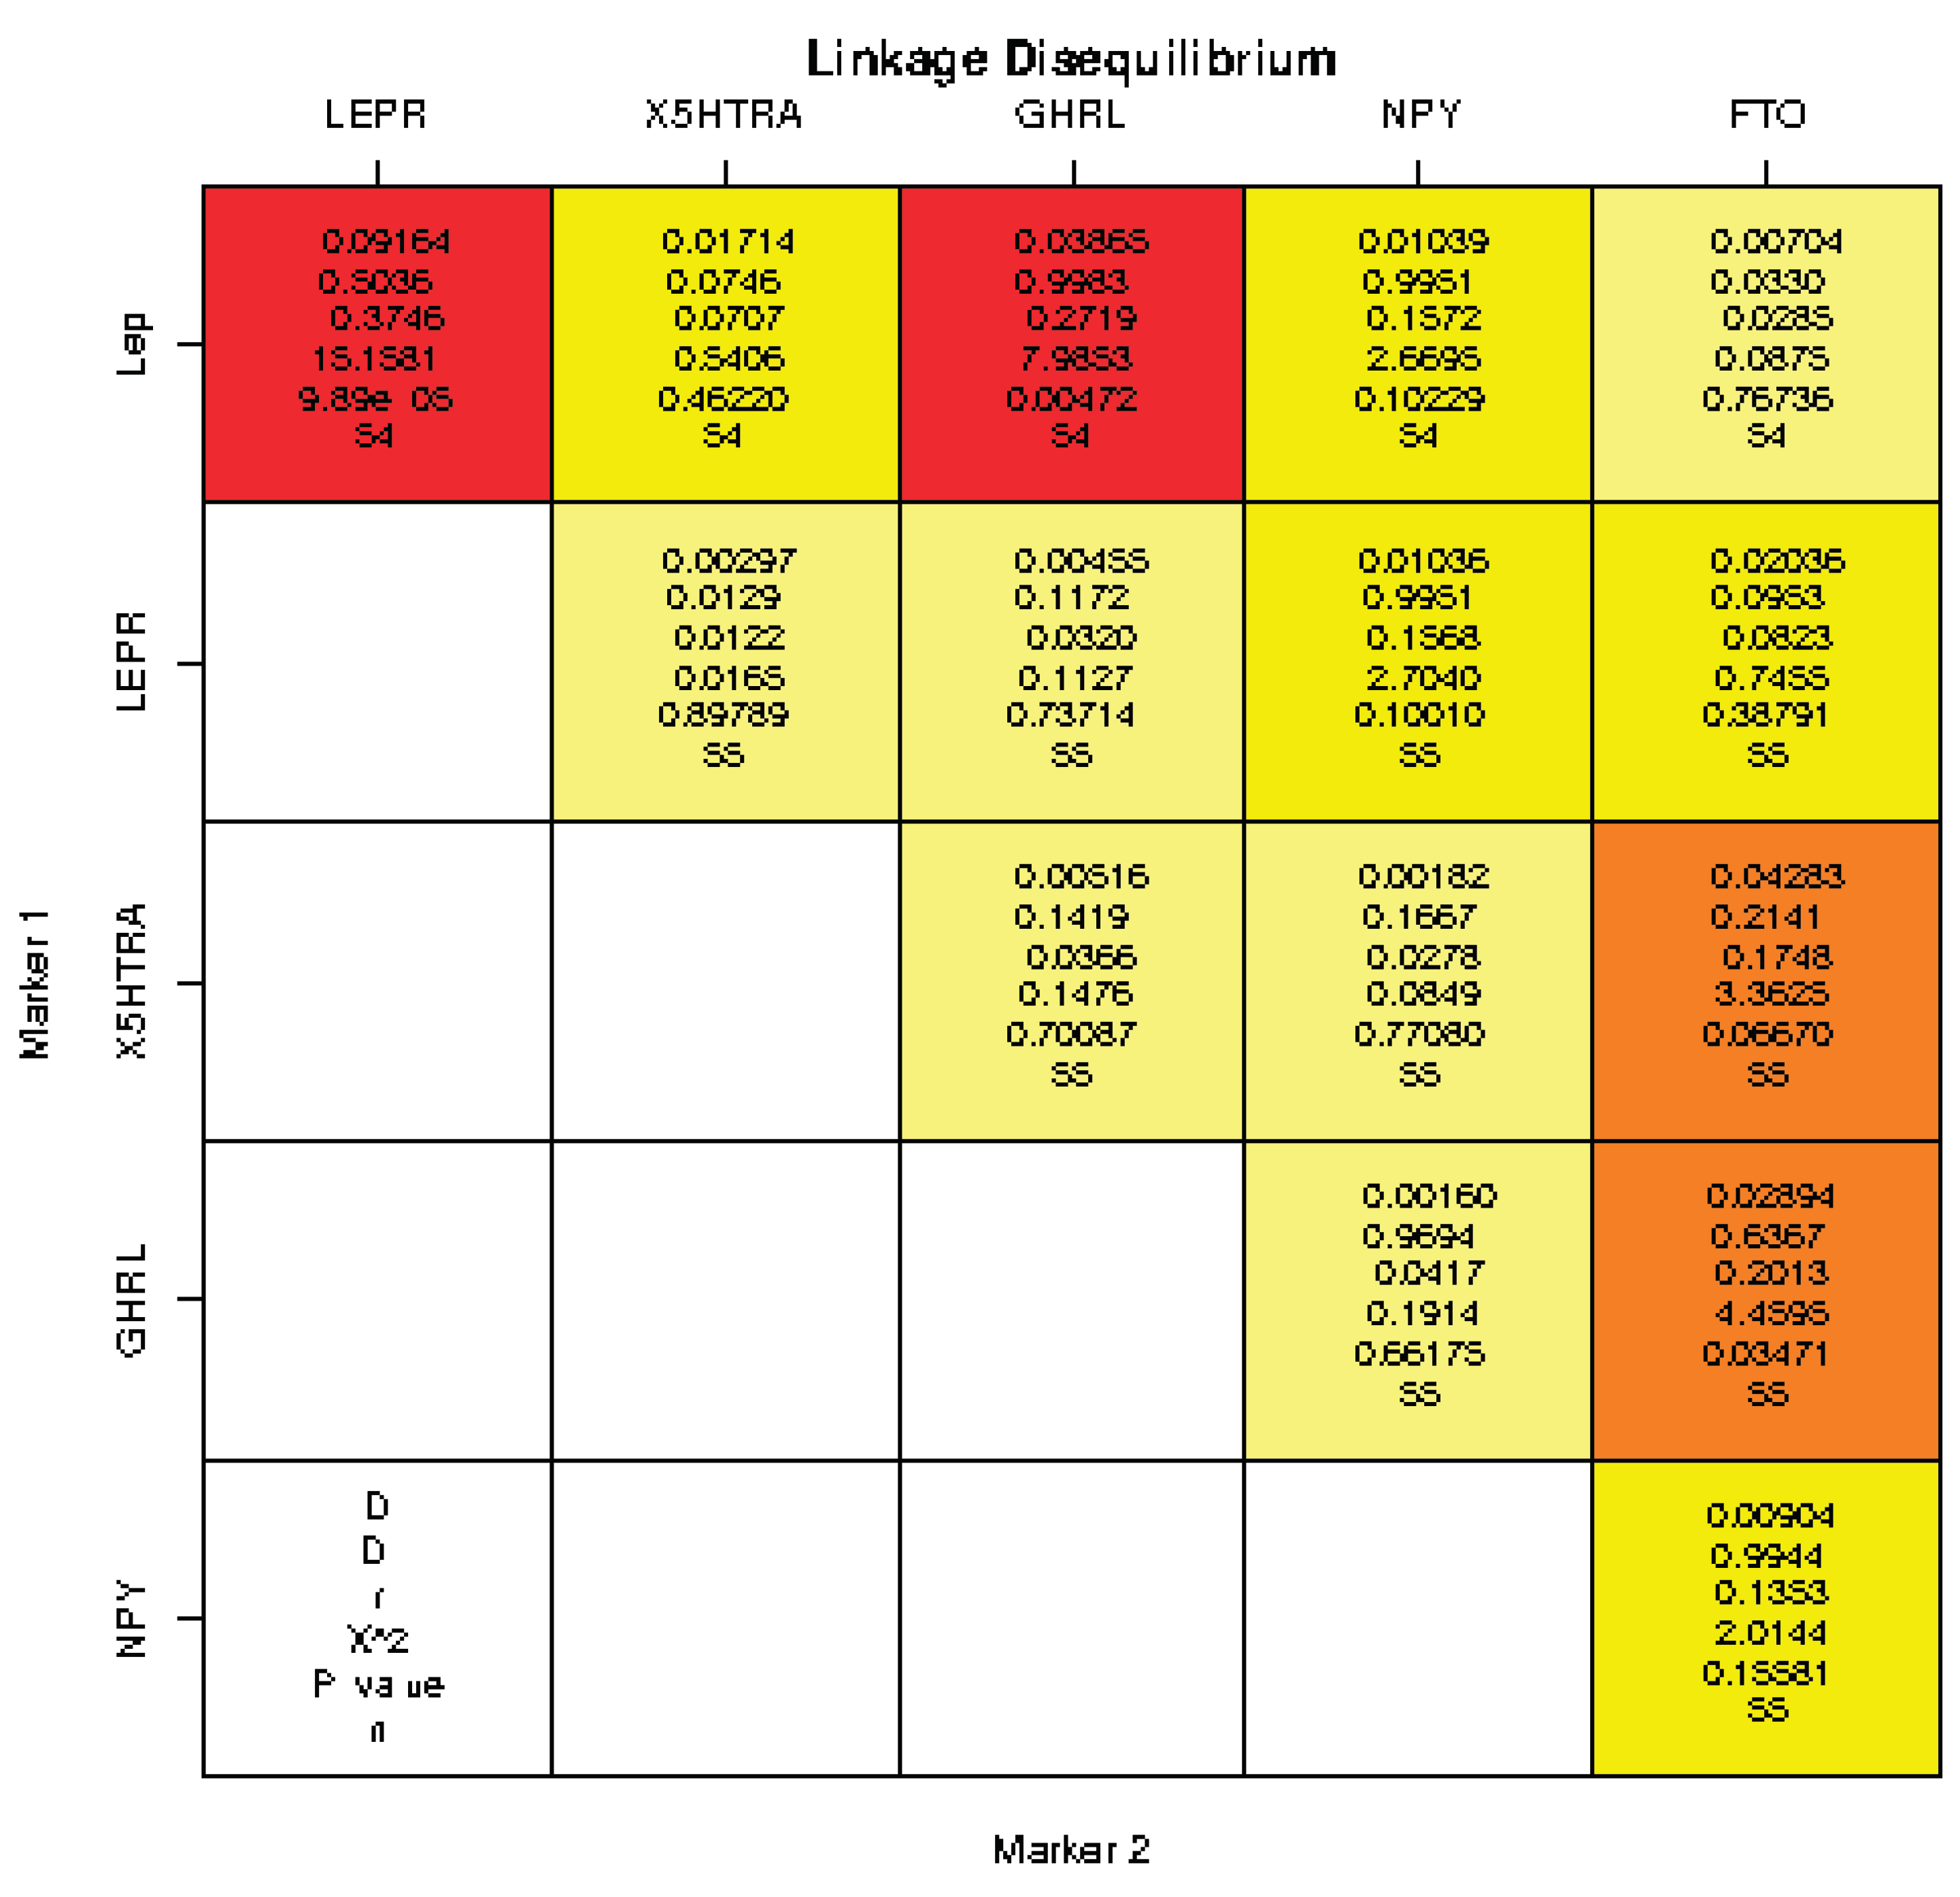
Table 5.
Genotype and codon mutation incidence for each studied gene; statistical significance between the groups of each variable.
Table 5.
Genotype and codon mutation incidence for each studied gene; statistical significance between the groups of each variable.
| 0 | SNP | Genotype 1 | Genotype 2 | Genotype 3 | p value |
|---|---|---|---|---|---|
| LEP | rs7799039 | AA=9 (16.4%) | GA=28 (52%) | GG=17 (30.9%) | p<0.001 |
| LEPR | rs1137101 | QQ=17 (30.9%) | QR=29 (52.7%) | RR=9 (16.4%) | p<0.001 |
| 5HTR2A | rs6311 | AA=12 (21.8%) | GA=20 (36.4%) | GG=23 (41.8%) | p<0.001 |
| GHRL | rs696217 | LL=45 (81.8%) | LM=9 (16.4%) | MM=1 (1.8%) | p<0.001 |
| NPY | rs16139 | LL=53 (96.4%) | LP=2 (3.6%) | N/O | p<0.001 |
| FTO | rs 9939609 | AA= 15 (27.3%) | TA=25 (45.5%) | TT=15 (27.3%) | p<0.001 |
4. Discussion
Single nucleotide polymorphisms are recognized as the leading cause of human genetic variability and are a valuable resource for mapping complex genetic traits. Understanding the difference between genomics and genetics, how various single nucleotide polymorphisms (SNPs) add risk or benefit to an individual, and how we can use the results of these tests to improve metabolic health in our patients was the purpose of our research.
The primary purpose of the study was to look at the association of the LEP (A-2548G), LEPR (rs1137101), 5HTR2A (rs696217), GHRLN (rs696217), NPY, and FTO (rs9939609) SNP (single nucleotide polymorphisms) as identified in introduction with BMI since there is today a vast amount of data around obesity inducing or associated gene mutations candidates for non-syndromic obesity. We confirmed some findings of a previously studied SNP regarding the leptin gene and its receptor associated with BMI. LEP − 2548 GA genotype is one of the most studied human leptin gene (LEP) SNPs in different populations and clinical contexts [41]. Our results correlate with the findings in the research literature that associated common obesity phenotypes with the presence of LEP − 2548 AG genotype [42,43,44]. Like previous studies (Bilge et al. 2021) [45], our association with LEP-2548 GA genotype was a predictor of obesity, close to statistically significant in the male gender. These findings suggest that the presence of the GA allele in the LEP-A2548-G gene may be a potential risk factor for developing overweight or obesity and associated complications. Further research and a higher number of patients are necessary to elucidate the exact mechanisms underlying this genetic association and its implications for understanding obesity and preventing cardio-metabolic complications.
The results of LEP GG genotype binary logistic regression analysis suggest a weak, not statistically significant association between the presence of the GG allele in the LEP gene and a reduced risk of obesity. Patients with GG genotype appear to be approximately 0.269 times less likely to be obese compared to those without this allele. However, it's important to note that the p-value (p=0.06) is above the traditional significance threshold, indicating that this association should be interpreted in the context of our study population. While some studies have identified a significant association of the GG homozygote genotype with obesity in the American population, indicating potential ethnic or geographic variances in the gene's obesity link, the associations between the LEP-2548 GG genotype and obesity have not demonstrated a significant link in our population, indicating possible modulation by additional genetic, environmental, or demographic factors, underscoring the variability and complexity of genetic influences on obesity across different demographic groups [46].
LEPR (leptin receptor gene) polymorphisms did not correlate statistically significantly with overweight or obese patient groups and did not predict a higher risk of obesity in our population study. Patients with the AA genotype in LEPR gene had a 2.5-fold higher risk of obesity compared to those with AG or GG genotypes (although not statistically significant).
Despite 5HTR2A rs6311 AA genotype patients group had almost a six times higher rate of presenting overweight or obesity when it was adjusted for age and gender, this result did not present statistical significance with a p-value close to significant (p=0.06) [47]. Although the values did not show a statistically significant p value, the mean BMI value in AA genotype was higher than AG or GG genotypes, which suggests that AA genotype is related to a high BMI; we look forward to analyzing a higher number of patients for a better analysis. Other studies reported the association of A allele with eating disorders and increased BMI, including German and British patients. Also, research data showed no association between 5HTR2A rs6311 genotypes and obesity [48]. Binary regression analysis suggests that the FTO (rs9939609) AA genotype is a significant predictor of obesity risk, with individuals carrying this polymorphism being more likely to be obese.
Haplotype association analysis showed a suggestive indication of GRGMLA haplotype with susceptibility effect towards obesity predisposition and associated cardio-metabolic complications. Although the results showed a rare frequency (0.0091) this haplotype had almost 30 times higher rate of association with overweight and obesity.
The use of personalized nutrition to optimize diet for patients based on genetic variation and knowing the results the specific diet will give can be a valuable tool for physicians as well for patients also. Further research, particularly focusing on specific subgroups and considering ethnic and geographic factors, is needed to fully understand the role of the studied gene polymorphism in obesity [49].
Our study has limitations. The study had a limited number of participants or lacked diversity in terms of age, ethnicity, or geographic location; this could limit the generalizability of our findings. The sample size was limited to 55 participants included in a pilot study; however, enhanced data is to be analyzed during a broader investigation. The serum leptin and ghrelin level determinations were not available in this study group. Even if the participants were randomly selected, in order of presentation, there might be selection bias considering their approach towards a health enhancement age management program. Other genes and environmental factors that might contribute to obesity were not considered, which could provide a more comprehensive understanding. The study had a cross-sectional design by establishing some associations without determining the cause; thus, longitudinal studies would be needed to confirm these findings over time.
5. Conclusions
Our study underscores the complex relationship between genetic polymorphisms and obesity, suggesting the need for further research to understand the contributing factors better. The study found a significant relationship between the AG genotype in the LEP-A2548G SNP and obesity risk. Individuals with this allele were about seven times more likely to be obese. The male gender showed a five-fold higher risk of carrying the high-risk obesity allele, particularly in the 40-49 age group. In contrast, the GG allele in the same gene was not significantly associated with obesity risk.
Regarding the LEPR-Q223R SNP, no significant associations with obesity risk were found across different genotypes. Similarly, the 5HTR2A-G1439A SNP, GHRL L72M SNP, NPY L7P SNP, and FTO rs9939609 SNP gene polymorphisms showed no significant associations with obesity risk, despite some trends observed. The FTO rs9939609 SNP AA genotype emerged as a significant negative predictor of obesity risk, indicating a decreased likelihood of obesity in individuals with this allele.
These results highlight the intricate relationship between genetic factors and obesity, revealing a complex interplay and underscoring the need for further research to deepen our understanding of these connections. With new technologies that allow us to understand how genes modulate the body's response to nutrition or how nutrition modulates the body's response to mutated genes, scientists are solving the mysteries of metabolic health and primary prevention of cardio-metabolic complications.
Author Contributions
Conceptualization, O.N.P., B.W. and A.L.P.; Data curation, A.L.P., C.Z. and A.S.K.; Formal analysis, O.N.P., B.W., M B-C, A.S.K. and R.V.; Investigation, O.N.P., B.W. and C.Z. Methodology, O.N.P., A.L.P., M B-C and V.N.V.; Project administration, O.N.P. and A.L.P.; Resources, O.N.P. and B.W.; Software, M B-C; Supervision, D.C. and C.Z. Validation, O.N.P., A.L.P. and C.Z. Visualization, B.W., V.N.V., D.C., R.V. and C.Z. Writing – original draft, O.N.P., A.L.P. and M B-C; Writing – review & editing, A.L.P., M B-C and V.N.V..
Funding
This Research received no external funding.
Institutional Review Board Statement
Ethical Committee approval C4/10.2022/Retrospective noninterventional study.
Informed Consent Statement
Informed consent was obtained from all subjects involved in the study.
Data Availability Statement
The data presented in this study are available on request from the corresponding author.
Conflicts of Interest
The authors declare no conflict of interest.
References
- Pepe, R.B.; Lottenberg, A.M.; Fujiwara, C.T.; Beyruti, M.; Cintra, D.E.; Machado, R.M.; Rodrigues, A.; Jensen, N.S.; Caldas, A.P.; Fernandes, A.E.; Rossoni, C. Position statement on nutrition therapy for overweight and obesity: nutrition department of the Brazilian association for the study of obesity and metabolic syndrome (ABESO—2022). Diabetology & Metabolic Syndrome. 2023, 15, 1–53. [Google Scholar]
- Nordang, G.B.N.; Busk, Ø.L.; Tveten, K.; Hanevik, H.I.; Fell, A.K.M.; Hjelmesæth, J.; Holla, Ø.L.; Hertel, J.K. Next-generation sequencing of the monogenic obesity genes LEP, LEPR, MC4R, PCSK1 and POMC in a Norwegian cohort of patients with morbid obesity and normal weight controls. Mol Genet Metab. 2017, 121, 51–56. [Google Scholar] [CrossRef] [PubMed]
- Cuda, S.; Censani, M.; Kharofa, R.; Williams, D.R.; O'Hara, V.; Karjoo, S.; Paisley, J.; Browne, N.T. Social consequences and genetics for the child with overweight and obesity: an obesity medicine association (OMA) clinical practice statement 2022. Obesity Pillars. 2022, 3, 100032. [Google Scholar] [CrossRef] [PubMed]
- Willer, C.J.; Schmidt, E.M.; Sengupta, S.; Peloso, G.; Gustafsson, S.; Kanoni, S.; Ganna, A.; Chen, J.; Buchkovich, M.; Mora, S. others. Discovery and refinement of loci associated with lipid levels. Nature Genetics 2013, 45, 1274. [Google Scholar]
- Locke, A.E.; Kahali, B.; Berndt, S.I.; et al. Genetic studies of body mass index yield new insights for obesity biology. Nature 2015, 518, 197–206. [Google Scholar] [CrossRef]
- Aruoma, O.I.; Hausman-Cohen, S.; Pizano, J.; Schmidt, M.A.; Minich, D.M.; Joffe, Y.; Brady, D.M. Personalized nutrition: translating the science of nutrigenomics into practice: proceedings from the 2018 American College of Nutrition Meeting. Journal of the American College of Nutrition 2019, 38, 287–301. [Google Scholar] [CrossRef] [PubMed]
- Richardson, T.G.; Sanderson, E.; Elsworth, B.; Tilling, K.; Smith, G.D. Use of genetic variation to separate the effects of early and later life adiposity on disease risk: mendelian randomisation study. Bmj 2020, 369, m1203. [Google Scholar] [CrossRef]
- Coc, L.M.C.; Lacatusu, I.; Badea, N.; Penes, O.; Cobelschi, C.P.; Pop, A.; Meghea, A. Curcumin co-loaded with a lipid mediator in the same nanostructured lipid delivery system. 2022, 70, 932–943. [Google Scholar] [CrossRef]
- Bhattacharya, T.; Dutta, S.; Akter, R.; Rahman, M.H.; Karthika, C.; Nagaswarupa, H.P.; Murthy, H.C.A.; Fratila, O.; Brata, R.; Bungau, S. Role of Phytonutrients in Nutrigenetics and Nutrigenomics Perspective in Curing Breast Cancer. Biomolecules. 2021, 11, 1176. [Google Scholar] [CrossRef]
- Boyer, S.W.; Barclay, L.J.; Burrage, L.C. Inherited Metabolic Disorders: Aspects of Chronic Nutrition Management. Nutr Clin Pract. 2015, 30, 502–510, Epub 2015 Jun 16. PMID: 26079521; PMCID: PMC4515158. [Google Scholar] [CrossRef]
- Jamka, M.; Kaczmarek, N.; Mądry, E.; Krzyżanowska-Jankowska, P.; Bajerska, J.; Kręgielska-Narożna, M.; Bogdański, P.; Walkowiak, J. Metabolic Health in Obese Subjects-Is There a Link to Lactoferrin and Lactoferrin Receptor-Related Gene Polymorphisms? Nutrients. 2020, 12, 2843, PMID: 32957486; PMCID: PMC7551427. [Google Scholar] [CrossRef]
- Liao, C.; Glodowski, C.R.; Fan, C.; Liu, J.; Mott, K.R.; Kaushik, A.; Vu, H.; Locasale, J.W.; McBrayer, S.K.; DeBerardinis, R.J.; Perou, C.M.; Zhang, Q. Integrated Metabolic Profiling and Transcriptional Analysis Reveals Therapeutic Modalities for Targeting Rapidly Proliferating Breast Cancers. Cancer Res. 2022, 82, 665–680, PMID: 34911787; PMCID: PMC8857046. [Google Scholar] [CrossRef]
- Lewis, R. Genome-wide association studies. In Human genetics: concepts and application, Series “WCB Cell & Molecular Biology”, 11th ed.; McGraw–Hill Education, 2015; pp. 139–142. [Google Scholar]
- Peneş, N.O.; Weber, B.; Păun, S.D. Role of genetic polymorphism in nutritional supplementation therapy in personalized medicine. Rom J Morphol Embryol, 2017, 58, 53–58. [Google Scholar]
- Barreiro, L.B.; Laval, G.; Quach, H.; Patin, E.; Quintana-Murci, L. Natural selection has driven population differentiation in modern humans. Nat Genet, 2008, 40, 340–345. [Google Scholar] [CrossRef]
- Lin, J.; Xie, Z.; Lan, B.; Guo, Z.; Tang, W.F.; Liu, C.; Zhang, S.; Chen, G.; Guo, F.; Chen, Y. Investigation of Leptin and its receptor (LEPR) for single nucleotide polymorphisms in colorectal cancer: a case-control study involving 2,306 subjects. Am J Transl Res. 2020, 12, 3613–3628, PMID: 32774722; PMCID: PMC7407677. [Google Scholar] [CrossRef]
- Ruiz-Castell, M.; Le Coroller, G.; Landrier, J.-F.; Kerkour, D.; Weber, B.; Fagherazzi, G.; Appenzeller, B.M.R.; Vaillant, M.; Bohn, T. Micronutrients and Markers of Oxidative Stress and Inflammation Related to Cardiometabolic Health: Results from the EHES-LUX Study. Nutrients 2021, 13, 5. [Google Scholar] [CrossRef]
- Alfaqih, M.A.; Elsalem, L.; Nusier, M.; Mhedat, K.; Khader, Y.; Ababneh, E. Serum Leptin Receptor and the rs1137101 Variant of the LEPR Gene Are Associated with Bladder Cancer. Biomolecules. 2023, 13, 1498, PMID: 37892180; PMCID: PMC10604959. [Google Scholar] [CrossRef] [PubMed]
- Mazahreh, T.S.; Alfaqih, M.; Saadeh, R.; Al-Zoubi, N.A.; Hatamleh, M.; Alqudah, A.; Aleshawi, A.J.; Alzoubi, A. The Effects of Laparoscopic Sleeve Gastrectomy on the Parameters of Leptin Resistance in Obesity. Biomolecules. 2019, 9, 533. [Google Scholar] [CrossRef] [PubMed]
- Yu, B.; Battaglia, D.M.; Foster, T.P.; Nichols, C.D. Serotonin 5-HT2A receptor activity mediates adipocyte differentiation through control of adipogenic gene expression. Sci Rep. 2021, 11, 19714. [Google Scholar] [CrossRef] [PubMed]
- Halder, I.; Muldoon, M.F.; Ferrell, R.E.; Manuck, S.B. Serotonin receptor 2A (HTR2A) gene polymorphisms are associated with blood pressure, central adiposity, and the metabolic syndrome. Metab Syndr Relat Disord. 2007, 5, 323–30. [Google Scholar] [CrossRef] [PubMed]
- Genis-Mendoza, A.D.; Ruiz-Ramos, D.; López-Narvaez, M.L.; Tovilla-Zárate, C.A.; Rosa Garcia, A.; Cortes Meda, G.; Nicolini, H. Genetic association analysis of 5-HTR2A gene variants in eating disorders in a Mexican population. Brain and behavior, 2019, 9, e01286. [Google Scholar] [CrossRef]
- Al-Nbaheen, M.S. Relationship between single nucleotide polymorphism studies in ghrelin gene with obesity subjects. Journal of King Saud University-Science. 2023, 35, 102393. [Google Scholar] [CrossRef]
- Human assembly GRCh37. Available online: https://grch37.ensembl.org/Homo_sapiens/Gene/Ontologies/biological_process?db=core;g=ENSG00000122585;r=7:24323782-24331484 (accessed on 20 November 2023).
- Ullamari Pesonen, NPY L7P polymorphism and metabolic diseases. Regulatory Peptides 2008, 149, 51–55. [CrossRef]
- Yeung, E.H.; Zhang, C.; Chen, J.; Bowers, K.; Hu, F.B.; Kang, G.; Qi, L. Polymorphisms in the neuropeptide Y gene and the risk of obesity: findings from two prospective cohorts. J Clin Endocrinol Metab. 2011, 96, E2055–E2062, Epub 2011 Sep 21. PMID: 21937627; PMCID: PMC3232624. [Google Scholar] [CrossRef]
- Katus, U.; Villa, I.; Ringmets, I.; Veidebaum, T.; Harro, J. Neuropeptide Y gene variants in obesity, dietary intake, blood pressure, lipid and glucose metabolism: A longitudinal birth cohort study. Peptides. 2021, 139, 170524. [Google Scholar] [CrossRef] [PubMed]
- Peters, T.; Ausmeier, K.; Dildrop, R.; Rüther, U. The mouse Fused toes (Ft) mutation is the result of a 1. 6-Mb deletion including the entire Iroquois B gene cluster. Mamm. Genome. 2002, 13, 186–188. [Google Scholar] [CrossRef]
- Tan, L.; Zhu, H.; He, H.; Wu, K.; Li, J.; Chen, X.; Zhang, J.G.; Shen, H.; Tian, Q.; Krousel-Wood, M.; et al. Replication of 6 obesity genes in a meta-analysis of genome-wide association studies from diverse ancestries. PLoS ONE. 2014, 9, e96149. [Google Scholar] [CrossRef]
- Dastgheib, S.A.; Bahrami, R.; Setayesh, S.; Salari, S.; Mirjalili, S.R.; Noorishadkam, M.; Sadeghizadeh-Yazdi, J.; Akbarian, E.; Neamatzadeh, H. Evidence from a meta-analysis for association of MC4R rs17782313 and FTO rs9939609 polymorphisms with susceptibility to obesity in children. Diabetes Metab. Syndr. 2021, 15, 102234. [Google Scholar] [CrossRef] [PubMed]
- Frayling, T.M.; Timpson, N.J.; Weedon, M.N.; Zeggini, E.; Freathy, R.M.; Lindgren, C.M., ... & McCarthy, M. I. (2007). A common variant in the FTO gene is associated with body mass index and predisposes to childhood and adult obesity. Science 2007, 316, 889–894.
- Scuteri, A.; Sanna, S.; Chen, W.M.; Uda, M.; Albai, G.; Strait, J... & Abecasis, G.R. (2007). Genome-wide association scan shows genetic variants in the FTO gene are associated with obesity-related traits. PLoS genetics 2007, 3, e115.
- Speakman, J.R.; Loos RJ, F.; O’Rahilly, S.; Hirschhorn, J.N.; Allison, D.B. GWAS for BMI: a treasure trove of fundamental insights into the genetic basis of obesity. International journal of obesity 2018, 42, 1524–1531. [Google Scholar] [CrossRef] [PubMed]
- Ağagündüz, D.; Gezmen-Karadağ, M. Association of FTO common variant (rs9939609) with body fat in Turkish individuals. Lipids Health Dis. 2019, 18, 212, PMID: 31810473; PMCID: PMC6896279. [Google Scholar] [CrossRef]
- Bratti LD, O.S.; Nunes, B.F.; Gorges, D.M.; Filippin-Monteiro, F.B. In silico approach to identify non-synonymous missense variants in human obesity-related genes: Comprehensive analyses in variants reported in Brazilian databases. Human Gene, 2023, 36, 201174. [Google Scholar] [CrossRef]
- Constantin, A.; Costache, G.; Sima, A.V.; Glavce, C.S.; Vladica, M.; Popov, D.L. Leptin G-2548A and leptin receptor Q223R gene polymorphisms are not associated with obesity in Romanian subjects. Biochemical and biophysical research communications. 2010, 391, 282–286. [Google Scholar] [CrossRef] [PubMed]
- Nasui, B.A.; Toth, A.; Popescu, C.A.; Penes, O.N.; Varlas, V.N.; Ungur, R.A.; Ciuciuc, N.; Silaghi, C.A.; Silaghi, H.; Pop, A.L. Comparative Study on Nutrition and Lifestyle of Information Technology Workers from Romania before and during COVID-19 Pandemic. Nutrients 2022, 14, 1202. [Google Scholar] [CrossRef]
- WHO European Regional Obesity Report 2022. Available online: https://iris.who.int/bitstream/handle/10665/353747/9789289057738-eng.pdf?sequence=1 (accessed on 4 November 2023).
- J. Weller, A. Manju, Sudharmadevi K, Anilkumar, Thottathil R. Vysakh, G. Leena, Balakumaran K. Lekshminarayan, Vijayalekshmi Kumar, Pradeep G. Shenoy, Trivikrama K. 2022 2022/12 A Case-Control Study of the Association of Leptin Gene Polymorphisms with Plasma Leptin Levels and Obesity in the Kerala Population. J Obes 2022, 2022, 1040650.
- Dina, C.; Meyre, D.; Gallina, S.; Durand, E.; Korner, A.; Jacobson, P.; Carlsson, L.M.; Kiess, W.; Vatin, V.; Lecoeur, C.; et al. Variation in FTO contributes to childhood obesity and severe adult obesity. Nat. Genet. 2007, 39, 724–726. [Google Scholar] [CrossRef]
- Portolés, J. V. Sorlí, F. Francés et al., “Effect of genetic variation in the leptin gene promoter and the leptin receptor gene on obesity risk in a population-basedcase-control study in Spain,”. European Journal of Epidemiology 2006, 21, 605–612. [CrossRef]
- Mammès, O.; Betoulle, D.; Aubert, R.; Herbeth, B.; Siest, G.; Fumeron, F. Association of the G-2548A polymorphism in the 5′ region of the LEP gene with overweigh. Human Genetics 2000, 64, 391–394. [Google Scholar] [CrossRef]
- Sabi, E.M.; Bin Dahman, L.S.; Mohammed, A.K.; Sumaily, K.M.; Al-Daghri, N.M. -2548G> A LEP Polymorphism Is Positively Associated with Increased Leptin and Glucose Levels in Obese Saudi Patients Irrespective of Blood Pressure Status. Medicina 2022, 58, 346. [Google Scholar] [CrossRef]
- Kaur, H., Bains, V., Sharma, T., & Badaruddoza. (2022). Relationship between leptin gene variants (–2548G> A and 19A> G) and obesity among north Indian Punjabi population. Journal of Genetics 2022, 102, 6.
- Bilge, S.; Yılmaz, R.; Karaslan, E.; Özer, S.; Ateş, Ö.; Ensari, E.; Demir, O. The Relationship of Leptin (+19) AG, Leptin (2548) GA, and Leptin Receptor Gln223Arg Gene Polymorphisms with Obesity and Metabolic Syndrome in Obese Children and Adolescents. Pediatr Gastroenterol Hepatol Nutr. 2021, 24, 306–315, Epub 2021 May 4. PMID: 34046334; PMCID: PMC8128779. [Google Scholar] [CrossRef] [PubMed]
- Zhang L, Yuan LH, Xiao Y, Lu MY, Zhang LJ, Wang Y. Association of leptin gene -2548 G/A polymorphism with obesity: a meta-analysis. Ann Nutr Metab. 2014, 64, 127–136, Epub 2014 Jul 12. PMID: 25034151. [CrossRef] [PubMed]
- Ricca, V. , Nacmias, B. , Cellini, E. , Di Bernardo, M. , Rotella, C. M. , & Sorbi, S. (2002). 5-HT2A receptor gene polymorphism and eating disorders. Neuroscience Letters 2022, 323, 105–108. [CrossRef]
- Kring, S. I., Werge, T., Holst, C., Toubro, S., Astrup, A., Hansen, T., ... & Sørensen, T. I. (2009). Polymorphisms of serotonin receptor 2A and 2C genes and COMT in relation to obesity and type 2 diabetes. PLoS One 2009, 4, e6696.
- O'Rahilly S, Farooqi IS. Genetics of obesity. Philos Trans R Soc Lond B Biol Sci. 2006, 361, 1095–1105, PMID: 16815794; PMCID: PMC1642700. [CrossRef]
Disclaimer/Publisher’s Note: The statements, opinions and data contained in all publications are solely those of the individual author(s) and contributor(s) and not of MDPI and/or the editor(s). MDPI and/or the editor(s) disclaim responsibility for any injury to people or property resulting from any ideas, methods, instructions or products referred to in the content. |
© 2024 by the authors. Licensee MDPI, Basel, Switzerland. This article is an open access article distributed under the terms and conditions of the Creative Commons Attribution (CC BY) license (http://creativecommons.org/licenses/by/4.0/).
Copyright: This open access article is published under a Creative Commons CC BY 4.0 license, which permit the free download, distribution, and reuse, provided that the author and preprint are cited in any reuse.


