Submitted:
17 February 2024
Posted:
19 February 2024
You are already at the latest version
Abstract
The conformity assessment of products or a measured value with the given standards is carried out based on the global risk of producers and consumers calculation. A product may conform to specifications but be falsely rejected as non-conforming. This is about the producer's risk. If a product doesn't meet the requirements but is falsely accepted as conforming, that poses a risk to the consumer. The conventional approach to risk assessment, which yields only a single numerical value for the global risk of producers and consumers, is naturally extended, and utilized for assessing risk in measurement models with linear regression. The outcomes of the two-dimensional extension, along a moderate scale, are the parabolas with an opening upwards. Risk surfaces were obtained through three-dimensional extension over the area limited by the moderate scale and guard band axes. Four models with different ranges of tolerance intervals were used to test this innovative method of risk assessment in linear regression. The corresponding standard measurement uncertainties are determined by applying a simplified measurement model with the use of comprehensive data on the measurement performance and by determining measurement uncertainty derived from consideration of the functional relationship obtained by linear regression analysis. Models that utilize information from linear regression analysis to determine measurement uncertainty are biased towards risks at the edges of the moderate scale. Testing the model's performances with metrics related to the confusion matrix, such as the F1 score, further substantiated this assertion. The diagnostic odds ratio has been proven to be extremely effective in identifying the curve along the guard band axis, along which the global risks of producers and consumers are at their lowest.
Keywords:
regression
; consumer’s risk
; producer’s risk
; tolerance interval
; measurement uncertainty
1. Introduction
Regression is the most used statistical method, applied for various purposes, and in different scientific disciplines, including metrology. The basic purpose of regression is the prediction of a value that has not been measured, but which can be estimated based on the regression line or regression plane. So, for example, a regression can be used to predict the cutting temperature and surface roughness during the face milling process [1], or for predicting and monitoring vibrations on a lathe machine [2]. Regression can also be used to characterize various devices and sensors: for atomic force microscope characterization [3] or magnetic field sensors characterization [4]. It is most often used in calibration: from calibrating pressure against ruby fluorescence shift [5] to calibration that describes the pressure sensitivities of the optical fibre sensors [6]. Furthermore, regression is often used in interlaboratory comparison studies of calibration standards in different fields [7,8], or for the analysis of different physical constants [9,10].
The application of regression involves measuring the value of the response variable that corresponds to the given values of the explanatory variable [11]. There are existing numerous regression techniques that can be used to determine the relationship between these variables [12]. Among all, a straight-line relationship is the simplest one. This, the most common way of connecting only one independent (explanatory) variable and the dependent (response) variable, is called univariate linear regression. The subject of this paper concerns the risk assessment for linear univariate regression models in metrology.
All recommendations and standards related to metrology are issued by the international metrology organization International Bureau of Weights and Measures (Bureau International des Poids et Mesures, BIPM). The basic procedure for risk assessment for an item of interest is given by the guide Evaluation of measurement data – The role of measurement uncertainty in conformity assessment 106:2012 [13]. However, this method of risk assessment, well-known in metrology, has not been applied for regression so far. According to [14] (p. 15), and [15,16] guidelines called JCGM 107, for the application of the least squares method, the most famous method for determining the coefficients of the regression line, are still in preparation. It is not yet known whether these guidelines will include a risk assessment.
Risk assessment is carried out in the process of assessing the conformity of a product with specified requirements. Two types of risks may arise during conformity assessment. The producer’s risk refers to situations where measurements or products meet the re-quired specifications but are rejected as non-conforming. Consumer risk refers to situations when products or measurements are accepted as conformed but do not meet specifications. Whether a product conforms to the given specifications or not is determined based on measurements. The measured value of the item of interest must be within the given tolerance interval. The measurement uncertainty that occurs during measurement may lead to incorrect decisions regarding the acceptance of a non-compliant product or the rejection of a product that meets the specifications. This happens when the measurement is close to either the lower limit of the tolerance interval or upper limit of the tolerance interval , and the measurement uncertainty associated with that measured value goes over the tolerance interval [17,18,19,20,21].
It is important to emphasize that the tolerance interval in the metrology domain is different from the regression tolerance interval in the statistical domain. The statistical tolerance regions also known as simultaneous tolerance intervals, are constructed so that, with a certain level of confidence, contain a specified proportion of the population in future sampling [22,23]. For reasons that will be elaborated upon further in the text, it is not feasible to apply these simultaneous tolerance intervals for the model of risk assessment in regression presented in this paper. The tolerance interval in the metrology domain is established by the manufacturer in its specifications for a particular measuring device, or this interval is determined by the applicable standards.
The risk assessment method outlined in this paper can be applied not only in metrology but also in general in all regression models, regardless of the area in which the data originates. Therefore, this manuscript gives alternative values for the tolerance interval that can be used when the values for the tolerance interval provided by the manufacturer are unavailable.
To reduce the impact of measurement uncertainty on risk assessment, an acceptance interval is introduced into the procedure for evaluating the conformity of products with the prescribed specifications, in addition to the tolerance interval. The marks and represents lower and upper limits of the acceptance interval, respectively. Acceptance and tolerance intervals can be in different mutual relations [24]. The limits of the tolerance interval and the acceptance interval depend on the properties of the measurand. These can be semi-open or semi-closed intervals [25]. Furthermore, that can be closed intervals, as in this case. If the tolerance interval is within the acceptance interval, it is a model of minimization of the producer’s risk, as illustrated in Figure 1a. If the tolerance interval is outside the acceptance interval, it is a consumer risk minimization model (Figure 1c) [26]. A special situation when tolerance and acceptance interval overlap, is when it is valid that , and . This is called shared risk (Figure 1b).
The guard band of length , between the tolerance interval and the acceptance interval, ensures a reduction in the probability of making wrong decisions. In practice, it is commonly recommended to minimize the consumer’s risk to enhance the quality of the delivered products. However, it is feasible to set the length of the guard band so that both the customer and the producer are satisfied.
When measuring, it is assumed that the object of interest has a measurable property with possible values It is natural to assume that there exists historical data about the item of interest, such as those found in manuals, scientific papers, data from previous measurements, and the like. Also, one can talk about prior beliefs of the measurer based on experience about possible values that will be obtained during the measurement, or about the possible distribution of parameters that describe the measured data. Such data are treated as random variables. Knowledge about these data is given by prior distribution, that is, by probability density function (PDF), designated with [13]. Depending on the available data, the prior can be a non-parametric, one-parameter or two-parameter distribution [27,28]. According to the principle of maximum entropy (PME), if data for two moments are available, a two-parameter distribution is used for the prior [29,30,31]. In this manuscript, the prior is a normal distribution whose parameters are the best estimate of a measurand , with an associated standard measurement uncertainty .
The data associated with the measurements are also treated as a random variable. The values that this random variable can take are denoted by Random variable , is modeled via the likelihood function for normal distribution and denoted by [13]. The formula for the likelihood function involves standard measurement uncertainty of some future measurement.
Global consumer’s risk and global producer’s risk are calculated probabilistically, using Bayes’ theorem. This is done by combining information on the prior distribution and the likelihood function, that is, by combining information on the random variables Y and [13,19], [32,33]. If the values for Y are outside the tolerance interval, and the values for within the acceptance interval, it is about the global consumer’s risk If the values for Y are within the tolerance interval, and the values for are outside the acceptance interval, it is about the global producer’s risk .
The risk assessment method can be applied when product quality is evaluated based on only one measured quantity [13]. For example: when determining the roundness deviation of the inner ring of the bearing [34], or when estimating the thickness of the epoxy coating applied to water pipes [25]. This approach can also be used to evaluate conformity with the specifications for each, distinct property of the item of interest [35]. It is also possible to assess the risk of multi-component models where several factors can affect the quality of the product [36,37]. Examples include risk assessment in food quality control and food supplements [38,39], risk assessment in drug quality control [40], air quality control [41], the chromatography process [42], pharmaceutical equivalence studies when comparing generic and reference drugs [43], and other related areas.
When the tolerance interval and acceptance interval are closed intervals, and in the case of risk evaluation for a single property of an item of interest, there exist two distinct models for the risk assessment: centered, and non-centered models (Figure 2).
For the centered model, the best estimate of a measurand is exactly in the middle of the acceptance and tolerance interval, which is not the case with the non-centered model. This approach to risk assessment for a single measurable property, based on intervals of tolerance and acceptance, yields only one numerical value for the global risk of the producer, i.e. the consumer. It is evident that this method naturally can be extended to the two-dimensional case, where the outcomes are iso-risk curves, or to the three-dimensional case, where the results are risk surfaces, as demonstrated in this paper.
2. Materials and Methods
2.1. Measurement Description
This article is focused on the development of a model for risk assessment in regression. Therefore, the measurement procedure utilized to collect the processed data is briefly described in the article.
The risk assessment was based on the information gathered during the calibration of the roundness measurement device, Mahr MMQ3. The calibration procedure consists of calibrating the inductive contact probe (dial indicator) on the Universal Length Measuring Machine (ULM) and determining the errors in the rotation of the measuring device spindle using the sphere standard [44]. All measurements were carried out in the Laboratory for Precise Measurement of Length of the Faculty of Mechanical Engineering and Naval Architecture, University of Zagreb. Key data for risk assessment were collected in the process of calibrating the inductive contact probe.
The risk assessment was carried out on a moderate scale from µm to µm. For each reference value of the moderate scale, were performed three measurements (Table 1).
2.2. Model Parameters
The input parameters needed for the calculation of the global consumer’s risk and global producer’s risk are as follows: the best estimate of a measurand with their associated standard uncertainty , then the tolerance interval and acceptance interval, and measurement uncertainty of a future inspection process.
2.2.1. Best Estimate of a Measurand
In assessing risk in regression models, the best estimates of a measurand can be obtained by calculating the values for the regression line in the points of the reference scale In that case, the best estimate of the measured quantity is represented by the vector and the risk is estimated for each of the values of the regression line The coefficients (intercept) and (slope) of the regression line were obtained by the well-known least squares (LS) method from a simple linear regression model:
where the intercept and slope are the model parameters and For simplicity, in the subsequent text, where appropriate, the designation is utilized. Values are random errors [45,46]. Model parameters and were estimated for each pair of observations [47] (pp. 76-78). The best estimates, and , of the parameters and are obtained by the least square method by minimizing the sum of the squared residuals:
According to [45] and [48], it is not difficult to show that is:
where is and that is:
The value of in expressions (3) and (4) represents the arithmetic mean of the values of the moderate scale:
It should be noticed that the values of the moderate scale are equidistant. Also, the values from the left side of zero on the moderate scale are of the opposite sign when compared to the values from the right side of the moderate scale. That’s why it’s always worth that is The value of in equations (3) and (4) is calculated from:
To estimate the measurement uncertainty based on the law of propagation of uncertainty (LPU) applied to the functional relationship of the input data, whisch was obtained from the linear regression analysis, two additional quantities are crucial: the standard error of slope and the standard error of intercept That quantities were calculated from the following equations:
and
The estimator for in the variable is equal to the variance of the regression [46], so it is valid:
The fitted regression line for data in Table 1 has the form:
The standard deviation of slope and intercept are respectively µm and µm. The result for residual standard deviation in variable is equal to µm and the coefficient of determination is Based on the Shapiro–Wilks test, at the significance level it was concluded that the residuals follow a normal distribution (Table S1). Residual diagnostics were also performed based on the residuals graph, Q-Q normal plot, and residual density graph (Figure S1).
2.2.2. Measurement Uncertainty
The standard uncertainty associated with the best estimate of a measurand was determined in two ways: by applying a simplified measurement model with the use of comprehensive data on measurement performance and by applying a statistical model, specifically the linear regression analysis (LRA), which was adapted to the measurement data.
A simplified measurement model that describes the measurement uncertainty of probe calibration is expressed by following equation:
where represents combined standard uncertainty of the probe calibration. Value denoted as is standard uncertainty due to the influence of the accuracy of the ULM device. The marks and stands for standard uncertainty of the linear error due to the error of the probe tilt angle and for standard uncertainty of the linear error due to the error of the probe position, respectively. From experience it is known that the error of the probe tilt angle can amount to a maximum of and that the error of the probe position can amount to a maximum of 0.3 mm. The standard uncertainty due to the influence of the resolution of the measuring device is indicated with The components that contribute to the uncertainty of measurement results and their contributions to the combined measurement uncertainty are given in Table 2.
The input parameter , calculated in the risk assessment procedure, based on the expression for the combined measurement uncertainty [49] (p. 21) amounts to µm. The mark stands for in further text. The measurement uncertainty, which is calculated in this way is the same for all points on the moderate scale . All components that enter the calculation of the combined measurement uncertainty of the probe have the sensitivity coefficient
Another approach to evaluating measurement uncertainty involves utilizing a statistical model and a functional relationship derived from linear regression analysis (LRA) [50,51]. The measurement uncertainty was calculated after the measurement is performed, and after the regression line was determined. This procedure encompasses the computation of the partial derivatives of the expression for the regression line and the incorporation of standard errors for the slope and intercept in the calculation of the measurement uncertainty [52,53]. Measurement uncertainty calculated using LRA is carried out for the equation:
The uncertainty to be evaluated in the regression model is the uncertainty of the random variable evaluated for the given value of the explanatory variable According to [49,53], this measurement uncertainties can be calculated from the equation:
where the standard uncertainty associated with the input quantity is equal to
The numerical calculation yields a value of for the data from Table 1. According to [52], the standard uncertainty arising from the dependence of the parameters and equals:
It is important to notice that the expression in equation (13) due to (15) only depends on the squares of the reference values of the moderate scale Therefore, the graph of measurement uncertainties, evaluated at the points of the moderate scale is a parabola with an opening upwards, axisymmetric concerning the direction (Figure 3).
The measurement uncertainty calculated using the expression for the combined measurement uncertainty is the same for all points of the moderate scale . In contrast, the measurement uncertainties calculated by the LRA method are different for different points of the scale. The vector of measurement uncertainties, calculated by the LRA is denoted by The point in the middle of the moderate scale has the lowest measurement uncertainty, and the points on the edges have the highest measurement uncertainty. The values of measurement uncertainties for each point of the moderate scale calculated by LRA are given in Table S2. In comparison with the value the values are underestimated.
When calibrating devices, there is usually no historical data from previous measurements about the slope and intercept of the regression line or their standard errors. A well-performed calibration yields a slope close to one and an intercept close to zero. For the measurer, it would be extremely difficult, to determine, based on prior beliefs, what values can have a slope and an intercept. Especially when it is taken into consideration that these values should be given to at least two decimal places. That kind of guessing would inevitably lead to an incorrect risk assessment. It is an even bigger problem if the data comes from other non-metrology models, where the values for slope and intercept can be any. Therefore, the risk assessment problem for regression is reformulated so that the calibration data shown in Table 1 are used to determine the data and that are included in the expression for the prior distribution The input parameter of the likelihood function is assumed to be the standard measurement uncertainty of a future inspection process. The behavior of global consumer’s and producer’s risk was tested for three different cases: for for and
In that regard, the contribution of this paper is a proposal to indicate the data for the regression line obtained during the calibration procedure, thereby enabling the measurer to be guided by these data in future measurements. This would allow traceability in the risk assessment.
2.2.3. Tolerance and Acceptance Interval
In the present study, four models were examined concerning the width of the tolerance interval: M1, M2, M3, and M4. The conventional tolerance interval for each point of the moderate scale was obtained based on the information provided by the manufacturer. The total span of error in both directions for the inductive contact probe in the standard range µm amounts to µm. Based on this information, it is assumed that in the first observed model M1, the range of tolerance interval for each point of the moderate scale is µm. Individual values of the upper and lower limits of the tolerance interval were determined for each reference value of the measuring range. Through these points, a straight line can be drawn. These lines are parallel and symmetrically positioned relative to the line , i.e., symmetrically relative to the line obtained for a perfect measurement. Therefore, can be spoken about the upper and lower tolerance lines. In this sense, this model is linearized.
If information about the tolerance interval does not exist, it can alternatively be taken that the range of the tolerance interval for each point of the reference scale of the moderate area, is equal to Model M2, where the range of the tolerance interval is is also linearized. Model M3, where was analyzed as well. In this model, the tolerance interval is placed symmetrically around the line, but the range of tolerance interval at the edges of the measurement area is wider than the range of tolerance interval in the middle of the scale. This model is non-linearized and can be spoken about as an upper and lower tolerance curve. These tolerance interval ranges and were chosen according to the 4-sigma and 6-sigma rules.
The global consumer’s and producer’s risk also was estimated for model M4. This model favors the minimal value of measurement uncertainty calculated using LRA. For that model is valid. Model M4 is artificially linearized based on model M3. An example of a linearized and non-linearized model is given in Figure 4.
The primary distinction between the statistically defined simultaneous tolerance intervals and the tolerance intervals outlined in this paper lies in their construction. The tolerance intervals in this study are positioned around the line that describes the perfect measurement. Simultaneous tolerance intervals are constructed relative to the fitted regression line [54]. When constructing a two-sided simultaneous tolerance interval, according to [54], for the lower and upper limits of the tolerance interval are valid:
and
where is a constant which can be calculated using the formula given in [55] or using tabulated values in [56]. It follows from equations (16-17) that is:
If the simultaneous tolerance interval were to be constructed around the line as is the case with the other described tolerance intervals, then, due to (9), it would be valid that . For this reason, simultaneous tolerance intervals cannot be applied in the risk assessment procedure for regression models defined in this paper.
If the tolerance interval is within the acceptance interval, then the maximum range of the acceptance interval is equal to , in all models (Figure 1a). If the acceptance interval is within the tolerance interval, then the maximum range of the acceptance interval is (Figure 1c). For the shared risk, applies (Figure 1b). The range of the acceptance interval was chosen so that the global producer’s risk surface intersects with the global consumer’s risk surface. For simplicity and transparency, the basic data on the analyzed models are given in Table 3.
Finally, it should be emphasized that the risk assessment was carried out for the regression line even though the data from Table 1 were collected during the calibration procedure. During the calibration procedure, the measurement uncertainty determined according to the LRA, instead of for from equation (13), would be determined for the values of the moderate scale The equation for is obtained from the expression (12) for the regression line [53] (p. 872). Furthermore, to calculate the risk for the calibration procedure, it is necessary to invert the tolerance and acceptance intervals constructed for the regression line to obtain the tolerance and acceptance intervals for the explanatory variable [57] (p.29).
2.3. Risk Calculation
The paper observes the behavior of the global producers’ risk and global consumers’ risk at points defined along the guard band axis and along the moderate scale. As a result of the analysis, according to the procedure described below, risk surface were obtained.
It is assumed that the maximal length of the guard band at each point of the moderate scale is equal to
where the value of the upper limit of the tolerance interval at the points of the moderate scale is given by equation
and the value of the lower limit of the tolerance interval at points of the moderate scale is given by equation
In equations (20) and (21), were included the values for from Table 3. In addition, it is valid that the points are the points of the line which corresponds to the perfect measurement. In other words, from equation (19) follows that the acceptance interval occupies 80% of the tolerance interval. The 10% of the length of the guard band occupies the area between the acceptance line (curve) and the tolerance line (curve) , below the line , and 10% of the length of the guard band occupies the area between the acceptance line (curve) and the tolerances line (curve) , above the line (Figure 4).
The maximal length of the guard band in linearized models is the same for all points of the moderate scale . For the non-linearized model M3, the maximal length of the guard band has the smallest value at the middle point of the moderate scale, for . The in non-linearized models has the highest value at the edges of the moderate scale.
The lower and upper limits of the acceptance interval are defined by introducing a multiplicative factor An equidistant subdivision of the interval with a subdivision rate of 0.1 results in 21 subdivision nodes [18]. These subdivision nodes have the form where is For nodes of the subdivision , the lower and upper limits of the acceptance interval at the points of the reference scale are calculated from the following formulas:
and
For it is valid that and in that case , i.e., the tolerance interval is within the acceptance interval (Figure 1a). For is valid that . In this case, , and the acceptance interval is within the tolerance interval (Figure 1c). For it is valid that and that . In this case, it is a shared risk model (Figure 1b).
It should be noted that for all models, the tolerance lines (curves) calculated from equations (20) and (21) are fixed. The acceptance lines (curves) change along the guard band axis, depending on the length of the guard band:
According to [13], the risk of rejection of a product conforming to the specifications, i.e., the global producers’ risk is calculated from the equation:
The risk of accepting a non-compliant product, i.e., the global consumer’s risk , according to the [13], is calculated using the following equation:
The random variables Y and are normally distributed. Therefore, the prior in equations (25) and (26) has the form:
and the likelihood function has the form:
In the simplification procedure, which is elaborately outlined in detail in [18], the double integrals present in formulas (25) and (26) can be reduced to single integrals. The global producer risk for models M1 and M2 can be calculated using the expression:
where with label denoted density function for the unit normal distribution which can be calculated from the following equation:
The quantity , is expressed through the cumulative distribution function (CDF) for the unit normal distribution [13]. For models M1 and M2 has the form:
Global consumers’ risk is calculated, according to [13] from
For the standard measurement uncertainty of future measurements , in equations (28) and (31), were taken the values and The formulas for global producer’s risk and global consumer’s risk for the non-linearized model M3 and the linearized model M4 are obtained by inserting the values instead of into equations (29), (31) and (32).
It is clear from equations (19-32) that the global risks of producers and consumers are calculated for each value of the moderate scale, namely for all reference values and for all values of the multiplicative factor in the nodes of the subdivision of the guard band. In this way, risk surfaces are obtained. The total number of grid points where the values of global producers’ and consumers’ risk were evaluated is The risk evaluation was performed by numerically solving the integrals from equations (29) and (32). All calculations were performed by using the R software package, as well as 2D graphs, while 3D graphs were created by using the Octave software package [58,59,60]. This can be a challenge because the measurer is required to be familiar with mathematics and programming. That is why risk calculation is often avoided.
An important quantity when assessing the global risk of consumers and the global risk of producers , which serves as a measure of model quality, is conformance probability This quantity indicates the probability that the measured value of the item of interest is within the tolerance interval. According to [13] (p. 27) and equation (27), conformance probability for models M1 and M2 can be calculated from:
For the models, M3 and M4, conformance probability is calculated by including the value in equation (33), instead of the value
3. Results and Discussions
3.1. Graphical Risk Analysis
Graphical risk analysis was carried out by monitoring the behavior of the global risk of the producer and the global risk of the consumer along the moderate scale, along the guard band axis, and monitoring the behavior of the risk concerning the assumed value of measurement uncertainty of a future inspection process.
3.1.1. Behaviors of a Global Consumer and Producer Risk Along the Moderate Scale
The behavior of the global producer’s risk and global consumer’s risk along the moderate scale depends on the values of the slope and intercept of the regression line. The risk curves for and along the moderate scale are parabolas with an upward opening. The minimum of these parabolas is located at the intersection of the regression line and the line . The position of the minimum at the moderate scale is indicated by and is represented by the following expression:
It is easy to show how the minimal values of the global risk of producers and consumers along the moderate scale in all analyzed models are achieved for µm (Figure 5).
Parabolas are translated to the right when i.e., if and , or if, as is the case here, and . That is the reason why the risk parabolas, i.e., the iso-risk curves along the moderate scale depicted in Figure 5, are asymmetric. In all models, due to translation, the values of global risk for producers and consumers on the left side of the moderate scale are higher compared to the risk values on the right side of the moderate scale. This disparity is readily apparent in Figure 4, as evidenced by the proportion of the regression line’s length located on the right side of the intersection of the regression line and the line, in contrast to the proportion located on the left side of the intersection of the regression line and the line. Therefore, the calculated global risks of producers and consumers can be seen as risks of deviation of the regression line from the line.
In the case of a regression line where and , or and the parabolas would be translated to the left. The minimal values for the parabolas of the global risk of producers and consumers then would be located at the point of the moderate scale and would be calculated from equation (34).
The line marked with and given by the equation:
is axisymmetric to the regression line. These lines are axisymmetric concerning For the worth and conversely, for the worth The global risks of producers and consumers calculated for the line are equal to the risks calculated for the regression line from equation (10) up to the order of magnitude ranging from do depending on the observed model and assuming that the line is obtained under identical conditions as the regression line, with identical values for and and identical values for tolerance intervals and acceptance intervals. The same applies to conformance probability.
Due to the narrower range of the tolerance interval ∆T, the M2 model exhibits higher values of the global risk of producers and consumers across the entire moderate scale than the M1 model. The width of the tolerance interval of the M3 model is greater than the width of the tolerance interval of the M4 model, except in the middle of the scale, in the point . At this point on the moderate scale, the width of the tolerance interval for both models is equal and amounts to (Table 3). Consequently, the global risks of producers and consumers in the M3 model are lower than those in the M4 model (Figure 5a,b). In these two models, the risk values coincide at the point of minimum,
The iso-risk curves of models M1 and M2, along the moderate scale, exhibit stable behavior with a narrower range of value changes. These models behave differently compared to the M3 and M4 models. In models M3 and M4, the range of variations in producer and consumer risk values is significantly greater. In the case of consumer risk, the iso-risk curves for models M3 and M4 intersect those for models M1 and M2 (Figure 5a). The same applies to iso-risk curves of producers (Figure 5b). All models are shown on the same scale for comparison. That is why the iso-risk curves for models M1 and M2 do not have such a prominent parabola shape compared to models M3 and M4.
The maximal value for conformance probability is reached precisely at the point where the global risk of the producer and the global risk of the consumer have a minimal value (Figure 6).
Higher risk values result in lower values for the conformance probability and vice versa. This can be observed when comparing models M1 and M2, i.e., M3 and M4, as well as all models (Figure 6). Models M3 and M4 have the same value for conformance probability at the point of moderate scale, Other points of the moderate scale show higher values for conformance probabilities for model M3 than for model M4. The lowest values for conformance probability are found on the left side of the moderate scale for all models. The values for drop to 72% for the M3 model, or even 69% for the M4 model. Hence, it is possible to conclude that models M3 and M4 attach greater importance to risks at the edges of the scale.
On the graphs of models M3 and M4, which show the behavior of the global risk of the producers, anomalies on the left edge of the scale can be observed (Figure 5b). Anomalies mean that the iso-risk curves deviate from the parabola graph. At the point of the moderate scale µm, the global risk of the producer for the M3 model is greater than the global risk of the producer for the M4 model. These anomalies occur when the tolerance interval is too narrow. If the range of the tolerance interval is too narrow, the regression line crosses the acceptance line, or both lines, the acceptance and tolerance line (or acceptance and tolerance curves). In that case, the risk graphs are no longer parabolas (Figure 7).
Figure 7 illustrates the presence of anomalies, i.e., the deviations of the iso-risk curve from the parabola graph. Such deviations are obtained when, for example, with the M3 model, a too-narrow tolerance interval range of is set. In that scenario, the regression line intersects the lower acceptance curve and the lower tolerance curve . Anomalies may manifest themselves for both the global consumer’s risk and global producer’s risk (Figure 7a,b). The graph for conformance probability clearly shows that the model behaves badly on the left side of the moderate scale, where the conformance probability falls below 20% (Figure 7c). The primary drawback of the described method for risk assessment in regression is excessively narrow tolerance interval. It is necessary to expand its span to resolve the issue. To stay within the 6-sigma range used in statistics, a tolerance interval width was set to in the M3 model. The anomaly is not completely resolved by this. The regression line for intersects the lower acceptance curve . The iso-risk curves for the global producer’s risk diverge from the parabola graph on the left edge of the moderate scale (Figure 5b). For this reason, the range of tolerance intervals should be further expanded. The deviation from the parabola graph is even more noticeable with the M4 model. With this model, the regression line intersects the lower line of the acceptance interval already by In both models, M3 and M4, anomalies occur for the values of the multiplicative factor which is related to the model of minimization of global consumer’s risk (Figure 1c). The specified values of the multiplicative factor were calculated numerically. Also, although the regression line in models M3 and M4 intersects the lower acceptance curve (line) , it fails to intersect the lower tolerance curve (line) . For the M2 model, it is sufficient to set to prevent the regression line from intersecting either the tolerance interval or acceptance interval.
3.1.2. Behaviors of a Global Consumer’s and Producer’s Risk Along the Guard Band Axis
Depending on the multiplicative factor where according to equation (24), the guard band can have a positive or negative value or be equal to zero. If it is about the model of the minimization of global producer’s risk (Figure 1a). If it is a shared risk model (Figure 1b). For it is a model for minimizing the global consumer risk (Figure 1c). It is natural to observe the behavior of the global risk of producers and consumers along the guard band axis. In general, if it is then for and holds that and Simplified, the consumer’s risk decreases along the guard band axis as depicted in Figure 8a, whereas the producer’s risk increases along the guard band axis as depicted in Figure 8b.
Figure 8 shows the curves of the minimum of the global producer’s and consumer’s risk calculated numerically along the guard band axis at points . These are the curves where the risks, for each model are the least. Due to the described construction of acceptance and tolerance intervals, risks are assessed for intervals of varying lengths along the guard band axis. The values of measurement uncertainties calculated using LRA, are considerably smaller in comparison with It is therefore pointless to compare all models for the same tolerance interval µm given by the manufacturer. For the measurement uncertainty the tolerance interval selected in this manner will be too wide, resulting in negligible risk values and for models M3 and M4, while the conformance probability will be equal to one. The M4 model’s curve of minimum for global producer’s risk intersects the curve of minimum of the M1 model (Figure 8b).
The conformance probability for the curve of minimum in each model is determined by the straight line along the guard band axis. These values remain the same for all points For models M1, M2, M3 and M4 respectively worth: , and .
The described behavior of the global producer’s risk and the global consumer’s risk along the moderate scale and the guard band axis can be easily noticed by observing the risk surfaces shown in Figure 9. From the picture, it is evident that there are areas where the global risk of the producer and the global risk of the consumer of models M3 and M4 are lower than the risk of the models M1 and M2.
3.1.3. Behaviour of a Global Consumer’s and Producer’s Risk with the Changes of Measurement Uncertainty of a Future Inspection Process
The behavior of the global producer’s risk and the global consumer’s risk across all models were tested for three different assumed values of measurement uncertainty of a futured inspection process: for and for
With the increase in measurement uncertainty , the global consumer’s risk also increase (Figure 11).
Additionally, with the increase in measurement uncertainty value , the producer’s risk also rises (Figure 12).
It is evident that, in addition to the range of the tolerance interval to the occurrence of anomalies in the behavior of the global producer’s risk , measurement uncertainty also has an impact. Deviation from the parabolic curve becomes more pronounced, (Figure 12c,d). Graphs can completely alter their behavior, as is the case in model M2. When it is worth that , the graph of the global producer’s risk is a parabola with a downward opening (Figure 12b). For the regression line is not outside the tolerance interval or the acceptance interval, in none of the mentioned case. To avoid anomalies in the behavior of the risk curves for , it is necessary to expand the ranges of tolerance intervals. For model M2, this range should be set to at least , for model M3 to and for model M4 to . This prevents anomalies in the graphs for all values of .
According to equation (33), the expression for conformance probability is independent of the measurement uncertainty of a future inspection process. Therefore, the graphs for conformance probability for all tested values of measurement uncertainty are as shown in Figure 6, and for the 3D case, as shown in Figure 10.
3.2. Comparison of Models by Root Mean Squared Error
There are lots of evaluation metrics for regression [61,62]. The most common are the mean squared error (MSE) and the root of the mean squared error (RMSE). RMSE is a more suitable statistical indicator compared to MSE because it is measured in the same units as the targeted variable, which allows for easier interpretation and comparison of models [63]. RMSE values range from zero to infinity. The lower RMSE values, closer to zero, indicate better model performance [64]. This metric is sensitive to large deviations of the measured values from the reference values [65].
The comparison of risk models using the RMSE metric was conducted both graphically and quantitatively. The targeted variables in the model comparison are global producer’s and consumer’s risk and conformance probability. Comparisons were conducted for each point on the moderate scale and for all measurements . If denotes the global consumer’s risk, calculated for each realization of the sample , then the RMSE for the global consumer’s risk, for a chosen fixed value can be calculated according to the following equation:
Analogously, by introducing the notations and , can be obtained the expressions for the RMSE of the individual measurements for the global producer’s risk and conformance probability, respectively. These metrics quantify the deviation of the calculated risk for each measurement point from the fitted risk surfaces shown in Figure 9, or from the fitted surfaces for conformance probability shown in Figure 10.
The RMSE metric exhibits higher values for those points on the moderate scale for which the deviation of measured values is greater relative to the scale values (Figure 13).
The calculated RMSE values indicate that the models M3 and M4 better detect deviations of the risks, calculated for the points of the moderate scale, from the risk surfaces. This is particularly true for the sample realization on the negative part of the scale (Table 1). All the points on the moderate scale, for models M1 and M2, for each measurement and each value of falls within the tolerance interval and acceptance interval. The same holds for all models, for measurements , and for each value of . For model M3, the value µm is already outside the tolerance interval and acceptance interval for . As consequences, there is a higher producer’s and consumer’s risk for the mentioned measurement, and ultimately, higher RMSE values for that measurement. For , all other values of the negative portion of the moderate scale , are outside the tolerance interval, that is, between the tolerance interval and the acceptance interval. From to , all 6 measurements on the negative part of the moderate scale from sample are outside the tolerance interval and outside the acceptance interval. In the model M4, all points in the negative portion of the moderate scale are located outside the tolerance and the acceptance intervals, for to .
Analogously, the RMSE values for conformance probability are higher in points where the measured values significantly diverge from the values of the moderate scale, in contrast to measurements with minor deviations from the moderate scale (Figure S2).
The total value of the RMSE for each model for the consumer’s risk, calculated for each measurement is denoted as and obtained from the equation:
Expressions for the total value of RMSE for the global producer’s risk and conformance probability are denoted as and , respectively. The values of these quantities are calculated analogously to the equation (37).
Each measurement contributes to the determination of the parameters of the regression line and the determination of the risk surfaces and surfaces for conformance probability [46], [47] (pp. 76-78). Therefore, the total RMSE value for global consumer’s risk was additionally calculated for each model. This value is labeled as , and was calculated according to the following equation:
The total value of RMSE for the global producer’s risk, , and the total value of RMSE for conformance probability, are obtained in the same manner as in equation (38). The results of the quantitative analysis for all models, considering all defined values for RMSE given in equations (36-38), are presented in Table 4.
Quantitative analysis reveals that models M3 and M4 are better detecting deviations from measured values from values on a moderate scale. Consequently, all RMSE values for these models are higher compared to models M1 and M2. For all individual measurements , it holds that , which is understandable given that model M1 has a broader tolerance interval compared to model M2. Furthermore, for RMSE values associated with the producer’s risk, it holds that for all measurements . When comparing models M3 and M4, it is evident that for the first sample realization , wherein significant deviations of measured values from reference values were observed in the negative part of the moderate scale, the RMSE values indicate that and For measurements and , the reverse inequalities hold true. Additionally, it can be observed that for sample realization , the RMSE values and are significantly higher compared to the values for measurements and . Despite having a broader tolerance interval across almost all points on the moderate scale, model M3 exhibits higher RMSE values for , , and . For all measurements , it holds that , and likewise
3.3. Comparison of Models Using Metrics Related to the Confusion Matrix
Recent studies have shown that risk assessment models can be compared using metrics relates to the confusion matrix [18,34]. Expressions for evaluating the global risk of producers and consumers from equations (29) and (32) are a kind of classifier that sorts measurements as falsely rejected (FR) and falsely accepted (FA), so that and . Considering that the measurements that are within the tolerance interval and the acceptance interval were defined as true positive (TP) and that the measurements that are outside the acceptance interval and tolerance interval were defined as true negative (TN), it is feasible to construct a confusion matrix [18]. For the confusion matrix constructed in this way, it is especially true that =1. In addition, it holds that and that [18]. For a well-performed measurement, it is always the case that i.e., it is about imbalanced data [66]. Since in the measurements there is always exist a measurement uncertainty, in practice it is assumed that the risks and are always present and that their values differ from zero. Theoretically, in metrology, these values can be equal to zero, but not simultaneously.
The models outlined in the article can be evaluated by utilizing any of the commonly recognized metrics: accuracy, precision, recall, F1 score, Matthew’s correlation coefficient (MCC), Cohen’s Kappa, etc. [67,68]. A comparison of models by using metrics associated with confusion matrices was conducted for the area enclosed by the moderate scale and guard band axes.
In this article, the F1 score and diagnostic odds ratio (DOR) were chosen for model comparison. The F1 score is the harmonic mean of precision and recall. According to [18] in the metrological sense, it can be written in the form:
This metric is conveniently used in binary classification when it is necessary to recognize and classify a specific class of confusion matrix [69]. Here it is the TP class. Standard values of the F1 score range from . In the metrological sense, the values 0 and 1 should be excluded. If the value of the F1 score were to be zero, it would be true that thereby indicating there is no TP measurement. Also, if the value of the F1 score were to be one, it would mean that , which is impossible because of measurement uncertainty. This is the rationale behind why the values of the F1 score, in the realm of metrology, ought to be within the interval . The model’s performances are better for the values of the F1 score that are closer to the one. Furthermore, the curves of the F1 score along the guard band axis pass through the intersection of the precision and recall curves. That characteristic intersection point is obtained for that value of the guard band for which [18]. The lengths of the acceptance intervals are chosen precisely so that the intersection of the risk surfaces will be visible on the graphs (Figures S3–S6). Like the risk surfaces, the F1 score surfaces for models M1 and M2 behave differently compared to models M3 and M4 (Figure 14).
For models M1 and M2, the F1 score decreases along the guard band axis. In contrast, the F1 score curves of models M3 and M4, along the moderate scale, have the maximum values at the points By using F1 score, it can be seen that models M3 and M4 better detect deviations of the measured values from the reference values of the moderate scale on the edge portions of the guard band axis. For all models, the maximal values of the F1 score along the guard band axis are found at points .
The comparison of risk assessment models was additionally performed using the DOR metric. DOR is the ratio of the probability of true positive measurements among falsely rejected measurements and the probability of falsely accepted measurements among true negative measurements [70]. It can be calculated from the following equation written in metrology terms:
Standard values for the DOR are in the range If the value for DOR were equal to zero, it would mean that , that is, that . This would mean that the measurement disastrously was carried out. Therefore, in the metrological sense, the values of DOR must be in the interval Models that possess DOR values exceeding one are more effective in detecting probabilities of TP measurements among FR measurements [71]. The minimal value of DOR along the guard band axis is achieved for the shared risk model when the length of the guard band is . The highest values for DOR are achieved for the low rate of the global consumer’s and producer’s risk [72]. Therefore, this metric is deemed suitable for identifying the line located in the plane that is enclosed by the moderate scale and by guard band axis, along which the risks are the smallest. As can be seen from Figure 15a,b, the curve that indicates the maximum values for the DOR is situated just above the line that traverses the points . DOR for M3 and M4 models detects this curve extremely well (Figure 15b).
Similarly to the surfaces of the risks (Figure 9), there is an area where the F1 score of the models M3 and M4 has a higher value than the F1 score of the models M1 and M2 (Figure 16a). Analogously, there is an area where the DOR of models M3 and M4 has lower values compared to models M1 and M2 (Figure 16b).
4. Conclusions
The analysis indicates that it is acceptable if the iso-risk curves along the moderate scale have a parabola shape with an upward opening. The minimal value of these parabolas is located at the point that is the intersection of the regression line and the line. The appearance of anomalies depends on the width of the tolerance interval and the value of the measurement uncertainty of a futured inspection process. These anomalies can be rectified by extending the tolerance interval range. Models, where for the risk calculation was used combined measurement uncertainty determined by applying a simplified measurement model with the use of comprehensive data on measurement performance, exhibit stable behavior along the moderate scale. Conversely, models in which the measurement uncertainty is calculated using the law of the propagation of uncertainty applied to the functional relationship of the input data obtained from the LRA, are biased towards risks on the edge of the moderate scale. This was confirmed by testing the models using the F1 score. Furthermore, the RMSE for the mentioned models is better able to detect deviations of the measured values from the reference values on a moderate scale. DOR metrics possess an exceptional ability to detect the curve along the guard band axis, where the risks are the lowest. Therefore, in the risk assessing procedure for linear regression, it is advisable to use models where the measurement uncertainty is calculated by LRA.
The described method of risk assessment in regression models should be further investigated. Primarily, this refers to testing models regarding the different values of input parameters and testing their mutual relationships. Research can also focus on using the method in the case of polynomial and exponential regression models. The adaptation of the method and its application in calibration are also a matter of concern for future work. The method could be applied for risk assessment in models that use information from economics, insurance, medicine or some other fields.
The risk assessment procedure for linear regression is a significant additional step in the analysis of the quality of the measurement. The application of this method certainly contributes to the improvement of product quality. Hence, risk assessment should be adopted as a standard procedure when assessing the conformity of products with given specifications and in metrology in general.
Supplementary Materials
The following supporting information can be downloaded at the website of this paper posted on Preprints.org, Table S1: Shapiro-Wilk normality test results; Figure S1: Residual diagnostics; Table S2: Measurement uncertainties for each point of the moderate scale calculated by LRA; Figure S2: The comparison of the RMSE values for conformance probability; Figure S3: Risk surfaces for model M1; Figure S4: Risk surfaces for model M2; Figure S5: Risk surfaces for model M3; Figure S6: Risk surfaces for model M4.
Author Contributions
Conceptualization, D.B.; methodology, D.B. and B.R.; software, D.B.; validation, D.B., B.R. and A.R.; formal analysis, D.B. and A.R.; investigation, D.B.; resources, D.B. B.R. and A.R.; data curation, D.B. and B.R.; writing—original draft preparation, D.B.; writing—review and editing, B.R. and A.R.; visualization, D.B., supervision, B.R.; project administration, A.R.; funding acqui-sition, B.R. D.B. and A. R. All authors have read and agreed to the published version of the man-uscript.
Institutional Review Board Statement
Not applicable.
Informed Consent Statement
Not applicable.
Conflicts of Interest
The authors declare no conflict of interest.
References
- Savković, B.; Kovač, P.; Rodić, D.; Štrbac, B.; Klančnik, S. Comparison of artificial neural network, fuzzy logic and genetic algorithm for cutting temperature and surface roughness prediction during the face milling process. Adv. Prod. Eng. Manag. 2020, 15, 137–150. [Google Scholar] [CrossRef]
- Sheth, S.; Modi, B.; Patel, D.; Chaudhari, A. Modeling and Prediction Using Regression, ANN and Fuzzy Logic of Real Time Vibration Monitoring on Lathe Machine in Context of Machining Parameters. Bonfring int. j. man mach. interface. 2015, 3, 30–35. [Google Scholar] [CrossRef]
- Razumić, A.; Runje, B.; Lisjak, D.; Kolar, D.; Horvatić Novak, A.; Štrbac, B.; Savković, B. Atomic force microscopy: step height measurement uncertainty evaluation. In Proceedings of the International Conference MATRIB 2023- Materials, Tribology & Recycling, Vela Luka, Croatia, June 29-July 1, 2023. in press. [Google Scholar]
- Papafotis, K.; Nikitas, D.; Sotiriadis, P.P. Magnetic Field Sensors’ Calibration: Algorithms’ Overview and Comparison. Sensors 2021, 21, 5288. [Google Scholar] [CrossRef] [PubMed]
- Shen, G.; et al. Toward an international practical pressure scale: A proposal for an IPPS ruby gauge (IPPS-Ruby2020). High. Press. Res. 2020, 40, 299–314. [Google Scholar] [CrossRef]
- Aime, L.F.J.; Kissinger, T.; James, S.W.; Chehura, E.; Verzeletti, A.; Tatam, R.P. High sensitivity pressure measurement using optical fibre sensors mounted on a composite diaphragm. Opt. Express. 2021, 29, 4105–4123. [Google Scholar] [CrossRef] [PubMed]
- Greaves, M.; et al. Interlaboratory comparison study of calibration standards for foraminiferal Mg/Ca thermometry. Geochem. Geophys. Geosyst. 2008, 9, Q08010. [Google Scholar] [CrossRef]
- Velychko, O.; Shevkun, S.; Gordiyenko, T.; Mescheriak, O. Interlaboratory comparisons of the calibration results of time meters. East. -Eur. J. Enterp. Technol. 2018, 1, 4–11. [Google Scholar] [CrossRef]
- Wübbeler, G.; Bodnar, O.; Elster, C. Robust Bayesian linear regression with application to an analysis of the CODATA values for the Planck constant. Metrologia 2018, 55, 20. [Google Scholar] [CrossRef]
- Liao, K.; Shafieloo, A.; Keeley, R.E.; Linder, E.V. A Model-independent Determination of the Hubble Constant from Lensed Quasars and Supernovae Using Gaussian Process Regression. ApJL. 2019, 886, L23. [Google Scholar] [CrossRef]
- Cox, M.G.; Forbes, A.B.; Harris, P.M.; Smith, I.M. The classification and solution of regression problems for calibration NPL Report CMSC 24/03, National Physical Laboratory, Teddington, UK, 2004. Available online: https://eprintspublications.npl.co.uk/2772/1/cmsc24.pdf (accessed on 4 January 2024).
- Fernández-Delgado, M.; Sirsat, M.S.; Cernadas, E.; Alawadi, S.; Barro, S.; Febrero-Bande, M. An extensive experimental survey of regression methods. Neural Netw. 2019, 111, 11–34. [Google Scholar] [CrossRef]
- BIPM, IEC, IFCC, ILAC, ISO, IUPAC, IUPAP, and OIML. Evaluation of measurement data — The role of measurement uncertainty in conformity assessment. Joint Committee for Guides in Metrology, JCGM 106:2012. BIPM; 2012. Available online: https://www.bipm.org/documents/20126/2071204/JCGM_106_2012_E.pdf/fe9537d2-e7d7-e146-5abb-2649c3450b25 (accessed on 4 January 2024).
- BIPM, IEC, IFCC, ILAC, ISO, IUPAC, IUPAP, and OIML. Evaluation of measurement data — An introduction to the “Guide to the expression of uncertainty in measurement” and related documents. Joint Committee for Guides in Metrology, JCGM 104:2009. BIPM; 2009. Available online: https://www.bipm.org/en/committees/jc/jcgm/publications (accessed on 4 January 2024).
- Expression of uncertainty in measurement. Chem. Int. 2018, 40, 30–31. [CrossRef]
- GUM-introduction. Available online: https://www.iso.org/sites/JCGM/GUM-introduction.htm (accessed on 4 January 2024).
- ILAC-G8:09/2019. Guidelines on Decision Rules and Statements of Conformity. 2019. Available online: https://ilac.org/publications-and-resources/ilac-guidance-series/ (accessed on 5 January 2024).
- Božić, D.; Runje, B.; Lisjak, D.; Kolar, D. Metrics Related to Confusion Matrix as Tools for Conformity Assessment Decisions. Appl. Sci. 2023, 13, 8187. [Google Scholar] [CrossRef]
- Pendrill, L.R. Using measurement uncertainty in decision-making and conformity assessment. Metrologia 2014, 51, 3206. [Google Scholar] [CrossRef]
- Dias, F.R.S.; Lourenço, F.R. Measurement uncertainty evaluation and risk of false conformity assessment for microbial enu-meration tests. J. Microbiol. Methods 2021, 189, 106312. [Google Scholar] [CrossRef] [PubMed]
- Williams, A.; Magnusson, B. (Eds). Eurachem/CITAC Guide: Use of uncertainty information in compliance assessment. Available online: https://www.eurachem.org/images/stories/Guides/pdf/MUC2021_P1_EN.pdf (accessed on 9 January 2024).
- Young, D.S. tolerance: An R Package for Estimating Tolerance Intervals. J. Stat. Softw. 2010, 36, 1–39. [Google Scholar] [CrossRef]
- Wallis, A.W. Tolerance intervals for linear regressions. In Proceedings of the Second Berkeley Symposium on Mathematical Statistics and Probability, Berkeley, USA, July 31-August 12, 1950. Available online: https://digicoll.lib.berkeley.edu/record/112745/files/math_s2_article-04.pdf (accessed on 5 January 2024).
- EUROLAB Technical Report No.1/2017-Decision Rules Applied to Conformity Assessment. Available online: https://www.eurolab.org/pubs-techreports (accessed on 7 January 2024).
- Božić, D.; Samardžija, M.; Kurtela, M.; Keran, Z.; Runje, B. Risk Evaluation for Coating Thickness Conformity Assessment. Materials 2023, 16, 758. [Google Scholar] [CrossRef] [PubMed]
- Runje, B.; Horvatić Novak, A.; Razumić, A.; Piljek, P.; Štrbac, B.; Orošnjak, M. Evaluation of Consumer and Producer Risk in Conformity Assessment Decision. In Proceedings of the 30th DAAAM International Symposium “Intelligent Manufacturing & Automation”, Zadar, Croatia, 23–26 October 2019. [Google Scholar] [CrossRef]
- Božić, D.; Runje, B. Data Modelling in Risk Assessment. In Proceedings of the Laboratory competence-2022, Cavtat, Croatia, 9-12 November 2022; Available online: https://www.crolab.hr/userfiles/file/cavtat2022/CROLAB_Cavtat%202022_zbornik%20radova_final_B.pdf (accessed on 9 January 2024).
- Toczek, W.; Smulko, J. Risk Analysis by a Probabilistic Model of the Measurement Process. Sensors 2021, 21, 2053. [Google Scholar] [CrossRef] [PubMed]
- Rajan, A.; Kuang, Y.C.; Po-Leen Ooi, M.; Demidenko, S.N. Moments and Maximum Entropy Method for Expanded Uncertainty Estimation in Measurements. In Proceedings of the IEEE International Instrumentation and Measurement Technology Conference (I2MTC), Turin, Italy, 22-25 May 2017. [Google Scholar] [CrossRef]
- Weise, K.; Woger, W. A Bayesian theory of measurement uncertainty. Meas. Sci. Technol. 1993, 4, 1. [Google Scholar] [CrossRef]
- BIPM, IEC, IFCC, ILAC, ISO, IUPAC, IUPAP, and OIML. Evaluation of measurement data — Supplement 1 to the “Guide to the expression of uncertainty in measurement” — Propagation of distributions using a Monte Carlo method. Joint Committee for Guides in Metrology, JCGM 101:2008. BIMP; 2008. Available online: https://www.bipm.org/documents/20126/2071204/JCGM_101_2008_E.pdf/325dcaad-c15a-407c-1105-8b7f322d651c (accessed on 9 January 2024).
- Lira, I. A Bayesian approach to the consumer’s and producer’s risks in measurement. Metrologia 1999, 36, 397–402. [Google Scholar] [CrossRef]
- Cox, M.G.; Forbes, A.B.; Harris, P.M. Bayesian estimation methods in metrology. In Proceedings of the 24th International Workshop on Bayesian Inference and Maximum Entropy Methods in Science and Engineering 25-30 July 2004, Garching, Germany. [CrossRef]
- Božić, D.; Runje, B. Selection of an Appropriate Prior Distribution in Risk Assessment. In Proceedings of the 33rd International DAAAM Virtual Symposium “Intelligent Manufacturing & Automation”, Vienna, Austria, 26–27 October 2022. [Google Scholar] [CrossRef]
- Brandão, L.P.; Silva, V.F.; Bassi, M.; de Oliveira, E.C. Risk Assessment in Monitoring of Water Analysis of a Brazilian River. Molecules 2022, 27, 3628. [Google Scholar] [CrossRef]
- Kuselman, I.; Pennecchi, F.; Bettencourt da Silva, R.J.N.; Brynn Hibbert, D. Conformity assessment of multicomponent materials or objects: Risk of false decisions due to measurement uncertainty—A case study of denatured alcohols. Talanta 2017, 164, 189–195. [Google Scholar] [CrossRef] [PubMed]
- Pennecchi, F.R.; Kuselman, I.; Hibbert, B.D.; Sega, M.; Rolle, F.; Altshul, V. Fit-for-purpose risks in conformity assessment of a substance or material – A case study of synthetic air. Measurement 2022, 188, 110542. [Google Scholar] [CrossRef]
- Pennecchi, F.R.; Kuselman, I.; Di Rocco, A.; Brynn Hibbert, D.; Semenova, A.A. Risks in a sausage conformity assessment due to measurement uncertainty, correlation and mass balance constraint. Food Control 2021, 125, 107949. [Google Scholar] [CrossRef]
- Separovic, L.; de Godoy Bertanha, M.L.; Saviano, A.M.; Lourenço, F.R. Conformity Decisions Based on Measurement Uncertainty—A Case Study Applied to Agar Diffusion Microbiological Assay. J. Pharm. Innov. 2020, 15, 110–115. [Google Scholar] [CrossRef]
- Lombardo, M.; Margueiro da Silva, S.; Lourenço, F.R. Conformity assessment of medicines containing antibiotics—A multi-variate assessment. Regul. Toxicol. Pharmacol. 2022, 136, 105279. [Google Scholar] [CrossRef] [PubMed]
- Pennecchi, F.R.; Kuselman, I.; Bettencourt da Silva, R.J.N.; Brynn Hibbert, D. Risk of a false decision on conformity of an environmental compartment due to measurement uncertainty of concentrations of two or more pollutants. Chemosphere 2018, 202, 165–176. [Google Scholar] [CrossRef]
- Separovic, L.; Lourenço, F.R. Measurement uncertainty and risk of false conformity decision in the performance evaluation of liquid chromatography analytical procedures. J. Pharm. Biomed. Anal. 2019, 171, 73–80. [Google Scholar] [CrossRef] [PubMed]
- Caffaro, A.M.; Lourenço, F.R. Total combined global risk assessment applied to pharmaceutical equivalence – A case study of ofloxacin medicines. Chemom. Intell. Lab. Syst. 2023, 241, 104935. [Google Scholar] [CrossRef]
- Bednjanec, F. Umjeravanje uređaja za mjerenje kružnosti. Diplomski rad, Fakultet strojarstva i brodogradnje, Sveučilište u Zagrebu 2016. March 24, 2016. Available online: https://urn.nsk.hr/urn:nbn:hr:235:701539 (accessed on 10 January 2024).
- Huzak, M. Vjerojatnost i Matematička Statistika, Predavanja; Poslijediplomski specijalistički sveučilišni studij aktuarske matematike; Specialist u Zagrebu, PMF-Matematički Odjel: Zagreb, Croatia, 2006. Available online: http://aktuari.math.pmf.unizg.hr/docs/vms.pdf (accessed on 11 January 2024).
- Ortiz, M.C.; Sánchez, M.S.; Sarabia, L.A. 1.05 - Quality of Analytical Measurements: Univariate Regression. In Comprehensive Chemometrics. Chemical and Biochemical Data Analysis, 1st ed; Brown, S.D., Tauler, R., Walczak, B.; Elsevier, Amsterdam, Netherlands, 2009; 1, 127-169. [CrossRef]
- Ellison, S.R.; Williams, A. (Eds). Eurachem/CITAC guide: Quantifying Uncertainty in Analytical Measurement. Available online: https://www.eurachem.org/images/stories/Guides/pdf/QUAM2012_P1.pdf (accessed on 11 January 2024).
- Miller, S.J. The Method of Least Squares; Mathematics Department Brown University: Providence, RI, USA, 2006; Available online: https://web.williams.edu/Mathematics/sjmiller/public_html/105Sp10/handouts/MethodLeastSquares.pdf (accessed on 15 January 2024).
- BIPM, IEC, IFCC, ILAC, ISO, IUPAC, IUPAP, and OIML. Evaluation of measurement data — Guide to the expression of uncertainty in measurement. Joint Committee for Guides in Metrology, JCGM 100:2008. BIPM; 2008. Available online: https://www.bipm.org/documents/20126/2071204/JCGM_100_2008_E.pdf/cb0ef43f-baa5-11cf-3f85-4dcd86f77bd6 (accessed on 16 January 2024).
- Taylor, B.N.; Kuyatt, C.E. Guidelines for Evaluating and Expressing the Uncertainty of NIST Measurement Results; NIST Technical Note 1297; US Department of Commerce, Technology Administration, National Institute of Standards and Technology: Gaithersburg, MD, USA, 1994. Available online: https://emtoolbox.nist.gov/publications/nisttechnicalnote1297s.pdf (accessed on 16 January 2024).
- Farrance, I.; Frenkel, R. Uncertainty of Measurement: A Review of the Rules for Calculating Uncertainty Components through Functional Relationships. Clin. Biochem. Rev. 2012, 33, 49–75. Available online: https://www.ncbi.nlm.nih.gov/pmc/articles/PMC3387884/ (accessed on 16 January 2024).
- Klauenberg, K.; Martens, S.; Bošnjaković, A.; Cox, M.G.; Van der Veen, A.M.; Elster, C. The GUM perspective on straight-line errors-in-variables regression. Measurement 2021, 187, 110340. [Google Scholar] [CrossRef]
- Croarkin, C.; Tobias, P.; Zey, C. Engineering Statistics Handbook; The Institute Gaithersburg: Gaithersburg, MD, USA, 2001. Available online: https://www.itl.nist.gov/div898/handbook/dtoc.htm (accessed on 16 January 2024).
- Young, D.S. tolerance: An R Package for Estimating Tolerance Intervals. J. Stat. Softw. 2010, 36(5), 1–39. [Google Scholar] [CrossRef]
- Krishnamoorthy, K.; Mathew, T. Statistical Tolerance Regions: Theory, Applications, and Computation; Wiley: Hoboken, NJ, USA, 2009. [Google Scholar]
- Splinter, K.; Sigler, G.; Harman, M.; Kolsti, K. Tolerance Intervals Demystified. Dayton. Scientific Test and Analysis Techniques Center of Excellence (STAT COE). Available online: https://www.afit.edu/STAT/statcoe_files/Tolerance%20Intervals%20Demystified.pdf (accessed on 23 January 2024).
- Greenwell, B.M. Topics in statistical calibration. Ph.D. thesis, Air Force Institute of Technology, Ohio, USA, March 3, 2014. Available online: https://apps.dtic.mil/sti/pdfs/ADA598921.pdf (accessed on 23 January 2024).
- R Core Team. R: A Language and Environment for Statistical Computing; The R Foundation for Statistical Computing: Vienna, Austria, 2022; Available online: https://www.R-project.org/ (accessed on 13 February 2024).
- Borchers, H.W. Pracma: Practical Numerical Math Functions; R Package Version; 2022, Volume 1, Number 3. Available online: https://R-Forge.R-project.org/projects/optimist/ (accessed on 13 February 2024).
- Eaton, J.W.; Bateman, D.; Hauberg, S.; Wehbring, R. GNU Octave version 8.4.0 manual: a high-level interactive language for numerical computations. Available online: https://www.gnu.org/software/octave/doc/v8.4.0/ (accessed on 13 February 2024).
- Botchkarev, A. A new typology design of performance metrics to measure errors in machine learning regression algorithms. Interdiscip. J. Inf. Knowl. Manag. 2019, 14, 45–76. [Google Scholar] [CrossRef] [PubMed]
- Abhishek, T. Comparative Assessment of Regression Models Based on Model Evaluation Metrics. IRJET 2021, 9(8), 853–860. [Google Scholar]
- Hodson, T.O. Root-mean-square error (RMSE) or mean absolute error (MAE): When to use them or not. Geosci. Model Dev. 2022, 15, 5481–5487. [Google Scholar] [CrossRef]
- Chicco, D.; Warrens, M.J.; Jurman, G. The coefficient of determination R-squared is more informative than SMAPE, MAE, MAPE, MSE and RMSE in regression analysis evaluation. PeerJ Comput. Sci. 2021, 7, e623. [Google Scholar] [CrossRef] [PubMed]
- Chai, T.; Draxler, R.R. Root mean square error (RMSE) or mean absolute error (MAE)? – Arguments against avoiding RMSE in the literature. Geosci. Model Dev. 2014, 7, 1247–1250. [Google Scholar] [CrossRef]
- Jeni, L.A.; Cohn, J.F.; de la Torre, F. Facing Imbalanced Data—Recommendations for the Use of Performance Metrics. In Proceedings of the 2013 Humaine Association Conference on Affective Computing and Intelligent Interaction (ACII), Geneva, Switzerland, 2–5 September 2013. [Google Scholar] [CrossRef]
- De Diego, I.M.; Redondo, A.R.; Fernández, R.R.; Navarro, J.; Moguerza, J.M. General Performance Score for Classification Problems. Appl. Intell. 2022, 52, 12049–12063. [Google Scholar] [CrossRef]
- Grandini, M.; Bagli, E.; Visani, G. Metrics for Multi-Class Classification: An Overview. arXiv 2020, arXiv:2008.05756. [Google Scholar] [CrossRef]
- Chicco, D.; Tötsch, N.; Jurman, G. The Matthews correlation coefficient (MCC) is more reliable than balanced accuracy, bookmaker informedness, and markedness in two-class confusion matrix evaluation. BioData Min. 2021, 14, 1–22. [Google Scholar] [CrossRef]
- McHugh, M.L. The odds ratio: Calculation, usage, and interpretation. Biochem. Medica 2009, 19, 120–126. Available online: https://hrcak.srce.hr/37593 (accessed on 1 February 2024). [CrossRef]
- Glas, A.S.; Lijmer, J.G.; Prins, M.H.; Bonsel, G.J.; Bossuyt, P.M.M. The diagnostic odds ratio: A single indicator of test performance. J. Clin. Epidemiol. 2003, 56, 1129–1135. [Google Scholar] [CrossRef] [PubMed]
- Šimundić, A.M. Measures of diagnostic accuracy: Basic definitions. Ejifcc 2009, 19, 203. Available online: https://www.ncbi.nlm.nih.gov/pmc/articles/PMC4975285/ (accessed on 1 February 2024). [PubMed]
Figure 1.
Interrelationships of tolerance interval and acceptance interval: (a) Minimizing producer risk; (b) Shared risk; (c) Minimizing consumer risk [26].
Figure 1.
Interrelationships of tolerance interval and acceptance interval: (a) Minimizing producer risk; (b) Shared risk; (c) Minimizing consumer risk [26].
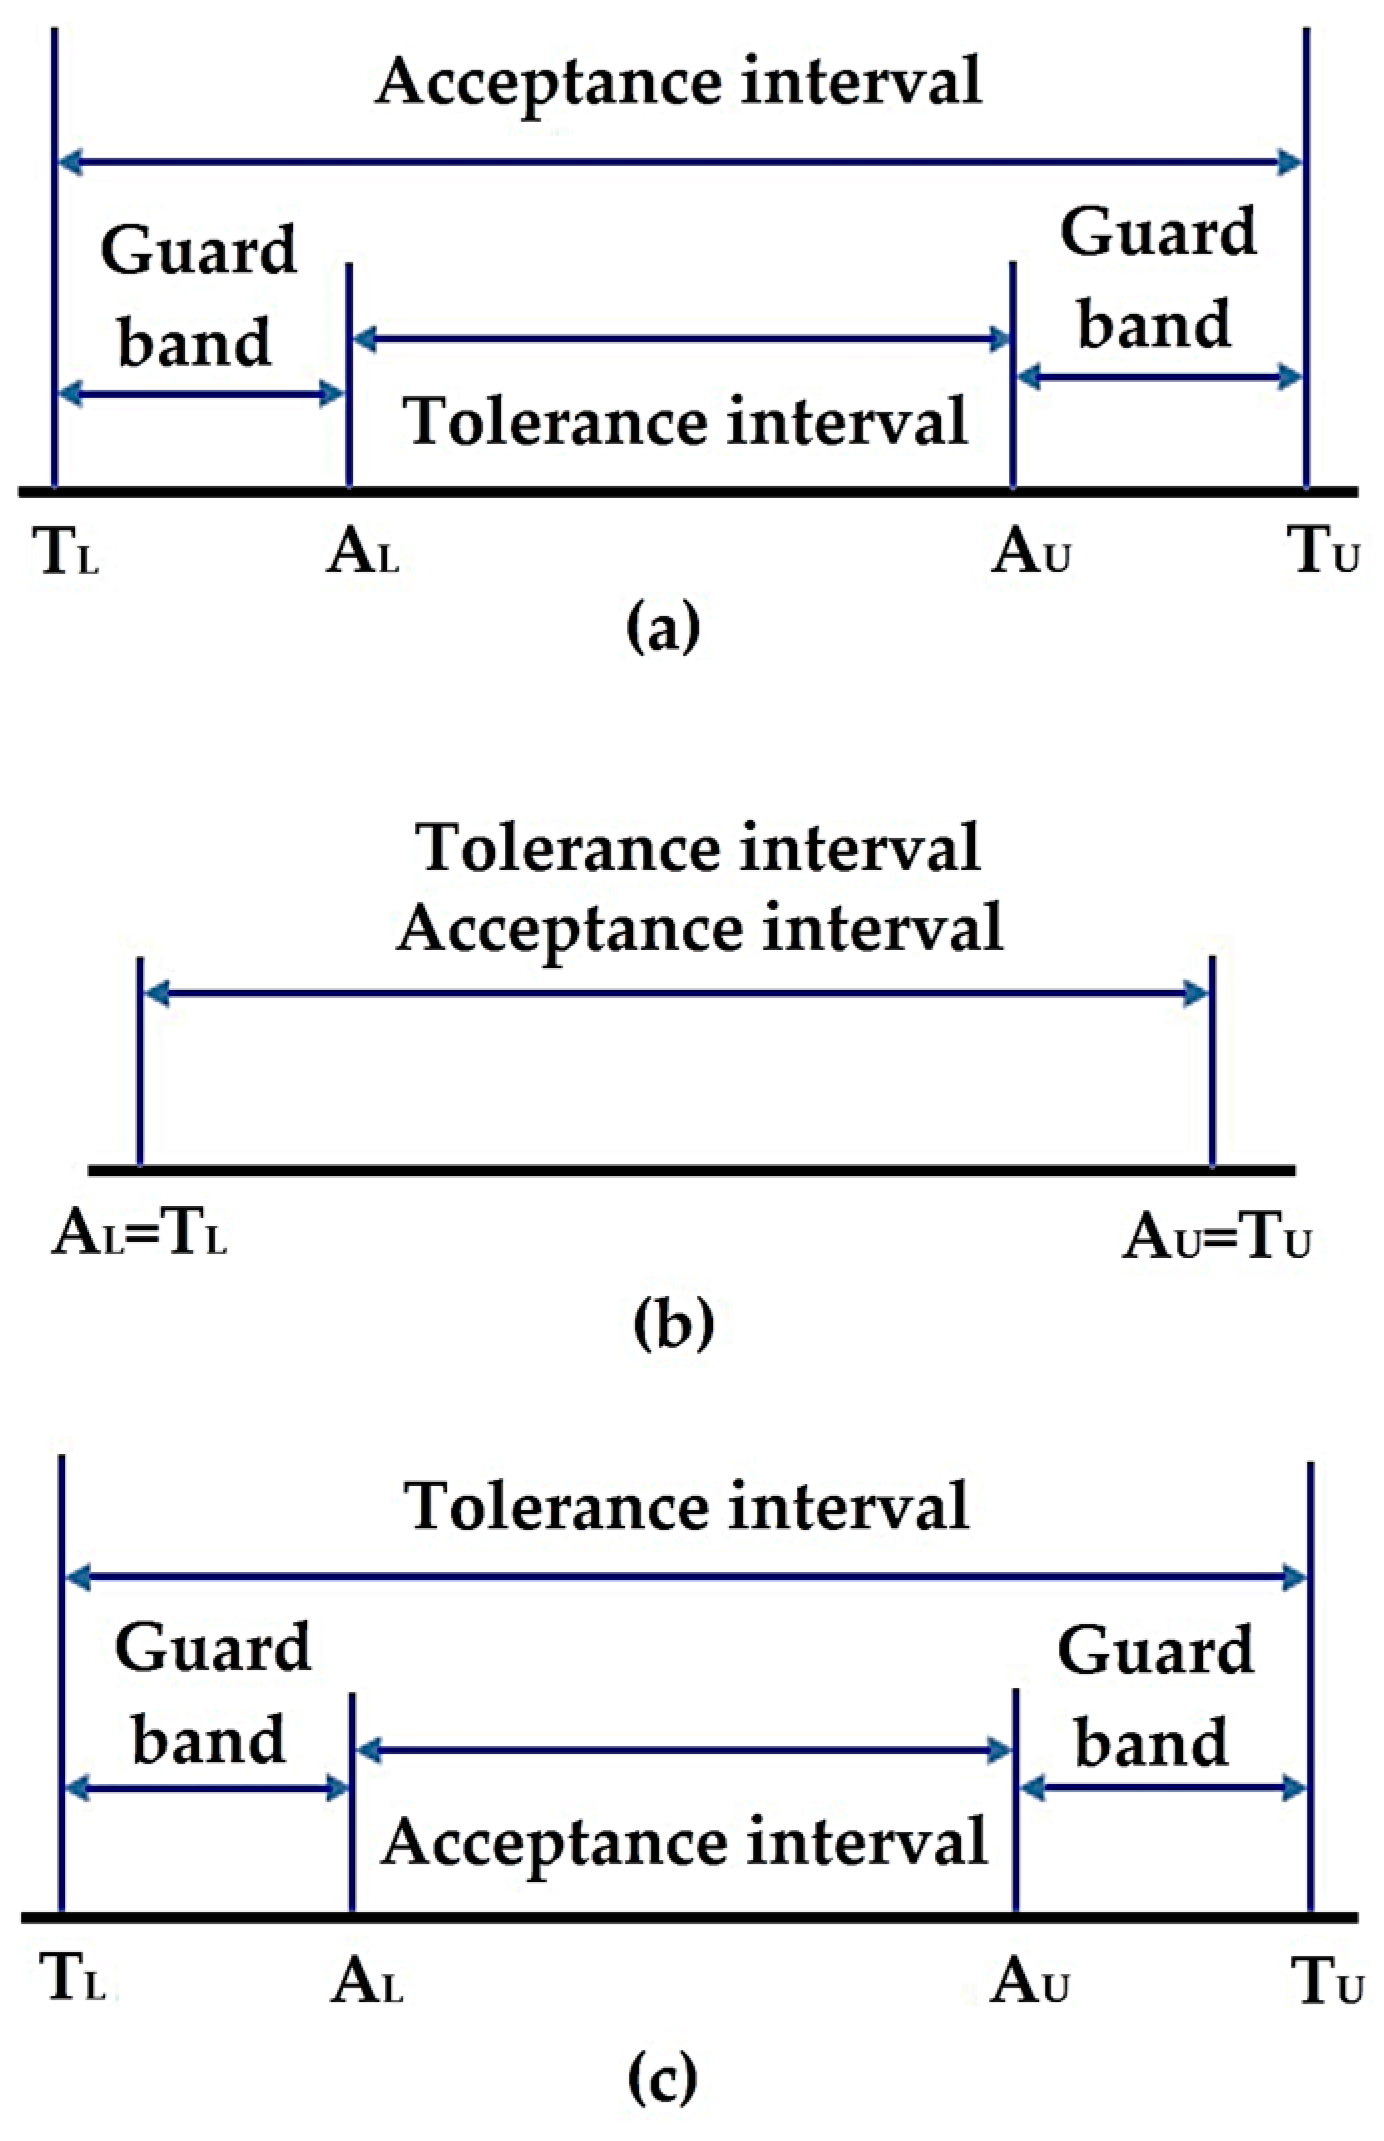
Figure 2.
Minimization of consumer risk: (a) Centered model; (b) Non-centered model.
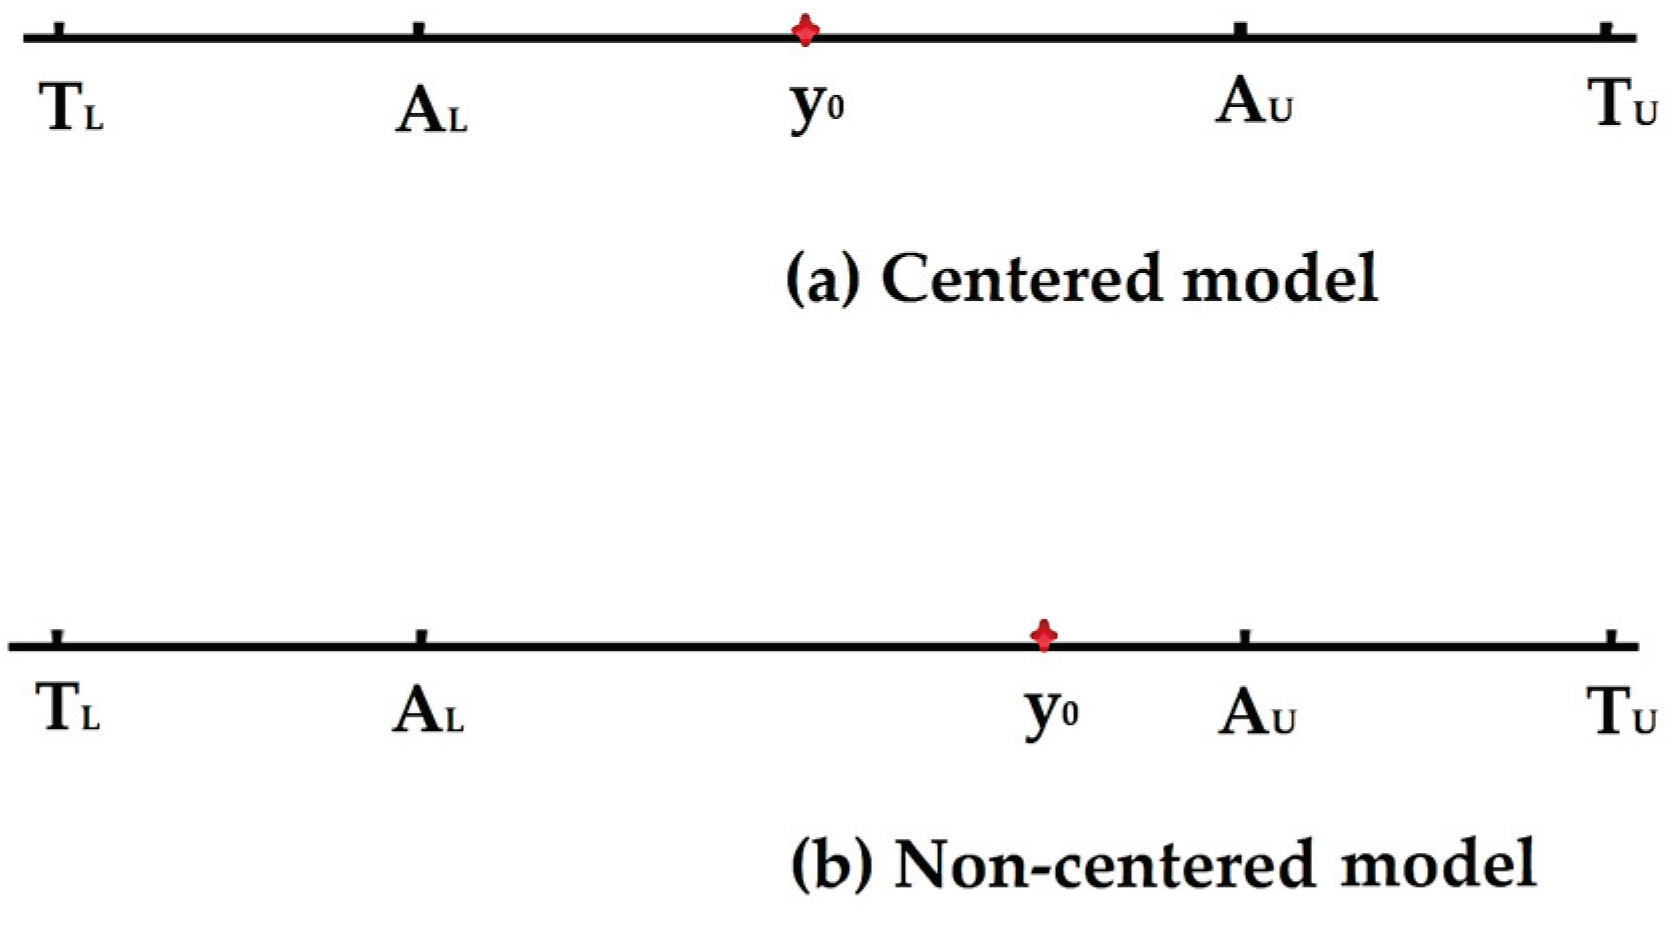
Figure 3.
The measurement uncertainty of the fitted regression line, according to the law of propagation of uncertainties.
Figure 3.
The measurement uncertainty of the fitted regression line, according to the law of propagation of uncertainties.
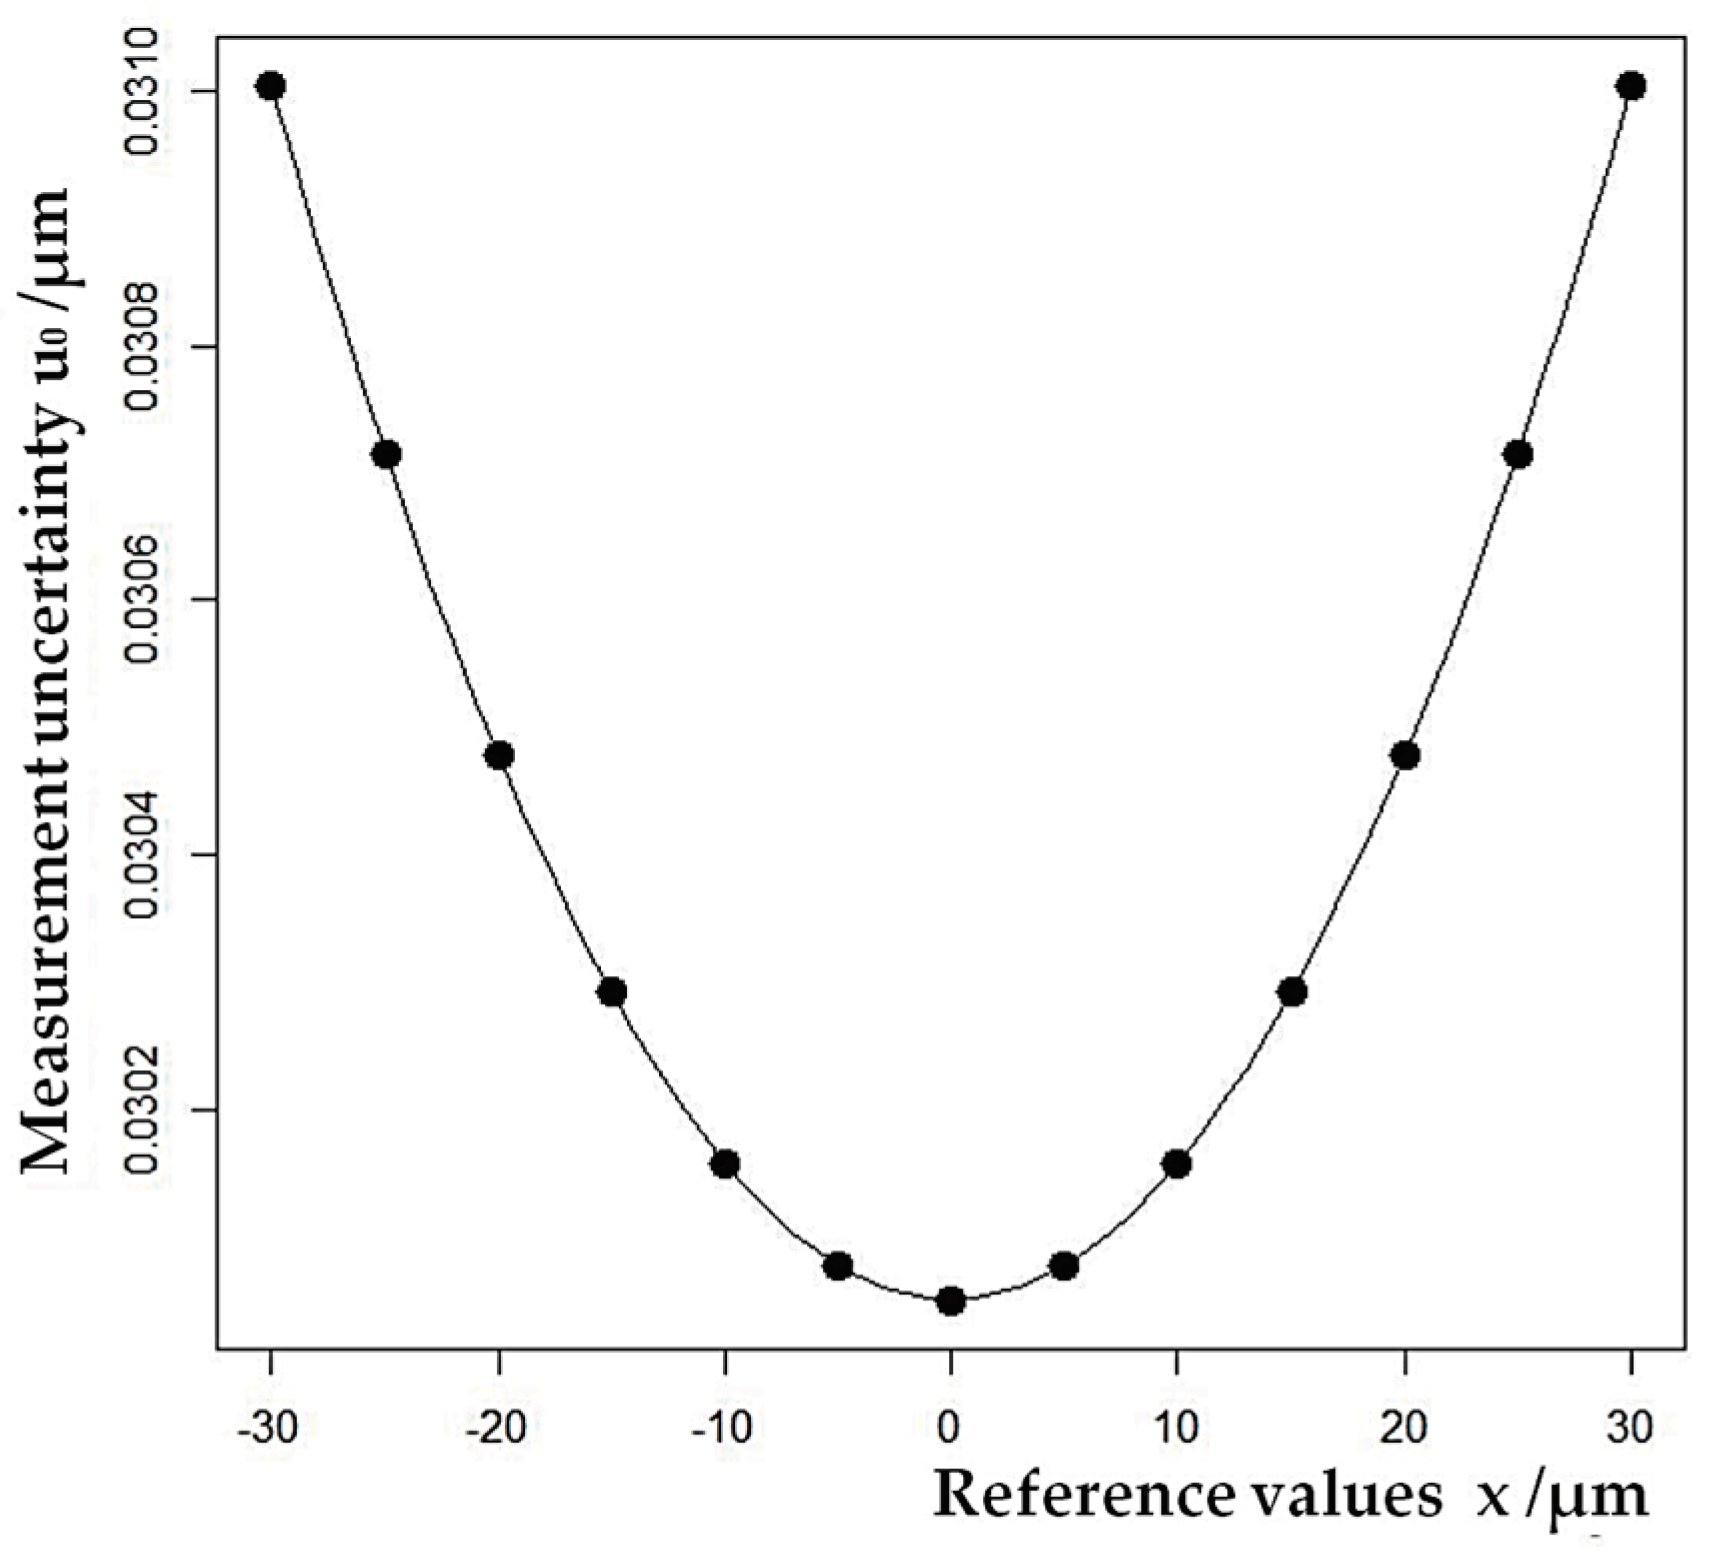
Figure 4.
Spatial extension of the risk assessment model in the case of consumer risk minimization: (a) Linearized model; (b) Non-linearized model.
Figure 4.
Spatial extension of the risk assessment model in the case of consumer risk minimization: (a) Linearized model; (b) Non-linearized model.
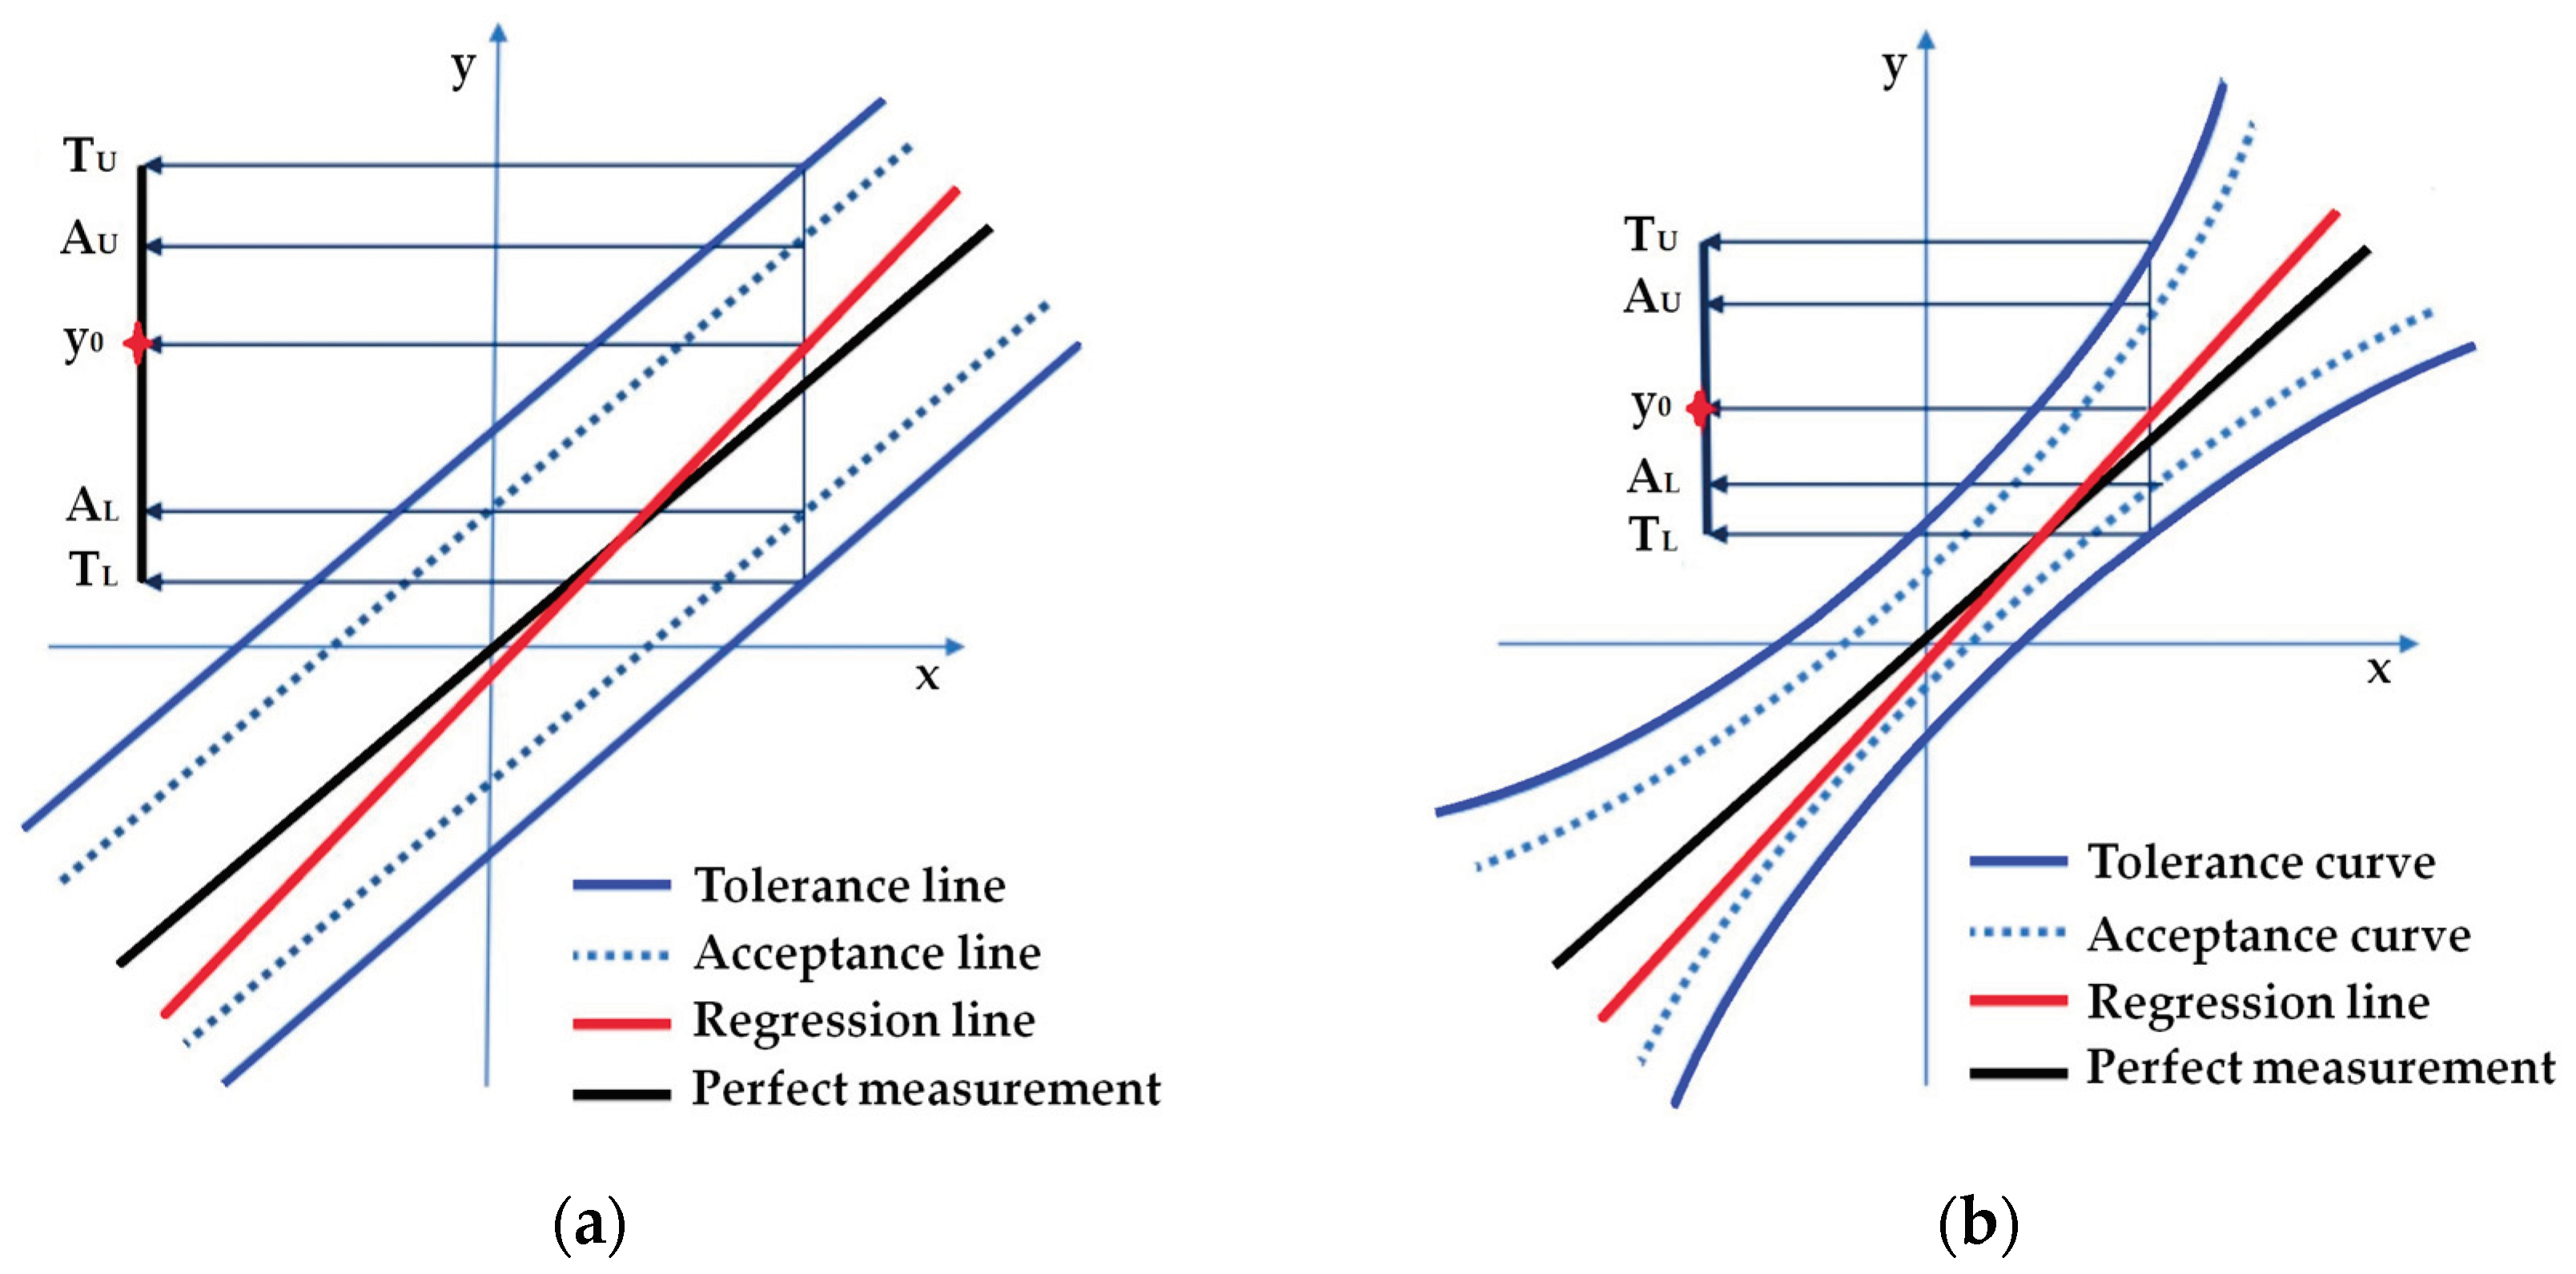
Figure 5.
Comparison of behavior of consumer’s risk and producer’s risk, along the moderate scale for all four models, : (a) Consumer’s risk; (b) Producer’s risk. A violet circle indicates the point of minimum for the risks and .
Figure 5.
Comparison of behavior of consumer’s risk and producer’s risk, along the moderate scale for all four models, : (a) Consumer’s risk; (b) Producer’s risk. A violet circle indicates the point of minimum for the risks and .
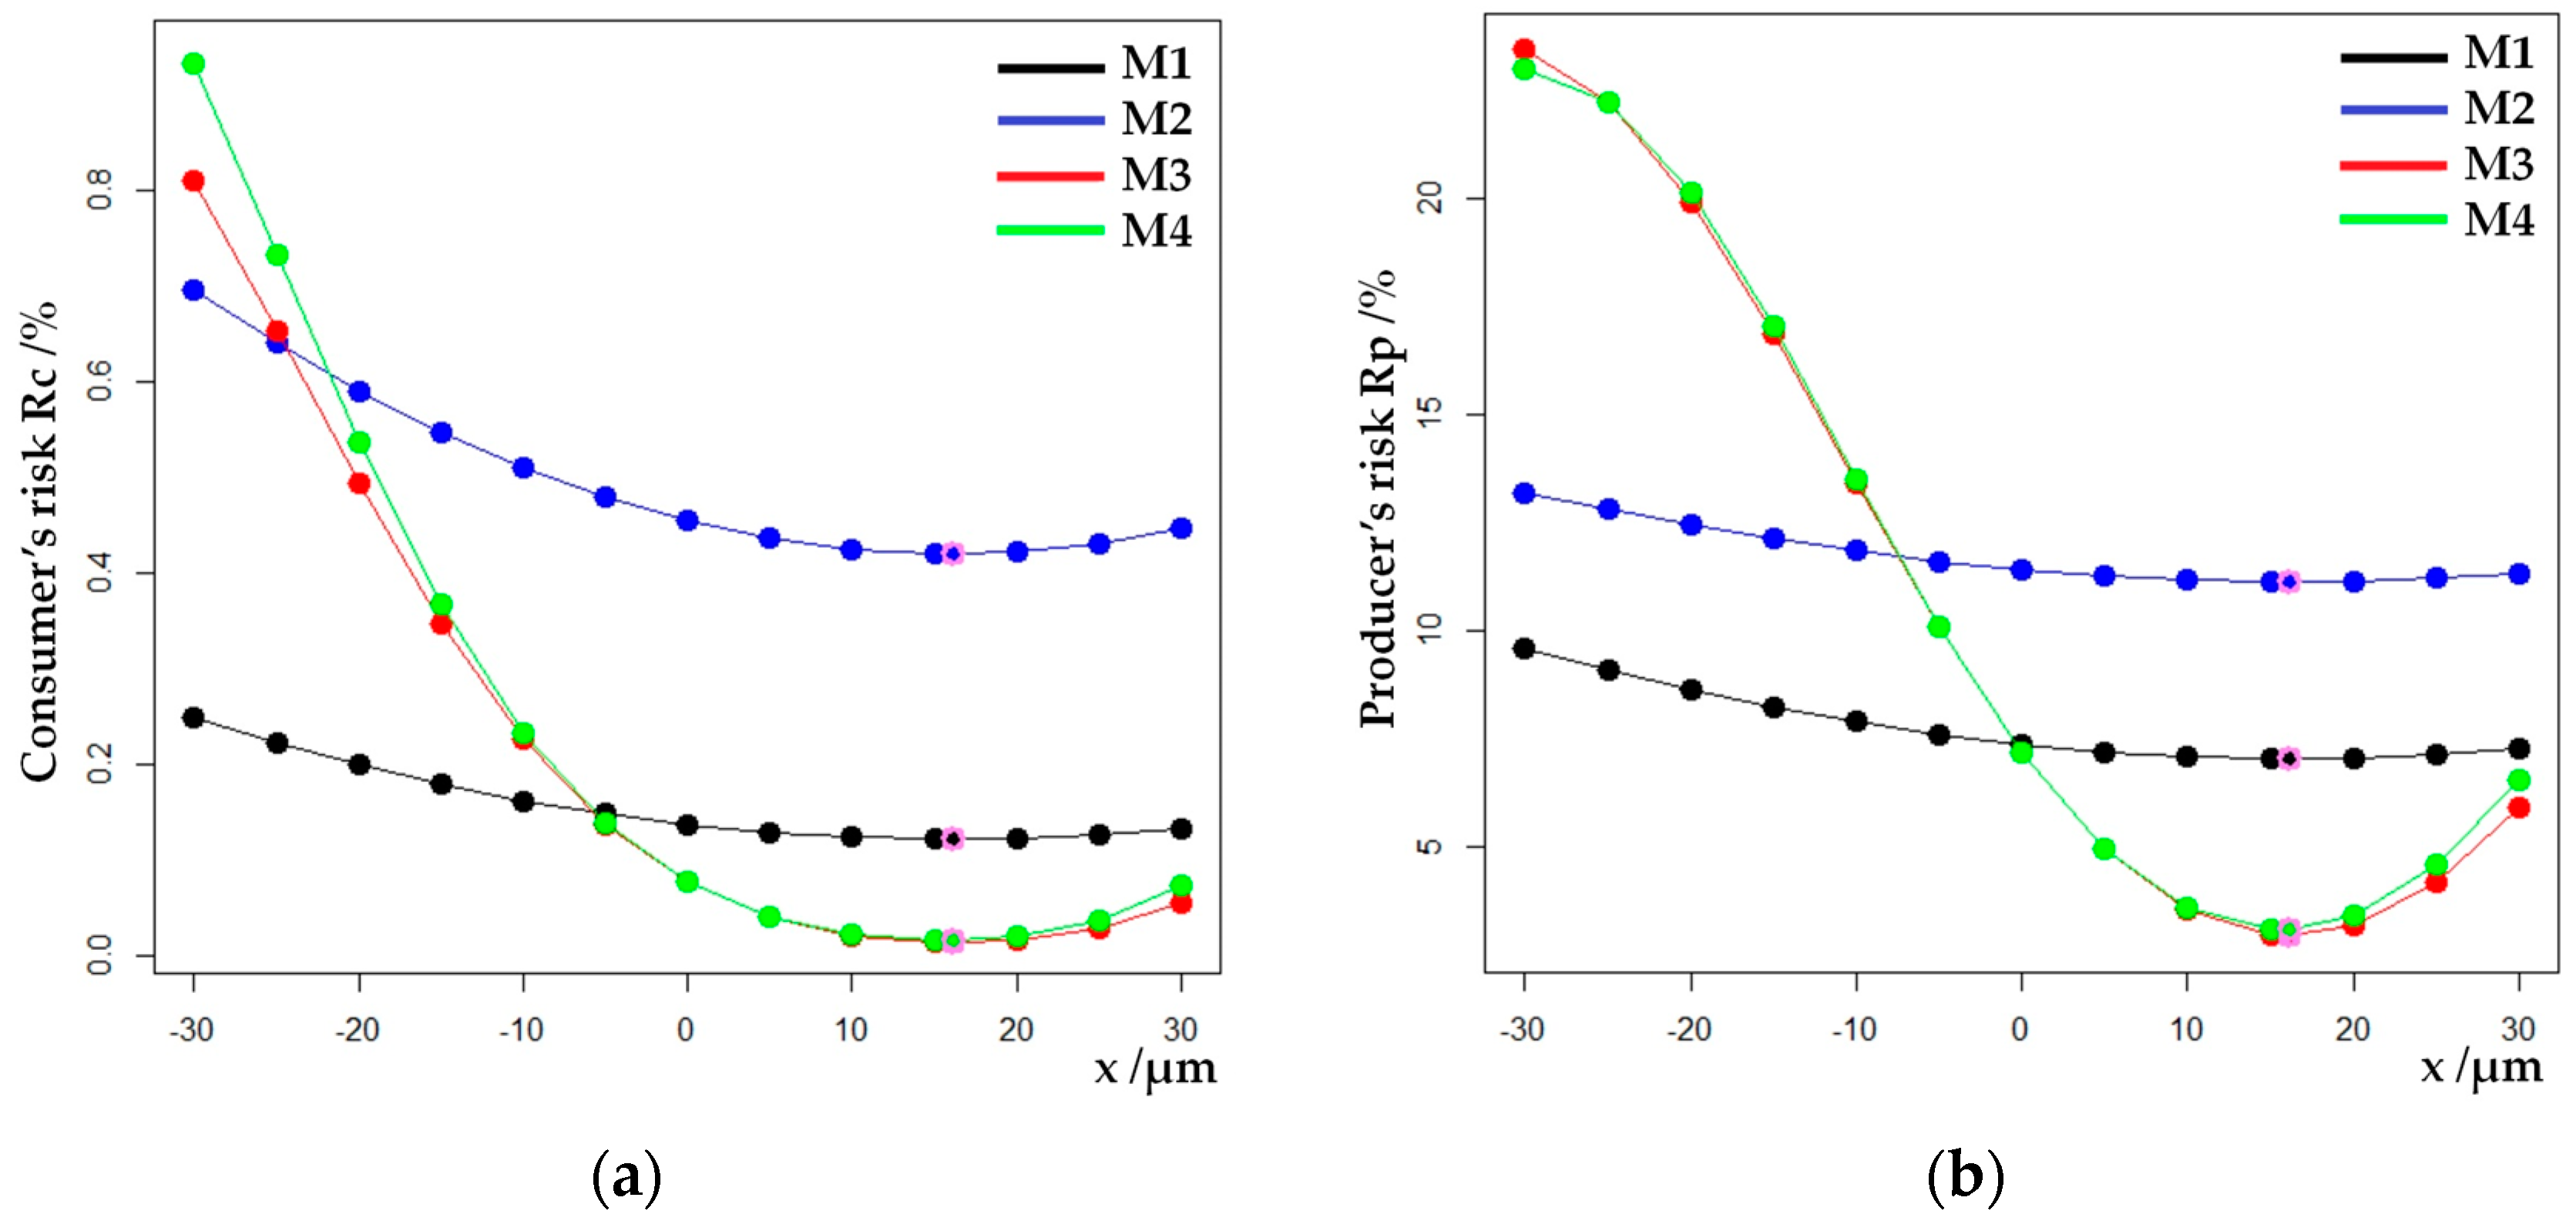
Figure 6.
Comparison of behavior of conformance probability along the moderate scale for all four models, . A violet circle indicates the point of maximum for conformance probability .
Figure 6.
Comparison of behavior of conformance probability along the moderate scale for all four models, . A violet circle indicates the point of maximum for conformance probability .
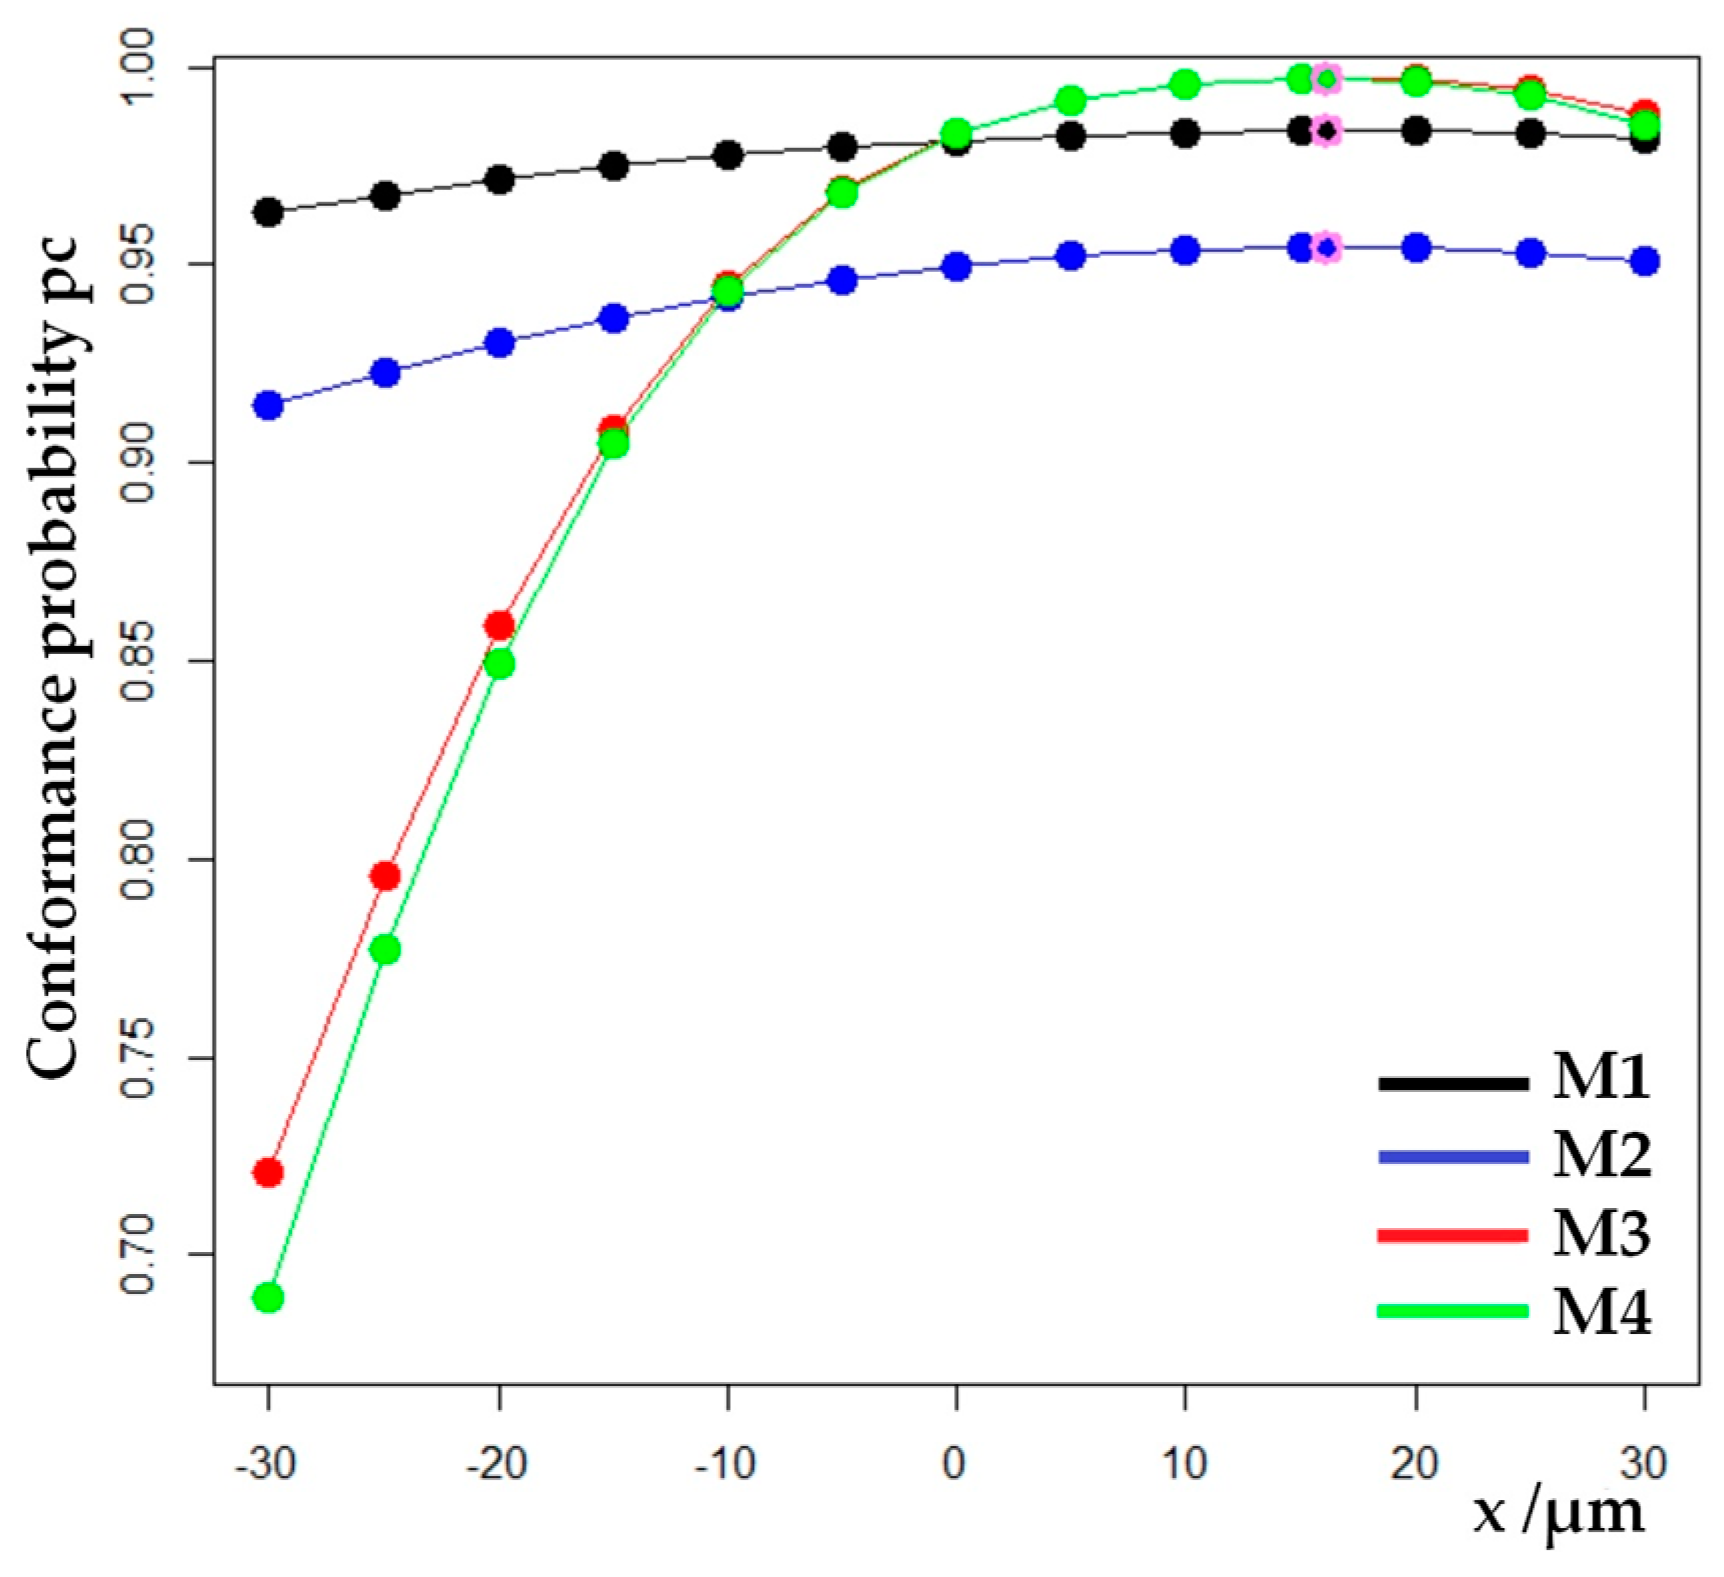
Figure 7.
An example of anomalies in the behavior of global consumer’s and producer’s risks along the moderate scale for the case of , , : (a) Consumer’s risk; (b) Producer’s risk; (c) Conformance probability.
Figure 7.
An example of anomalies in the behavior of global consumer’s and producer’s risks along the moderate scale for the case of , , : (a) Consumer’s risk; (b) Producer’s risk; (c) Conformance probability.
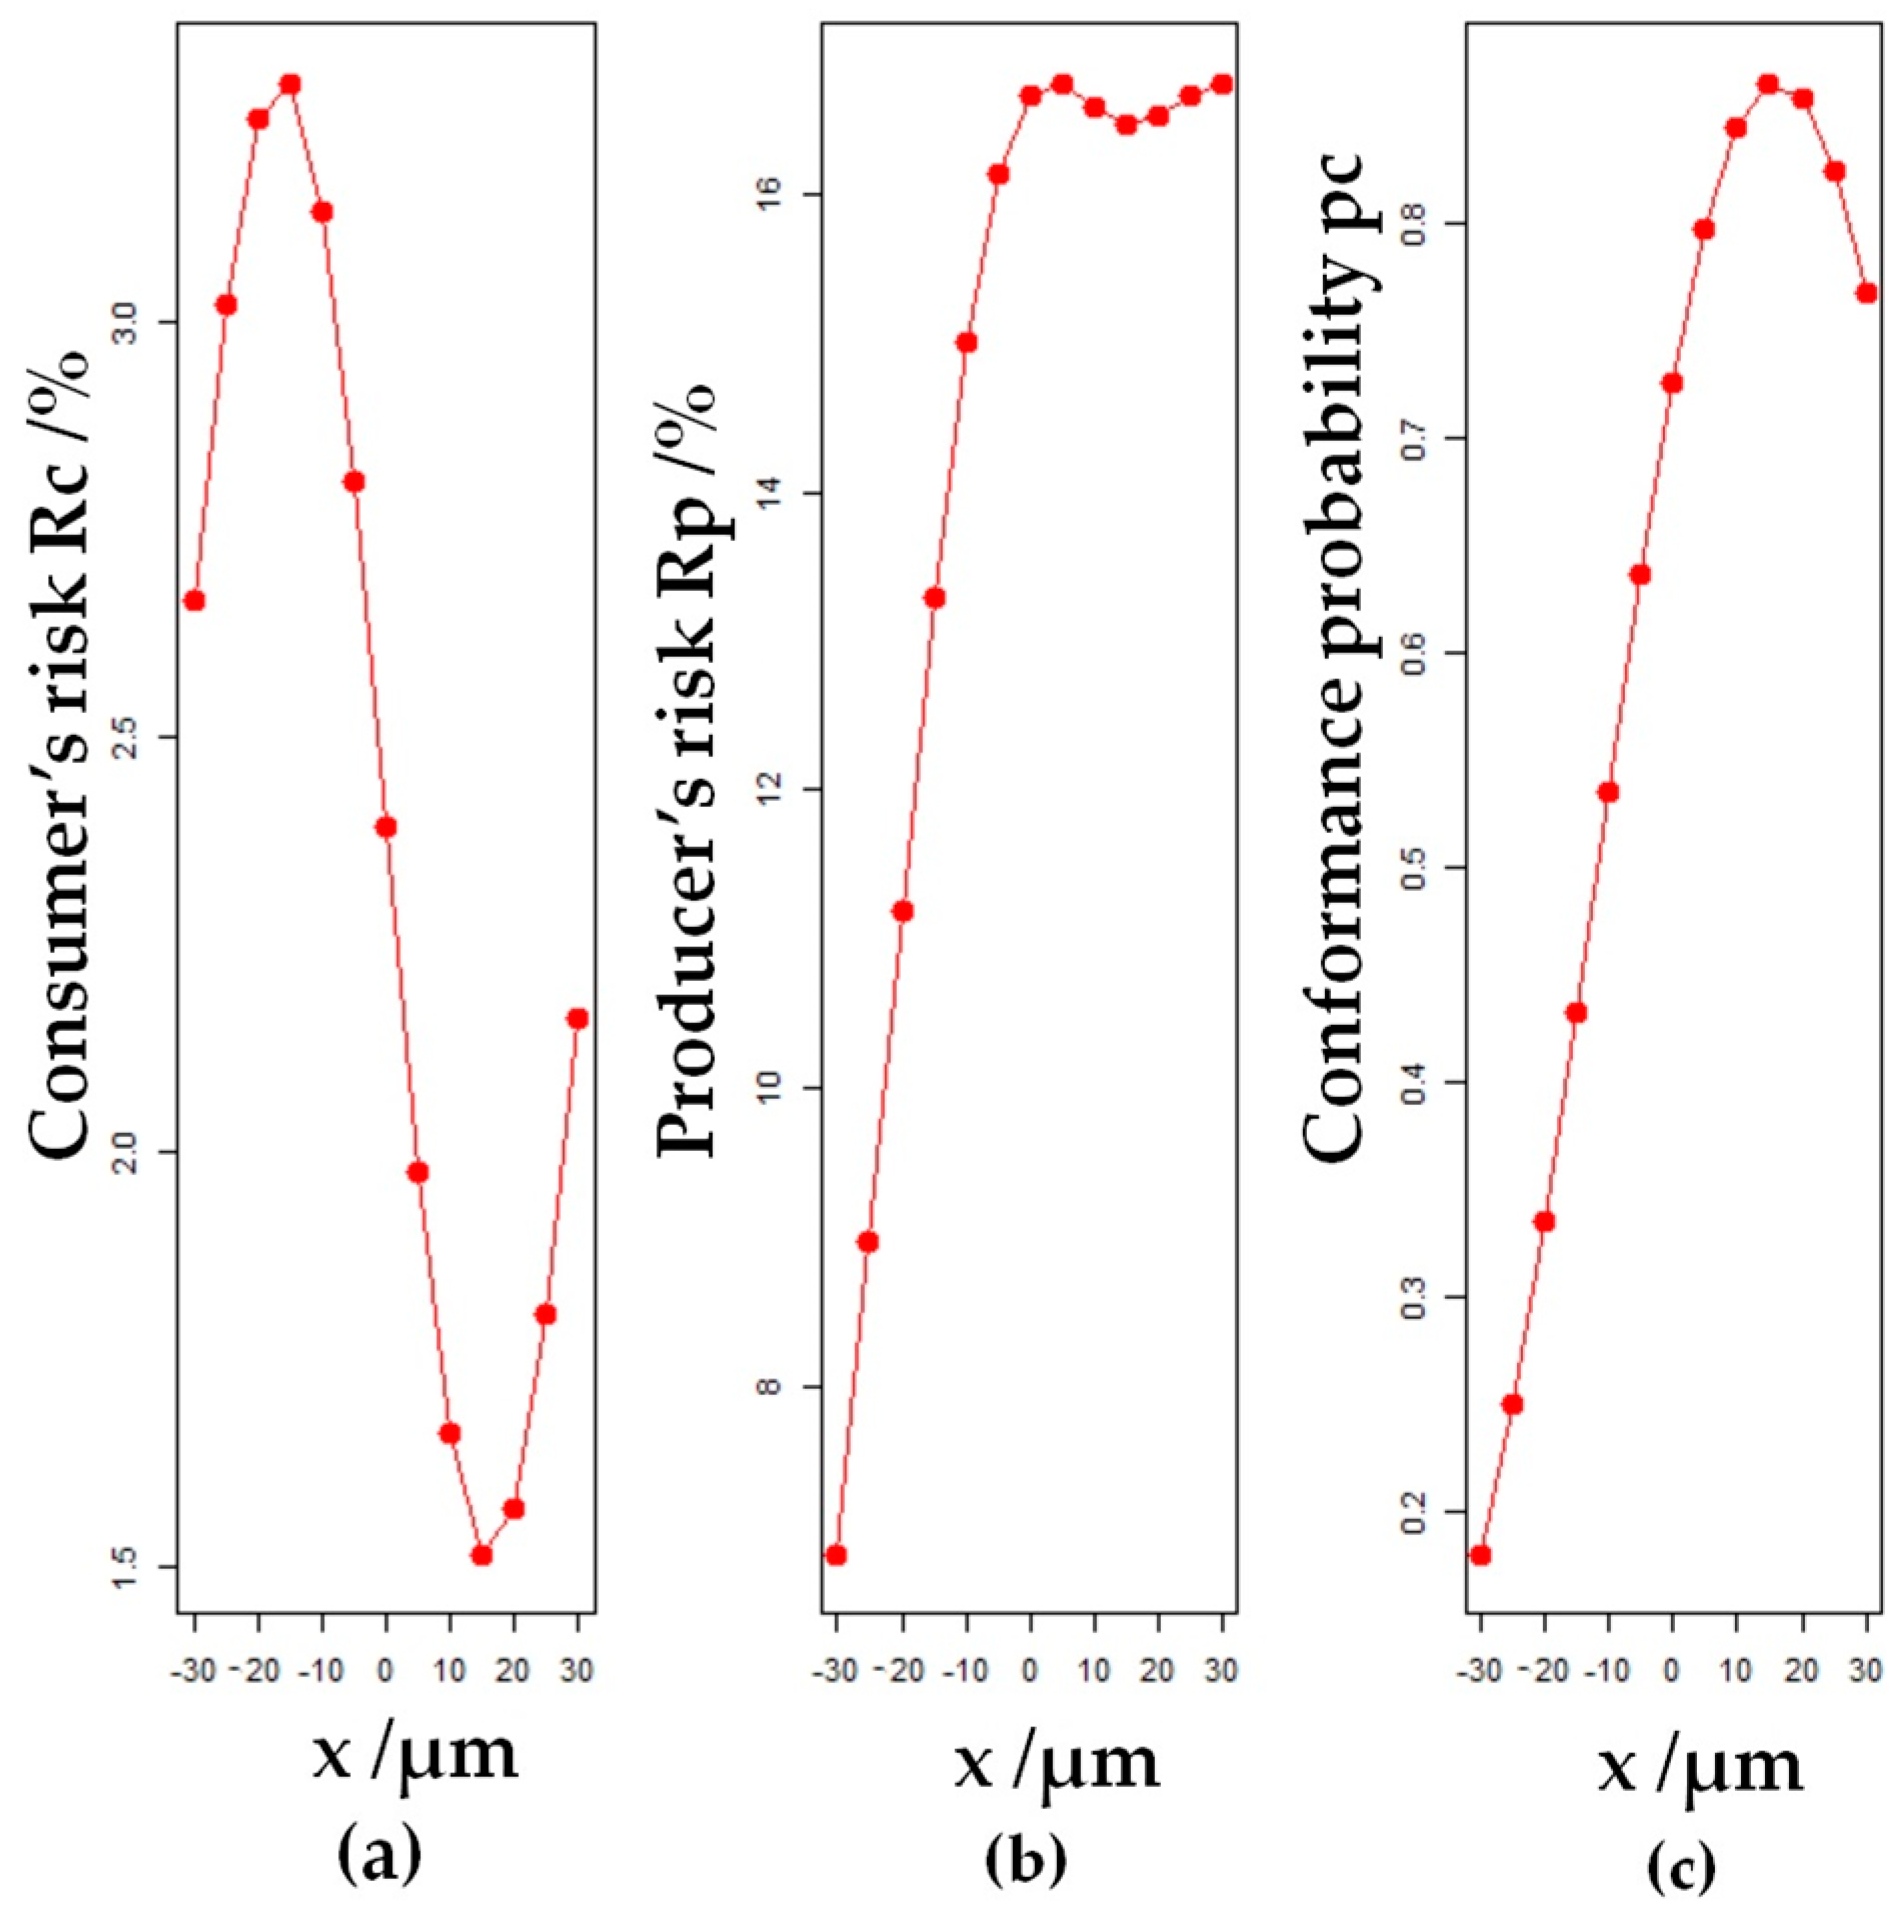
Figure 8.
Curves of a minimum of the global risk of consumers and producers evaluated along the guard band axis at points , , ; (a) Consumer’s risk; (b) Producer’s risk.
Figure 8.
Curves of a minimum of the global risk of consumers and producers evaluated along the guard band axis at points , , ; (a) Consumer’s risk; (b) Producer’s risk.
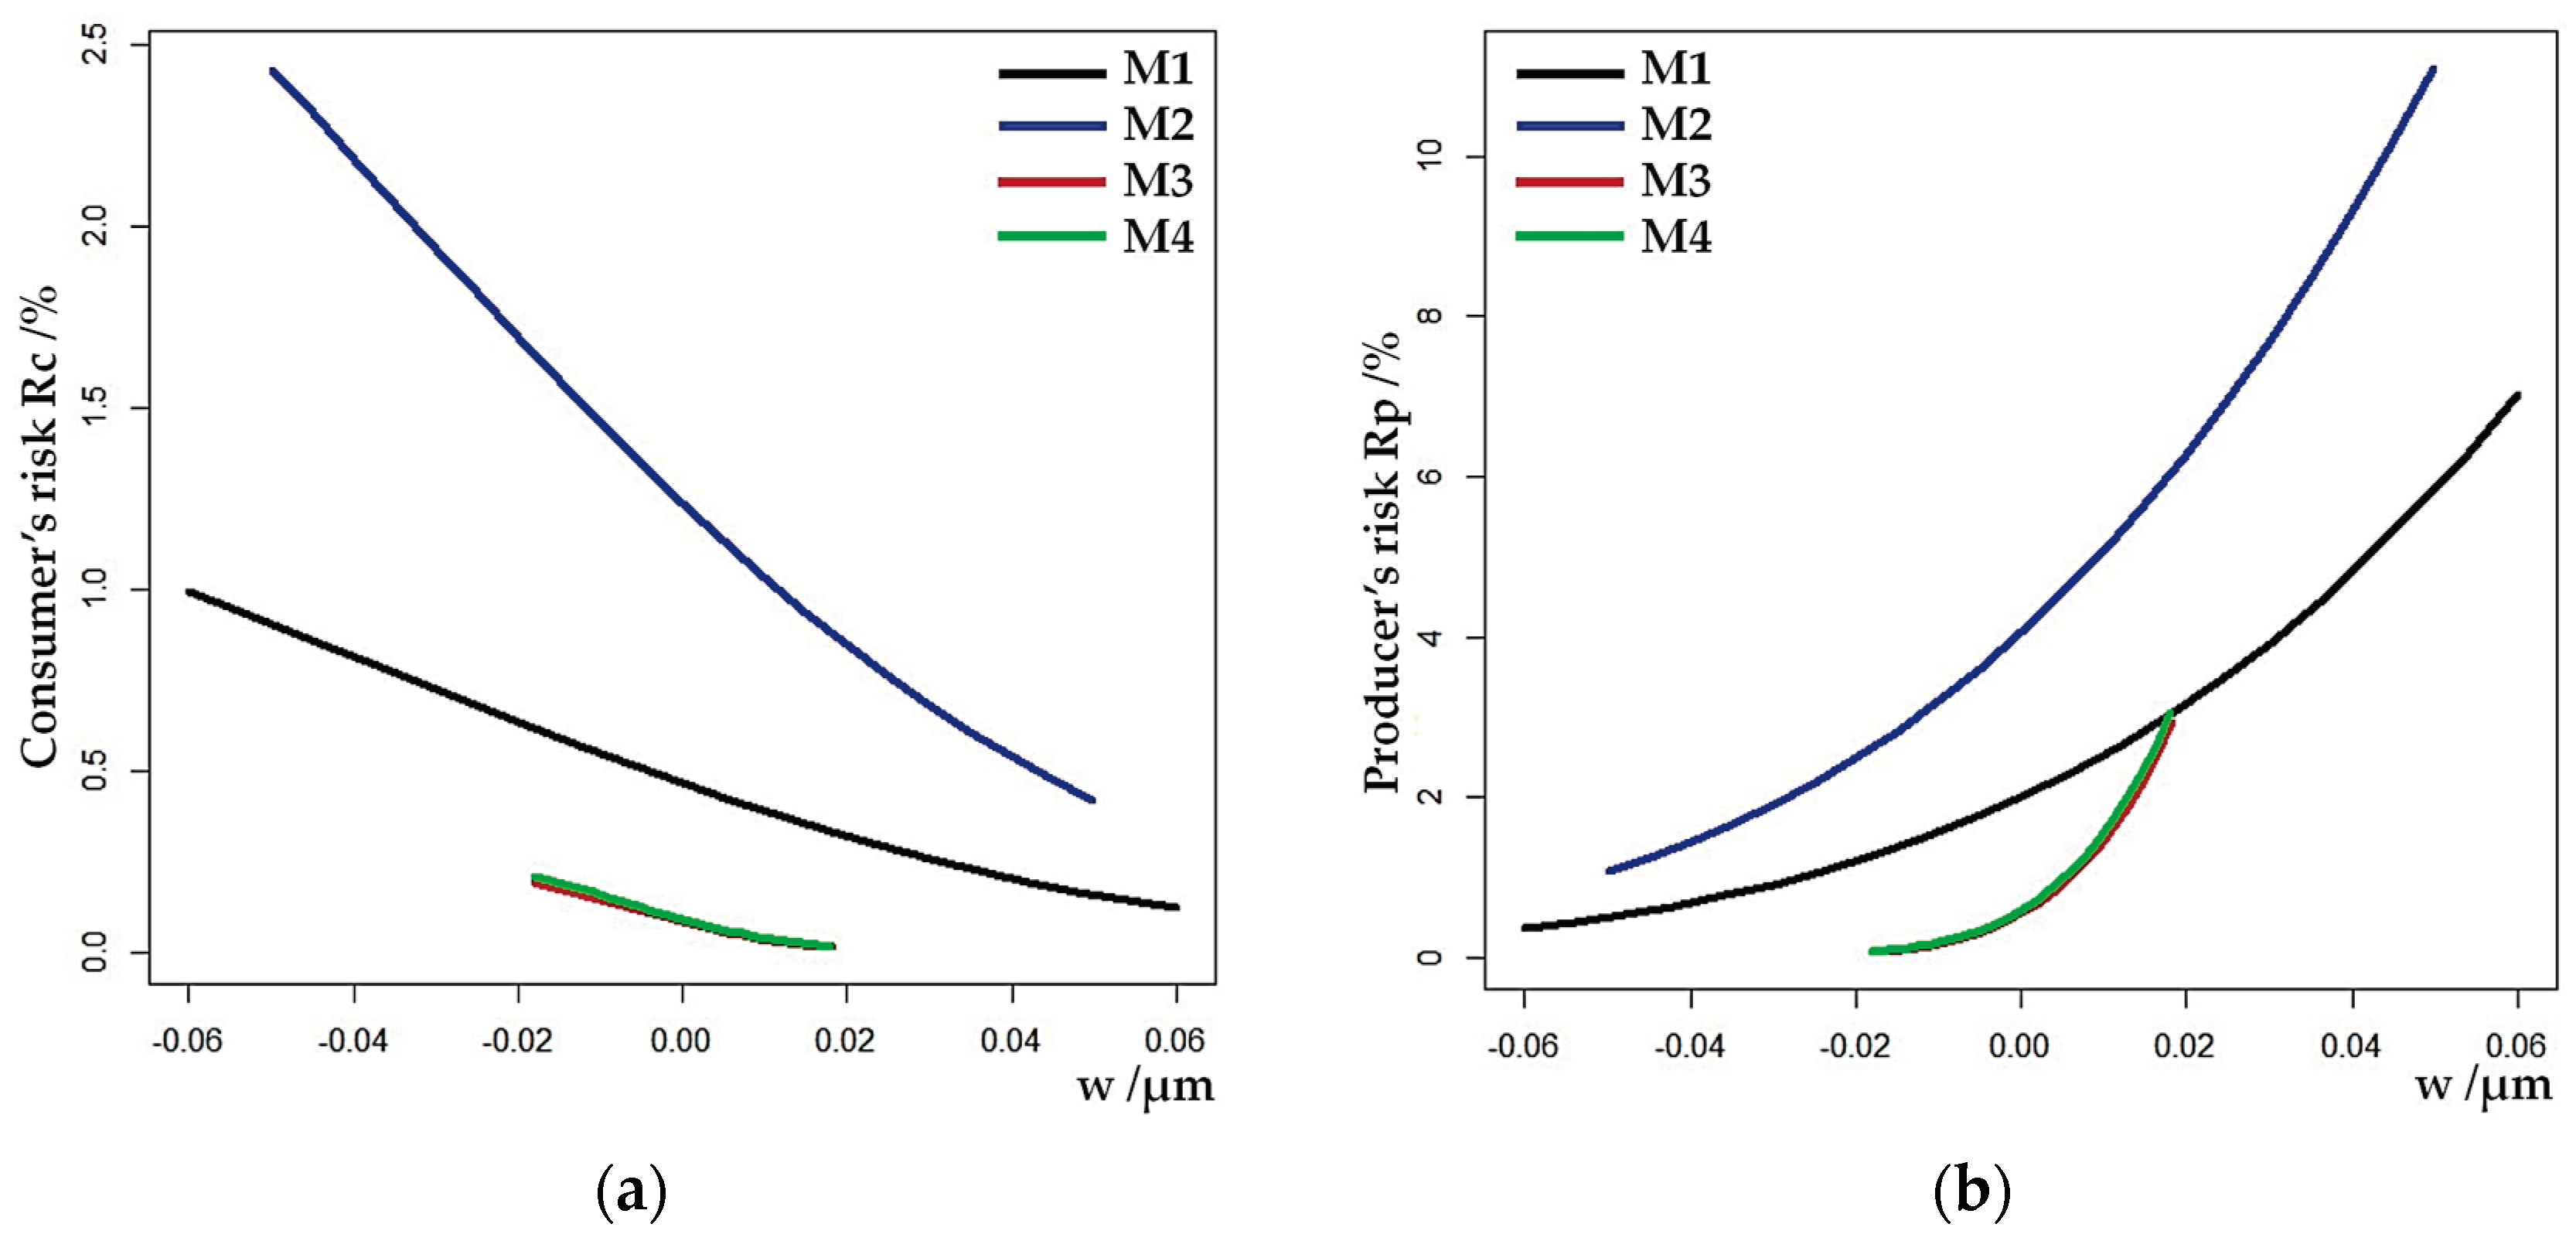
Figure 9.
Risk surfaces; (a) Consumer’s risk; (b) Producer’s risk.
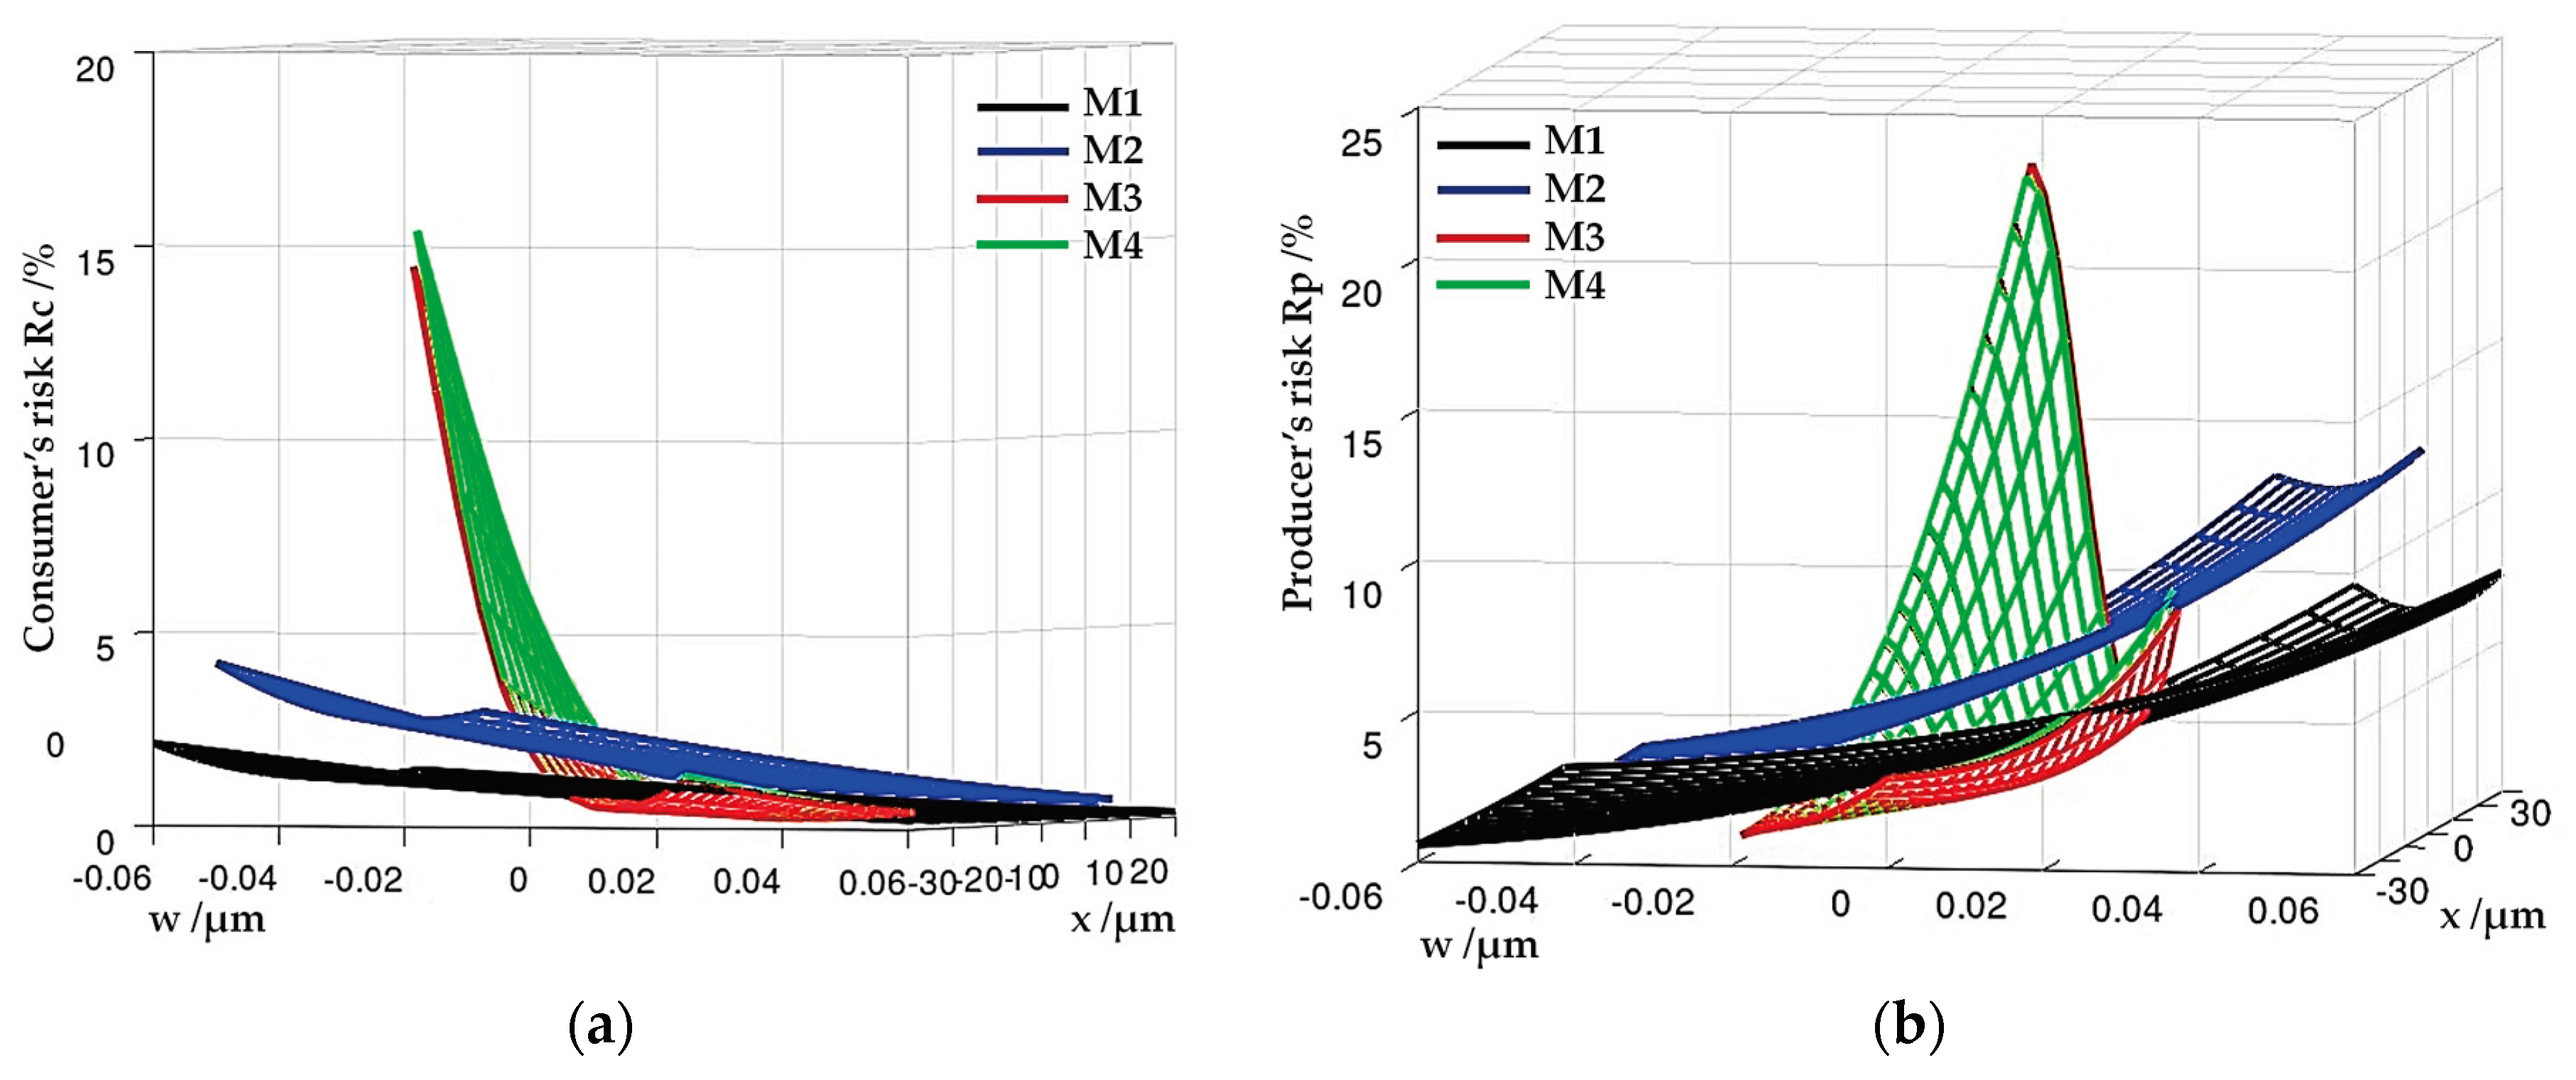
Figure 10.
Conformance probability surfaces.
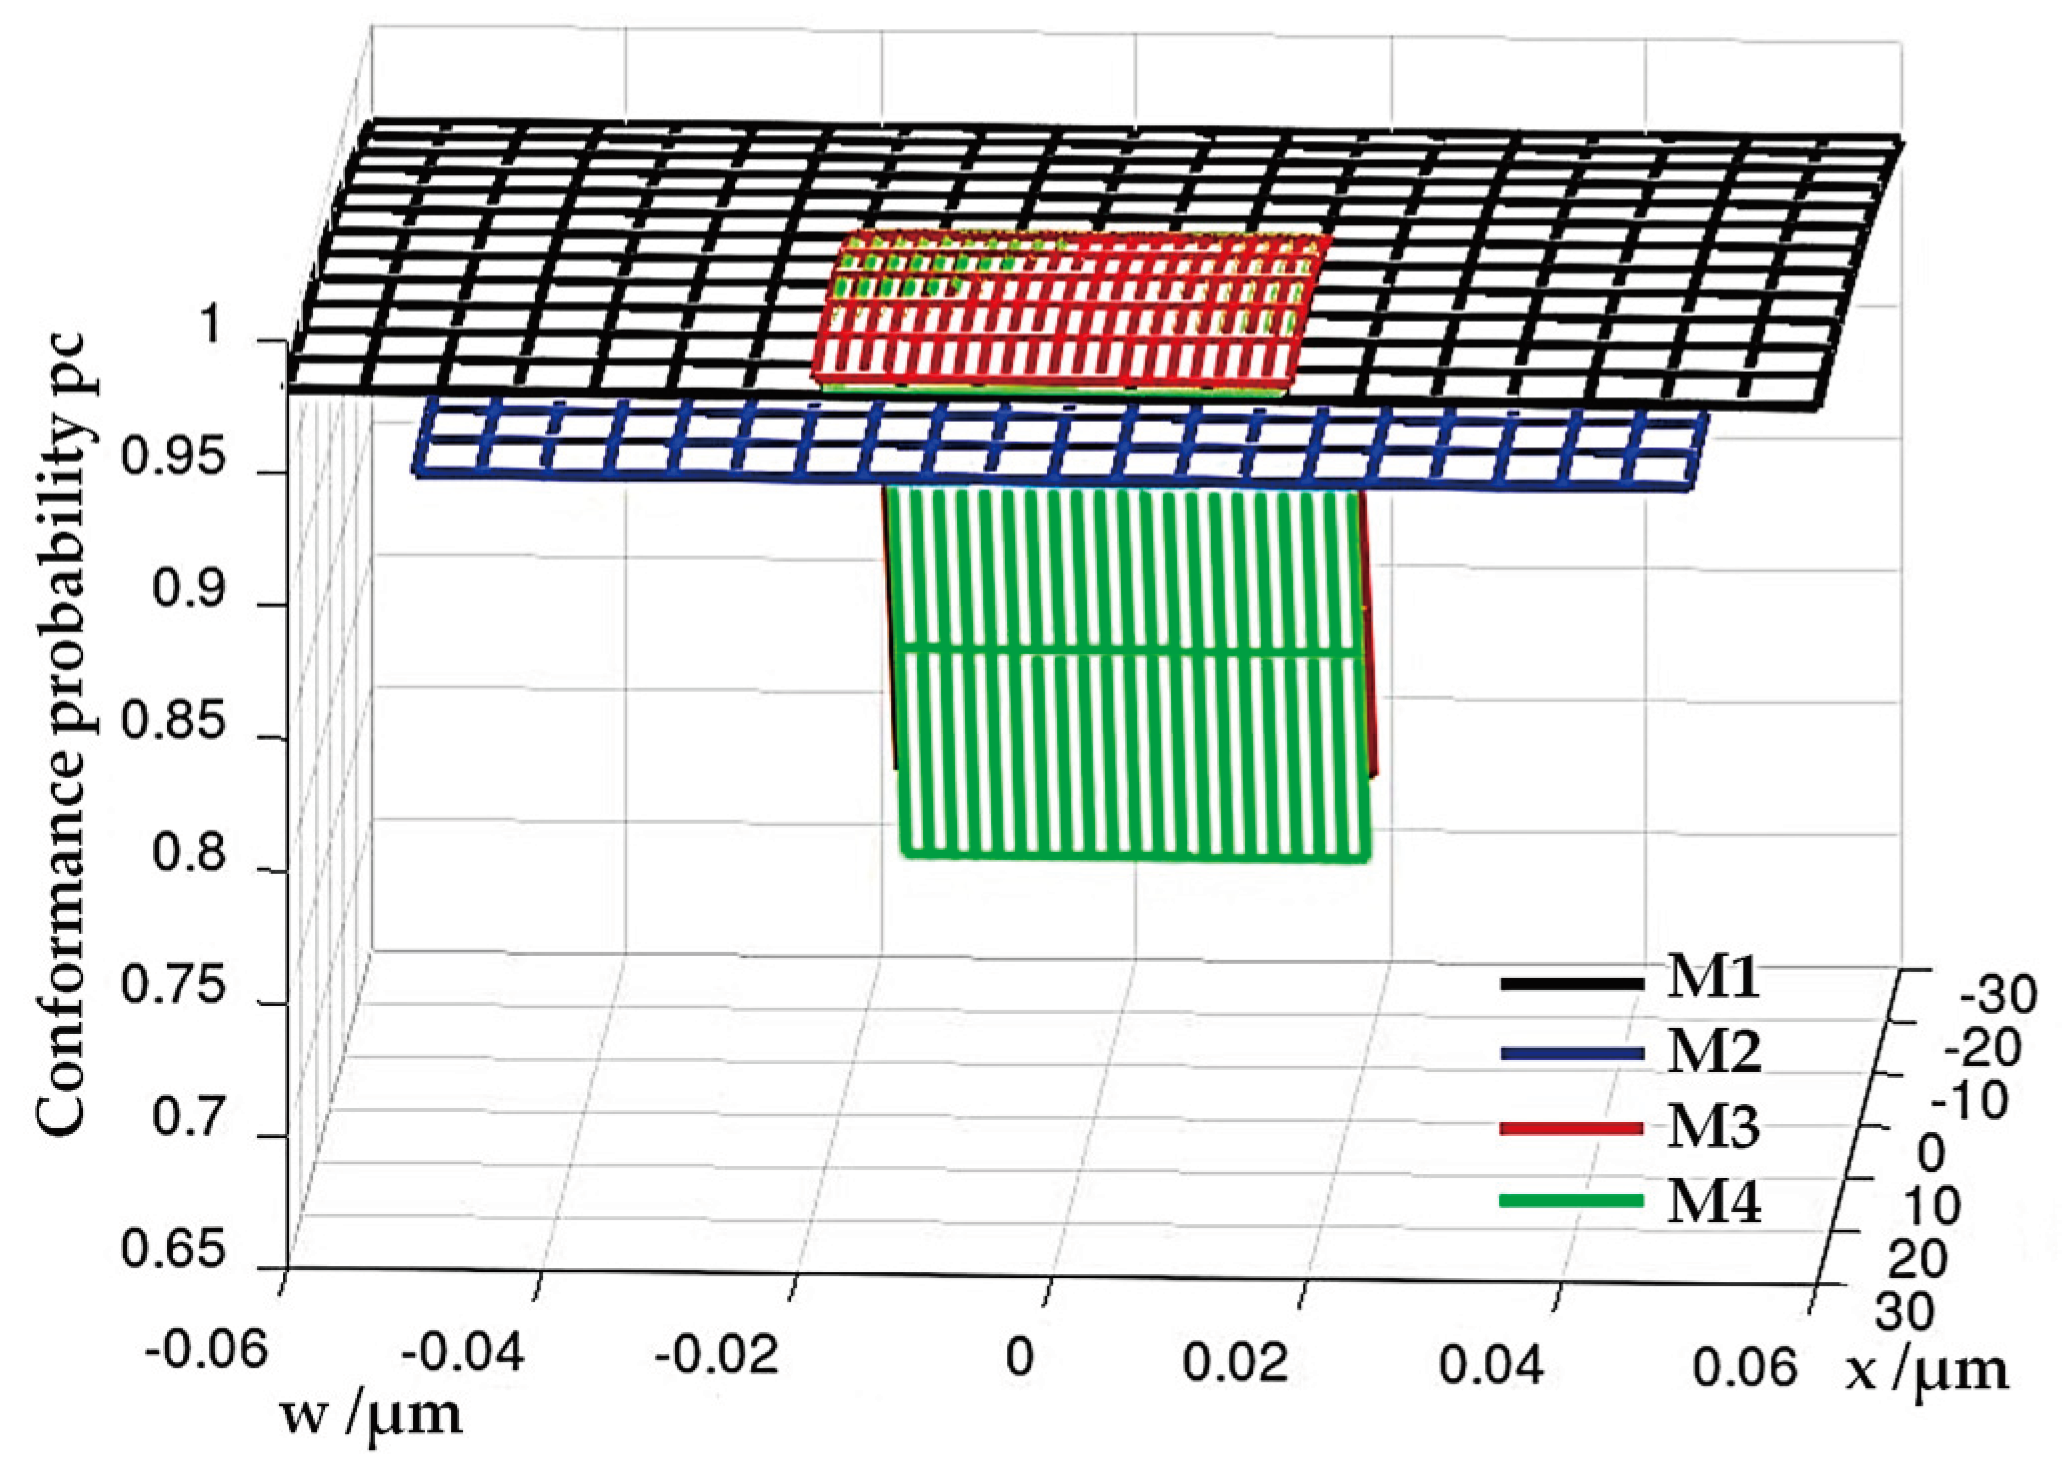
Figure 11.
Behaviors of a global consumer’s risk along the moderate scale with the changes of measurement uncertainty , : (a) Model M1; (b) Model M2; (c) Model M3; (d) Model M4.
Figure 11.
Behaviors of a global consumer’s risk along the moderate scale with the changes of measurement uncertainty , : (a) Model M1; (b) Model M2; (c) Model M3; (d) Model M4.
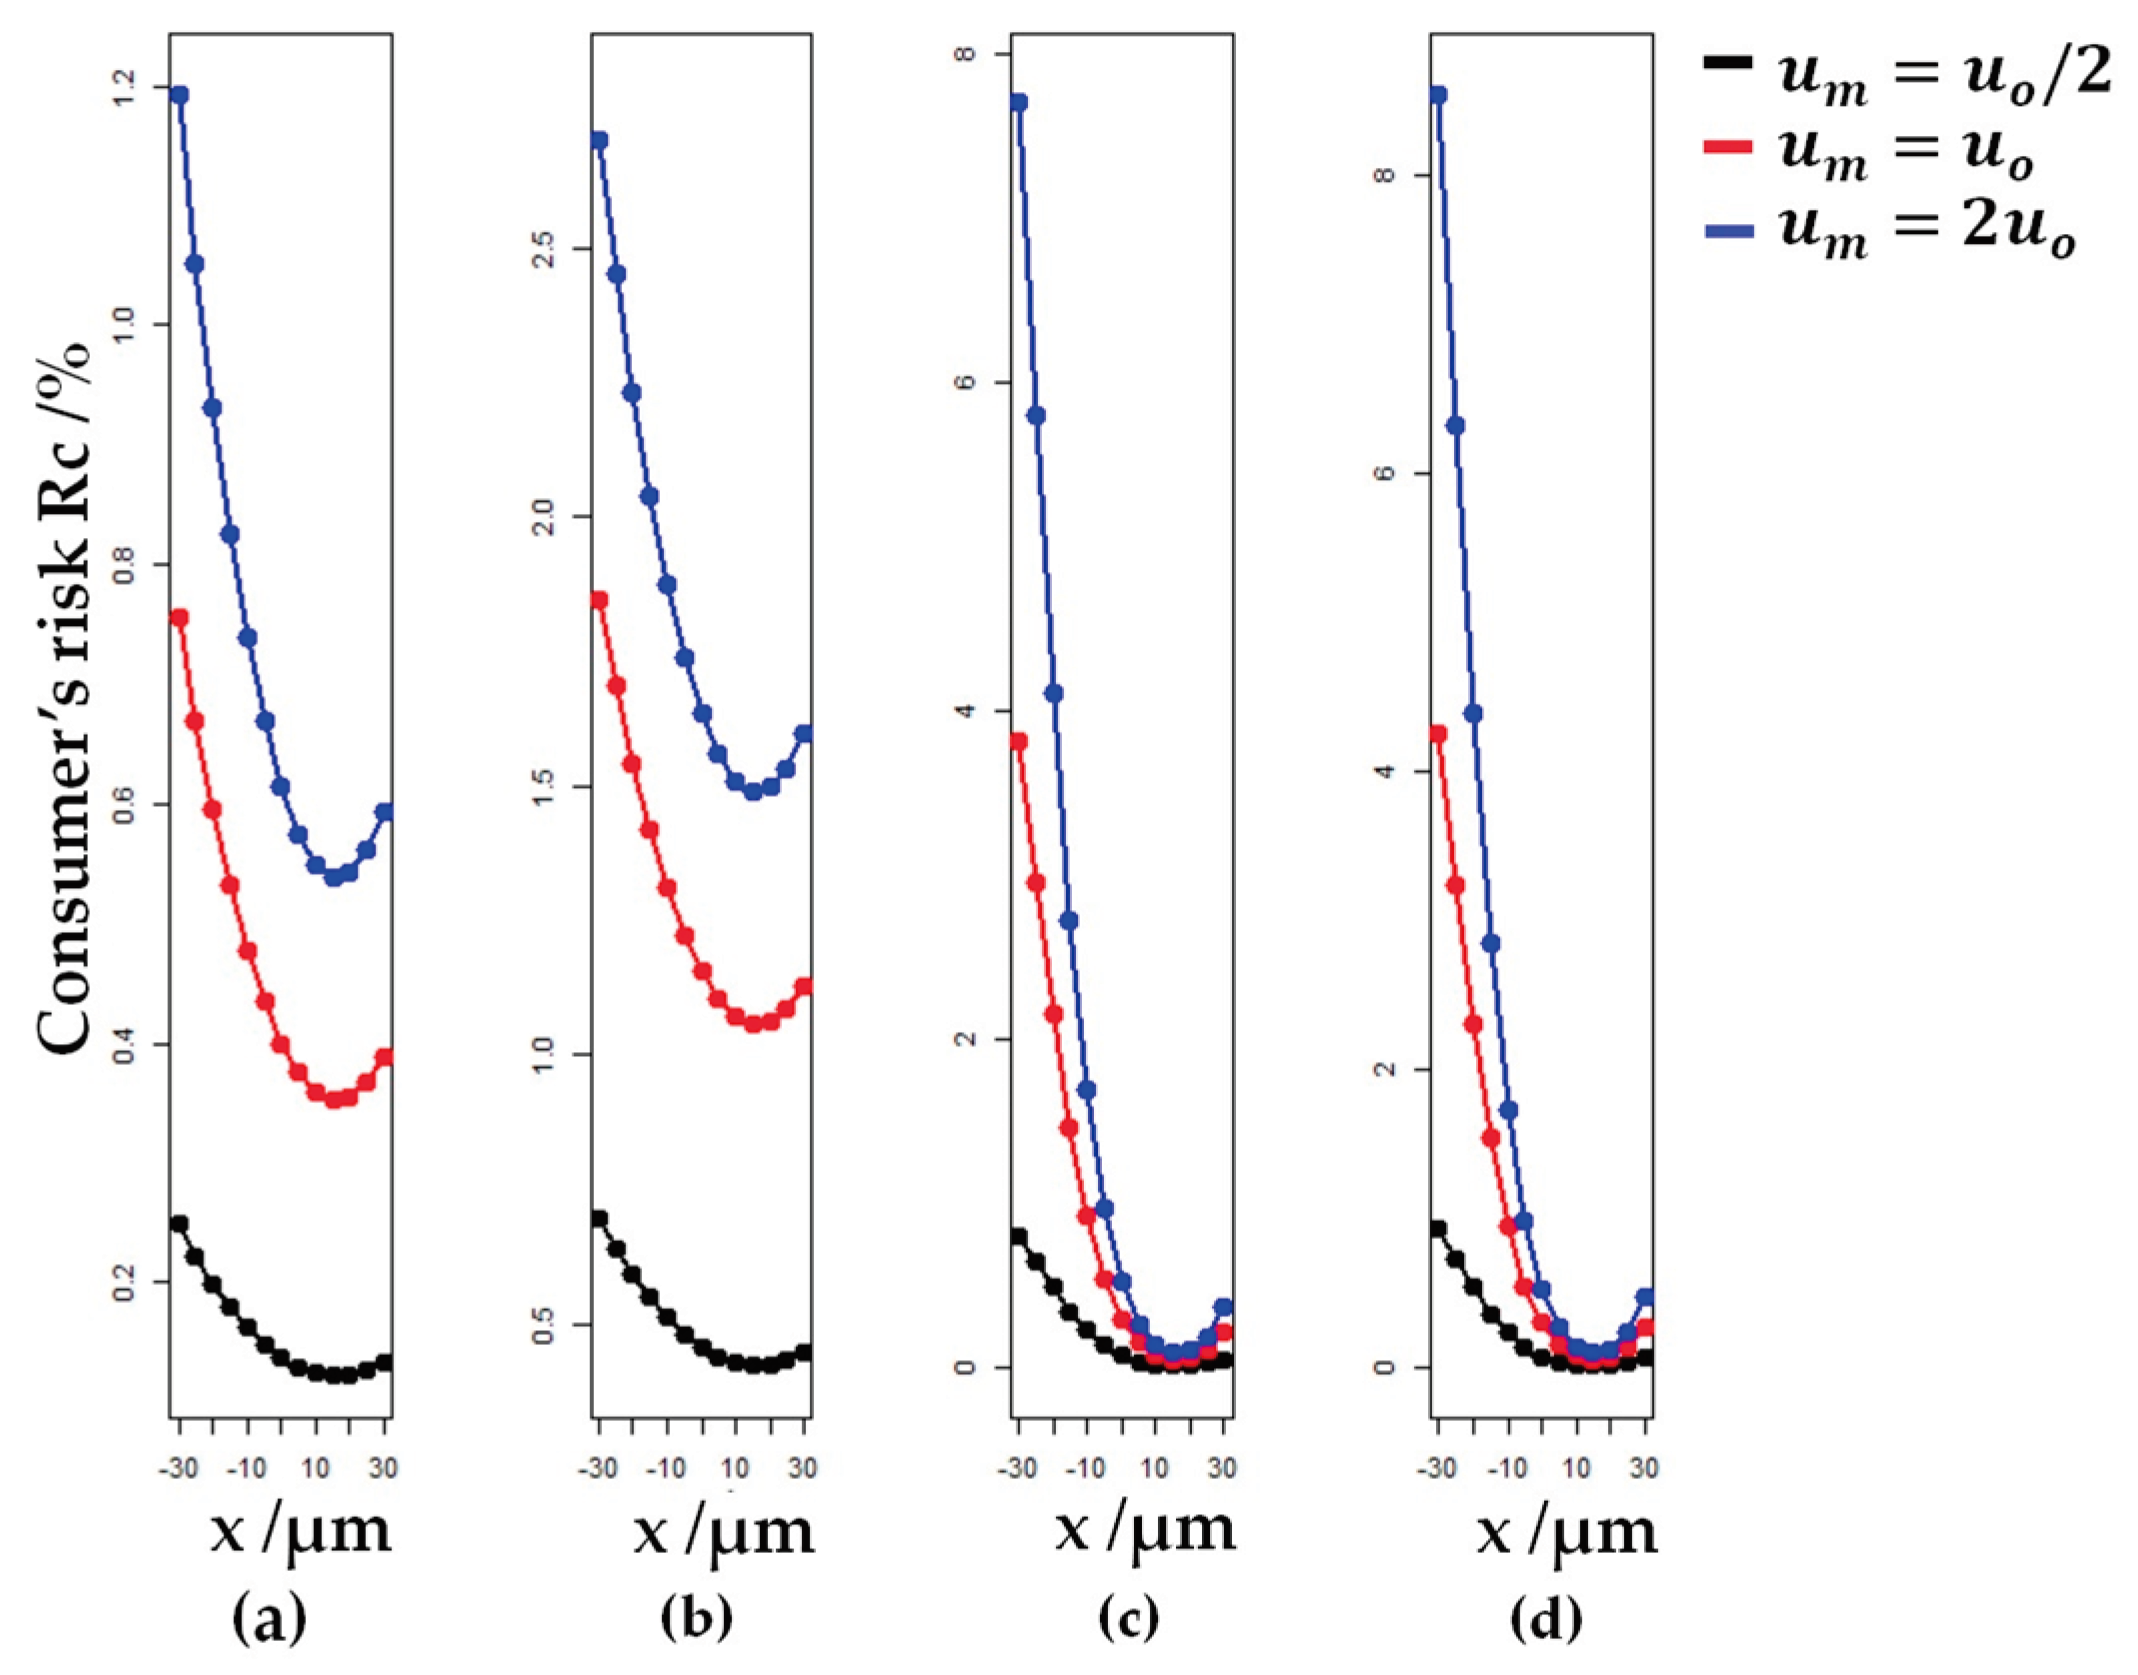
Figure 12.
Behaviors of a global producer’s risk along the moderate scale with the changes of measurement uncertainty , : (a) Model M1; (b) Model M2; (c) Model M3; (d) Model M4.
Figure 12.
Behaviors of a global producer’s risk along the moderate scale with the changes of measurement uncertainty , : (a) Model M1; (b) Model M2; (c) Model M3; (d) Model M4.
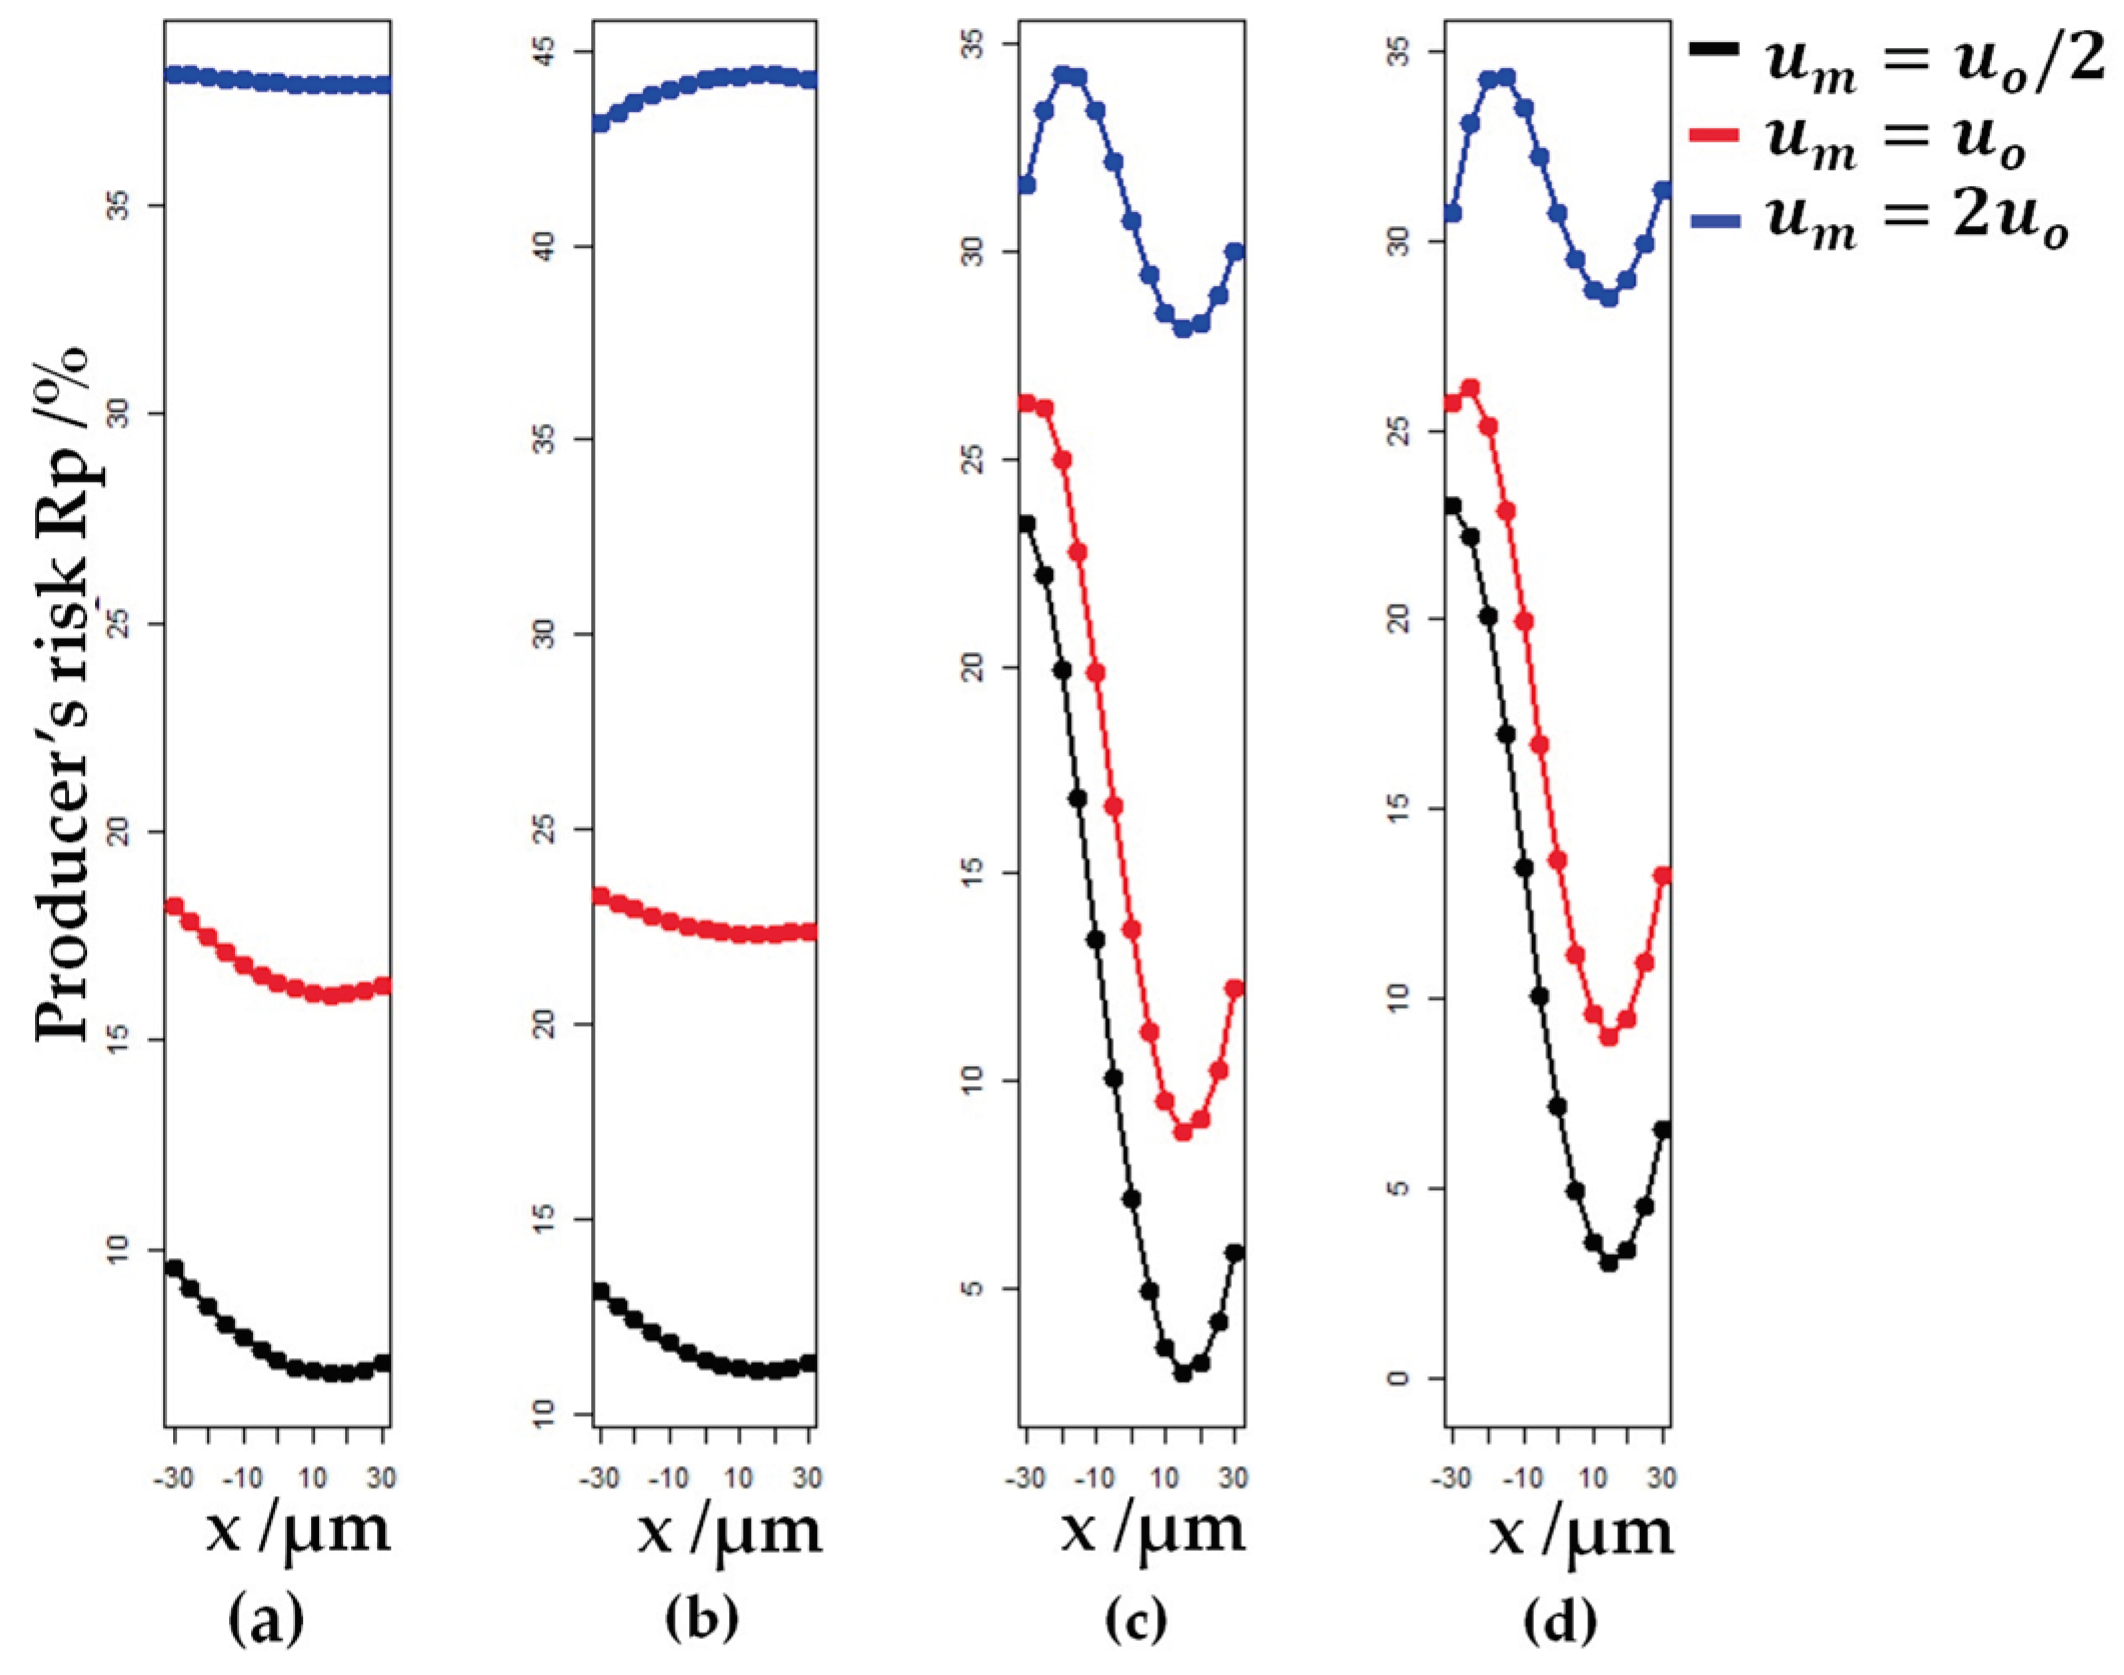
Figure 13.
The comparison of the RMSE values of each individual model, calculated in the values of the moderate scale , for each sample realization : (a) Consumer’s risk; (b) Producer’s risk.
Figure 13.
The comparison of the RMSE values of each individual model, calculated in the values of the moderate scale , for each sample realization : (a) Consumer’s risk; (b) Producer’s risk.
Figure 14.
Comparison of risk models using F1 score: (a) F1 score for models M1 and M2; (b) F1 score for models M3 and M4. The curve of maximums along the guard band axis for all models is marked in pink.
Figure 14.
Comparison of risk models using F1 score: (a) F1 score for models M1 and M2; (b) F1 score for models M3 and M4. The curve of maximums along the guard band axis for all models is marked in pink.
Figure 15.
Comparison of the risk models using DOR: (a) DOR surfaces for models M1 and M2; (b) DOR surfaces for models M3 and M4. The curve of maximums for all models is marked in pink.
Figure 15.
Comparison of the risk models using DOR: (a) DOR surfaces for models M1 and M2; (b) DOR surfaces for models M3 and M4. The curve of maximums for all models is marked in pink.
Figure 16.
Comparison of models using F1 score and DOR surfaces. (a) F1 score; (b) DOR. The curve of maximums for all models is marked in pink.
Figure 16.
Comparison of models using F1 score and DOR surfaces. (a) F1 score; (b) DOR. The curve of maximums for all models is marked in pink.

Table 1.
Calibration of probes in the measuring range of µm [44].
Table 1.
Calibration of probes in the measuring range of µm [44].
| Reference value x / µm | 1st measurement y1 / µm | 2nd measurement y2 / µm | 3rd measurement y3 /µm |
|---|---|---|---|
| −30 | −30.10 | −30.02 | −30.05 |
| −25 | −25.12 | −25.05 | −25.05 |
| −20 | −20.10 | −20.05 | −20.05 |
| −15 | −15.10 | −15.00 | −15.05 |
| −10 | −10.10 | −10.00 | −10.05 |
| −5 | −5.10 | −5.05 | −5.06 |
| 0 | 0.00 | 0.00 | 0.00 |
| 5 | 4.98 | 4.98 | 5.00 |
| 10 | 9.99 | 10.00 | 10.02 |
| 15 | 14.99 | 15.00 | 15.00 |
| 20 | 20.00 | 20.00 | 20.05 |
| 25 | 25.00 | 25.02 | 25.00 |
| 30 | 30.00 | 30.05 | 30.00 |
Pozitive and negative reference values of the calibration scale indicate the direction of the probe movement during calibration.
Table 2.
Uncertainty budget for probe in the measuring range µm [44].
Table 2.
Uncertainty budget for probe in the measuring range µm [44].
| Probability distribution | Standard uncertainty / µm | |
|---|---|---|
| ULM device | Normal | 0.1 |
| Linear error of the probe I | Rectangular | 0.000184462 |
| Linear error of the dial probe II | Rectangular | 0.065909762 |
| Resolution | Rectangular | 0.034641016 |
| Combined measurement uncertainty of the probe | 0.1247 | |
Table 3.
Overview of model properties.
| Model | Uncertainty | Tolerance interval |
|---|---|---|
| M1 Linearized model |
µm | |
| M2 Linearized model |
||
| M3 Non-linearized model |
||
| M4 Linearized model |
Table 4.
RMSE values for global consumer’s and producer’s risk and conformance probability, by models and sample realization and in total.
Table 4.
RMSE values for global consumer’s and producer’s risk and conformance probability, by models and sample realization and in total.
| RMSE, global consumer’s risk | ||||
| / µm | /% | /% | /% | /% |
| 0.63 | 0.94 | 5.40 | 5.27 | |
| 0.22 | 0.35 | 2.55 | 2.68 | |
| 0.17 | 0.27 | 2.11 | 2.16 | |
| 0.40 | 0.60 | 3.66 | 3.63 | |
| RMSE, global producer’s risk | ||||
| / µm | /% | /% | /% | /% |
| 1.16 | 0.97 | 2.40 | 2.52 | |
| 0.46 | 0.42 | 4.03 | 3.97 | |
| 0.35 | 0.32 | 2.92 | 2.87 | |
| 0.75 | 0.64 | 3.19 | 3.18 | |
| RMSE, conformance probability | ||||
| / µm | ||||
| 0.022 | 0.039 | 0.356 | 0.358 | |
| 0.007 | 0.014 | 0.092 | 0.100 | |
| 0.005 | 0.010 | 0.078 | 0.083 | |
| 0.013 | 0.025 | 0.217 | 0.220 | |
Disclaimer/Publisher’s Note: The statements, opinions and data contained in all publications are solely those of the individual author(s) and contributor(s) and not of MDPI and/or the editor(s). MDPI and/or the editor(s) disclaim responsibility for any injury to people or property resulting from any ideas, methods, instructions or products referred to in the content. |
© 2024 by the authors. Licensee MDPI, Basel, Switzerland. This article is an open access article distributed under the terms and conditions of the Creative Commons Attribution (CC BY) license (http://creativecommons.org/licenses/by/4.0/).
Copyright: This open access article is published under a Creative Commons CC BY 4.0 license, which permit the free download, distribution, and reuse, provided that the author and preprint are cited in any reuse.


