
Submitted:
15 February 2024
Posted:
16 February 2024
You are already at the latest version
Abstract
The soil organic matter (SOM) content and stability in natural gypsum soils and soils from mining/industrial areas were compared, in terms of their physical, chemical and micromorphological properties, to determine whether the old brownfield soils were acting as carbon (C) sinks, counteracting increasing carbon dioxide concentrations in the atmosphere. The mining/industrial soils were 50–400 years old, so had been left sufficiently long for full self-restoration. Despite having very different origins, both natural and brownfield soils stored similar amounts of SOM, and had similar pH values, calcium carbonate contents and textures. They were also fully covered with similar grass plant communities. The mining/industrial soils exhibited similar microstructures to the gypsum soils and were often quite porous. The most striking difference between them and the natural gypsum soils was that the mining/industrial soils were strongly polluted with zinc, lead and cadmium. The 50-year-old brownfield soils differed from the others in terms of having a lower state of SOM transformation, with a much higher C/N ratio, lower aggregate water resistance index, lower dehydrogenase activity and greater areas of undecomposed or slightly decomposed plant residues. These parameters in the older (150–400 years) brownfield soils were similar to those of the natural soils.
Keywords:
gypsum soils
; brownfield soils
; micromorphology
; pores
; aggregates
; undecomposed organic matter
1. Introduction
Soil ecosystems contain more carbon (C) than the terrestrial biomass and atmospheric resources combined. Soil C is bound in the soil organic matter (SOM), thereby reducing the emission of carbon dioxide (CO2) into the atmosphere [1,2]. The SOM also supplies the materials and energy required to support plant metabolism, improve plant growth and retain soil water, and is a main source of nutrients [3]. For this reason, SOM is essential to the soil environment, sustaining ecosystem health and functions and, ultimately, human life [4]. Even an insignificant decrease in SOM could have considerable negative consequences for the entire environment [2].
The environmental services that soil provides depend, to a great extent, on its SOM content and quality, in addition to the SOM-related soil features, such as structure and porosity [4]. The particles forming the SOM are bound within the soil structure, specifically in microaggregates (∅ = 50–250 µm) and macroaggregates (>250 µm) [5]. The small pores resulting from the arrangement of the primary soil particles are known as textural (intra-aggregate) pores, while the larger (inter-aggregate) pores, known as structural pores, result from biological activity, climatic conditions and management practices [6]. The soil structure controls several processes, such as the retention of water, gas exchange, nutrient dynamics and root penetration. It is also a habitat populated by soil organisms, controlling their diversity and activity [6].
To interpret soil processes and the nature and arrangement of soil features, micromorphological techniques, based on thin-sections made from undisturbed soil samples, have often been used. These allow the structure and porosity to be assessed and the soil constituents to be identified, including the SOM, its quality and degree of decomposition [4,7,8]. Microscopic observations can be complemented with quantifications of the micromorphological constituents based on scanned colour images processed using image-analysis computer software [9,10].
Soil contaminated with trace metals is widespread as a result of industrial activities, such as the mining, extraction and processing of mineral ores [11,12,13]. These activities lead to the destruction of the whole soil profile, resulting in the substantial loss of SOM. Soil recovery in such areas mainly involves the development of surface horizons and SOM storage [14]. According to Slukovskaya et al. [15], the restoration of ecosystems on brownfield sites takes at least 30–35 years. In the first recovery phase, which takes about 5–7 years, an organic-accumulative layer forms, fixed by the root systems of perennial grasses. Where the soil pollution is heavy, this stage can take an extended amount of time due to the need to reduce the toxicity of the soil. However, after several years, the recovered soils of mining/industrial areas could potentially become important C reservoirs.
Studies on the original structure of SOM and its relationship to soil porosity and aggregation at detailed scales have already been undertaken, investigating different aspects and the effects of different climatic conditions. Such studies have illuminated the impact of the addition of organic products on aggregate stability [16] and the soil pore structure effect on the rate of SOM decomposition [1,10]. Forms of organic substances in soils have been studied at the microscopic level in a riparian zone [17], while Virto et al. [18] investigated the effect of soil mineral composition on aggregation, with a focus on SOM, calcium carbonate (CaCO3) and clay contributions to semi-arid Mediterranean soils, emphasising the role of SOM in aggregate stabilisation. The soil quality in restored mining areas was the subject of a study by Bosch-Serra et al. [13], who linked soil biological activity, aggregation and porosity with chemical properties. A micromorphological investigation allowed the authors to confirm that the development of pore structure in restored mining soils, accompanied by high micro- and mesofaunal activity, led to pedogenesis mainly through the formation of pedogenic structures. The relationships between soil chemical and micromorphological properties and SOM transformation have been investigated in soils derived from gypsum under Mediterranean climatic conditions [7]. The authors focused on problems associated with plant root penetration and water infiltration due to microcrystalline gypsum pore infillings.
Having reviewed the literature, to our knowledge, no studies have investigated SOM at the microscale, in terms of its relationship with the soil physicochemical properties of two contrasting soils––natural soils derived from gypsum and old, self-restored soils from mining and industrial areas. Soils derived from gypsum occupy large areas under arid or semi-arid climatic conditions, where the presence of precipitated gypsum in the soil profile often inhibits plant growth and worsens the soil properties and fertility [7,19]. In temperate areas, although such soils occupy small areas and are usually shallow, they are environmentally important because they contain high amounts of SOM [20] and exhibit high biological activity [21]. For these reasons, we chose gypsum soils to compare with self-restored mining/industrial soils treating them as a pattern for mining/industrial soils.
We hypothesised that both groups of soils (natural gypsum and post-mining/industrial) were important C sinks, storing high amounts of SOM. However, we thought that excessive amounts of trace metals in the post-mining/industrial soils would have negatively affected their structural development, which would thus affect SOM stabilisation, compared to the case in natural gypsum soils. In order to test the hypothesis, we compared the SOM decomposition state, structure and porosity in natural soils derived from gypsum and in self-restored soils from former mining and industrial areas. As well as measuring their physicochemical properties, we examined thin-sections of the soils in order to determine their microstructures and degree of SOM transformation at the microscopic level, and quantified the results using image analysis.
2. Materials and Methods
2.1. Study Areas, Soil Bedrock and Sampling
The studies were carried out in four areas located in southern Poland: (1) the Nida Basin, which is the main area where gypsum rock occurs in Poland. These deposits formed in the Miocene as a result of salt precipitating from warm seawater. In the Pleistocene, the Nida Basin was covered by the Cracow glaciation, which left behind mainly sand, clay and loess, which occur as admixtures to the gypsum parent materials in the soils of the region. The gypsum rock in the area usually forms gentle hills [20,22]; (2) the area around Bukowno, where the mining and processing of zinc-lead (Zn-Pb) ores have been performed since the 15th century, leaving heaps of tailings that have never been reclaimed in about 150 to 400 years; (3) close to Jaworzno, an area of recent Zn-Pb mining, the tailings heaps left behind composed of waste rock. The Zn-Pb ore deposits in the Bukowno and Jaworzno areas occur in Jurassic limestone and dolomite, with admixtures of Pleistocene sand; and (4) in the district of Krakow (Nowa Huta), where iron (Fe) processing has been going on for 50 years, leaving heaps of metallurgical slag on which soils with loess and sand admixtures have formed [23] (Figure 1).
All the waste materials were characterised by properties unfavourable to ecosystem development, such as sensitivity to erosion, poor water retention, nutrient deficiency and very high, or at least excessive, contents of trace metals. For these reasons, pedogenesis at these sites has been occurring very slowly and full recovery of the soils is taking a long time. In the Nida Basin area, the soils derived naturally from gypsum, while in the Bukowno, Jaworzno and Nowa Huta areas, the soils are self-restored mining/industrial soils. Both groups represent shallow soils in which the accumulation of SOM is the main soil-forming process, and all sites are fully covered with grasses belonging to the Molinio–Arrhenatheretea class.
Sampling was performed at four natural soil sites in the Nida Basin area (Gacki [Gac], Busko-Lagiewniki [Bus-L], Busko [Bus] and Chotelek [Chot]) and at four sites hosting post-mining/industrial soils (Jaworzno [Jaw], Bukowno-Warpie [Buk-W], Bukowno [Buk] and Nowa Huta [NH], (Figure 1). As noted above, the soils in the post-mining and industrial areas differed in age, with the Buk-W and Buk soils formed on very old heaps of about 400 and 150 years old, respectively, and referred to as old brownfield soils, while the Jaw and NH soils were formed on younger heaps, about 50 years old, referred to as brownfield soils. At each site, three sampling points were designated, totalling 24 sampling points. For the analyses, we collected disturbed and undisturbed samples from the top layers 0–15 cm deep.
2.2. Field Analyses
The macrostructure (i.e., the size, shape and resistance of the soil aggregates) was determined for each sample based on the Guidelines for Soil Description [24]. The colour of the soil was established using a Munsell chart [25]. Based on the soil colour, the values of the A-horizon development index (ADI) were calculated, according to Equation (1)
where v = Munsell value and C = Munsell chroma [26,27].
2.3. Laboratory Analysis of Disturbed Soils Samples
Air-dried soil samples were passed through a 2 mm–mesh sieve. On the fine soil particles, we determined the following. The texture was based on the Bouyoucos hydrometer–sieve method, classified in accordance with International Union of Soil Sciences Working Group World Reference Base [28] recommendations. The pH values were determined potentiometrically in a suspension of soil and deionised water at a ratio of 1:2.5 [29]. The total nitrogen (N) content was determined using the Kjeldahl method [29] on a FOSS Kjeltec TM 8100 apparatus. The CaCO3 content was determined by the CO2 volumetric method using a Scheibler apparatus [29]. The organic C content was determined after removal of the carbonates by hydrochloric acid (HCl), and dry combustion using a Vario MACROcube analyser equipped with a CO2 detector (Elementar Analysensysteme GmbH, Germany), with sulphanilic acid (C6H7NO3S) as the reference material, and with a detection limit of 0.001%. The SOM was calculated by multiplying the organic C content by the Van Bemmelen factor (equal to 1.724) [29]. The exchangeable Ca2+, magnesium (Mg2+), sodium (Na+) and potassium (K+) cations were extracted using 1 mol·dm−3 ammonium acetate (NH4OAc) [29]. The determined cation contents were summed and presented as the total content of basic cations (BCs). The concentrations of cadmium (Cd), Pb and Zn were measured after digestion of the soil in a mixture (1:3 v/v) of concentrated perchloric and nitric acids (HClO4 and HNO3, respectively), using the wet method in a closed microwave oven (Multiwave 3000, Anton Paar). The concentrations of the exchangeable cations (Ca2+, Mg2+, Na+ and K+) and the trace metals (Zn, Pb and Cd) were assessed using a PerkinElmer atomic emission spectrometer, an ICP-OES Optima 7300 DV and a multi-element ICP-IV Merck standard solution. The quality of the data was verified using internal standards and the certified reference material CRM023-050 – Trace Metals – Sandy Loam 7 (RT Corporation). The dehydrogenase activity (indicator of overall soil microbial activity) was established after incubating the samples for 24 h at 37ºC using a 2,3,5-triphenyltetrazolium chloride solution as the substrate. The intensity of the colouration was measured using a Shimadzu UV-1800 spectrophotometer (Kyoto, Japan) at 450 nm [30].
2.4. Laboratory Analysis of Undisturbed Soils Samples
Undisturbed aggregates were collected in order to establish the aggregate stability, which was determined via their water resistance using the sieve method. Air-dried aggregates were placed on a 0.25-mm sieve, which was slowly immersed in distilled water, and then mechanically raised for 3 min in the sieving apparatus (Eijkelkamp Agrisearch Equipment, Giesbeek, The Netherlands). The sieving process was repeated using a dispersing solution containing 2 g·dm−3 sodium hydroxide (NaOH) until total breakdown of the aggregates was achieved. The unstable (sieved in distilled water) and stable (sieved in dispersing solution) fractions were dried at 110 °C and then weighed. The water resistance index (WRI) was calculated using the formula
where MDS = weight of the soil obtained from the dispersing solution (stable fraction) and MH2O = weight of the soil obtained from the water (unstable fraction).
The dry soil bulk density (BD) was established by weighing it in 100-cm3 cylinders filled with soil with undisturbed structure [31]. The total porosity (TPor) was calculated from the BD, given the particle density (PD, data not shown), according to the formula:
For the micromorphological study, thin-sections were prepared from the undisturbed soil samples collected in Kubiena boxes. The samples were consolidated with Araldite® epoxy resin, cut into slices, the slices glued to a microscope slide, then thinned to 30 µm and polished. To obtain digital images suitable for the micromorphometric analysis of the images, all the thin-sections were scanned using a high-resolution Epson scanner. The files were converted to TIFF format and transferred to a computer. Areas of 3.5 x 5.0 cm were processed using the 2400 dpi option. The digital images were assessed using Aphelion software v.4.6.0 (ADCIS S.A. and AAI, Inc.). We selected the organic and inorganic parts in these images. The organic parts were then divided into well- and slightly decomposed or undecomposed organic substances. Pores and minerals were isolated from the inorganic parts. For the identification and quantification of selected objects, the Otsu method was used [32], which is based on minimising the inter-class variance. This fully automated method is especially useful for images with a bimodal distribution of pixel values, representing dark and bright objects. Detection of the non-decomposed organic substance and pores was performed using manual thresholding (Figure A1). All the image processing and measurements of the images were performed using Aphelion software.
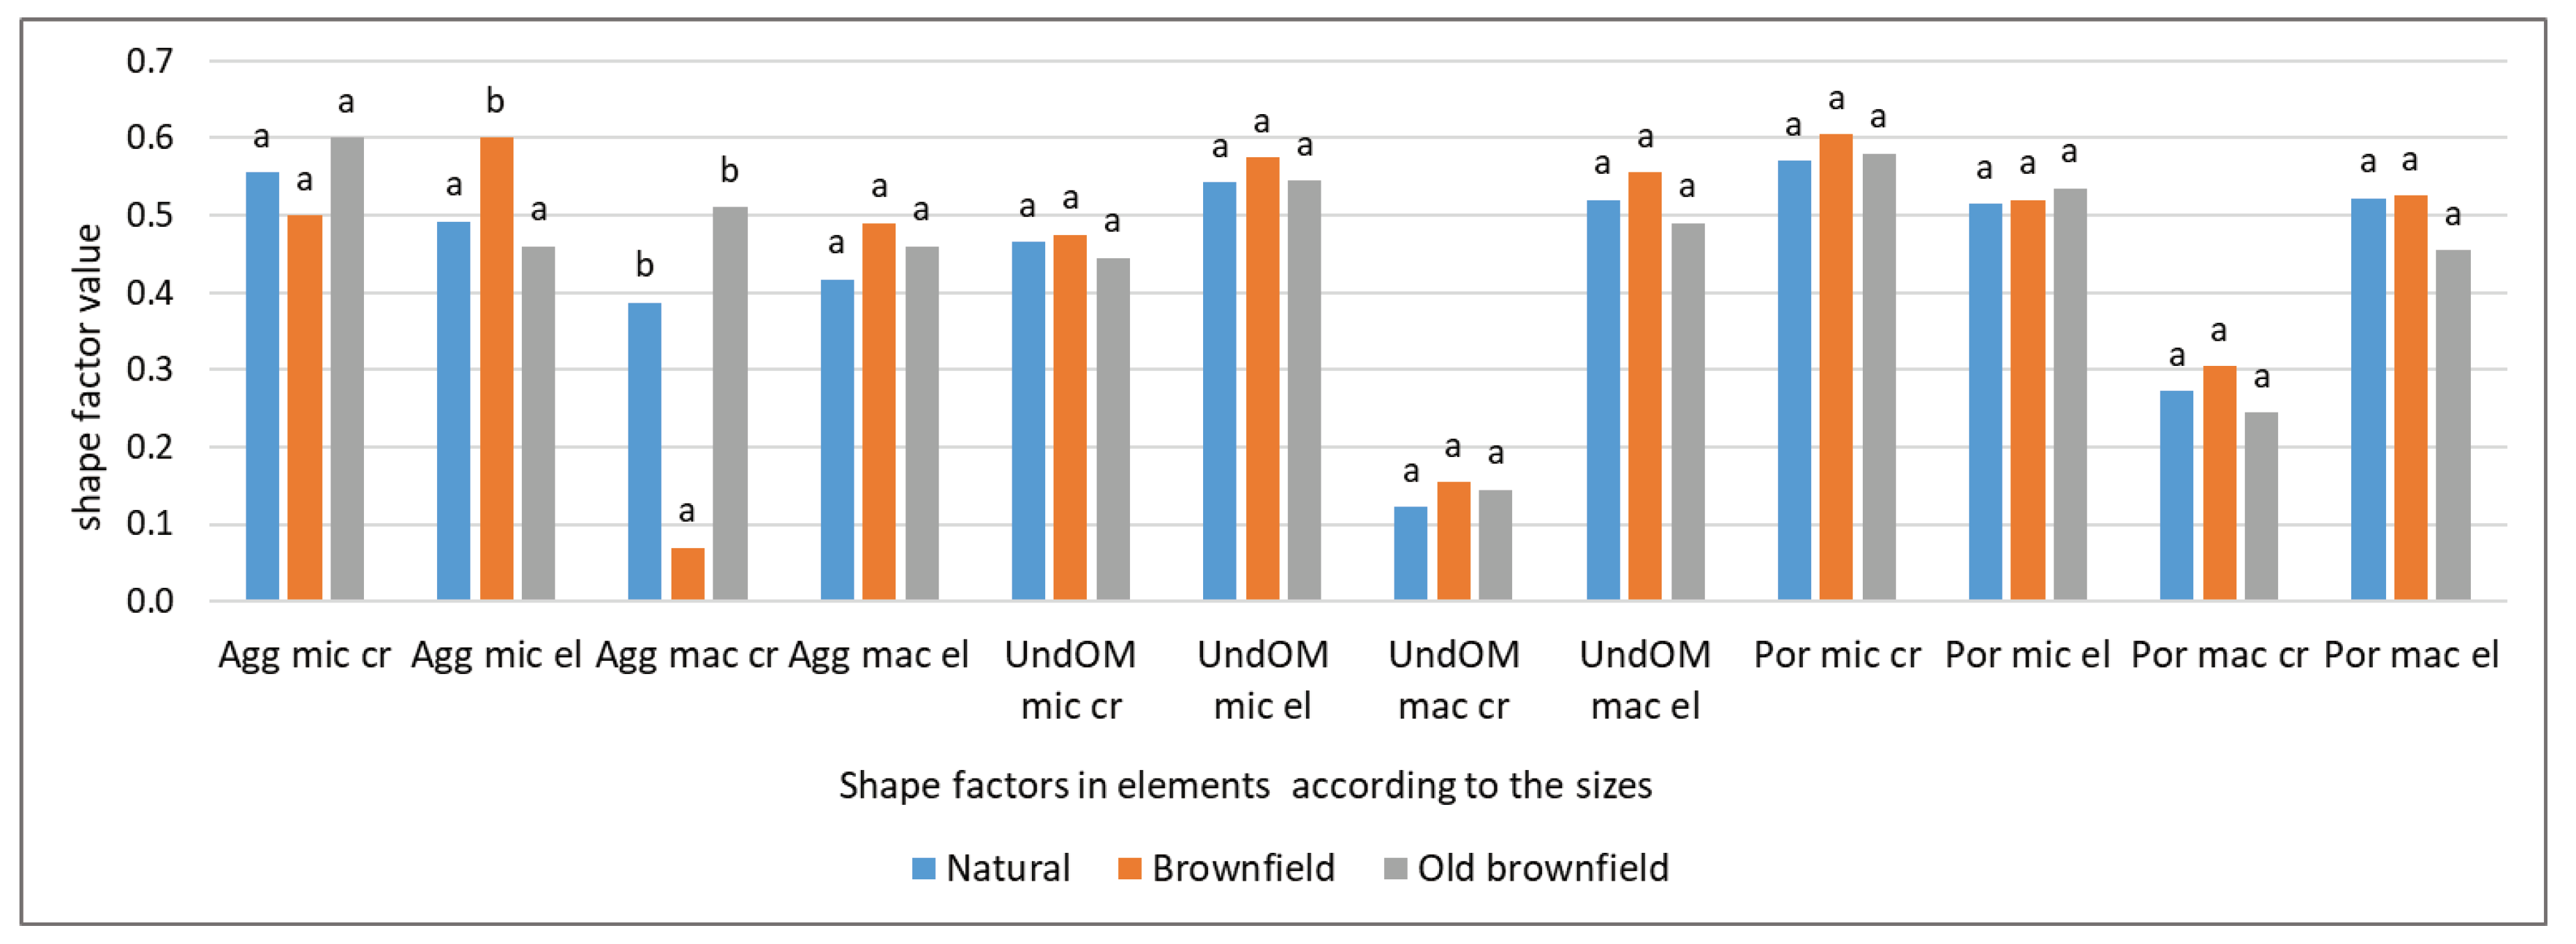
The slightly decomposed organic matter (OM) comprised recognisable tissue remains, but with evidence of decomposition caused by microfloral or microfaunal activity. The decomposed OM occurred mainly in the form of organic aggregates (also containing small mineral particles). The identifiable aggregates were divided into two classes based on the mean equivalent diameter (diameter of an equivalent circle having the same area)––microaggregates (Agg mic), with a diameter of 50–250 μm, and macroaggregates (Agg mac) >250 μm. The areas of slightly decomposed OM (UndOM) were similarly divided into “mic” and “mac” size ranges. The size and shape of selected porous areas (Por) were determined, with two pore size categories––the medium pores (<150 μm) referred to as Por mic and the coarse pores (>150 μm) as Por mac. The aggregate, UndOM and pore properties (area and percentage of the image surface) were determine, together with their shape factors––circularity and elongation. In the digital images, for circularity, a value of 1 represented a circle, with a trend towards 0 for long, thin objects or those very irregular edges. Elongation was the absolute value of the difference in moments of inertia in the main directions divided by the sum of these moments, with 0 representing a circle and 1 an elongated ellipse. The means of these properties were calculated for each size class and each sample.
Observations of the soil thin-sections were also performed using a Nikon Eclipse E400 POL microscope under plane-polarised light and cross-polarised light. The microscope observations focused on small features, such as textural pores, enchytraeid droppings and separate plant tissues that were barely or not visible in the scans. The micromorphological descriptions of the thin-sections were based on nomenclature adopted from Stoops [33].
2.5. Statistical Analyses
One-way analysis of variance (ANOVA) was used to study the differences in individual parameters between the soil properties. In order to estimate the least significant differences between the mean values of homogeneous groups, we applied the post hoc test by means of the Bonferroni correction (at p < 0.05). Standard deviation values were computed. Principal component analysis (PCA) was performed in order to demonstrate relationships among the variables (soil parameters) and the soils from different sites. To meet the requirements for an ANOVA (additivity, homogeneity of variance and normality of distribution), the data were subjected to logarithmic transformation prior to the PCA. Multiple linear regression analysis was used to describe the relationships between the SOM contents and the physicochemical and micromorphological properties of the soils. All calculations were performed using Statistica v.13.3 PL [34] and Canoco 5 [35] software.
3. Results
3.1. Physical Properties
All the soil groups (natural and mining/industrial) had similar textures (sandy loam, silt or silt loam), with the silt fraction dominating in most cases (Table 1).
In the natural gypsum soils, the macrostructures established in the field were moderate or strong, fine or medium granular, while in the mining/industrial soils, they were weak or moderate, blocky angular, crumbly or single-grained. The lower macrostructural grade in the mining/industrial soils was followed by lower WRI values than in the soils derived from gypsum. The soil groups differed in BD, which ranged from 0.87 to 1.2 in the natural soils, to higher in the brownfield soils (Jaw and NH), at 1.46–1.50, to much lower in the old brownfield soils (Buk-W and Buk), where it was about 0.55. The total porosity calculated for the gypsum soils was in the range 52–65%, while the brownfield soils had relatively low porosity (43–44%) and the old brownfield soils were more porous, at 78% (Table 1).
3.2. Chemical and Morphological Properties
All the soils had similar pH values (6.4–7.5) and CaCO3 contents (1.8–5.7%), but they differed in the sum of BCs, the values of which were higher in the natural soils. At Gac and Bus, the BC values were relatively very high, at 1205 and 2164 mmol+ kg–1, while in all the mining/industrial soils, the BC values were in the range 164.6–288.1 mmol+ kg–1 (Table 2).
In the old brownfield soils, the SOM contents were around 10%, generally similar or slightly lower than in the natural gypsum soils (7.7–16.8%), while in the brownfield soils (Jaw and NH), the SOM was the lowest, at 2.9 and 8.9%, respectively. The surface layers (0–15 cm) of the gypsum soils were characterised by much lower C/N ratios (7.6–9.4) than the analogous layers in the mining/industrial soils (15.8–27.6). The dehydrogenase activity (DHA) varied greatly, from 4.43 (Jaw) to 102.8 (Gac) mg TPF (1,3,5-triphenyl-formasane)/ kg–1 24 h–1, with the highest values being in the natural soils, followed by the old brownfield soils. The lowest DHA was determined at Jaw and NH (in the brownfield soils). However, in the oldest brownfield soil (Buk-W), the DHA value was similar to those obtained from Chot and Bus-L (Table 2). The old brownfield soils were heavily polluted with heavy metals in amounts exceeding 13,000 mg Zn kg–1, 5100 mg Pb kg–1 and 170 mg Cd kg–1 (Table 2), with the brownfield soils containing about 30 times less Zn, 50 times less Pb and more than 100 times less Cd than the old brownfield soils, while the amounts were much lower in the natural soils (Table 2). The surface layers of the natural gypsum soils were characterised by darker colours and a higher mean ADI value (5.6) than the old brownfield and brownfield soils ( 3.7 and 2.2, respectively) (Table 3).
3.3. Micromorphological Descriptions and Micromorphometric Calculations
The micromorphological characteristics of the top layers of the soils are provided in Table 1S. The natural gypsum soils were all very micromorphologically similar. Generally, these soils had a crumb microstructure, with highly porous macroaggregates containing organic microaggregates and abundant, thin, interconnected textural pores. The high porosity resulted from compound or complex packing voids. The aggregates were of animal origin. There were also visible, moderately decomposed root fragments. No charcoal or coal fragments were detected during microscopic observation.
The mining/industrial soils (both old brownfield and brownfield) had either a highly separated granular microstructure or a more massive vugy-type structure. The aggregates were non- to slightly porous, the porosity formed by structural pores (compound packing voids or vugs). The soils contained relatively high amounts of slightly to moderately decomposed root residues and some charcoal pieces (Table A1).
The mean shares of aggregated, decomposed OM (Agg), undecomposed OM (UndOM) and pores (Por) in each group of soils showed Figure 2.
None of the soils differed in the area taken up by Agg. The area occupied by UndOM was smaller in the natural soils than in the mining/industrial soils. The brownfield soils were characterised by lower Por than the natural and old brownfield soils. The percentage shares of all three parameters (Agg, UndOM and Por) were analysed in two size classes––mic and mac–– as shown in Figure 3, including microaggregates (Agg mic), macroaggregates (Agg mac), fine pieces of UndOM (UndOM mic), coarse pieces of UndOM (UndOM mac), medium-sized pores (Por mic) and coarse pores (Por mac). The lowest shares of Agg mic and UndOM mic occurred in the brownfield soils, therefore these soils had the highest shares of Agg mac and UndOM mac. All the OM parameters, independent of size or degree of decomposition, had similar shares in the natural and in old brownfield soils, but were different in the brownfield soils. The shares of Por mic and Por mac did not differ among the soils.
In Figure A2, the areas occupied by Agg mic and mac, UndOM mic and mac and Por mic and mac in the three groups of soils are classed based on the shape factors, circularity and elongation. Generally, the mean shape factor values did not differ among the groups of soils, although in the brownfield soils, Agg mic had higher values and Agg mac lower values than the other soils.
4. Discussion
4.1. Factors Affecting SOM Storage
Generally, it is thought that the sequestration of C by soils is achieved through SOM stabilisation, which involves its physical incorporation in aggregates, its location in small pores, its association with clay particles and/or its biochemical recalcitrance. Among these, the organisation of soil aggregate structure is considered a major factor in controlling SOM [6,36]. In order to determine the significant variables affecting the SOM content in our soils, a multiple regression equation was derived. A method of stepwise forward regression was applied based on 24 observations. In the equation, the relationship between the SOM content and the examined soil parameters, including the content of sand, silt, clay and CaCO3, the pH, BD, WRI and TPor values, areas of Por mic and mac, Agg mic and mac, UndOM mic and mac, and the Zn, Pb and Cd concentrations, were considered. The equation has the following form, with the p-values of the individual elements given in brackets:
SOM=14.623 – 3.155CaCO3 + 0.065DHA + 8.55Por mac + 8.27Por mic + 0.029Agg mic
(0.000) (0.007) (0.011) (0.015) (0.015) (0.024)
R2adj.=0.989, p<0.000
Our multiple linear regression analysis revealed close relationships between SOM content and CaCO3 content. Although carbonates are well known for stabilising soil structures by creating permanent bonds between the soil particles [16,18], which should promote SOM storage, rather unexpectedly, we found a negative relationship between the SOM and carbonate. This might be explained by relatively high amounts of the CaCO3 being of anthropogenic origin (used as an additive in Fe smelting or coming from the technological processes involved in Zn-Pb ore flotation) in all the mining/industrial soils (Buk-W, Buk, NH and Jaw), and thus not having the same effect on the SOM as natural carbonates would. Similarly, Fernández-Ugalde et al. [37] observed that carbonates, when not naturally present, do not promote aggregate stabilisation as strongly as those in naturally carbonated soils. There have also been other reports that the presence of CaCO3 is not always an important factor in aggregate formation and SOM stabilisation, with a lack of positive correlation between these two parameters having been noted [18,36]. The second most important parameter affecting the SOM content was DHA, which reflects the activity of the living cells of microorganisms and emphasises the well-known role of microbes in SOM transformation. Pores of both sizes had a positive effect on SOM storage. This is not surprising because the surface horizons are where the majority of the biological activity takes place, and pore space is mainly formed by root penetration and animal activity [6]. Coarse pores are often infilled with faunal droppings composed of organic substances [17], whereas fine pores contain the appropriate amounts of available water and oxygen needed to optimise the processes of SOM transformation [1]. So, since pore space and pore distribution control the availability of liquids, air and biological activity, they exert a general control over SOM decomposition and mineralisation. The last component in the equation was Agg mic, which proved that microaggregates play a decisive role in the long-term stabilisation of SOM by incorporating the SOM within their structures [1,6].
4.2. Drivers of Natural and Mining/Industrial Soil Formation
The PCA results (Figure 4) indicated that the first component, explaining 77.9% of the variance, was described by the pollutants Zn, Pb and Cd. The highest amounts of these trace metals occurred in the old brownfield soils at Buk-W and Buk, along with the highest pH values and silt contents (both latter parameters being of low importance). The lowest contents of trace metals, at natural levels, occurred in the gypsum soils (Gac, Bus-L, Bus and Chot), while the brownfield Jaw and NH soils were slightly polluted. The second component, which explained 10.4% of the variance, indicated the structure and properties of the surface layers connected with the SOM decomposition state, stability and physical properties of the surface horizons. According to this component, the natural gypsum soils, especially at Bus and Chot, were characterised by high SOM contents and high ADI and WRI values, with all these being strongly related. A strong positive correlation between SOM and the ADI had also been emphasised by Mazurek et al. [26] in urban soils, who evaluated SOM stabilisation based on the ADI. The SOM stability in the gypsum soils also resulted from the occurrence of decomposed, amorphous OM, mainly in the form of Agg mic. This is considered more stable than Agg mac OM because Agg mic is formed by fresh SOM decomposition, which produces polysaccharides and other organic binding compounds, whereas the less stable Agg mac provides minimum physical protection because the bonds in Agg mac are not persistent [18]. Stability of the SOM can also be indicated by a high WRI value, indicating the aggregate’s ability to withstand being broken down into smaller fragments when moistened. Stable soil aggregates counteract land degradation threats, and favour the maintenance of adequate water storage and aeration [38]. The oldest brownfield soil (Buk-W) had this factor, with the SOM content and properties and macro- and microstructure being similar to those in the gypsum soils. In the Buk-W and (to a lesser degree) Buk soils, we recorded the occurrence of both organs and decomposed, aggregated OM. According to Falsone et al. [1], this combination of slightly and fully decomposed SOM in the same sample suggests that the latter could be the end-product of the SOM transformation process, making it more stable than the initial organic form. In addition, the slightly decomposed OM occurred as small particles, indicating a high level of faunal activity in the soil. This fauna, including earthworms and mesofauna (beetle larvae or pot worms), feed on fresh organic residues, grinding them into pieces [21]. The transformation of plant residues was also aided by microorganisms, as indicated by the high DHA activity in the natural and Buk-W soils.
The second axis was also described by high BC values in the gypsum soils, caused by the Ca2+ cations originating from the gypsum parent material. On the opposite side, the Jaw and NH brownfield soils contained large amounts of organic residues and had high C/N ratios, with the decomposed OM forming large, less stable, aggregates. The high C/N ratios signify a greater accumulation of non- or partly transformed organic compounds in these soils compared to the other soils. Even where the amounts of SOM accumulated were similar (at Jaw) to the other soils, and the samples were collected under similar vegetation cover, a high BD resulted in a massive microstructure and low porosity. In compacted soils, root growth and the movement of organisms gradually decreases. Root growth is commonly restricted beyond BD values of 1.5 to 1.8 g cm–3 [39]. This, together with a high clay content, can reduce the amount of air in the soil, which decreases the biological activity. As was noted, a CaCO3 content did not compensate for the reduced biological activity in these soils.
4.3. Share of Aggregation and Pore Structure in SOM Storage: Effect of Excessive amounts of Zn, Pb and Cd in the Mining/Industrial Soils
The mining/industrial soils had a long story of contamination with trace metals (Zn, Pb and Cd) and their ages were between around 50 and 400 years, counting from the cessation of any perturbation. After such a long time, self-restoration has finished and such soils can be viewed as stable, with their maximum potential for SOM storage reached [40]. As described above, among the properties studied, pore structure substantially influenced the SOM storage. From the scanned thin-sections, the pores were seen to be structural, consisting of biopores, vugs, packing voids and cracks [33]. For this reason, they often reflect the effects of the soil biota [41], determining the physical suitability of the space for microbial colonisation and moderating predation by the mesofauna. Our study revealed significant differences in the abundances of the pores (both the TPor and Por of the image area), which showed two extreme values in the mining/industrial soils, the lowest in the brownfield and the highest in the old brownfield soils. The TPor was strongly related with the area of large pores (Por mac), prevailing over areas of pores <150 µm in diameter in all soils. Also, in all the soils, the smaller pores were round and narrow, while the larger pores were relatively elongated or had irregular shapes. Rasa et al. [42] described abundant macroporosity and a greater proportion of elongated pores as suitable conditions for root development and air/water retention. This could explain the full cover of all the studied soils (even the most polluted ones) by grass communities, which was also a reason for the high SOM storage. Aggregate stability and their resistance to physical stresses are key factors in storing C through the physical protection of organic substances [16]. No significant differences were found between areas of aggregates and undecomposed OM between the natural and mining/industrial soils, independent of their age. All these characteristics showed that long-term self-restoration led to the pedogenesis of the mining/industrial soils through the formation of proper pedogenic structures. However, in contrast to the remaining soils, in the brownfield soils at Jaw and NH, macroaggregates prevailed and larger areas were occupied by undecomposed OM and large pieces of plant organ residues. This means that the SOM in these soils is characterised by the lowest stability because, as mentioned above, macroaggregates are supposed to be more susceptible to rapid decomposition than microaggregates, and the occurrence of large fragments of plant organs is the result of low microbial and faunal activity [4].
Thus, our hypothesis that the excessive amounts of Zn, Pb and Cd would negatively affect SOM transformation and stability was partly confirmed. These pollutants decreased the biological activity (microbiological and faunal) and the stability of the aggregates, as especially notable in the brownfield Jaw and NH soils, while the structure, porosity and SOM forms and storage in the oldest brownfield soils were similar to those of the natural soils, despite the very high pollution. However, it should be noted that the negative effect of the excessive amounts of trace metals (Zn, Pb and Cd) in the mining/industrial soils was strongly diminished by the neutral soil reaction. Under high pH values, soluble forms of metals that are toxic to living organisms are largely transformed into biologically inactive forms, thus strongly reducing their bioavailability [13,43].
Nevertheless, our results clearly demonstrate that large amounts of SOM were stored in the mining/industrial soils, making them an important C sink that can be counted with natural soils as mitigating the effects of global climate warming. The results of this study hold true for the given pH, bedrock and climatic conditions, but further studies will be required on other soils and under different conditions.
Author Contributions
Conceptualization, M.C. and K.C.; methodology, M.C. and K.C.; software, L.W.; validation, M.C., K.C. and L.W.; investigation, M.C.; data curation, M.C.; writing—original draft preparation, M.C.; writing—review and editing, K.C.; funding acquisition, M.C. All authors have read and agreed to the published version of the manuscript.
Funding
This research was partly funded by Kimpa Vita University, Angola,.
Institutional Review Board Statement
Not applicable.
Informed Consent Statement
Not applicable.
Data Availability Statement
Data available on request.
Conflicts of Interest
The authors declare no conflicts of interest.
Appendix A
Figure A1.
Transformation of scanned images: original image (A), segmented pores (B), segmented organic matter (C), segmented undecomposed (plant residues) or slightly decomposed organic matter (D) on example of top layer of heavily polluted soil (Buk).
Figure A1.
Transformation of scanned images: original image (A), segmented pores (B), segmented organic matter (C), segmented undecomposed (plant residues) or slightly decomposed organic matter (D) on example of top layer of heavily polluted soil (Buk).
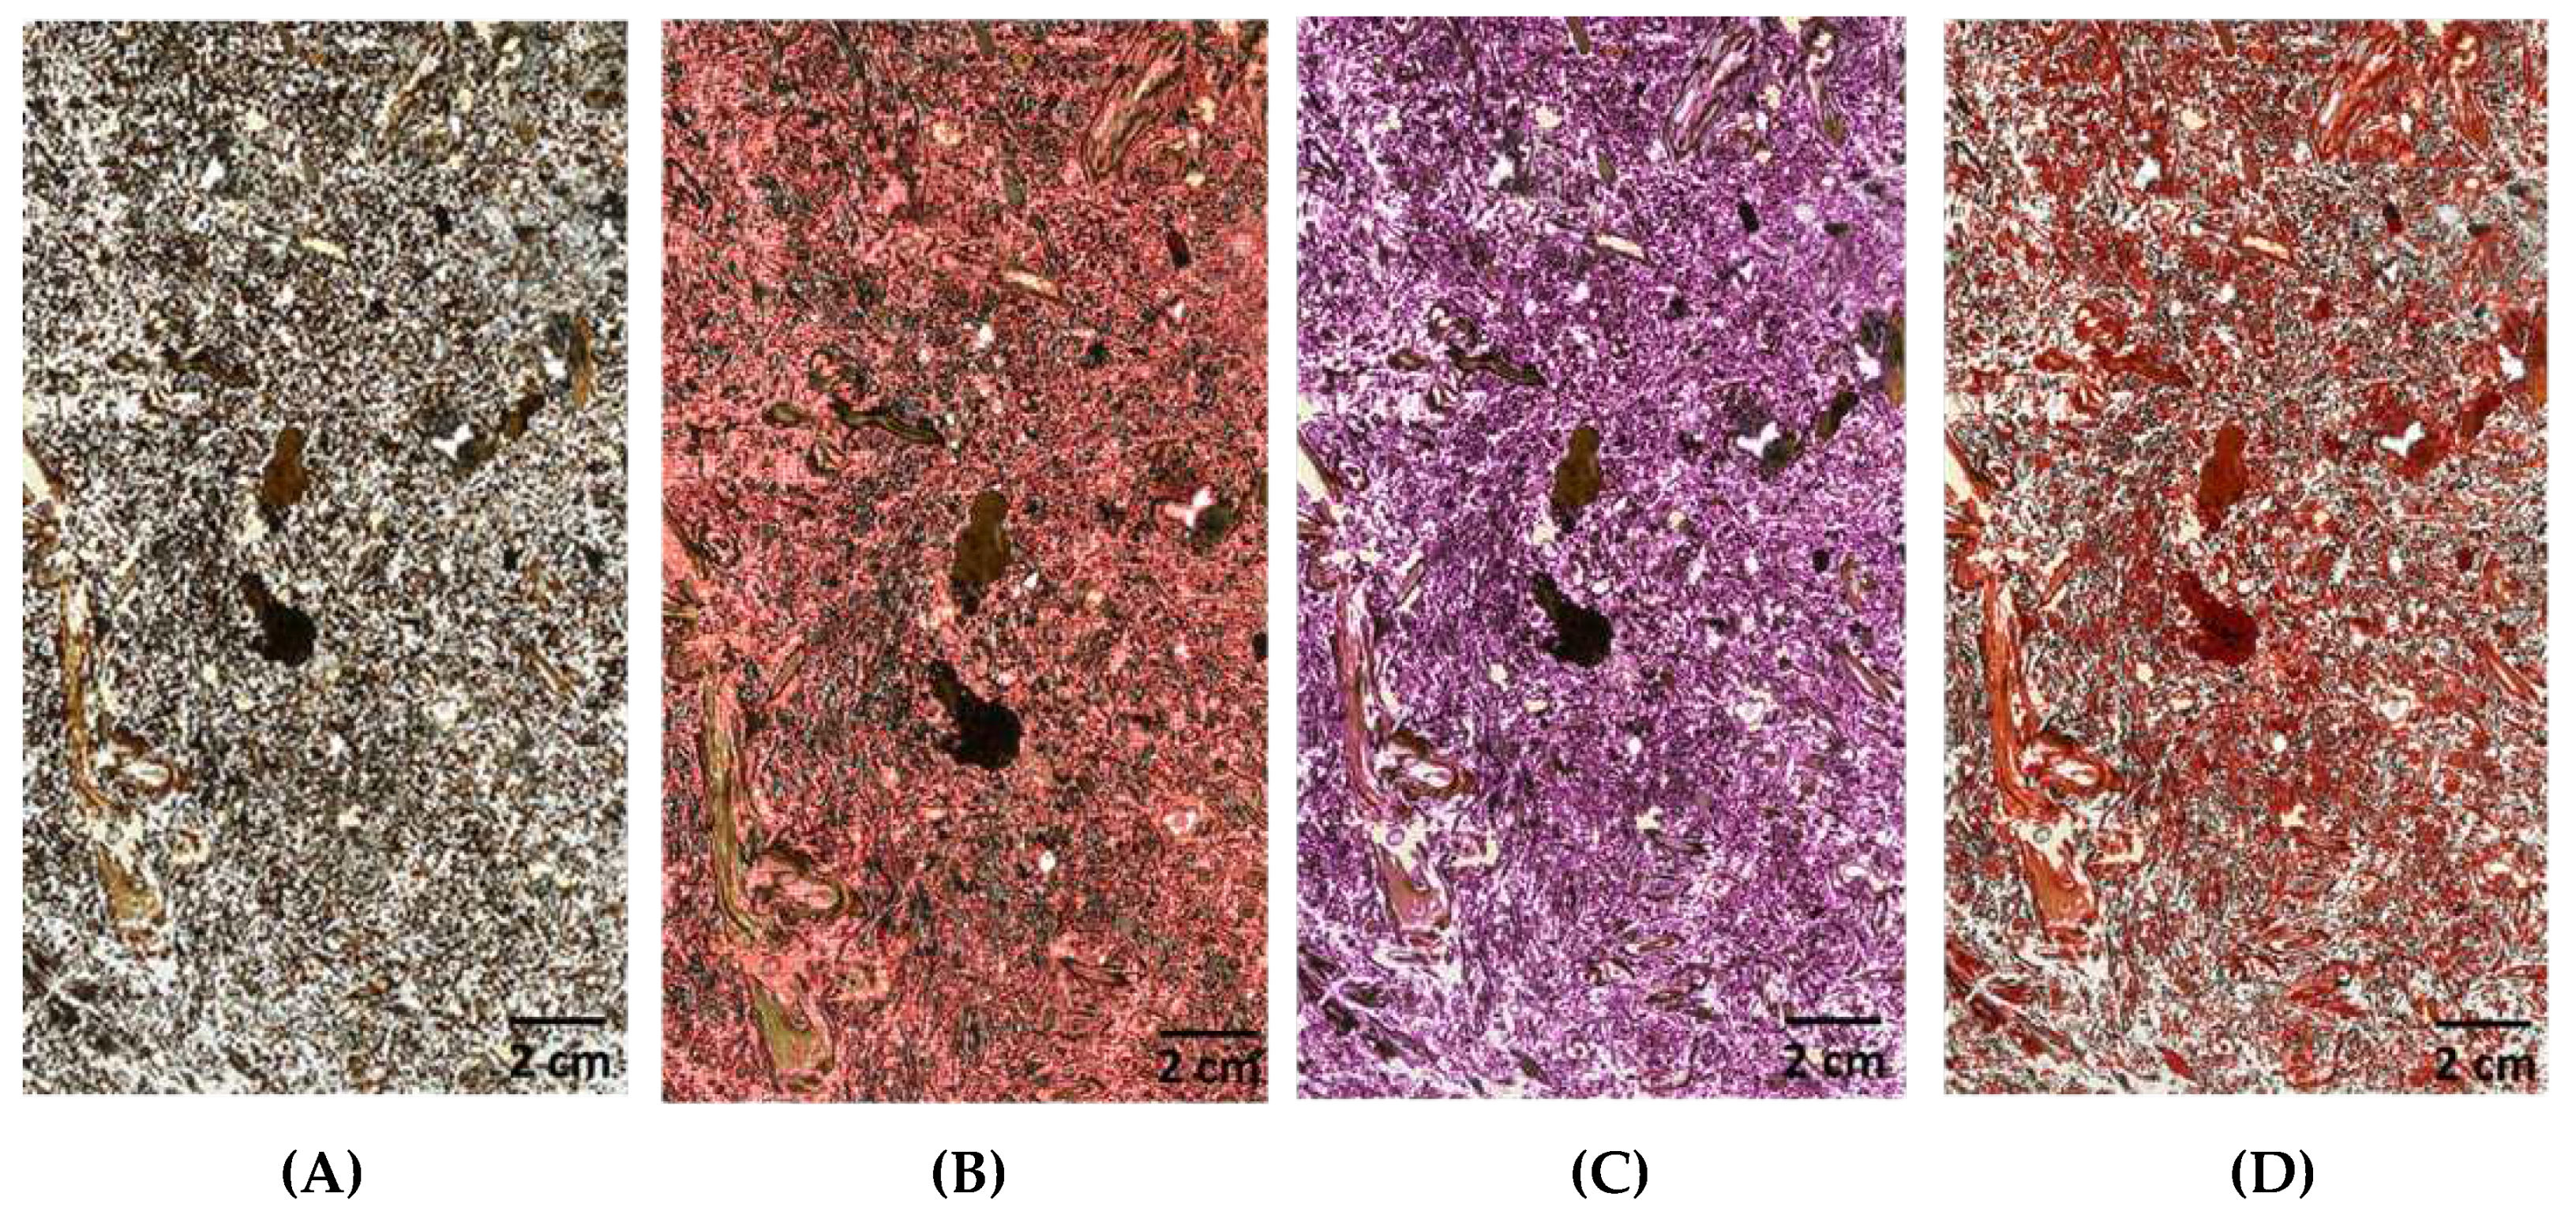

Table A1.
Micromorphological characteristics.
| Soil | c/f related distribution | Coarse material | Microstructure | Pores | Other observations |
|---|---|---|---|---|---|
| Natural soils | |||||
| Gac, Chot |
double spaced enaulic |
grains of quartz and gypsum, some calcite |
crumb microstructure with porous, sub-rounded and highly separated macroaggregates containing micro-aggregates (composed of amorphous organic material of animal origin and phlobaphene containing tissues) |
compound packing voids abundant thin, interconnected textural pores |
fauna droppings of about 400 µm composed of small aggregates of 25-50 µm |
| Bus Bus-L |
double spaced enaulic | grains of quartz and gypsum some calcite |
crumb microstructure with porous spheroidal and highly separated aggregates within macroaggregates micro-aggregates composed of amorphous organic material of animal origin |
complex packing voids abundant thin, interconnected textural pores |
fauna droppings (c. 400 µm) composed of small aggregates of 25-50 µm, medium decomposed organ residues (roots) |
| Old brownfield soils | |||||
| Buk-W Buk |
open porphyric | grains of quartz and a few grains of calcite |
highly separated granular, small slightly porous aggregates (c. 100-200 µm) |
compound packing voids few textural pores |
abundant organ residues (roots) yellowish to reddish (slightly decomposed)charcoal pieces, fauna droppings |
| Brownfield soils | |||||
| Jaw | open porphyric | grains of quartz |
highly separated granular, small and non-porous aggregates (c. 100-200 µm) |
compound packing voids few textural pores |
few organ residues, more tissue residues |
| NH | chitonic | abundant grains of quartz and some calcite grains |
vughy some small non-porous aggregates (c. 100-200 µm) |
numerous vughs |
abundant, yellowish to reddish organ residues (roots), some fine amorphous organic, material |
Figure A2.
Areas of aggregates (Agg), plant residues (UndOM) and pores (Por) of two size classes (mic and mac: described under Figure 3) divided according to their shapes: cr - circularity, el – elongation. Different letters show significant differences at p<0.05.
Figure A2.
Areas of aggregates (Agg), plant residues (UndOM) and pores (Por) of two size classes (mic and mac: described under Figure 3) divided according to their shapes: cr - circularity, el – elongation. Different letters show significant differences at p<0.05.
References
- Falsone, G.; Wilson, C.A.; Cloy, J.M.; Graham, M.C.; Bonifacio, E. Relating Microfeatures of Soil Organic Matter to C Stabilisation: Optical Microscopy, SEM-EDS, Abiotic Oxidation. Biol Fertil Soils 2014, 50, 623–632. [Google Scholar] [CrossRef]
- Laudicina, V.A.; Dazzi, C.; Delgado, A.; Barros, H.; Scalenghe, R. Relief and Calcium from Gypsum as Key Factors for Net Inorganic Carbon Accumulation in Soils of a Semiarid Mediterranean Environment. Geoderma 2021, 398, 115115. [Google Scholar] [CrossRef]
- Čížková, B.; Woś, B.; Pietrzykowski, M.; Frouz, J. Development of Soil Chemical and Microbial Properties in Reclaimed and Unreclaimed Grasslands in Heaps after Opencast Lignite Mining. Ecological Engineering 2018, 123, 103–111. [Google Scholar] [CrossRef]
- Poch, R.M.; Virto, I. Micromorphology Techniques for Soil Organic Carbon Studies. In Soil Carbon; 2014; pp. 17–27. [Google Scholar]
- Lützow, M.V.; Kögel-Knabner, I.; Ekschmitt, K.; Matzner, E.; Guggenberger, G.; Marschner, B.; Flessa, H. Stabilization of Organic Matter in Temperate Soils: Mechanisms and Their Relevance under Different Soil Conditions—A Review. European J Soil Science 2006, 57, 426–445. [Google Scholar] [CrossRef]
- Rabot, E.; Wiesmeier, M.; Schlüter, S.; Vogel, H.-J. Soil Structure as an Indicator of Soil Functions: A Review. Geoderma 2018, 314, 122–137. [Google Scholar] [CrossRef]
- Aznar, J.M.; Badía Villas, D.; Poch, R.M. Soil Catena along Gypseous Woodland in the Middle Ebro Basin: Soil Properties and Micromorphology Relationships. Span. J. Soil Sci. 2014, 2, 173. [Google Scholar] [CrossRef]
- VandenBygaart, A.J.; Fox, C.A.; Fallow, D.J.; Protz, R. Estimating Earthworm-Influenced Soil Structure by Morphometric Image Analysis. Soil Science Soc of Amer J 2000, 64, 982–988. [Google Scholar] [CrossRef]
- Aydemir, S.; Keskin, S.; Drees, L.R. Quantification of Soil Features Using Digital Image Processing (DIP) Techniques. Geoderma 2004, 119, 1–8. [Google Scholar] [CrossRef]
- Zaiets, O.; Poch, R.M. Micromorphology of Organic Matter and Humus in Mediterranean Mountain Soils. Geoderma 2016, 272, 83–92. [Google Scholar] [CrossRef]
- Singh, J.P.; Vaidya, B.P.; Goodey, N.M.; Krumins, J.A. Soil Microbial Response to Metal Contamination in a Vegetated and Urban Brownfield. Journal of Environmental Management 2019, 244, 313–319. [Google Scholar] [CrossRef]
- Zhong, X.; Chen, Z.; Li, Y.; Ding, K.; Liu, W.; Liu, Y.; Yuan, Y.; Zhang, M.; Baker, A.J.M.; Yang, W.; et al. Factors Influencing Heavy Metal Availability and Risk Assessment of Soils at Typical Metal Mines in Eastern China. Journal of Hazardous Materials 2020, 400, 123289. [Google Scholar] [CrossRef] [PubMed]
- Bosch-Serra, A.D.; Cruz, J.; Poch, R.M. Soil Quality in Rehabilitated Coal Mining Areas. Applied Sciences 2023, 13, 9592. [Google Scholar] [CrossRef]
- Świątek, B.; Woś, B.; Chodak, M.; Maiti, S.K.; Józefowska, A.; Pietrzykowski, M. Fine Root Biomass and the Associated C and Nutrient Pool under the Alder (Alnus Spp.) Plantings on Reclaimed Technosols. Geoderma 2019, 337, 1021–1027. [Google Scholar] [CrossRef]
- Slukovskaya, M.V.; Vasenev, V.I.; Ivashchenko, K.V.; Morev, D.V.; Drogobuzhskaya, S.V.; Ivanova, L.A.; Kremenetskaya, I.P. Technosols on Mining Wastes in the Subarctic: Efficiency of Remediation under Cu-Ni Atmospheric Pollution. International Soil and Water Conservation Research 2019, 7, 297–307. [Google Scholar] [CrossRef]
- Abiven, S.; Menasseri, S.; Chenu, C. The Effects of Organic Inputs over Time on Soil Aggregate Stability – A Literature Analysis. Soil Biology and Biochemistry 2009, 41, 1–12. [Google Scholar] [CrossRef]
- Blazejewski, G.A.; Stolt, M.H.; Gold, A.J.; Groffman, P.M. Macro- and Micromorphology of Subsurface Carbon in Riparian Zone Soils. Soil Science Soc of Amer J 2005, 69, 1320–1329. [Google Scholar] [CrossRef]
- Virto, I.; Barré, P.; Enrique, A.; Poch, R.M.; Fernández-Ugalde, O.; Imaz, M.J.; Bescansa, P. Micromorphological Analysis on the Influence of the Soil Mineral Composition on Short-Term Aggregation in Semi-Arid Mediterranean Soils. Span. J. Soil Sci. 2014, 3, 179. [Google Scholar] [CrossRef]
- Poch, R.M.; de Coster, W.; Stoops, G. Geoderma. Pore space characteristics as indicators of soil behaviour in gypsiferous soils 1998, 87, 87–109. [Google Scholar]
- De Carvalho, M.; Ciarkowska, K.; Miechówka, A. Storage of Persistent Organic Matter in Temperate Gypsum Soils –Relevance of the Parent Material and Vegetation Cover. Geoderma 2023, 435, 116522. [Google Scholar] [CrossRef]
- Ciarkowska, K.; Niemyska-Łukaszuk, J. Microstructure of Humus Horizons of Gypsic Soils from the Niecka Nidziańska Area (South Poland). Geoderma 2002, 106, 319–329. [Google Scholar] [CrossRef]
- Urban, J.; Chwalik-Borowiec, A.; Kasza, A. Biuletyn Państwowego Instytutu Geologicznego. The development and age of the karst in gypsum deposits of the Nicka Solecka (Solec Basin) area 2015, 462, 125–152. [Google Scholar]
- Ciarkowska, K.; De Carvalho, M.; Gambus, F. Analysis of Polycyclic Aromatic Hydrocarbons (PAHs) Sources and Vertical Distribution in Soils of the Age-Diverse Brownfields of Southern Poland Using Positive Matrix Factorisation and Data Mining Model. Sustainability 2022, 14, 13796. [Google Scholar] [CrossRef]
- Jahn, R.; Blume, H.P.; Asio, V.; Spaargaren, O.; Schad, P. Guidelines for Soil Description, 4th ed.; FAO: Rome, Italy, 2006. [Google Scholar]
- Oyama, M.; Takehara, H. Revised Standard Soil Color Charts; Research Council for Agriculture, Forestry and Fisheries: Japan, 1970. [Google Scholar]
- Mazurek, R.; Kowalska, J.; Gąsiorek, M.; Setlak, M. Micromorphological and Physico-Chemical Analyses of Cultural Layers in the Urban Soil of a Medieval City — A Case Study from Krakow, Poland. CATENA 2016, 141, 73–84. [Google Scholar] [CrossRef]
- Sokołowska, J.; Józefowska, A.; Zaleski, T. Humus Horizon Development during Natural Forest Succession Process in the Polish Carpathians. J. Mt. Sci. 2022, 19, 647–661. [Google Scholar] [CrossRef]
- IUSS Working Group World Reference Base for Soil Resources. International Soil Classification System for Naming Soils and Creating Legends for Soil Maps; 4th-th ed.; International Union of Soil Sciences: Vienna, Austria, 2022. [Google Scholar]
- Tan, K.T. Soil Sampling, Preparation and Analysis; Taylor & Francis Group: Boca Raton, USA, 2005. [Google Scholar]
- Cassida, L.E.; Klein, D.A.; Santoro, T. Soil Science. Soil dehydrogenase activity 1964, 98, 371–376. [Google Scholar]
- Blake, G.R.; Hartge, K.H. Particle Density. In Methods of Soil Analysis, Part 1: Physical and Mineralogical Methods; American Society of Agronomy: Madison, WI, USA, 1986; Volume 9, pp. 377–382. [Google Scholar]
- Otsu, N. A Threshold Selection Method from Gray-Level Histograms. IEEE Trans. Syst., Man, Cybern. 1979, 9, 62–66. [Google Scholar] [CrossRef]
- Stoops, G. Guidelines for Analysis and Description of Soil and Regolith Thin Section; Soil Sci. Soc. Am. Inc.: Madison, Wisconsin, USA, 2003. [Google Scholar]
- StatSoft Inc. Statistica (Data Analysis Software System). 2019. [Google Scholar]
- ter Braak, C.J.F.; Smilauer, P. Canoco Reference Manual and User’s Guide: Software for Ordination, version 5.1; 2012. [Google Scholar]
- Gupta, V.V.S.R.; Germida, J.J. Soil Aggregation: Influence on Microbial Biomass and Implications for Biological Processes. Soil Biology and Biochemistry 2015, 80, A3–A9. [Google Scholar] [CrossRef]
- Fernández-Ugalde, O.; Virto, I.; Barré, P.; Gartzia-Bengoetxea, N.; Enrique, A.; Imaz, M.J.; Bescansa, P. Effect of Carbonates on the Hierarchical Model of Aggregation in Calcareous Semi-Arid Mediterranean Soils. Geoderma 2011, 164, 203–214. [Google Scholar] [CrossRef]
- Bieganowski, A.; Zaleski, T.; Kajdas, B.; Sochan, A.; Józefowska, A.; Beczek, M.; Lipiec, J.; Turski, M.; Ryżak, M. An Improved Method for Determination of Aggregate Stability Using Laser Diffraction. Land Degrad Dev 2018, 29, 1376–1384. [Google Scholar] [CrossRef]
- Alvarez, M.F.; Poch, R.M.; Osterrieth, M. Bioporosity in Thin Sections of Luvic Phaeozems of Southeast of Buenos Aires, Argentina, and Its Possible Role as an Indicator of Soil Quality. An Micromorphological Approach. Eurasian Soil Sc. 2021, 54, 918–926. [Google Scholar] [CrossRef]
- Ciarkowska, K.; Gargiulo, L.; Mele, G. Natural Restoration of Soils on Mine Heaps with Similar Technogenic Parent Material: A Case Study of Long-Term Soil Evolution in Silesian-Krakow Upland Poland. Geoderma 2016, 261, 141–150. [Google Scholar] [CrossRef]
- Johannes, A.; Weisskopf, P.; Schulin, R.; Boivin, P. Soil Structure Quality Indicators and Their Limit Values. Ecological Indicators 2019, 104, 686–694. [Google Scholar] [CrossRef]
- Rasa, K.; Eickhorst, T.; Tippkötter, R.; Yli-Halla, M. Structure and Pore System in Differently Managed Clayey Surface Soil as Described by Micromorphology and Image Analysis. Geoderma 2012, 173–174, 10–18. [Google Scholar] [CrossRef]
- Ciarkowska, K.; Sołek-Podwika, K.; Wieczorek, J. Enzyme Activity as an Indicator of Soil-Rehabilitation Processes at a Zinc and Lead Ore Mining and Processing Area. Journal of Environmental Management 2014, 132, 250–256. [Google Scholar] [CrossRef] [PubMed]
Figure 1.
Map of study area, gypsum soils (Gacki-Gac, Busko-Bus, Busko-Lagiewniki - Bus-L, and Chotelek-Chot) and mining/industrial soils (Nowa Huta - NH, Jaworzno -Jaw, Bukowno-Warpie- Buk-W and Bukowno-Buk).
Figure 1.
Map of study area, gypsum soils (Gacki-Gac, Busko-Bus, Busko-Lagiewniki - Bus-L, and Chotelek-Chot) and mining/industrial soils (Nowa Huta - NH, Jaworzno -Jaw, Bukowno-Warpie- Buk-W and Bukowno-Buk).
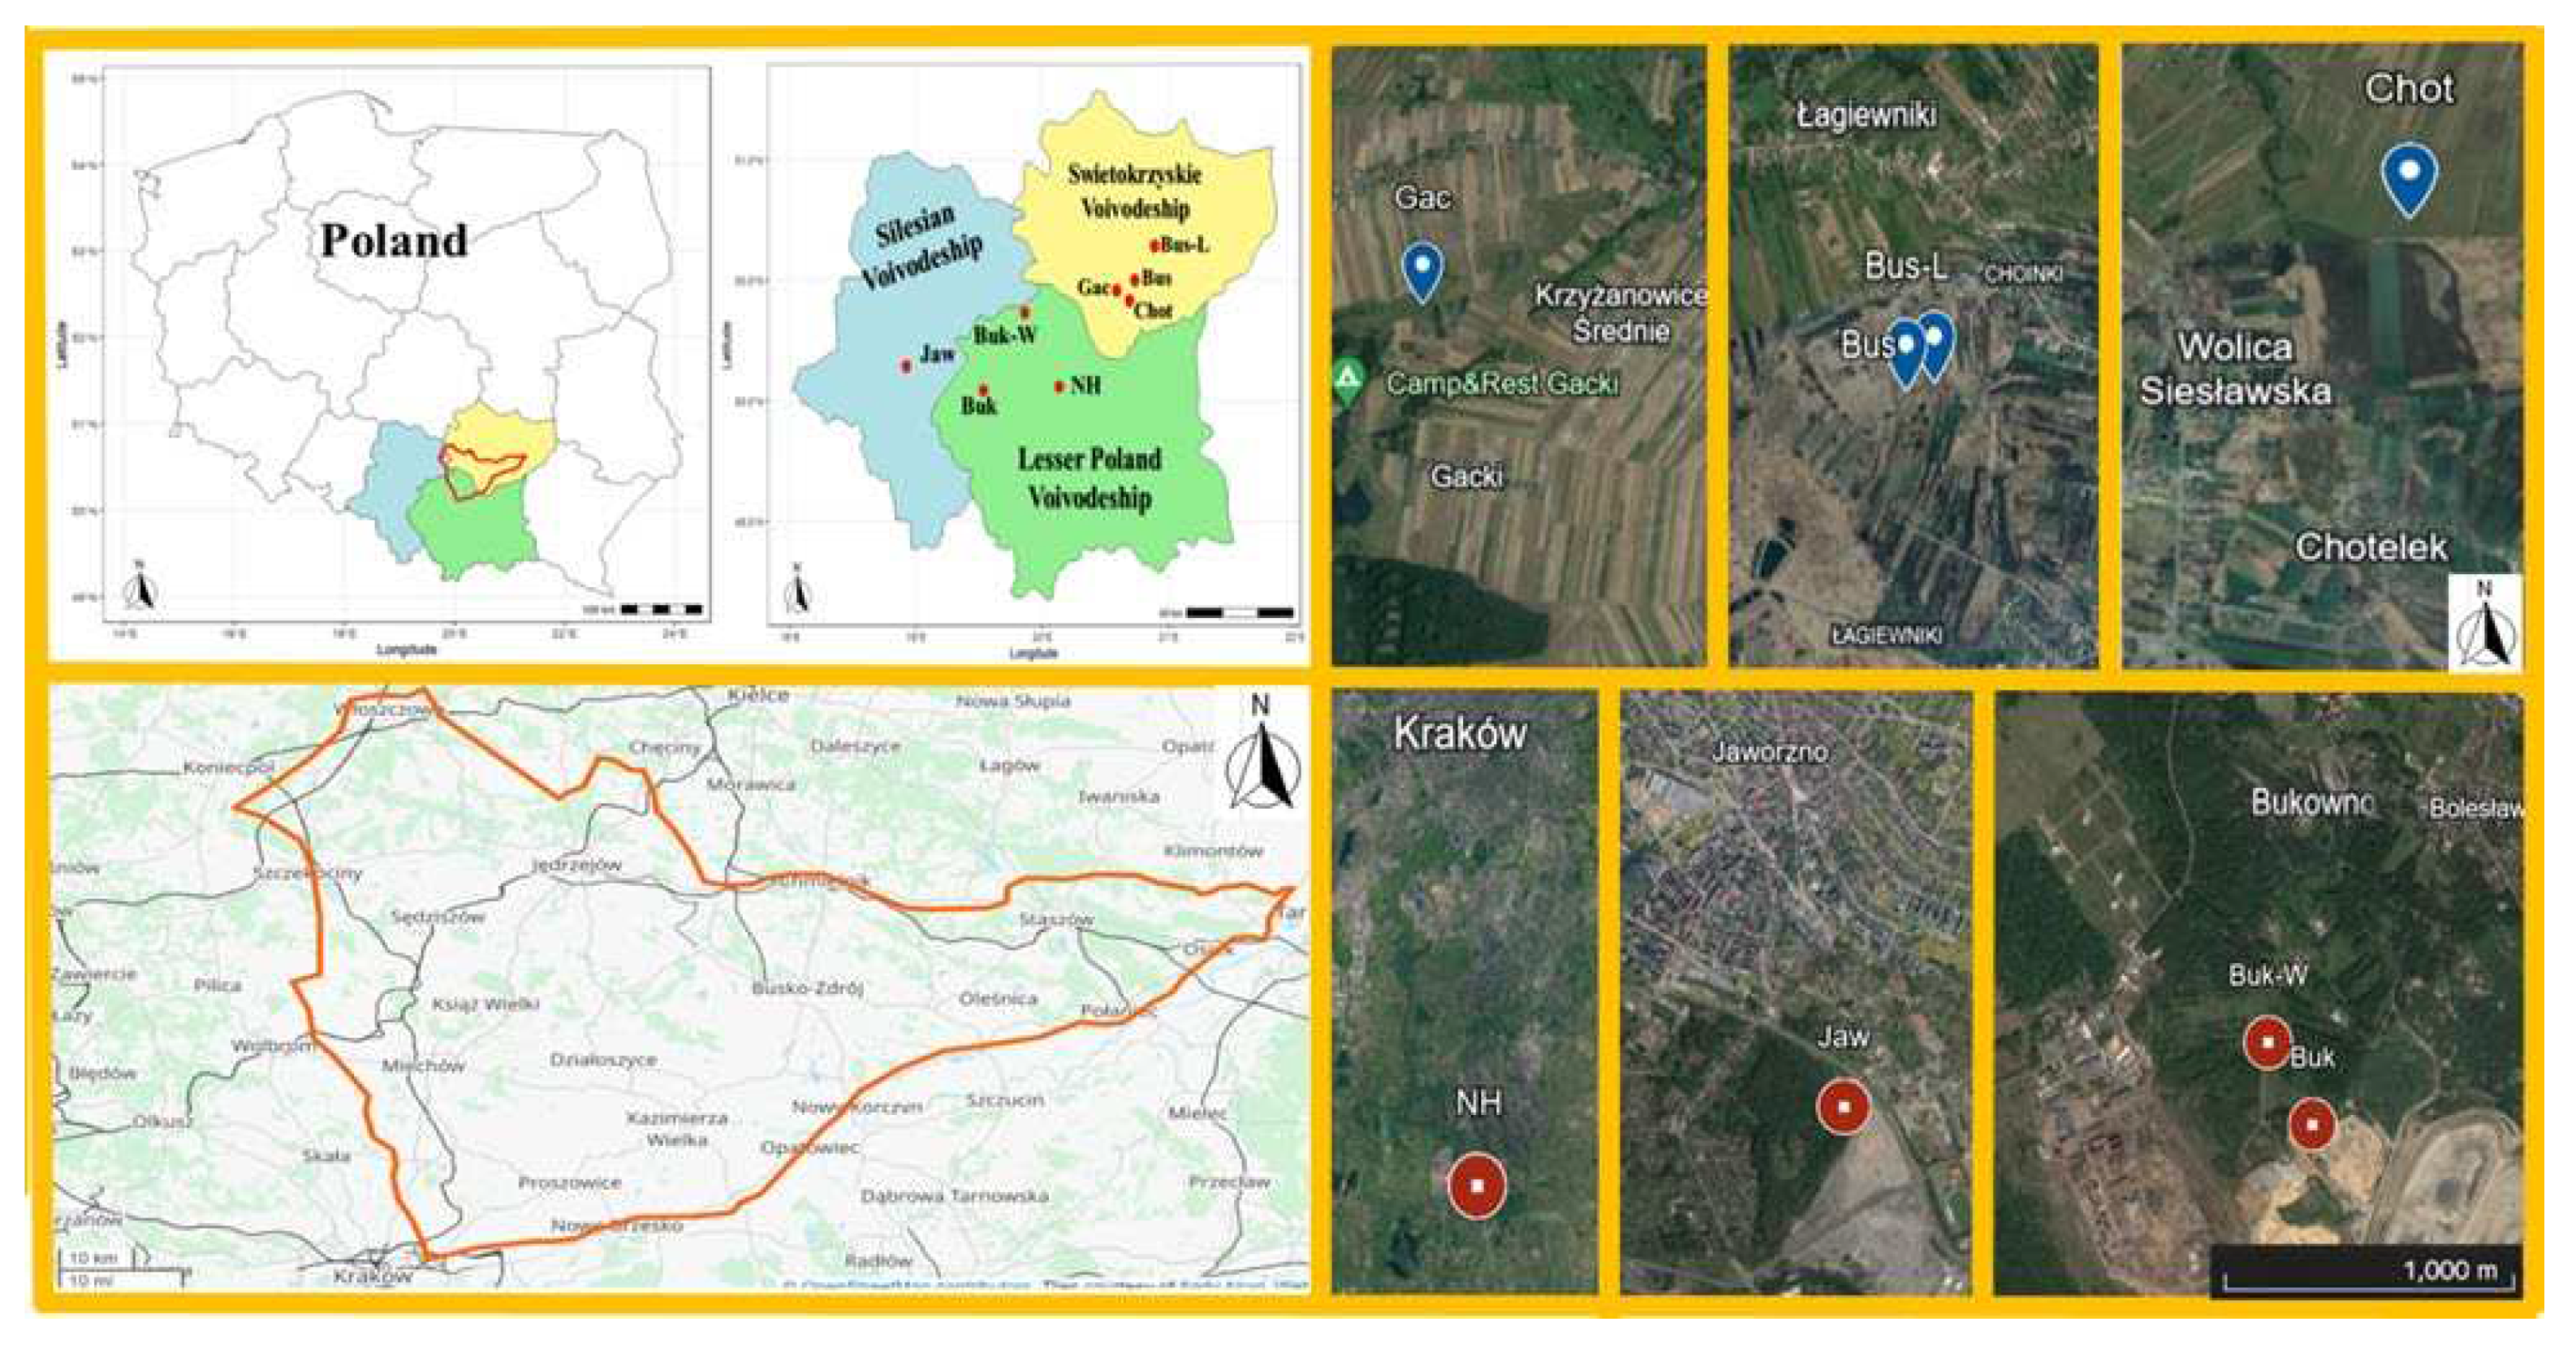
Figure 2.
Share of aggregated decomposed organic matter (Agg), undecomposed plant residues (UndOM) and pores (Por) in the analysed image of the scanned thin section. Different letters show significant differences at p<0.05.
Figure 2.
Share of aggregated decomposed organic matter (Agg), undecomposed plant residues (UndOM) and pores (Por) in the analysed image of the scanned thin section. Different letters show significant differences at p<0.05.
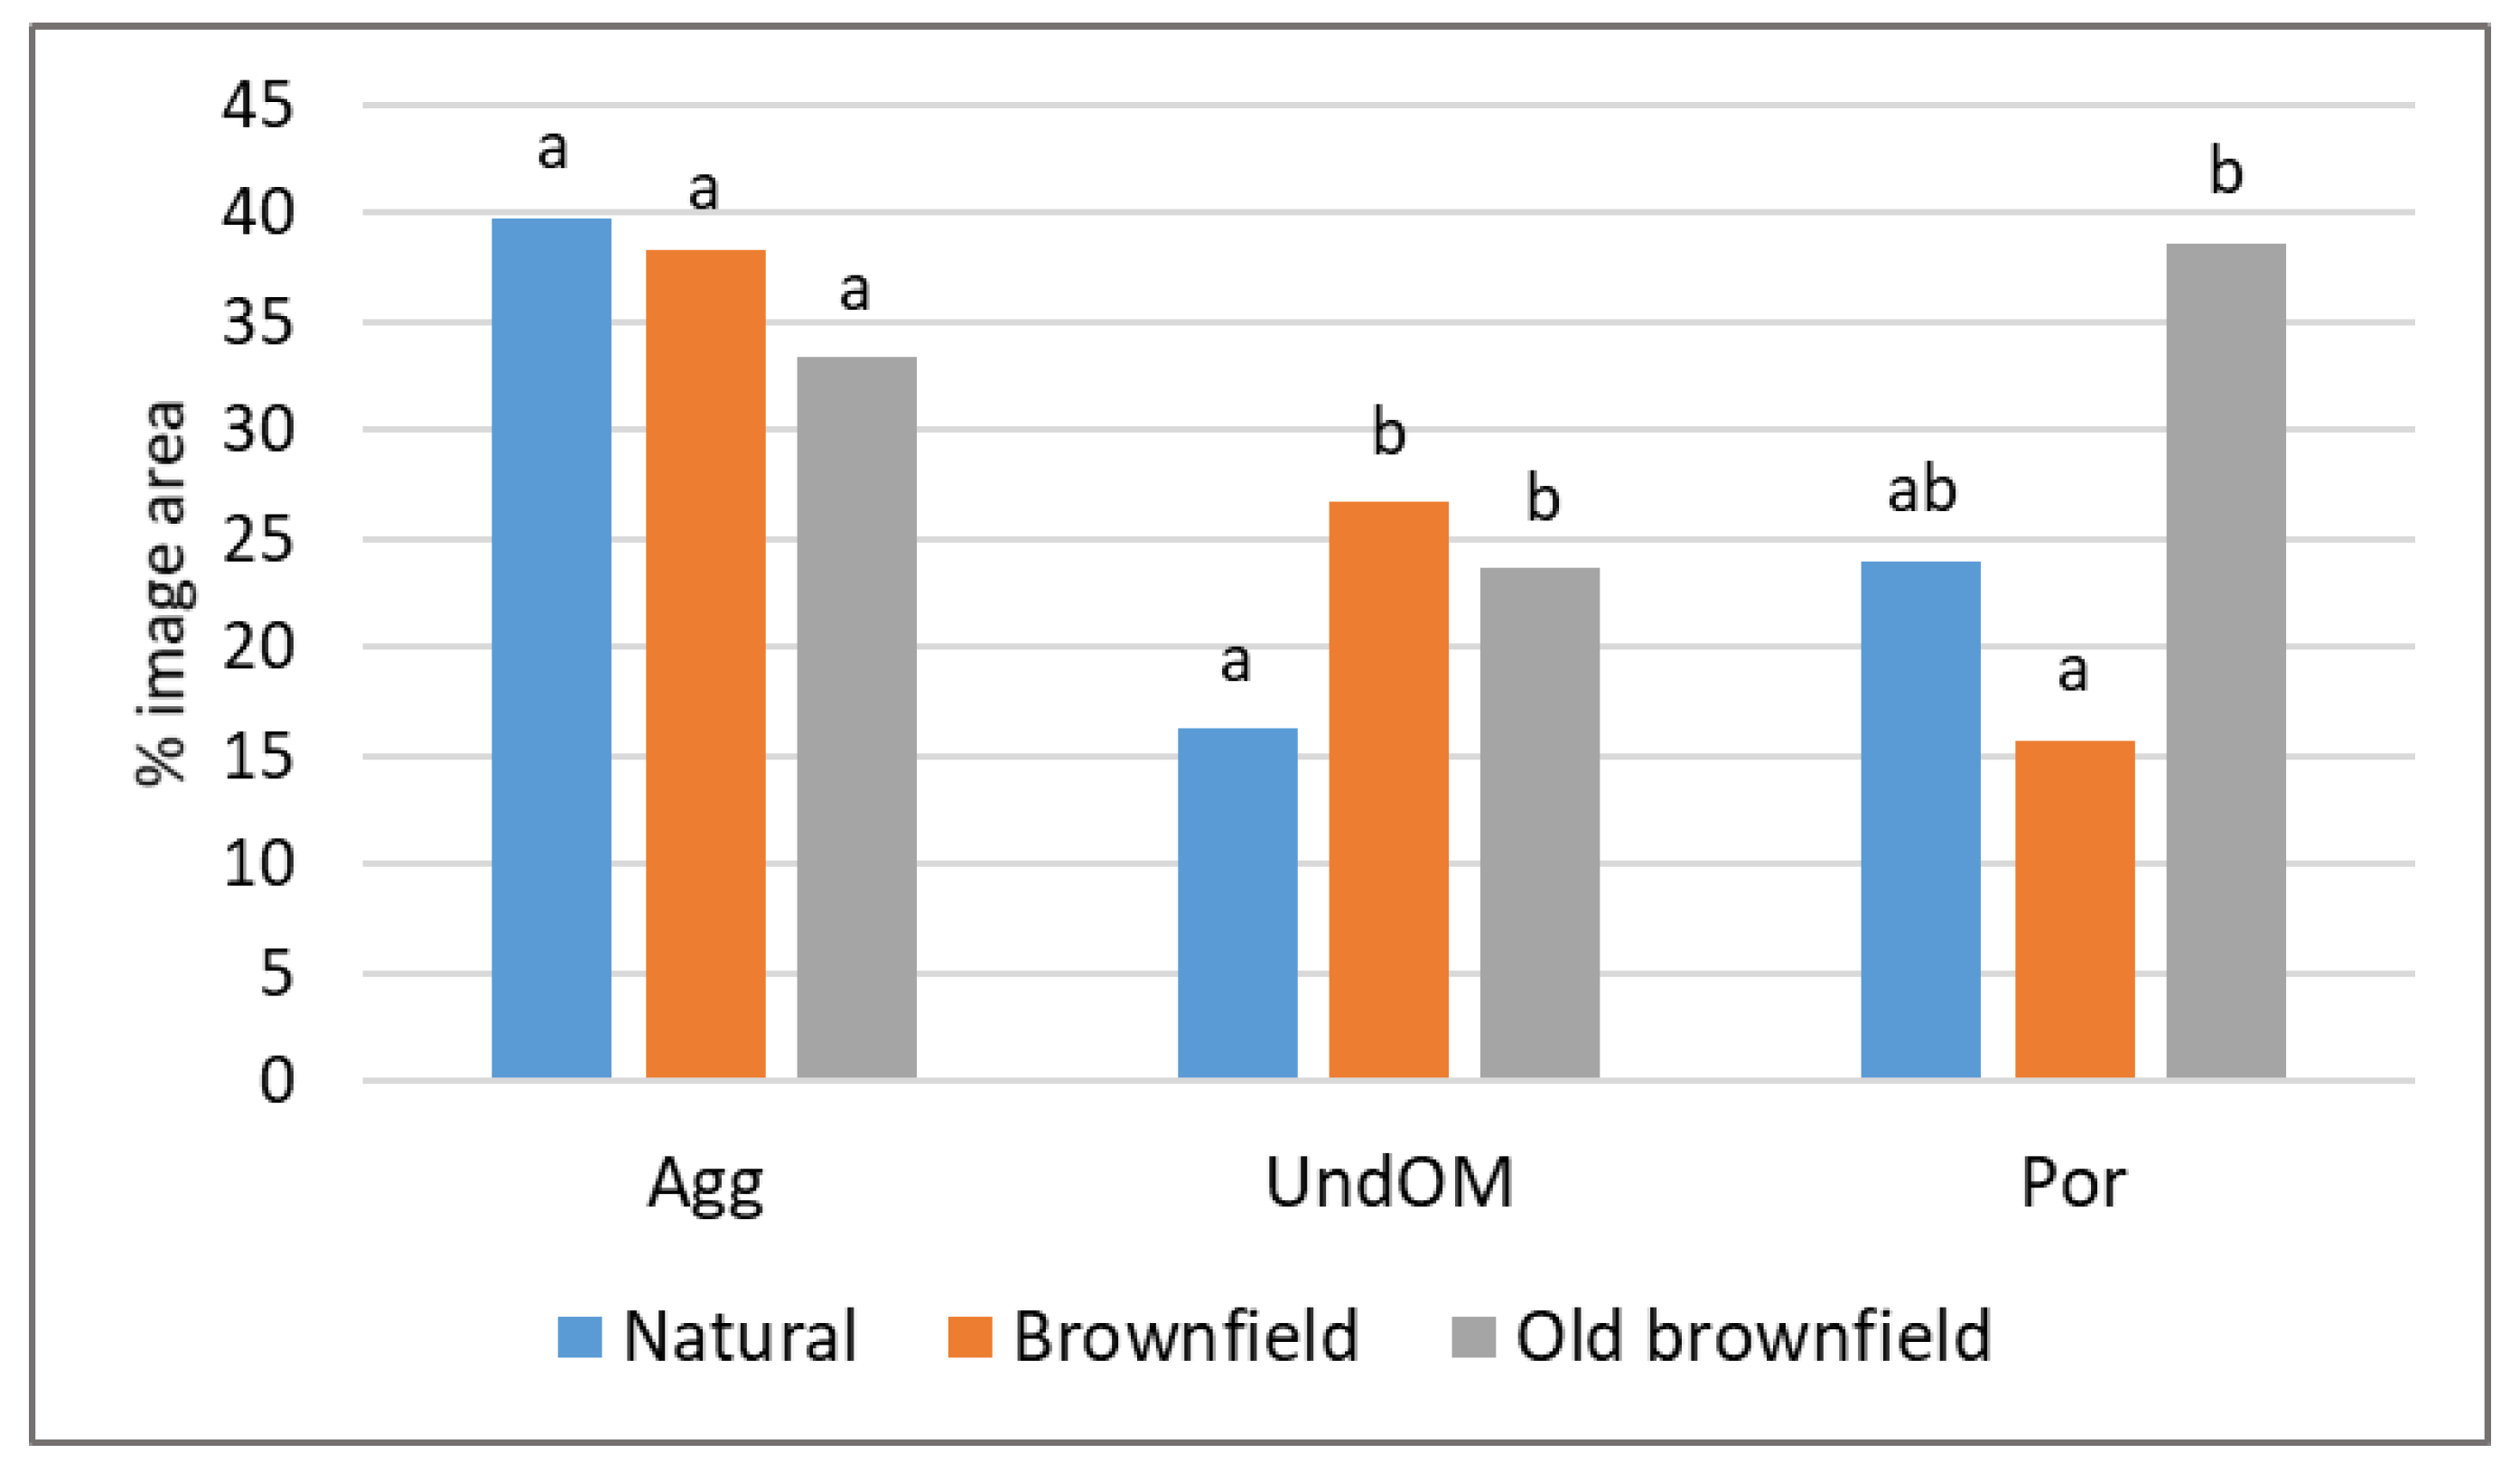
Figure 3.
Share of aggregates, undecomposed plant residues and pores according to their size classes: Mic Agg and UndOM Mic: microaggregates and plant residues with a diameter below 250 µm, Mac Agg and UndOM Mac: macroaggregates and plant residues with a diameter above 250 µm, Por Mic and Por Mac coarse pores and medium-sized pores with a diameter, lower and larger than 150 µm respectively. Different letters show significant differences at p<0.05.
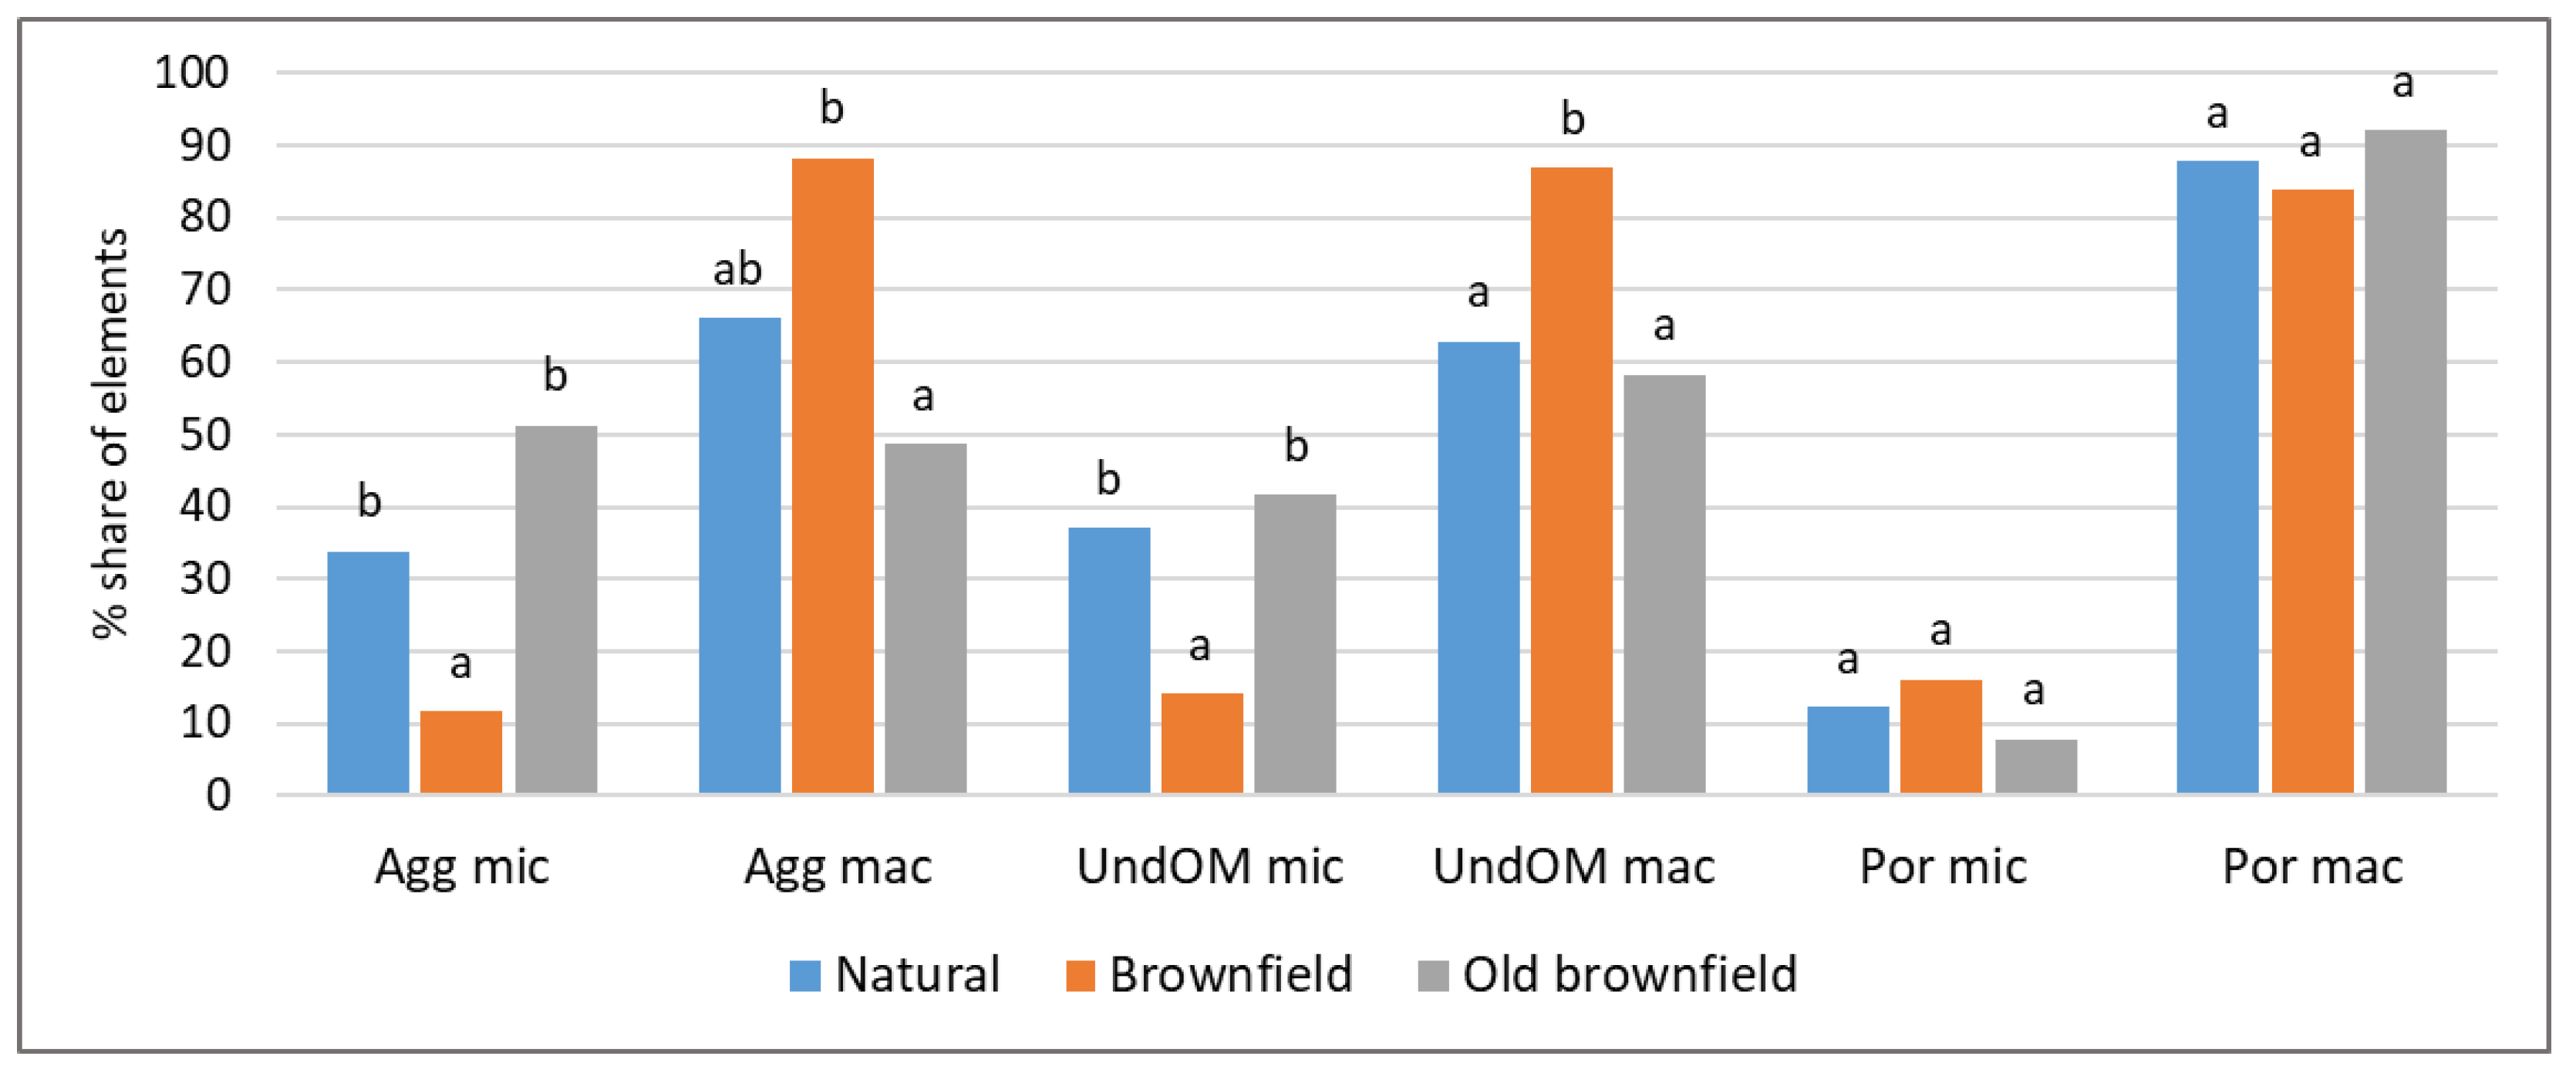
Figure 4.
Principal component analysis (PCA) showing the relationship between the examined variables (selected soil parameters) and natural, gypsum soils (Bus, Gac, Chot, Bus-L), brownfield soils (Jaw, NH) and old brownfield soils (Buk-W, Buk). In PCA following soil parameters were included: SOM content (SOM), amounts of CaCO3 (CaCO3), dehydrogenase activity (DHA), pH, a C to N ratio (C/N), amounts of sand, silt and clay (sand, silt, clay), pH, bulk density (BD), total porosity (TPor), amounts of Zn, Pb, Cd (Zn, Pb, Cd), water resistance index (WRI), as well as soil properties established through image analysis: macro-aggregates (AggMac) and micro-aggregates (Agg mic), large fragments of undecomposed organic matter (UndOMMac) and small fragments of undecomposed organic matter (UndOMMic), coarse pores (PorMac) and medium sized pores (PorMic).
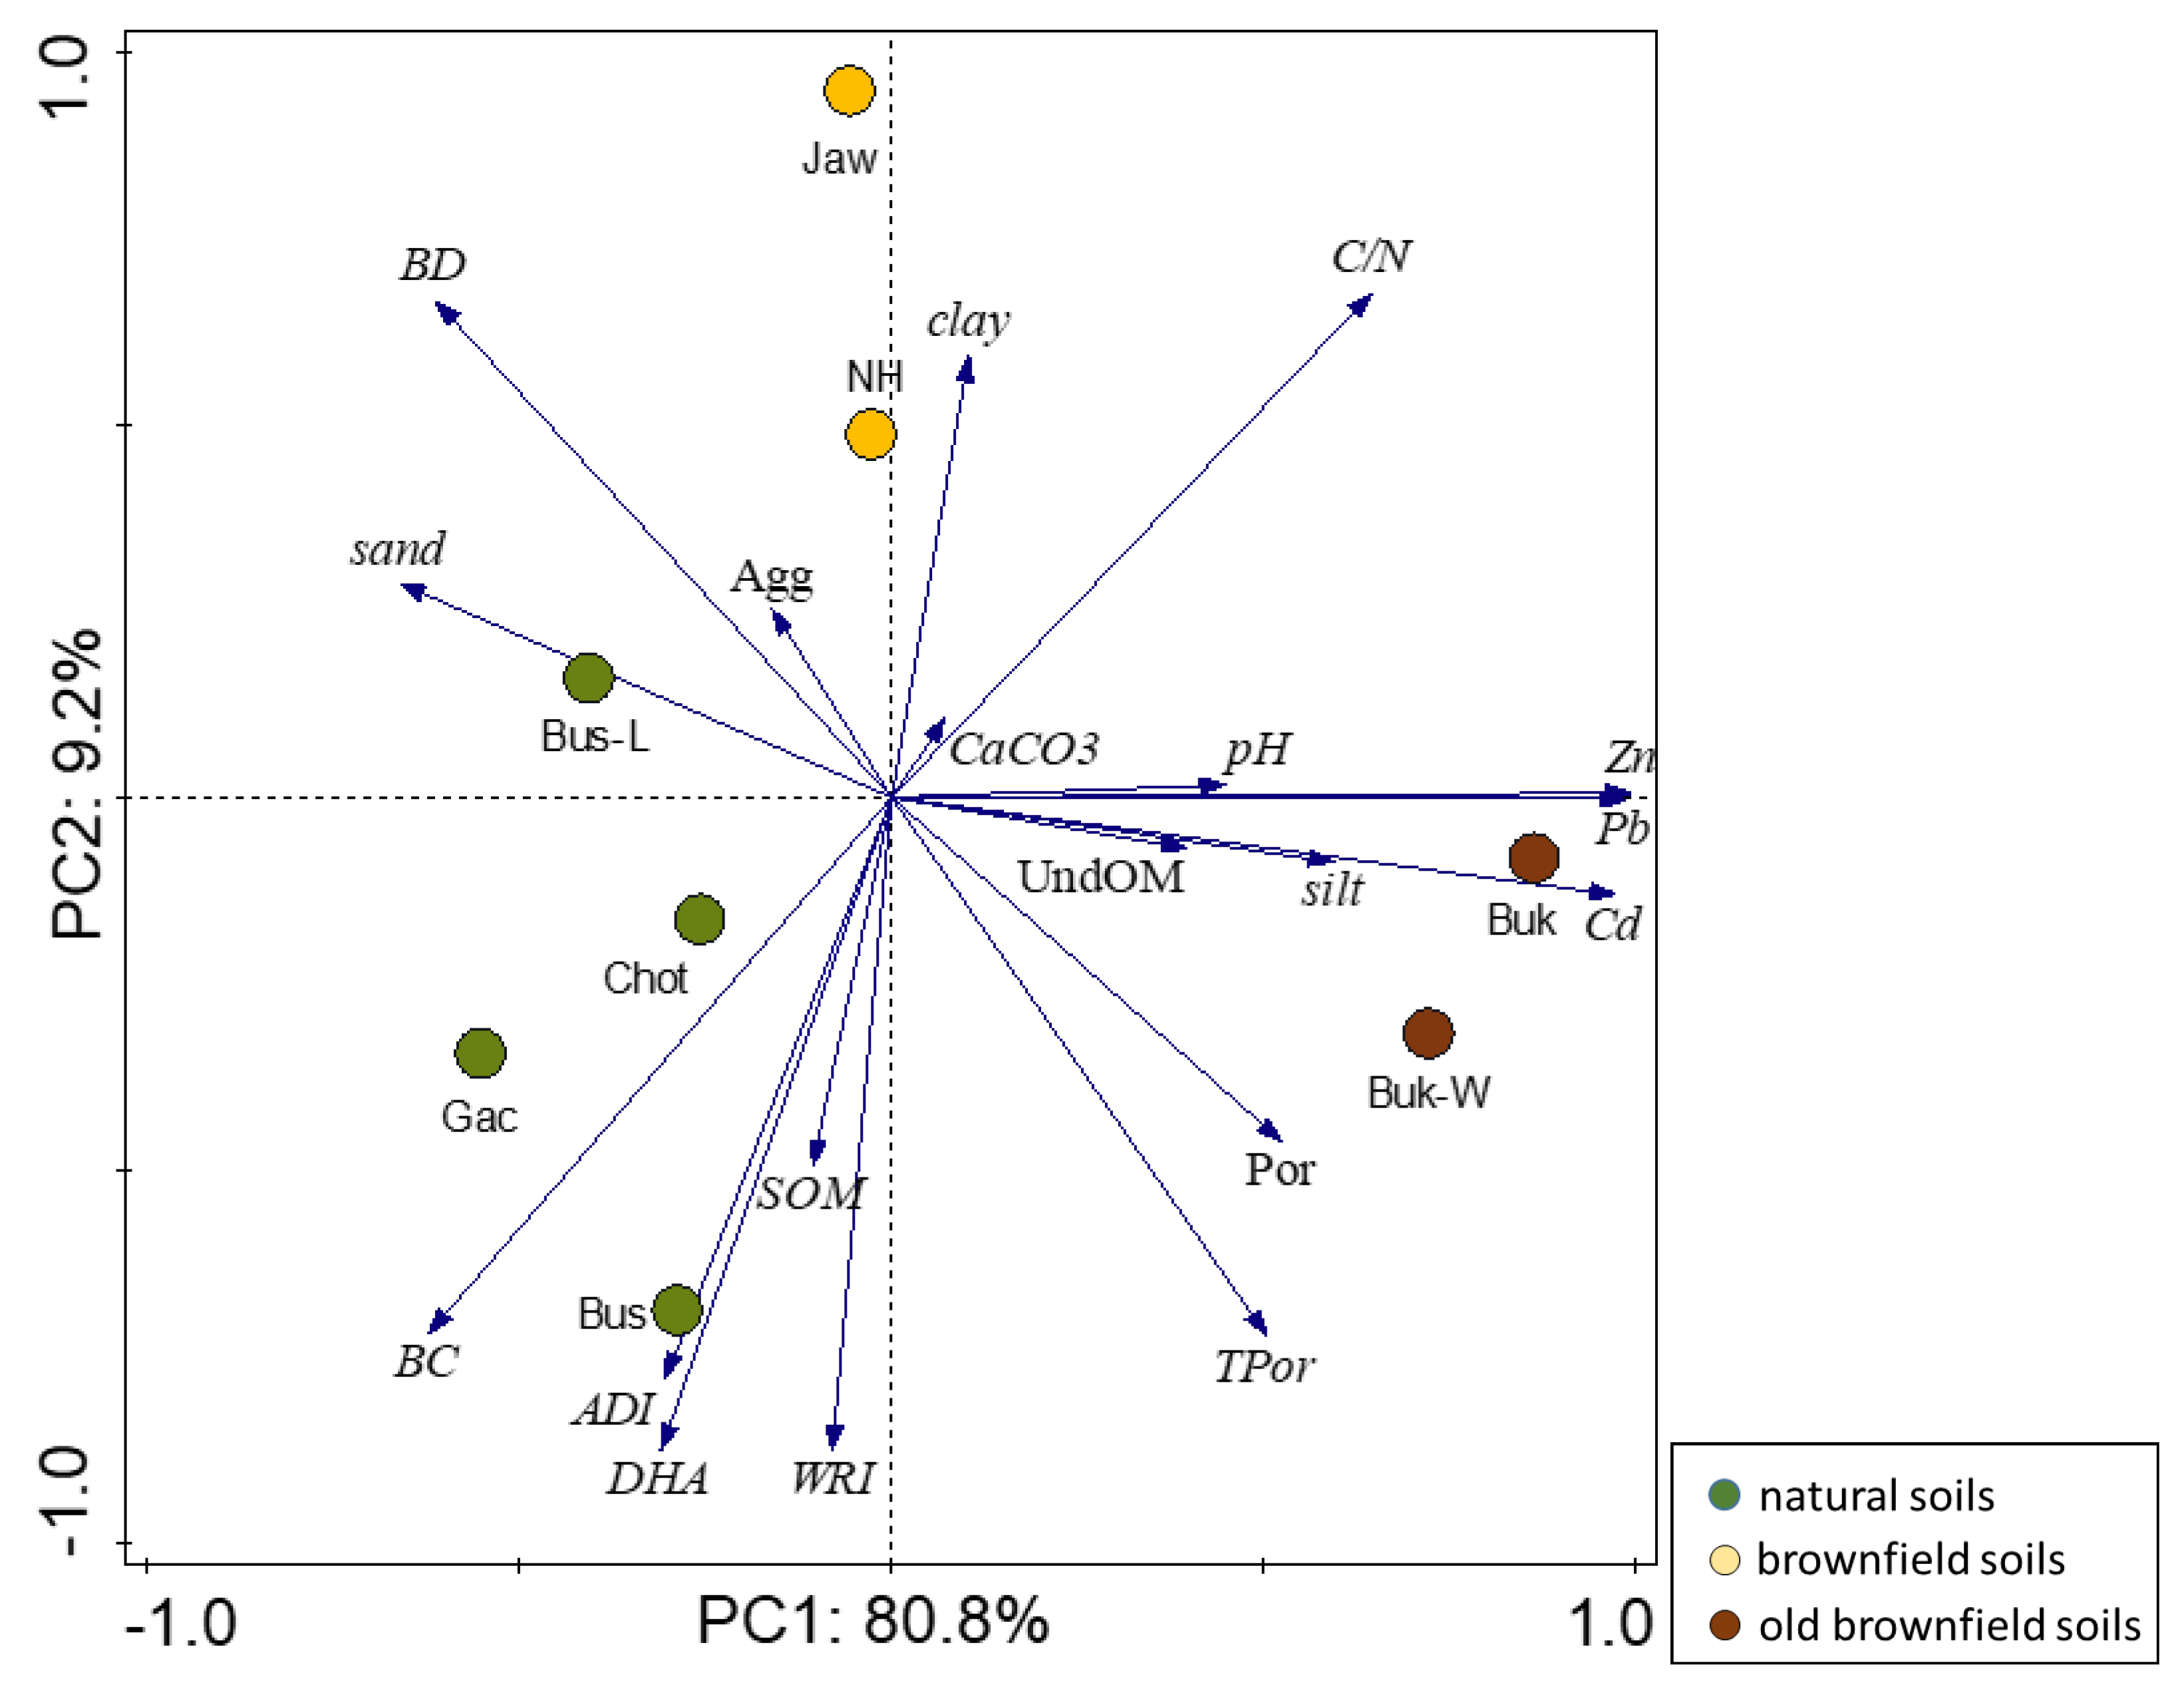
Table 1.
Selected physical properties of soils.
| Soils | Sand % |
silt % |
clay % |
Macrostructure1 – grade, size, shape | WRI2 | BD3 g/cm3 |
TPor4 % |
|
|---|---|---|---|---|---|---|---|---|
| Natural soils | ||||||||
| Gac | 59.9b* ±5.15 |
29.1a ±3.4 |
11ab ±3 |
strong, fine granular | 0.98c ±0.21 |
0.96b ±0.10 |
63b ±2 |
|
| Bus-L | 68b ±2 |
24a ±5.1 |
8a ±3.4 |
moderate, medium granular | 0.75c ±0.15 |
0.98b ±0.09 |
61b ±3 |
|
| Bus | 6.1a ±2.3 |
89.9b ±5.8 |
4a ±3.5 |
strong → moderate, fine granular |
0.87c ±0.14 |
0.87b ±0.11 |
65b ±2 |
|
| Chot | 11.7ab ±5.6 |
74.3b ±9.6 |
14b ±2 |
strong → moderate, fine granular |
0.84c ±0.18 |
1.20b ±0.10 |
52ab ±2 |
|
| Brownfield soils | ||||||||
| Jaw | 21.2ab ±5.8 |
65.8b ±12.4 |
13b ±1.2 |
weak, coarse, blocky angular →crumbly |
0.18a ±0.08 |
1.46c ±0.12 |
44a ±4 |
|
| NH | 12.6ab ±2.3 |
73.4b ±3.6 |
14b ±2.3 |
moderate, very thick, platy →fine, crumbly |
0.42b ±0.10 |
1.50c ±0.20 |
43a ±4 |
|
| Old brownfield soils | ||||||||
| Buk-W | 4.6a ±3.5 |
84.4b ±6.7 |
11a ±1 |
moderate, medium, single grained → blocky angular |
0.51b ±0.10 |
0.55a ±0.11 |
78c ±3 |
|
| Buk | 8.6a ±4.2 |
82.4b ±5.5 |
9a ±3 |
single grained → blocky angular | 0.57b ±0.12 |
0.56a ±0.13 |
78c ±2 |
|
1 field estimation, 2 water resistant index, 3 bulk density, *different letters show significant differences, at p< 0.05, 4 total porosity, 5mean±SD.
Table 2.
Selected chemical and biochemical soil properties.
| Soils | pH | BC1 mmol+/kg |
CaCO3 % |
SOM % |
C/N | DHA2 mgTPF/kg/24h |
Zn | Pb | Cd |
|---|---|---|---|---|---|---|---|---|---|
| mg/kg | |||||||||
| Natural soils | |||||||||
| Gac | 7.0ab* ±0.12 |
1205c ±230 |
5.7b ±0.4 |
7.7b ±0.1 |
8.4a ±0.1 |
102.8d ±10.0 |
15.09a ±0.15 |
5.79a 0.21 |
0.30a ±0.10 |
| Bus-L | 6.4a ±0.2 |
534.1b ±25 |
1.9a ±0.4 |
14.5c ±0.2 |
9.3a ±0.1 |
57.42bc ±4.70 |
27.00a ±0.32 |
24.09b ±1.65 |
0.21a ±0.10 |
| Bus | 6.5a ±0.1 |
2164d ±345 |
1.8a ±0.5 |
16.8c ±0.2 |
8.6a ±0.2 |
67.71c ±9.74 |
66.46a ±1.23 |
26.30b ±1.67 |
0.49a ±0.12 |
| Chot | 7.7b ±0.2 |
572.4b ±22 |
2.6a ±0.7 |
12.0c ±0.1 |
7.6a ±0.1 |
46.89b ±2.93 |
70.68a ±1.35 |
37.14b ±2.25 |
0.14a ±0.12 |
| Brownfield soils | |||||||||
| Jaw | 6.9ab ±0.1 |
164.6a ±56 |
3.0a ±0.6 |
8.9b ±0.1 |
27.6c ±0.3 |
4.43a ±0.5 |
165.8b ±12.1 |
99.6b ±3.65 |
1.01b ±0.10 |
| NH | 7.1ab ±0.1 |
288.1a ±62 |
3.7ab ±0.4 |
2.9a ±0.1 |
16.5b ±0.2 |
12.2a ±1.9 |
382.9b ±32.1 |
39.6b ±3.45 |
2.0b ±0.1 |
| Old brownfield soils | |||||||||
| Buk-W | 7.1ab ±0.1 |
249.3a ±49 |
2.9a ±0.5 |
10.3b ±0.2 |
15.8b±0.2 | 45.7b ±3.9 |
9232b ±123 |
2515c ±153 |
75.8c ±1.23 |
| Buk | 7.5b ±0.1 |
179.5a ±47 |
3.6ab ±0.5 |
9.5b ±0.1 |
21.3c ±0.3 |
22.3a ±1.9 |
13257b ±356 |
5157c ±239 |
175.2c ±15.3 |
1basic cations,2dehydrognase activity,*different letters show significant differences at p< 0.05, 2mean ± SD.
Table 3.
Minimum and maximum of colour value and chroma, Munsell chart colours, mean and standard deviation values of A Horizon Development Index (ADI).
Table 3.
Minimum and maximum of colour value and chroma, Munsell chart colours, mean and standard deviation values of A Horizon Development Index (ADI).
| 0-15 cm | Value | Chroma | Munsell chart | ADI | ||
|---|---|---|---|---|---|---|
| min | max | min | max | |||
| Natural soils | 2 | 6 | 1 | 3 |  |
5.6*b±2.8 |
| Old brownfield soils | 4 | 5 | 2 | 4 |  |
3.7a± 1.0 |
| Brownfield soils | 2 | 3 | 2 | 3 |  |
2.2a± 0.3 |
All of the examined soil samples were in a dry state and examined by a 10YR Munsell hue, *different letters show significant differences between gypsum and mining soils, at p< 0.05.
Disclaimer/Publisher’s Note: The statements, opinions and data contained in all publications are solely those of the individual author(s) and contributor(s) and not of MDPI and/or the editor(s). MDPI and/or the editor(s) disclaim responsibility for any injury to people or property resulting from any ideas, methods, instructions or products referred to in the content. |
© 2024 by the authors. Licensee MDPI, Basel, Switzerland. This article is an open access article distributed under the terms and conditions of the Creative Commons Attribution (CC BY) license (http://creativecommons.org/licenses/by/4.0/).
Copyright: This open access article is published under a Creative Commons CC BY 4.0 license, which permit the free download, distribution, and reuse, provided that the author and preprint are cited in any reuse.


