Submitted:
14 February 2024
Posted:
15 February 2024
You are already at the latest version
Abstract
Two pilot scale desalination system employing carbon modified nano-sized, zero valent metals (n-ZVM) were maufactured and tested to determine (1) the degree to which high salt water (20 to 130 mS) could be desalinated and (2) if this degree of desalination could be maintained throughout an extended treatment period. Two pilot systems were tested (referred to as Generation 1 and Generation 2) consisting of parallel lines of 4 individual reactors in series, a settling tank and an activated carbon cell at the end of each reactor line. The system capacity was 300 gal in Generation 1 and 600 gal in Generation 2 total with a total hydraulic residence time of 6 hours per reactor line (one hour per cell/tank). A slurry of n-ZVM was introduced in the first reactor on each line to yield approximately 5 to 45 grams of nano-metal per 100 L of influent salt water. The n-ZVM slurry was made from mixing tea extract with metal salts (eg ferrous sulfate, ferric chloride) to produce the carbon modified metal slurry. Initial runs focused on dosing required to achieve maximum salt removal at each of three influent salt contents, 28 mS, 44 mS and 123 mS. Once dosing was set, continuous runs (14 days, 23 days and 9 days) were carried out to (1) examine the ability of the pilot to maintain the removal efficiency over an extended period, (2) to determine the weaknesses inherent in the pilot systems, and (3) to begin to develop CAPEX and OPEX estimates for the pilot and pre-design full scale mobile desalination unit (MDU) system. Results demonstrated that maximum removal occurred with 10 g/100L of salt for the 30 mS salt solution,16 g/100 L of salt for the 40 mS influent water and 40 g/100 L for the 130 mS influent. Salt removal (expressed as Na and Cl removed) approached 78% for the 30 mS influent and 41 mS influent respectively while removal for the highest salt influent (130 mS) approached 81 %. Addition of greater amounts of carbon modified slurry than those described resulted in a pH less than 6 which inhibits continued salt removal and would require addition of calcium or magnesium oxides/hydroxides or bicarbonate solutions at the influent side to achieve greater salt removal and of course greater cost per gallon. Continuous operation over the extended time-period showed no significant decrease in salt removal with typical day to day variation of no more than 10% suggesting that this approach to desalination could rapidly provide usable water from saline aquifers, seawater or even produced water. Treatment of saline waters at 30 mS or less yields effluent water in the range necessary for irrigation use of many crops while treatment of seawater or produced water levels of salt (40 mS or higher) yields effluent in the range of 8 to 10 mS a range ideal for RO influent that would prevent the production of large volumes of brine. Pilot testing continues with seawater extracted from Puget Sound, Seattle WA and higher levels of salt to better represent produced water.
Keywords:
iron aluminum particles
; desalination
; nano zero valent iron
; green synthesis
; reactors
; flow through reactors
; saline waters
; irrigation water
; NaCl removal
1. Introduction
Engineered nano materials include zero valent metallic particles in the size range of 1 to 100 nm, referred to as n-ZVM [1]. These materials offer great potential for water treatment due to their high surface area and high reactivity allowing removal of contaminants by adsorption or through reductive processes [2,3]. The application of these materials in water treatment have been reviewed [4,5,6] which highlights the diversity of application as well as the numerous types of nano materials available for removing specific contaminants encountered in water treatment systems.
Nano metals, especially nano sized zero valent metals, including iron, aluminum, copper, manganese, magnesium, silver, zinc and titanium (N-ZVM) have been used in water remediation and contaminant removal [7] primarily as adsorbents. Adsorption is a surface phenomenon wherein an ion or molecule forms a layer on the particle surface via chemical or physiochemical processes. Their effectiveness in treating and removing contaminants is due to the high surface area of the metals (20–40nm) and high reactivity due to electron rich structure [8]. This allows [1] reductive type reactions to occur such as reductive dechlorination of many halogenated organic compounds, [2] removal via adsorption of metal(oid)s by n-ZVM that include arsenic, selenium, zinc, copper, cadmium and a host of other metals and radionuclides [4,5,6].
An emerging application of nano metals is desalination of various saline waters. N-ZVM is used both as an adsorptive surface for sodium and chloride and other dissolved species as well as a catalytic agent for salt removal far in excess of its mass or surface area predictions. Several publications and patents now describe the process of salt removal by N-ZVM (or M-ZVM) and several different designs for the rapid, continuous removal of salt by this method have been or are in pilot scale operation ([9,10,11] and this work). Unlike RO and other advanced technology, it requires only that water be pumped to the reactors and air supplied in low amounts to initiate the reaction. This translates to eminently mobile units, with small electric demands usually powered by solar panels/battery systems. N-ZVM desalination systems can be used to desalinate waters including seawater, saline aquifer water, saline return irrigation water and oilfield/natural gas produced water for industrial and agricultural re-use.
The mechanism of salt (principally Na and Cl) removal is not well understood or completely known but can be related to the following characteristics observed in the reaction between salt and slurried n-ZVM:
Under oxidative conditions, air (O2) initiates the corrosion reaction which is also catalyzed by the presence of Cl ion. Corrosion products include a variety of iron oxides and oxyhdroxides all of which have a greater surface area than the n-ZVM particles. For example, n-ZVI (iron) has a surface area of 20 to 40 m2/g but the oxide/oxyhydroxide corrosion products have surface areas between 600 and 1100 m2/g [12]. This additional surface area would provide much increased (30 to 50x) surface adsorption [12],
Corrosion products can also include layered double hydroxides (LDH) that offer substantial interlayer space for salt removal [13,14],
The surface functional groups of iron oxyhydroxides can carry both negative and positive charges, the balance depending on ambient pH conditions. These protonated surface hydroxyl groups can bind both Na and Cl,
The hydration layers surrounding iron corrosion products have been found to contain Na and Cl possibly as inner-sphere complexes [13,15].
Of particular interest is whether this technology can be scaled to perform economically under field conditions. In a previous paper [11] researchers examined the use of n-ZVM as a means of treating saline irrigation return water. The previous process focused on pre-treatment of the water to remove sulfate prior to desalination and was conducted in a batch mode capable of treating 200 gal per day. In contrast, this paper focuses on the application of the technology to water with very different salt contents; from low salinity (15 ppt) irrigation water to medium salinity seawater (22 ppt) to very high salt contents (70 to 130 ppt) such as observed in produced water. The work was conducted in two pilot reactors, approximately 1/12th the size of a conceptual full-scale system with daily capacity of 7000 gallons and 10,000 gallons for the different reactors.
2. Objectives
- -
- The objective of this work was as follows:
- -
- Determine the degree to which high salt water (20 to 250 mS) could be desalinated,
- -
- Determine if this degree of desalination could be maintained throughout an extended treatment period,
- -
- Identify weaknesses in the pilot system such that improvements to the full-scale system could be made,
- -
- Begin to assess waste volumes and disposal options,
- -
- Identify and quantify system materials and consumables in order to begin estimating CAPEX and OPEX for the desalination process.
3. Materials and Methods
The methods used to conduct this work are detailed and explained in the sections below.
Reactors—Two pilot scale reactors were used in the study. The Generation 1 pilot consisted of 5, 152 cm tall, 30.5 cm diameter PVC pipes placed in a series (Figure 1 and Figure 2). Influent water was fed via a peristaltic pump to the first PVC reactor where nano media slurry was added also using a peristaltic pump to deliver the precise amount of nano metals to effect desalination. Feed water was subsequently transferred to the other reactors via short (12.7 cm) stretches of polypropylene tubing. Water entering the reactor was forced down to the bottom via a 2.54 cm PVC pipe where it mixed with air delivered at the bottom of the reactor from a manifold driven by a small air pump. The air delivery rate to each reactor was set at 2L/min continuously. Only the first reactor in the series was dosed with the slurry. Reactor 5 was used to settle the salt metal mixture and reactor 6 contained activated carbon to remove color and excess metal slurry.
And the real system:
The Generation 2 reactor is similar but configured slightly differently. The reactor was made from a refurbished aluminum tank that was sandblasted and then coated with epoxy paint. Dividers were welded in place to serve as the individual reactors. As with Generation 1, the first reactor was fed the media slurry with a peristaltic pump, and air bubbled through the bottom of the tank at the same rate as Generation 1. The primary difference was capacity. Generation 1 has a total capacity of 300 gallons and generation 2 a capacity of 600 gallons (Figure 3, Figure 4 and Figure 5).
N-ZVM Slurry—The media driving the desalination reaction is made from natural tea (black or green) extraction and metal salts as described in Walker (2023). The general composition of the media is also shown in US Patent 10919784 B2. For the different salt contents (Na and Cl primarily) the media was made to yield approximately 10 g, 20g and 40g of total metal/100 L of saline waater. The metals consisted of iron (Fe), aluminum (Al) and smaller amounts of copper (Cu). The slurry was made in 50 L batches and was shown to be stable for up to 1.5 months at room temperature. It was stored in 20 L polyethylene carboys before connection to the pilot plant.
Influent Water—Due to the lack of large volumes of both irrigation type water and produced water derived from oil/natural gas extraction, synthetic saline water was constructed in 1500 gal batches using halite, magnesium sulfate, potassium bicarbonate, calcium chloride and calcium sulfate. The seawater was also constructed from the same chemical mixtures and used in the pilot runs until seawater was obtained from Puget Sound, Seattle WA in November of 2023. The mixtures used to produce the various waters are shown in Table 1 along with the appropriate references.
Instrumentation, Data Collection and Analysis—During operation of the pilots, continuous (each second) measurement of pH, Cl, EC, air flow and water flow occurred on the influent side of the pilot (feed tank) and the discharge side of the pilot after water passes through the activated carbon. In addition, during select times (each 8-12 hours) the same analytes were determined in each reactor tank to observe chemical changes from tank to tank through time. All measurements were captured by the programmable logic controller (PLC) located on the influent side of the pilots (Figure 1 and Figure 3). The PLC controlled the flow and air meters and the various probes collecting chemical information. pH and EC (and temperature) probes were purchased from Seametrics Corporation (Model CT2X conductivity cell) and (Model TempHion pH, ORP/ISE smart sensor) and data logger (pH, EC, ORP and Cl). Calibration of each instrument was done using Oakton purchased calibration standards. Calibration was repeated daily for pH and EC while Cl and Na calibration was repeated every 4 to 8 hours.
Pilot Operation—Both pilot systems were operated similarly. Feed water rates were set via the diaphragm pumps (Generation 2) or peristaltic pump (Generation 1) and fed directly in to the first reaction chamber. Flows only varied between 1.85 l/m and 3.7 l/M in both pilots. At the first reaction chamber, the media feed pumps delivered the nano slurry at a rate consistent with feed water flow and the desired amount of nano metal for each type of water. The air pumps fed 1.5L to 2L air/min to each reaction chamber at the bottom of the cell. The feed water entering the cells was directed to the bottom of the cell near the air flow stream using internal piping which allowed good contact between the nano media and the air flow and forced the feed water up through the cell. The water in cell 1 was transferred to the next cell via continued feed water flow and again directed to the bottom of that cell. The first four cells in each pilot had similar air delivery but nano media was only fed to cell 1. Cell 5 contained no air flow and allowed solids to settle while cell 6 contained 25kg of granular activated carbon for polishing the treated water.
The reactors were run continuously for 14 days for treatment of saline irrigation water, 23 days for treatment of synthetic seawater and 9 days for treatment of synthetic produced water. Water was stored either in 2, 3000-gallon poly tanks or a 1500 gallon above ground, collapsable swimming pool. Puget Sound seawater was conveyed via a series of large water tanks in a truck bed after pumping from the Sound at a depth of 12 feet below surface.
4. Results
Dosing: Prior to performing the extended runs, dosing experiments were carried out to determine the amount of nano metal required to remove between 70 and 80% of the salt. This percentage was chosen since 80% removal would remove typical seawater to a level (10 mS) conducive for RO processing at an efficiency that would produce very little brine. To determine the required dose for each water, about 500 gallons of each was prepared and run through the pilot in a single pass. During the shortened run, the delivery rate of the nano slurry was adjusted to achieve the desired removal. The nano metal in the slurry was always constant, only the feed rate changed. The data by Walker (2023) was used as a guide for initial dosing. Dosing began at 5g of nano metal per 100L (0.05g/L) of feed water and increased slowly (every 2 hours) until the desired removal was achieved. Replicate runs at each dose produced removal efficiencies of 73–78% for saline irrigation water, 75 to 81% for sweater and 69 to 87% for produced water. The ultimate dosing selected for each water and the relation to salt content is shown in Figure 6.
Extended Desalination Runs: The results of the extended runs are summarized in Table 3. The first three rows in the table demonstrate the dosing changes and their effect on salt removal. The Table can be interpreted as follows:
Column1 is the start date for each run, followed by dose of n-ZVM used, followed by reactor type (G1 or G2). Next is the water type (saline irrigation, seawater or produced water, followed by the media mixture (usually tea extract and metal salts). The last columns show the initial EC, the initial Cl and Na, the Cl removed and the % removed for Cl and Na.
The first four rows show the effect of increasing dose nano slurry on salt removal from saline irrigation water. Increasing the dose from 5g/100L to 10 increased desalination from about 50% to 77% at 10g/100L Once the dose was set, this reactor continued to treat saline irrigation water for 336 hours or 14 days.
The extended run with saline irrigation water (row 5) showed that addition of 10g of nano metal could desalinate the water by 77% over the 2-week runtime.
The sixth row is a replicate run at 10g/100L to ensure this dose could achieve similar results. As noted, desalination was similar or about 78% reduction compared to 77% reduction in the previous run.
Row 7 is the extended run for the synthetic produced water. At a dose rate of 40g/100L, 80% reduction was achieved over the entire 9 day runtime.
Row 8 shows the results for the synthetic seawater and that a dose of 20g/100L could desalinate more than 75% of the entrained salt.
Row 9 was the most recent run (2/24) using seawater pumped from Puget Sound. This comparison to the synthetic seawater in Row 8 was important for validating the approach using constructed seawater. The results for each seawater sample are similar where 74% salt reduction was achieved with synthetic seawater while 76% reduction was achieved using similar reaction conditions.
Figure 7 and Figure 8 depict additional detail of the 23-day seawater run. Figure 6 shows the Na and Cl removal calculated from data collected at 12-hour intervals. As noted, the desalination was very consistent with only a 5 to 10% deviation from the mean removal efficiency (76%). Between hours 372 and 396 hours, the media feed pump became clogged resulting in no slurry feed for approximately 2 to 3 hours. Once the feed line was cleared, the desalination proceeded as before the clog occurred.
Figure 8 shows the Cl remaining in solution during the same seawater run and demonstrates how Cl is reduced from 15,000 mg/L to under 4000 mg/L with the 20g/100L dose and 4 hour retention time.
Another important part of the desalination runs was to inspect the chemistry data of the influent with the effluent to determine the effect the n-ZVM may have on other major cations and anions in the feed water. This data is shown in Table 3.
The table shows that only marginal removal of K occurred during desalination ranging from about 40% removal in saline irrigation water and 8% in produced water. This may be due to the much higher concentrations of both Na and Cl when compared to other chemicals in these waters. The Ca, Mg and SO4 concentrations stayed the same or showed slight increases. This was because the pH of the feed water was typically raised to pH 8 or 8.5 using Ca or Mg hydroxide (additions of 0.3 to 0.7 g/L). As noted, the pH of the effluent was always lower than the influent pH due to the fact that the slurry made with tea extract has a pH of about 3. Therefore, in poorly buffered waters such as these synthetic waters sources of hydroxide or bicarbonate may have to be added along with the slurry to maintain a high rate of desalination in concentrated waters..
Retention Times: One of the reasons for the use of multiple reactors in series was to allow independent analysis of salt removal through time. The reactors were sampled usually at 1-hour intervals during the first 12 hours of operation for the continuous runs and then randomly during the rest of the runs. Inspection of samples collected from each reactor during the runs indicate that the reaction is nearly complete between reactors 2 and 3 and by reactor 4. Given the volume of each reactor is 100 L in Generation 1 and 200 L in Generation 2 with flow rates of 1.85 L/min and 3.7 L/min, respectively results in a retention time between 2 and 3 hours where maximum salt removal occurs.
Effect of pH: The pH of the influent water has a marked effect on salt removal. Figure 9 displays the results of 8 experimental runs using Generation 2 reactors. While the influent water for all runs was between 24.5 mS and 25.8 mS, the amount of media slurry varied from 5g of nano metal per 100/L to 15g/100 L. Increasing the nano metal involved increasing the slurry which included the tea extract polyphenols and acids which decreases the pH of the influent water within the reactor. In Figure 9 the low pH values (pH from 6 to 6.4) cleary show a much lower efficiency ranging from 39 to 51%. When the pH (lower dose) of the reactor mixtures was kept above 7, efficiency increased to over 80%. The pH effect suggests that some waters may require pH adjustment prior to treatment usually under the following conditions:
If the source water is acidic then addition of a neutralizing chemical such as calcium hydroxide, magnesium hydroxide, potassium bicarbonate or others may be added to the influent side of the reactor. The amount to add should be based on a titration to yield enough buffering to keep pH above 7 after addition of the slurry.
If the source water is hypersaline and a significant increase in nano slurry is required to achieve the desired desalination. Again, the neutralizing agent should be added at amounts determined by titration.
It’s possible that the salt removal mechanism is different at high pH in the presence of very high calcium or magnesium hydroxide addition. The reaction could be dominated via precipitation of iron oxyhydroxides as soon as corrosion of the iron nano particles begins or from Fe (II) and Fe (III) species in the n-ZVM slurry much like the sol gel process explored by Antia [18] that might be independent of everything except the total amount of iron in the system. Future work will follow these different possibilities using a combination of wet chemical techniques and surface spectroscopic methods.
Pilot Reactor Issues: During the extended runs the electrical and mechanical systems were scrutinized to assess potential week links such that better more durable replacement systems could be identified. The primary observations included:.
The media feed pump and tubing will have to be reconfigured to prevent blockages occurring due to poorly mixed nano media. It was noticed that settling of the nano media occurred within one hour of operation and some large particles or clumps of tea extract artifacts caused tube blockages. To prevent this, the nano media will have to be filtered through a 200 mesh sieve to remove large debris and the continuously stirred during the media delivery process. Both improvements are underway.
In general air flow to the reactors is very steady, however occasionally the check valves at the outlet from the quick connect valves at the bottom of the tank become clogged with nano media settling to the bottom during reactor runs. The problem results in increased flow readings on the inlet side of the manifold that delivers the air flow. To date, three different styles of check valve have been used to determine if one type is superior to others. The problem occurs once every 2 to 3 months usually on 1 to 2 reactors.
The air supply and peristatic pumps have been operating continuously since 6/1/23 and none of the equipment has failed, yet. Over 80,000 gallons of water has been processed during that time.
Waste: Because the reactors can remove 70 to 80% of the dissolved salt load a substantial volume of waste is produced. For example, the treatment of 1000 L of water at 80% salt removal produces the waste mass and volume described in the table below:

Table 4.
Waste Generated from Each Water Type.
| Water Type | Mass | Volume (density of solids 2kg/L) | % waste to treatment volume |
|---|---|---|---|
| 31 mS Saline irrigation | 12.6 kg | 6.3 | 0.63 |
| 44 mS Seawater | 17.95 kg | 8.9 | 0.89 |
| 130 mS Produced Water | 53.04 kg | 27 L | 2.7 |
The waste product is collected from the bottom of each reactor at cleanout intervals each month. Each of the reactors in the series contains waste, but the majority of the waste accumulates in Reactor 5, the settling reactor. However, each of the other reactors contains settled salt/metal waste but in lower amounts. To date only the Generator 2 reactor has been examined quantitively for waste products. In this case, the reactors treated saline irrigation water with a salt content of 33 mS (similar to the water used in the 14 day extended run). After 2220 L of water had been run through the system, the reaction was stopped, the air supply shut off and all solids allowed to settle over a 24 hour period. The removal efficiency was just under 75%. A transfer pump was used to remove most of the water in the individual cells (except the carbon polishing cell) without disturbing the settled solids at the bottom. Next a vacuum hose was used to pull the solids from the bottom into a series of clean 20L plastic buckets which had been labeled and pre-weighed. These buckets were left to evaporate to dryness or until no change in weight was observed. The mass observed in each bucket (representing each reactor) are shown below.
Table 4.
Mass balance of waste collected versus waste calculated from salt removal efficiencies.
| Reactor (Bucket) | Mass (kg) | Volume (density-2kg/L) (L) |
Compared to Theoretical Mass/Volume |
|---|---|---|---|
| 1 | 15.1 | 3.04 | |
| 2 | 5.5 | 1.1 | |
| 3 | 5.2 | 1.04 | |
| 4 | 5.4 | 1.08 | |
| 5 | 8.1 | 1.62 | |
| Totals | 38.3 | 7.88 | 35.1 kg/7.87L |
Total amount of nano metal added about 0.6 kg
The amount of waste produced was slightly greater (38.3 kg) than predicted from an 80% efficiency (35.1 kg). The waste mass also includes the metal added from the slurry or about an extra 0.6 kg which would be subtracted from the mass observed.
The pilots are now having a waste vacuum lime installed such that the waste accumulating at the bottom of the reactor can be removed, filtered, and dried for disposition or recycle/reuse. A comparison of the waste from this system to other desalination systems is not entirely straightforward since this system produces a solid waste, but using the data from these extended runs it is likely that the “water treated (WT)” to “waste produced (WP)” ratio (WT/WP V/V) is between 80 and 347 depending on the initial salt content. For example, the WT/WP ratio for seawater is 236 or 1L of waste for every 236 L of treated water.
5. Summary and Discussion
Two different but similar pilot reactors were constructed and operated in several extended runs using different levels of Na and Cl to determine [1] removal efficiencies for each type of water, [2] required dosages of nano media to effect 80% salt removal, [3] to assess the overall ability of the systems to continuously produce the same effluent quality, [4] determine characteristics of the process in terms of solids removal, and [5] provide confirmation of the removal via solids mass balance. The results of the study indicated that:
Salt removal was dependent on media dose in a linear manner, with low salt content water (20 to 31 mS) requiring 10 g of per 100L of water, medium level salt (seawater 41 mS) requiring 16 g/100 L and high salt (>130 mS) requiring 41 g/100L). The resultant dosing chart can be used to predetermine the nano sluury required based on the EC of the water (dose (g) = 0.2926(EC) + 2.101).
The pH of the influent water was also found to be a critical factor in removal efficiency. If the influent water pH is less than 6.5, removal efficiency was only 50%, but if pH increased to 7 or higher removal efficiencies were always 70% or greater. The easiest solution for low pH waters would be to add a dose of potassium bicarbonate or other neutralizing agent to the influent to raise pH to 7 or above. The amount required can be determined simply by titration with a known amount of neutralizing material to be used.
The extended runs showed that the pilot systems were capable of producing lower salt water (70–80% less salt) throughout the duration of each run. Typical variation was less than 10% except where a single equipment malfunction occurred.
The reactor design using 5 separate reactors in a series appears to be a possible precursor to a full scale system but other designs are possible. One of the reasons for the multiple reactors was to allow the solids to accumulate across all reactors rather than a single one which could require frequent stoppages for solids removal. The solids measured in each reactor showed that most of the solids were removed uniformly in Reactors 2 through 4 with Reactor accumulating the most (about 40% of the total). The next generation of reactors will have a vacuum line at the bottom of the reactors such that solids can be removed on a predetermined cycle or cone bottom tanks can be employed for rapid solids removal. While solids accumulation Reactor 1 was high, the amount of salt removed in Reactor 1 was not high suggesting that solids in Reactor 1 may contain a considerable amount of unreacted media. This could be due to the manner in which the nano slurry is added: the nano slurry pump outlet is fed into the water inlet line and is forced to the bottom of the reactor with the water. Thus some of the nano media may never be able to circulate up through the reactor with the incoming water. Testing is underway to determine if different placement of the feed line could improve the distribution of the nano slurry in Reactor 1.
References
- D. O’Carroll, B. Sleep, M. Krol, H. Buparai, C. Kokur. Nanoscale Zero Valent Iron and Bimetallic Particles for contaminated site remediation. 51 (2013) Adv. Water Resour. Pp 104-122. [CrossRef]
- F. Kausar, A. Bagheri, T. Rasheed, M. Bilal, K. Rizwan, T.A. Nguyen, H.M.N. Iqubal. Ch7 Nanomaterials for Removal of Heavy Metals from Wastewater. 2022 In: Nano-Biosorbents for Decontamination of Water, Air, and Soil Pollution. Elsevier 2022 pages 135-161. [CrossRef]
- Y. Han, W. Yan. Reductive Dechlorination of Trichloroethene by Zero Valent iron Nanoparticles: Reactivity Enhancement Through Sulfidation Treatment. 2016 50(23) pp 12992-13001. Envirom. Sci. Technol. [CrossRef]
- M. Sudeep, V. Moses. Nanotechnology and Heavy Metal Removal in Waste Water Treatment: A Review. 2018. AIP Proceedings. P 020067. [CrossRef]
- D. Tiwari. Applications of Nanoparticles in Waste Water Treatment. 2008. World Applied Sciences Journal. 3(3) pp 417-433. [CrossRef]
- V. Vijayageetha, V. Annamalai, A. Pandiarajan, M. Dheenadayalan. A Study on the Nanotechnology in water and Waste Water Treatment. 2018. Journal of Applied Physics. 10 (4) pp 28-31. [CrossRef]
- D. Lu, Q. Liu, T. Zhang, Y. Cai, Y. Yin, G. Giang. Stable Silver isotope Fractionation in the Natural Process of Silver Nanoparticles. 2016. Nat. Nanotechnology. 11(8) pp 682-686. [CrossRef]
- T. Pasinszki, M. Krebsz. Synthesis and Application of Nanoparticles in Water Treatment, Environmental Remediation, Catalysis and Their Biological Effects. 2020 Nanomaterials. 10(5) pp 917-931. [CrossRef]
- D.D.J Antia. Feo Desalination: Catalytic Partial Desalination of Saline Aquifers. 2018 Applied Water Science (8) pp 71. [CrossRef]
- D.D.J. Antia. Provision of Desalinated Irrigation Water by the Desalination of Groundwater Abstracted from a Saline Aquifer. 2022. Hydrology (9) pp 128. [CrossRef]
- W.J. Walker. Treatment of Saline irrigation Water Using a Sulfate Reducing Bioreactor Coupled with an Iron Based Desalination Reactor. 2023. Water 15(12) p 11. [CrossRef]
- T. Hiemstra, J. Mendez, J.Li. Evolution of Reactive Surface Area of ferrihydrite: time, pH, and temperature dependency of growth by Ostwald ripening. 2019. Environmental Science:Nano (6) pp 820-833. [CrossRef]
- D.D.J. Antia. ZVI (Feo) Desalination: Stability of product Water. 2016. Resources. P 47. [CrossRef]
- Y. Huang, D. Kim, H.S. Shin. Inhibition o Nitrate Reduction by NaCl Adsorption on a Zero Valent Iron Surface During Concentrate Treatment for Water Reuse. 2015. Environ Technol. 36 pp 1178-1187. [CrossRef]
- D.D.J. Antia. Desalination of Groundwater and Impoundments Using Nano-Zero Valent Iron (Feo). [CrossRef]
- M. Kang and R. Jackson. Salinity of Deep Groundwater In California: Water Quantity, Quality and Protection. 2016. PNAS 113(28) pp 7768-7773. [CrossRef]
- G. Thyne. Produced Water Chemistry in Petroleum Basins. 2017. ESal Engineering Salinity.
- D.D.J. Antia. Desalination of Irrigation Water Using Metal Polymers. 2022. Water. 14 p 3224. [CrossRef]
Figure 1.
Drawing of Generation 1 Pilot system.
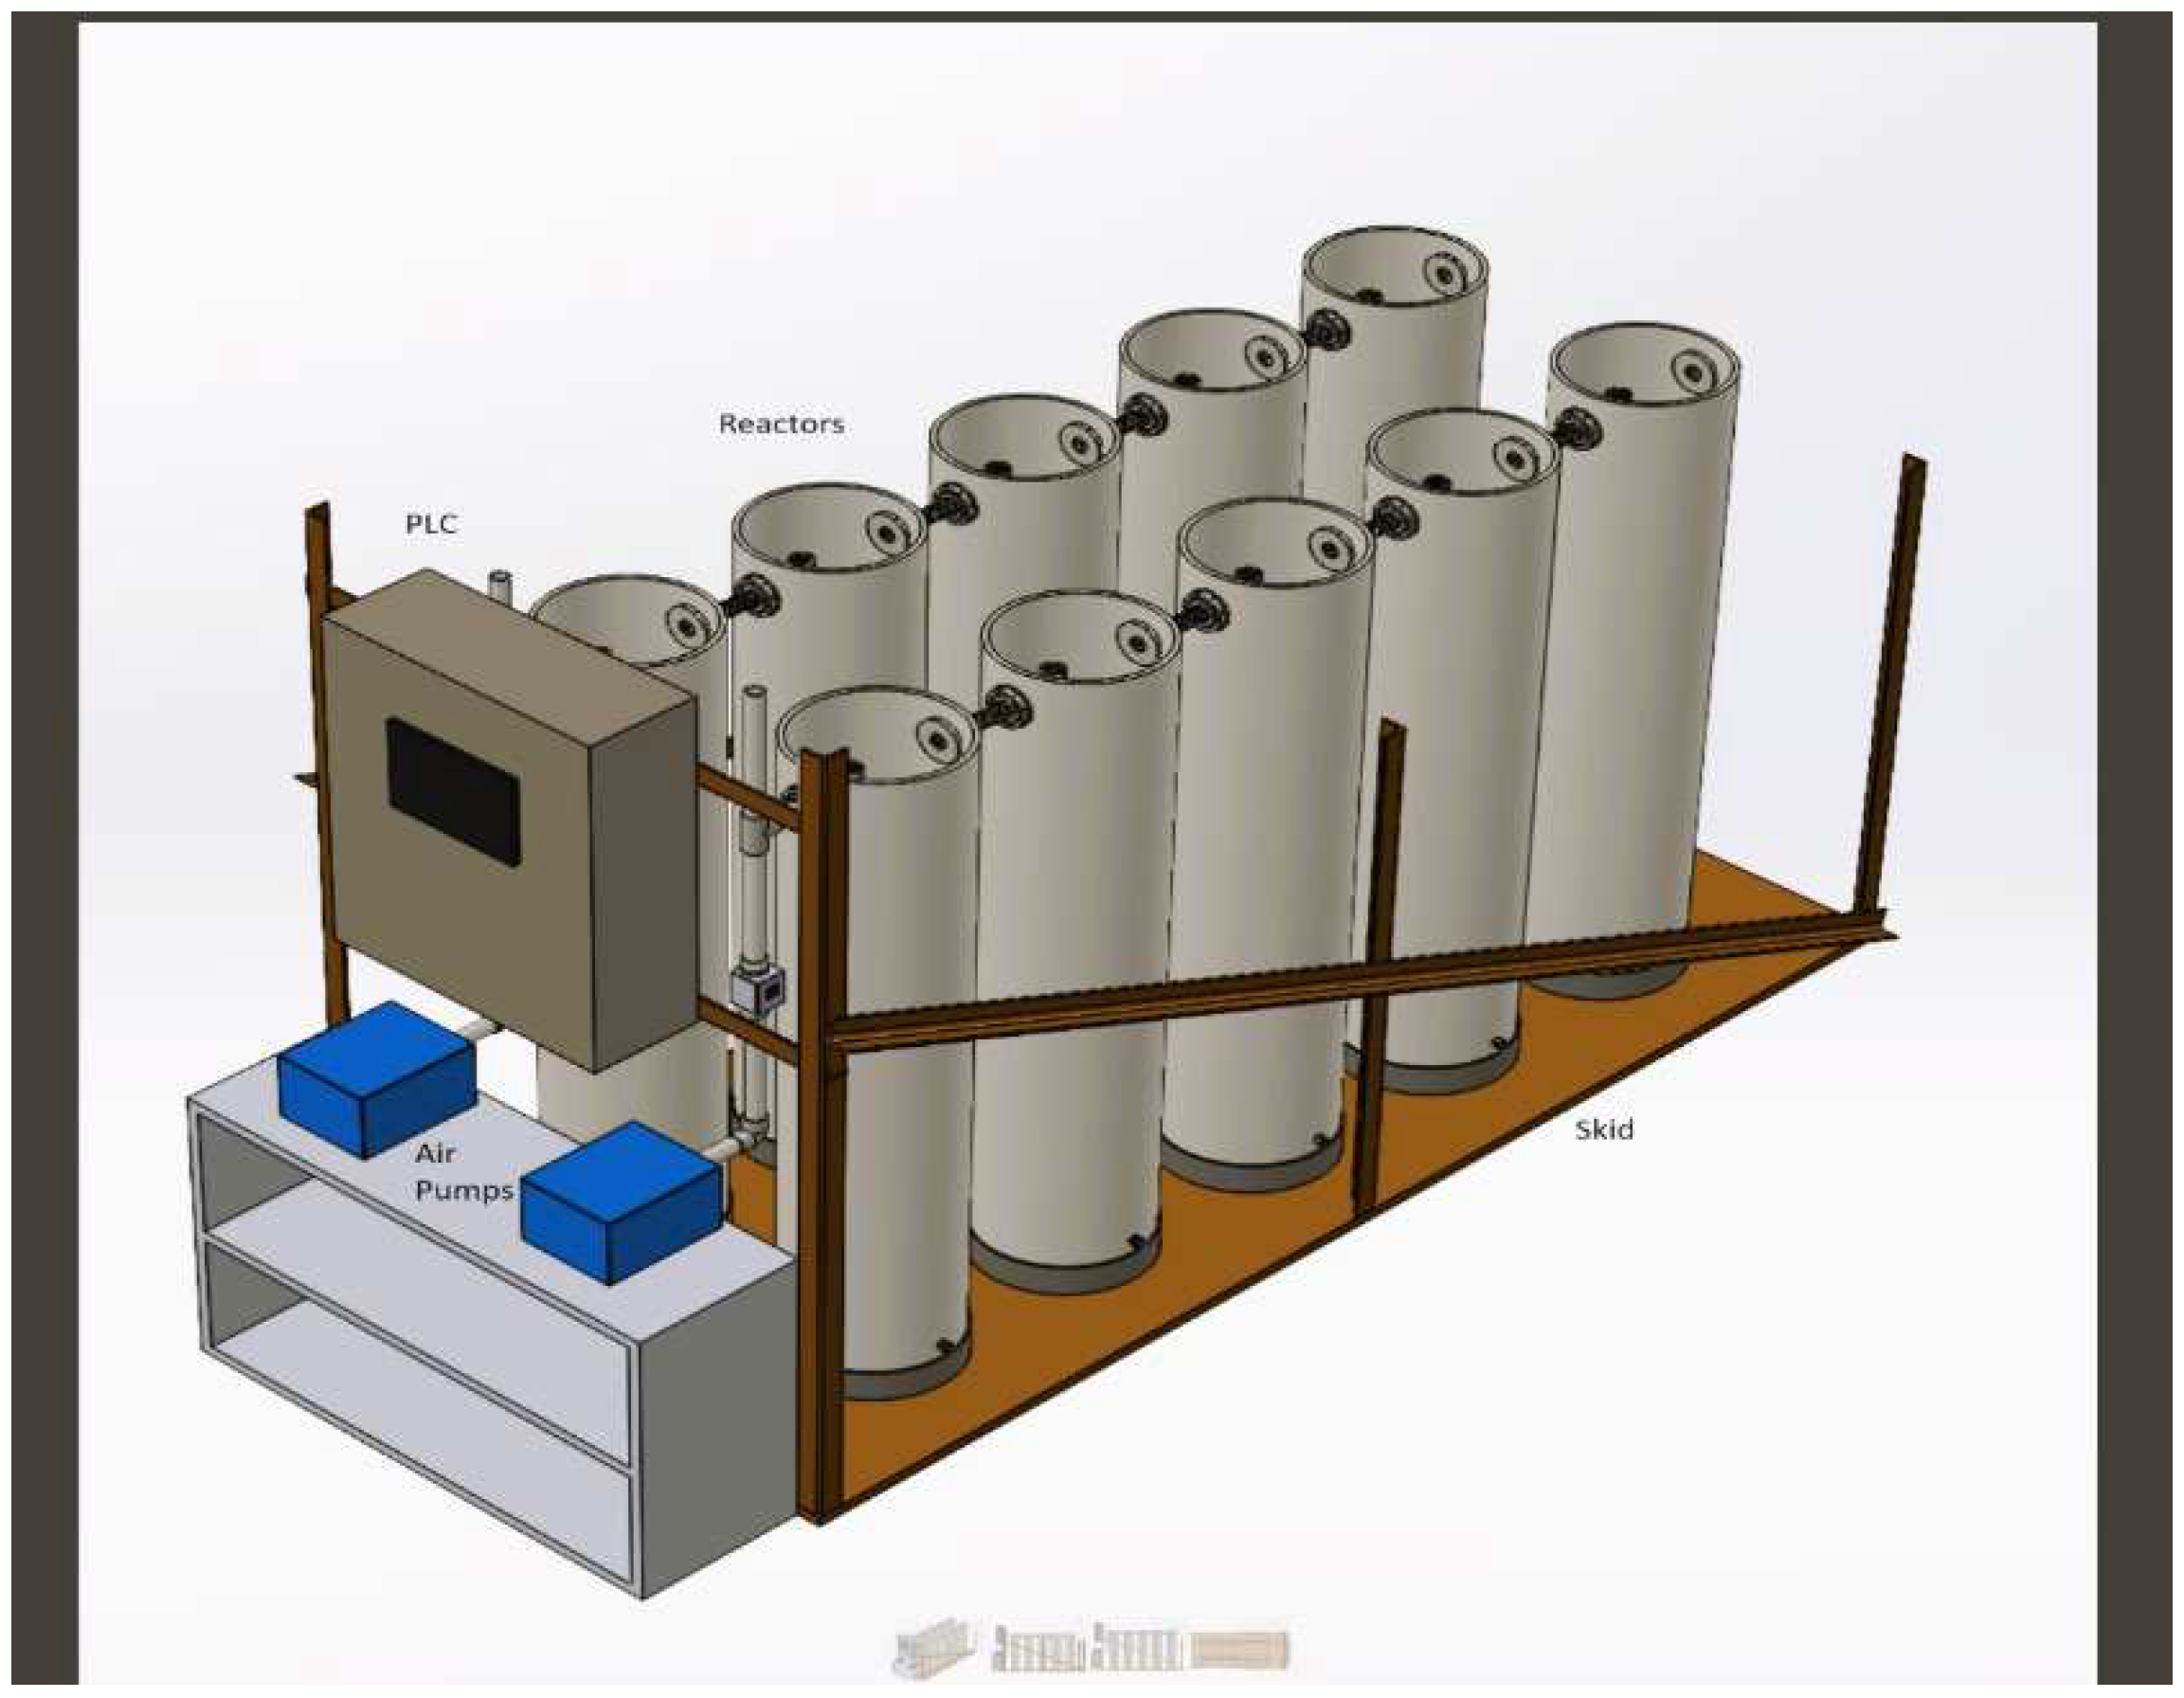
Figure 2.
The Generation 1 pilot system looking down the row of reactors in Line 2 showing the air manifold and delivery lines. All processing is controlled via a PLC.
Figure 2.
The Generation 1 pilot system looking down the row of reactors in Line 2 showing the air manifold and delivery lines. All processing is controlled via a PLC.
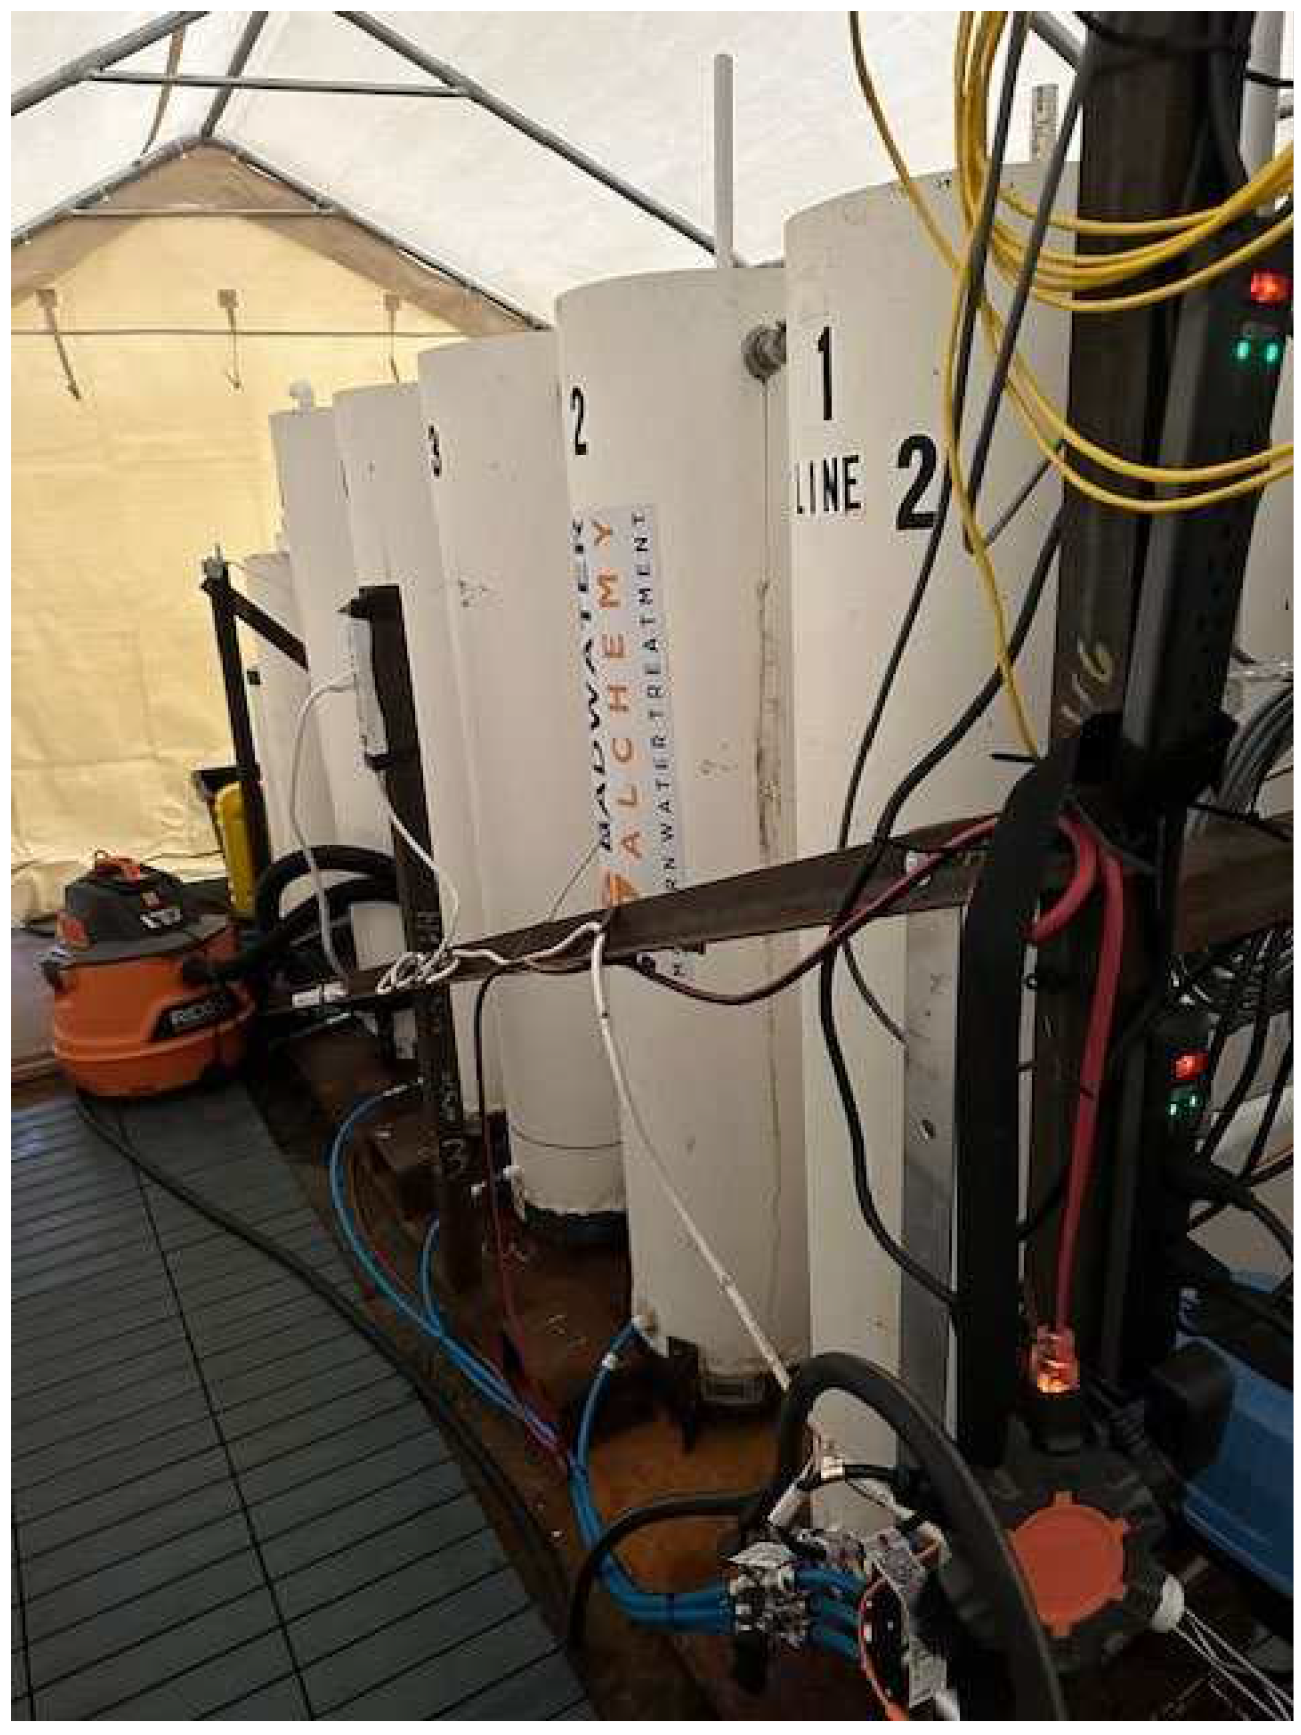
Figure 3.
Drawing of Generation 2 Pilot showing basic system components: influent and effluent water flow, air flow, media pumps. EC, pH, Eh and Cl monitored in real time. The light blue pumps at the end of the system are the air pumps and the peristaltic pump delivering influent water is the darker blue box on the front lower rack.
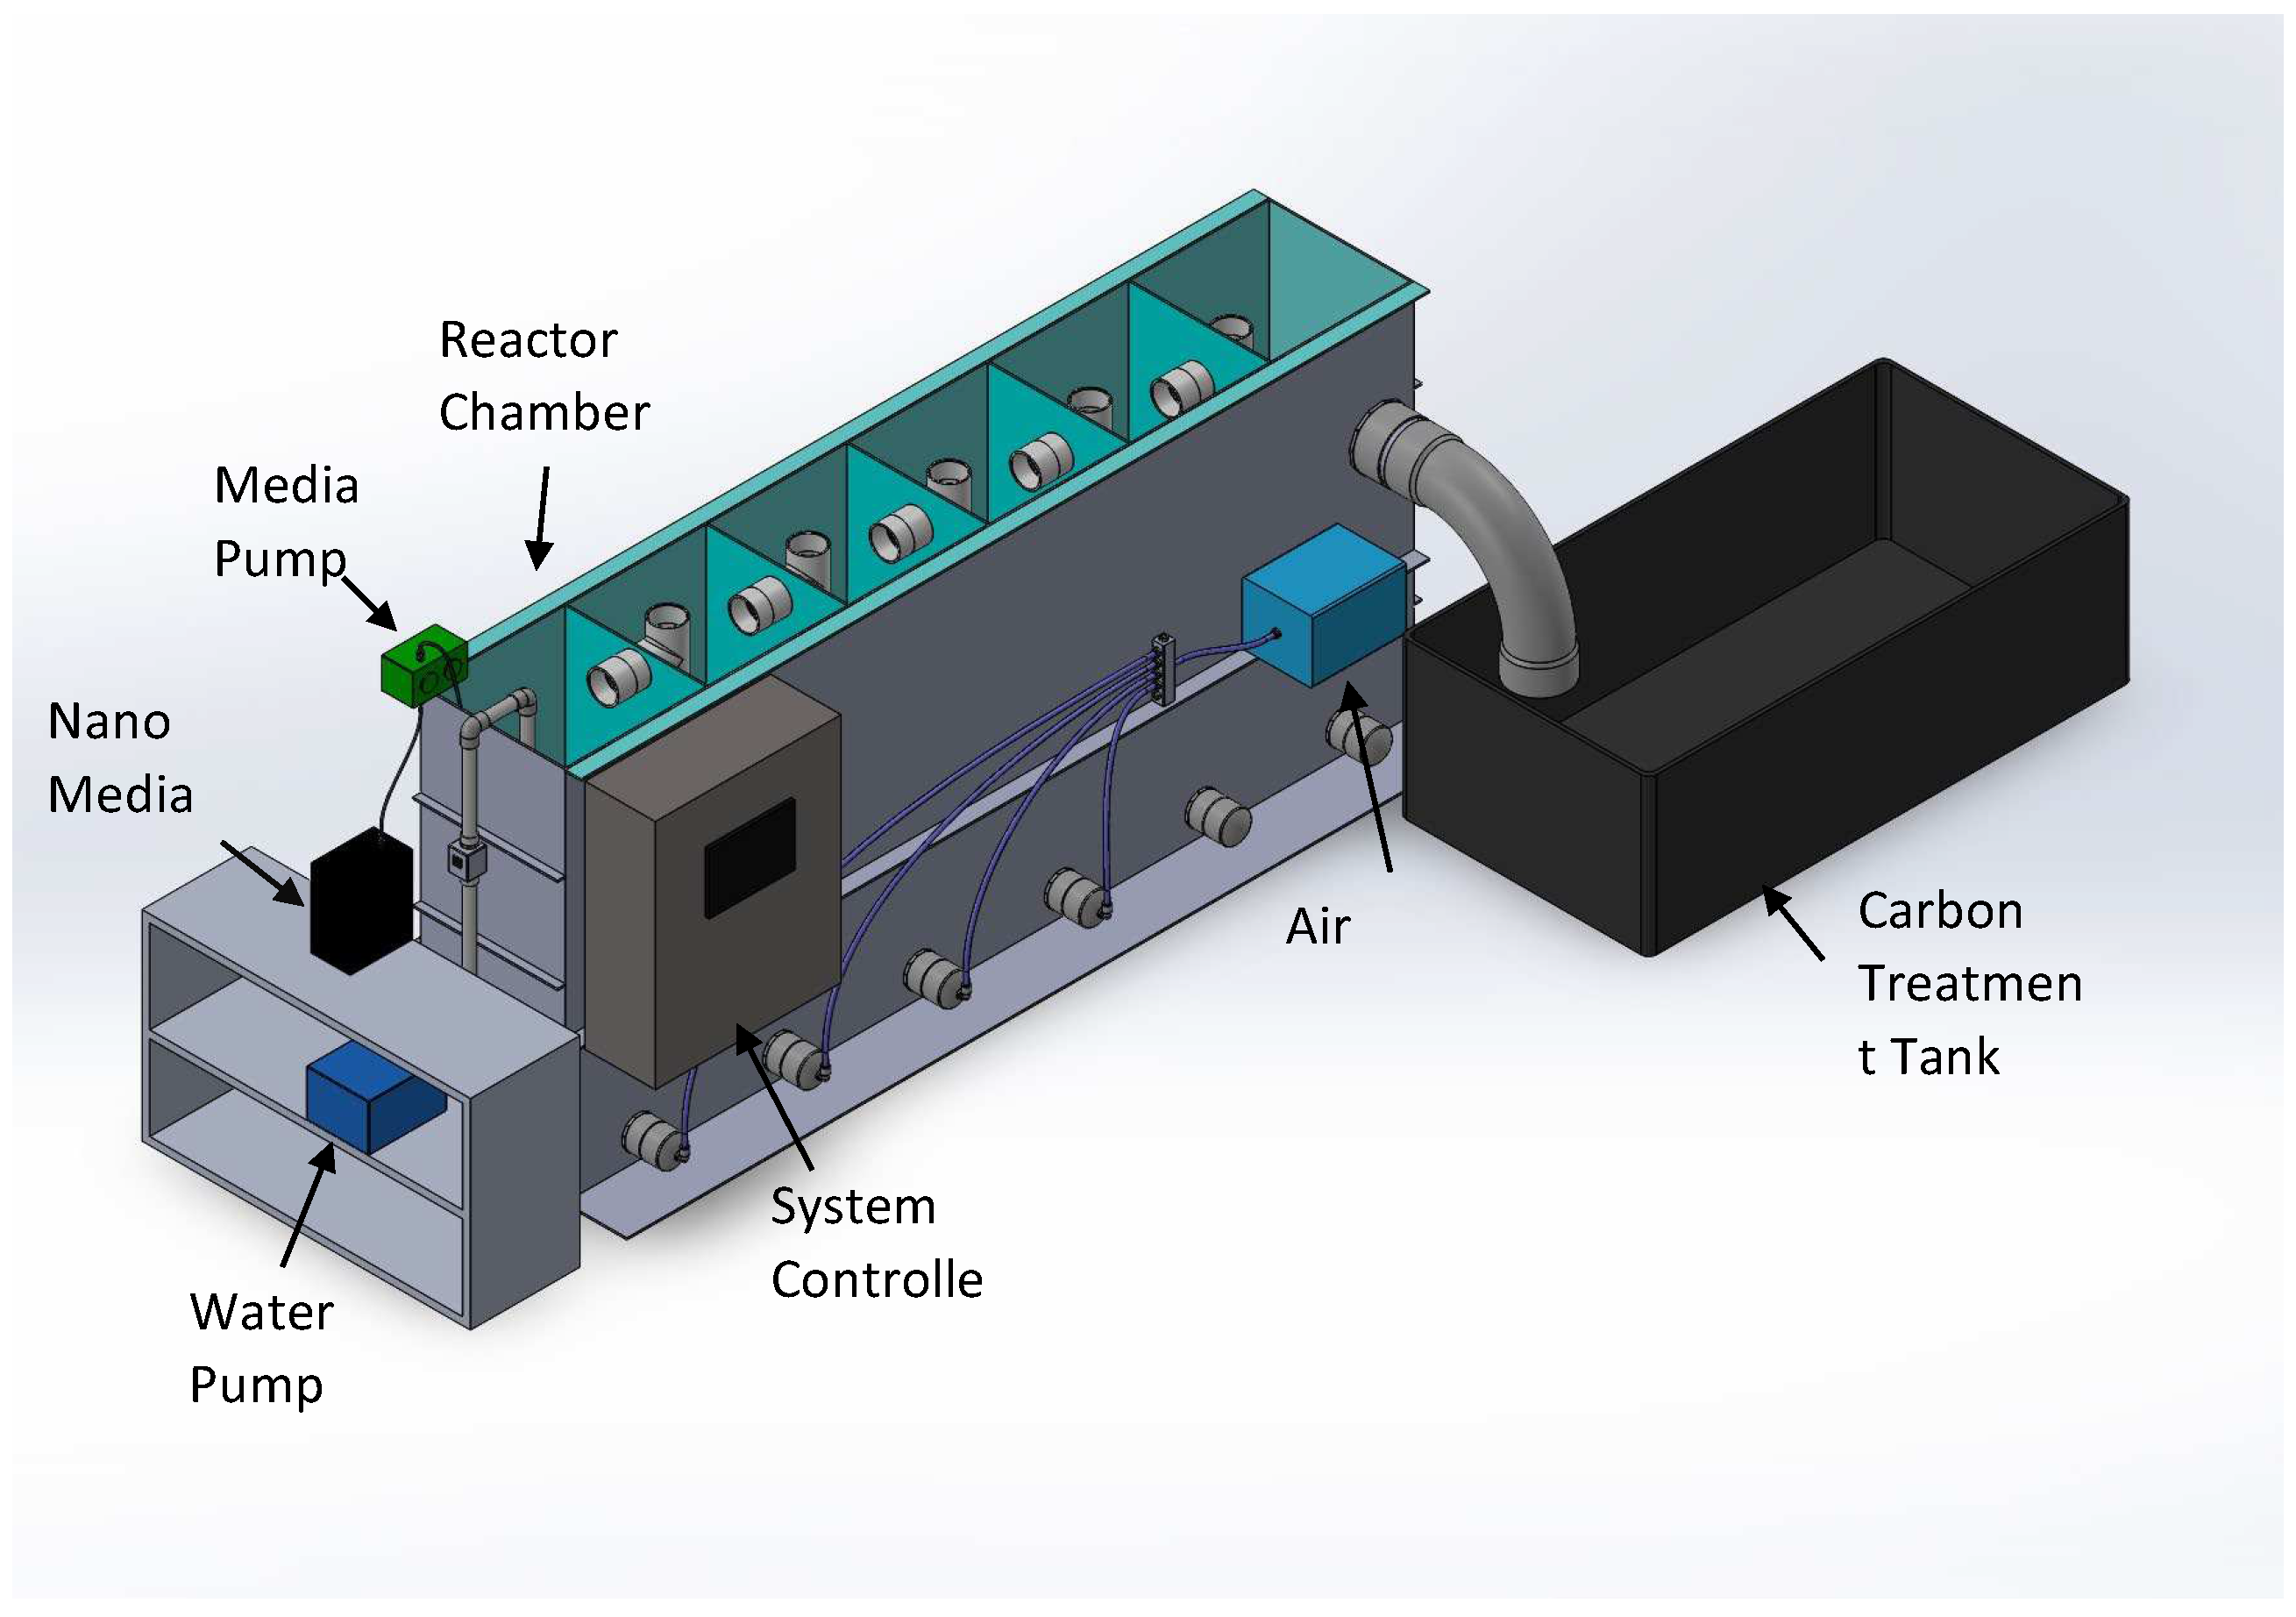
Figure 4.
Generation 2 reactor looking towards the water delivery end of the pilot. The 3000-gallon tank in the background is used to fill and transport seater from Puget Sound.
Figure 4.
Generation 2 reactor looking towards the water delivery end of the pilot. The 3000-gallon tank in the background is used to fill and transport seater from Puget Sound.
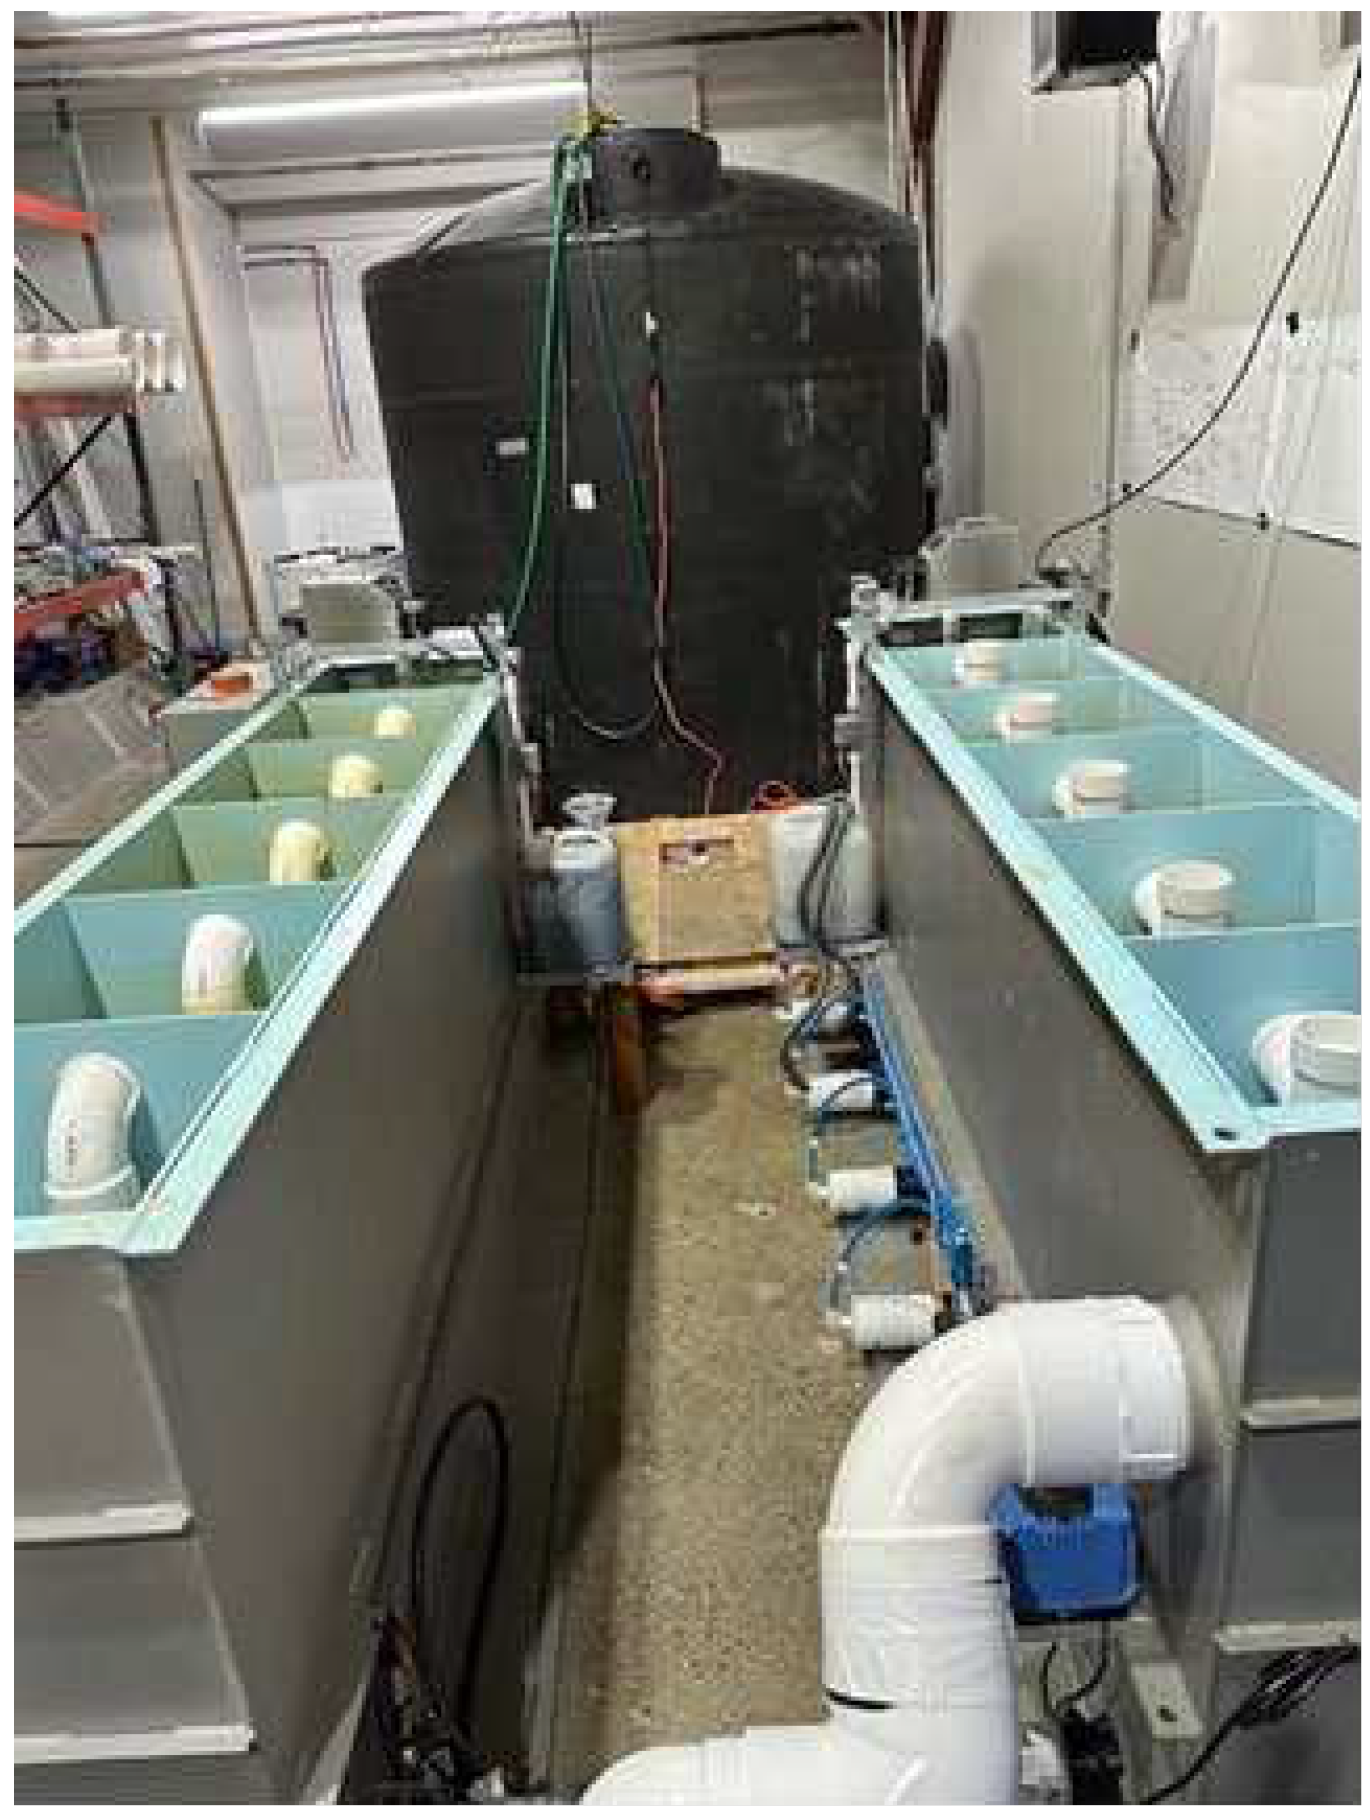
Figure 5.
Generation 2 Pilot side view and system PLC. The media pumps sit atop the first reactor cell in each line.
Figure 5.
Generation 2 Pilot side view and system PLC. The media pumps sit atop the first reactor cell in each line.
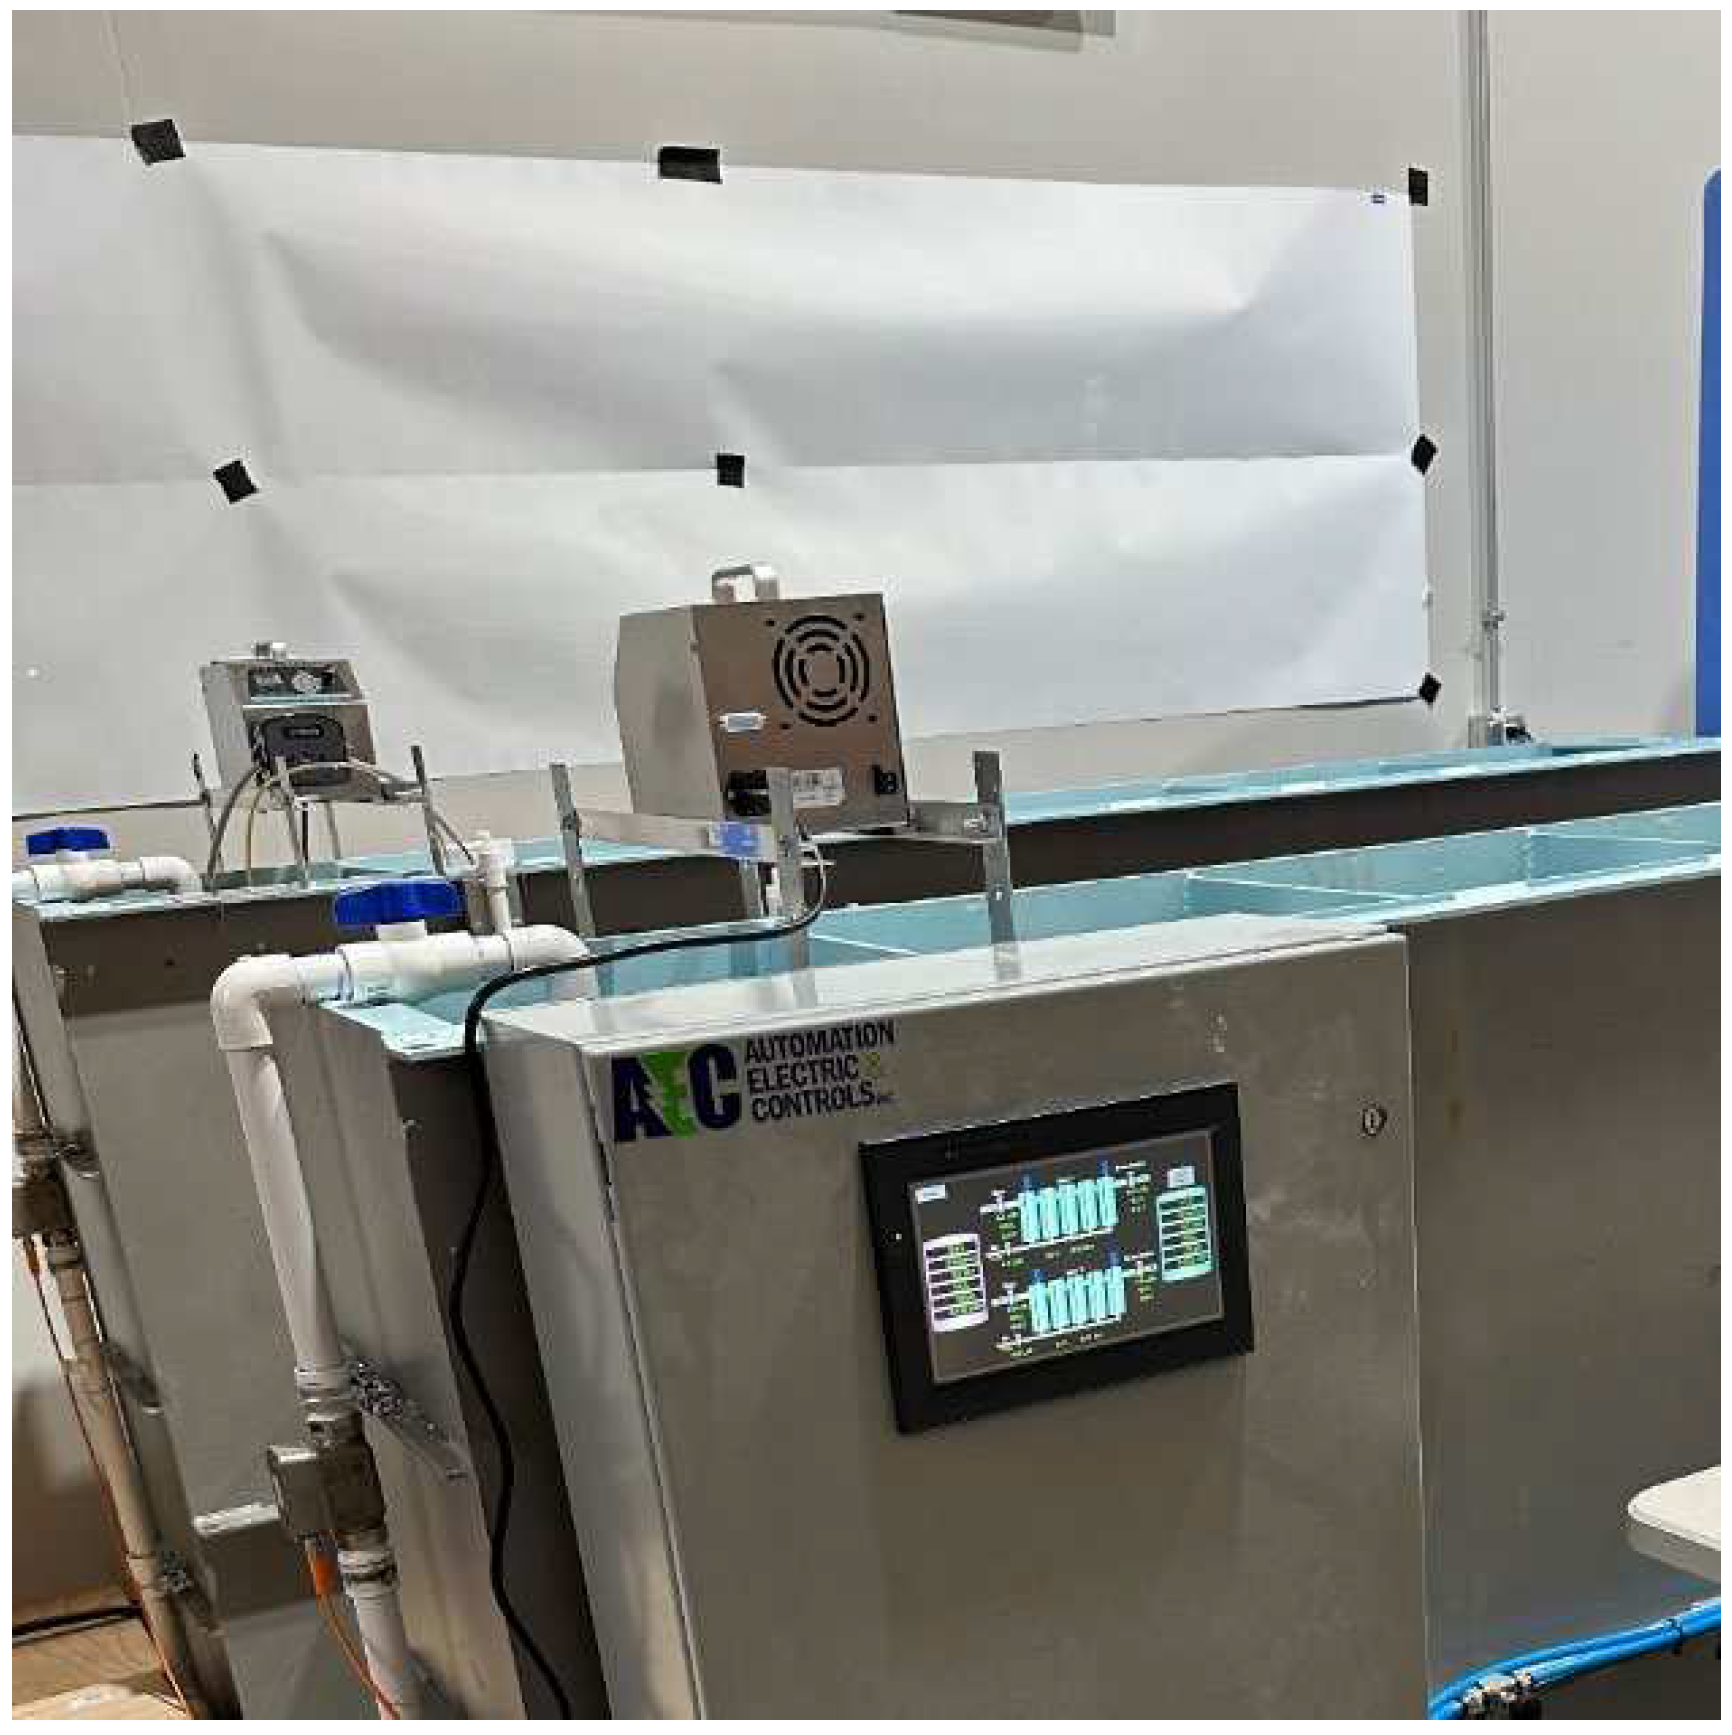
Figure 6.
Dose Curve for Desalination of Different Water Types.
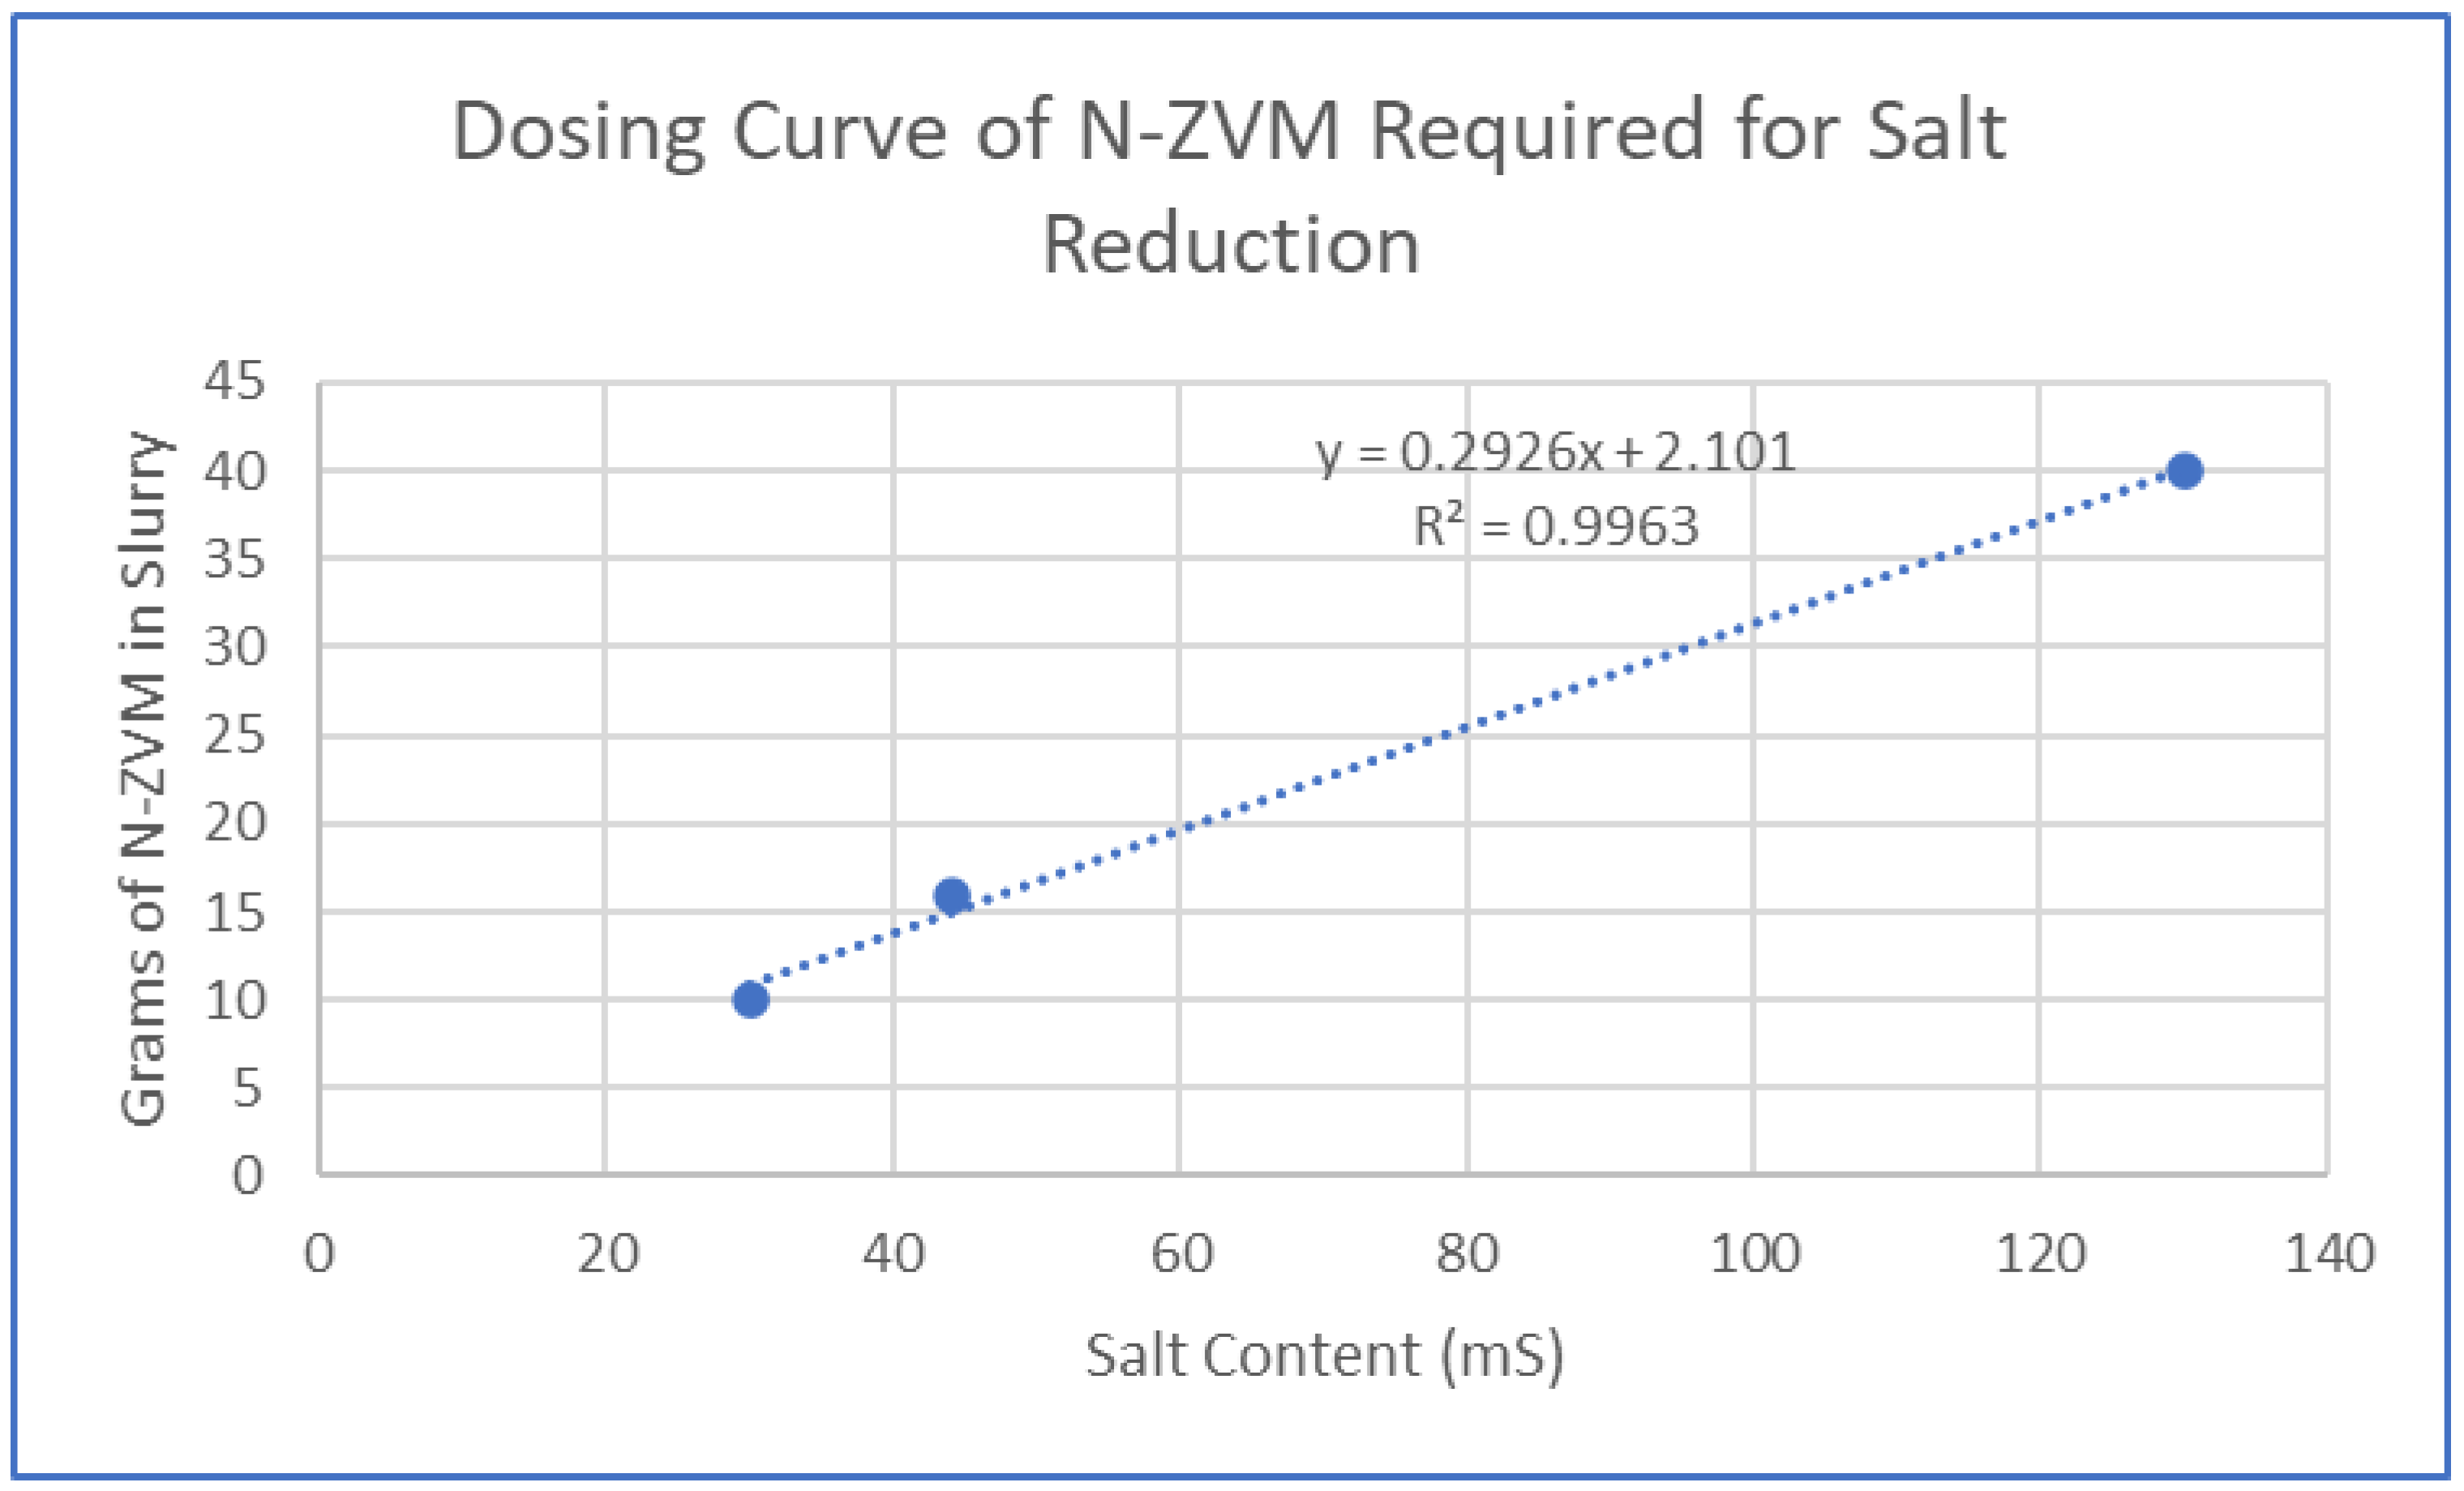
Figure 7.
Cl and Na removal during sweater desalination run using Generation 1 reactor,.
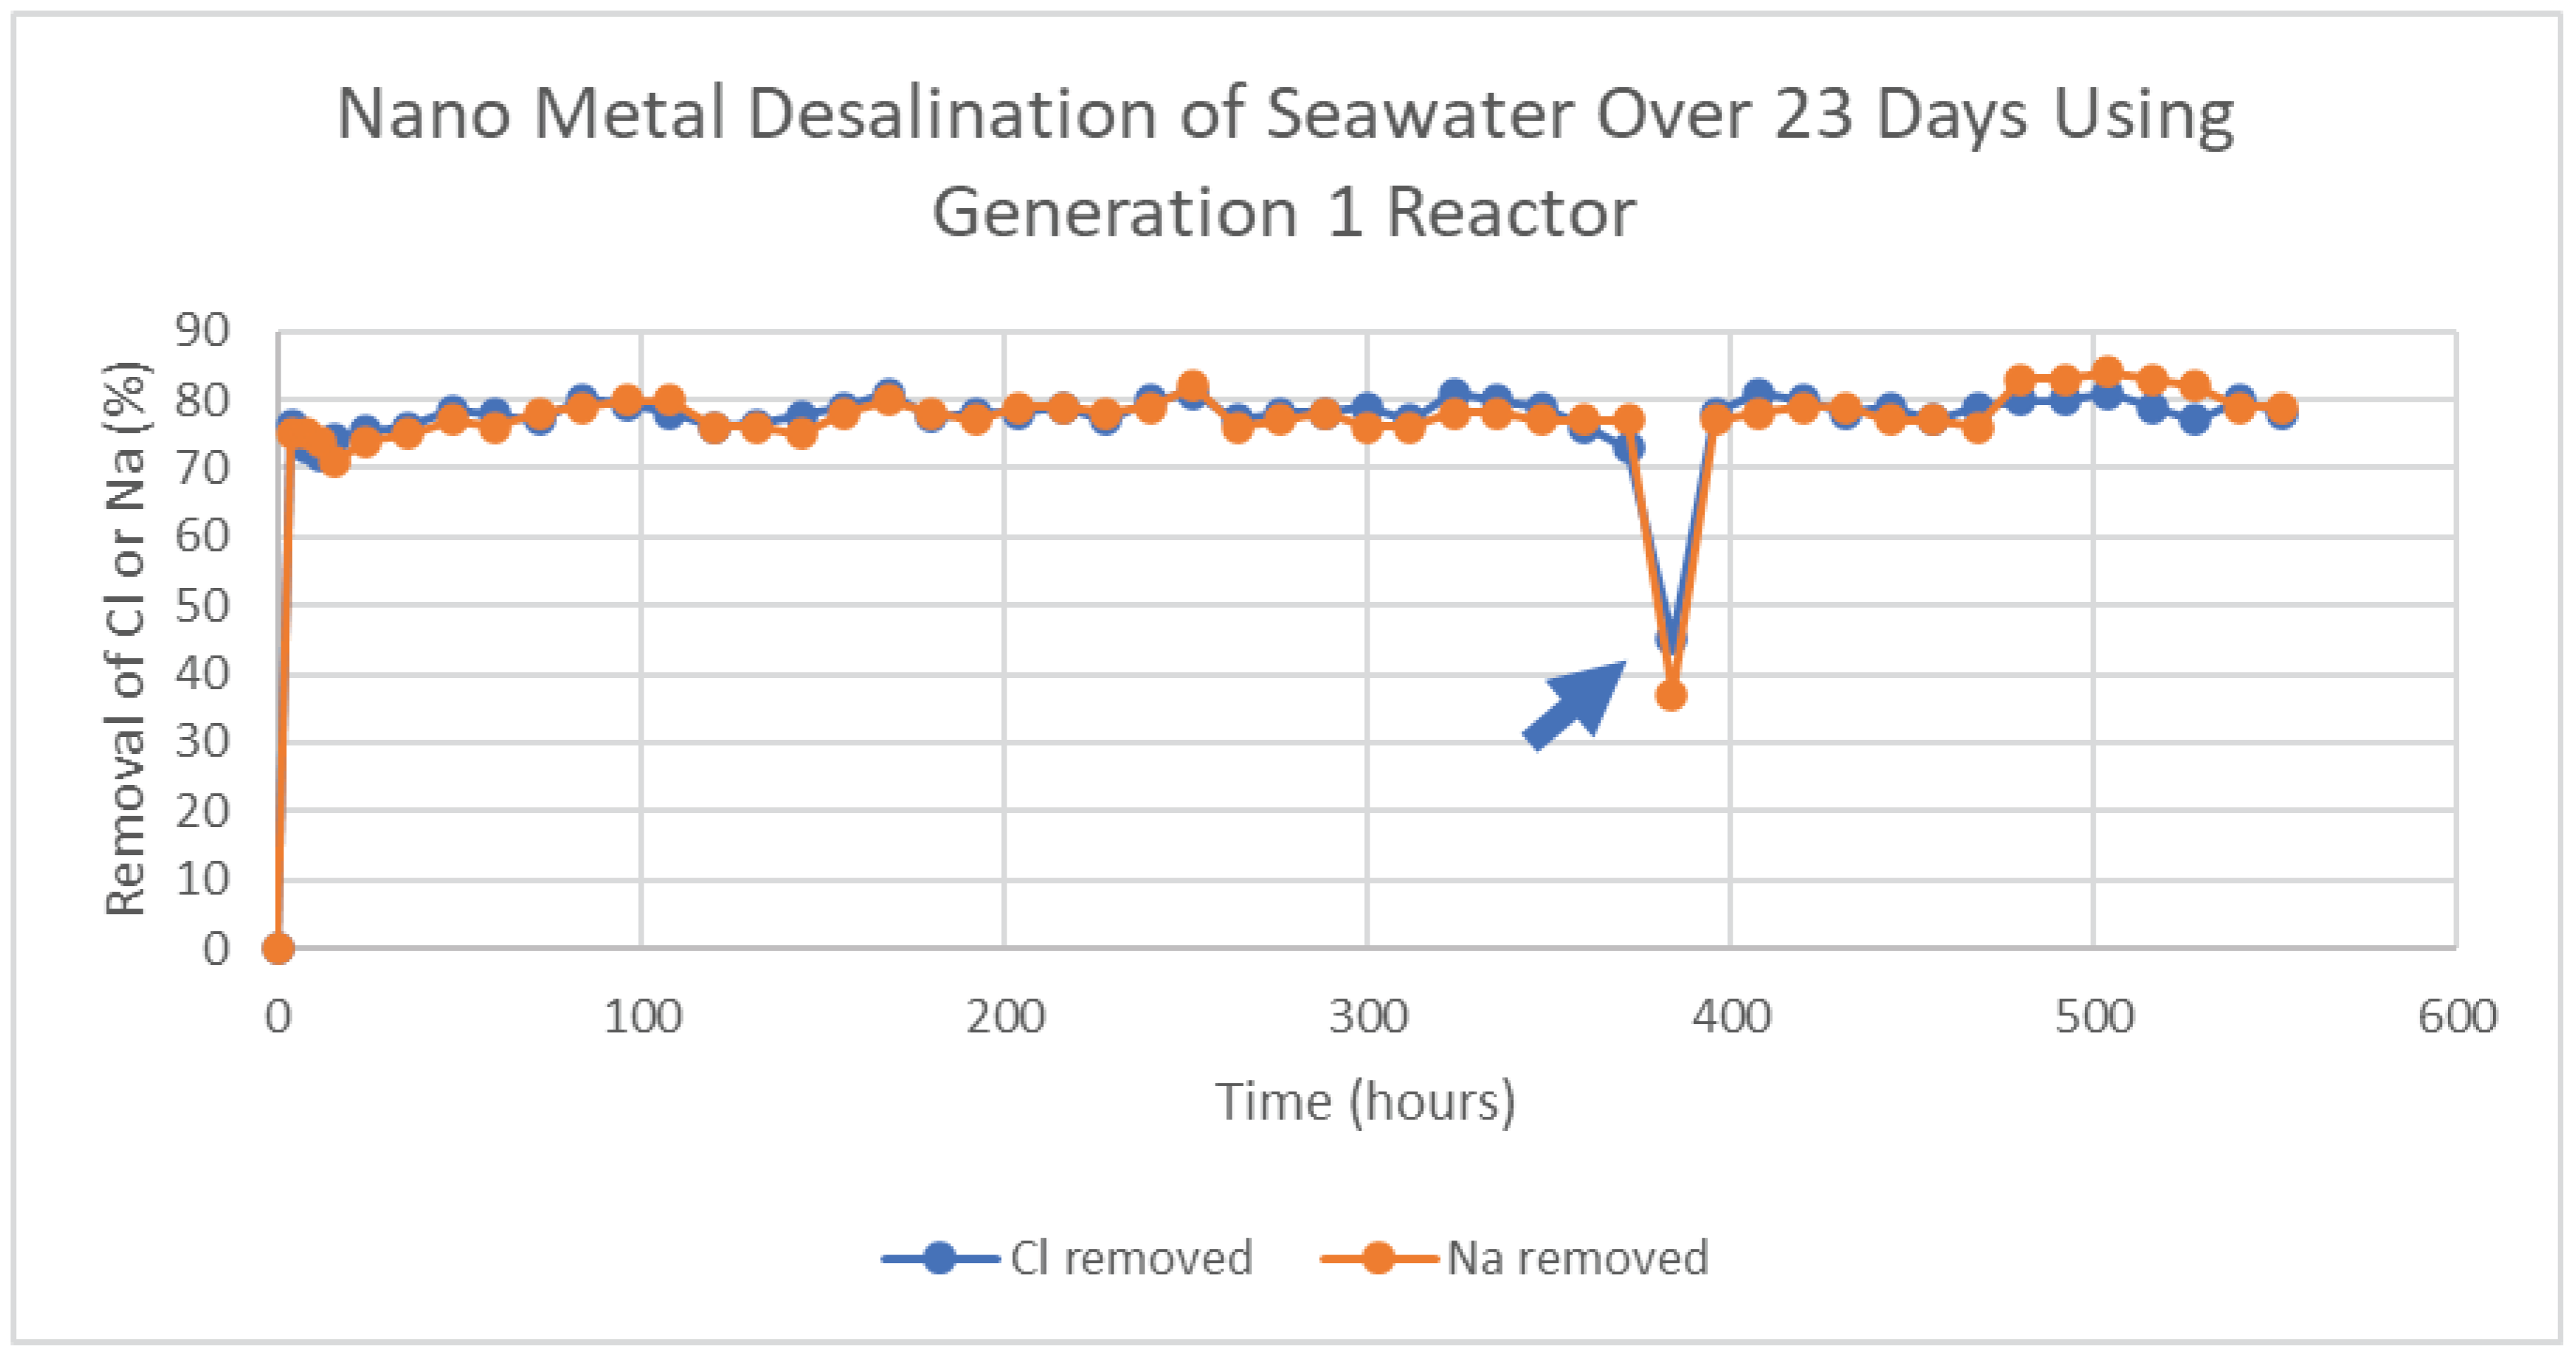
Figure 8.
Cl remaining in solution during the extended seawater run.
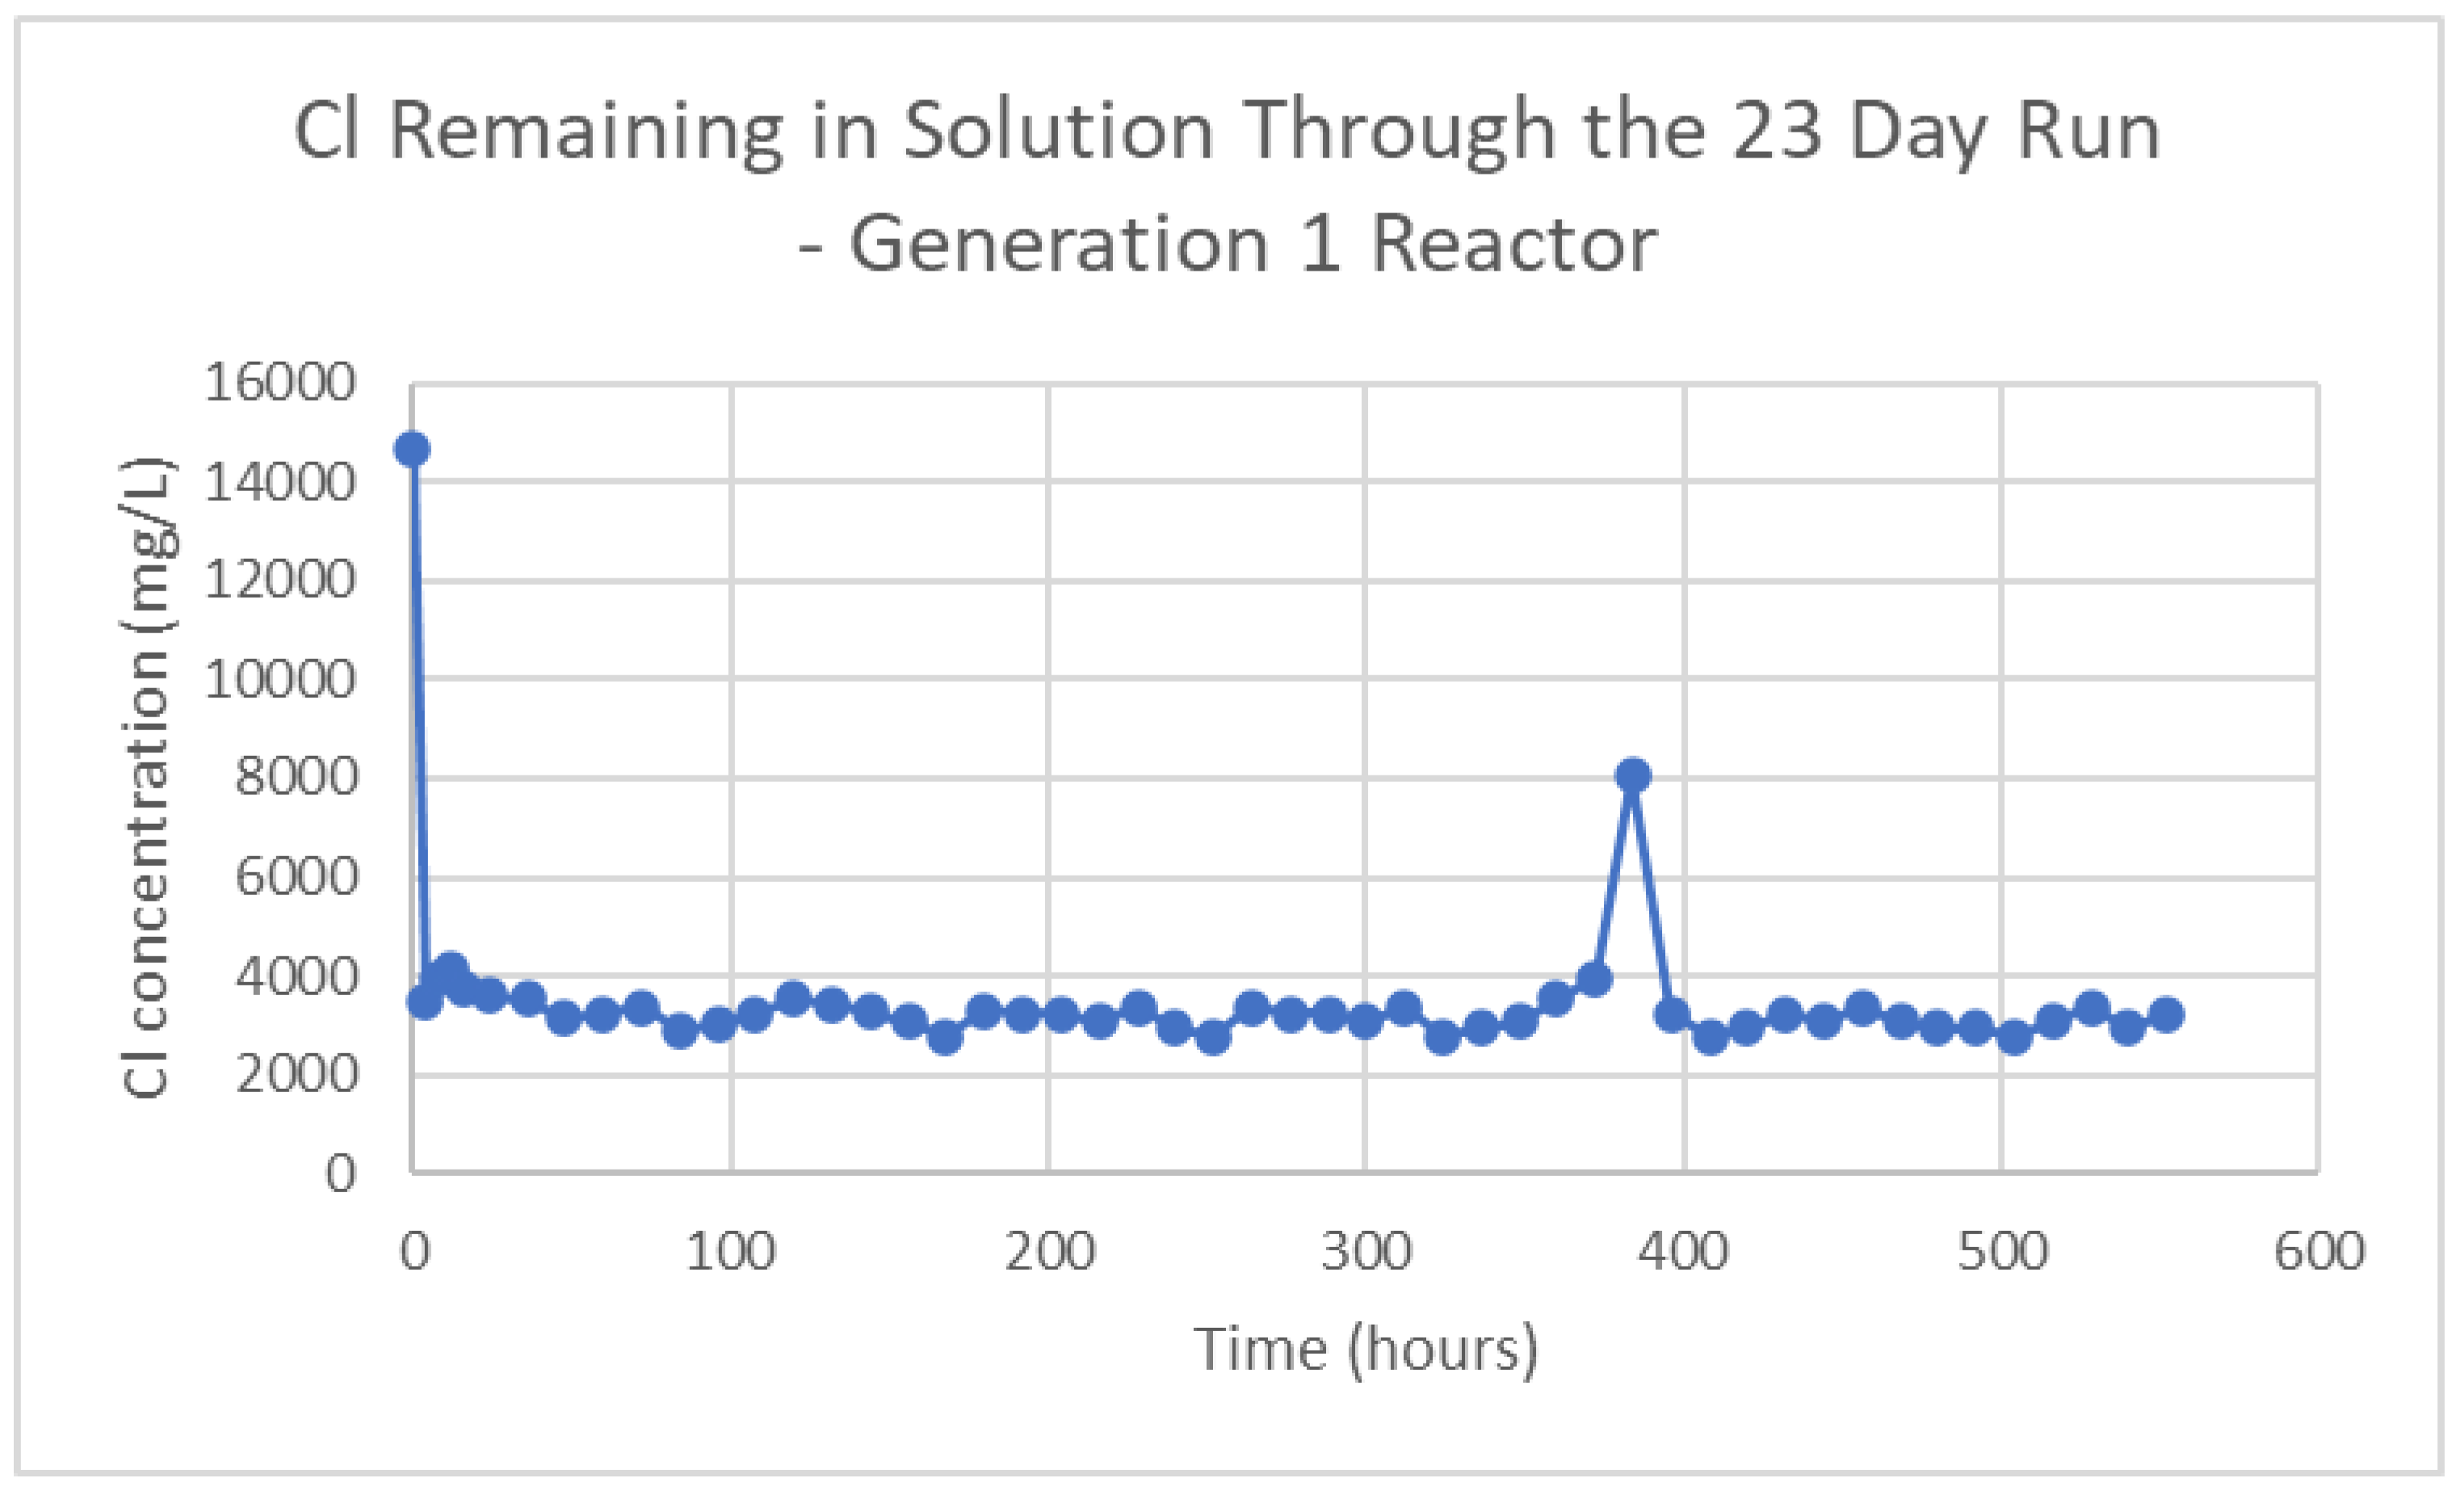
Figure 9.
Effect of Reactor pH on Pilot Plant Efficiency Expressed as Salt Reduction (percent).
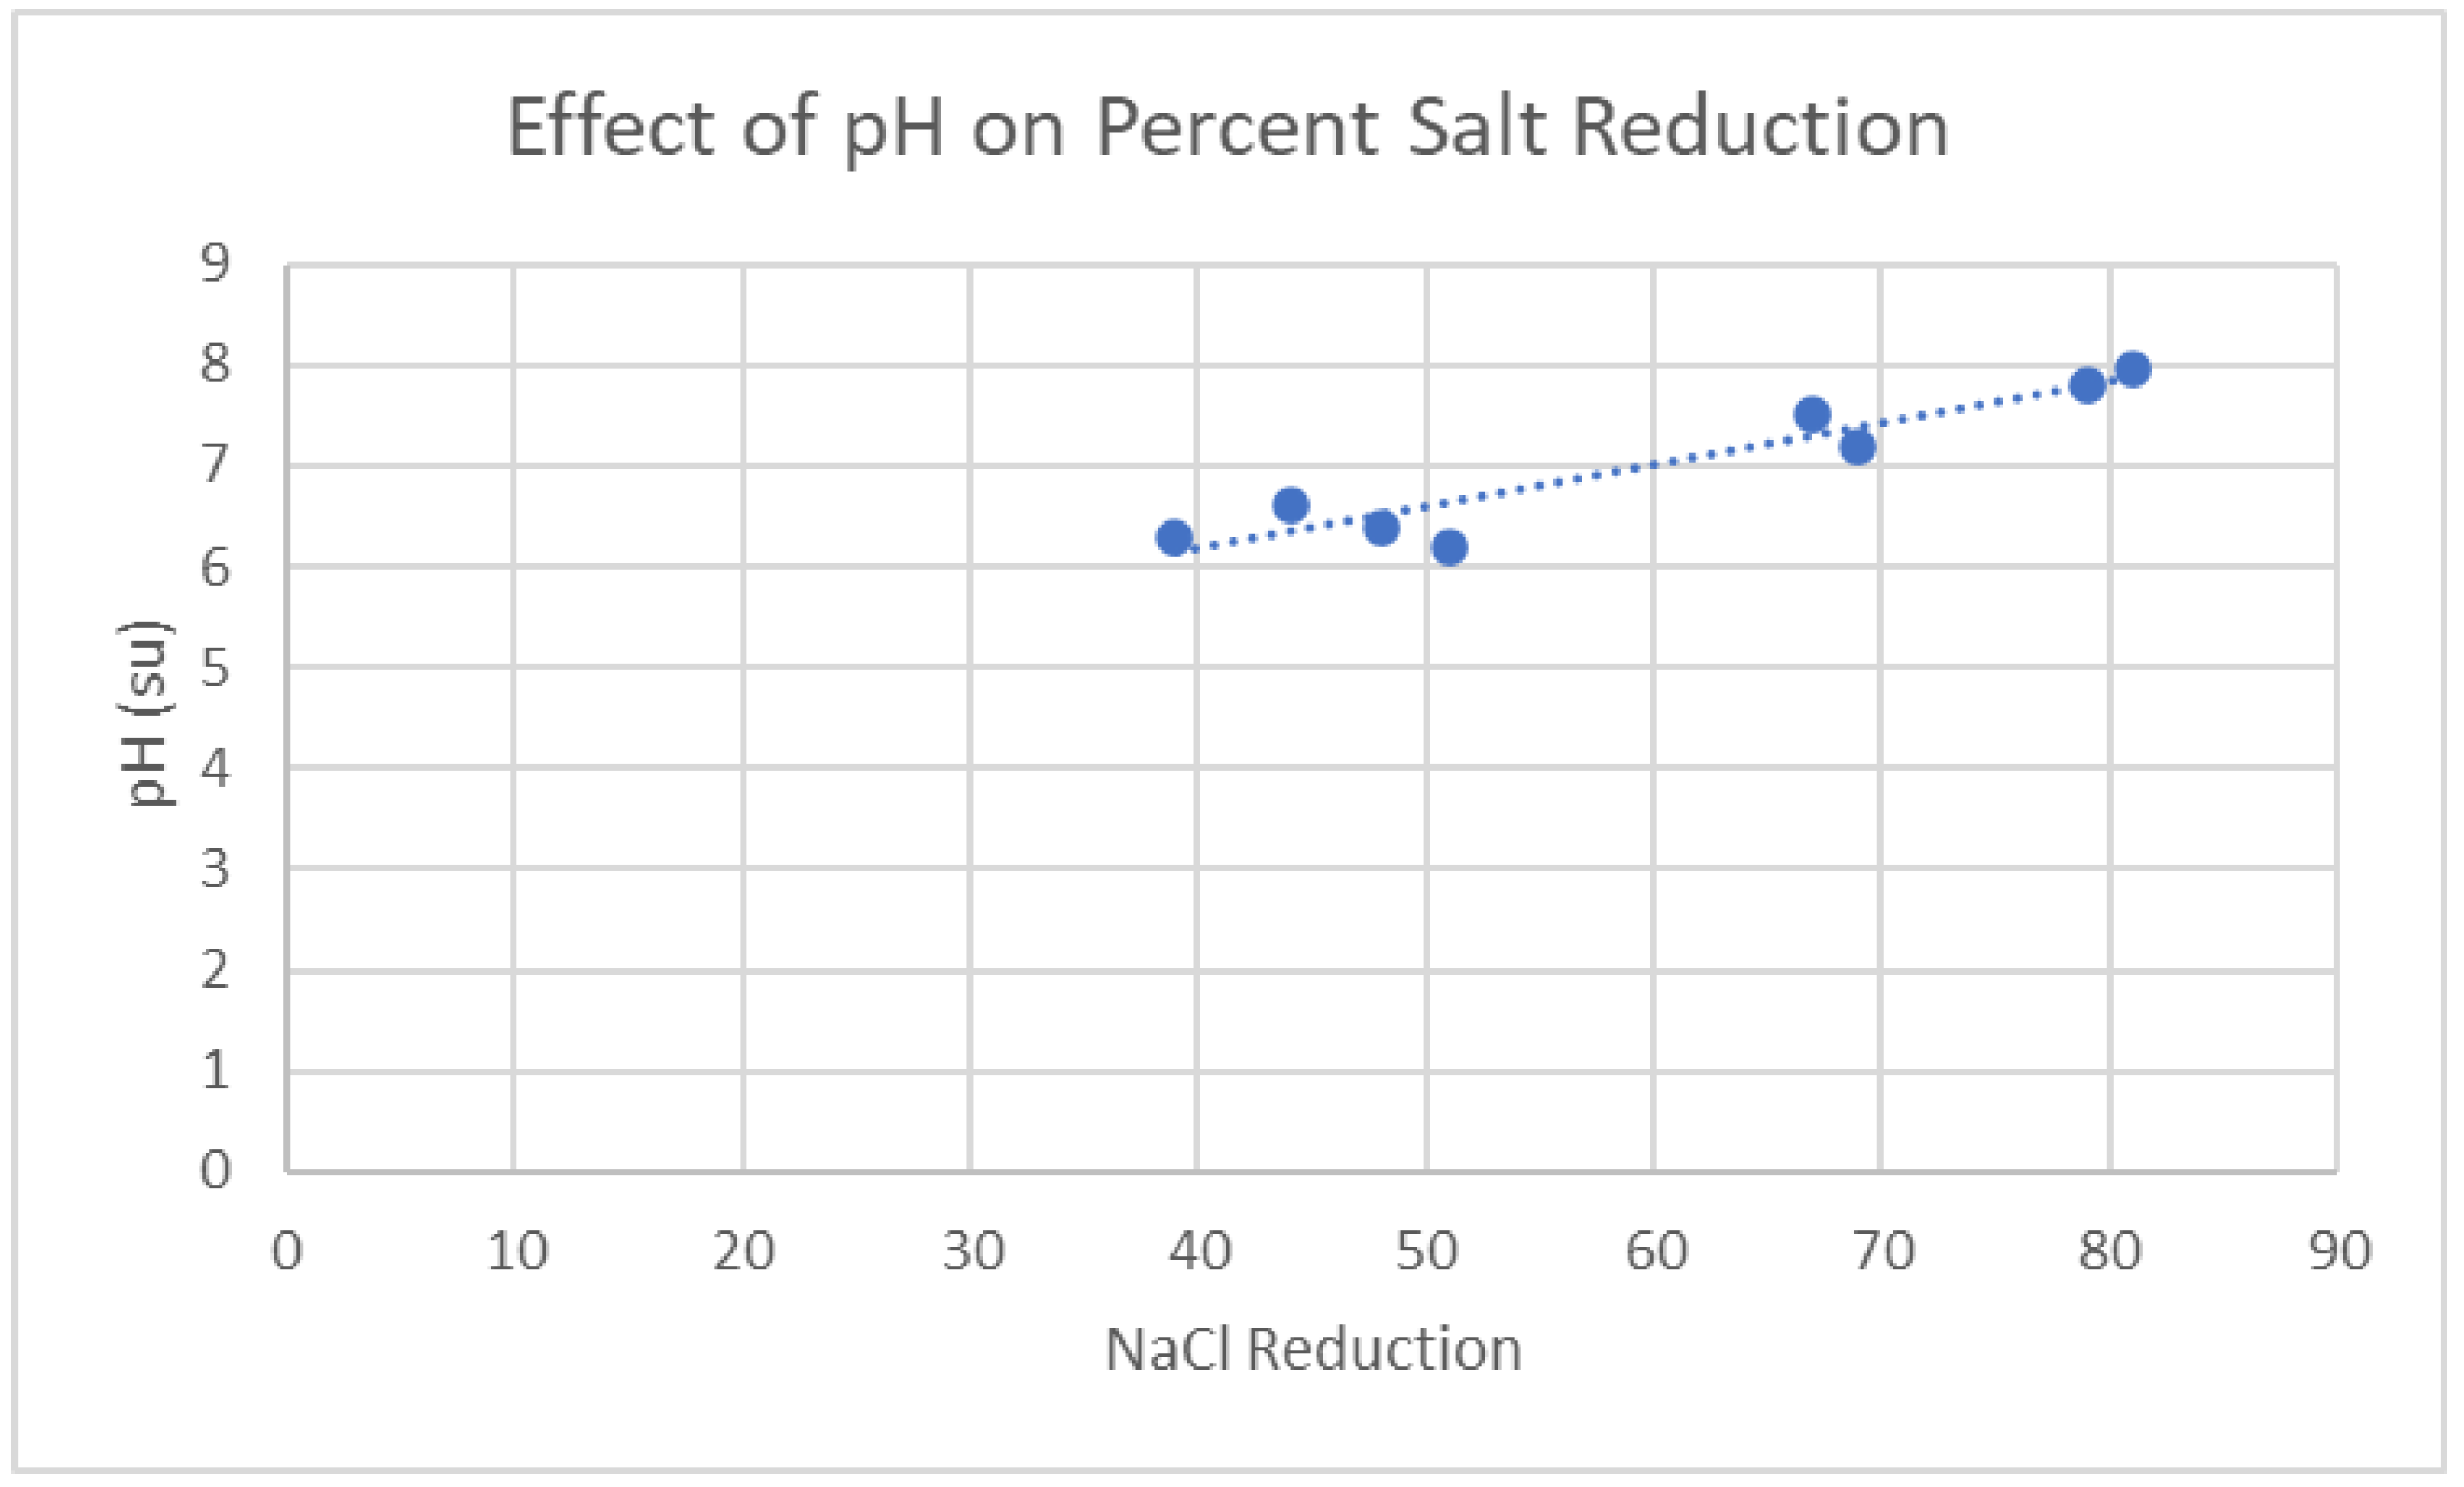
Table 1.
Composition of Different Waters Used in the Study.
| Analyte | Saline Irrigation Water [16] | Produced Water 1 [17] |
Synthetic Seawater | Seawater Puget Sound |
|---|---|---|---|---|
| Na * | 5800 | 26670 | 9766 | 8370 |
| Ca | 215 | 215 | 210 | 390 |
| Mg | 298 | 298 | 298 | 451 |
| K | 420 | 420 | 420 | 99 |
| Cl | 8800 | 40000 | 14650 | 12546 |
| SO4 | 2100 | 2100 | 2100 | 2900 |
| Alkalinity | 660 | 660 | 660 | 460 |
| pH ** | 8.2 | 8.4 | 8.3 | 8.2 |
| EC *** | 33 | 130 | 44 | 41 |
| TDS | 18293 | 70363 | 28109 | 21.1 |
* mg/L. ** standard units. *** mS.
Table 2.
Summary of Pilot Test Results.
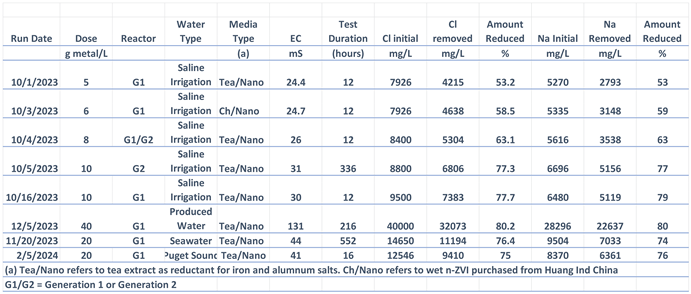
Table 3.
Effect of n-ZVM media on removal of other chemical constituents.
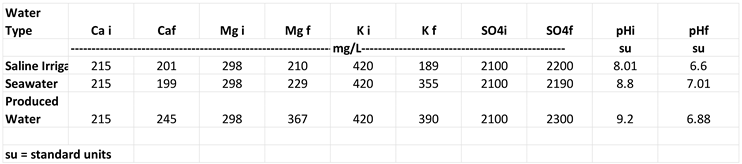
Subscript i = initial concentration. Subscript f = final concentration.
Disclaimer/Publisher’s Note: The statements, opinions and data contained in all publications are solely those of the individual author(s) and contributor(s) and not of MDPI and/or the editor(s). MDPI and/or the editor(s) disclaim responsibility for any injury to people or property resulting from any ideas, methods, instructions or products referred to in the content. |
© 2024 by the authors. Licensee MDPI, Basel, Switzerland. This article is an open access article distributed under the terms and conditions of the Creative Commons Attribution (CC BY) license (http://creativecommons.org/licenses/by/4.0/).
Copyright: This open access article is published under a Creative Commons CC BY 4.0 license, which permit the free download, distribution, and reuse, provided that the author and preprint are cited in any reuse.


