
Submitted:
15 February 2024
Posted:
15 February 2024
You are already at the latest version
Abstract
Community centers play a crucial role in urban environments, providing physical and educational services to their surrounding communities, particularly for students. Among the many benefits for students are enhanced academic outcomes, improvement of behavioral problems, and increased school attendance. Such centers are also particularly vital for low-income and racial minority students as they are pivotal in giving them outside-of-school learning opportunities. However, determinants influencing attendance at community centers remain largely unexplored. Using census data, Boston Centers for Youth and Families (BCYF) attendance data, and specific center attributes, we develop human mobility gravitational models to predict attendance across the BCYF network. Using those models, we investigate the potential effects on general and student attendance by changing center attributes, such as facilities and operating hours. We also research the impact of changing the walking accessibility to those centers on their respective attendance patterns. After the analysis, we find that the most cost-effective policy to increase BCYF attendance is changing each center’s educational and recreational offerings far beyond any accessibility interventions. Our results provide insights into potential policy changes that could optimize the attendance and reach of BCYF Community Centers to underserved populations.
Keywords:
Policymaking
; urban simulation
; gravitational Huff models
; smart cities
1. Introduction
In numerous urban environments, from metropolitan areas to large towns, community centers are a key part of society [1,2]. Often publicly funded and run by the government, these centers all share one common goal: to serve the community [3]. They do this in various ways, and each Community Center, or network thereof, is different. Nevertheless, these Community Centers run with tight budgets; thus, they have to optimize their budgets when deciding their offerings, like classes, facilities, or hours open, so that they can reach as many people as they can within their communities. This creates a heavy need for tools that enable policymakers to better understand why people go to certain community centers. With that knowledge, community centers will be able to funnel their resources in a way that maximizes their attendance.
In general, policymakers and community center directors do not possess comprehensive tools or models that measure the dependence of demand on the accessibility and attributes of community centers. However, the problem of accessibility to amenities has been heavily studied for the past 50 years for other types of infrastructure, namely commercial or retail infrastructure, using gravitational models, accessibility to transportation, and Agent-Based Modeling [4,5,6,7,8]. This allows owners and policymakers in those sectors to make better, data-driven decisions to benefit their respective infrastructures.
In this study, we extend these methodologies to address the issue of community center engagement. Focusing on the Boston Centers for Youth and Families (BCYF) [3] (see Figure 1), our collaboration with BCYF directors has provided access to key data, enabling an in-depth analysis of the BCYF system, its utilization patterns, and the diverse factors influencing engagement within the urban demographic [9,10]. By using enhanced gravitational Huff models for modal transportation and a unique dataset for Community Center attendance across the BCYF network, we build two models of demand. One of these models represents the total population and one represents the population aged 5 through 17. The models are built with the same equations; the only difference is that they are trained with different eligible populations and thus provide guidance for specific actions regarding the different types of populations. The accuracy of our models allows us to study potential interventions and offer insights into better, data-driven decisions for policymakers or center directors to increase attendance at BCYF community centers.
2. Methodology
Following established methodologies identified in our literature review [4,5,11], this study utilizes a unique dataset on BCYF Community Center attendance and advanced gravitational Huff models.
2.1. Data
In our methodology, we use a variety of data to analyze attendance patterns at the BCYF Community Centers. Our research utilizes anonymous data from visits to each Community Center, including variables such as age, class, encrypted name, and contact ID. To calculate the number of unique visitors at each center, we identify distinct encrypted names and contact IDs. The data was anonymized by using the SHA-512 Algorithm [12]. For consistency across all data, we limit our time range to 1/1/2022 - 5/31/2023. We also access a specific dataset of visit data only for the BCYF Quincy Community Center that includes the same variables with the addition of a zip code, which lets us fit our probability equations for distance.
Furthermore, we gather the different attributes of each center [3], shown in Table 1. We use this data to optimize the attractiveness function as well as inform our interventions. We also use geographic and demographic data from the U.S. Census. This includes, for each CBG [13], the number of current residents, the age distribution (specifically focusing on the total and 5-17 population), and socioeconomic data regarding the number of people below the poverty line.
2.2. Model
We develop two models: one encompassing the entire available population and another focusing on individuals aged 5-17. Our methodology, akin to the Huff model, employs a gravitational approach. In this framework, the likelihood of an individual from CBG c visiting Community Center z is inversely related to the distance between c and z, and directly related to the attractiveness of z.
where is a function that grows with distance d and measures the attractiveness of Community Center z. Traditional forms of are power-law or exponential functions, and they vary depending on the transportation modal choice [11].
To determine the functional form of these modal choice functions, we use two datasets. The first is attendance data from a specific Community Center known as the BCYF Quincy Community Center. This data contains , the number of visitors to the center from each zip code in the Boston area. Using a regression for the probability (where is the population in each CBG c), we find that a power law fit like describes the data accurately for large distances, with exponent and a Root Mean Square Error (RMSE) of .
Since driving is the most common mode of transportation at large distances, we use the previous fit to model the probability that an individual from CBG c visits a Community Center z by driving as
In this equation, we use the traditional Huff Model [4], where the probability is proportional to the attractiveness of the center, , and inversely proportional to the distance. Furthermore, from our analysis of the data and previous research made by Ibaragoyen et al. (2023) [14] and Hidalgo et al. (2020) [15], we discover that individuals typically opt not to drive for distances shorter than km.
From the same surveys in Ibaragoyen et al. (2023) [14], we approximate the probability of visiting a Community Center c by walking as the probability of walking to an elementary school, and found that
with and . Finally, from Ibaragoyen’s et al. (2023) [14] research, we estimate the probability of visiting a Community Center c by public transportation with the following equation:
where and km. We have tested that our results do not depend critically on these assumptions for their functional form.
In our equations, is a normalization so that the probabilities of going to all Community Centers z from a CBG c equal one.
To determine the number of individuals visiting Community Center z from a CBG c, we multiply each probability by the relevant eligible population, , which varies depending on the model used. In our primary model, the eligible population is the total population of the CBG. Conversely, in our student model, the eligible population is restricted to those aged 5-17 within each CBG. This results in the following equations:
where is a normalization factor so that the equals the known amount of individuals that attend the entire network of BCYF Community Centers. From the BCYF network attendance data, we know that the total amount of people attending the entire network is 42,686 individuals for the total population model and 20,720 for the 5-17 age group model.
However, this enhanced Huff model remains a competitive one, where the total number of visitors remains constant. In other words, demand never increases. Changes in the center attributes, or the accessibility to them, will only change how the amount of visitors is distributed between centers. However, demand is elastic, and the number of visitors to all Community Centers could increase if center attributes or accessibility to Centers were altered. In fact, there is evidence that attendance to public infrastructure increases with accessibility. For example, in [5], it was found that the number of visitors to retail centers decreases when residents have less access to these centers. To account for this accessibility difference between individuals as was done in [5], we add a third component to our equations 6, which decreases the number of visitors from each CBG c to a Community Center z by the same inverse decay function used in our driving model, . Thus, our final equations are:
Note that this change allows for an increasing demand if accessibility or attractiveness to centers is increased.
Finally, we model , the attractiveness of each Community Center z, as a linear combination of the Community Center attributes
Table 1 shows the attributes of each of our Community Centers, ranging from the number of hours open to the number of classes or facilities. We also had binary variables, such as having a pool, computer lab, dance studio, or fitness center.
These attributes are not independent of one another. For example, the number of facilities is heavily correlated with the existence of a computer lab, dance studio, and fitness center (see Figure 2). Thus, we employ a feature selection process, discarding the attributes that have large correlations with one another in order to prevent multicollinearity. Therefore, we choose the number of classes based inside a school as well as the possession of a pool, dance studio, fitness center, and computer lab to model each center’s attractiveness.
2.3. Optimization of the Model
Since the transportation modal probabilities are fixed to existing literature, our model only depends on the relative weights assigned to the attributes of a center as in equation 12. We fit them using an optimization algorithm [16] to minimize the RMSE between our predictions and the actual attendance to each center. The result of this optimization is shown in Figure 3, where we can see that our models for the total and 5-17 population are very accurate, with RMSE = and RMSE = , respectively. During our optimization, we found that the most important attributes for the attractiveness of a center are the number of classes offered and the possession of a pool. Interestingly, centers that are based inside of a school have less attractiveness. This is due to centers located within schools offering fewer hours and classes and lacking fitness center facilities, as can be seen by the correlations in Figure 2.
3. Interventions
Given the high accuracy of our models, attributed by an RMSE of for the total population model and for the 5-17 population model, we can study the impact on attendance of two interventions: enhancing the center offerings and changing the walking accessibility to centers.
The first is an intervention regarding the attractiveness of centers, where we change their attributes so that more individuals are enticed to visit them. Note that, as Figure 2 shows, individual attributes of a center are not independent. For example, we cannot independently change whether the center is school-based from the number of classes. To determine the direction of an intervention, we use Principal Component Analysis of the different attributes to suggest possible linear combinations of changes to a center’s attributes. We found that the first principal component is mostly described by the number of classes, having a fitness center, being based inside of a school, and having a dance studio, see Figure 2B. Thus, we choose our interventions along the directions of the first PCA. Namely, we study how attendance at a particular Community Center changes when the center becomes independent from a school when we add a fitness center, and when we increase the number of classes the center offers by one hundred. Our results for different centers subject to this intervention can be found in Figure 4. The effect of the intervention is substantial, with percentage increases in attendance of 100-130% in the total population and around 40% in the 5-17 population. We have also studied the percentage change in attendance of the low-income population, calculated by multiplying our predicted attendance for each CBG by the fraction of people living under the poverty line in that CBG. In this intervention, we do not see any significant difference in attendance change between total and low-income populations.
Our second intervention modifies the walking accessibility of a particular center. To do this, we modify the function so that it becomes more likely that an individual will come to the center walking. This can be done by doubling the B coefficient in the equation 3 so that the function decays slower with distance. Our results for this intervention, shown in Figure 4 Panels B and D, still show a substantial change. In regards to the low-income population, the percentage change is higher than for the total population, suggesting that by changing the walking accessibility of a center, we impact the low-income communities around them more.
The geographical effects of these interventions can be seen in Figure 5. As we can see, both interventions significantly increase attendance from nearby CBGs. Nevertheless, we can see in Figure 5B that the increase in attendance extends to CBGs further away from the community center. We attribute this to the fact that driving is the most probable modal choice for larger distances.
4. Conclusions and Future Work
This study offers a detailed analysis of attendance patterns at BCYF Community Centers, utilizing enhanced Huff models based on census and real attendance data. Our findings reveal significant insights into factors influencing attendance and effective policy interventions for increasing it. We found that the most impactful factor is enhancing the educational and recreational offerings at each center, notably more than improving walking accessibility. Centers within schools are less attractive, suggesting that making centers independent, thereby allowing for more classes, longer hours, and fitness facilities, would significantly boost attendance.
Predicted attendance increases substantially with these interventions: independence, added fitness centers, and additional classes could lead to attendance increases of 100-130% for the entire population and around 40% for the 5-17 age group, with similar rises in low-income populations. Modifications to walking accessibility show notable impacts as well, showing a 20-40% increase in the entire population and a 15-40% increase in the 5-17 population. However, with this type of intervention, we see a large percentage increase for the low-income population, suggesting that improving pedestrian access greatly benefits underserved communities.
Despite its insights, the study has limitations: incomplete data for smaller centers, unaddressed detailed transit accessibility, and a simplified linear attractiveness function in the model. Future research could enhance model accuracy with more comprehensive data collection and transportation accessibility analysis. Nevertheless, our model’s high accuracy renders it a valuable and robust tool, capable of providing policymakers and center directors with data-driven insights to optimize the BCYF program’s reach.
Acknowledgments
IThe authors wish to express their gratitude for the valuable attendance data provided by Helen Wong, Director of the BCYF Quincy Community Center. This data, encompassing all BCYF community centers, was instrumental in the completion of this research.
References
- Massachusetts Department of Elementary and Secondary Education. 21st Century Community Learning Centers (CCLC) Grant Program, Summer Reports. Available online: https://www.doe.mass.edu/21cclc/ (accessed on 21 January 2024).
- Afterschool Alliance. What does the research say about 21st Century Community Learning Centers? Available online: http://afterschoolalliance.org//documents/What_Does_the_Research_Say_About_21stCCLC.pdf (accessed on 21 January 2024).
- of Boston, C. of Boston, C. Boston Centers for Youth and Families. Available online: https://www.boston.gov/departments/boston-centers-youth-families (accessed on 16 January 2024).
- Huff, D.L. Parameter estimation in the Huff model. Esri, ArcUser 2003, 34–36. [Google Scholar]
- Sevtsuk, A.; Kalvo, R. Patronage of urban commercial clusters: A network-based extension of the Huff model for balancing location and size. Environment and Planning B: Urban Analytics and City Science 2018, 45, 508–528. [Google Scholar] [CrossRef]
- Gibbs, R.J. Principles of urban retail planning and development; John Wiley & Sons, 2012.
- Doorley, R.; Noyman, A.; Sakai, Y.; Larson, K. What’s Your MoCho? Real-time Mode Choice Prediction Using Discrete Choice Models and a HCI Platform. Proceedings of the UrbComp 2019, 19. [Google Scholar]
- Antonelli, D.; Azzato, S.; Elkatsha, M.; Defrain, E.m.; Alonso Pastor, L.; Larson, K. Predicting Behavioral Changes as a result of land-use Modifications in Auto-Centric Communities: Data Driven Discrete Mode Choice Modeling for Dallas TX. Proceedings of SUPTM 2024 2023. [Google Scholar]
- Alonso, L.; Zhang, Y.R.; Grignard, A.; Noyman, A.; Sakai, Y.; ElKatsha, M.; Doorley, R.; Larson, K. Cityscope: A data-driven interactive simulation tool for urban design. Use case volpe. Unifying Themes in Complex Systems IX: Proceedings of the Ninth International Conference on Complex Systems 9. Springer, 2018, pp. 253–261.
- Grignard, A.; Alonso, L.; Taillandier, P.; Gaudou, B.; Nguyen-Huu, T.; Gruel, W.; Larson, K. The impact of new mobility modes on a city: A generic approach using abm. Unifying Themes in Complex Systems IX: Proceedings of the Ninth International Conference on Complex Systems 9. Springer, 2018, pp. 272–280.
- Barbosa, H.; Barthelemy, M.; Ghoshal, G.; James, C.R.; Lenormand, M.; Louail, T.; Menezes, R.; Ramasco, J.J.; Simini, F.; Tomasini, M. Human mobility: Models and applications. Physics Reports 2018, 734, 1–74. [Google Scholar] [CrossRef]
- Grignard, A.; Macià, N.; Alonso Pastor, L.; Noyman, A.; Zhang, Y.; Larson, K. Cityscope andorra: A multi-level interactive and tangible agent-based visualization. Proceedings of the 17th International Conference on Autonomous Agents and MultiAgent Systems, 2018, pp. 1939–1940.
- United States Census Bureau. 2015-2019 American Community Survey 5-year Estimates. 2021. Available online: https://www.census.gov/programs-surveys/acs (accessed on 16 January 2024).
- Ibargoyen, T.M.; Barrenechea, P.; Elkatsha, M.; Alonso Pastor, L.; Larson, K. A Methodology To Quantify Demands And Space Requirements Of Amenities And Services For A Given Community. Use Case: Volpe Development, Kendall Sq. Proceedings of SUPTM 2024 2023. [Google Scholar]
- Hidalgo, C.A.; Castañer, E.; Sevtsuk, A. The amenity mix of urban neighborhoods. Habitat International 2020, 106, 102205. [Google Scholar] [CrossRef]
- Virtanen, P.; Gommers, R.; Oliphant, T.E.; Haberland, M.; Reddy, T.; Cournapeau, D.; Burovski, E.; Peterson, P.; Weckesser, W.; Bright, J.; van der Walt, S.J.; Brett, M.; Wilson, J.; Millman, K.J.; Mayorov, N.; Nelson, A.R.J.; Jones, E.; Kern, R.; Larson, E.; Carey, C.J.; Polat, İ.; Feng, Y.; Moore, E.W.; VanderPlas, J.; Laxalde, D.; Perktold, J.; Cimrman, R.; Henriksen, I.; Quintero, E.A.; Harris, C.R.; Archibald, A.M.; Ribeiro, A.H.; Pedregosa, F.; van Mulbregt, P.; SciPy 1.0 Contributors. SciPy 1.0: Fundamental Algorithms for Scientific Computing in Python. Nature Methods 2020, 17, 261–272. [CrossRef]
Figure 1.
Map of the BCYF Community Centers in the Boston Area. Symbol size is proportional to attendance, and colors indicate if they are school-based.
Figure 1.
Map of the BCYF Community Centers in the Boston Area. Symbol size is proportional to attendance, and colors indicate if they are school-based.
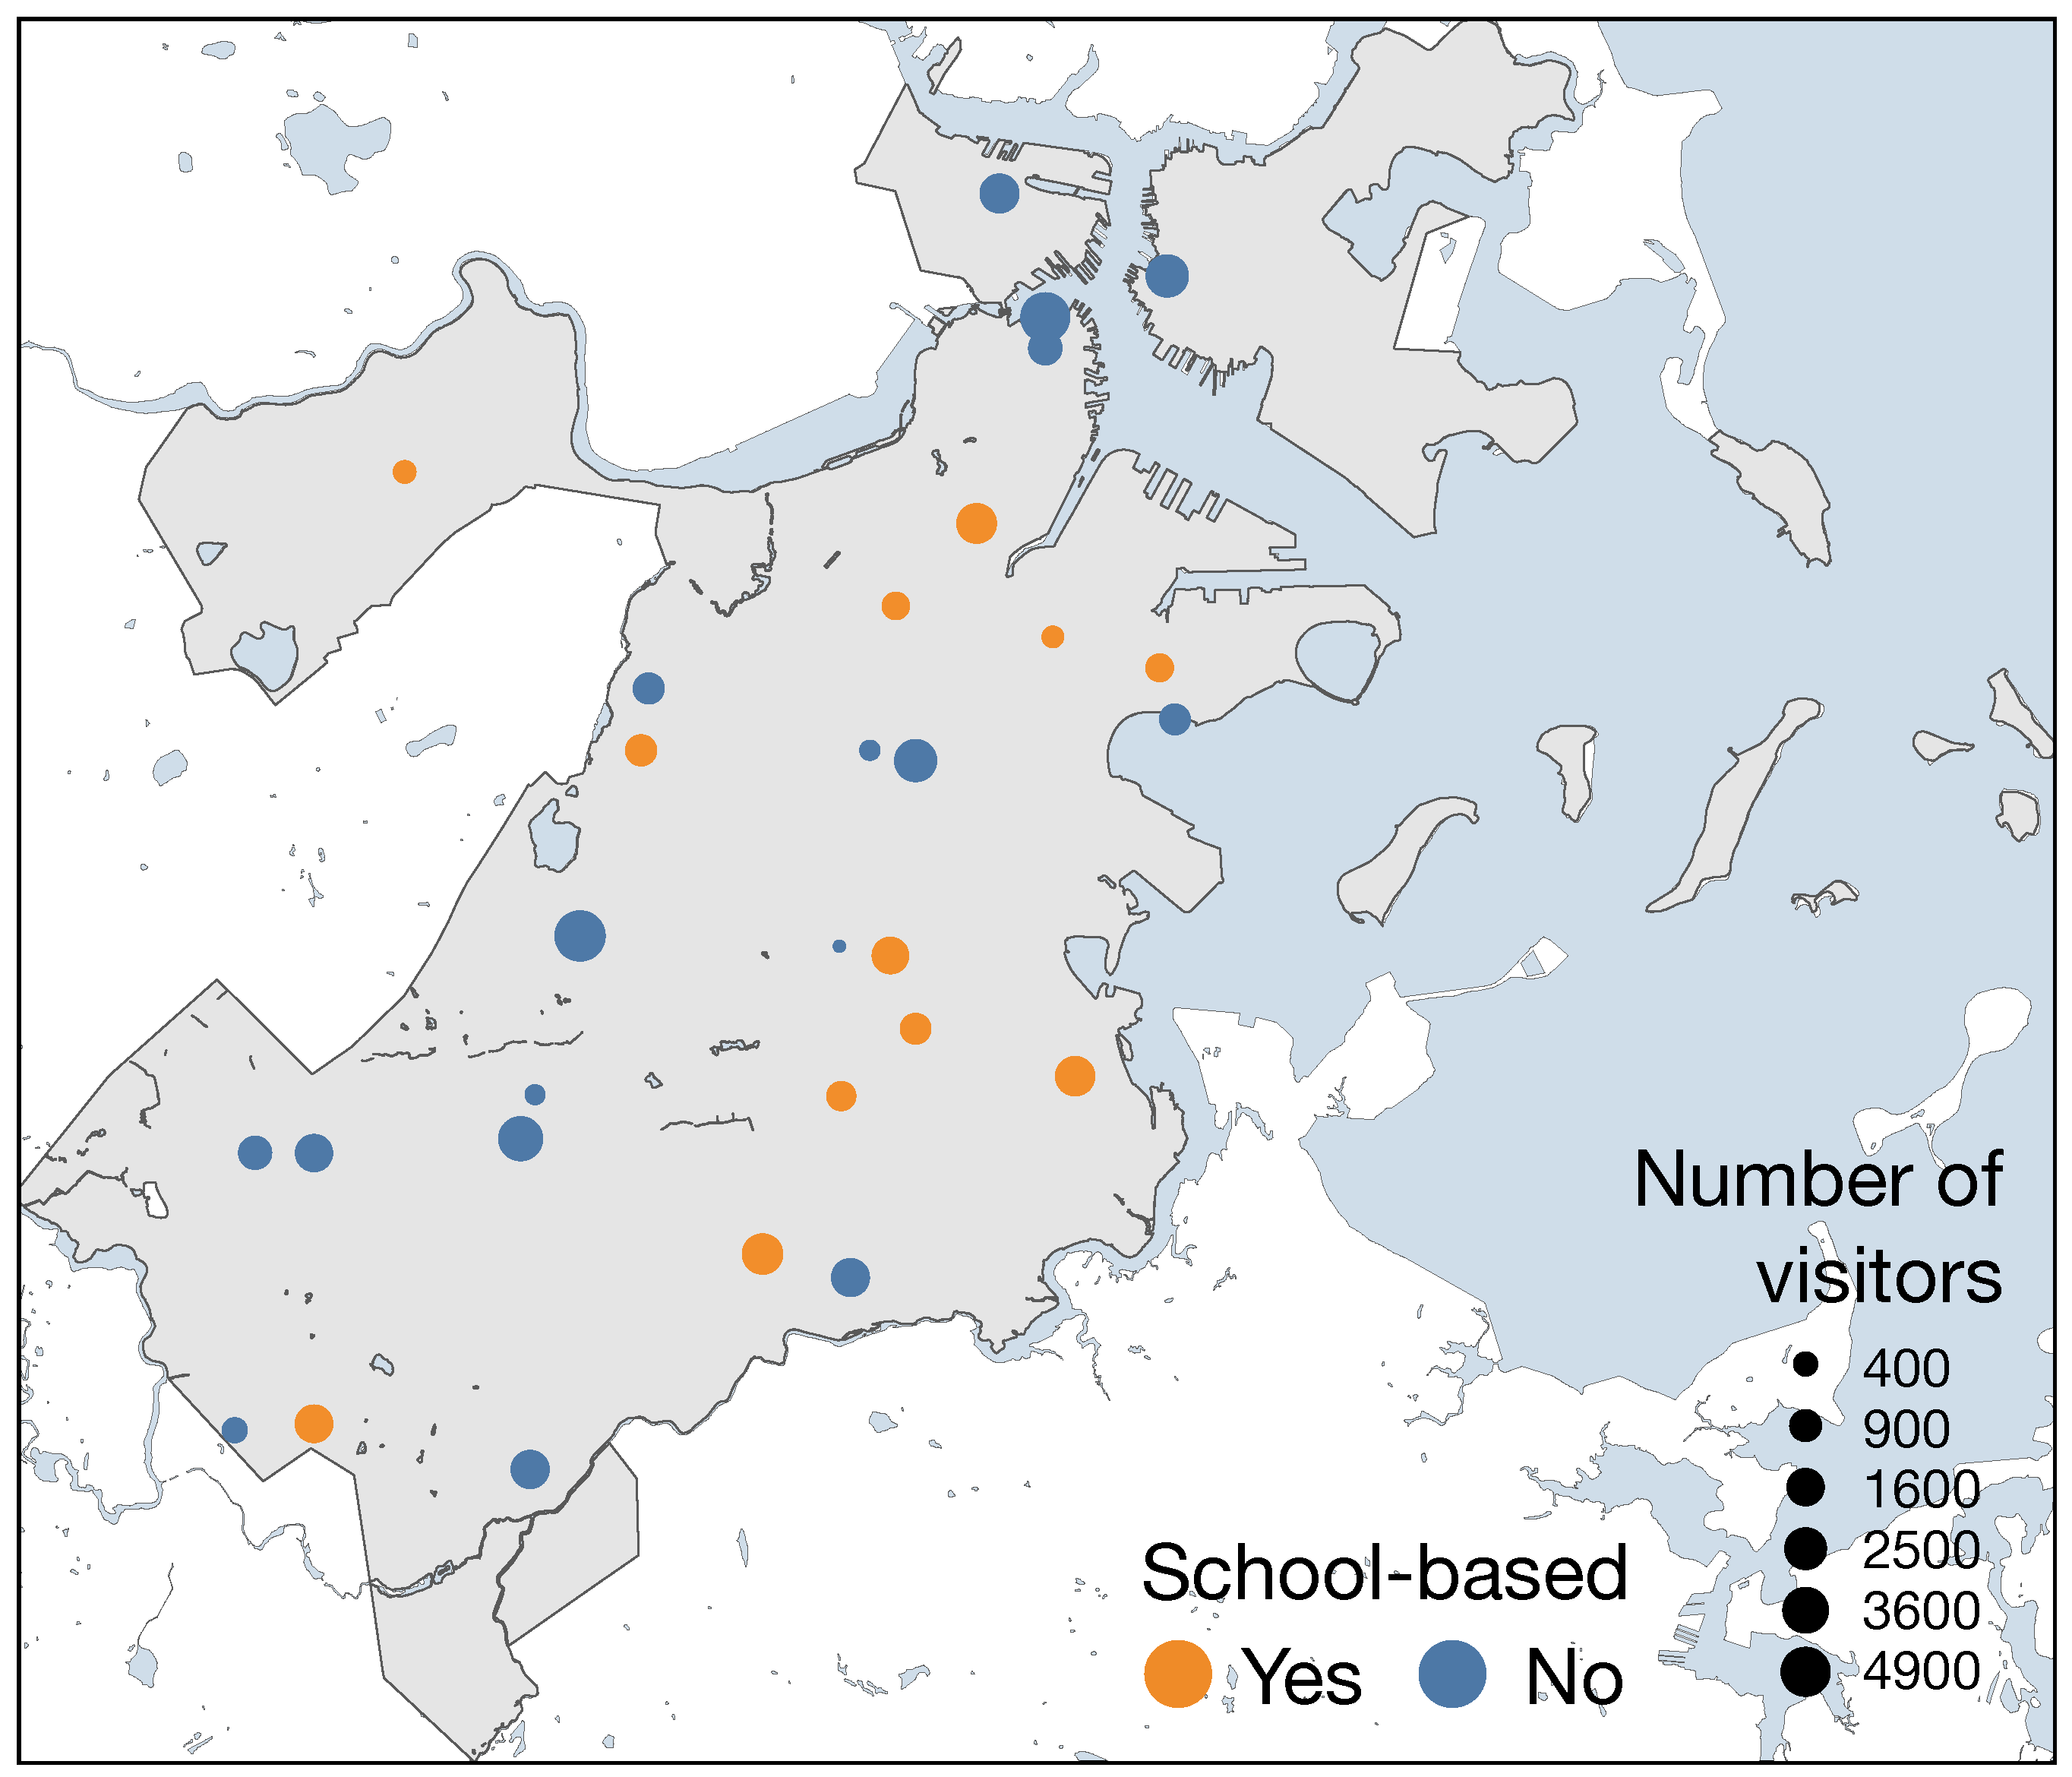
Figure 2.
A) Correlation matrix between center attributes. B) Biplot of the first two PCA components of center attributes.
Figure 2.
A) Correlation matrix between center attributes. B) Biplot of the first two PCA components of center attributes.
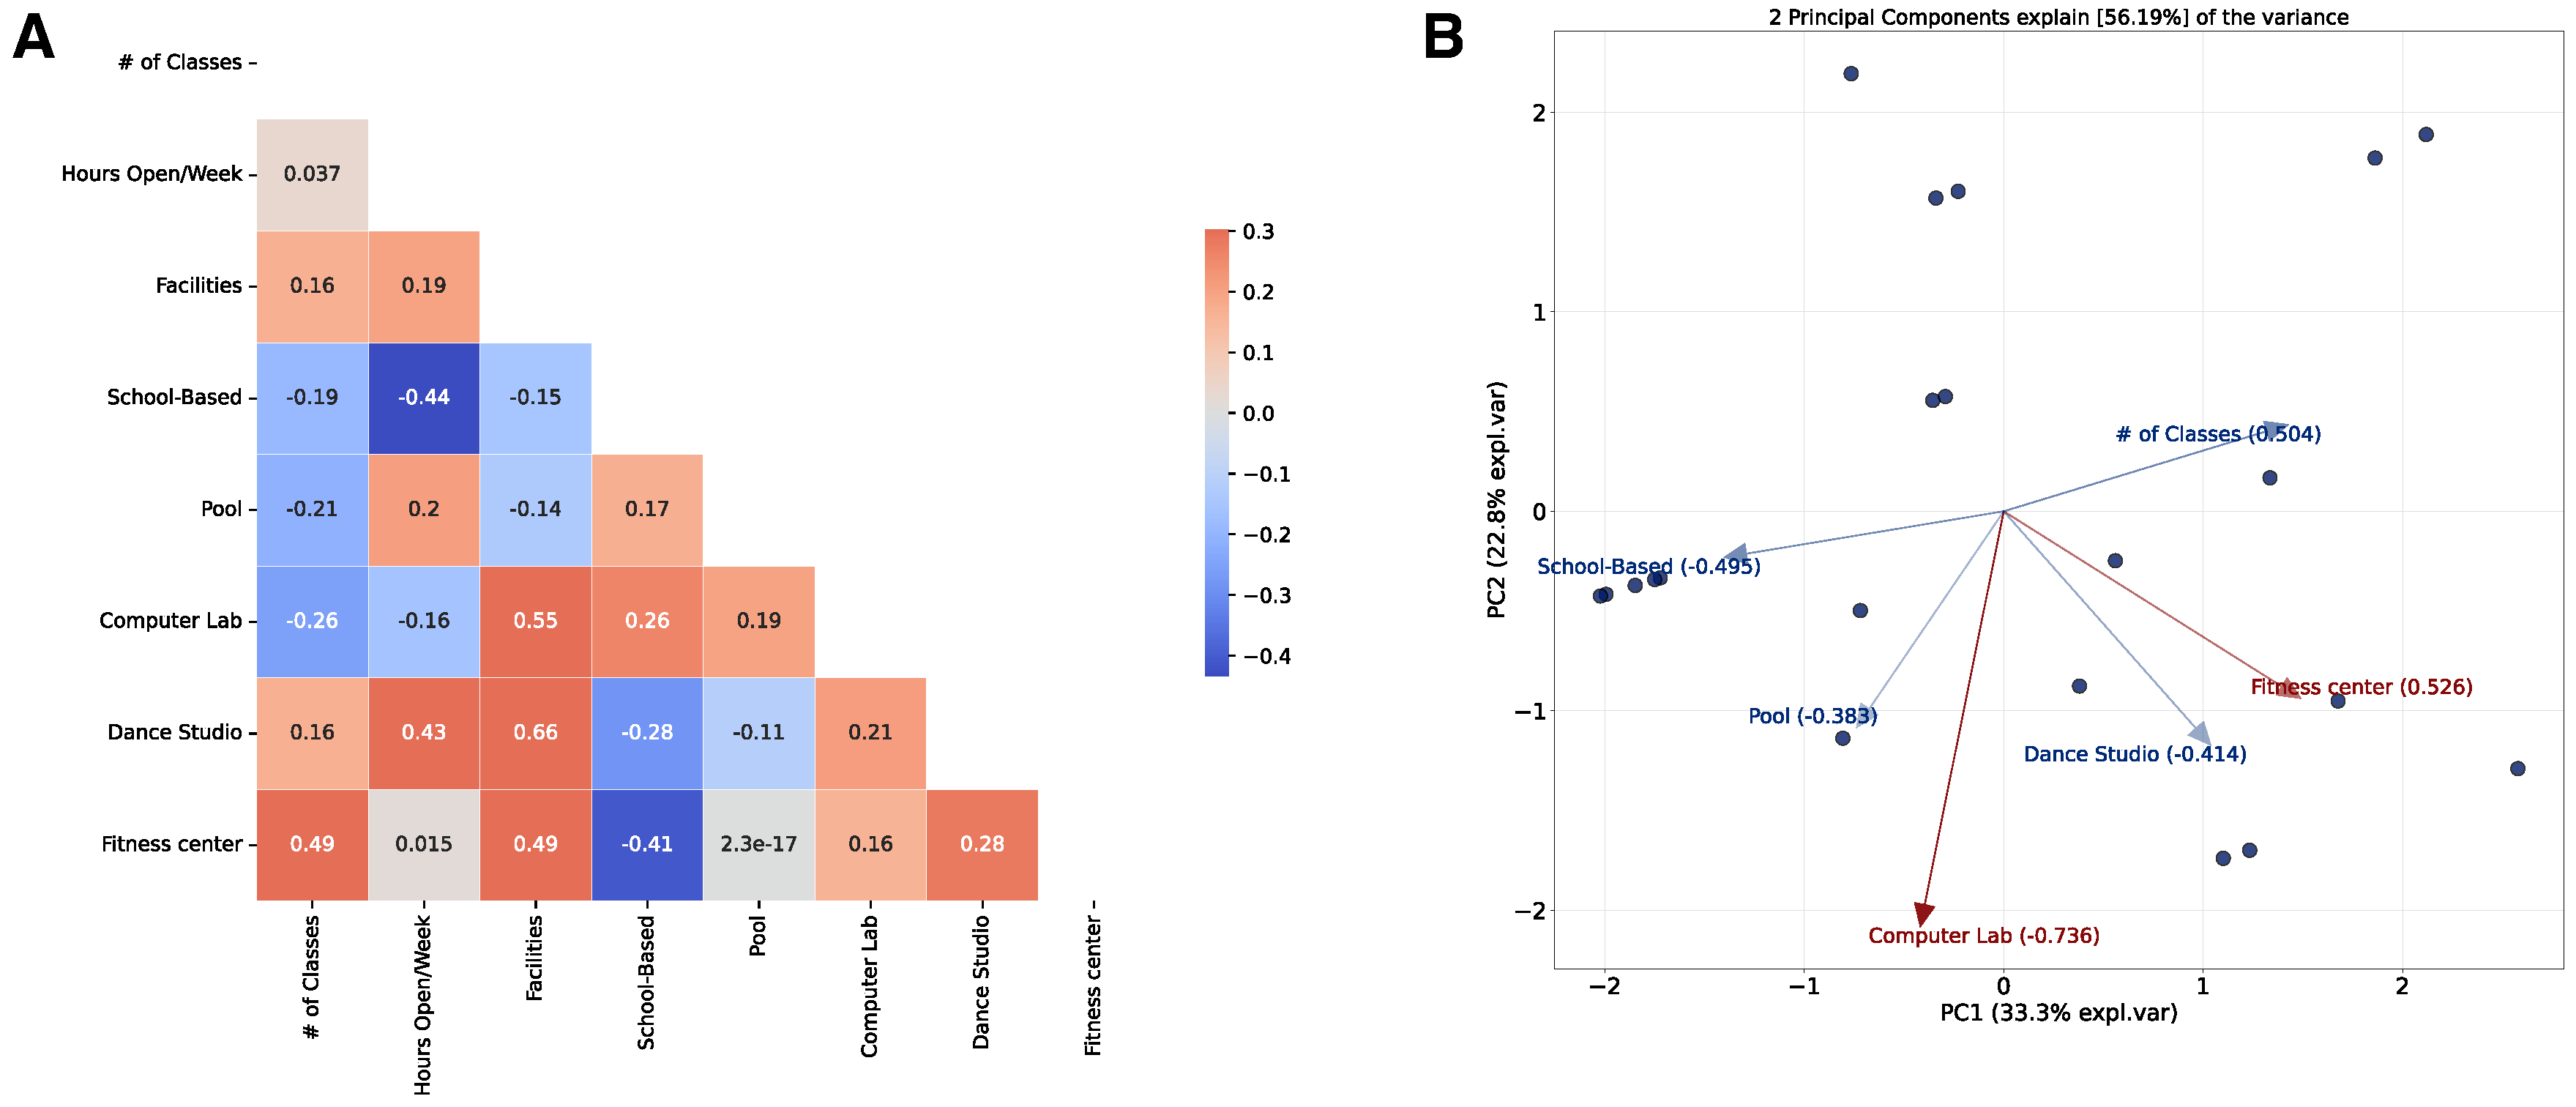
Figure 3.
Model Fitting Results. Relationship between our model predictions and real data for the attendance at each Community Center for the total population (A) and 5-17 year-old population (C). The coefficient weights found for our model for the total population (B) and the 5-17 population (C). For illustration purposes, the coefficient for the number of classes is normalized to one.
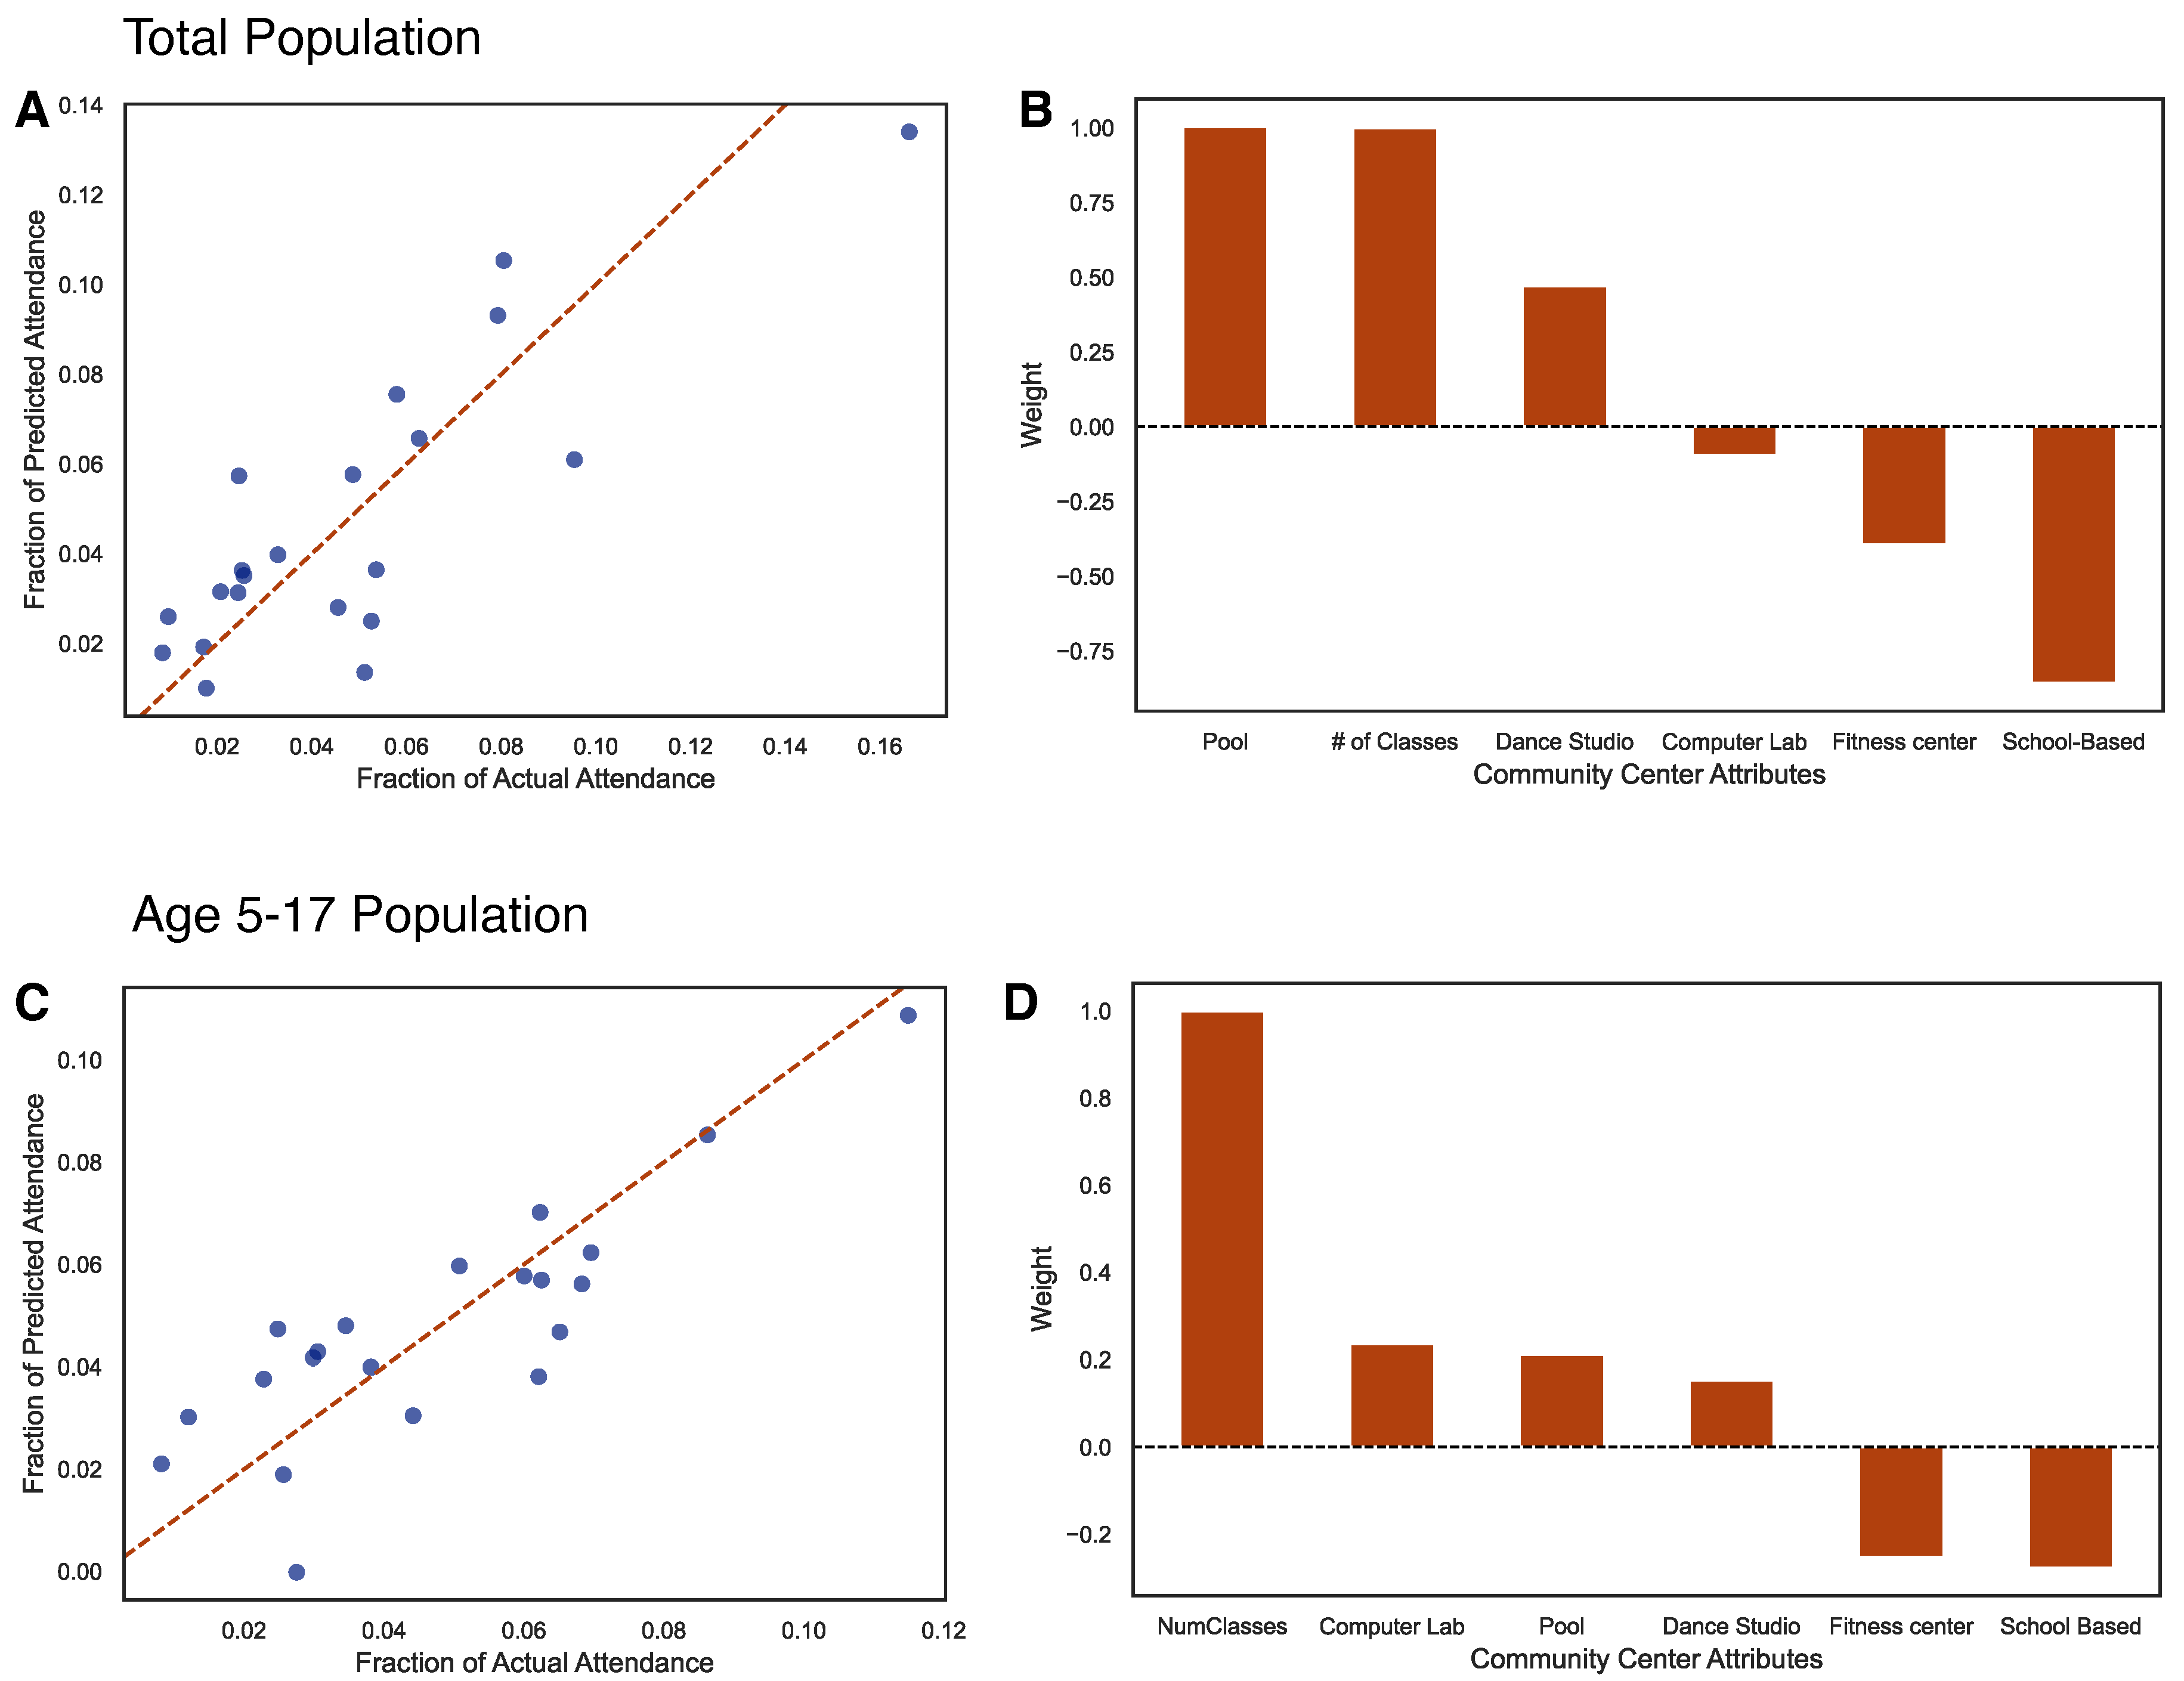
Figure 4.
Effect of interventions. A) Percent change of attendance for total and low-income total populations when changing center attributes. B) Percent change of attendance for total and low-income total populations when changing the walking accessibility to centers. C) Percent change of attendance for 5-17 and low-income 5-17 populations when changing center attributes. D) Percent change of attendance for 5-17 and low-income 5-17 populations when changing the walking accessibility to centers.
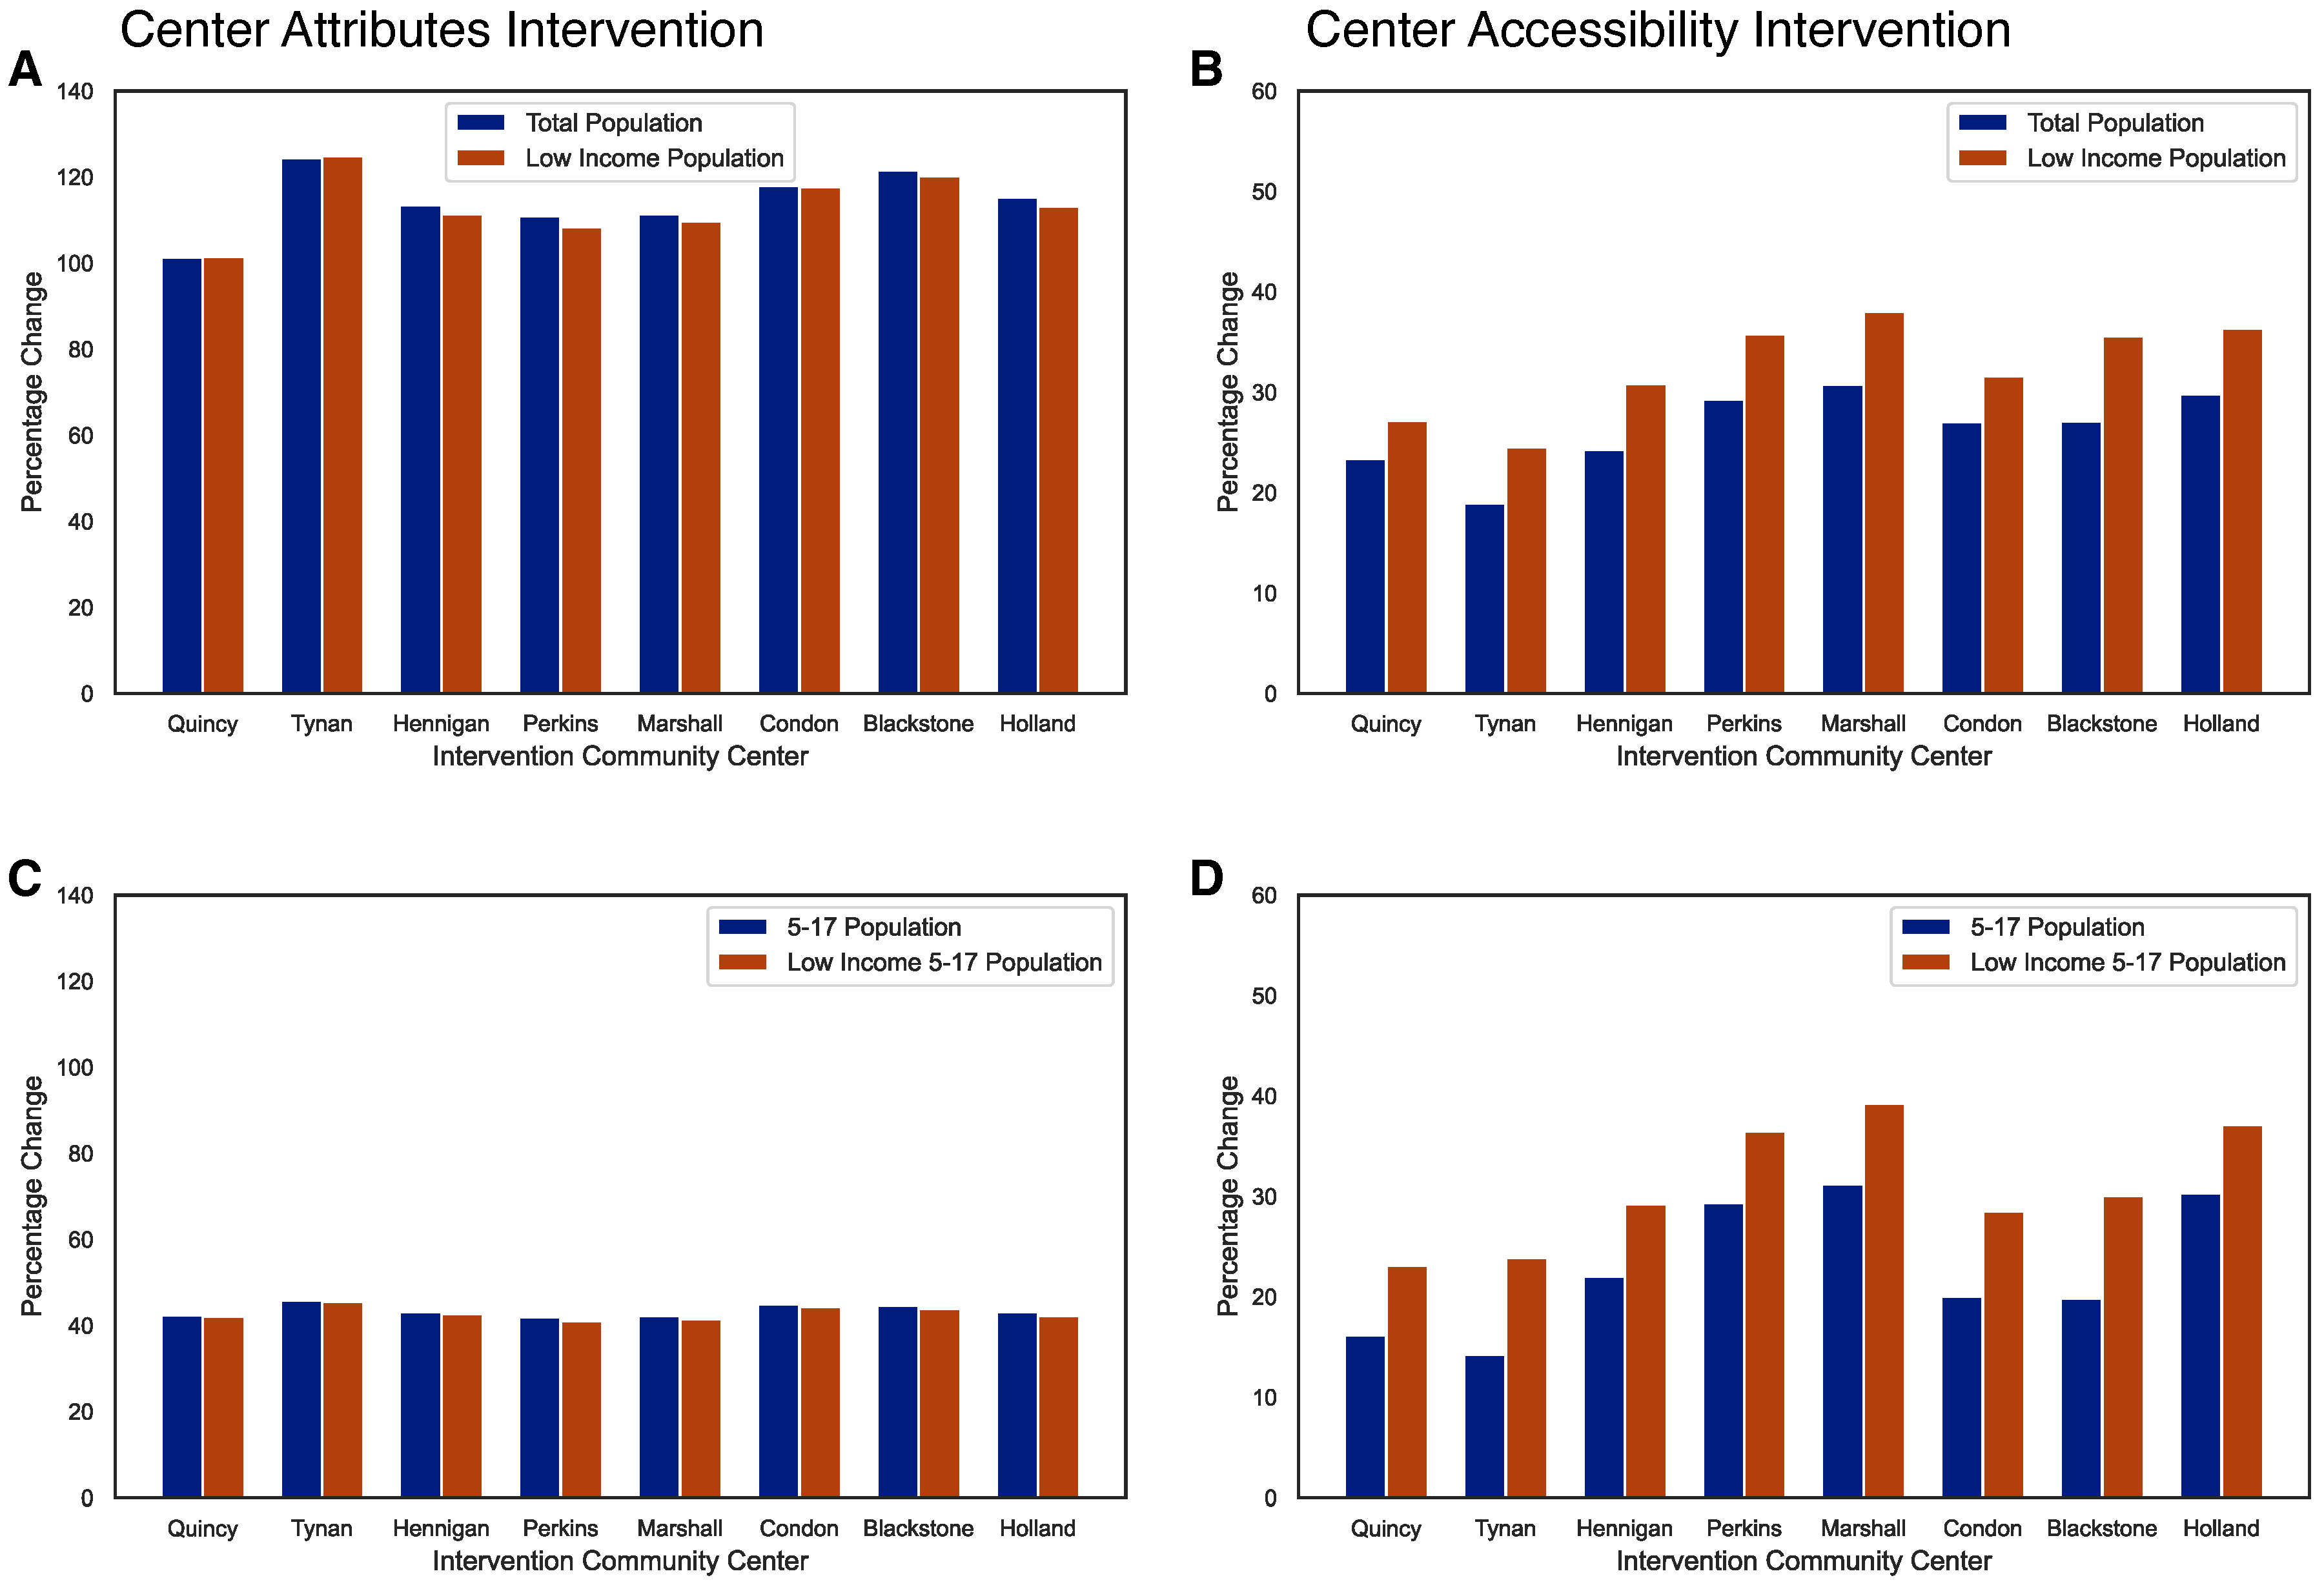
Figure 5.
Geographical representation of the effects of each intervention labeled with the square root of the total attendance per CBG
Figure 5.
Geographical representation of the effects of each intervention labeled with the square root of the total attendance per CBG
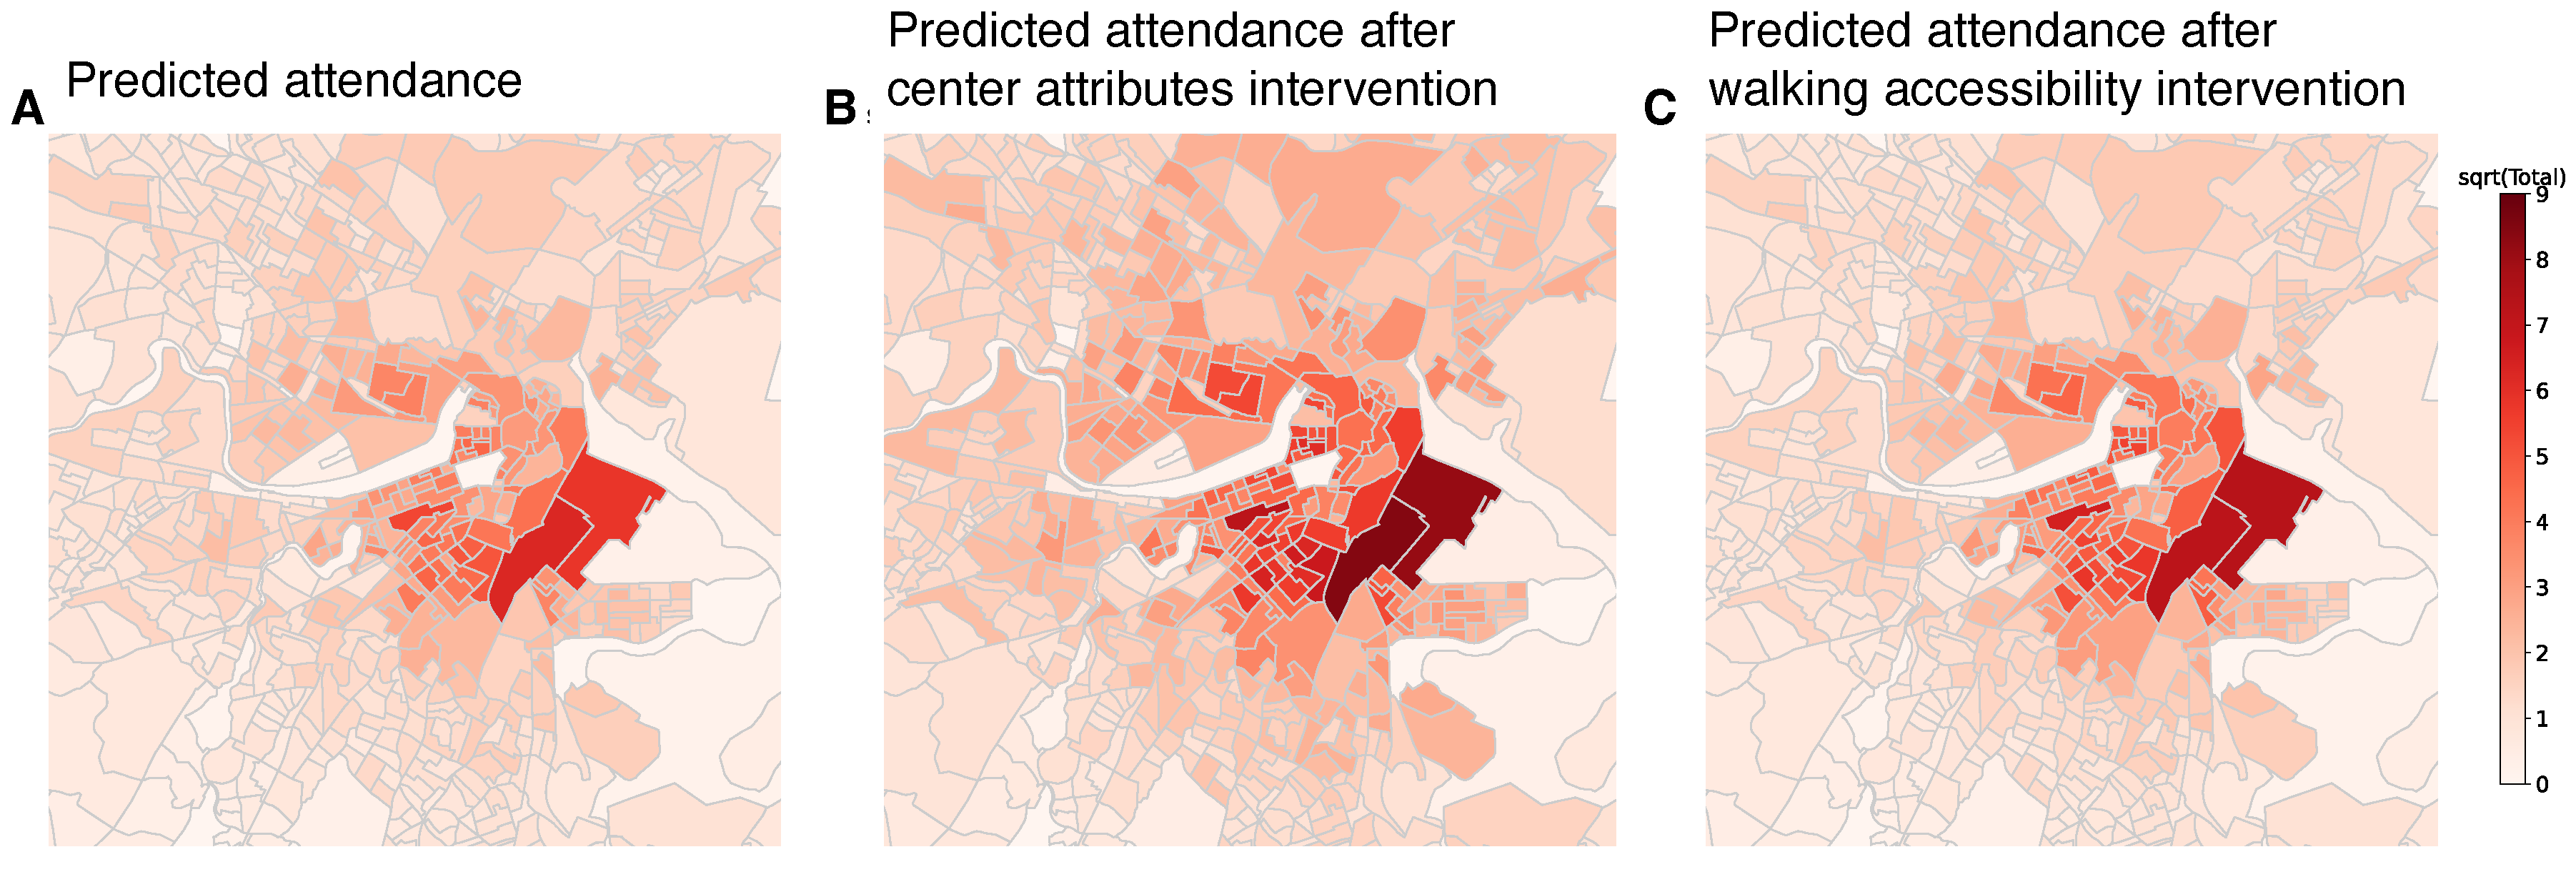

Table 1.
Attributes of the different BCYF Community Centers considered in the study.
| Community | # of | Hours | School- | Computer | Dance | Fitness | ||
| Center | Classes | Open/Week | Facilities | Based | Pool | Lab | Studio | Center |
| Quincy | 84 | 58 | 6 | 1 | 1 | 1 | 1 | 0 |
| Blackstone | 21 | 58 | 11 | 1 | 0 | 1 | 1 | 0 |
| Nazzaro | 183 | 60 | 8 | 0 | 0 | 0 | 0 | 1 |
| Condon | 22 | 58 | 6 | 1 | 1 | 1 | 0 | 0 |
| Tobin | 61 | 73 | 10 | 0 | 0 | 1 | 1 | 1 |
| Mason Pool | 82 | 66 | 2 | 0 | 1 | 0 | 0 | 0 |
| Charlestown | 59 | 40 | 6 | 0 | 1 | 1 | 0 | 1 |
| Tynan | 73 | 50 | 4 | 1 | 0 | 0 | 0 | 0 |
| Curley | 54 | 78.5 | 9 | 0 | 1 | 1 | 1 | 1 |
| Paris Street | 73 | 68 | 12 | 0 | 1 | 1 | 1 | 1 |
| Hennigan | 61 | 70 | 6 | 1 | 1 | 1 | 0 | 0 |
| Curtis Hall | 266 | 78 | 13 | 0 | 1 | 1 | 1 | 1 |
| Holland | 18 | 58 | 8 | 1 | 1 | 1 | 0 | 0 |
| Marshall | 43 | 50 | 4 | 1 | 1 | 1 | 0 | 0 |
| Perkins | 57 | 68 | 8 | 1 | 1 | 1 | 0 | 0 |
| Gallivan | 47 | 68 | 6 | 0 | 0 | 1 | 0 | 0 |
| Menino | 38 | 55 | 6 | 0 | 0 | 1 | 0 | 0 |
| Flaherty Pool | 66 | 78 | 2 | 0 | 1 | 0 | 0 | 0 |
| Roche | 198 | 73 | 5 | 0 | 0 | 0 | 1 | 0 |
| Hyde Park | 61 | 60 | 12 | 0 | 0 | 1 | 1 | 0 |
| Ohrenberger | 264 | 40 | 7 | 1 | 0 | 1 | 0 | 1 |
Disclaimer/Publisher’s Note: The statements, opinions and data contained in all publications are solely those of the individual author(s) and contributor(s) and not of MDPI and/or the editor(s). MDPI and/or the editor(s) disclaim responsibility for any injury to people or property resulting from any ideas, methods, instructions or products referred to in the content. |
© 2024 by the authors. Licensee MDPI, Basel, Switzerland. This article is an open access article distributed under the terms and conditions of the Creative Commons Attribution (CC BY) license (http://creativecommons.org/licenses/by/4.0/).
Copyright: This open access article is published under a Creative Commons CC BY 4.0 license, which permit the free download, distribution, and reuse, provided that the author and preprint are cited in any reuse.


