

Submitted:
10 February 2024
Posted:
12 February 2024
You are already at the latest version
Abstract
Developing effective trend estimators is a main method to solve the online portfolio selection problem. Although the existing portfolio strategies have demonstrated good performance through the development of various trend estimators, it is still challenging to determine in advance which estimator will yield the maximum final cumulative wealth in online portfolio selection tasks. This paper studies an online ensemble approach for online portfolio selection by leveraging the strengths of multiple trend estimators. Specifically, a return-based loss function and a cross-entropy-based loss function are first designed to evaluate the adaptiveness of different trend estimators in a financial environment. On this basis, a passive aggressive ensemble model is proposed to weigh these trend estimators within a unit simplex according to their adaptiveness. Extensive experiments are conducted on benchmark datasets from various real-world stock markets to evaluate the performance. The results show that the proposed strategy achieves the state-of-the-art performance including efficiency and cumulative return.
Keywords:
Online Portfolio Selection
; Online Ensemble Learning
; Passive Aggressive Algorithm
1. Introduction
Online portfolio selection dynamically allocates wealth across real-world assets by analyzing stream data from financial markets [1,2]. To optimize the wealth allocation, portfolio selection leverages a range of machine learning techniques, including Newton gradient step [3] and nearest neighbor [4]. In addition to these methods, portfolio selection must also consider economic and financial theories and criteria, particularly investment behaviors [5,6]. Accordingly, many of the current leading portfolio selection systems employ historical price information to predict future prices to determine the optimal portfolio allocation.
Reversion and momentum are two significant characteristics in finance. Numerous the state-of-the-art portfolio selection strategies develop trend estimators based on these characteristics for decision-making. For example, trend estimators like the inverse price [7,8], the simple moving average [17], and the exponential moving average [9] assume that the asset price will reverse to some kind of its historical average. On the contrary, the peak price [10,11] assumes that the price of a good performing asset will continue to rise due to the irrational investing behaviors. Since each trend estimator is based on different prior assumptions, their effectiveness is contingent on the financial environment aligning with these assumptions. Consequently, it is challenging to predetermine which trend estimator will maximize the final cumulative wealth for online portfolio selection tasks.
To take the advantages of various trend estimators during the whole investment period, we pay attention to the online ensemble learning framework [12]. The online learning adeptly balances each trend estimator with evolving financial environments, while the ensemble learning combines these estimators to enhance robustness and precision. A simple but effective ensemble learning approach is weighted averaging [13]. Consequently, it is a viable solution to develop a suitable online ensemble learning algorithm to amalgamate various trend estimators emerges.
In this paper, we address the problem of online portfolio selection with multiple trend estimators by developing a framework named Passive Aggressive Ensemble (PAE). The characteristics and contributions of the proposed PAE are summarized as follows:
- The PAE framework is introduced to employ two distinct schemes to efficiently ensemble four different types of trend estimators.
- The PAE framework augments the performance of original trend estimators through reasonable evaluation and weighting.
- The hyperparameters are tuned based on the oldest dataset to avoid overfitting. Extensive experiments are conducted on six real-world datasets to demonstrate our algorithm not only outperforms competing strategies in terms of multiple evaluation criteria, but also has promising scalability of transaction costs.
The rest of the paper is organized as follows. Section 2 formally states portfolio selection in machine learning. Section 3 reviews some related work regarding trend estimator and ensemble learning in the context of online portfolio selection. Section 4 presents our PAE framework for portfolio selection. Section 5 presents experiments and results of PAE on real-world benchmark datasets. Finally, conclusions are made in Section 6.
2. Problem Setting
In this paper, we use a standard and universal setting of portfolio selection in machine learning [7,8,9,10,11]. Consider a financial market with assets for periods. At the end of the period, a non-negative m-dimensional vector
represents the close price of assets. A relative price vector is introduced to see the change of asset prices as
where a division between two vectors represents element-wise division in this paper.
At the beginning of the period, an investment in the market is specified by a portfolio vector in dimensional unit simplex
where denotes the proportion of total wealth invested in the asset. The non-negative constrain means no short is allowed and the equality constraint means that the portfolio is self-financed.
For the trading day, a portfolio generated by the portfolio selection algorithm results in a daily return . Thus, the cumulative wealth can be calculated as , and the final cumulative wealth with a common initial wealth is given by
Finally, a portfolio learning algorithm sequential learns a set of portfolio vectors to maximize the final cumulative wealth and satisfy some risk management metrics.
3. Related Works
In this section, we mainly review the related work of trend estimators and ensemble learning in online portfolio selection.
3.1. Trend Estimator
Following-the-winner strategies assume that the price of a good performing asset will continue to rise. Based on this assumption, researchers have designed different trend estimators. Exponential gradient [14] and its improved variants [15] estimate the asset price as it will continue to change as last day. The peak price tracking system [10] and short-term portfolio optimization with loss control [16] adopt the peak price (PP) as trend estimator. PP assumes the price continues moving in their max price of a recent time window but fails to capture continuous depreciation of asset price. Recently, there are many works to handle the shortcomings of peak price, e.g., the trend peak price tracing [11] and the peak price tracking approach [17].
Following-the-loser strategies are opposite to Following-the-winner strategies, and they assume that the asset price will reverse to some kind of its historical average. The inverse price (IP) expects the asset price will reverse to the last day. Passive aggressive mean reversion [7] and confidence weighted mean reversion [8] adopt the IP as trend estimator but suffer from significant performance degradation if the underlying short-term reversion fails to exist. The simple moving average (SMA) and exponential moving average (EMA) [9] improve the estimation of IP. The SMA utilizes the average of the asset prices within a specified time window to estimate the future price movement. It assigns equal weight to each asset price in the specified period, effectively smoothing out any extreme prices within the time frame to derive the most recent price information from the financial market. The EMA incorporates all historical asset prices but assigns higher significance to recent prices in predicting future trends, making it generally more reflective of the actual price trends in comparison to the SMA. Recently, Gaussian weighting reversion [18] uses Gaussian weighting function to enhance the time validity. Vector autoregressive weighting reversion [19] and weighted multivariate mean reversion [20] use autoregressive moving average and multi-variate robust mean respectively to estimate the mean more precisely. The state-dependent exponential moving average [21] predicts asset returns by additionally analyzing market states.
3.2. Ensemble Learning
In recent years, the ensemble learning algorithm has been promoted more widely in improving its generalization ability and application scope. The online portfolio selection has garnered significant interest from both industry professionals and academic researchers. In this context, Guo et al. [22] introduced a novel approach termed adaptive online moving average. This technique enhances the prediction of future returns of volatile assets by integrating an adaptive decaying factor with the traditional moving average approach. Furthermore, it incorporates the concept of ensemble learning through the inclusion of a net profit maximization model. It significantly enhances the precision of return forecasts. Kumar and Segev [23] introduced a Bayesian ensembled mean-median reversion to adeptly integrate the advantages of mean and median reversion techniques. It employs Bayesian methods to amalgamate these two strategies, improving future portfolio decisions by learning from past prediction errors. Hong et al. [11] introduced a trend peak price tracing strategy in online portfolio selection to address market unpredictability by combining trend analysis and ensemble learning. It employs a dynamic price forecasting method, using linear combinations of slopes to determine stock price trends. The trend peak price tracing’s three-state forecasting adapts to market conditions by incorporating peak values, exponential moving averages, or maintaining current values based on trend analysis.
4. Methodology
To take the advantages of different trends and adapt to different financial environments, we propose a passive aggressive ensemble (PAE) framework and two strategies: PAE-R and PAE-C in this section. We take four traditional trend estimators as the input of PAE:
where w is the time window size, ϑ∈(0,1) denotes the decaying factor, 1 is a m-dimensional vector whose elements are 1, and i = 1,2,…,m is the order of asset.
4.1. Passive Aggressive Ensemble
The construction of trend composite starts with a trend back-test step. Let denote a set of trends—e.g., , and , where L is the total number of trends. We project onto a unit simplex [24] to get feasible portfolios
Then we are able to measure the return-based performance [25] of each trend estimator in a certain time period
where is the back-tested return of trend in period, is the real relative price factor given by (2), and is the collection of different back-tested returns.
Drawing upon from the cross-entropy [26], we also propose an indicator to evaluate each trend estimator called cross-entropy-based performance
where is the projection of real relative price vector by (9). The cross-entropy allows us to measure the gap between the trend estimator and the true price movement.
Two ensemble targets are defined to meet the goal of our approach. We expect that our ensembled trend estimator is no worse than the average performance of any single trend estimator over the investment period, which is consistent with investing intuition. For the cross-entropy-based performance, smaller values indicate a better trend estimator, and the opposite is true for returns-based performance. Our ensemble targets are defined as follow:
where is the window size in the most recent time. We average the back-tested performance of each trend estimator in the most recent time window and select the one with the best average performance.
Combining the passive aggressive principle [28] and online ensemble framework [13], a weighting vector for weighted averaging is first defined. Then, we propose two new loss functions to combine all the trends and consider their performance for our PAE-R and PAE-C strategies, respectively:
where and are the performance of ensemble targets, is the tolerance threshold between the return-based performance of ensemble target and weighted averaging trend estimators, is the tolerance threshold between the cross-entropy-based performance of ensemble target and weighted averaging trend estimators.
We update the weighting vector at the end of each trading period through the following optimization problem
On one hand, if our weighted averaging trend estimators outperform or close to the ensemble target, our approach passively maintains the weighting vector in the next trading period. On the other hand, when the weighted averaging trend estimators perform much worse than the ensemble target, our approach aggressively adjusts to seek a better weight. The problem will be solved in Section 4.3.
4.2. Online Portfolio Selection with Multiple Trend Estimators
The next step is to decide the proportion of the wealth being allocated to each asset of the stock based on the weighting and trend estimators received from the previous step. First proposed by Li et al. [7,9,27], the portfolio selection through passive aggressive algorithms is widely used today [18,20,23], especially in single trend estimator situation. We extend the application of this algorithm to the case of multi-trend estimators. Our basic idea to form the final portfolio is to maximize the ensemble trend estimator and keep last portfolio information through a regularization term. The final portfolio optimization problem can be expressed as:
where is the collection of different trends, is the weighting vector, is the reversion threshold, and is the ensemble trend estimator.
If the expected return is greater than the threshold, we passively maintain the original investment portfolio vector. If the expected return is less than the threshold, we aggressively adjust the investment portfolio vector to maximize our returns. is capable of combining various trends via the weighting vector as the output of (16). We will solve this problem in subsection 4.3.
4.3. Solving Algorithm
In this subsection, we will derive the solutions for the above optimization problem and summarize the whole procedure for PAE algorithms in Algorithm 1.
Theorem 1.
Without considering the non-negativity constraint, the solution of PAE-R type optimization problem (16) is
where is the mean value of back-tested return-based performance and is computed as:
The proof of this theorem is in Appendix A.
Theorem 2.
Without considering the non-negativity constraint, the solution of PAE-C type optimization problem (16) is
where is the mean value of back-tested cross-entropy-based performance and is computed as:
Because the proof of theorem 2 is almost the same as theorem 1, we omit the proof.
No matter which type of loss function is considered, should be further projected onto the -dimensional unit simplex [24] to satisfy the non-negativity constraint of weighted averaging
Theorem 3.
Without considering the non-negativity constraint, the solution of problem (17) is
where denotes the -dimensional vector to distinguish with -dimensional in (19) and (21), and is the average value of trend composite. Then is calculated as:
The proof of theorem 3 is in Appendix B.
is further projected onto a -dimensional unit simplex [24] to satisfy the non-negativity constraint
Algorithm 1. The general computing process of PAE-R and PAE-C.
| Algorithm 1 PAE framework |
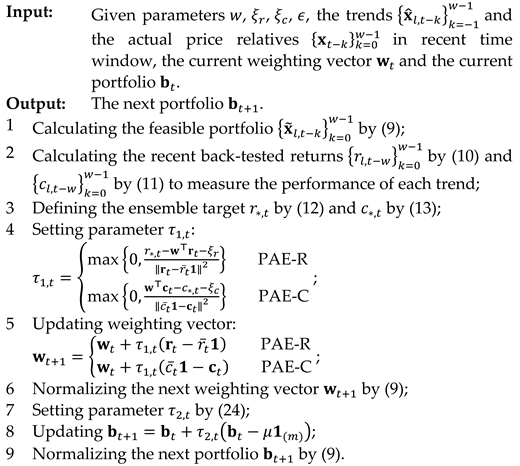 |
4.4. Complexity Analysis
In the context of online portfolio selection, the running efficiency is a crucial factor to consider as the application has time constraints. The ideal candidate for high-frequency trading [29] would be a portfolio selection strategy that effectively balances wealth accumulation and computational efficiency. The main factors that affect the computational cost of PAE are the total investing periods , the number of assets , and the number of trends . All the steps of PAE cost except step 7, which consume . Table 1 shows the time complexity for different portfolio selection strategies. Our PAE algorithm achieves the lowest complexity when using multiple trend estimators. As the number of trends and assets increases, PAE is still efficient to compute. To be specific, PAE maintains the complexity in , which makes it applicable to time-limited applications.
5. Experiments and Results
In this section, we mainly focus on the comparison studies. First, we introduce experimental datasets and competing portfolio strategies and criteria of evaluation in turn. Then, we conduct experiments on parameter settings and ensemble effectiveness. Finally, we report and analyze the results of comparison studies, and also discuss the transaction costs and running time.
5.1. Data
To improve the reproducibility of the experiments and get close to the recent market, we conduct comparison studies on four popular traditional datasets and three new datasets. All of them are publically available. Four traditional datasets include: NYSE(O) [30], NYSE(N) [8], TSE [31], and MSCI [7]. Three new datasets include: NYSE19 [16], ZZ28 [32], and ETF23.
They contain real-world daily close price relatives from different stock and index markets, including the New York Stock Exchange (NYSE(O), NYSE(N), NYSE19), the Toronto Stock Exchange (TSE), the MSCI World Index (MSCI), and the China Securities 500 index (ZZ28). In 2023, China’s ETF market achieved leapfrog development, with a total scale exceeding 1.8 trillion yuan, an increase of nearly 40% from 2022. The significant growth of this market underscores its importance, and we propose the ETF23 dataset, comprising the largest ETFs by market capitalization from 23 different industries in the Chinese ETF market. The detailed information about these datasets are listed in Table 2.
5.2. Competing Portfolio Srategies
For comparison, we consider some benchmarks and a number of existing online portfolio management strategies (including some the state-of-the-art ones). In the following, we show these benchmarks and strategies, where the parameters of each strategy are set according to the recommendations of the corresponding studies.
- BAH: the uniform Buy-And-Hold trading strategy. The strategy invests equally in assets at the onset and maintains this allocation throughout.
- OLMAR [9]: It takes the moving average to predict the future price. The parameters are set as: and .
- PPT [10]: It takes the PP in recent time window to predict the future price. The parameters are set as: and .
- AICTR [25]: The adaptive input and composite trend representation combines three trends (SMA, EMA, PP) and market conditions through radial basis functions. The parameters are set as: , , and .
- SPOLC [16]: The short-term portfolio optimization with loss control strategy with the window size 𝑤 = 5 and the mixing parameter 𝛾 = 0.025.
5.3. Evaluation Critteria
For the convenience of calculations, we assume that the initial wealth is 1 [33]. Under such a circumstance, the single-period growth rate is equal to portfolio’s gross return at period, and the cumulative growth rate is equal to cumulative wealth. Then, we evaluate the characteristics of the aforementioned portfolio strategies by two criteria and five performance metrics. The two criteria are return and risk-adjusted return. Basically, the higher the values of metrics are in return and risk-adjusted return criteria, the better the portfolio strategy performs.
- Cumulative wealth. The cumulative wealth (CW) is utilized as the key evaluation metric for the investment performance of each portfolio selection algorithm.
- Annualized Percentage Yield. The annualized percentage yield (APY) is a widely used metric for evaluating investment returns. It represents the average return of a strategy over the course of a year. APY is computed as follow:where represents the number of years according to trading days. In this study, all datasets consist of daily prices. Therefore, is calculated as divided by 252, which is the average number of annual trading days.
- Sharpe ratio. In the realm of financial trading, it is often observed that higher returns are accompanied by elevated levels of risk. Thus, it is crucial for an investment algorithm to strike a balance between maximizing returns and managing risks. The Sharpe Ratio (SR) serves as a widely utilized metric for evaluating risk-adjusted returns and is defined as follows:Where is the return of a risk-free asset and is set to 0 in this paper since we do not consider a risk-free asset, is the standard deviation of return estimated by the samples in trading periods.
- Calmar ratio. The Calmar Ration (CR) [36] is a comparison of the average annual compound return and the maximum drawdown (MDD) risk, which is widely adopted in fund management. The calculation formula is CR=APY/MDD, where .
In addition, to test whether the strategy achieves its returns just by luck [34], we introduce the statistic t-test method into the measurement of the proposed strategies. Particularly, a regression model of portfolio excess returns and market excess returns is established as follows:
By assuming that parameter follows a normal distribution, we conduct a statistic -test on and derive the probability of achieving the excess return by luck.
5.4. Results
5.4.1. Parameter Setting
Previous studies [10,16,17,18] typically search for parameters across all datasets, and they carry the risks of overfitting. To finely tune hypermeters in PAE and avoid overfitting, we tune our PAE in the oldest dataset NYSE(O) and make sure the training set ends earlier than the start of other datasets.
We take four trends (, , and ) as the input of PAE and initiate the weighting vector as = [1/4, 1/4, 1/4, 1/4]. The value of is set to 5. It aligns with previous research [9,10,11,16,25] and is a commonly used time window size in stock and futures investment because it reflects the recent financial environment. To run trend back-test step, the PAE strategies require at least days of data. For fairness, all strategies adopt their respective algorithm outputs for investment from the sixth day.
Regarding the threshold parameters , and , an initial approximation is made by following gird searching. As shown in Figure 1, PAE-C performs better and stable around and . Thus, we recommend to choose and for PAE-C. Similarly, Figure 1 indicates that PAE-R performs better and stable around and We recommend to choose and for our PAE-R. The rest experiments adopt this parameter setting for comparison.
5.4.2. Ensemble Effectiveness
Drawing upon from previous study [25], we compare our PAE performance against single trend situation to evaluate the effectiveness of our ensemble method in combining diverse trends for improved investment performance.
Different trend estimators exhibit significant variability in performance across various datasets. As what we initially emphasized, it is impossible to predict which trend estimator will demonstrate the best performance over the entire investment period. Therefore, we evaluate the effectiveness of our ensemble strategy from two perspectives. First, we expect the strategy to optimize the performance. Second, the baseline for evaluating this strategy is that its performance should not be inferior to that of any single trend estimator.
In Table 3, the best-performing strategy is highlighted in bold, while the two worst-performing strategies are underlined. The results from Table 3 clearly show that our PAE-C and PAE-R strategies consistently exceed the baseline method. Furthermore, they demonstrate leading performance on multiple datasets. It significantly validates the effectiveness of the PAE strategy in integrating trend estimators.
5.4.3. Comparison Studies
Table 4 shows the performance of PAE and competing strategies on six real-world datasets. We evaluate the performance of portfolio strategies comprehensively with respect to return and risk-adjusted return.
In terms of return, PAE-R demonstrates the best performance for most of the datasets, especially in TSE and NYSE(N), where its cumulative wealth far exceeds other strategies. PAE-C performs well in the MSCI and ETF23 datasets but generally is inferior to PAE-R for other datasets. To provide a visual representation of the evolution of trajectory, cumulative wealth plots of various portfolio selection strategies on the benchmark datasets are presented in Figure 2. The plots reveal that the PAE algorithm consistently attains higher wealth return compared to others over a majority of time periods, demonstrating the superiority of the model in portfolio decision-making.
Regarding the risk-adjusted returns, PAE-R outperforms other strategies for most of the datasets, especially in ETF23 and TSE. PAE-C has a higher Sharpe ratio in the MSCI dataset, indicating better performance. PAE-R exhibits higher information ratios in TSE and MSCI, indicating stronger relative outperformance against benchmarks. PAE-C, while performing well in multiple datasets, is generally not as strong as PAE-R. PAE-R almost always has the highest Calmar ratio across all datasets, particularly in ETF23 and TSE. PAE-C shows strength in the MSCI and NYSE19 datasets but is usually inferior to PAE-R for other datasets.
Besides the quantitative evaluation results, Table 5 lists the results of t-test to justify the effectiveness of the proposed PAE. Table 5 shows that except for NYSE19 and ETF23, it is almost impossible for PAE-C to produce the corresponding returns simply by luck at a high confidence level of 97%. There are also around 80% of confidence level for PAE-C not to produce their returns by luck in the rest datasets. The results also indicate that the values of of PAE-R are significantly larger than 0 at a high confidence level of 99% on four datasets while the rest are higher than 90%.
In general, PAE show noticeable advantages over other competing strategies in terms of comprehensive performance.
5.4.4. Transaction Costs
The paramount concern in practical real-world trading is the transaction cost. When there is a transaction cost rate of r for each trade in the portfolio re-balancing process, the cumulative wealth can be determined using the proportional transaction cost model [9] as:
where is the price adjusted portfolio of asset in the period and is set to . The term represents the transaction cost incurred from the adjustment of portfolio to through re-balancing.
To evaluate the practicality of the portfolio selection algorithms, we perform experiments on cumulative wealth while changing the transaction cost rate between 0 and 0.5%. The findings, displayed in Figure 3, indicate that PAE-R delivers superior results on NYSE(N), MSCI, TSE and ETF23. Additionally, PAE-R is comparable to other the state-of-the-art algorithms on the remaining datasets. PAE-C shows competitive performance in MSCI and NYSE19.
This demonstrates that PAE is a capable framework for managing transaction costs, making it suitable for real-world financial environments.
5.4.5. Running Time
To evaluate the computational cost of the PAE, we conducted 5 iterations of the algorithms on each dataset using an AMD 3500x CPU with two 16G DDR4 3000MHz RAM. The average running times (in seconds) of PAE-C per trading period are 0.0064, 0.0064, 0.0071, 0.0064, 0.0067 and 0.0073 on NYSE(N), MSCI, TSE, ZZ28, NYSE19 and ETF23, respectively. The average running times (in seconds) of PAE-R per trading period are 0.0056, 0.0056, 0.0063, 0.0057, 0.0056 and 0.0060. It indicates that PAE has a fast running time, making it applicable to real-world financial environments that require efficient computations.
6. Conclusion and Future Work
In this study, we present a Passive Aggressive Ensemble (PAE) framework, a new approach for online portfolio selection to integrate multiple trend estimators. PAE stands out by efficiently combining different estimators and enhancing their performance through a novel weighting mechanism. Our extensive experiments across various real-world datasets demonstrate that PAE not only outperforms the competing algorithms in key evaluation metrics but also shows potential in managing transaction costs effectively. This approach is particularly notable for its adaptability to different market conditions and scalability, making it suitable for practical financial applications.
This paper envisages three primary directions for future research. First, the exploration of different loss functions: In our framework, the weighting factors of different trend estimators are determined by their relative loss to the market. Identifying more optimal loss functions to evaluate the effectiveness of trend estimators could significantly enhance the overall performance of the framework. Second, the investigation into the application of regularization techniques in ensemble methods: Regularization techniques can prevent overfitting and bolster the robustness of the ensemble approach. Finally, we acknowledge that our model has substantial room for improvement in high transaction fee environments. Therefore, refining the PAE model to improve its performance by considering transaction costs is also a pivotal aspect of our forthcoming research endeavors.
Author Contributions
Conceptualization, K.X.; methodology, K.X.; software, K.X.; validation, K.X.; formal analysis, K.X.; investigation, K.X.; resources, K.X.; data curation, K.X.; writing—original draft preparation, K.X.; writing—review and editing, H.Y., Y.C.; visualization, K.X.; supervision, J.Y., H.Y., H.F. and Y.C.; project administration, H.F., Y.C.; funding acquisition, Y.C. All authors have read and agreed to the published version of the manuscript.
Funding
This research was funded by the Stabilization Support Plan for Shenzhen Higher Education Institutions, grant number 20200812165210001.
Data Availability Statement
The dataset, i.e., ETF23, is free to download from website: https://drive.google.com/file/d/1W89bkqKqQJioLC9ljIf_mlFHgk9fPcSh/view?usp=sharing, or https://pan.baidu.com/s/1j3wMPVHHWiifKW4jJ2iS-Q?pwd=ETF0 with password ETF0.
Conflicts of Interest
The authors declare no conflicts of interest.
Appendix A
Proof of Theorem 1.
When , the constraint in (14) is satisfied by , and it becomes the optimal solution. For the case where , we can solve the optimization problem by introducing the Lagrangian of the problem in (14):
where and are the Lagrangian multipliers. Taking the gradient with respect to and setting it to zero, we get,
By left multiplying on both sides, we get
where is the mean value of back-tested returns. Plugging the above equation to (32), we get the update of
Simplifying the formula after plugging (34) and (35) to Lagrangian (31), we get
Taking derivative with respect to and setting it to zero, we have
which implying,
Further projecting to , we complete the proof of (19). □
Appendix B
Proof of Theorem 3.
The Lagrangian of optimization problem (17) is
where and are the Lagrangian multipliers. Taking the gradient with respect to and setting it to zero, we have
where denotes the -dimensional vector. By left multiplying both sides with , we have
where . Plugging the above equation to (40), we have the update of
Simplifying the formula after plugging (42) and (43) to Lagrangian (39), we have
Taking derivative with respect to and setting it to zero, we arrive at
which can be simplified to,
Further projecting to we finally complete the proof of (24). □
References
- Li B, Hoi S C H. Online portfolio selection: A survey[J]. ACM Computing Surveys (CSUR), 2014, 46(3): 1-36. [CrossRef]
- Lai Z R, Yang H. A survey on gaps between mean-variance approach and exponential growth rate approach for portfolio optimization[J]. ACM Computing Surveys (CSUR), 2022, 55(2): 1-36. [CrossRef]
- Agarwal A, Hazan E, Kale S, et al. Algorithms for portfolio management based on the newton method[C]//Proceedings of the 23rd international conference on Machine learning. 2006: 9-16. [CrossRef]
- Györfi L, Udina F, Walk H. Nonparametric nearest neighbor based empirical portfolio selection strategies[J]. 2008. [CrossRef]
- Kahneman D, Tversky A. Prospect theory: An analysis of decision under risk[M]//Handbook of the fundamentals of financial decision making: Part I. 2013: 99-127. [CrossRef]
- Shiller R, J. From efficient markets theory to behavioral finance[J]. Journal of economic perspectives, 2003, 17(1): 83-104. [CrossRef]
- Li B, Zhao P, Hoi S C H, et al. PAMR: Passive aggressive mean reversion strategy for portfolio selection[J]. Machine learning, 2012, 87: 221-258. [CrossRef]
- Li B, Hoi S C H, Zhao P, et al. Confidence weighted mean reversion strategy for online portfolio selection[J]. ACM Transactions on Knowledge Discovery from Data (TKDD), 2013, 7(1): 1-38. [CrossRef]
- Li B, Hoi S C H, Sahoo D, et al. Moving average reversion strategy for on-line portfolio selection[J]. Artificial Intelligence, 2015, 222: 104-123. [CrossRef]
- Lai Z R, Dai D Q, Ren C X, et al. A peak price tracking-based learning system for portfolio selection[J]. IEEE Transactions on Neural Networks and Learning Systems, 2017, 29(7): 2823-2832. [CrossRef]
- Dai H L, Liang C X, Dai H M, et al. An online portfolio strategy based on trend promote price tracing ensemble learning algorithm[J]. Knowledge-Based Systems, 2022, 239: 107957. [CrossRef]
- Fern A, Givan R. Online ensemble learning: An empirical study[J]. Machine Learning, 2003, 53: 71-109.
- Von Krannichfeldt L, Wang Y, Hug G. Online ensemble learning for load forecasting[J]. IEEE Transactions on Power Systems, 2020, 36(1): 545-548. [CrossRef]
- Helmbold D P, Schapire R E, Singer Y, et al. On-line portfolio selection using multiplicative updates[J]. Mathematical Finance, 1998, 8(4): 325-347. [CrossRef]
- Li Y, Zheng X, Chen C, et al. Exponential gradient with momentum for online portfolio selection[J]. Expert Systems with Applications, 2022, 187: 115889. [CrossRef]
- Lai Z R, Tan L, Wu X, et al. Loss control with rank-one covariance estimate for short-term portfolio optimization[J]. The Journal of Machine Learning Research, 2020, 21(1): 3815-3851.
- Dai H L, Huang C Y, Dai H M, et al. A novel adjusted learning algorithm for online portfolio selection using peak price tracking approach[J]. Decision Analytics Journal, 2023: 100256. [CrossRef]
- Cai X, Ye Z. Gaussian weighting reversion strategy for accurate online portfolio selection[J]. IEEE Transactions on Signal Processing, 2019, 67(21): 5558-5570. [CrossRef]
- Cai, X. Vector autoregressive weighting reversion strategy for online portfolio selection[C]//Proceedings of the twenty-ninth international conference on international joint conferences on artificial intelligence. 2021: 4469-4475.
- Wu B, Lyu B, Gu J. Weighted Multivariate Mean Reversion for Online Portfolio Selection[C]//Joint European Conference on Machine Learning and Knowledge Discovery in Databases. Cham: Springer Nature Switzerland, 2023: 255-270.
- Guo, Sini, et al. “Online portfolio selection with state-dependent price estimators and transaction costs.” European Journal of Operational Research (2023).
- Guo S, Gu J W, Ching W K. Adaptive online portfolio selection with transaction costs[J]. European Journal of Operational Research, 2021, 295(3): 1074-1086. [CrossRef]
- Kumar A, Segev A. Bayesian Ensembled Knowledge Extraction Strategy for Online Portfolio Selection[C]//2022 IEEE International Conference on Big Data (Big Data). IEEE, 2022: 4148-4156.
- Duchi J, Shalev-Shwartz S, Singer Y, et al. Efficient projections onto the l 1-ball for learning in high dimensions[C]//Proceedings of the 25th international conference on Machine learning. 2008: 272-279.
- Lai Z R, Dai D Q, Ren C X, et al. Radial basis functions with adaptive input and composite trend representation for portfolio selection[J]. IEEE Transactions on Neural Networks and Learning Systems, 2018, 29(12): 6214-6226. [CrossRef]
- De Boer, Pieter-Tjerk, et al. “A tutorial on the cross-entropy method.” Annals of operations research 134 (2005): 19-67. [CrossRef]
- Huang D, Zhou J, Li B, et al. Robust median reversion strategy for online portfolio selection[J]. IEEE Transactions on Knowledge and Data Engineering, 2016, 28(9): 2480-2493. [CrossRef]
- Crammer, Koby, et al. “Online Passive-Aggressive Algorithms.” Journal of Machine Learning Research 7.19 (2006): 551-585.
- Aldridge, Irene. High-frequency trading: a practical guide to algorithmic strategies and trading systems. Vol. 604. John Wiley & Sons, 2013.
- Cover, Thomas M. “Universal portfolios.” Mathematical finance 1.1 (1991): 1-29. [CrossRef]
- Borodin, Allan, Ran El-Yaniv, and Vincent Gogan. “Can we learn to beat the best stock.” Advances in Neural Information Processing Systems 16 (2003).
- Zhang, Yong, et al. “Combining expert weights for online portfolio selection based on the gradient descent algorithm.” Knowledge-Based Systems 234 (2021): 107533. [CrossRef]
- Li, Bin, et al. “Transaction cost optimization for online portfolio selection.” Quantitative Finance 18.8 (2018): 1411-1424. [CrossRef]
- Grinold, Richard C., and Ronald N. Kahn. “Active portfolio management.” (2000).
- Treynor, Jack L., and Fischer Black. “How to use security analysis to improve portfolio selection.” The journal of business 46.1 (1973): 66-86.
- Young T, W. Calmar ratio: A smoother tool[J]. Futures, 1991, 20(1): 40.
Figure 1.
Parameter sensitivity of PAE strategies in terms of CW. Gird searching is used for finding the optimal threshold parameters.
Figure 1.
Parameter sensitivity of PAE strategies in terms of CW. Gird searching is used for finding the optimal threshold parameters.
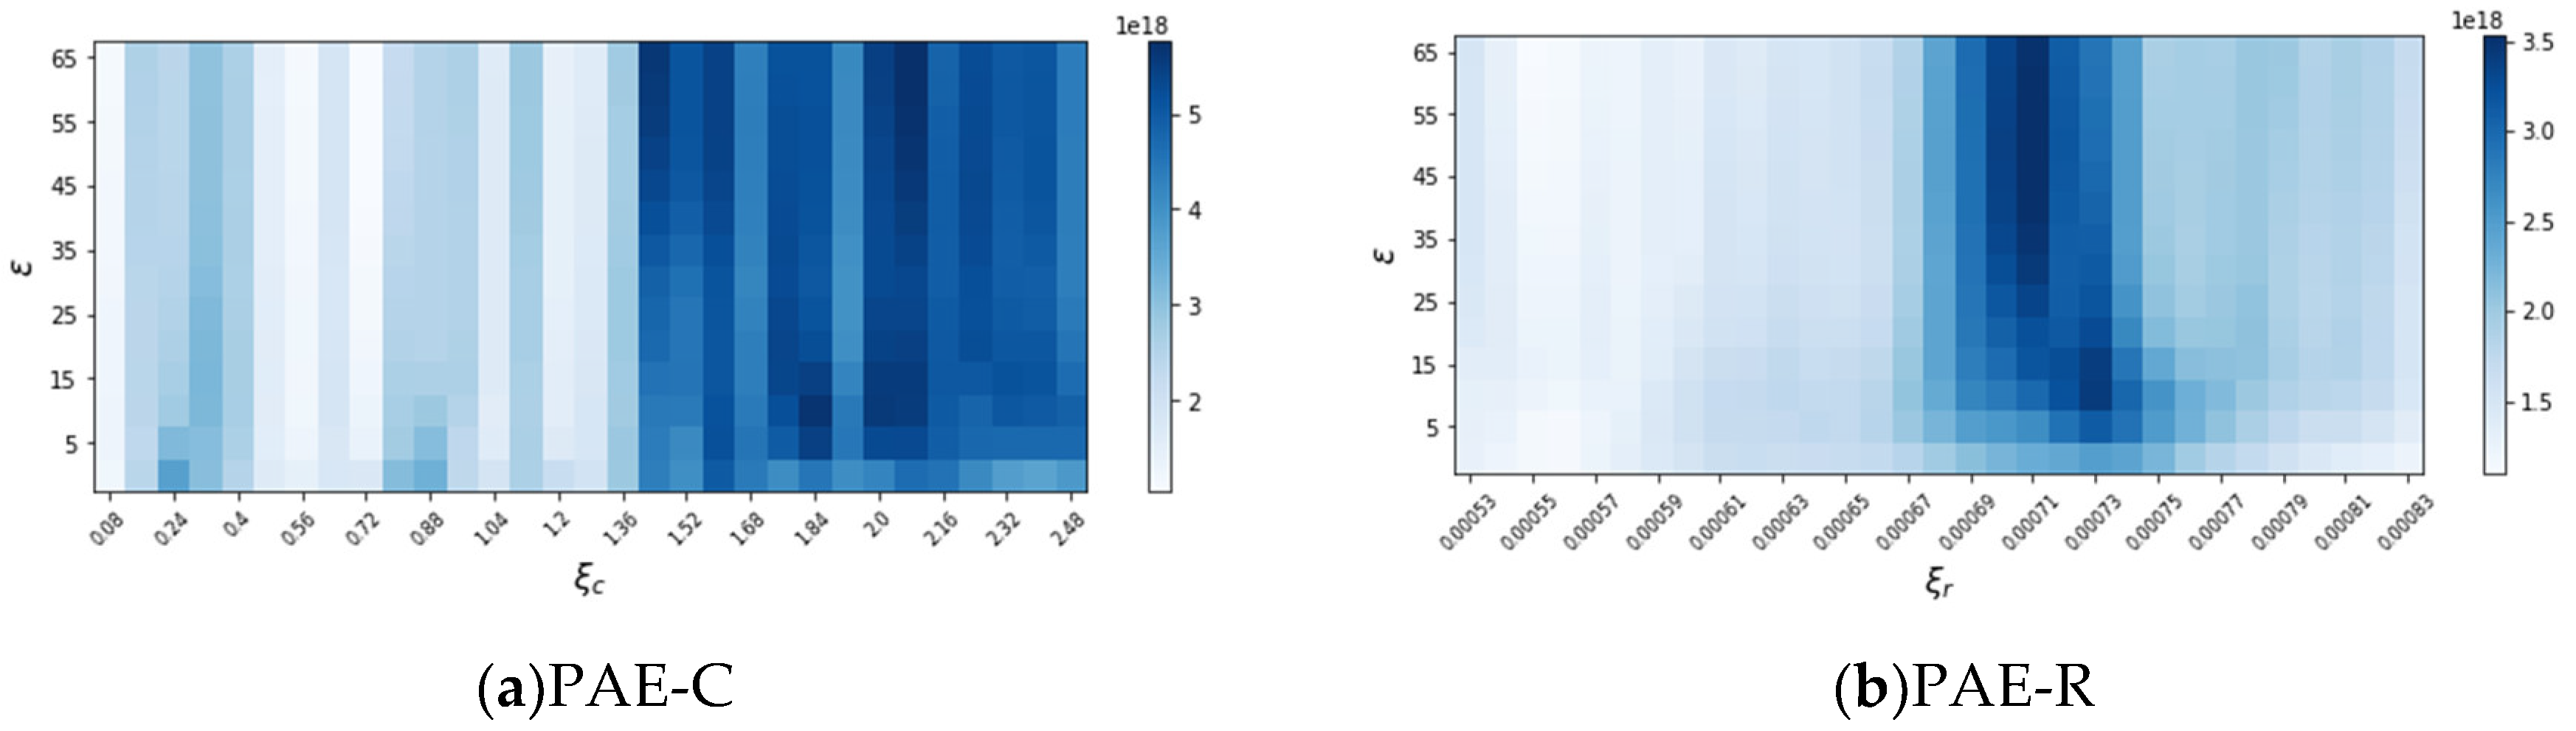
Figure 2.
Cumulative wealth of different portfolio selection algorithms during the entire investments on six datasets.
Figure 2.
Cumulative wealth of different portfolio selection algorithms during the entire investments on six datasets.
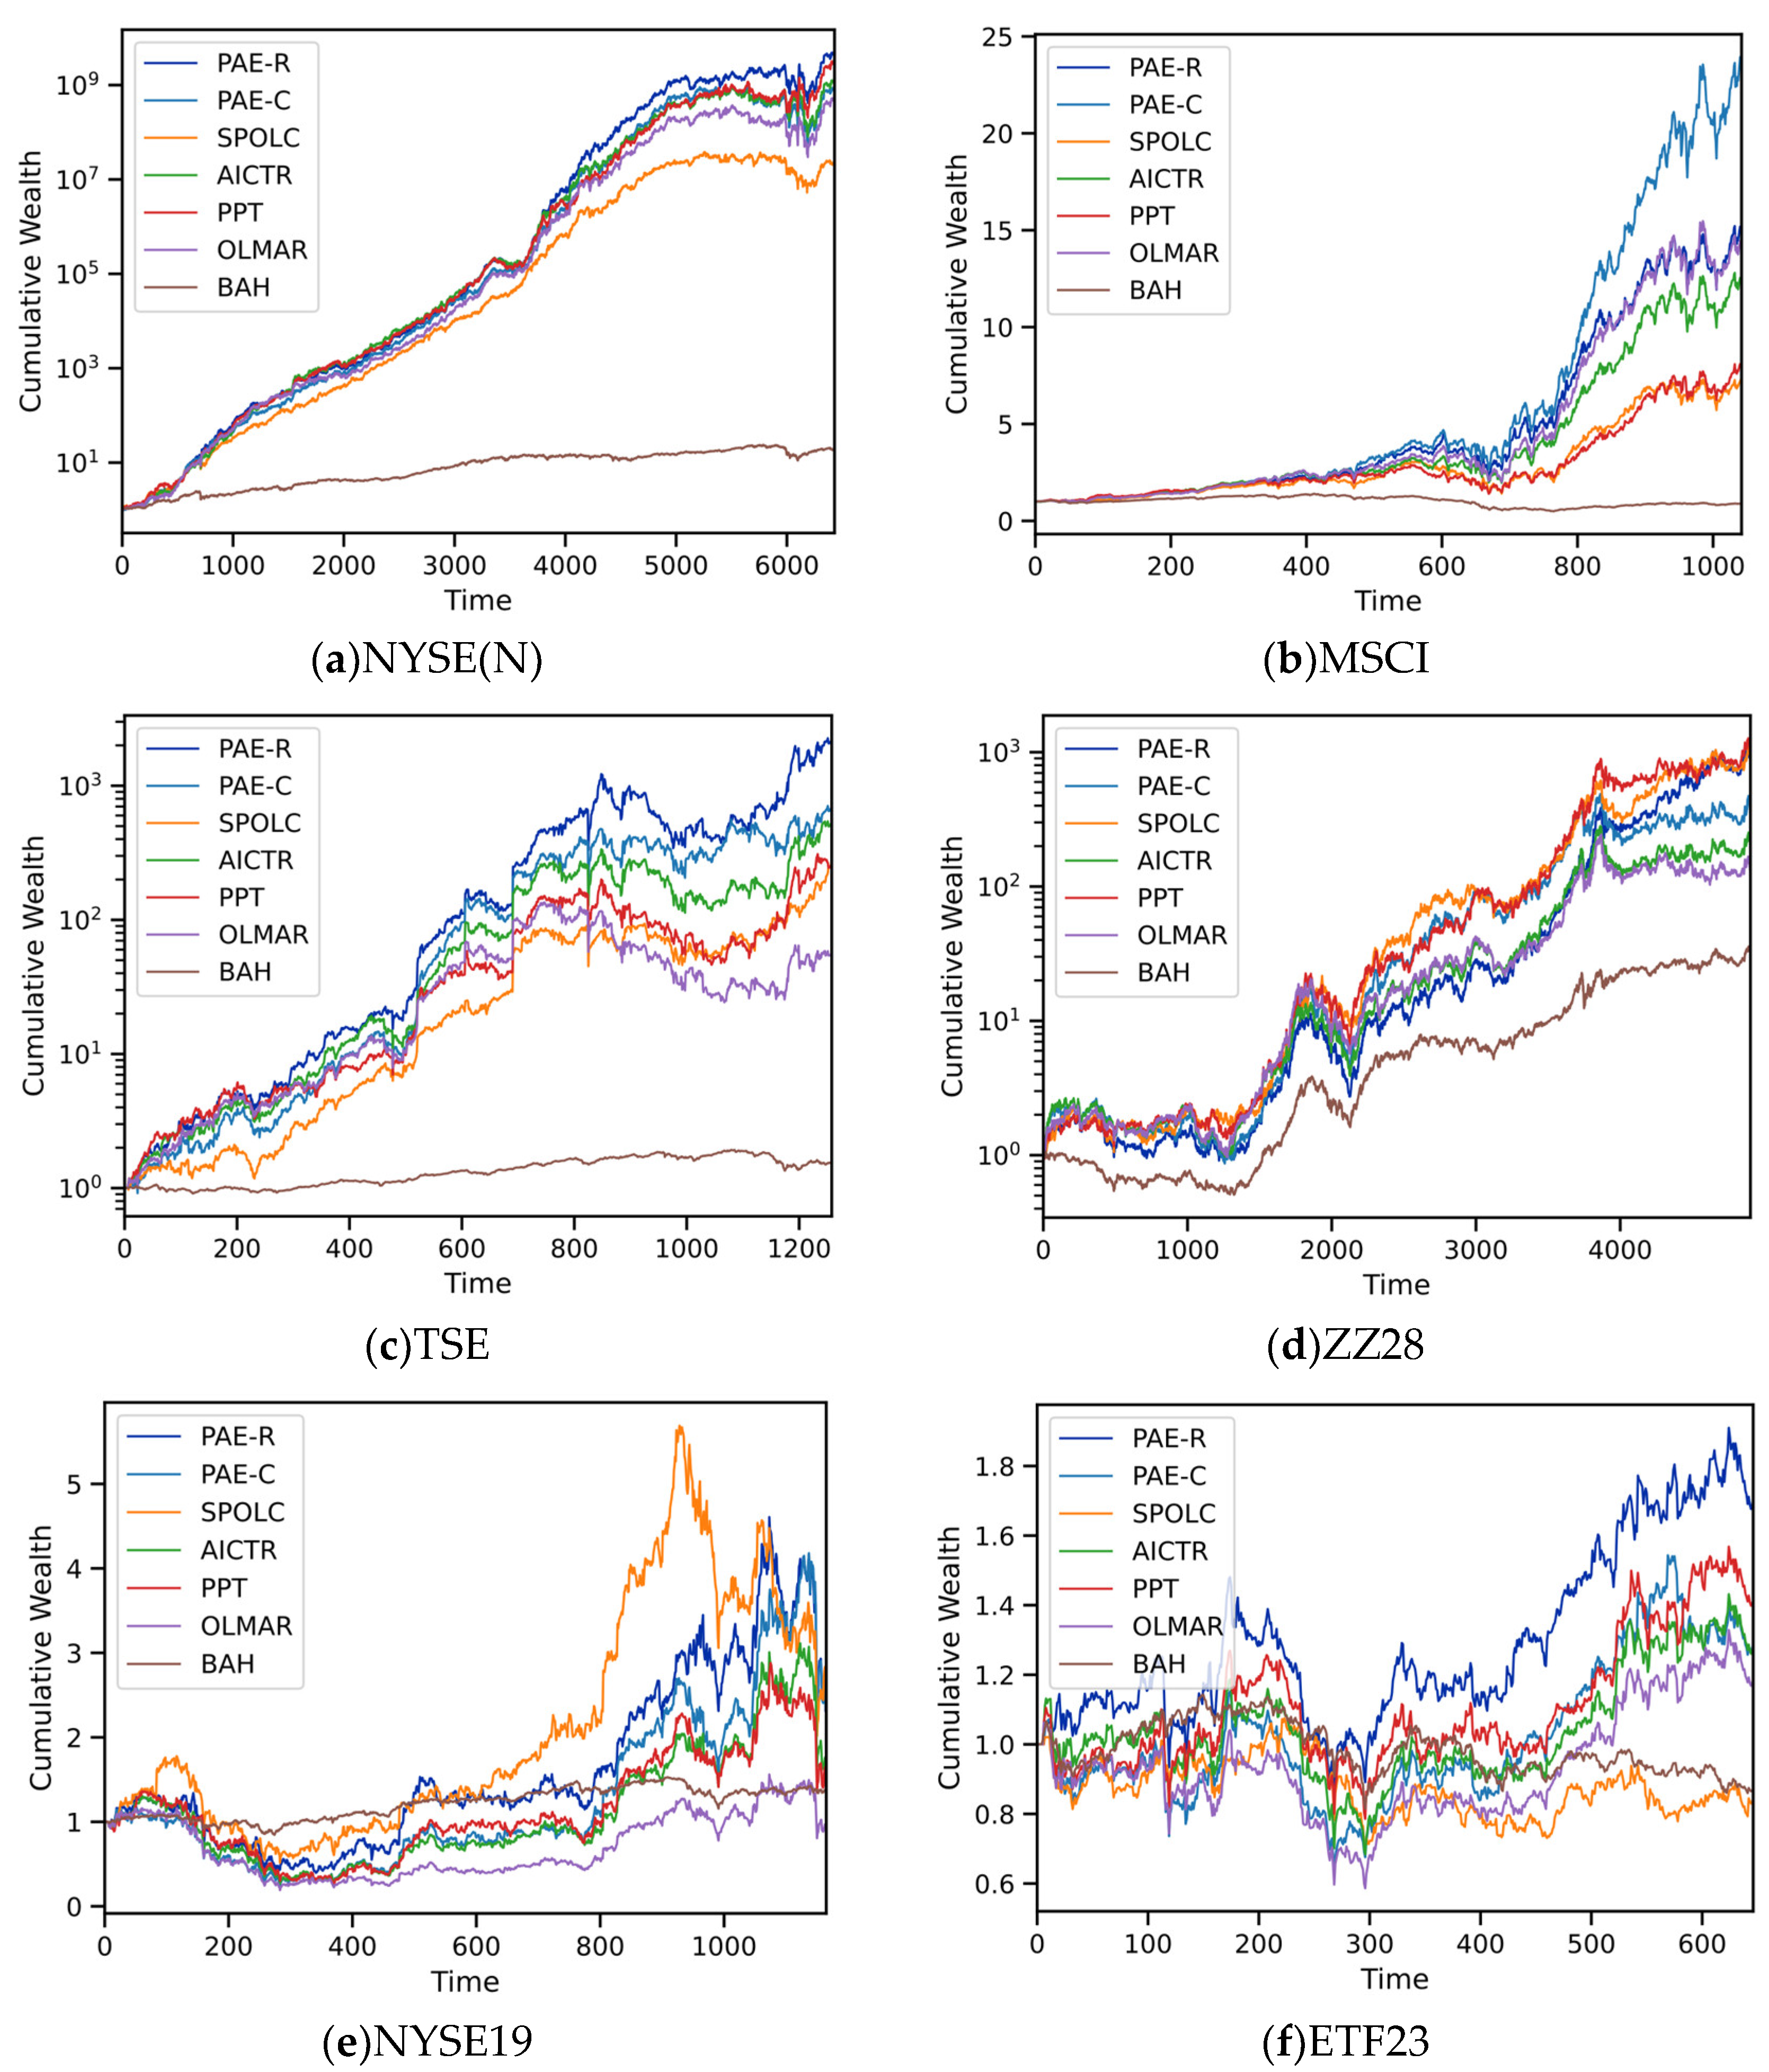
Figure 3.
Cumulative wealth of different algorithms under different transaction cost rates on six benchmarks datasets.
Figure 3.
Cumulative wealth of different algorithms under different transaction cost rates on six benchmarks datasets.
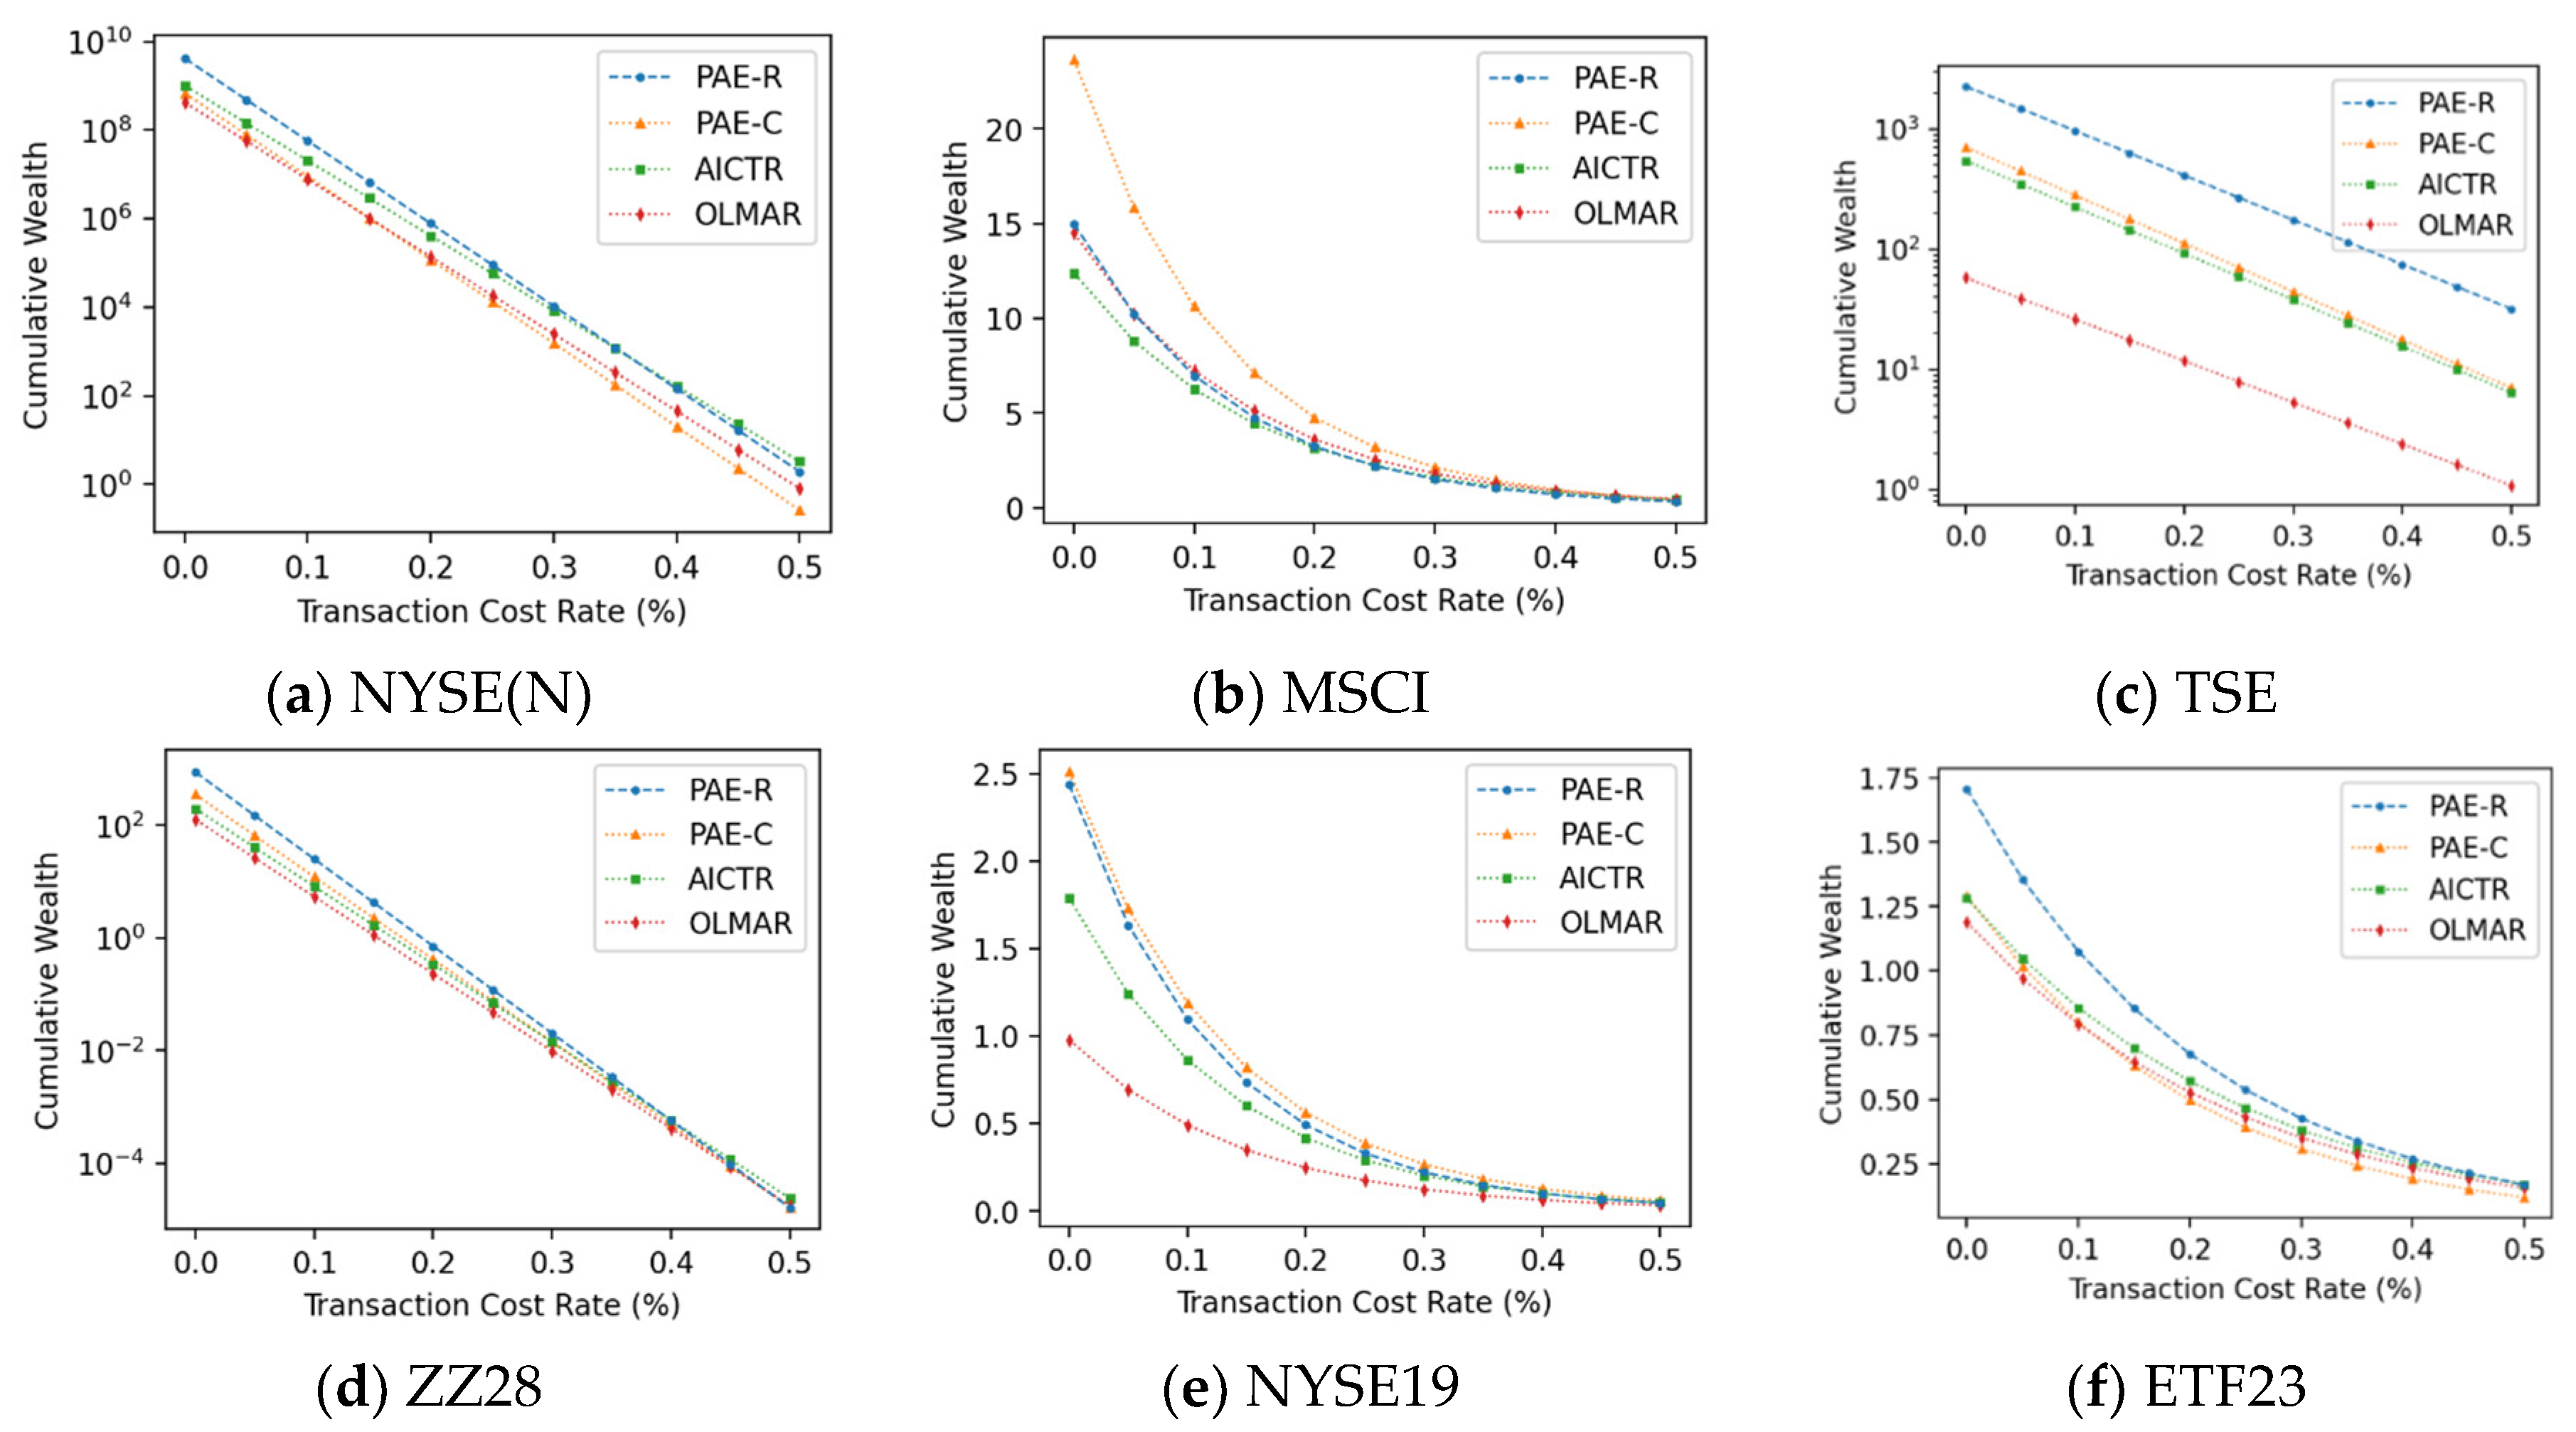

Table 1.
Complexity comparison with other strategies.
| Type | Strategies | Complexity |
| Single trend estimator | OLMAR | |
| PPT | ||
| Multiple trend estimators | AICTR | |
| PAE |
Table 2.
Detailed Information of 7 datasets.
| Dataset | Region | Time | Days | Assets |
| NYSE(O)* | US | 3/7/1962 - 31/12/1984 | 5651 | 36 |
| NYSE(N) | US | 1/1/1985 - 30/6/2010 | 6431 | 23 |
| TSE | CA | 4/1/1994 - 31/12/1998 | 1259 | 88 |
| MSCI | Global | 1/4/2006 - 31/3/2010 | 1043 | 24 |
| NYSE19 | US | 2/1/2015 - 4/9/2019 | 1167 | 47 |
| ZZ28 | CN | 4/1/2000 - 1/4/2020 | 4905 | 28 |
| ETF23 | CN | 1/2/2021-1/10/2023 | 647 | 23 |
* NYSE(O) was used as the parameter search.
Table 3.
CWs of different trend estimator. The best-performing strategy is highlighted in bold, while the two worst-performing strategies are underlined.
Table 3.
CWs of different trend estimator. The best-performing strategy is highlighted in bold, while the two worst-performing strategies are underlined.
| Trend estimator | NYSE(N) | MSCI | TSE | ZZ28 | NYSE19 | ETF23 |
| PP | 2.08E+09 | 8.33 | 226.84 | 906.7 | 1.46 | 1.4 |
| EMA | 4.64E+08 | 23.6 | 680.83 | 283.58 | 2.46 | 1.69 |
| SMA | 4.26E+08 | 14.1 | 76.77 | 134.64 | 1.14 | 1.26 |
| IP | 1.16E+06 | 10.28 | 1.39E+03 | 185.13 | 9.34 | 0.84 |
| PAE-C | 6.83E+08 | 23.63 | 706 | 348.31 | 2.51 | 1.29 |
| PAE-R | 4.15E+09 | 14.98 | 2.26E+03 | 867.83 | 2.44 | 1.71 |
Table 4.
Performance of different strategies. The best score is highlighted in each row.
| Dataset | Metrics | BAH | OLMAR | PPT | AICTR | SPOLC | PAE-C | PAE-R |
| NYSE(N) | CW | 18.29 | 4.19E+08 | 2.63E+09 | 1.01E+09 | 1.99E+07 | 6.83E+08 | 4.15E+09 |
| APY | 0.121 | 1.177 | 1.339 | 1.254 | 0.932 | 1.219 | 1.382 | |
| SR | 0.046 | 0.104 | 0.108 | 0.106 | 0.105 | 0.105 | 0.113 | |
| IR | -0.025 | 0.096 | 0.102 | 0.099 | 0.095 | 0.097 | 0.107 | |
| CR | 0.225 | 1.28 | 1.561 | 1.374 | 1.082 | 1.298 | 1.629 | |
| MSCI | CW | 0.89 | 14.5 | 7.99 | 12.38 | 7.34 | 23.63 | 14.98 |
| APY | -0.027 | 0.908 | 0.652 | 0.837 | 0.618 | 1.147 | 0.923 | |
| SR | 0.001 | 0.116 | 0.09 | 0.108 | 0.09 | 0.132 | 0.116 | |
| IR | -0.036 | 0.169 | 0.136 | 0.158 | 0.132 | 0.193 | 0.17 | |
| CR | -0.041 | 1.889 | 1.269 | 2.026 | 1.13 | 2.677 | 1.901 | |
| TSE | CW | 1.56 | 57.79 | 265.05 | 544.47 | 277.1 | 706 | 2.26E+03 |
| APY | 0.093 | 1.252 | 2.055 | 2.529 | 2.083 | 2.717 | 3.692 | |
| SR | 0.048 | 0.082 | 0.101 | 0.111 | 0.111 | 0.114 | 0.129 | |
| IR | -0.002 | 0.078 | 0.098 | 0.108 | 0.107 | 0.111 | 0.127 | |
| CR | 0.311 | 1.527 | 2.672 | 3.81 | 4.087 | 4.779 | 5.127 | |
| ZZ28 | CW | 31.76 | 124.58 | 922.47 | 195.73 | 853.07 | 348.31 | 867.83 |
| APY | 0.194 | 0.281 | 0.42 | 0.311 | 0.415 | 0.351 | 0.416 | |
| SR | 0.048 | 0.05 | 0.063 | 0.053 | 0.068 | 0.057 | 0.063 | |
| IR | 0.002 | 0.024 | 0.044 | 0.029 | 0.044 | 0.034 | 0.043 | |
| CR | 0.335 | 0.389 | 0.583 | 0.436 | 0.711 | 0.474 | 0.548 | |
| NYSE19 | CW | 1.37 | 0.98 | 1.5 | 1.79 | 2.45 | 2.51 | 2.44 |
| APY | 0.07 | -0.005 | 0.092 | 0.133 | 0.214 | 0.22 | 0.213 | |
| SR | 0.034 | 0.018 | 0.028 | 0.032 | 0.04 | 0.04 | 0.039 | |
| IR | -0.022 | 0.009 | 0.021 | 0.024 | 0.033 | 0.033 | 0.032 | |
| CA | 0.288 | -0.006 | 0.113 | 0.168 | 0.299 | 0.277 | 0.301 | |
| ETF23 | CW | 0.87 | 1.19 | 1.41 | 1.28 | 0.84 | 1.29 | 1.71 |
| APY | -0.053 | 0.07 | 0.143 | 0.102 | -0.064 | 0.104 | 0.231 | |
| SR | -0.012 | 0.023 | 0.034 | 0.028 | -0.003 | 0.029 | 0.048 | |
| IR | -0.005 | 0.036 | 0.051 | 0.043 | 0.005 | 0.043 | 0.067 | |
| CR | -0.185 | 0.156 | 0.375 | 0.24 | -0.181 | 0.224 | 0.532 |
Table 5.
Statistical t -test of performance of PAE-C and PAE-R.
| Statistics | NYSE(N) | MSCI | TSE | ZZ28 | NYSE19 | ETF23 | ||||||
| PAE-C | PAE-R | PAE-C | PAE-R | PAE-C | PAE-R | PAE-C | PAE-R | PAE-C | PAE-R | PAE-C | PAE-R | |
| 0.0030 | 0.0033 | 0.0033 | 0.0029 | 0.0061 | 0.0071 | 0.0007 | 0.0009 | 0.0009 | 0.0014 | 0.0008 | 0.0012 | |
| 1.3411 | 1.3561 | 1.2009 | 1.1946 | 2.2057 | 2.0434 | 1.0666 | 1.0718 | 1.7696 | 1.4239 | 1.1315 | 1.1495 | |
| t-statistics | 7.3420 | 8.0863 | 6.3287 | 5.5531 | 3.6954 | 4.2855 | 2.2146 | 2.8055 | 1.3519 | 1.7481 | 1.1124 | 1.7443 |
| p-value | 0.0000 | 0.0000 | 0.0000 | 0.0000 | 0.0002 | 0.0000 | 0.0268 | 0.0050 | 0.1769 | 0.0807 | 0.2664 | 0.0816 |
Disclaimer/Publisher’s Note: The statements, opinions and data contained in all publications are solely those of the individual author(s) and contributor(s) and not of MDPI and/or the editor(s). MDPI and/or the editor(s) disclaim responsibility for any injury to people or property resulting from any ideas, methods, instructions or products referred to in the content. |
© 2024 by the authors. Licensee MDPI, Basel, Switzerland. This article is an open access article distributed under the terms and conditions of the Creative Commons Attribution (CC BY) license (http://creativecommons.org/licenses/by/4.0/).
Copyright: This open access article is published under a Creative Commons CC BY 4.0 license, which permit the free download, distribution, and reuse, provided that the author and preprint are cited in any reuse.