Submitted:
08 February 2024
Posted:
09 February 2024
Read the latest preprint version here
Abstract
Keywords:
1. Introduction
2. Results
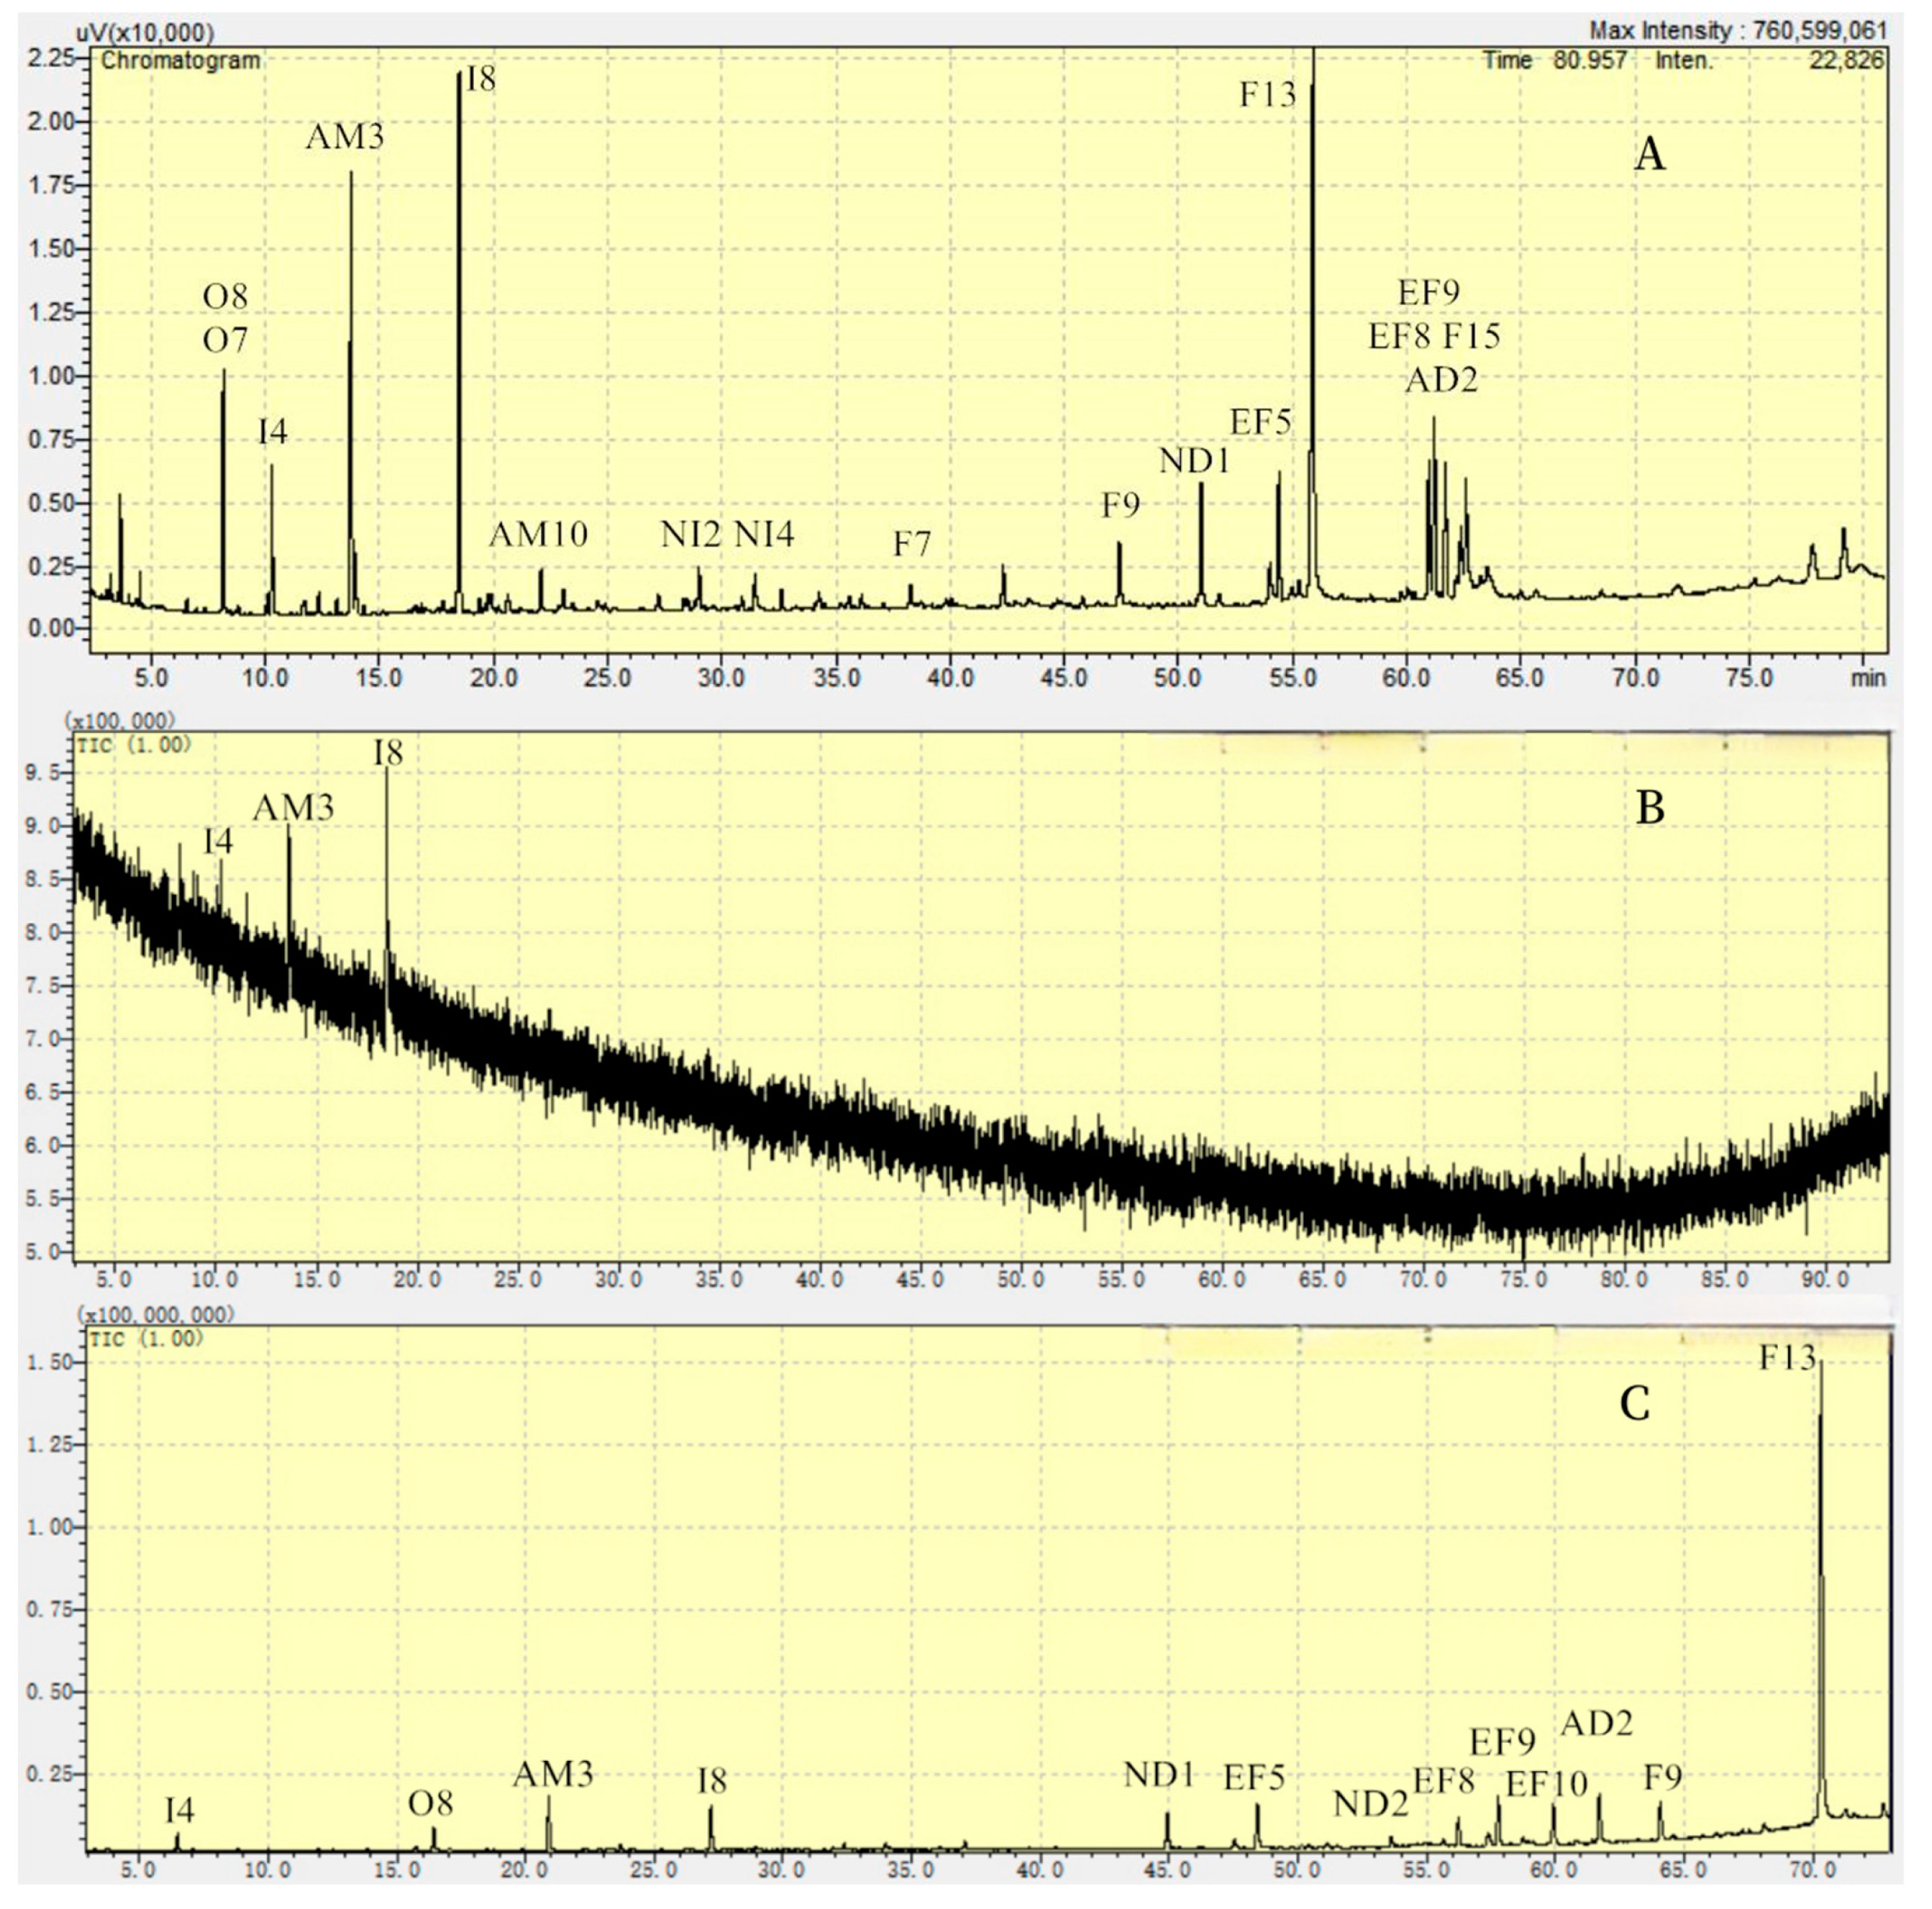
2.1. Extraction and Separation
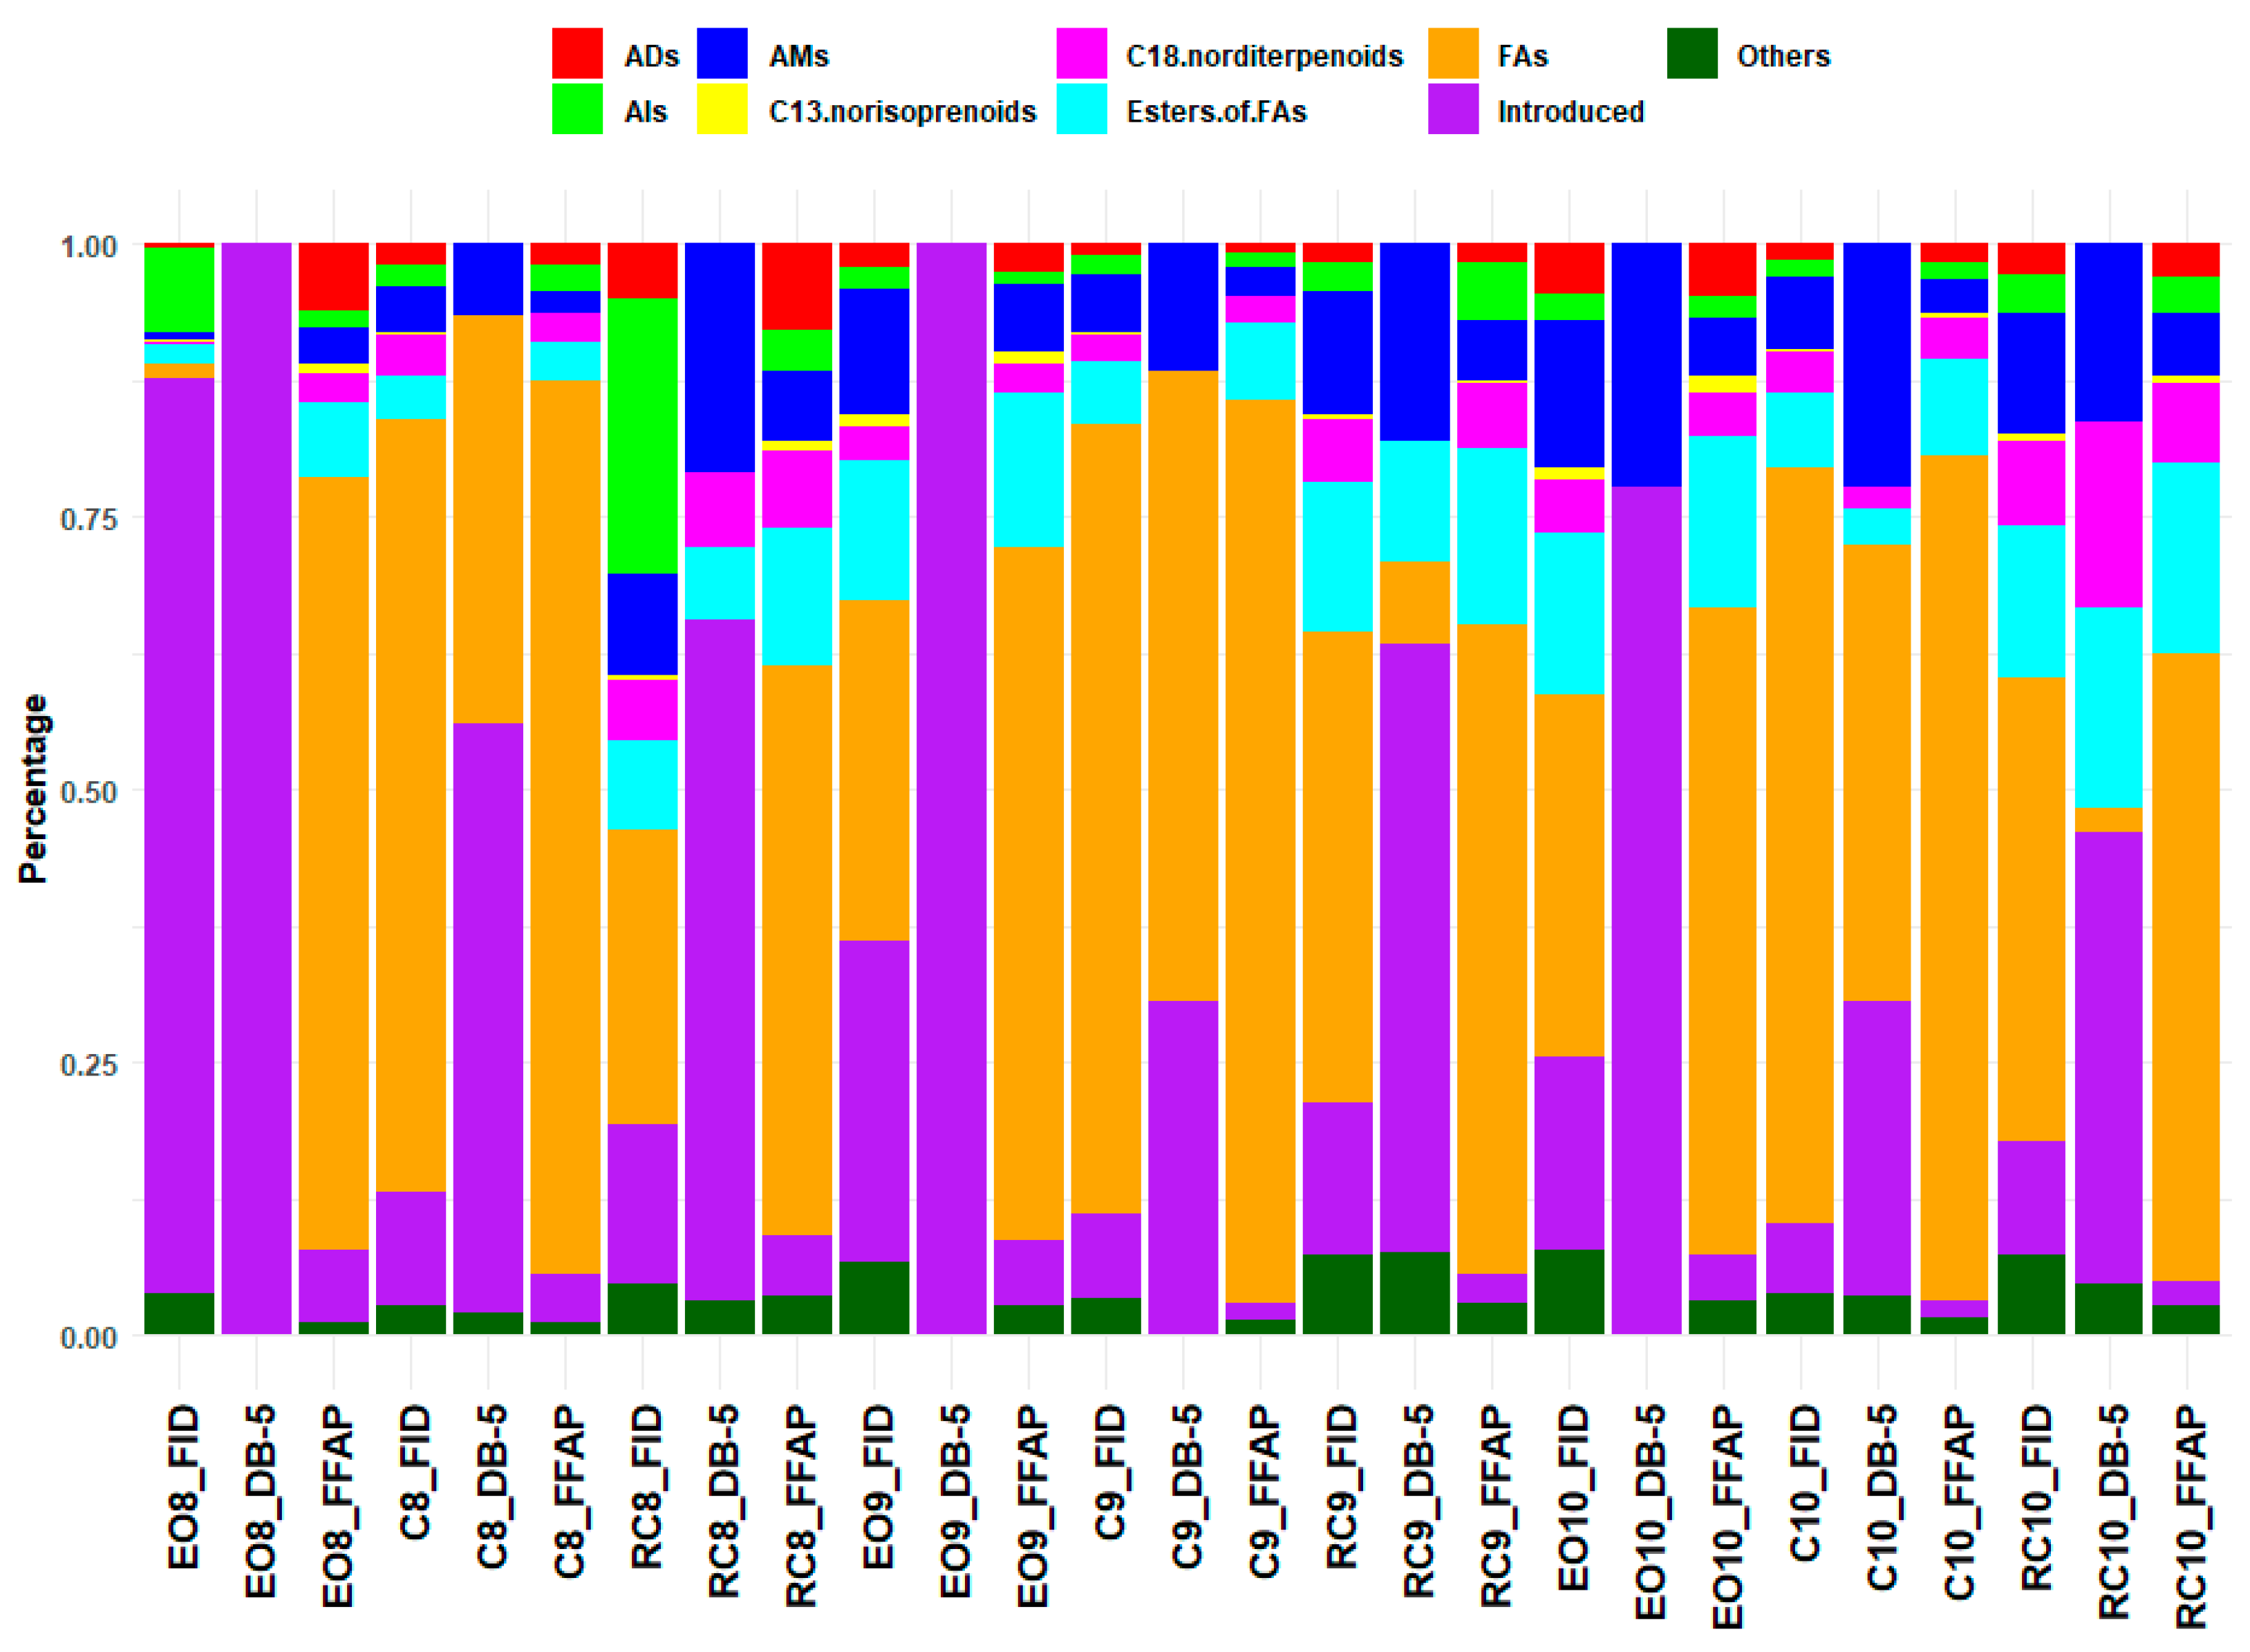
2.2. Chemical Composition of the Es from PR
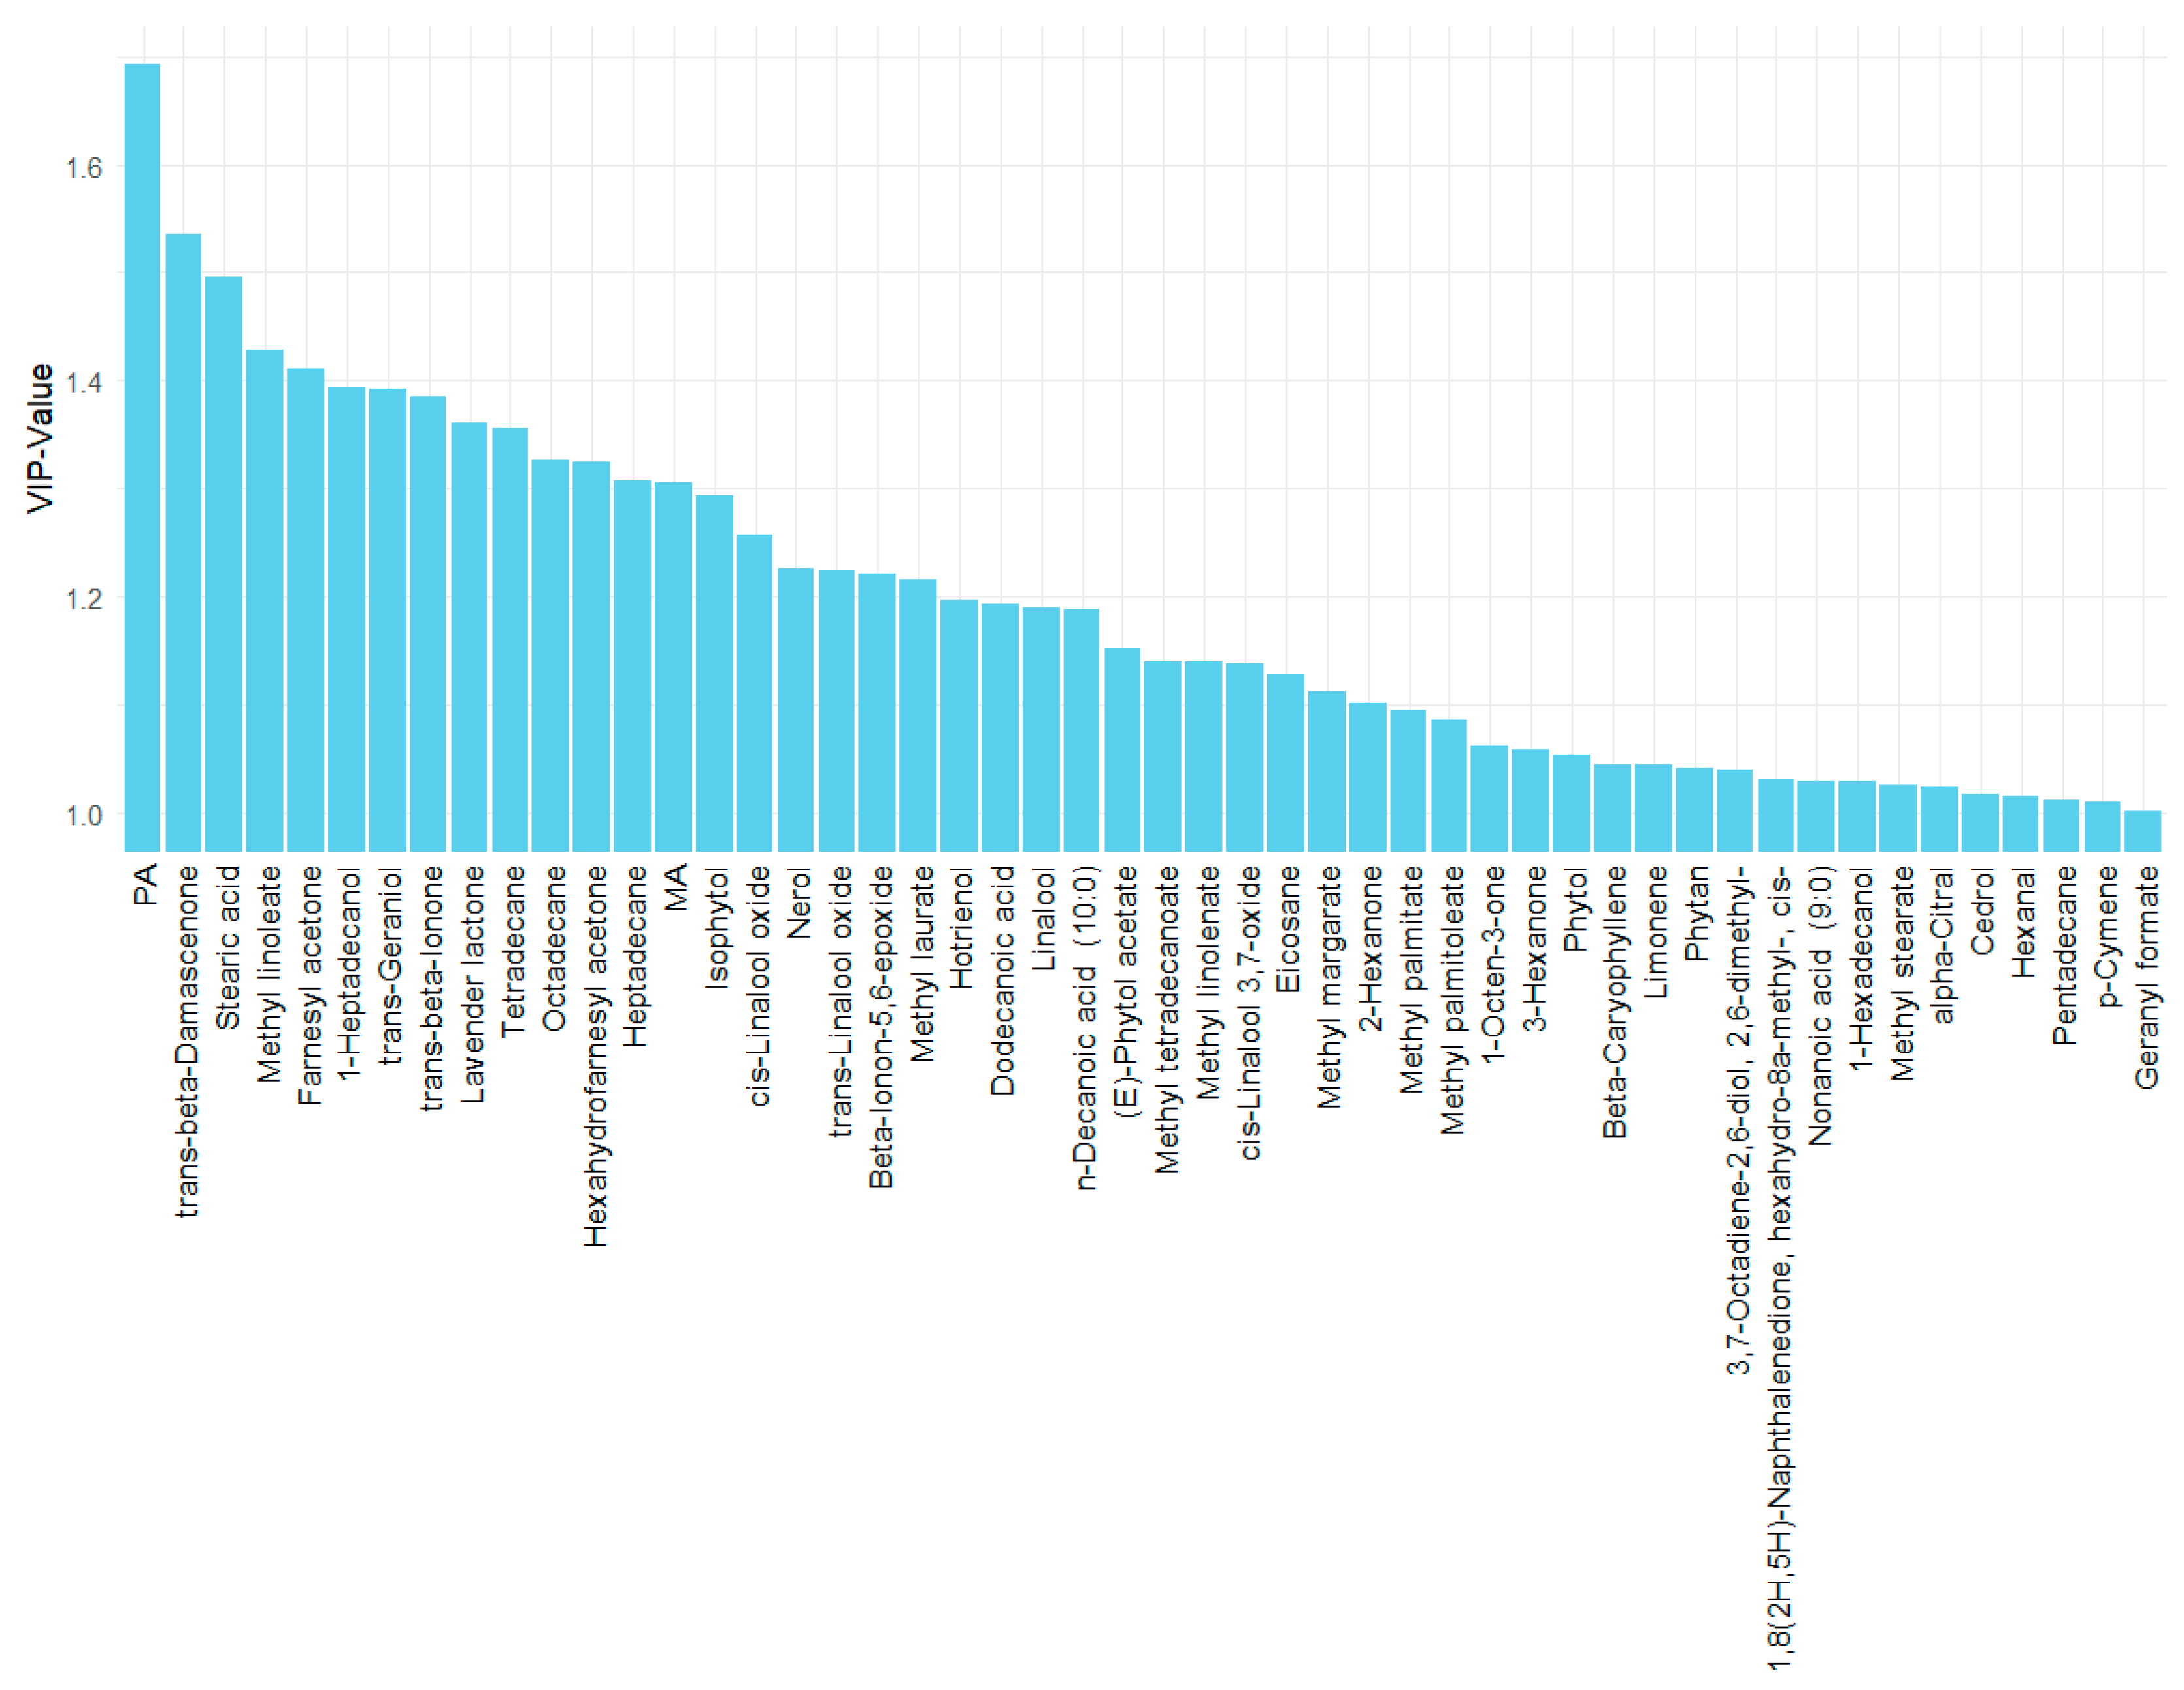
2.3. Principal Component Analysis (PCA) and Partial Least Squares Discriminant Analysis (PLS-DA) of the Metabolites in Es of PR

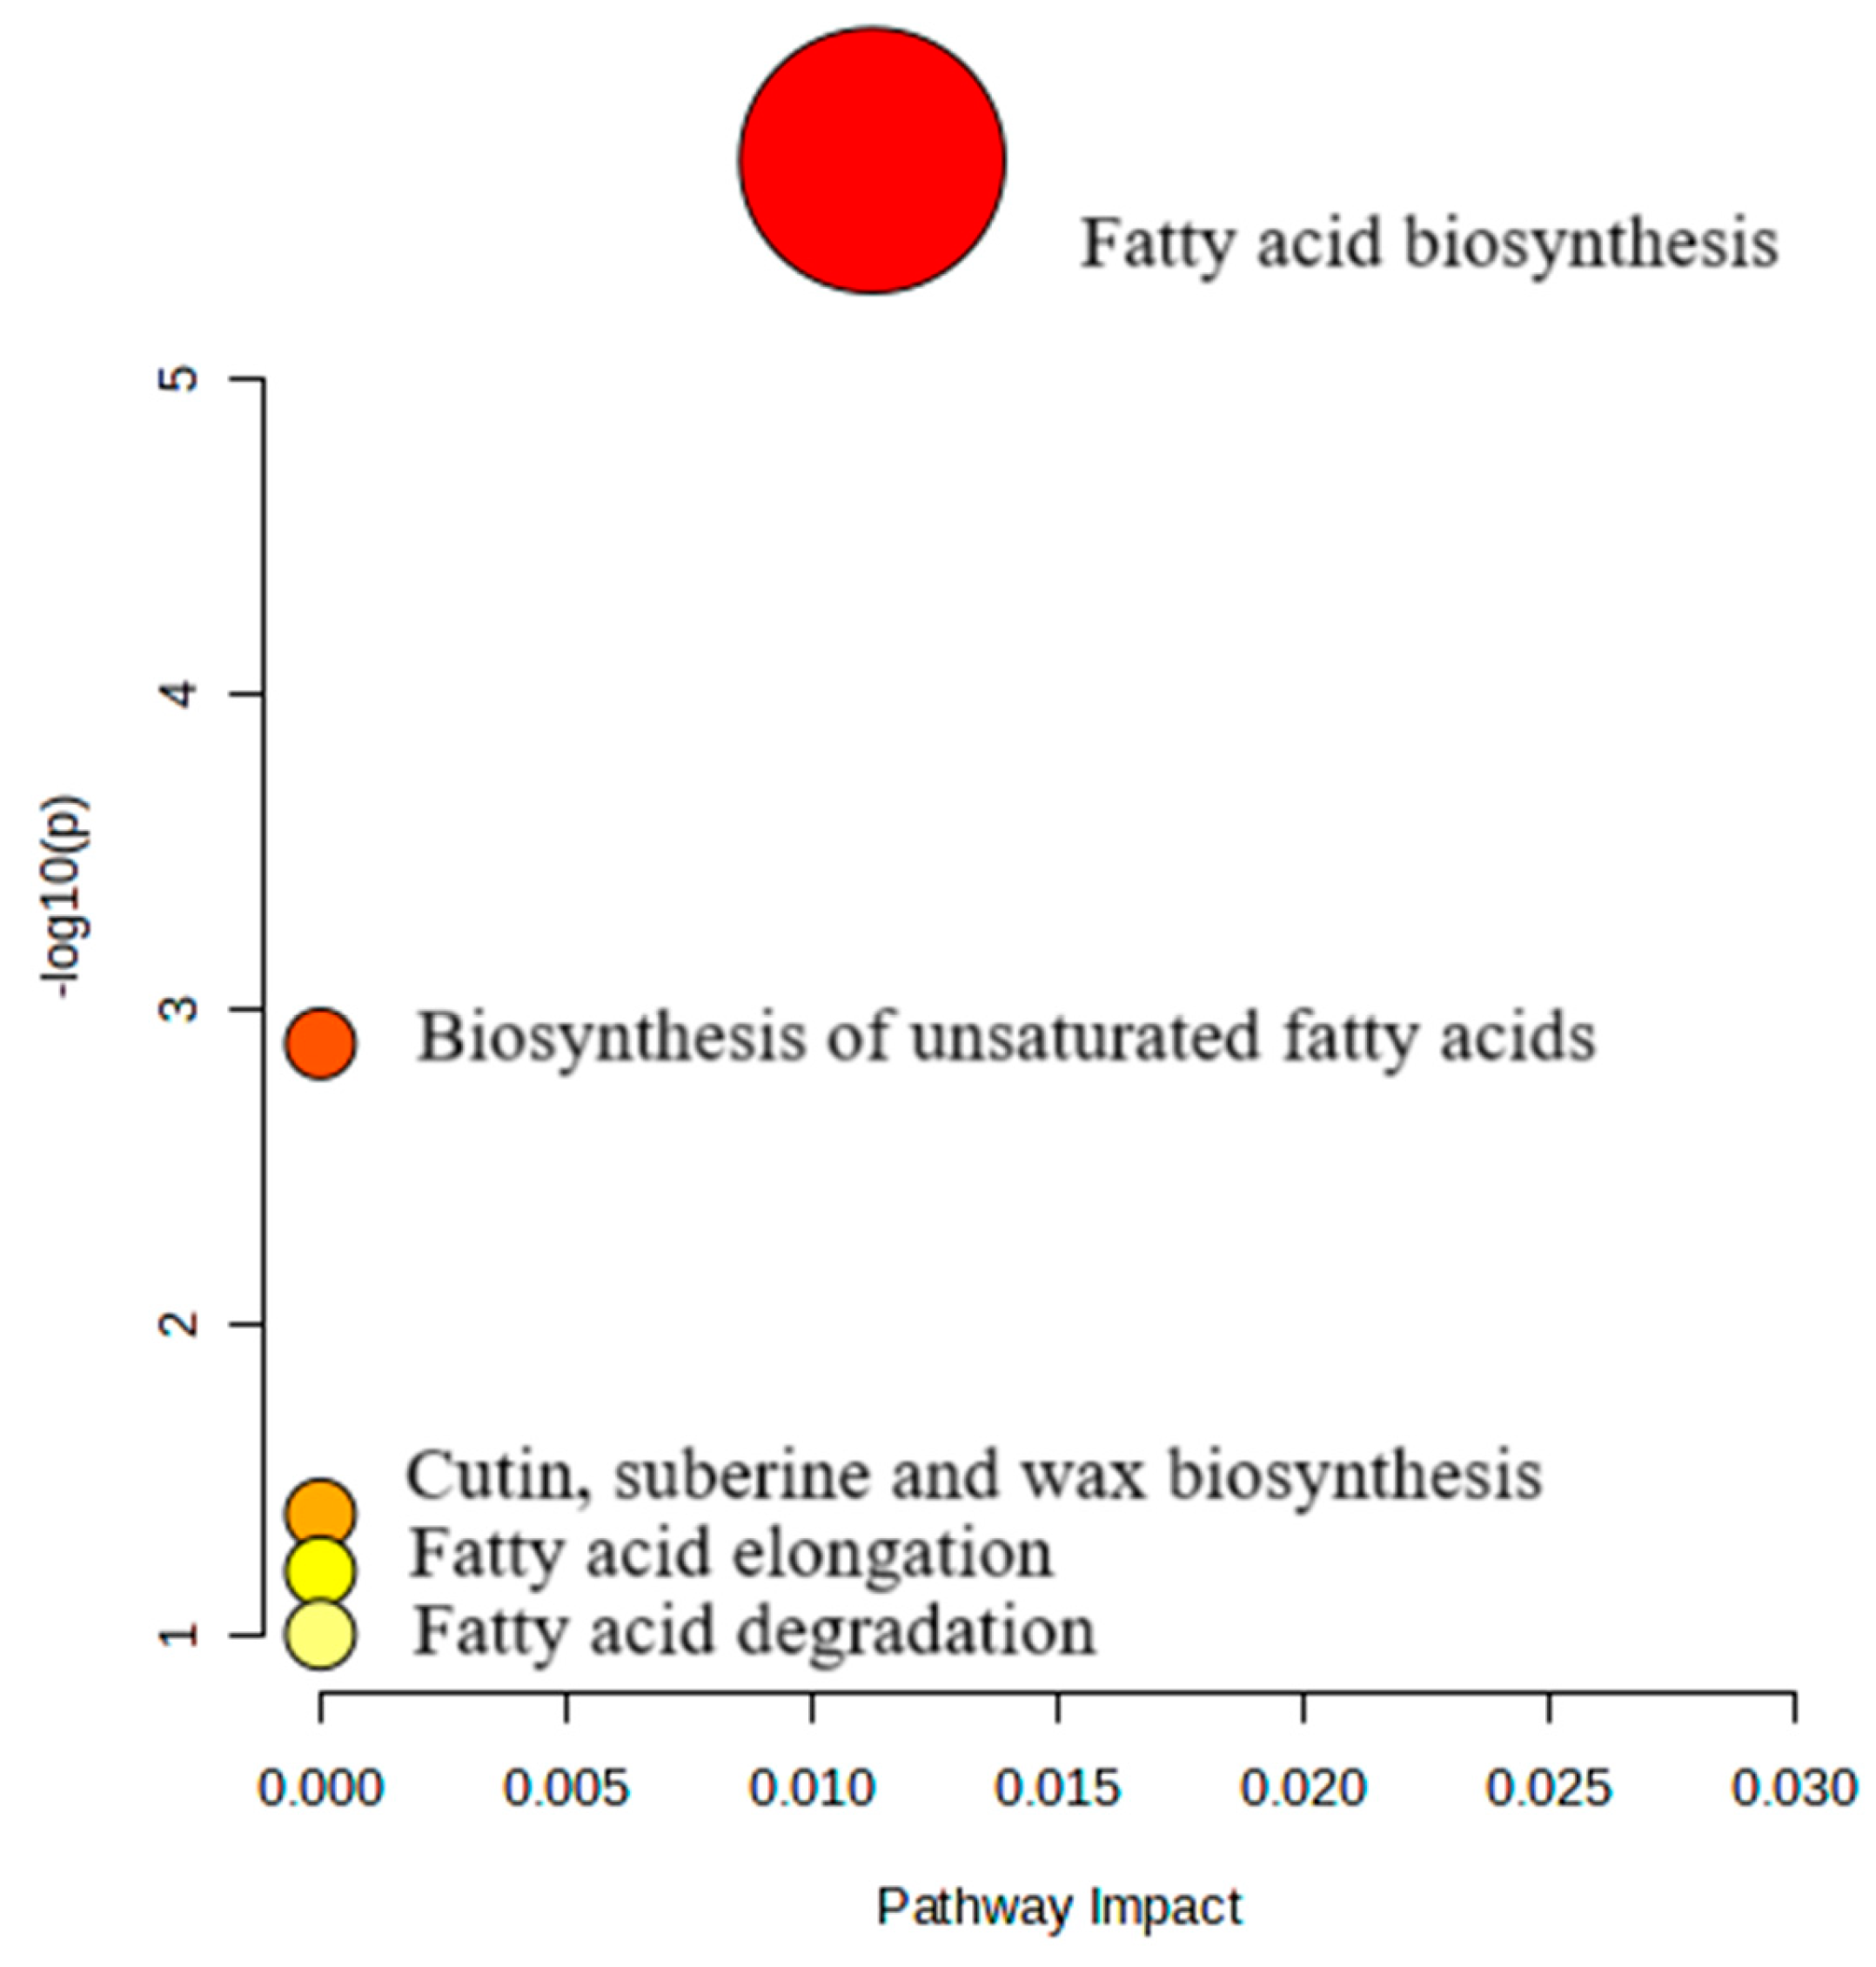
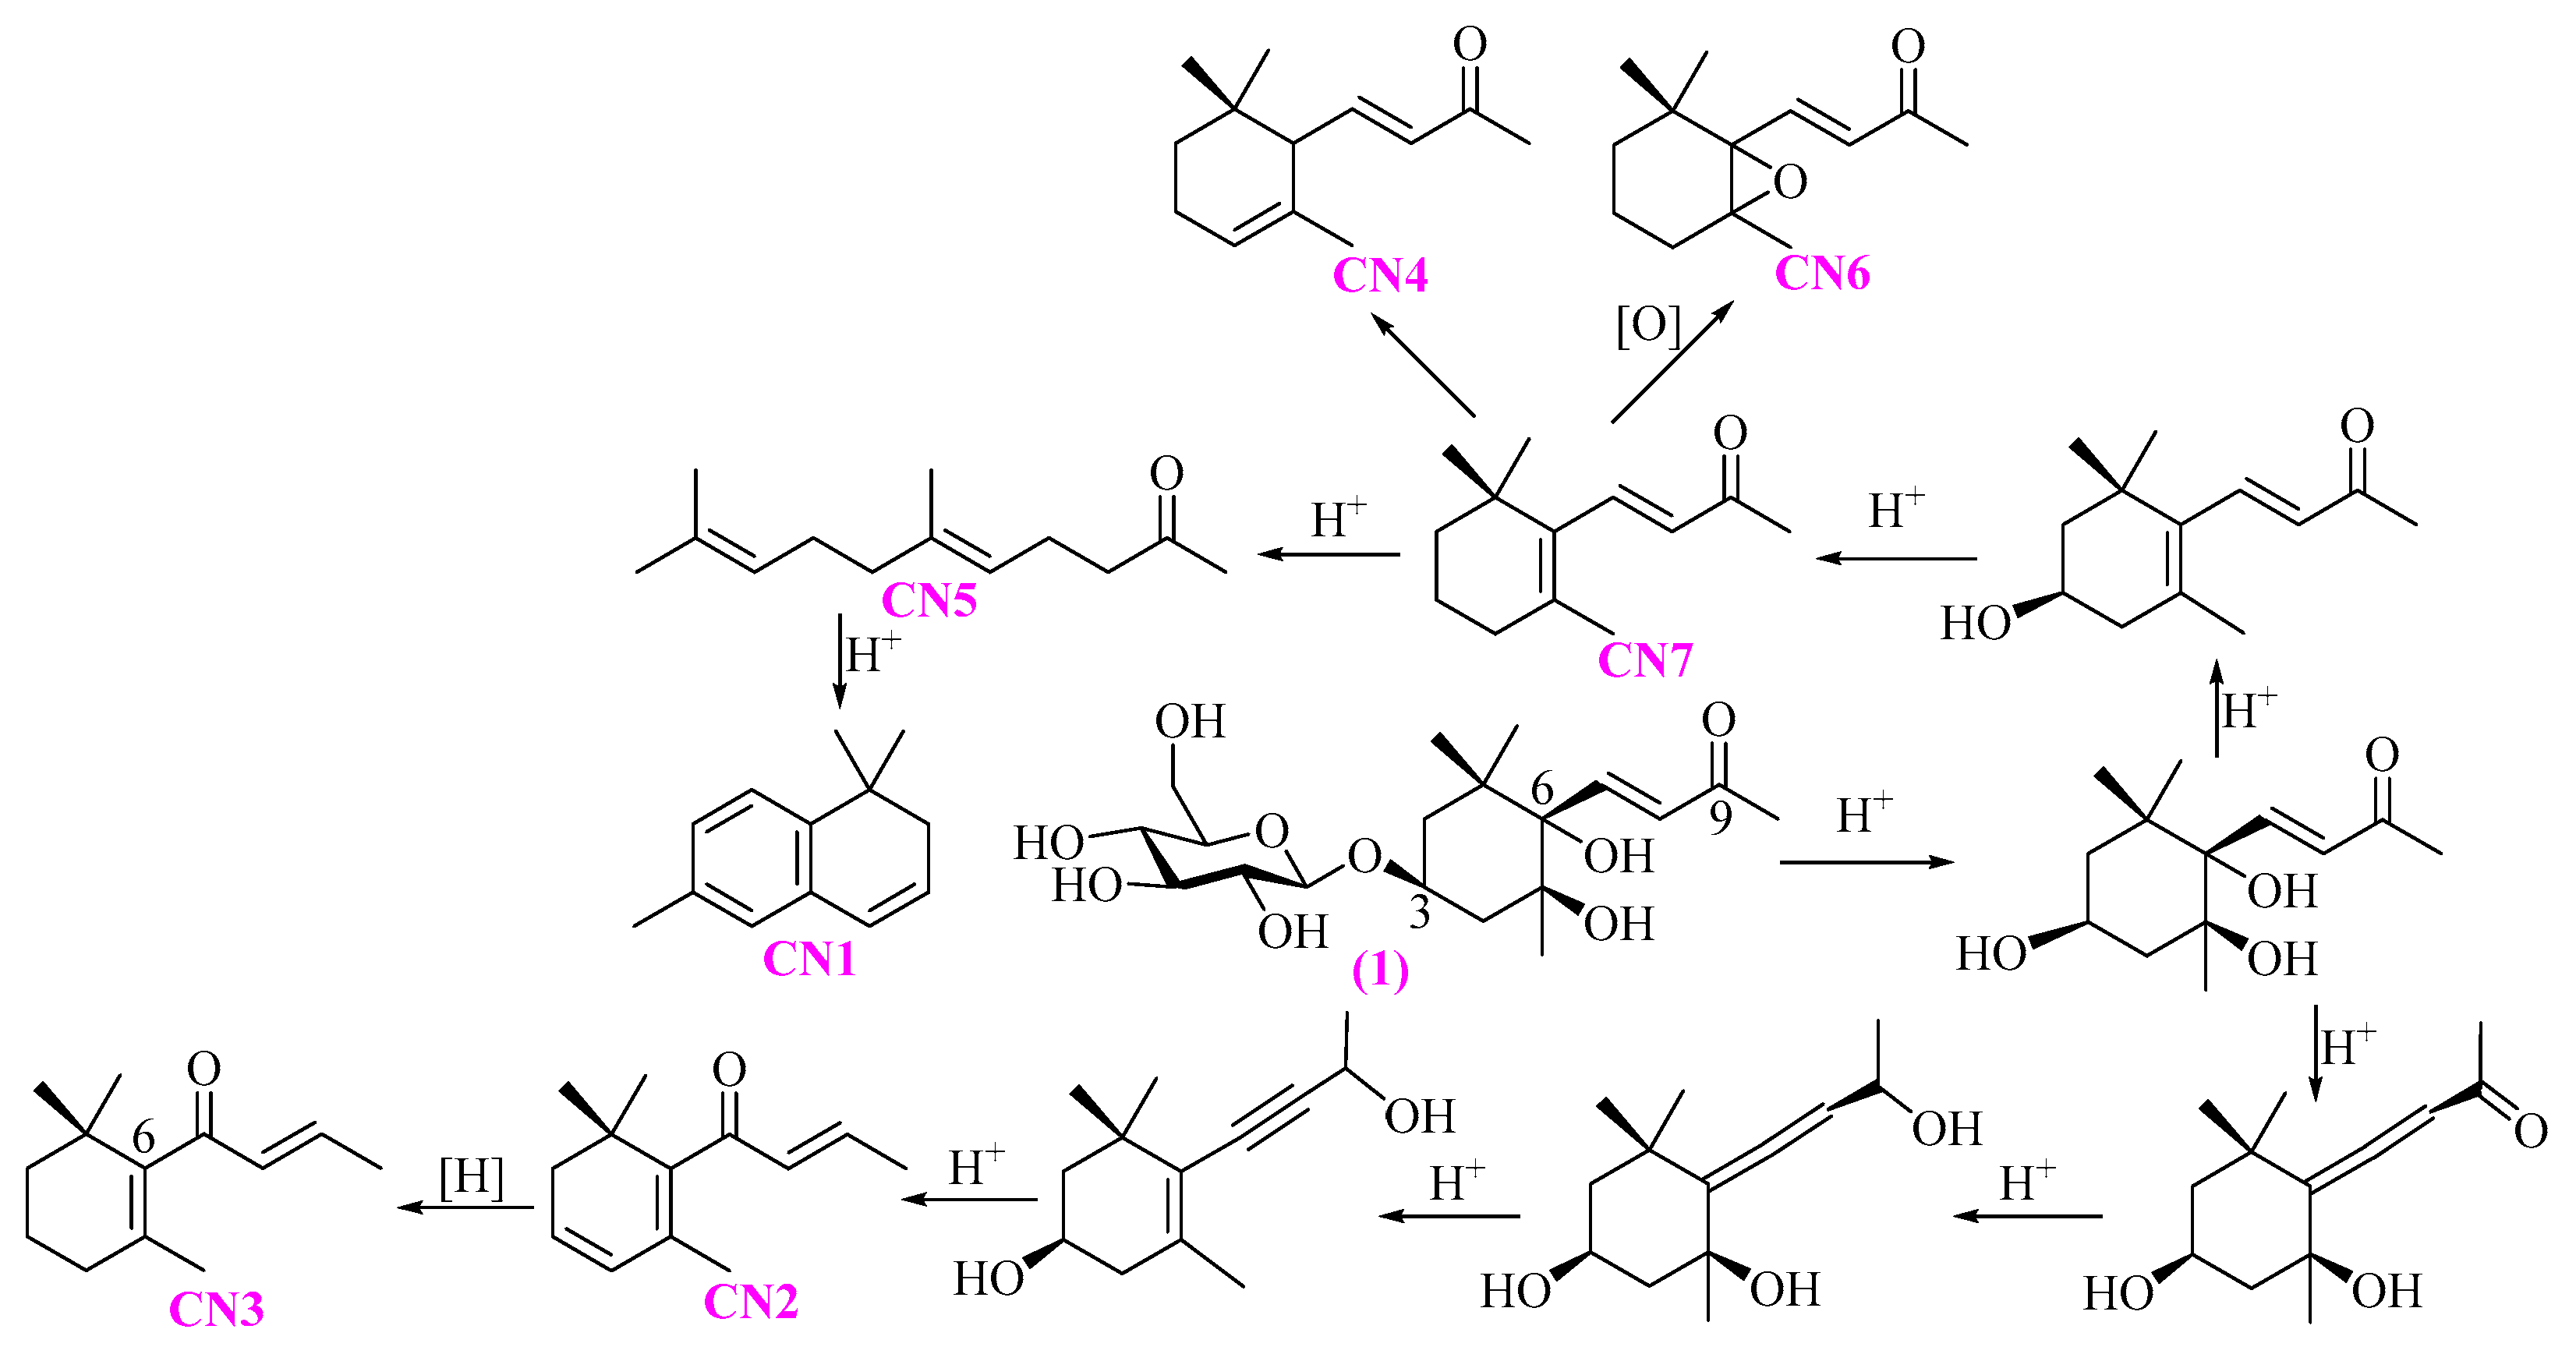
2.4. Metabolic Pathway Analysis
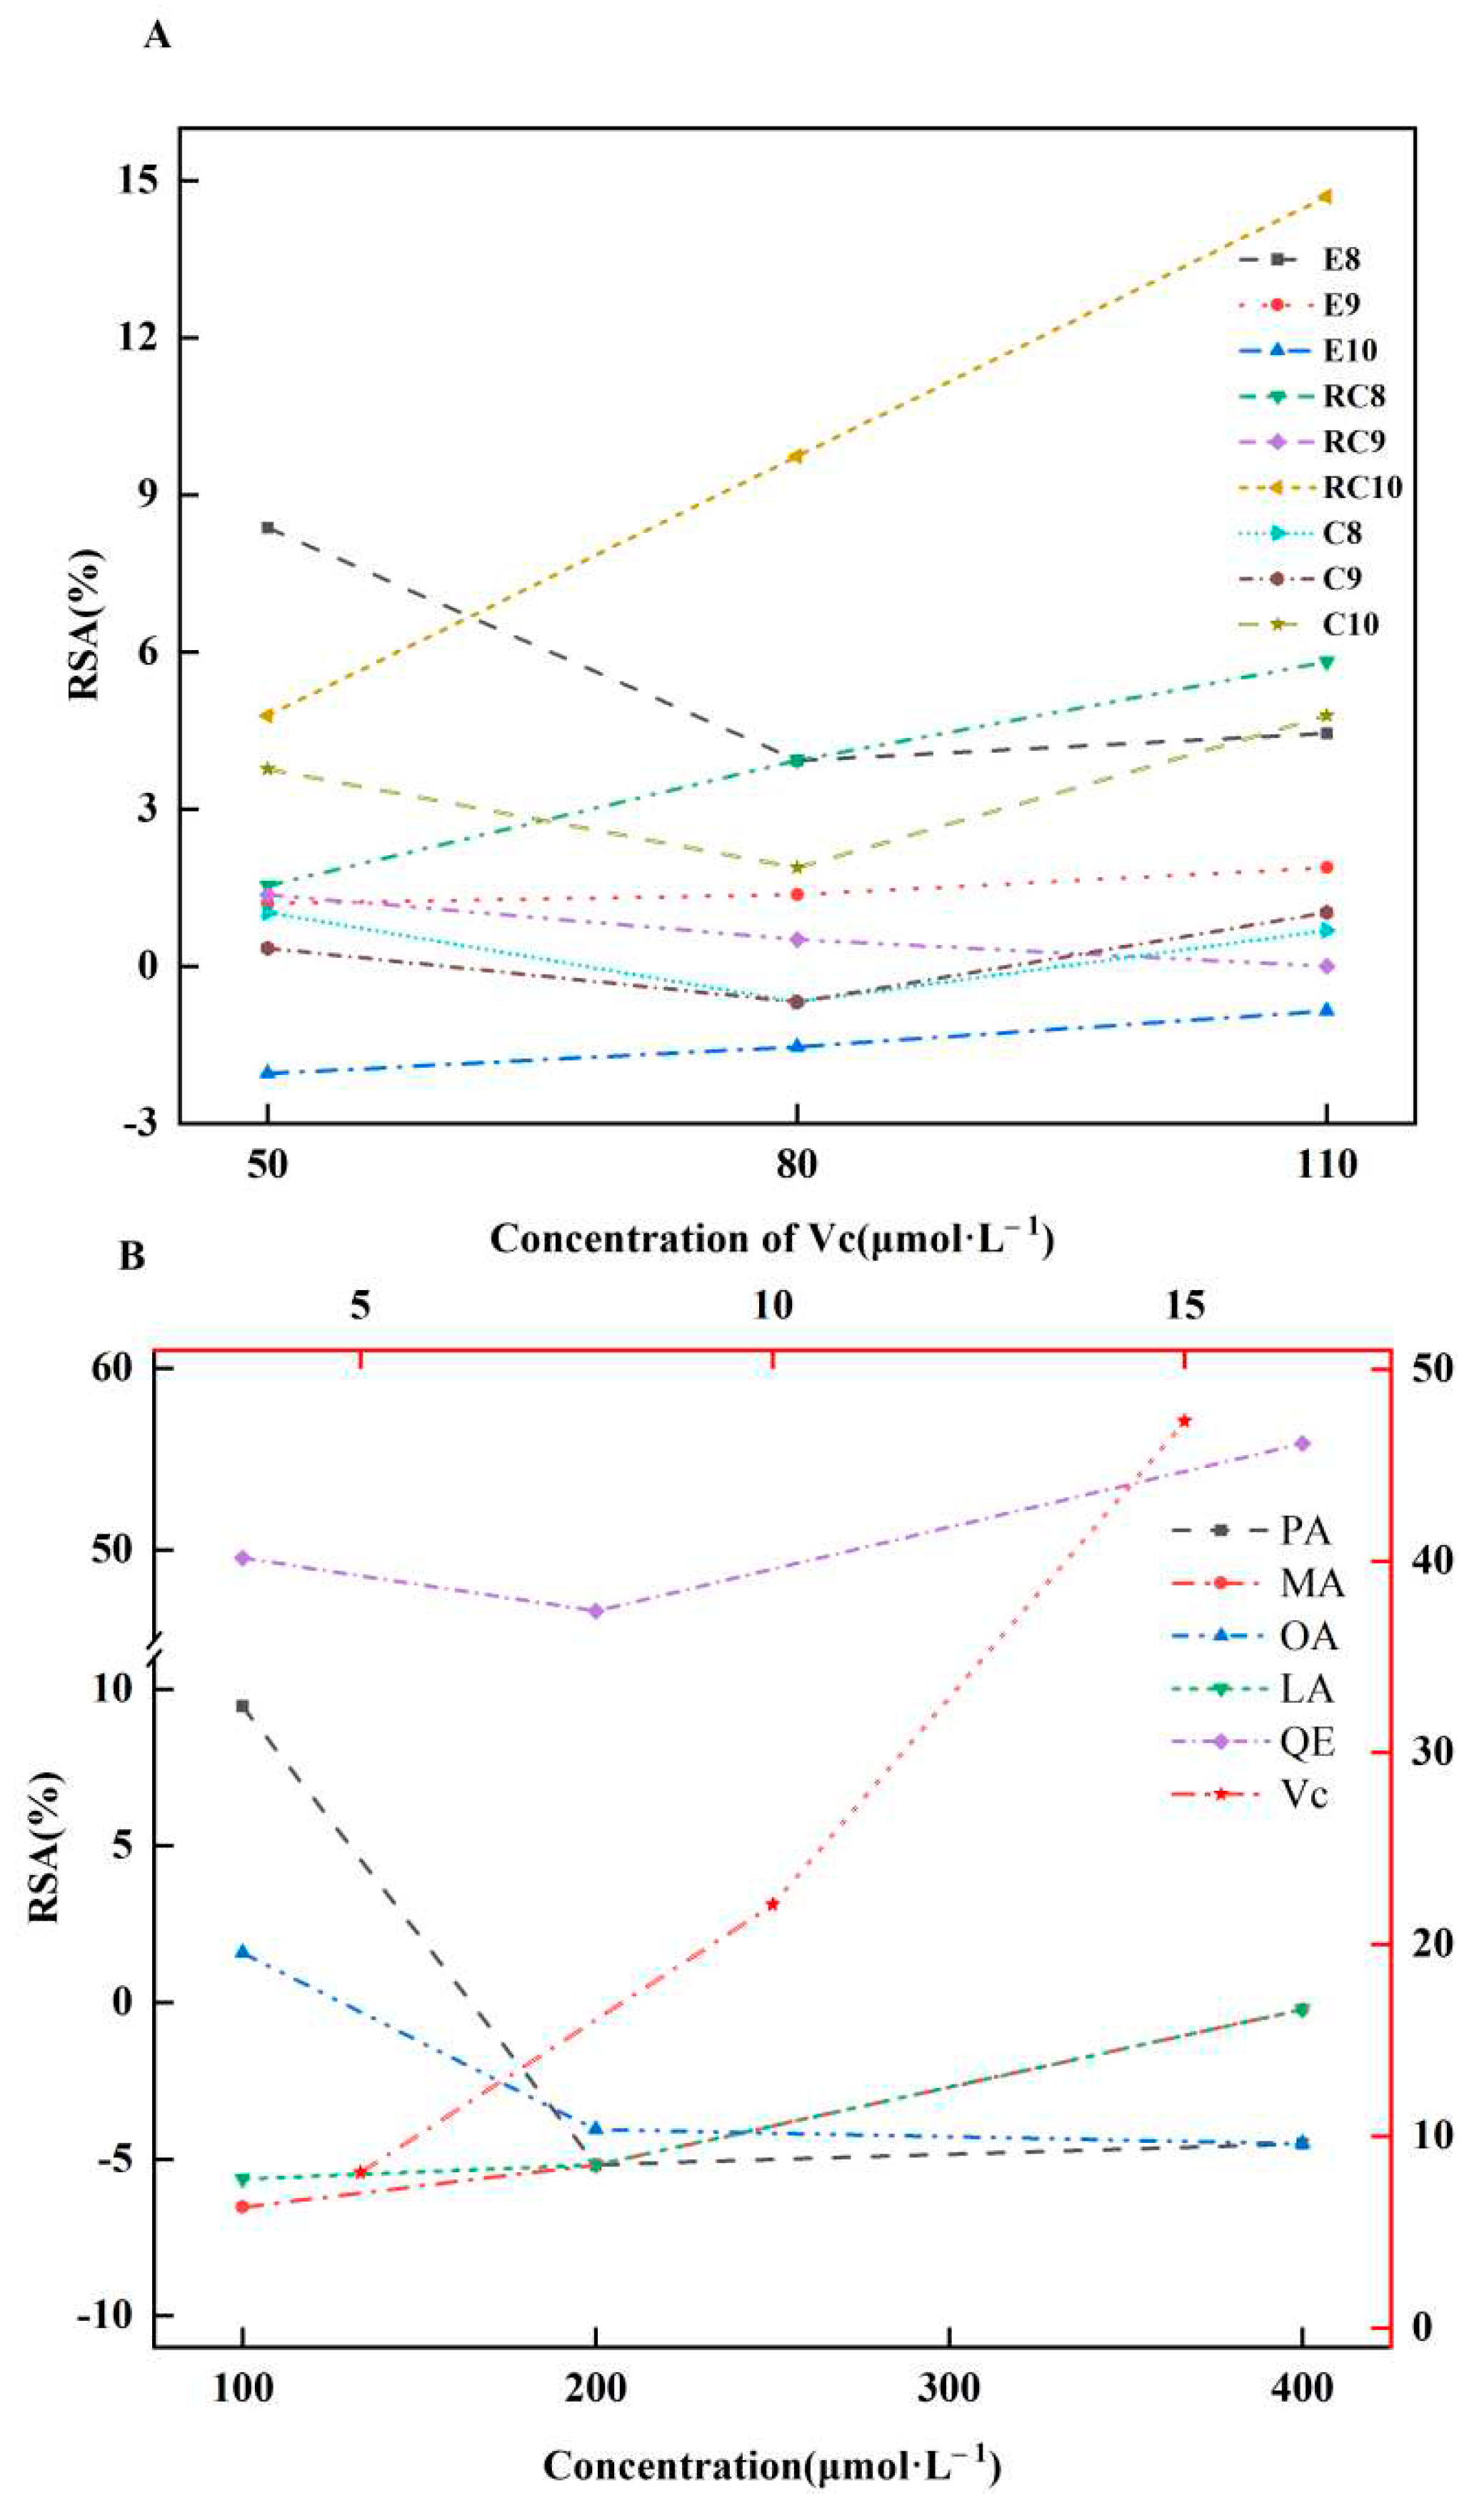
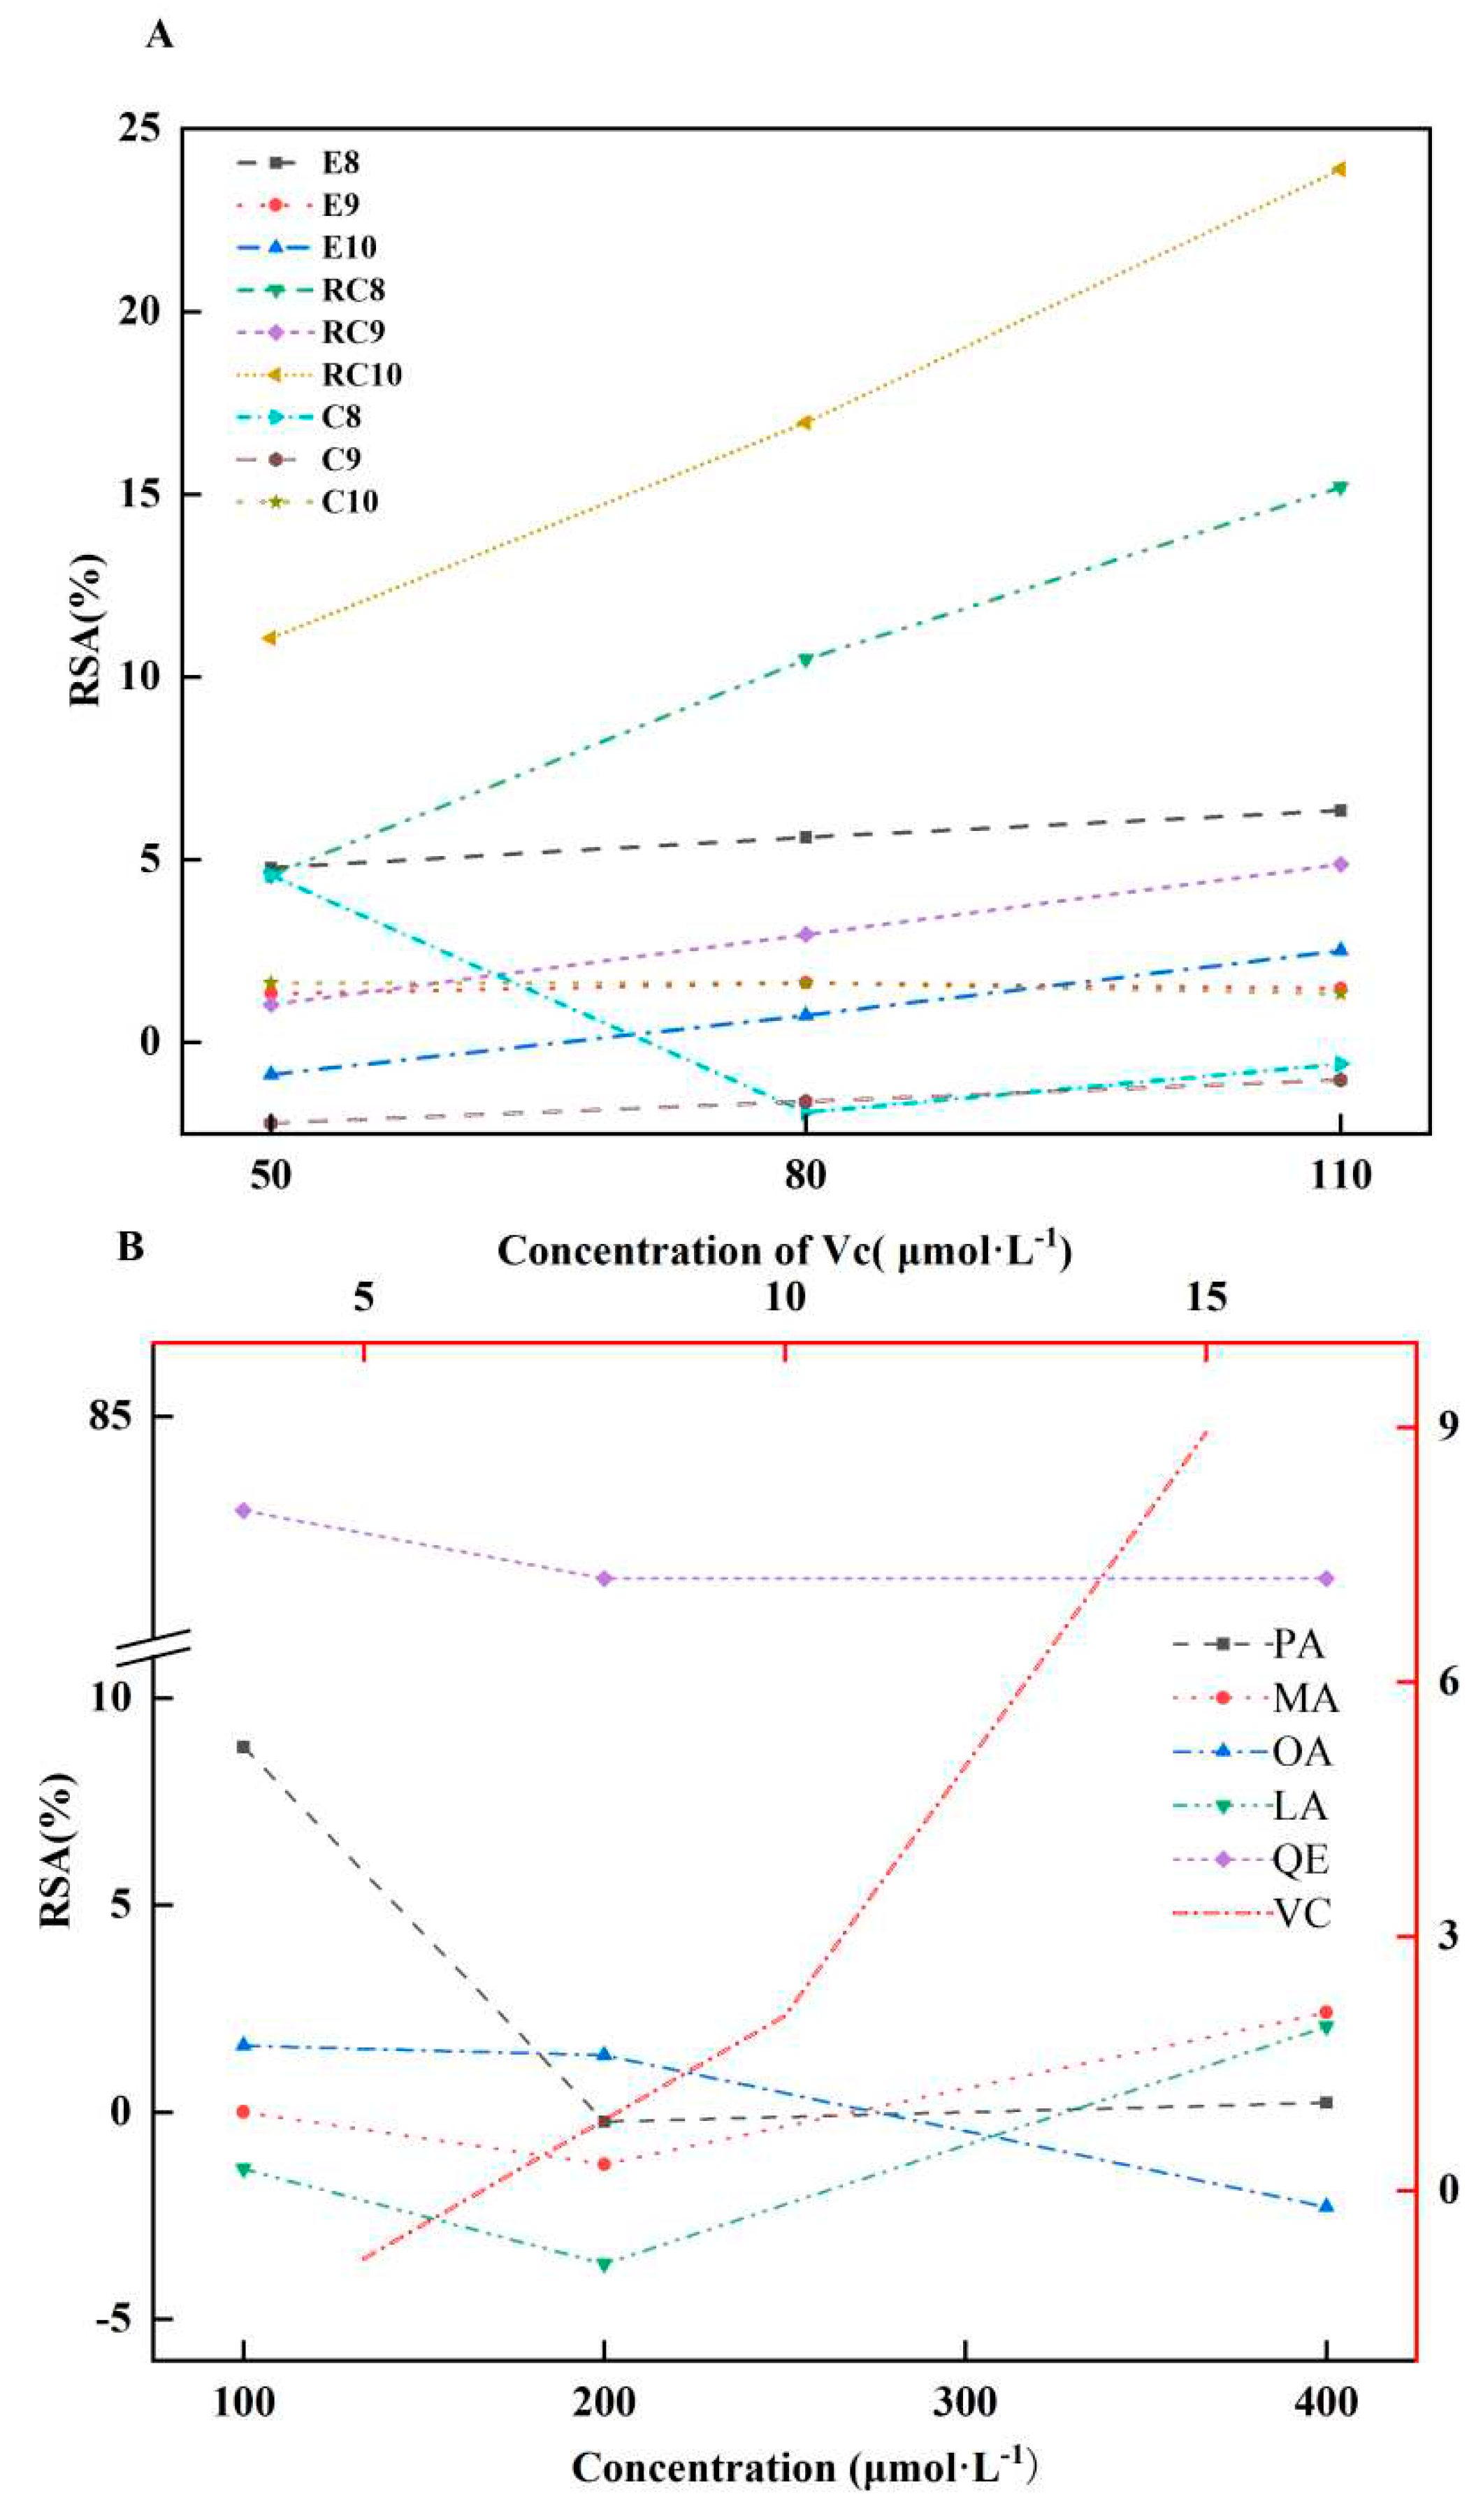
2.5. AOAs of Es, Cs, RCs, and Four CMs
3. Discussion
3.1. Extraction and Separation
3.2. Chemical Composition of the Es from PR
3.3. PCA and PLS-DA Results
3.4. Metabolic pathway analysis
3.5. AOAs of Es, Cs, RCs, and Four CMs
4. Materials and Methods
4.1. Plant Materials, Reagents and Chemicals
| Voucher No. | Sources | GPS Coordinates | GenBank Accession Number |
|---|---|---|---|
| L8 | BianBa, LeiWuQi and NaQu counties of Tibet | E: 93° W: 31° | KP699743/45-4750-51/54 |
| L9 | |||
| L10 |
4.2. Extraction and Separation
4.3. The Identification and Quantitation of Chemicals in the Es, Cs, and RCs
4.3.1. Sample Preparation
4.3.2. GC Analyses
4.3.3. Identification and Quantitation
4.3.3.1. Identification
4.3.3.2. Quantification
4.4. PCA and PLS-DA
4.5. Metabolic Pathway Analysis
4.6. AOAs of Es, Cs, RCs, and Four CMs
4.6.1. Sample Preparation
4.6.2. DPPH Assay
4.6.3. ABTS Assay
4.6.4. FRAP Assay
5. Conclusions
Supplementary Materials
Author Contributions
Funding
Acknowledgments
Conflicts of Interest
References
- Mathiesen, C.; Scheen, A.C.; Lindqvist, C. Phylogeny and biogeography of the lamioid genus Phlomis (Lamiaceae). Kew Bull. 2011, 66, 83–99. [Google Scholar] [CrossRef]
- The editorial board of Flora of China of Chinese Academy of Sciences. Flora of China (in Chinese, Volume 65 issue 2). Science press; Beijing, China, 1977; p. 1, 480.
- Li, H.; Hedge, I.C. Flora of China (Lamiaceae) (Volume 17). Science press; Beijing, China, 1994; p. 50, 52, 156-157.
- Pharmacopoeia committee of the People’s Republic of China. Pharmacopoeia of the People’s Republic of China (Volume I). China Medical Science and Technology Press; Beijing, China, 2020; p. 274.
- Nanjing University of Chinese medicine. The dictionary of Chinese materia medica (Volume 2) - 2nd edition. Shanghai scientific and technical publishers, China. 2006; p. 2390-2391.
- Cui, Z.H.; Qin, S.S.; Qin, E.H.; Qin, C.; Gao, L.; Li, Q.C.; Wang, Y.L.; Huang, X.Z.; Zhang, Z.Y.; Li, M.H. Traditional uses, phytochemistry, pharmacology and toxicology of Lamiophlomis rotata (Benth.) Kudo: a review. RSC Adv. 2020, 10, 11463. [Google Scholar] [CrossRef] [PubMed]
- Li, Y.; Li, F.; Zheng, T.T.; Shi, L.; Zhang, Z.G.; Niu, T.M.; Wang, Q.Y.; Zhao, D.S.; Li, W.; Zhao, P. Lamiophlomis herba: A comprehensive overview of its chemical constituents, pharmacology, clinical applications, and quality control. Biomed. Pharmacother. 2021, 144, 112299. [Google Scholar] [CrossRef]
- Zhang, F.; Wu, Z.J.; Sun, L.; Wang, J.; Tao, X.; Chen, W.S. Iridoid glucosides and a C13-norisoprenoid from Lamiophlomis rotata and their effects on NF-kB activation. Bioorg. Med. Chem. Lett. 2012, 22, 4447–4452. [Google Scholar] [CrossRef]
- Liu, H.F.; Li, X.; Deng, Y.; Song, X.; Li, H. Study on the chemical constituents of the essential oil from Lamiophlomis rotata. Chin. J. Pharm. Anal. 2006, 26, 1794–1796. [Google Scholar]
- Liu, J.; Nan, P.; Wang, L.; Wang, Q.; Tsering, T.; Zhong, Y. Chemical variation in lipophilic composition of Lamiophlomis rotata from the Qinghai-Tibetan plateau. Chem. Nat. Compd. 2006, 42, 525–528. [Google Scholar] [CrossRef]
- Wang, J. Alkanes and chemical markers identified in the essential oil from pericarp of Nanfengmiju (Citrus kinokuni Hort. ex Tanaka). J. Mex. Chem. Soc. 2023, 67, 82–93. [Google Scholar] [CrossRef]
- Ul Haq, A.; Wang, J. Identification of varieties and biomarkers analyses on essential oils from peels of Citrus L. collected in Pakistan. Pak. J. Bot. 2023, 55, 1407–1418. [Google Scholar]
- Ali, S.; Seema, H.; Khan, Z.; Din, A.; Hadi, F.; Wang, J. The nomenclature of three Citrus varieties collected in Pakistan and chemicals in essential oils from their peels. Pak. J. Bot. 2024, 56. [Google Scholar] [CrossRef]
- Jia, Z.P.; Li, M.X.; Zhang, R.X.; Wang, J.H.; Wang, M.; Guo, X.N.; Shen, T. Vitro screening of the effective antitumor components of Herba Lamiophlomis rotata. Med. J. Nation. Defend Force Northwest Chin. 2005, 26, 173–175. [Google Scholar]
- Zhou, Z.; Li, T.; Du, R.; Liu, C.; Huang, S.; Han, L.; Zhang, P.; Wang, Y.; Jiang, M. Lamiophlomis rotata attenuates rheumatoid arthritis by regulating sphingolipid and steroid hormone metabolism. Mol. Omics 2023, 19, 72–83. [Google Scholar] [CrossRef] [PubMed]
- Aebisher, D.; Cichonski, J.; Szpyrka, E.; Masjonis, S.; Chrzanowski, G. Essential oils of seven Lamiaceae plants and their antioxidant capacity. Molecules 2021, 26, 3793. [Google Scholar] [CrossRef] [PubMed]
- Hart, C.M.; Tolson, J.K.; Block, E.R. Fatty acid supplementation protects pulmonary artery endothelial cells from oxidant injury. Am. J. Respir. Cell Mol. BioI. 1990, 3, 479–489. [Google Scholar] [CrossRef] [PubMed]
- Hart, C.M.; Tolson, J.K.; Block, E.R. Supplemental fatty acids alter lipid peroxidation and oxidant injury in endothelial cells. Am. J. Physiol. 1991, 260, L481–L488. [Google Scholar] [CrossRef] [PubMed]
- Kehrer, J.P.; Autor, A.P. The effect of dietary fatty acids on the composition of adult rat lung lipids: relationship to oxygen toxicity. Toxicol. Appl. Pharmacol. 1978, 44, 423–430. [Google Scholar] [CrossRef]
- Kennedy, J.I.; Chandler, D.B.; Fulmer, J.D.; Wert, M.B.; Grizzle, W.E. Dietary fish oil inhibits bleomycin-induced pulmonary fibrosis in the rat. Exp.Lung Res. 1989, 15, 315–329. [Google Scholar] [CrossRef]
- Sosenko, I.R.S.; Innis, S.M.; Frank, L. Polyunsaturated fatty acids and protection of newborn rats from oxygen toxicity. J. Pediatr. 1988, 112, 630–637. [Google Scholar] [CrossRef]
- Sosenko, I.R.S.; Innis, S.M.; Frank, L. Menhaden fish oil, n-3 polyunsaturated fatty acids, and protection of newborn rats from oxygen toxicity. Pediatr. Res. 1989, 25, 399–404. [Google Scholar] [CrossRef]
- Favre, J.; Yıldırım, C.; Leyen, T.A.; Chen, W.J.Y.; Genugten, R.E.; Golen, L.W.; Garcia-Vallejo, J.J.; Musters, R.; Baggen, J.; Fontijn, R.; Pouw Kraan, T.; Serné, E.; Koolwijk, P.; Diamant, M.; Horrevoets, A.J.G. Palmitic acid increases pro-oxidant adaptor protein p66Shc expression and affects vascularization factors in angiogenic mononuclear cells: Action of resveratrol. Vasc. Pharmacol. 2015, 75, 7–18. [Google Scholar] [CrossRef]
- Ke, J.; Wei, R.; Liu, Y. Metformin combined with liraglutide has a synergistic protective effect on palmitic acid-induced oxidative damage of endothelial cells. Chin. J. Diabetes Mellitus 2014, 6, 312–316. [Google Scholar]
- Wang, J.; Gao, Y.L.; Chen, Y.L.; Chen, Y.W.; Zhang, Y.; Xiang, L.; Pan, Z. Lamiophlomis rotata identifification via ITS2 barcode and quality evaluation by UPLC-QTOF-MS couple with multivariate analyses. Molecules 2018, 23, 3289. [Google Scholar] [PubMed]
- Adams, R.P. Identification of essential oil components by gas chromatography/mass spectrometry, ed. 4.1. Allured publishing; Illinois, America, 2017; p. 1-804.
- Flavornet by Terry Acree & Heinrich Arn. https://www.flavornet.org/info/3033-23-6.html (accessed on 3th January 2024).
- Teow, C.C.; Truong, V.D.; Mcfeeters, R.F.; Thompson, R.L.; Pecota, K.V.; Yencho, G.C. Antioxidant activities, phenolic and β-carotene contents of sweet potato genotypes with varying flesh colours. Food Chem. 2007, 103, 829–838. [Google Scholar] [CrossRef]
- Bouzid, H.A.; Oubannin, S.; Ibourki, M.; Bijla, L.; Hamdouch, A.; Sakar, E.H.; Harhar, H.; Majourhat, K.; Koubachi, J.; Gharby, S. Comparative evaluation of chemical composition, antioxidant capacity, and some contaminants in six Moroccan medicinal and aromatic plants. Biocatal. Agric. Biotechnol. 2023, 47, 102569. [Google Scholar] [CrossRef]
- Zhao, Q.Y.; Yousaf, L.; Xue, Y.; Shen, Q. Changes in flavor of fragrant rice during storage under different conditions. J. Sci. Food Agric. 2020, 100, 3435–3444. [Google Scholar] [CrossRef]
- Carlin, S.; Mattivi, F.; Durantini, V.; Dalledonne, S.; Arapitsas, P. Flint glass bottles cause white wine aroma identity degradation. PNAS 2022, 119, e2121940119. [Google Scholar] [CrossRef]
- Pickenhagen, W. In Flavor Chemistry-Thirty Years of Progress; Teranishi, R., Wick, E.L., Hornstein, I., Eds. Kluwer Academic/Plenum Publishers: New York, U.S.A, 1999: p. 75-87.
- Kaneshima, T.; Nojima, S.; Mori, S.; Myoda, T.; Nakahara, K.; Matsuo, Y. Isolation and identification of progenitors, glycoconjugates of β-damascenone precursors, in sweet potato (Ipomoea batatas). Flavour Fragr. J. 2023, 38, 152–162. [Google Scholar] [CrossRef]
- Roberts, D.D.; Mordehai, A.P.; Acree, T.E. Detection and partial characterization of eight β-damascenone precursors in apples (Malus domestica Borkh. Cv empire). J. Agric. Food Chem. 1994, 42, 345–349. [Google Scholar] [CrossRef]
- Roberts, D.D.; Roberts, A.P.; Acree, T.E. Detection and partial characterization of eight β-Damascenone precursors in Apples (Malus domestica Borkh. Cv. Empire). J. Agric. Food Chem. 1994, 42, 345–349. [Google Scholar] [CrossRef]
- Suzuki, M.; Matsumoto, S.; Mizoguchi, M.; Hirata, S.; Takagi, K.; Hashimoto, I.; Yamano, Y.; Ito, M.; Fleischmann, P.; Winterhalter, P.; Morita, T.; Watanabe1, N. Identification of (3S, 9R)- and (3S, 9S)-Megastigma-6,7-dien-3,5,9-triol 9-O-β-D-glucopyranosides as Damascenone progenitors in the flowers of Rosa damascena Mill. Biosci. Biotechnol. Biochem. 2002, 66, 2692–2697. [Google Scholar] [CrossRef]
- Usami, A.; Kashima, Y.; Marumoto, S.; Miyazawa, M. Characterization of aroma-active compounds in dry flower of Malva sylvestris L. by GC-MS-O analysis and OAV calculations. J. Oleo Sci. 2013, 62, 563–570. [Google Scholar] [CrossRef]
- Choi, H.S. GC-MS analyses of the essential oils from Ixeris dentate (Thunb.) Nakai and I. stolonifera A. Gray. Korean J. Food Nutr. 2012, 25, 274–283. [Google Scholar] [CrossRef]
- Choi, H.S. Chemical composition of Cirsium japonicum var. ussurience Kitamura and the quantitative changes of major compounds by the harvesting season. Korean J. Food Nutr. 2016, 29, 327–334. [Google Scholar] [CrossRef]
- Munteanu, I.G.; Apetrei, C. Analytical methods used in determining antioxidant activity: A review. Int. J. Mol. Sci. 2021, 22, 3380. [Google Scholar] [CrossRef]
- Fratantonio, D.; Speciale, A.; Ferrari, D.; Cristani, M.; Saija, A.; Cimino, F. Palmitate-induced endothelial dysfunction is attenuated by cyanidin-3-o-glucoside through modulation of Nrf2/Bach1 and NF-κB pathways. Toxicol Lett 2015, 239, 152–160. [Google Scholar] [CrossRef]
- Giorgio, M.; Migliaccio, E.; Orsini, F.; Paolucci, D.; Moroni, M.; Contursi, C.; Pelliccia, G.; Luzi, L.; Minucci, S.; Marcaccio, M.; Pinton, P.; Rizzuto, R.; Bernardi, P.; Paolucci, F.; Pelicci, P.G. Electron transfer between cytochrome c and p66shc generates reactive oxygen species that trigger mitochondrial apoptosis. Cell 2005, 122, 221–233. [Google Scholar] [CrossRef]
- Tada, M.; Ichiishi, E.; Saito, R.; Emoto, N.; Niwano, Y.; Kohno, M. Myristic acid, a side chain of phorbol myristate acetate (PMA), can activate human polymorphonuclear leukocytes to produce oxygen radicals more potently than PMA. J. Clin. Biochem. Nutr. 2009, 45, 309–314. [Google Scholar] [CrossRef]
- Khalil, A.S.M.; Giribabu, N.; Yelumalai, S.; Shahzad, H.; Kilari, E.K.; Salleh, N. Myristic acid defends against testicular oxidative stress, inflammation, apoptosis: Restoration of spermatogenesis, steroidogenesis in diabetic rats. Life Sci. 2021, 278, 119605. [Google Scholar] [CrossRef] [PubMed]
- Sun, Y.; Wang, J.; Guo, X.; Zhu, N.; Niu, L.; Ding, X.; Xie, Z.; Chen, X.; Yang, F. Oleic acid and eicosapentaenoic acid reverse palmitic acid-induced insulin resistance in human Hepg2 cells via the reactive oxygen species/Jun pathway. Genom. Proteom. Bioinf. 2021, 19, 754–771. [Google Scholar] [CrossRef] [PubMed]
- Abenavoli, L.; Milanović, M.; Milić, N.; Luzza, F.; Giuffrè, A.M. Olive oil antioxidants and non-alcoholic fatty liver disease. Expert Rev. Gastroenterol. Hepatol. 2019, 13, 739–749. [Google Scholar] [CrossRef] [PubMed]
- Pauls, S.D.; Rodway, LA.; Winter, T.; Taylor, C.G.; Zahradka, P.; Aukema, H.M. Anti-inflammatory effects of α-linolenic acid in M1-like macrophages are associated with enhanced production of oxylipins from α-linolenic and linoleic acid. J. Nutr. Biochem. 2018, 57, 121–129. [Google Scholar] [CrossRef] [PubMed]
- Wu, S.H.; Sun, G.R.; Wang, Y.Y.; Tan, T.T.; Zhang, Y.; Deng, H.M.; Zhang, T.L.; Du, F.G. Chemical composition analysis and antioxidant activity of essential oil from Magnolia sieboldii Leaves. Mol. Plant Breed. 2023, 21, 1–12. [Google Scholar]
- Lee, S.H.; Min, D.B. Effects, quenching mechanisms, and kinetics of carotenoids in chlorophyll-sensitized photooxidation of soybean oil. J. Agri. Food Chem. 1990, 38, 1630–1634. [Google Scholar] [CrossRef]
- Sila, A.; Sayari, N.; Balti, R.; Martinez-Alvarez, O.; Nedjar-Arroume, N.; Moncef, N.; Bougatef, A. Biochemical and antioxidant properties of peptidic fraction of carotenoproteins generated from shrimp by-products by enzymatic hydrolysis. Food Chem. 2014, 148, 445–452. [Google Scholar] [CrossRef] [PubMed]
- Burton, G.W.; Ingold, K.U. β-Carotene: An unusual type of antioxidant. Science 1984, 224, 569–573. [Google Scholar] [CrossRef]
- Grujić-Milanović, J.D.; Miloradović, Z.Z.; Mihailović-Stanojević, N.D.; Banjac, V.V.; Vidosavljević, S.; Ivanov, M.S.; Karanović, D.J.; Vajić, U.-J.V.; Jovović, D.M. Excesive consumption of unsaturated fatty acids leads to oxidative and inflammatory instability in wistar rats. Biomed. Pharmaco. 2021, 139, 111691. [Google Scholar] [CrossRef]
- Liu, W.; Zhu, M.; Gong, M.; Zheng, W.; Zeng, X.; Zheng, Q.; Li, X.; Fu, F.; Chen, Y.; Cheng, J.; Rao, Z.; Lu, Y.; Chen, Y. Comparison of the effects of monounsaturated fatty acids and polyunsaturated fatty acids on liver lipid disorders in obese mice. Nutrients 2023, 15, 3200. [Google Scholar] [CrossRef] [PubMed]
- Van Den Dool, H.; Kratz, P.D. A generalization of the retention index system including linear temperature programmed gas-liquid partition chromatography. J. Chromatogr. 1963, 11, 463–471. [Google Scholar] [CrossRef] [PubMed]
- Zengin, G.; Sarikurkcu, C.; Uyar, P.; Aktumsek, A.; Uysal, S.; Kocak, M.S.; Ceylan, R. Crepis foetida L. subsp. rhoeadifolia (Bieb.) Celak. as a source of multifunctional agents: Cytotoxic and phytochemical evaluation. J. Funct. Foods 2015, 17, 698–708. [Google Scholar] [CrossRef]
- Re, R.; Pellegrini, N.; Proteggente, A.; Pannala, A.; Yang, M.; Rice-Evans, C. Antioxidant activity applying an improved ABTS radical cation decolorization assay. Free Radical Bio. Med. 1999, 26, 1231–1237. [Google Scholar] [CrossRef]

Disclaimer/Publisher’s Note: The statements, opinions and data contained in all publications are solely those of the individual author(s) and contributor(s) and not of MDPI and/or the editor(s). MDPI and/or the editor(s) disclaim responsibility for any injury to people or property resulting from any ideas, methods, instructions or products referred to in the content. |
© 2024 by the authors. Licensee MDPI, Basel, Switzerland. This article is an open access article distributed under the terms and conditions of the Creative Commons Attribution (CC BY) license (http://creativecommons.org/licenses/by/4.0/).


