
Submitted:
07 February 2024
Posted:
08 February 2024
You are already at the latest version
Abstract
Diabetes Mellitus (DM) is a chronic metabolic disease consisting of Type 1 or Type 2 diabetes. Although treatment of Type 1 diabetes primarily involves insulin therapy, inhibitors of sodium glucose co-transporters (SGLT’s) are a promising new therapeutic. Of particular interest are the two family members, SGLT1 and SGLT2 that collectively contribute to 100% of filtered glucose reabsorption within the kidneys. Consequently, sole SGLT2 inhibitors (SGLT2i) and dual SGLT1/2 inhibitors (SGLT1/2i) contribute to reducing blood glucose levels by reducing glucose reabsorption and promoting glucosuria and natriuresis. Research from our team on SGLT2i, showed that there is a compensatory mechanism whereby SGLT1 is upregulated. This therefore may warrant the combined use of SGLT1/2i. Our in vitro results demonstrated that whilst both the sole SGLT2i empagliflozin (EMPA) and dual SGLT1/2i sotagliflozin (SOTAG) significantly reduce glucose uptake within HK2 cells, the latter was more effective. In addition, our in vitro results indicate significantly more pronounced upregulation of SGLT1 protein with EMPA compared to SOTAG. Our in vivo mechanistic findings demonstrated that SGLT1/2i significantly increased renal SOD1 levels, whilst SGLT2i significantly elevated renal SOD2 levels. Therefore, our study highlighted that SGLT2i and SGLT1/2i differentially regulate protective anti-oxidant proteins in the kidney.
Keywords:
diabetes
; sotagliflozin
; empagliflozin
; sglt1
; sglt2
1. Introduction
Diabetes mellitus (DM) is a disease characterised by hyperglycemia resulting from insulin deficiency, insulin resistance, or both. It remains a global health challenge with a significant impact on morbidity and mortality. Patients with diabetes are at a high risk of developing associated multi-organ complications, such as cardiovascular disease (CVD), chronic kidney disease (CKD), and heart failure (HF) [1]. These complications substantially effect their quality of life and pose a substantial economic burden on the healthcare systems globally.
Sodium Glucose Co-transporters (SGLTs) are transport proteins found on the luminal side of the cell membrane and their activity mediates apical sodium and glucose transport across cell membranes. Among the isoforms, SGLT1 and SGLT2 have been widely investigated [2]. This resulted in the development of SGLT inhibitors, a novel pharmacological drug class commonly known as “Gliflozins” which have revolutionized the management of type 2 diabetes (T2D) and its complications. Gliflozins such as Empagliflozin and Dapagliflozin only target SGLT2 proteins whilst dual inhibitors such as Sotagliflozin target both SGLT1 and SGLT2. The gliflozins were designed primarily to reduce hyperglycaemia, although pleiotropic effects of these inhibitors are now widely reported [3–21]. Despite the significant additional protective effects of these inhibitors, it still needs to be determined as to whether dual SGLT1/2 inhibitors may provide more effective cardiorenal protection than SGLT2 inhibition alone.
We have previously shown that in mouse models of diet-induced obesity and neurogenic hypertension, SGLT2 inhibition may promote cardiorenal benefits by reducing sympathetic nervous system (SNS) activation [3,4]. We also demonstrated that, in a type 1 diabetic (T1D) setting, pharmacological inhibition of SGLT2 increased SGLT1 protein expression in the kidneys [12] and eyes [6] in a compensatory manner. Additionally, under normal blood glucose levels (euglycemia), Rieg et al. demonstrated that both genetic and pharmacological inhibition of SGLT2, promoted a compensatory mechanism whereby SGLT1-mediated glucose reabsorption is increased in response to SGLT2 inhibition [22]. Taken together, these findings suggest that the kidneys adapt to the inhibition of SGLT2 by upregulating SGLT1 activity. Furthermore, we recently demonstrated that dual inhibition of SGLT1 and SGLT2 with Sotagliflozin leads to compensatory upregulation of SGLT1 and SGLT2 protein levels in the kidneys of diabetic mice.
Oxidative stress plays an essential role in the pathogenesis of diabetes. Reactive oxygen species (ROS) such as superoxide overwhelm anti-oxidant systems leading to an imbalance which in turn causes oxidative stress. Oxidative stress results in endothelial dysfunction which may occur in the retinas during diabetic retinopathy. In addition, oxidative stress results in lipid peroxidation, protein damage and DNA damage [23]. It has already been demonstrated that sole SGLT2 inhibition in the lens or retina decreases oxidative stress in the eye of T2D patients or mice respectively [24,25]. In relation to the kidneys, there is currently controversy concerning the impact of SGLT2i on oxidative stress and there are no studies aiming to assess the impact of SGLT1/2i on reactive oxygen species.
It has been established that different “Gliflozins” have distinct pharmacological, pharmacodynamic and pharmacokinetic effects. [26–32]. These differences, along with their variable selectivity for SGLT1 and SGLT2 proteins, may contribute to different protective effects on multiple organ systems. A study published by Kim et al. [33] has demonstrated that both Empagliflozin and Sotagliflozin exert cardioprotective effects in a zebrafish model of diabetes mellitus combined with heart failure with reduced ejection fraction. Despite the similar cardioprotective effects of the two treatments, Sotagliflozin may be less effective than Empagliflozin at high concentrations [33]. To the best of our knowledge there is no data comparing the effects of Empagliflozin and Sotagliflozin in T1D. Therefore, in this study, we evaluated the effects of the sole SGLT2 inhibitor, Empagliflozin and the dual SGLT1/2 inhibitor, Sotagliflozin, in T1D.
2. Methods
2.1. Human Kidney 2 (HK2) Cell Culture
The human renal proximal tubule cell line, HK2, was generously provided by Dr Melinda Coughlan and Prof Karin Jandeleit-Dahm (Baker IDI Heart and Diabetes Institute, Melbourne, VIC, Australia). Cells were cultured in high-glucose Dulbecco’s Modified Eagle Medium (HG-DMEM) supplemented with L-glutamine (1%), streptomycin/penicillin (2%) and foetal calf serum (FCS) (10%) (Thermo Fisher, Melbourne, VIC, Australia).
Unless stated otherwise, cells were trypsinized, plated in Corning Cell Bind 6 well plates (Corning, Glendale, AZ, USA) and allowed to grow to 70% confluency before being treated with SGLT2i’s, SOTAG or Norepinephrine (NE) (Sigma-Aldrich, Sydney, NSW, Australia). Norepinephrine was diluted in Baxter water and added to the wells in accordance with previous studies [4]. Control wells were treated with Baxter water. Norepinephrine was protected from light during its preparation and experiments. SGLT2i’s and SOTAG were dissolved in Dimethylsulfoxide (DMSO). Control wells were treated with DMSO.
2.2. Treatment with NE
Our team has previously published the optimal NE treatment conditions for SGLT1 and SGLT2 protein studies in HK2 cells (4, 9). Cells were either treated with 10 µM NE or Vehicle (VEH, Baxter water) in 2 ml of high glucose DMEM growth media for a period of 48 hrs.
2.3. Sole SGLT2 Inhibitors and Dual SGLT1/2 Inhibitor Treatment
Based on previously published literature, the following SGLT2i’s (canagliflozin, dapagliflozin, and empagliflozin) were used at 30 µM for in vitro purposes (34, 35). Stock solutions (0.03 M) were prepared. We therefore diluted the stocks 1 in 1000 in HG-DMEM growth media. As DMSO was used to dissolve all SGLT2i’s, control cells were treated with DMSO (vehicle) at the same dilutions as SGLT2 inhibitor stocks. Incubation times were also chosen based on the literature (34). To allow for comparability, SOTAG was also prepared as a 0.03 M stock solution (36). The stock solution was diluted at a 1 in 1000 dilution in HG-DMEM growth media. Cells were treated for 48 hrs as per the SGLT2i’s.
2.4. Glucose Uptake in HK2 Cells
Glucose uptake assays were performed using the fluorescently labelled (Fluorescein isothiocyanate or FITC filter) 2[N-(7-nitrobenz-2-oxa-1,2-diaxol-4-yl) amino]-2-deoxyglucose (2-NBDG) (N13195, Invitrogen, Victoria, Australia). According to the work of Lu and colleagues in 2019, incubation of 2-NBDG in a Na+ media is essential due to the sodium-dependent nature of SGLTs. The Na+ buffer was prepared with the following constituents (37): 140 mM NaCl, 5 mM KCl, 2.5 mM CaCl2, 1 mM MgSO4, 1 mM KH2PO4, and 10 mM HEPES (pH 7.4) diluted in Milli-Q water.
A 5 mg stock of the fluorescently labelled 2-NBDG was diluted in DMSO to produce a 200 mM stock. This glucose analog was used to monitor glucose uptake within HK2 cells via fluorescence detected by fluorescent microscopy. After 48 hrs of treatment with either EMPA, SOTAG, NE, or VEH, HK2 cells were washed 3X with ice-cold PBS. This was followed by a 2-hour incubation period with 2-NBDG (0.2 mM) in Na+ incubation media. Upon completion of the 2-hrs incubation, cells were washed 3X with ice-cold PBS and visualised in 2 ml of PBS under fluorescent microscopy (37). When fluorescently labelled 2-NBDG was omitted, no fluorescence was detected. A grading system ranging from 0-3 (0 represents no fluorescence detected whilst 3 demonstrated the presence of bright green fluorescence) was utilised to quantify fluorescence. Microscopic images of random fields of view were taken for each treatment well. Results were quantified in a blinded manner by two independent individuals.
2.5. Collection of Protein Cell Lysates
After cell were treated, they were gently placed on ice where the media was removed and discarded. This was followed by two 1X cold PBS washes of each well (2 ml per well). The monolayer was then lysed with 60 µl of lysis buffer containing 1X phosphatase inhibitor, 1X protease inhibitor and cytosolic extraction buffer (CEB). The CEB buffer consisted of 10 mM 4-(2-hydroxyethyl)-1-piperazineethanesulfonic acid (HEPES) pH 7.5, 14 mM KCl, 5% glycerol, 0.2 nonidet P-40 (Igepal). After adding lysis buffer to cells, adhered HK2 cells were then scraped and transferred to a 1.5 ml eppendorf tube to be stored at -80 °C for 24 hrs. Cell lysates were thawed and centrifuged at 12 000 rpm at 4 °C for 10 minutes. Supernatants were gently transferred to a new 1.5 ml eppendorf tube for protein quantitation.
2.6. Protein Quantification Using the Bradford Assay
Sample protein concentrations were determined using the Bradford assay. The bovine serum albumin (BSA) protein standards were added to 96 well plates in duplicate with concentrations ranging from 0-6 µg/µl. In separate wells, 1 µl of protein sample was added in duplicate to the same 96 well plate. Then, 250 µl of Bradford protein assay reagent was prepared for each sample well (50 µl of Bio-Rad dye reagent concentrate and 200 µl of Milli-Q water) and added to each well. The absorbance of samples was then determined after reading the plate at 595 nm which gave rise to the development of a standard curve (OD versus BSA protein standard concentrations). Unknown protein sample concentrations were then calculated from using the standard curve. Samples were then prepared (10 µg/100 µl) for SGLT1 determination.
2.7. Enzyme-Linked Immunosorbent Assay (ELISA)
HK2 lysates were analysed for SGLT1 protein expression levels using a commercially available human SGLT1-specific ELISA kit (Cloud clone – SEE 381Hu (Wuhan, China)) as per the manufacturer’s instructions.
2.8. Immunocytochemistry
SGLT1 was detected in HK2 cells using the immunocytochemistry technique. Using a 6 well plate, the cells were fixed in methanol/acetone (1:1) and then endogenous peroxidases were blocked with 3% H2O2 followed by blocking with 10% FCS/Tx/PBS. The primary antibody (1:500, Rabbit anti-SGLT1 antibody, Novus, Centennial, CO, USA.) diluted in Triton X/PBS was added to each well and incubated at 4 °C overnight. The following day a secondary conjugated antibody (1:100 goat anti-Rabbit IgG Peroxidase, Thermofisher, Melbourne, VIC, Australia) was added to each well and then stained with diaminobenzadine (DAB) prior to visualisation with a high-powered microscope.
2.9. Mice and Genotyping
As a model system, we utilized the Akimba mouse (Ins2AkitaVEGF+/−), a novel transgenic model of DR that was generated by crossing the diabetic Akita (Ins2Akita) which develops hyperglycemia with Kimba (trVEGF029) mice. The Kimba mouse has transient photoreceptor-specific overexpression of human vascular endothelial growth factor 165 (VEGF165) and hence depicts changes associated with DR without the hyperglycemic background. The Akimba mouse (Ins2AkitaVEGF+/−) is a cross between the diabetic Akita and the Kimba model, and develops advance DR features due to the interplay between high blood glucose levels and overexpression of VEGF [38]. DNA was isolated from tail clips by using the Wizard Genomic DNA Purification Kit (Promega, Madison, WI). Genotyping of Kimba mice was carried out as previously described [39,40]. Akita mice were genotyped for the insulin 2 (Ins2) gene as described [41]. Akimba mice were genotyped by using protocols for both Kimba and Akita mice.
2.10. Animal Work
Animal experimentation was carried out at the Harry Perkins Institute for Medical Research animal holding facility (Perth, WA). Animal ethics was approved by the Harry Perkins Institute for Medical Research Animal Ethics Committee (AE141/2019). Male Kimba and Akimba mice were bred and obtained from the Animal Resources Centre (Perth, WA, Australia) at 2–5 weeks of age. Mice were housed under a 12-h light/dark cycle, at 21 ± 2°C and were given a standard chow diet (Specialty Feeds, Glen Forrest, WA, Australia) with free access to food and water. Wet mash was replenished three times per week. Following a 7-day acclimatization period, the SGLT2 inhibitor EMPA (Ark Pharma Scientific Limited, China; 25 mg/kg/day), SOTAG (Med Chem Express, USA; 25mg/kg/day) or vehicle (dimethylsulfoxide) was administered to the mice weekly via their drinking water for 8 weeks. Urine glucose levels were measured (Keto-Diastix; Bayer, Leverkusen, Germany) before treatment and 1 week post-treatment to establish the diabetic status of Akimba mice and the development of glucosuria induced by EMPA or SOTAG. Mice were weighed weekly. Fasting blood glucose levels were measured at the end of the experiment using the Accu-Chek Performa blood glucose monitoring system (Roche Diagnostics, North Ryde, Australia). Only male mice were used in the present study as disease progression is known to be slower and less uniform in female mice [42].
2.11. Glucose Tolerance Testing (GTT)
Glucose tolerance testing was carried out in non-diabetic and diabetic mice treated for 8 weeks with vehicle (DMSO), SGLT2 inhibitor Empagliflozin (EMPA) or dual SGLT1/2 inhibitor SOTAG. After fasting for ~5 hrs, mice were given an intraperitoneal glucose injection (1g/kg; 100-200µl volumes injected) and blood glucose levels were measured via tail blood samples (~10µl) at 0, 15, 30, 45, 60, 90, 120 min using a Accu-Chek Performa blood glucose monitoring system (Roche Diagnostics, North Ryde, Australia).
2.12. Tissue and Serum Sample Collection
After 8 weeks of their respective treatments, the mice were fasted for 5 hrs and had access to treatment water. Mice were deeply anesthetized using isoflurane inhalation, underwent cardiac puncture to obtain blood and were killed by cervical dislocation. Blood samples were centrifuged, serum collected and stored at -80°C. Kidneys and pancreas tissue were harvested, weighed and fixed in 10% buffered formaldehyde (PFA) for histology.
2.13. Immunohistochemistry
Briefly, kidneys were fixed in 10% buffered formalin for 24 h, followed by wax embedding. Paraffin sections (5 μm) were collected and mounted on slides and then heated for 30 minutes at 60 degrees. Kidneys were washed in xylene (2 x 10 mins) and then rehydrated in 100% ethanol (2 x 5 mins), 95% ethanol (1 x 5 min), 70% ethanol (3 min) and then water (5 min). For antigen retrieval, slides were heated for 5 minutes in a pre-heated 1 x EDTA buffer (pH 8.5; Sigma-Aldrich, Sydney, Australia). After washing twice in PBS/0.1% Tween for 5 min, tissue sections were outlined with a paraffin pen. Sections were blocked with 3% H2O2 for 10 min, washed twice with PBS/0.1% Tween for 5 min and blocked with 5% FBS in PBS/0.1% Tween for 1 hr in a humidified chamber. Sections were then incubated overnight at 4°C in a humidified chamber with i) mouse anti-Glucagon antibody (1:500, NB600-1506, Novus Biologicals, Melbourne, Australia) for Glucagon; ii) rabbit anti-superoxide dismutase (SOD)-1 antibody (1:100, Catalog: A0274-20), Abclonal, Massachusetts, USA) for SOD-1; and iii) rabbit anti-SOD-2 antibody (1:100, Catalog: A19576-20, Abclonal, Massachusetts, USA) for SOD-2. Following overnight incubation, sections were washed three times with PBS/0.1% Tween for 5 mins and incubated with i) anti-rabbit or anti-mouse (1:100, Santa Cruz Biotechnology, Sydney, Australia) secondary antibodies conjugated with HRP in PBS/0.1% Tween for 1 hr. This was followed by incubation with DAB. Slides were counterstained with Hematoxylin, dehydrated and mounted with DPX (Sigma-Aldrich, Sydney, Australia).
2.14. Tissue Imaging and Analysis
Images were obtained using the inverted microscopic system Nikon Eclipse Ti (Nikon, Tokyo, Japan) with a digital camera CoolSNAP HQ2 (Photometrics, Tucson, AZ, USA) linked to a computer running the image analysis software ‘NIS-Elements Advanced Research’ (Nikon, Tokyo, Japan). The mean SOD1 and SOD2 staining expression intensity scores were calculated in counterstained renal tissue based on a scale of 0–3 (0 = absent expression; 1 = low expression; 2 = intermediate expression; 3 = high expression). Expression scores were obtained by two independent scorers to ensure results were unbiased. Glucagon staining was analysed with image analysis software (ImageJ 1.43j, National Institutes of Health, Bethesda, Maryland, U.S.A.). DAB quantitation was carried out according to the work of Fuhrich and colleagues with a slight modification in the background removal step. An independent negative threshold was determined for each stained tissue sample (43).
2.15. Statistical analysis
All data were analyzed using two-tailed Student’s t-test or One-way ANOVA and p≤0.05 was considered as a significant threshold.
3. Results
3.1. In Vitro
3.1.1. Treatment of HK2 Cells with SOTAG Resulted in a Greater Reduction of Glucose Uptake Compared to EMPA
Using concentrations of EMPA and SOTAG which do not result in cellular toxicity (30 µM), we performed a glucose uptake experiment to compare the glucose uptake in HK2 cells treated with vehicle, EMPA or SOTAG. Both EMPA and SOTAG treated cells displayed no signs of toxicity when inhibitors were used at 30 µM and remained adhered to the culture dish. Furthermore, SOTAG treated cells exhibited remarkably enhanced glucose-lowering effects in comparison to the sole SGLT2i, EMPA (Figure 1).
3.1.2. Treatment of HK2 Cells with NE Promotes Elevated Glucose Uptake
We investigated the influence of NE on glucose uptake within HK2 cells. The 10 µM concentration of NE which has been used in our previous studies has been shown to be functional in HK2 cells [4,9]. Confluent monolayers of HK2 cells were treated with NE or vehicle (Baxter water) in high glucose DMEM for 48 hrs before treatment with fluorescently labelled 2-NBDG for 2 hrs. This was followed by microscopic visualisation of fluorescence in the HK2 cells. We were able to demonstrate that NE-treated HK2 cells displayed a significantly higher fluorescence intensity compared to vehicle treated cells (Figure 2). In conclusion, this result highlights that exposure to NE contributes to increased SGLT mediated glucose uptake within the human proximal tubule cell line. Furthermore, this result supports our previous findings that NE promotes increased SGLT 1 and 2 protein expression and translocation to the cell surface in HK2 cells (4, 9).
3.1.3. Treatment of HK2 Cells with Sole SGLT2i’s, Dapagliflozin and Empagliflozin Promotes the Upregulation of SGLT1 Protein Expression
The exact mechanisms underlying the regulation of SGLT1 remain unclear. Although both SGLT1 and 2 possess identical functions, SGLT1 differs in its expression pattern throughout the body. The SGLT2 protein is found within various locations such as the kidneys (predominantly within the renal proximal tubules) and retina [5]. Meanwhile, SGLT1 is found in liver, retina, lungs and the distal tubules of the kidney. Our team and others have demonstrated that SGLT1 protein expression is significantly increased with SGLT2 inhibition in vivo. This observation demonstrates the existence of a compensatory mechanism. We endeavoured to investigate whether there is a direct upregulation of SGLT1 protein expression that is mediated by the action of three different clinically utilised SGLT2i’s (Canagliflozin, Dapagliflozin and Empagliflozin) in HK2 cells. With the aid of a human anti-SGLT1 ELISA, we demonstrated that SGLT1 protein expression is indeed significantly increased with DAPA and EMPA treatment (Figure 3).
3.1.4. The SGLT2 Inhibitor Empagliflozin Increases SGLT1 Expression in HK2 Cells
In an effort to further confirm the SGLT2i (EMPA) mediated increase in SGLT1 protein expression, immunocytochemistry for SGLT1 protein was then performed. This method was conducted on HK2 cells that were either treated with VEH (DMSO) or EMPA. The SGLT2i, EMPA, was used as it resulted in the largest increase in SGLT1 expression by ELISA detection. In Figure 4, the SGLT1 expression was visually detectable with the aid of a rabbit anti-SGLT1 antibody and an anti-rabbit HRP conjugated antibody followed by DAB treatment. The EMPA treated HK2 cells expressed a trend for higher levels of SGLT1 protein as indicated by cytoplasmic brown staining (Figure 4). It should be noted that when no anti-SGLT1 antibody was added to the cells, there was no brown staining detected.
3.1.5. Treatment of HK2 Cells with the Dual SGLT1/2i, Sotagliflozin, Causes a Mild Non-Significant Elevation in SGLT1 Protein Expression
It has been suggested that dual inhibition of both proteins, SGLT1 and 2 with SOTAG treatment may provide more advantageous outcomes than EMPA that are beyond its glucose lowering effects [44]. We sought to examine whether dual SGLT1/2i with SOTAG also promotes the upregulation of SGLT1 protein expression. Using a human anti-SGLT1 ELISA, we showed that SOTAG treatment resulted in a mild non-significant elevation in SGLT1 protein expression (Figure 5).
3.2. In Vivo Studies
3.2.1. SGLT2 and SGLT1/2 Inhibition with EMPA and SOTAG Treatment Promotes Glucosuria in Non-Diabetic Kimba Mice
The Kimba mouse model lacks the hyperglycemic background and therefore acts as the internal control to determine the effectiveness of the SGLT2i EMPA and the SGLT1/2i SOTAG to promote glucosuria in our in vivo study. Before treatment, urine glucose levels in the non-diabetic Kimba mice were 0 mmol/L compared to > 111 mmol/L in the diabetic Akimba mice (data not shown). As anticipated, the consumption of 25 mg/kg/day of either EMPA or SOTAG in drinking water resulted in glucosuria in the non-diabetic Kimba mice (Figure 6), indicated by the dark brown coloration (> 111 mmol/L). Mice receiving vehicle remained at 0 mmol/L as indicated by the green coloration. As expected, urine glucose levels of the diabetic Akimba mice were positive (> 111 mmol/L) regardless of treatment (data not shown).
3.2.2. EMPA and SOTAG Treatment Was Well-Tolerated by Mice
Kimba and Akimba mice displayed normal responses to touch, smooth and healthy body coats, bright eyes and normal posture throughout the 8 weeks of vehicle, EMPA or SOTAG treatment.
3.2.3. Treatment with EMPA and SOTAG Both Reduce Fasting Blood Glucose Levels Equally in Diabetic Akimba Mice
We tested the glucose lowering potential of both EMPA and SOTAG to determine if dual SGLT1/2i is superior to sole SGLT2i. The non-diabetic Kimba blood glucose levels were consistently lower than 20 mmol/l and there was no difference between the Vehicle, EMPA or SOTAG groups (Figure 7A). The blood glucose levels in Kimba mice were markedly lower than the diabetic Akimba mice (Figure 7B). In diabetic Akimba mice, after 8 weeks of treatment, the fasting blood glucose levels of the EMPA and SOTAG treated mice were both equally lower than the Vehicle treated mice (Figure 7B). This result highlights that both sole SGLT2i and dual SGLT1/2i were able to significantly reduce diabetic hyperglycemia.
3.2.4. EMPA and SOTAG Both Significantly Promote Glucose Tolerance to a Similar Degree
To address the question whether there is a difference in pancreatic function between mice treated with dual SGLT1/2i and sole SGLT2i, we challenged the mice with a glucose bolus and then conducted a 120 min GTT in our vehicle, EMPA or SOTAG treated Akimba mice. It was clearly evident that the vehicle treated mice were the most glucose intolerant as their fasting blood glucose started at over 30 mmol/L at time-point 0 min and remained the highest throughout the time-course. As expected, the fasting blood glucose levels in EMPA or SOTAG treated Akimba mice were markedly lower at 16.8±1.6 mmol/L and 15.5±0.5 mmol/L at time-point 0 min, respectively with no statistical difference between the two groups. After glucose administration, the EMPA or SOTAG treated Akimba mice were consistently displaying lower glucose levels from 15 min onwards compared to the Akimba vehicle mice. There was no statistically discernible difference between EMPA or SOTAG treated mice (Figure 8B). We also show that the non-diabetic EMPA or SOTAG treated Kimba counterparts were the most glucose tolerant mice as evidenced by their markedly lower fasting blood glucose levels over the 120 min time-course (Figure 8A).
3.2.5. EMPA and SOTAG Both Reduce Diabetes Induced Polydipsia
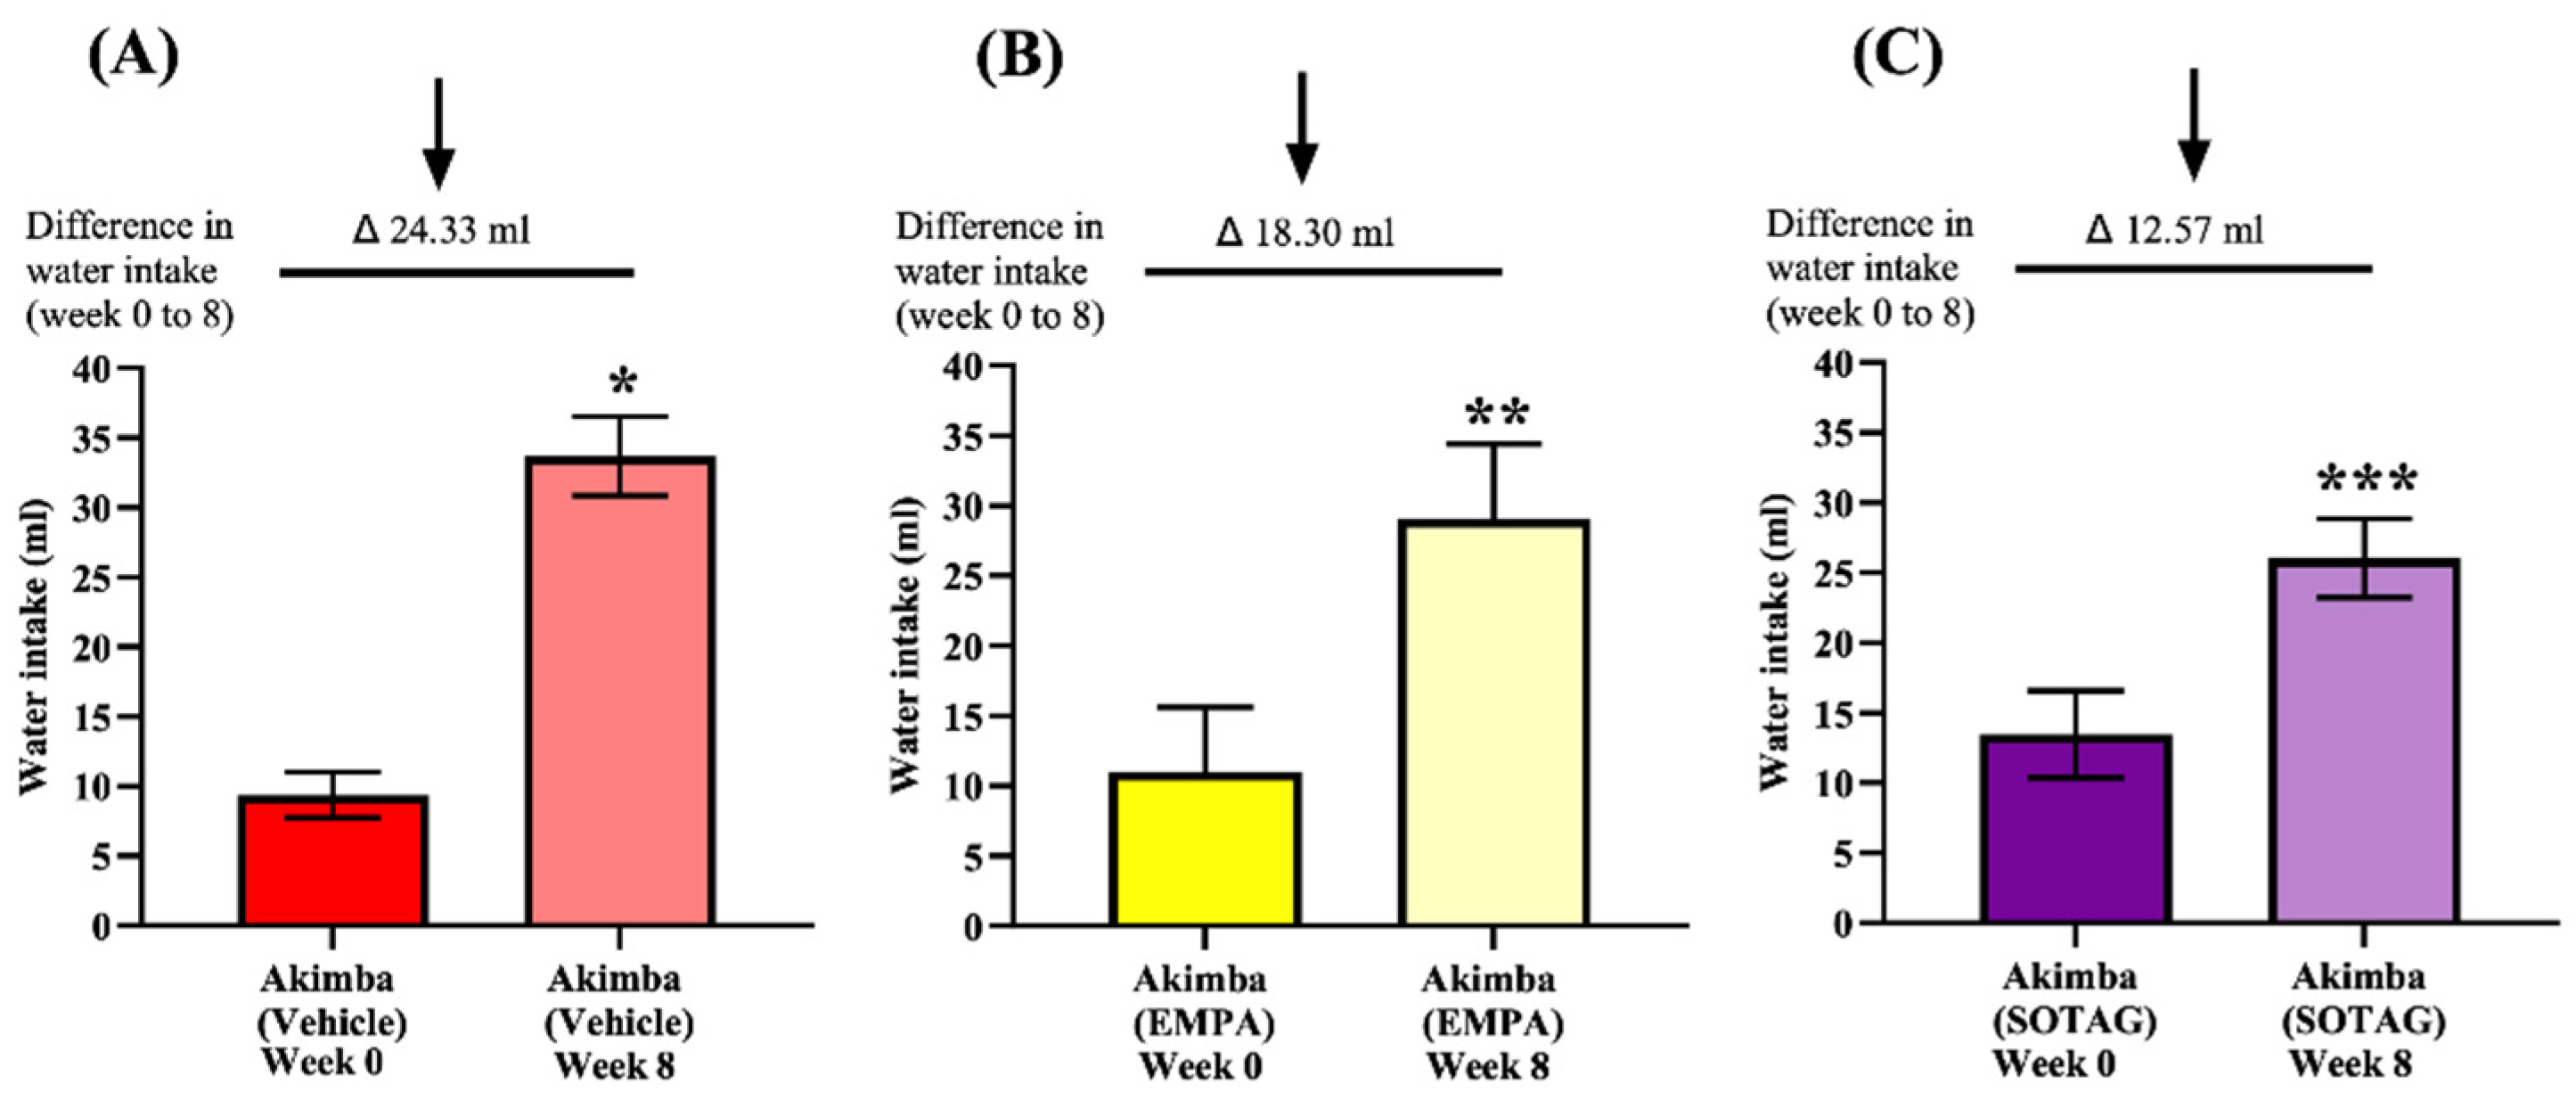
Both EMPA and SOTAG treatment had no effect on the water intake in non-diabetic Kimba mice (Supplementary Figure S1). In Akimba mice, both EMPA and SOTAG treatment reduced the diabetes induced polydipsia when compared to vehicle treated mice (Figure 9). When assessing the pre-treatment and post-treatment water intake, it was evident that Sotagliflozin treatment was also more effective at reducing water intake compared to EMPA treatment.
3.2.6. EMPA and SOTAG Mediated Effects on Glucagon Protein Expression in Diabetic Akimba Mice
As previous studies have shown that SGLT2i may increase glucagon production to reduce hypoglycemia, we assessed whether EMPA and SOTAG may regulate glucagon levels. As seen in Supplementary Figure S2, we demonstrated that EMPA and SOTAG do not influence glucagon protein expression in the pancreatic islets of our Akimba Diabetic mice compared to vehicle treatment.
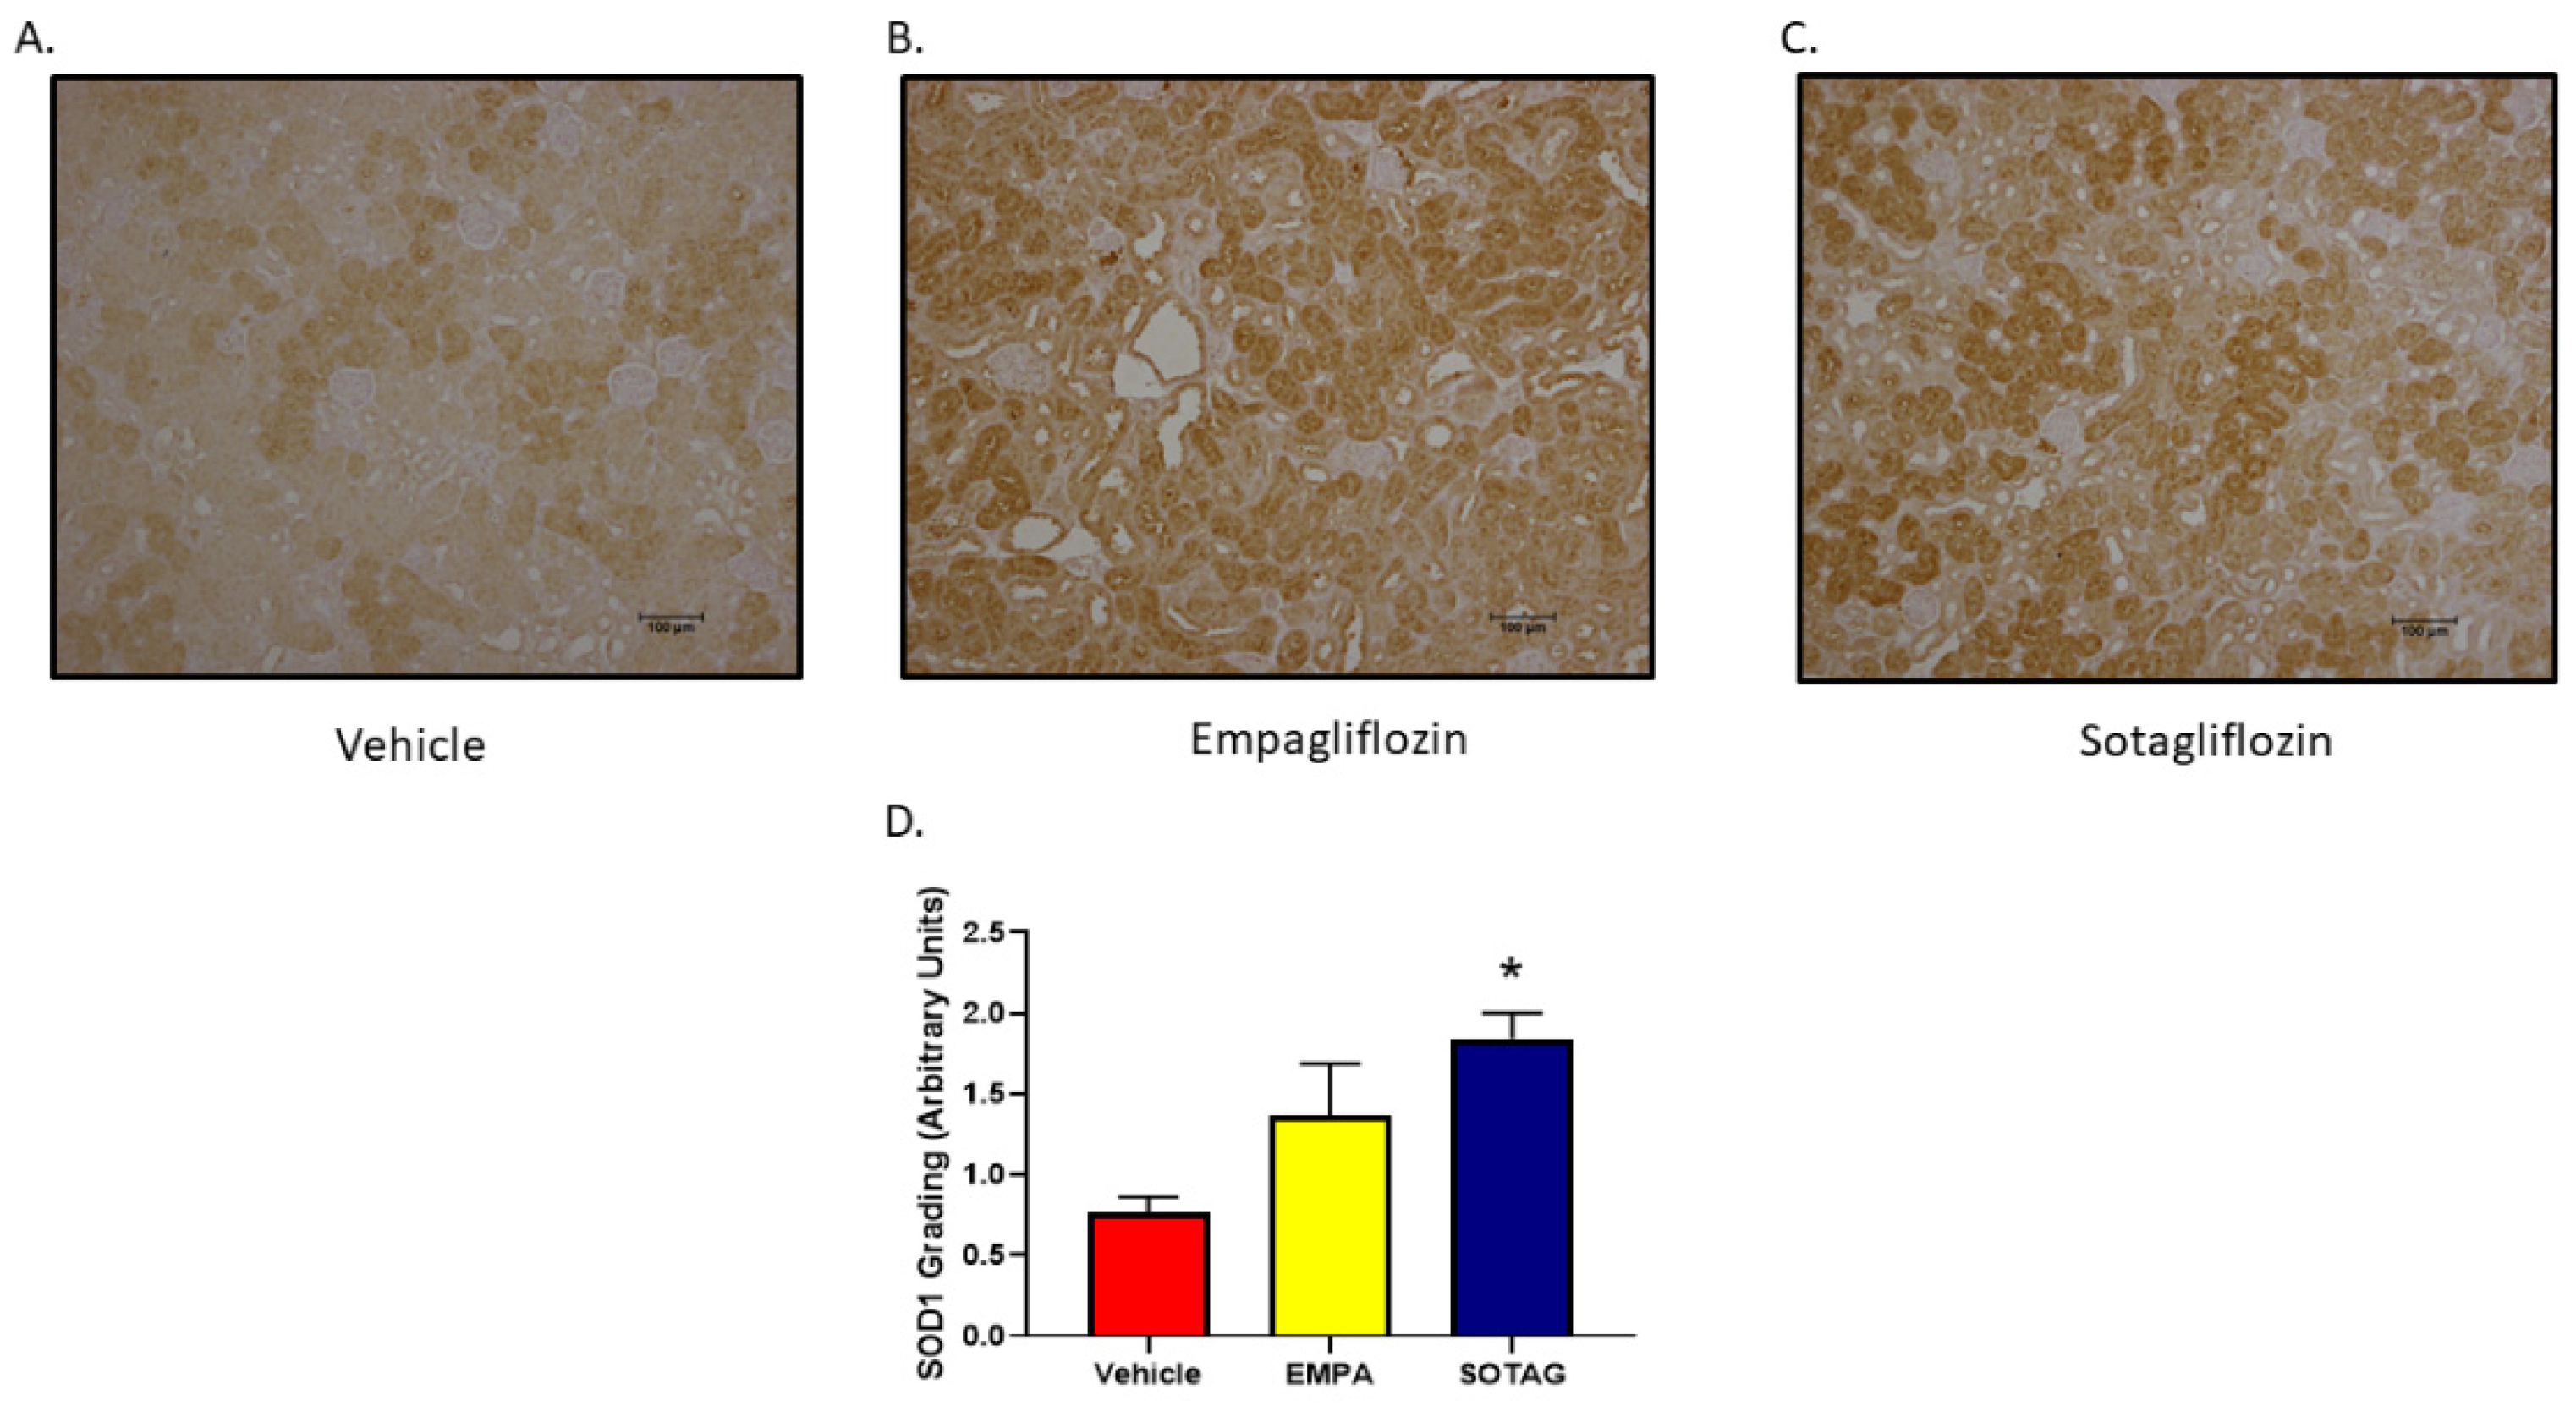
3.2.7. EMPA and SOTAG Both Increase SOD1 Expression
In an effort to discern the impact of EMPA and SOTAG on renal oxidative stress, immunohistochemistry for SOD1 was performed in kidneys of our Akimba mice. While SOD1 was increased in both Empagliflozin and Sotagliflozin compared to Vehicle, it was significantly higher in the SGLT1/2 inhibitor SOTAG group.
Figure 10.
Renal SOD1 expression in Akimba mice. Statistical sigificance was determined with a one-way ANOVA. n=4-6 mice/group, *p=0.003 (Vehicle v SOTAG). Abbreviation: Empagliflozin (EMPA) and Sotagliflozin (SOTAG).
Figure 10.
Renal SOD1 expression in Akimba mice. Statistical sigificance was determined with a one-way ANOVA. n=4-6 mice/group, *p=0.003 (Vehicle v SOTAG). Abbreviation: Empagliflozin (EMPA) and Sotagliflozin (SOTAG).
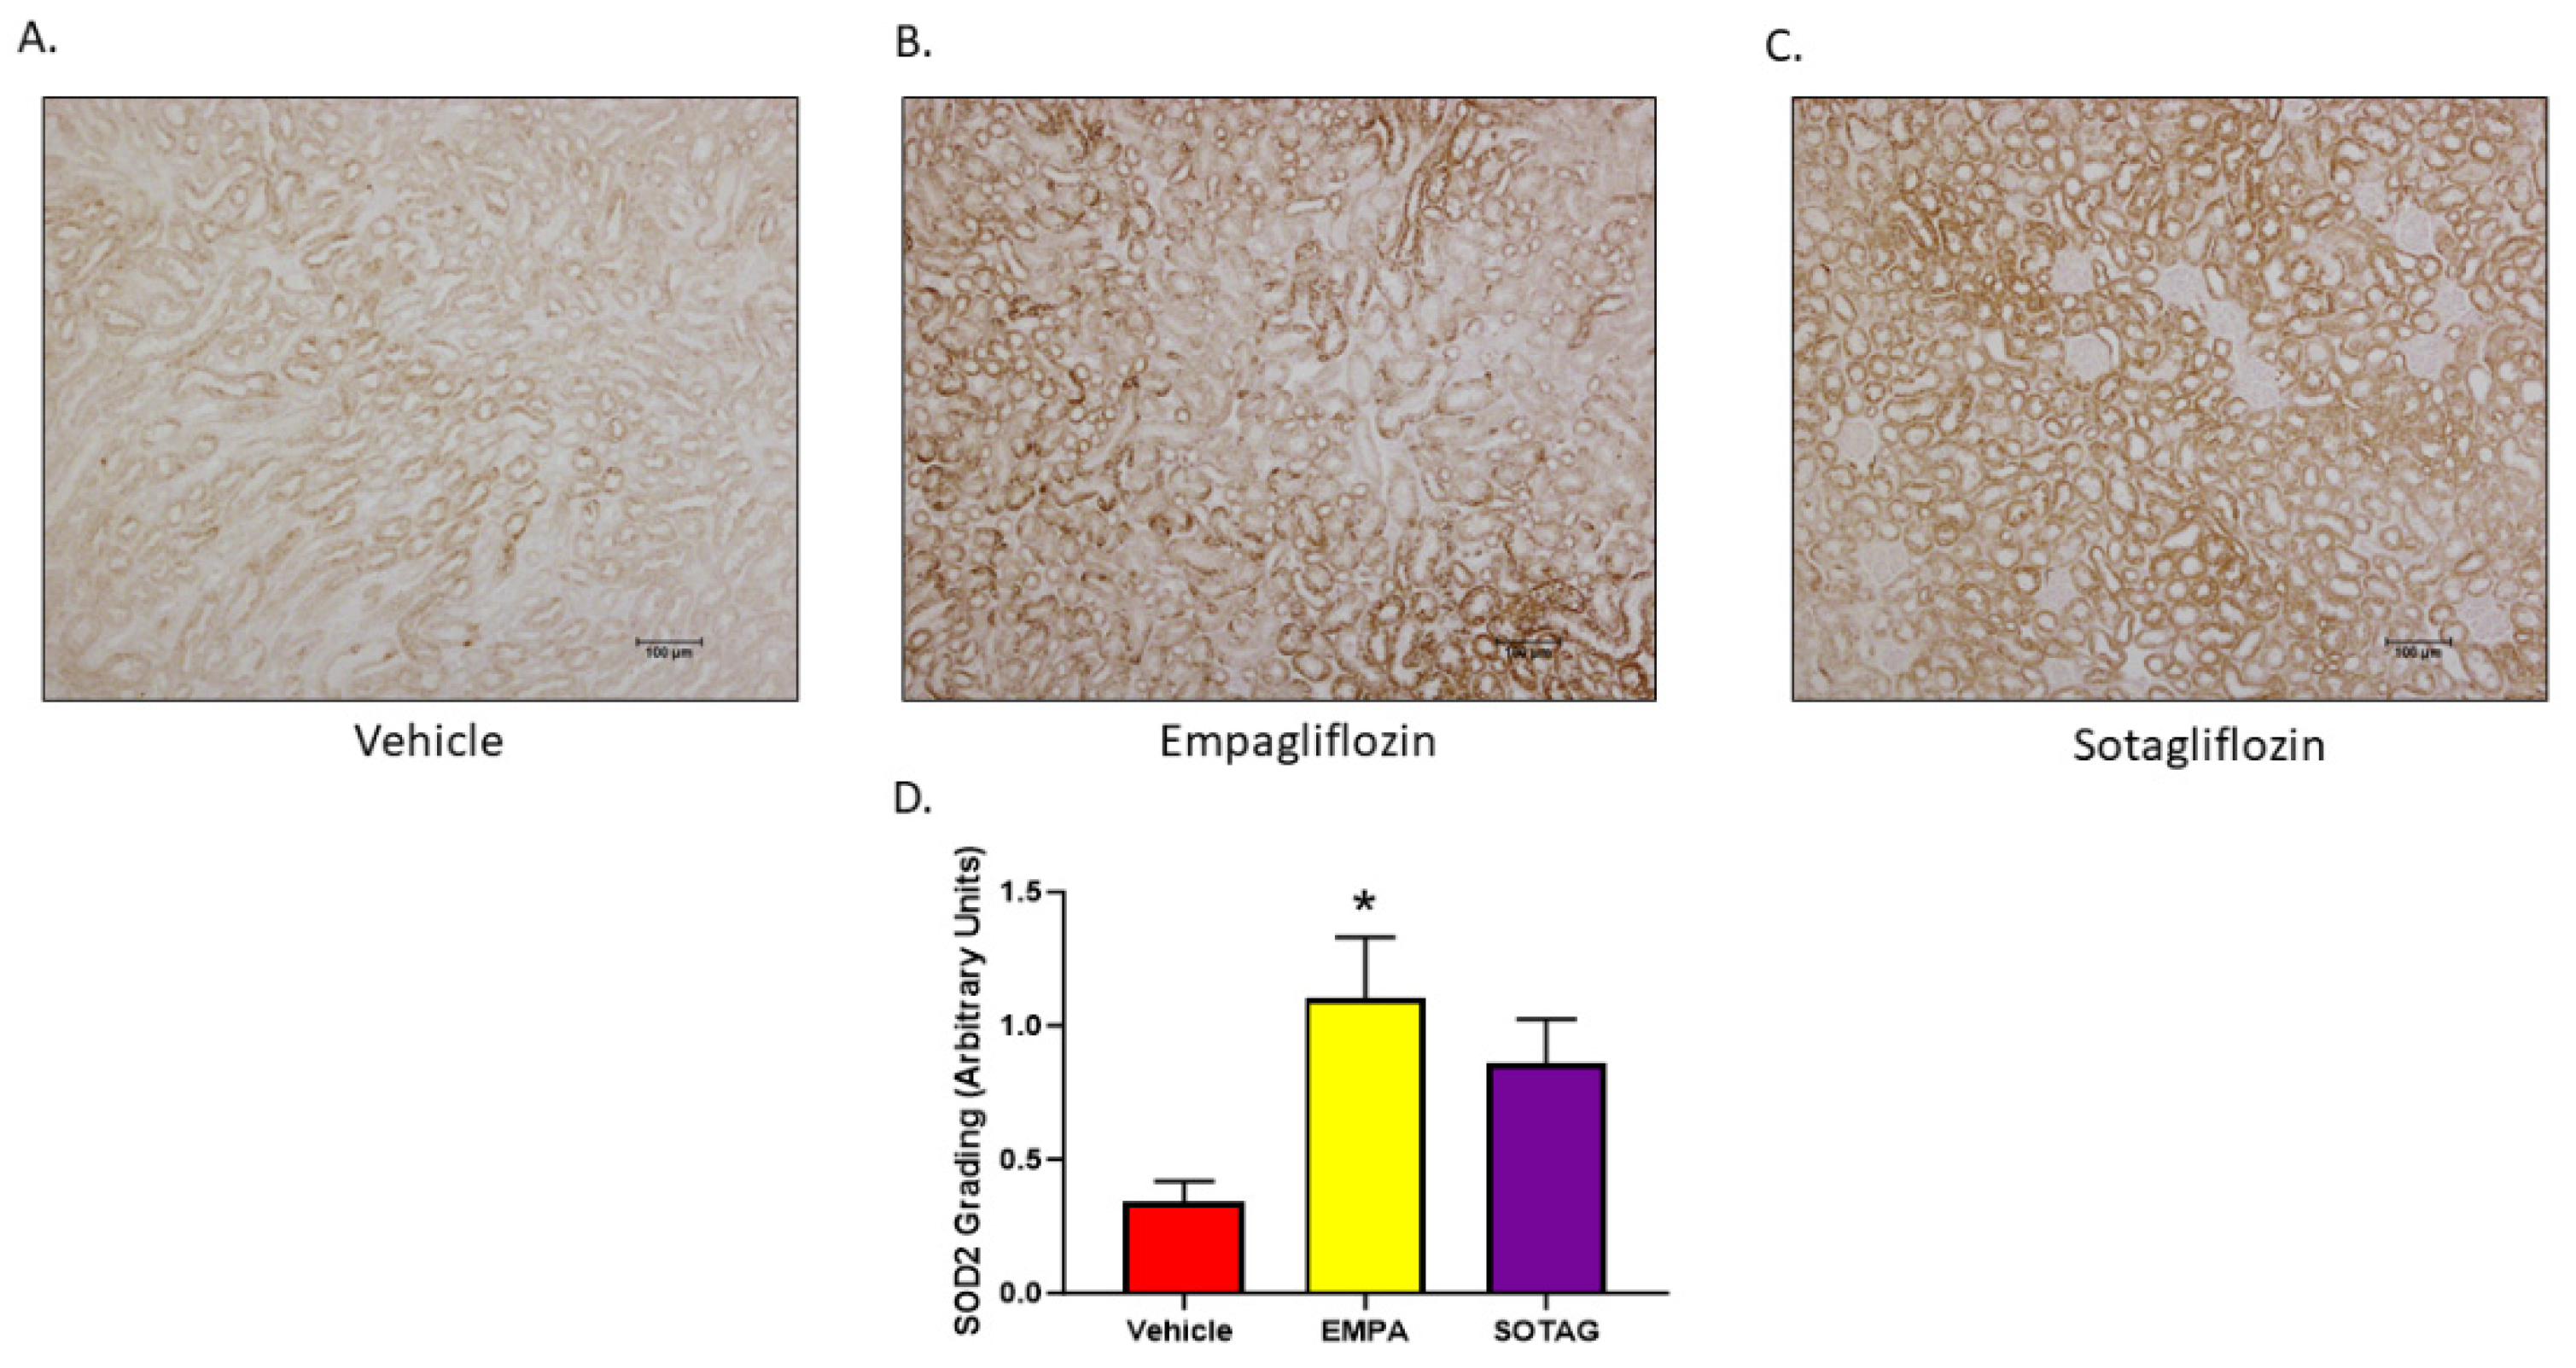
3.2.8. EMPA and SOTAG Both Increase SOD2 Expression
To discern the impact of EMPA and SOTAG had on renal oxidative stress, immunohistochemistry for SOD2 was performed in kidneys of our Akimba mice. While SOD2 was increased with both Empagliflozin and Sotagliflozin treatment compared to vehicle treatment, it was significantly higher in the SGLT2 inhibitor Empagliflozin group.
Figure 11.
Renal SOD2 expression in Akimba mice. Statistical sigificance was determined with a one-way ANOVA. n=4-6 mice/group, *p=0.011 (Vehicle v Empagliflozin). Abbreviation: Empagliflozin (EMPA) and Sotagliflozin (SOTAG).
Figure 11.
Renal SOD2 expression in Akimba mice. Statistical sigificance was determined with a one-way ANOVA. n=4-6 mice/group, *p=0.011 (Vehicle v Empagliflozin). Abbreviation: Empagliflozin (EMPA) and Sotagliflozin (SOTAG).
4. Discussion
While sole SGLT2 inhibition is now considered standard therapy for treatment of T2DM and its complications, dual SGLT1/2 inhibitors have shown promise in further advancing organ protection [18,19]. Our understanding of the mechanisms underpinning these apparent additional beneficial effects remains limited. Only a few studies aimed at comparing and contrasting sole SGLT2 inhibition with dual SGLT1/2i in the context of cardiovascular benefits. Firstly, a compare and contrast study utilizing the zebrafish model showed that both EMPA and SOTAG offered cardioprotective benefits by inhibiting NHE1 activity, although SOTAG may be less effective than EMPA at higher concentrations [33]. Additionally, a meta-analysis of human studies [45] showed that T2D patients on the dual SGLT1/2 inhibitor exhibited a lower risk of myocardial infarction and stroke than those on sole SGLT2 inhibitors. Interestingly, in the latter study, SOTAG treated patients did appear to have a higher risk of severe hypoglycemia and diarrhea. Therefore, dual SGLT1/2i demonstrates both advantages and disadvantages for diabetes protection.
Sodium Glucose Co-transporters are currently used to treat diabetes by lowering blood glucose levels. Both our in vitro studies utilizing Human Kidney 2 (HK2) cells and our in vivo studies utilizing our diabetic Akimba mice showed that when the SGLT2i’s EMPA or SOTAG were administered, both drugs resulted in a decrease in in vitro glucose uptake within the cells (Figure 1) and an in vivo decrease in glucose levels in mice when compared to vehicle (Figure 7).
One of the major aims of our study was to compare and contrast whether dual inhibition of both SGLT1 and 2 with SOTAG, provides greater metabolic benefits compared to sole inhibition of SGLT2 with EMPA. With our combined in vitro and in vivo study approach we were able to demonstrate that (a) SOTAG treatment resulted in a more pronounced reduction in glucose uptake in HK2 cells compared to EMPA treatment; (b) the major neurotransmitter of the SNS, NE upregulates glucose uptake in HK2 cells; (c) upregulation of SGLT1 protein expression only occurred with SGLT2 inhibition via EMPA, but not with dual SGLT1/2 inhibition with SOTAG in vitro; (d) both EMPA and SOTAG caused significant equivalent reductions in blood glucose levels and glucose tolerance in vivo; (e) SOTAG promoted a greater reduction in water intake in Akimba mice compared to EMPA treatment; and (f) EMPA and SOTAG upregulate the anti-oxidative stress proteins SOD2 and SOD1, respectively.
Activation of the SNS is a cardinal feature of the metabolic disturbances associated with T2DM. We have previously demonstrated that this associated may at least in part be explained by the bi-directional interaction between SNS activity and SGLT2 expression [4]. Indeed, exposure of HK2 cells to NE, the main neurotransmitter of the SNS, resulted in upregulation of SGLT2 expression [4]. Altered sympathetic nervous system signaling was also identified in the diabetic heart [46]. In our current study, we verified using the fluorescently labelled glucose analogue, 2-NBDG, that NE does indeed promote SGLT mediated glucose uptake [4,9]. This supports our previous findings where we demonstrated that NE increases expression of SGLT 1 and 2 protein expression and their translocation to the cell surface [4,9]. Furthermore, this finding provides compelling evidence for the notion that the NE induced SGLT1 and SGLT2 translocation to the cell membrane is functional in HK2 cells.
As highlighted in Figure 3, both DAPA and EMPA caused a significant direct upregulation in SGLT1 protein expression. Consequently, our in vitro findings aligned with prior research concerning the SGLT2i mediated compensatory upregulation of SGLT1 protein expression in vivo [6]. The upregulation of SGLT1 protein expression could therefore provide a justification for the observed 50-60% of remaining filtered glucose reabsorption with SGLT2 inhibition within the proximal tubules under euglycemic conditions [21]. Furthermore, the compensatory increase in SGLT1 expression mediated by SGLT2 inhibition could result in diminished efficacy of SGLT2 inhibitors. The apparent additive benefit of combined SGLT1/2 inhibition with SOTAG compared to SGLT2 inhibition alone, as portrayed in a meta-analysis from human trial data [45], may at least in part be explained by functional mitigation of SGLT2i induced upregulation of SGLT1 with SOTAG, resulting in more pronounced overall metabolic benefits and cardiorenal protective outcomes.
Another pathogenic mechanism contributing to the development of complications associted with longstanding diabetes such as diabetic nephropathy and diabetic retinopathy is hypoxia. Decreased retinal blood flow and a deficit in oxygen delivery facilitate this process. Inflammation induced capillary dropout contributes to the well described scenario of retinal hypoxia which is mediated by the oxygen sensitive transcription factor hypoxia-inducible factor-1 alpha (HIF-1α) [47]. Interestingly, expression of the pathogenic factors vascular endothelial growth factor (VEGF) is regulated by HIF-1α [42]. Future studies should include uncovering the effect of both the SGLT2 inhibitor EMPA and the SGLT1/2 inhibitor SOTAG on renal hypoxia in the diabetic Akimba mouse. In addition, as SOD’s prevent the production of aggressive ROS’s which promote inflammation, pro-inflammatory cytokine production in the kidneys should also be assessed after EMPA and SOTAG therapy [48].
5. Conclusions
Our current study examined renal oxidative stress related proteins and provided new insights into the anti-diabetic protective effects of EMPA, a highly selective sole SGLT2 inhibitor and SOTAG, a dual SGLT1/2 inhibitor. In addition, our study using our novel Akimba mouse model failed to demonstrate that SOTAG treatment is superior to EMPA therapy.
Supplementary Materials
The following supporting information can be downloaded at the website of this paper posted on Preprints.org, Figure S1: Effect of EMPA and SOTAG on water intake in non-diabetic Kimba mice; Figure S2: Effect of VEH, EMPA and SOTAG treatment on glucagon expression in the pancreas of diabetic Akimba mice
Author Contributions
Conceptualization, V.M., L.H., and M.P.S.; formal analysis, J.M., L.H, A.S. and V.B.M.; funding acquisition, M.P.S., V.M. and L.H.; investigation, J.M, L.H., E.R., A.S., M.P.S. and V.M.; writing—original draft, J.M., V.M., L.H.; writing—review and editing, J.M., L.H, E.R., A.S., M.P.S and V.M. All authors have read and agreed to the published version of the manuscript.
Funding
Funding from the Royal Perth Hospital Research Foundation to the Dobney Chair Professor Markus Schlaich. Royal Perth Hospital Research Foundation Fellowship to Lakshini Y Herat ID CAF 133/2020. Diabetes Research WA (DRWA-LHerat-2023)
Data Availability Statement
The data presented in this study are available on request from authors.
Acknowledgments
We thank Animal Resources Centre (Murdoch, Western Australia) and the Bioresources, Harry Perkins Institute of Medical Research (Nedlands, Western Australia) for providing animal care services.
Conflicts of Interest
Prof. Schlaich has received research support from Medtronic, Abbott, Novartis, Servier, Pfizer and Boehringer Ingelheim. All other authors declare no conflict of interest.
References
- Fowler, M.J. Microvascular and Macrovascular Complications of Diabetes. Clinical Diabetes. 2008, 26, 77–82. [Google Scholar] [CrossRef]
- Poulson, S; Fenton, R; Rieg, T. Sodium-glucose cotransport. Curr Opin Nephrol Hypertens. 2015, 24(5): 463-469. [CrossRef]
- Herat, LY; Magno, AL; Rudnicka, C; Hricova, J; Carnagarin, R; Ward, NC; Arcambal, A; Kiuchi, MG; Head, GA; Schlaich, MP; Matthews, VB. SGLT2 Inhibitor-Induced Sympathoinhibition: A Novel Mechanism for Cardiorenal Protection. JACC Basic Transl Sci. 2020, 5(2), 169-179. [CrossRef]
- Matthews, VB; Elliot, RH; Rudnicka, C; Hricova, J; Herat, L; Schlaich, MP. Role of the sympathetic nervous system in regulation of the sodium glucose cotransporter 2. J. Hypertens. 2017, 35(10), 2059–2068. [CrossRef]
- Matthews, J; Herat, L; Rooney, J; Rakoczy, E; Schlaich, M; Matthews V. Determining the role of SGLT2 inhibition with Empagliflozin in the development of diabetic retinopathy. Biosci Rep. 2022, 42(3), BSR20212209. [CrossRef]
- Herat, LY; Matthews, JR; Ong, WE; Rakoczy, EP; Schlaich, MP; Matthews, VB. Determining the role of SGLT2 Inhibition with Dapagliflozin in the Development of Diabetic Retinopathy. Front Biosci. 2022, 27(12), 321. [CrossRef]
- Herat, LY; Matthews, JR; Rakoczy, EP; Schlaich, MP; Matthews, VB. Comparing and Contrasting the Effects of the SGLT2 Inhibitors Canagliflozin and Empagliflozin on the Progression of Retinopathy. Front Biosci. 2023, 28(4), 83. [CrossRef]
- Matthews, JR; Schlaich, MP; Rakoczy, EP; Matthews, VB; Herat, LY. The Effect of SGLT2 Inhibition on Diabetic Kidney Disease in a Model of Diabetic Retinopathy. Biomedicines. 2022, 10(3), 522. [CrossRef]
- Jennifer Matthews; Moira Hibbs; Lakshini Herat; Markus Schlaich; Vance Matthews. The Sympathetic Nervous System Regulates Sodium Glucose Co-Transporter 1 Expression in the Kidney. Biomedicines. 2023, 11(3), 819. [CrossRef]
- Herat, LY; Ward, NC; Magno, AL; Rakoczy, EP; Kiuchi, MG; Schlaich, MP; Matthews, VB. Sodium glucose co-transporter 2 inhibition reduces succinate levels in diabetic mice. World J Gastroenterol. 2020, 26(23), 3225-3235. [CrossRef]
- Matthews, JR; Herat, LY; Magno, AL; Gorman, S; Schlaich, MP; Matthews, VB. SGLT2 Inhibitor-Induced Sympathoexcitation in White Adipose Tissue: A Novel Mechanism for Beiging. Biomedicines. 2020, 8(11), 514. [CrossRef]
- Herat, LY; Matthews, JR; Hibbs, M; Rakoczy, EP; Schlaich, MP; Matthews, VB. SGLT1/2 inhibition improves glycemic control and multi-organ protection in type 1 diabetes. iScience. 2023, 26(8), 107260. [CrossRef]
- Zinman, B.; Wanner, C.; Lachin, J.; Fitchett, D.; Bluhmki, E.; Hantel, S.; Mattheus, M.; Devins, T.; Johanssen, E.; Woerle, H.; Broedl, U.; Inzucchi, S. Empagliflozin, Cardiovascular Outcomes, and Mortality in Type 2 Diabetes. N Engl J Med. 2015, 373, 2117–2128. [Google Scholar] [CrossRef]
- Wiviott, SD.; Raz, I.; Bonaca, M.; Mosenzon, O.; Kato, E.; Cahn, A.; Silverman, M.; Zelniker, T.; Kuder, J.; Murphy, S.; Bhatt, D.; Leiter, L.; McGuire, D.; Wilding, J.; Ruff, C.; Gause-Nilsson, I.; Fredriksson, M.; Johansson, P.; Langkilde, A.; Sabatine, M. Dapagliflozin and Cardiovascular Outcomes in Type 2 Diabetes. N Engl J Med. 2019, 380, 347–357. [Google Scholar] [CrossRef] [PubMed]
- Wanner, C.; Inzucchi, S.; Lachin, J.; Fitchett, D.; Von Eynatten, M.; Mattheus, M.; Johansen, E.; Woerle, H.; Broedl, U.; Zinman, B. Empagliflozin and Progression of Kidney Disease in Type 2 Diabetes. N Eng J Med. 2016, 375, 323–334. [Google Scholar] [CrossRef]
- Heerspink, H.; Stefansson, B.; Correa-Rotter, R.; Chertow, G.; Greene, T.; Hou, F.; Mann, J.; McMurray, J.; Lindberg, M.; Rossing, P.; Sjostrom, D.; Toto, R.; Langkilde, A.; Wheeler, D. Dapagliflozin in Patients with Chronic Kidney Disease. N Eng J Med. 2020, 383, 1436–1446. [Google Scholar] [CrossRef]
- McMurray, J; Solomon, S; Inzucchi, S; Kober, L; Kosiborod, N; Martinez, F; Ponikowski, P; Sabatine, M; Anand, I; Belohlavek, J; Bohm, M; Chiang, C; Chopra, V; DeBoer, R; Desai, A; Diez, M; Drozdz, J; Dukat, A; Ge, J; Howlett, J; Katova, T; Kitakaze, M; Ljungman, C; Merkely, B; Nicolau, J; O’Meara, E; Petrie, M; Vinh, P; Schou, M; Tereschenko, S; Verma, S; Held, C; DeMets, D; Docherty, K; Jhund, P; Bengtsson, O; Sjostrand, M; Langkilde, A. Dapagliflozin in Patients with Heart Failure and Reduced Ejection Fraction. N Eng J Med. 2019, 381, 1995–2008. [CrossRef]
- Bhatt, D; Szarek, M; Steg, P; Cannon, C; Leiter, L; McGuire, D; Lewis, J; Riddle, M; Voors, A; Metra, M; Lund, L; Komajda, M; Testani, J; Wilcox, C; Ponikowski, P; Lopes, R; Verma, S; Lapuerta, P; Pitt, B. Sotagliflozin in Patients with Diabetes and Recent Worsening Heart Failure. N Eng J Med. 2021, 384(2), 117–128. [CrossRef]
- Bhatt, D; Szarek, M; Pitt, B; Cannon, C; Leiter, L; McGuire, D; Lewis, J; Riddle, M; Inzucchi, S; Kosiborod, M; Cherney, D; Dwyer, J; Scirica, B; Bailey, C; Dfaz, R; Ray, K; Udell, J; Lopes, R; Lapuerta, P; Steg, P. Sotagliflozin in Patients with Diabetes and Chronic Kidney Disease. N Eng J Med. 2021, 384, 129–139. [CrossRef]
- Patel, D.K.; Strong, J. The Pleiotropic Effects of Sodium-Glucose Cotransporter-2 Inhibitors: Beyond the Glycemic Benefit. Diabetes Ther. 2019, 10, 1771–1792. [Google Scholar] [CrossRef] [PubMed]
- Suga, T; Kikuchi, O; Kobayashi, M; Matsui, S; Yokota-Hashimoto, H; Wada, E; Kohno, D; Sasaki, T; Takeuchi, K; Kakizaki, S; Yamada, M; Kitamura, T. SGLT1 in pancreatic a cells regulate glucagon secretion in mice, possibly explaining the distinct effects of SGLT2 inhibitors on plasma glucagon levels. Mol Metab. 2019, 19, 1–12. [CrossRef]
- Rieg, T; Masuda, T; Gerasimova, M; Mayoux, E; Platt, K; Powell, D; Thomson, S; Koepsell, H; Vallon, V. Increase in SGLT1-mediated transport explains renal glucose reabsorption during genetic and pharmacological SGLT2 inhibition in euglycemia. Am J Physiol Renal Physiol. 2014, 306(2), F188-93. [CrossRef]
- Al-Kharashi, AS. Role of oxidative stress, inflammation, hypoxia and angiogenesisin the development of diabetic retinopathy. Saudi J Ophthalmol. 2018, (32), 318–23. [Google Scholar] [CrossRef]
- Chen, Y-Y; Wu, T-T; Ho, C-Y; Yeh, T-C; Sun, G-C; Tseng, C-J; Cheng, P-W. Blocking of SGLT2 to eliminate NADPH-induced oxidative stress in lenses of animals with fructose-induced diabetes mellitus. Int J Mol Sci. 2022, 23, 7142. [CrossRef]
- Gong, Q; Zhang, R; Wei, F; Fang, J; Zhang, J; Sun, J; Sun, Q; Wang, H. SGLT2 inhibitor empagliflozin treatment ameliorates diabetic retinopathy manifestations and exerts protective effects associated with augmenting branched chain amino acids catabolism and transportation in db/db mice. Biomedicine & Pharmacotherapy. 2022, 152, 113222. [Google Scholar] [CrossRef]
- Schmidt, D; Argyropoulos, C; Singh N. Are the Protective Effects of SGLT2 Inhibitors a “Class-Effect” or Are There Differences between Agents? Kidney360. 2021, 2(5), 881–885. [CrossRef]
- Tahara, A; Takasu, T; Yokono, M; Imamura, M; Kurosaki, E. Characterization and comparison of sodium-glucose cotransporter 2 inhibitors in pharmacokinetics, pharmacodynamics, and pharmacologic effects. J Pharmacol Sci. 2016, 130(3), 159-169. [CrossRef]
- Tahara, A; Takasu, T; Yokono, M; Imamura, M; Kurosaki, E. Characterization and comparison of sodium-glucose cotransporter 2 inhibitors: Part 2. Antidiabetic effects in type 2 diabetic mice. J Pharmacol Sci. 2016, 131(3), 198-208. [CrossRef]
- Tahara, A; Takasu, T; Yokono, M; Imamura, M; Kurosaki, E. Characterization and comparison of SGLT2 inhibitors: Part 3. Effects on diabetic complications in type 2 diabetic mice. Eur J Pharmacol. 2017, 809, 163–171. [CrossRef] [PubMed]
- Kaur, P; Behera, B; Singh, S; Munshi, A. The pharmacological profile of SGLT2 inhibitors: Focus on mechanistic aspects and pharmacogenomics. Eur J Pharmacol. 2021, 904, 174169. [CrossRef]
- Zambrowicz, B; Ogbaa, I; Frazier, K; Banks, P; Turnage, A; Freiman, J; Boehm, K; Ruff, D; Powell, D; Sands, A. Effects of LX4211, a Dual Sodium-Dependent Glucose Cotransporters 1 and 2 Inhibitor, on Postprandial Glucose, Insulin, Glucagon-like Peptide 1, and Peptide Tyrosine Tyrosine in a Dose-Timing Study in Healthy Subjects. Clin Ther. 2013, 35(8), 1162-1173. [CrossRef]
- He, X; Gao, X; Xie, P; Liu, Y; Bai, W; Liu, Y; Shi A. Pharmacokinetics, Pharmacodynamics, Safety and Tolerability of Sotagliflozin After Multiple Ascending Doses in Chinese Healthy Subjects. Drug Des Devel Ther. 2022, 16, 2967–2980. [CrossRef] [PubMed]
- Kim, I; Cho, H; Lim, S; Seok, S; Lee, H. Comparison of the effects of empagliflozin and sotagliflozin on a zebrafish model of diabetic heart failure with reduced ejection fraction. Exp Mol Med, 2023, 55(6), 1174-1181. [CrossRef]
- Le, Y; Yang, J; Li, F; Jiang, Y; Wei, T; Wang, D; Wang, K; Cui, X; Lin, X; Yang, K; Hong, T; Wei, R. Dapagliflozin improves pancreatic islet function by attenuating microvascular endothelial dysfunction in type 2 diabetes. Diabetes Metab Res Rev. 2023, 39(3): e3607. [CrossRef]
- Pirklbauer, M; Sallaberger, S; Staudinger, P; Corazza, U; Leierer, J; Mayer, G; Schramek, H. Empagliflozin Inhibits IL - 1b – Mediated Inflammatory Response in Human Proximal Tubular Cells. Int J Mol Sci. 2021, 22(10): 5089. [CrossRef]
- Yang, F; Li, B; Yang, Y; Huang, M; Liu, X; Zhang, Y; Liu, H; Zhang, L; Pan, Y; Tian, S; Wu, Y; Wang, L; Yang, L. Leptin enhances glycolysis via OPA1-mediated mitochondrial fusion to promote mesenchymal stem cell survival. Int J Mol Med. 2019, 44(1): 301-312. [CrossRef]
- Lu, YT; Ma, XL; Xu, YH; Hu, J; Wang, F; Qin, WY; Xiong, WY. A Fluorescent Glucose Transport Assay for Screening SGLT2 Inhibitors in Endogenous SGLT2-Expressing HK-2 Cells. Nat Prod Bioprospect. 2019, 9(1): 13-21. [CrossRef]
- Rakoczy, E; Rahman, I; Binz, N; Li, C; Vagaja, N; Pinho, M; Lai, C. Characterization of a mouse model of hyperglycemia and retinal vascularization. Am J Pathol. 2010, 177(5), 2659–70. [CrossRef] [PubMed]
- Shen, W; Lai, C; Graham, C; Binz, N; Lai, Y; Eade, J; Guidolin, D; Ribatti, D; Dunlop, S; Rakoczy, E. Long-term global retinal microvascular changes in a transgenic vascular endothelial growth factor mouse model. Diabetologia. 2006, 49(7), 1690-701. [CrossRef]
- Lai, C; Dunlop, S; May, L; Gorbatov, M; Brankov, M; Shen, W; Binz, N; Lai, K; Graham, C; Barry, C; Constable, I; Beazley, L; Rakoczy, E. Generation of transgenic mice with mild and severe retinal neovascularization. Br J Ophthalmol. 2005, 89(7), 911–916. [CrossRef]
- Vagaja, N; Chinnery, H; Binz, N; Kezic, J; Rakoczy, E; McMenamin, P. Changes in murine hyalocytes are valuable early indicators of ocular disease. Invest Ophthalmol Vis Sci. 2012, 53(3), 1445–51. [CrossRef]
- Barber, A; Antonetti, D; Kern, T; Reiter, C; Soans, R; Krady, J; Levison, S; Gardner, T; Bronson, S. The Ins2Akita mouse as a model of early retinal complications in diabetes. Invest Ophthalmol Vis Sci. 2005, 46(6), 2210–8. [CrossRef]
- Fuhrich, D; Lessey, B; Savaris, R. Comparison of HSCORE assessment of endometrial beta3 integrin subunit expression with digital HSCORE using computerized image analysis (ImageJ). Anal Quant Cytopathol Histpathol 2013, 35(4): 210-6.
- Pitt, B; Steg, G; Leiter, L; Bhatt, D. The Role of Combined SGLT1/SGLT2 Inhibition in Reducing the Incidence of Stroke and Myocardial Infarction in Patients with Type 2 Diabetes Mellitus. Cardiovasc Drugs Ther. 2022, 36(3), 561-567. [CrossRef]
- Teo, Y; Ting, A; Teo, Y; Chong, E; Tan, J; Syn, N; Chia, A; Ong, H; Cheong, A; Li, T; Poh, K; Yeo, T; Chan, M; Raymond, W; Chai, P; Sia, C. Effects of Sodium/Glucose Cotransporter 2 (SGLT2) Inhibitors and Combined SGLT1/2 Inhibitors on Cardiovascular, Metabolic, Renal and Safety Outcomes in Patients with Diabetes: A Network Meta-Analysis of 111 Randomized Controlled Trials. Am J Cardiovasc Drugs. 2022, 22(3), 299-323. [CrossRef]
- Thackeray, J; Beanlands, R; DaSilva J. Altered sympathetic nervous system signaling in the diabetic heart: emerging targets for molecular imaging. Am J Nucl Mol Imaging. 2012, 2(3), 314-334.
- Zhang, J; Sharma, D; Dinabandhu, A; Sanchez, J; Applewhite, B; Jee, K; Deshpande, M; Flores-Bellver, M; Hu, M-W; Guo, C; Salman, S; Hwang, Y; Anders, NM; Rudek, MA; Qian, J; Canto-Soler, MV; Semenza, GL; Montaner, S; Sodhi, A. Targeting hypoxia-inducible factors with 32-134D safely and effectively treats diabetic eye disease mice. J Clin Invest. 2023, 133(13), e163290. [CrossRef]
- Mittal, M; Siddiqui, M; Tran, K; Reddy, S; Malik, A. Reactive oxygen species in inflammation and tissue injury. Antioxid Redox Signal. 2013, 20(7): 1126-67. [CrossRef]
Figure 1.
Sole SGLT2i (Empagliflozin; EMPA) and dual SGLT1/2i (Sotagliflozin; SOTAG) promote reduced glucose uptake in HK2 cells. HK2 cells were treated with EMPA, SOTAG, or vehicle (VEH) for 48 hrs in HG-DMEM prior to treatment with fluorescently labelled 2-NBDG in Na+ buffer for 2 hrs. Representative fluorescent images of HK2 cells treated with (A) VEH/DMSO, (B) EMPA or (C) SOTAG. (D) Quantitation of VEH, EMPA and SOTAG mediated glucose uptake. Mean + SEM; Statistical significance was determined with a one-way ANOVA. n = 4/group. (VEH vs EMPA; *p = 0.032), (VEH vs SOTAG; **p<0.001), (EMPA vs SOTAG; ***p = 0.032). Scale bar, 100 µm. Intensity: 0 = absent, whilst 3 = high intensity. Results are representative of at least two independent experiments.
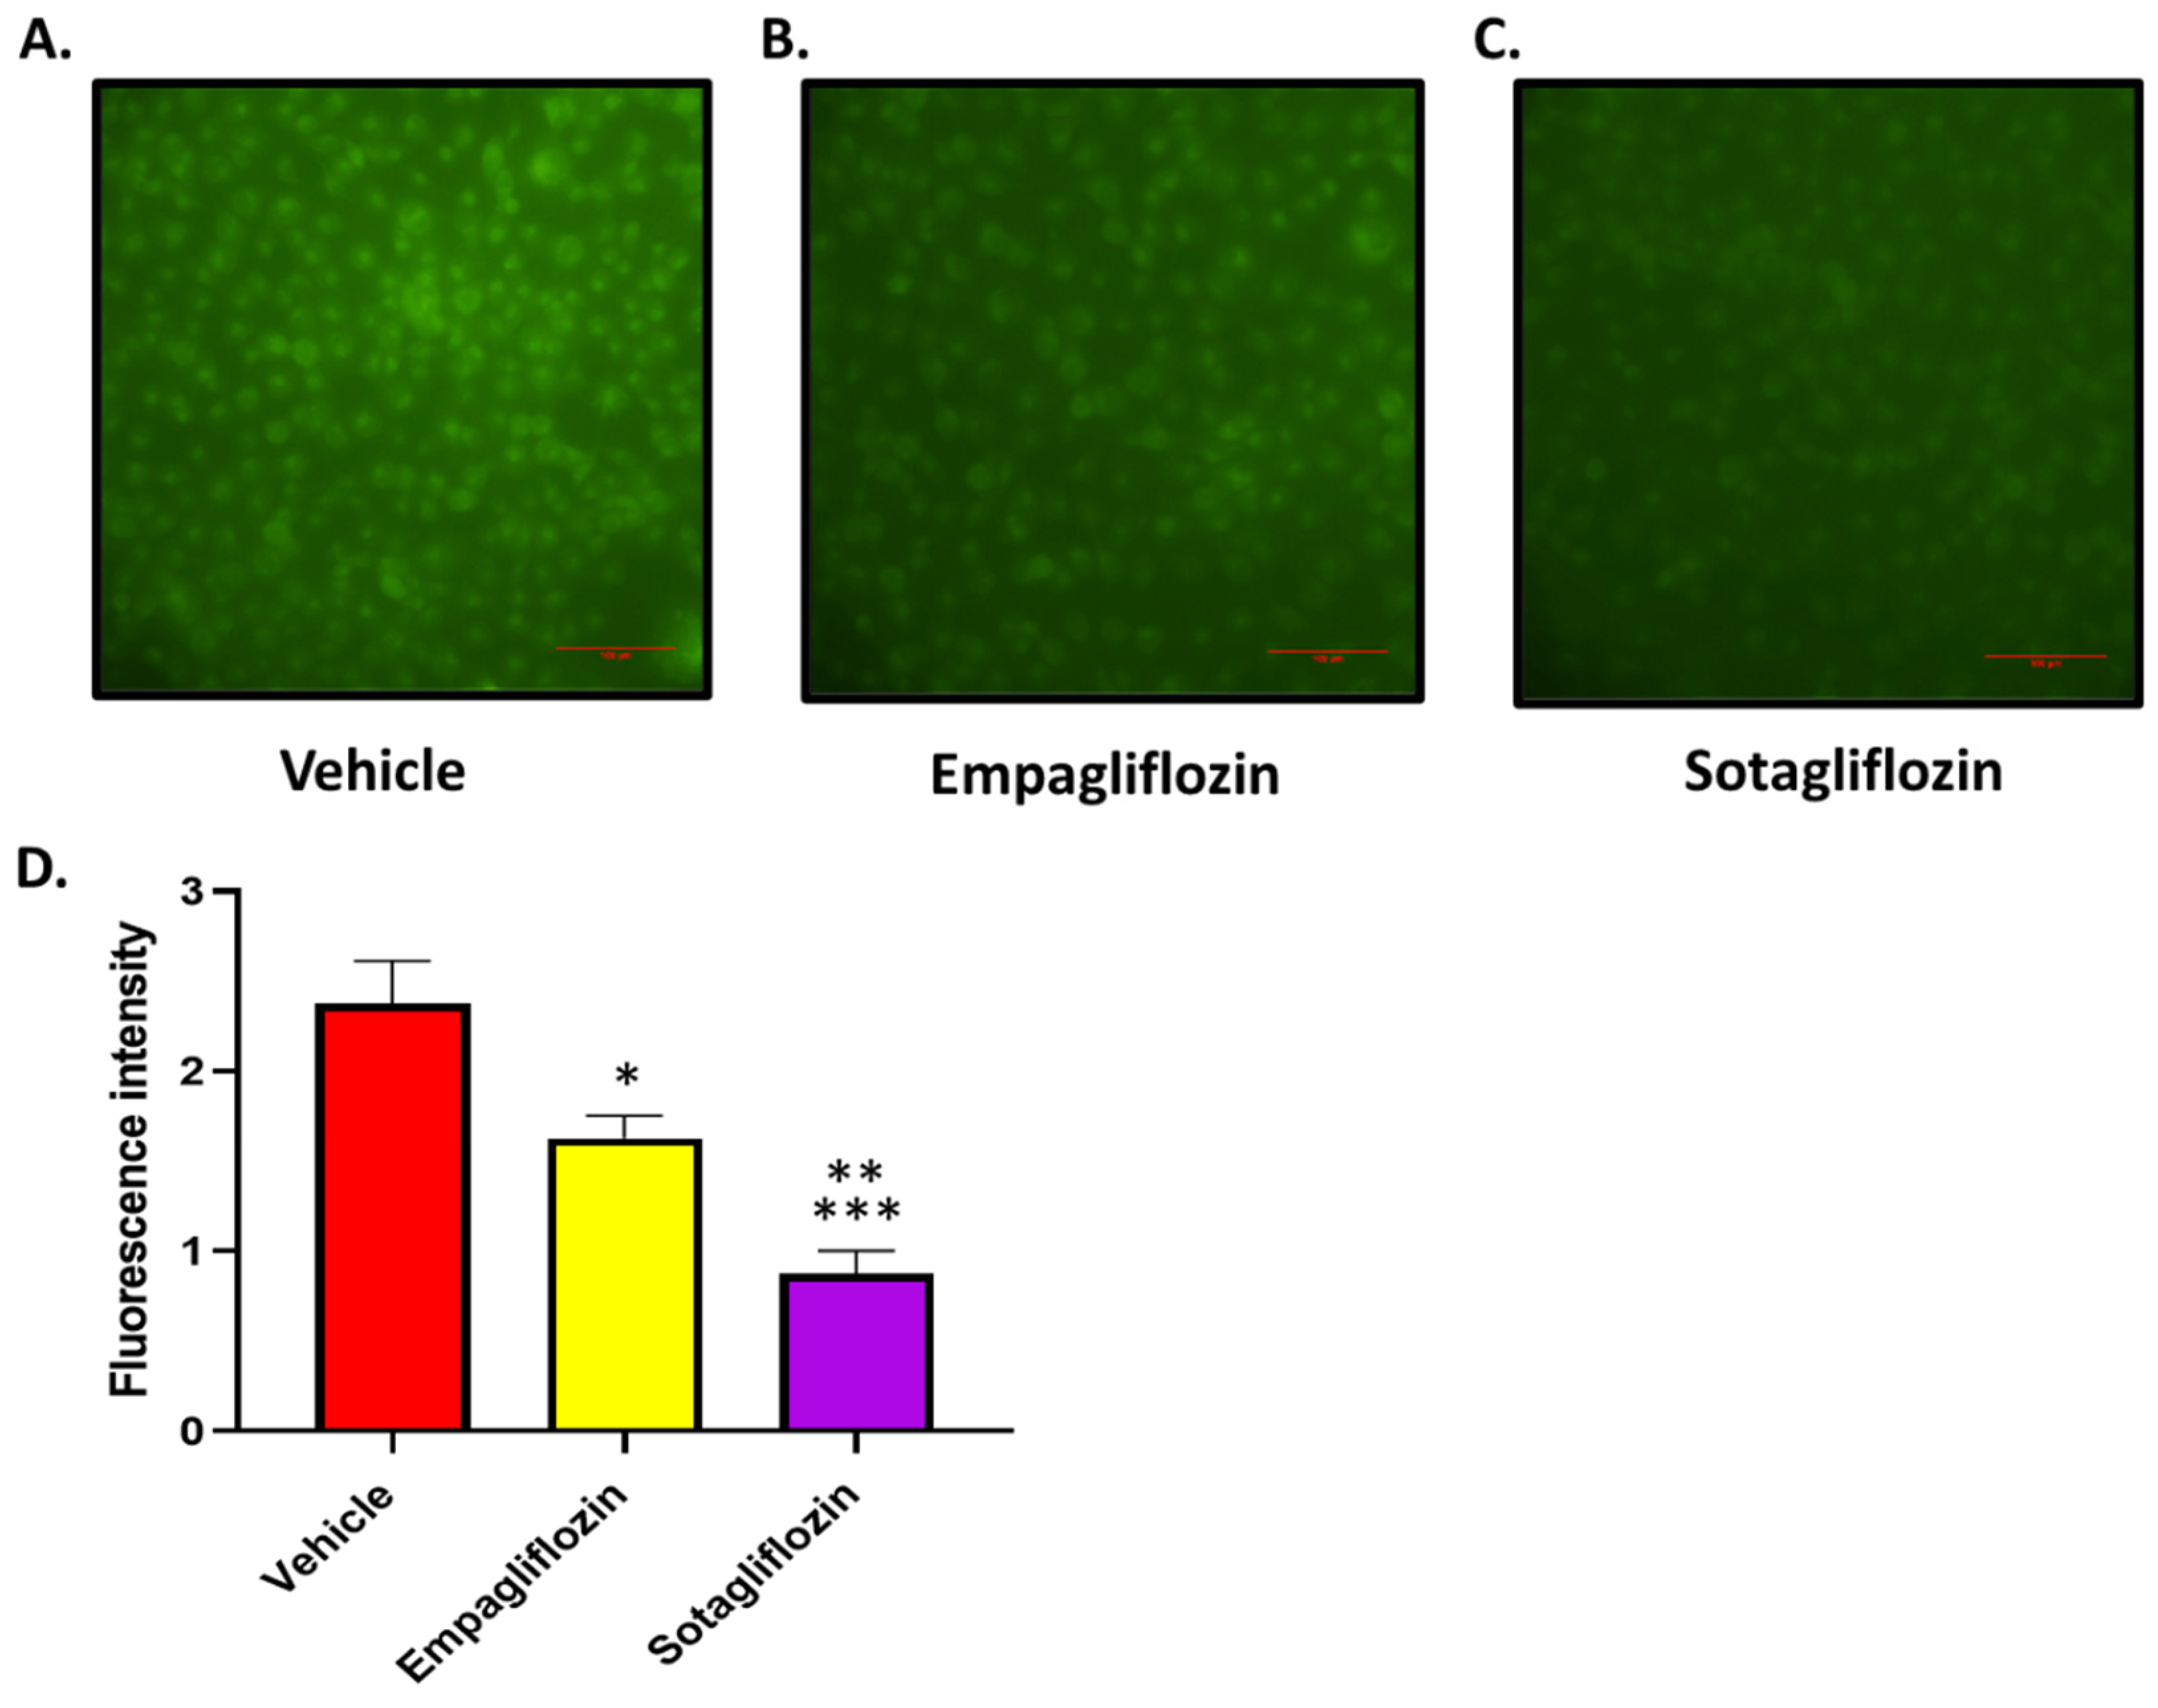
Figure 2.
Norepinephrine (NE) induced glucose uptake within HK2 cells, visualised by fluorescence microscopy. HK2 cells were treated with NE (10 µM) or vehicle for 48 hrs in high glucose DMEM before treatment with fluorescently labelled 2-NBDG in Na+ buffer for 2 hrs. (A) Representative bright field and fluorescent microscopy images of HK2 cells treated with NE or VEH. (B) Quantitation of NE-mediated glucose uptake. Statistical significance was determined with a student t-test. n = 3/group; mean ± SEM (VEH vs NE; *p = 0.025). Scale bar, 100 µm. Intensity: 0 = absent whilst 3 = high intensity. Results are representative of at least two independent experiments.
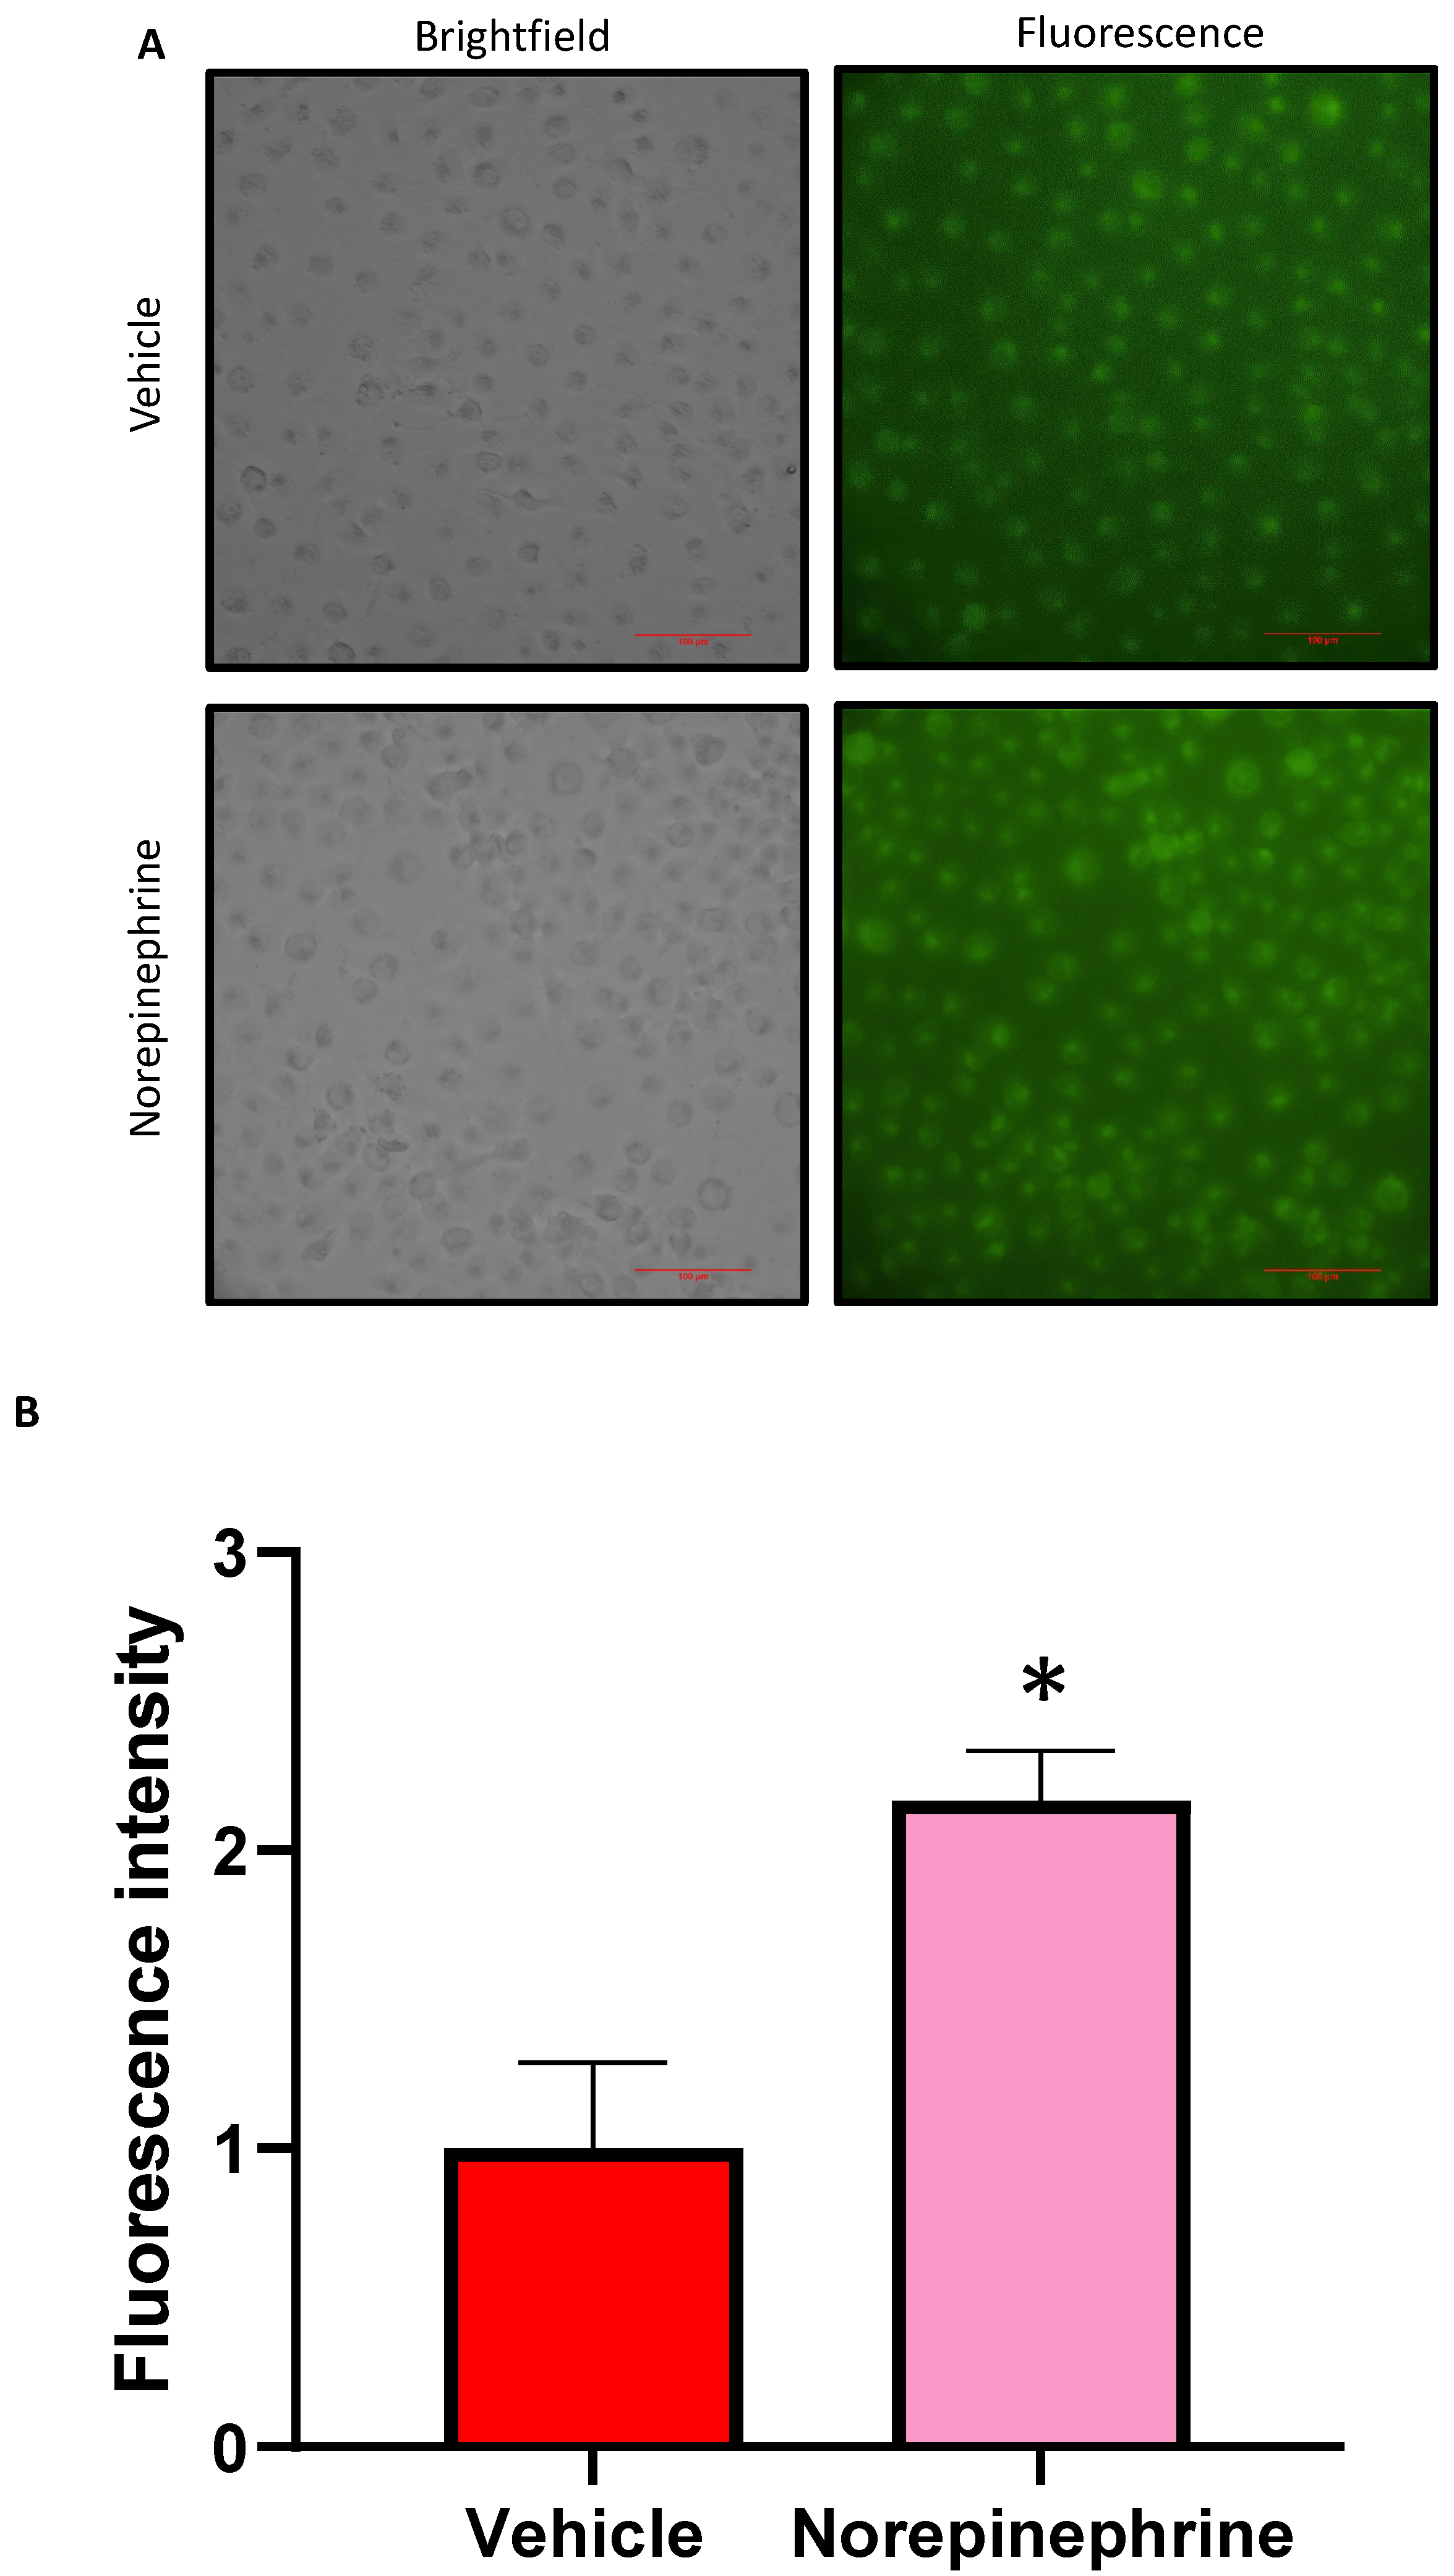
Figure 3.
Quantitation of SGLT2 inhibitor mediated regulation of SGLT1 expression in HK2 cells. An anti-SGLT1 ELISA was performed on HK2 lysates which were from cells treated with three SGLT2i’s (Canagliflozin, CANA; Dapagliflozin, DAPA and Empagliflozin, EMPA) to determine SGLT1 expression changes observed with SGLT2 inhibition. Both DAPA and EMPA resulted in a significant increase in the upregulation of SGLT1 protein expression compared to vehicle (VEH) treated HK2 cells. Statistical significance was determined with a one-way ANOVA. n= 3/group (VEH vs DAPA; *p = 0.001), (VEH vs EMPA; **p<0.001). Results are representative of at least two independent experiments.
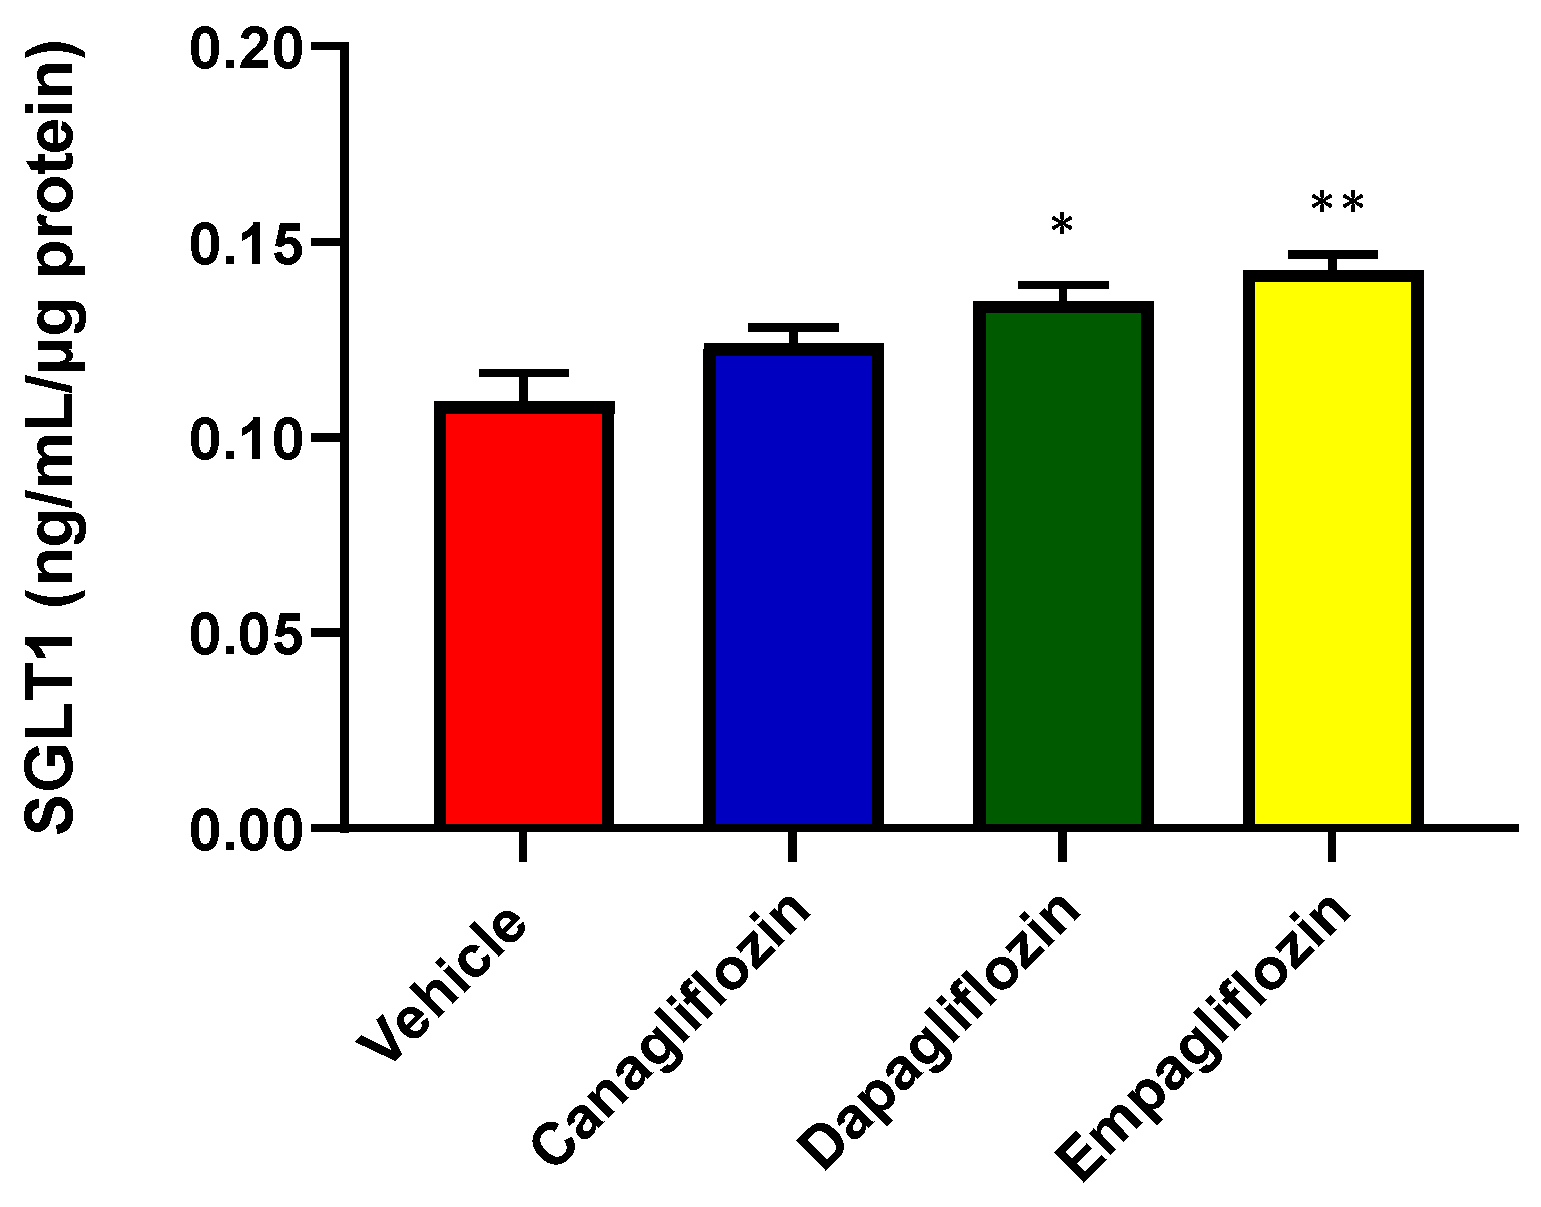
Figure 4.
Immunocytochemical detection of SGLT1 expression in HK2 cells treated with Vehicle (VEH) or Empagliflozin (EMPA). Each image depicts an individual well of cells treated with either VEH (A) or EMPA (B) for 48 hrs. Statistical significance was determined with a student t-test; n=5/group. (C) Quantitation of EMPA mediated SGLT1 expression; (VEH vs EMPA; *p = 0.075). Scale bar, 100 µm. Results are representative of at least two independent experiments.
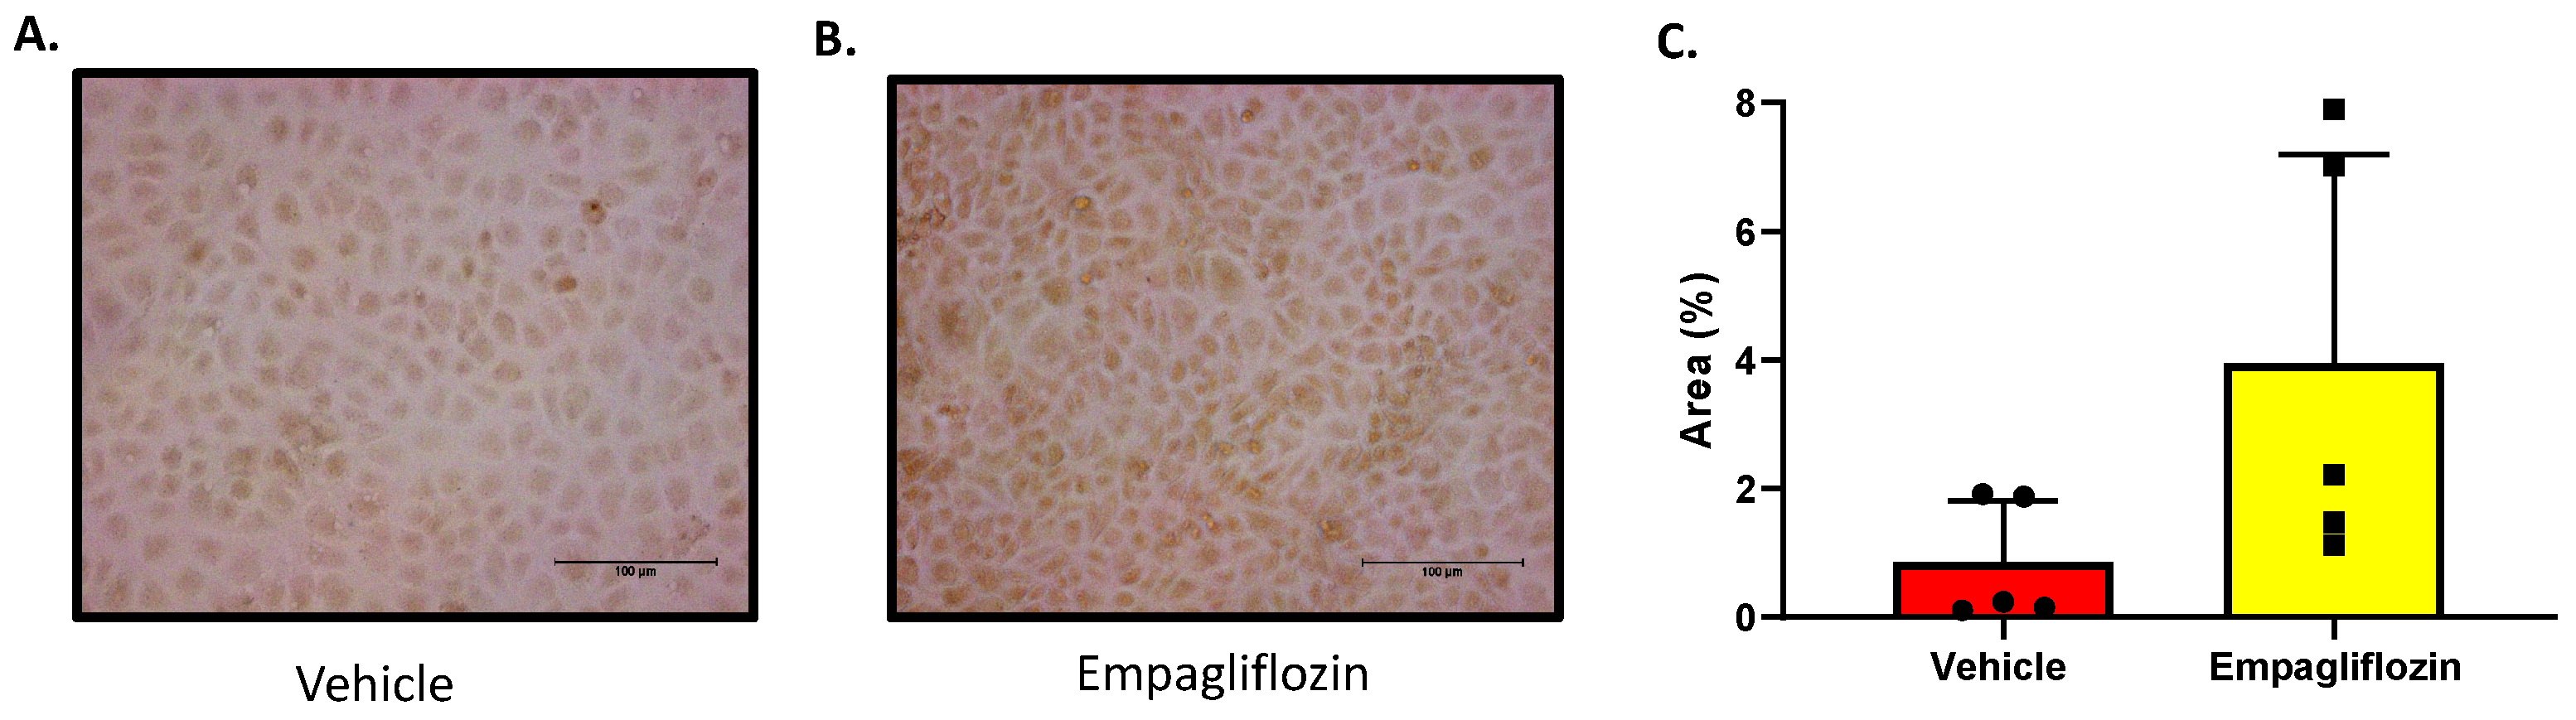
Figure 5.
Sotagliflozin (SOTAG) mediated regulation of SGLT1 expression in HK2 cells. SOTAG treatment of HK2 cells resulted in a mild non-significant elevation in SGLT1 protein expression compared to vehicle (VEH) treated HK2 cells. n= 6/group. Results are representative of at least two independent experiments.
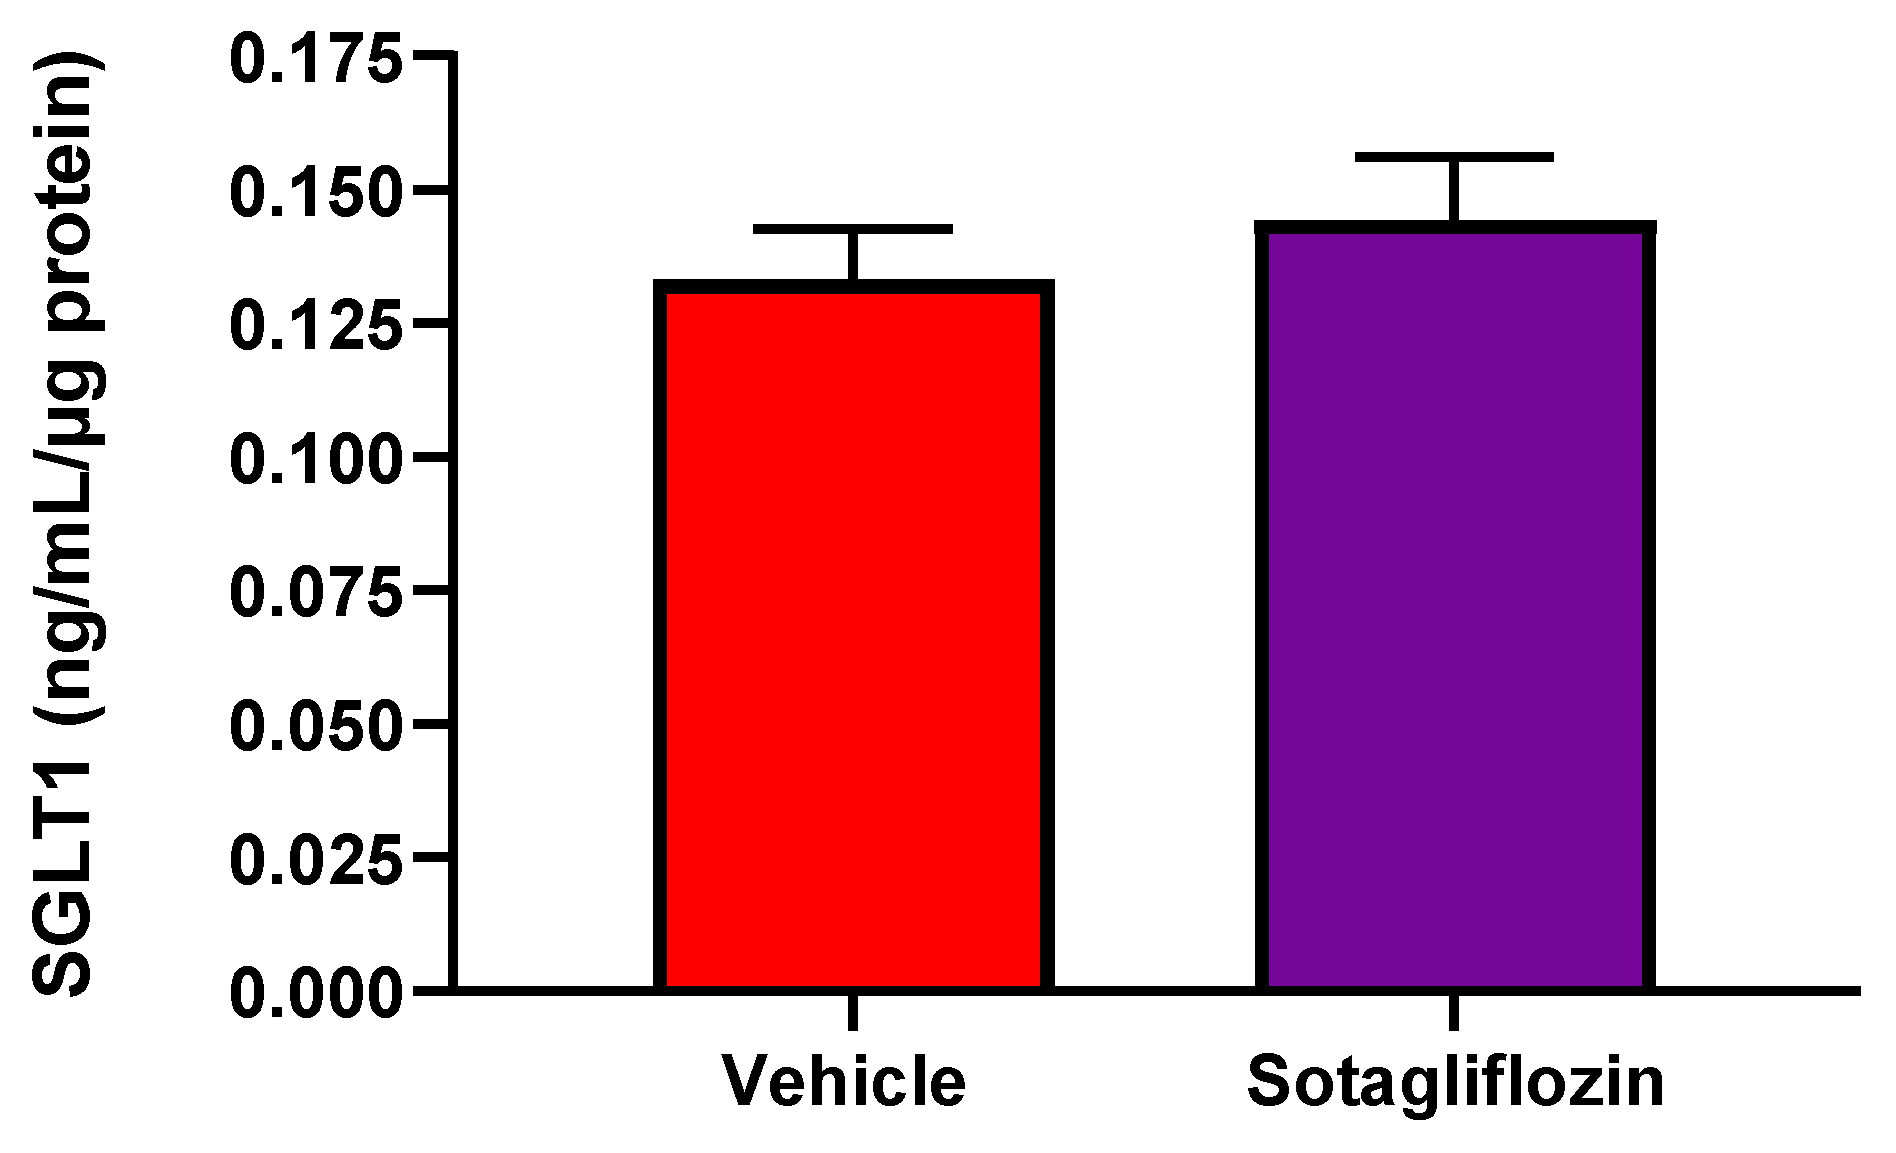
Figure 6.
EMPA and SOTAG promotes glucosuria in non-diabetic Kimba mice. Blue equals 0 mmol/L glucose whilst dark brown indicates a urinary glucose concentration of >111 mmol/L.
Figure 6.
EMPA and SOTAG promotes glucosuria in non-diabetic Kimba mice. Blue equals 0 mmol/L glucose whilst dark brown indicates a urinary glucose concentration of >111 mmol/L.
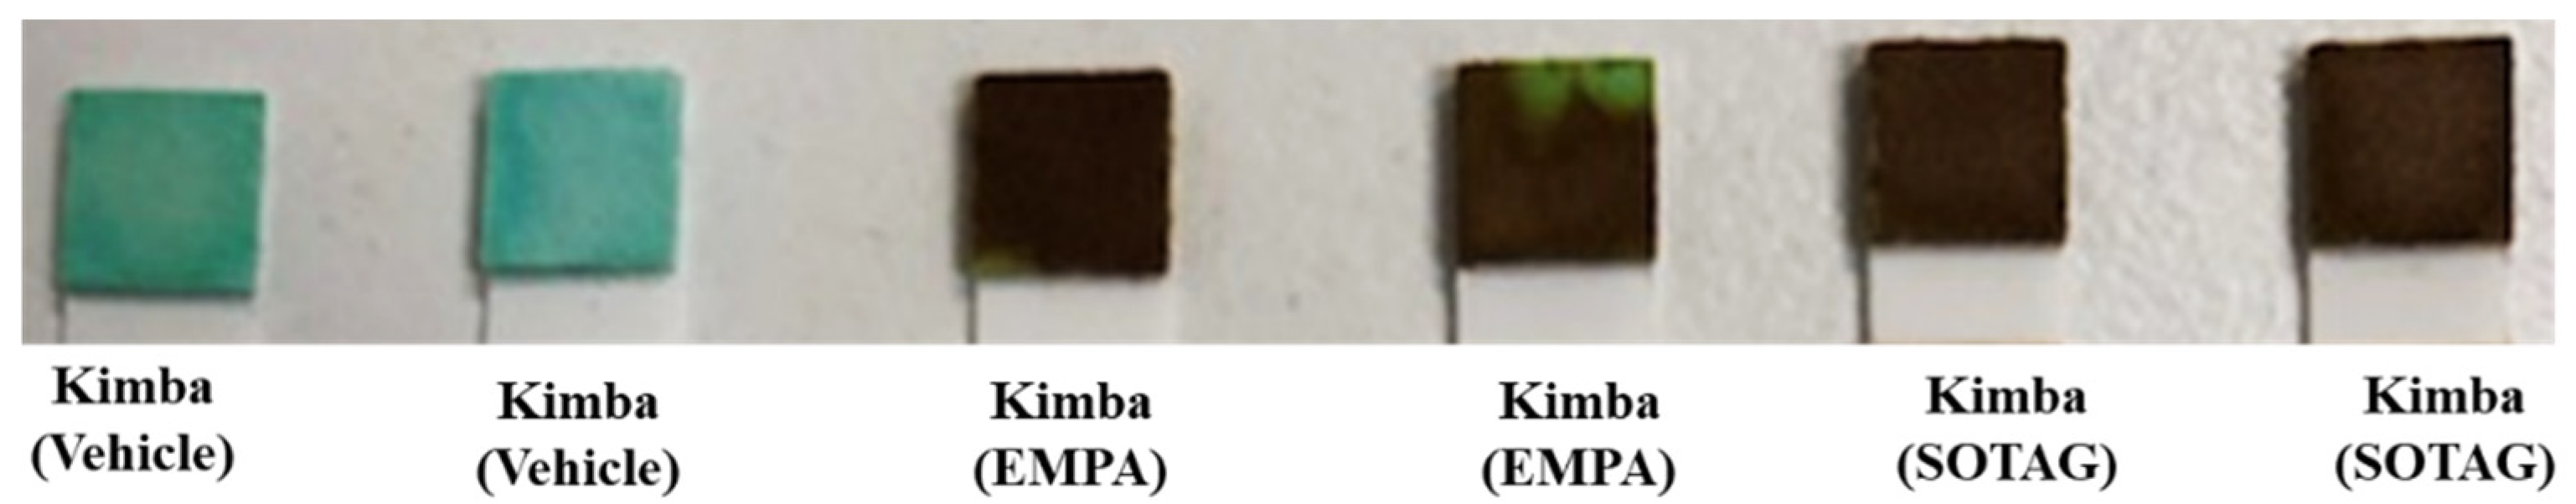
Figure 7.
Effect of EMPA and SOTAG on blood glucose levels of non-diabetic Kimba and diabetic Akimba mice. Quantitation of fasting blood glucose levels after 8 weeks of treatment with either 25mg/kg/day of Vehicle, EMPA or SOTAG via drinking water. Statistical significance was determined with a one-way ANOVA; Akimba Vehicle vs EMPA (*p<0.001); Akimba Vehicle vs SOTAG (**p<0.001); data represented as mean + SEM of 4-6 mice per group.
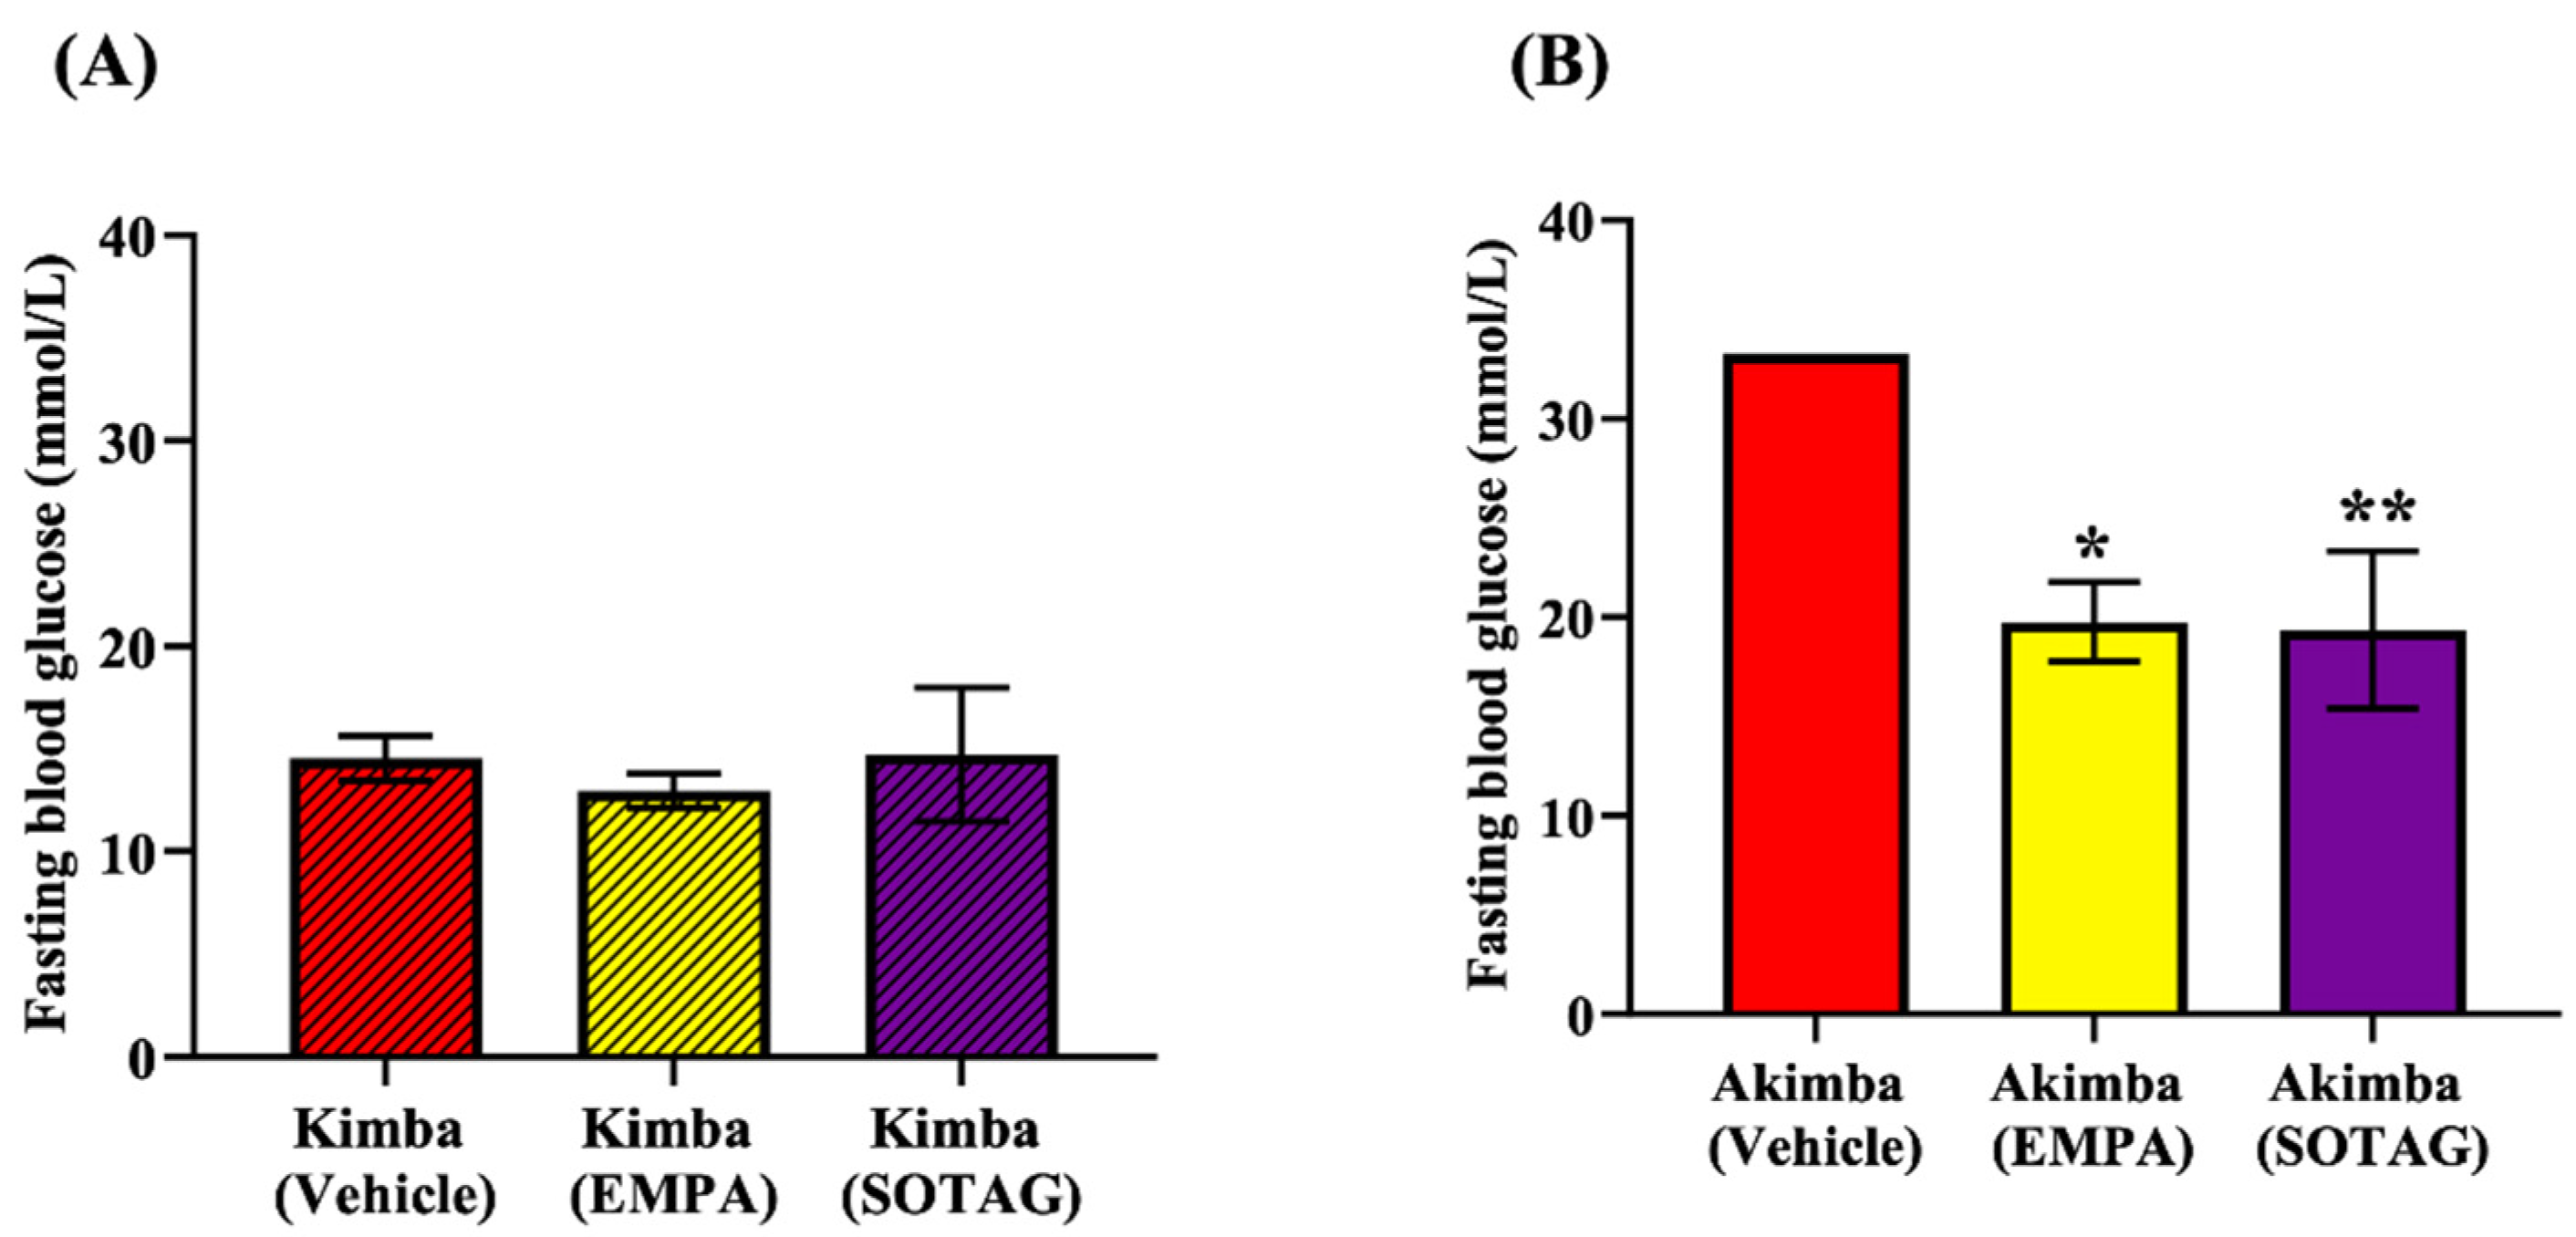
Figure 8.
Administration of EMPA and SOTAG on glucose tolerance in non-diabetic Kimba and diabetic Akimba mice. Statistical sigificance was determined with a one-way ANOVA; Kimba (Vehicle vs EMPA and SOTAG, 2-3 mice per group); Akimba (Vehicle vs EMPA and SOTAG, *p< 0.05, 5-6 mice per group).
Figure 8.
Administration of EMPA and SOTAG on glucose tolerance in non-diabetic Kimba and diabetic Akimba mice. Statistical sigificance was determined with a one-way ANOVA; Kimba (Vehicle vs EMPA and SOTAG, 2-3 mice per group); Akimba (Vehicle vs EMPA and SOTAG, *p< 0.05, 5-6 mice per group).
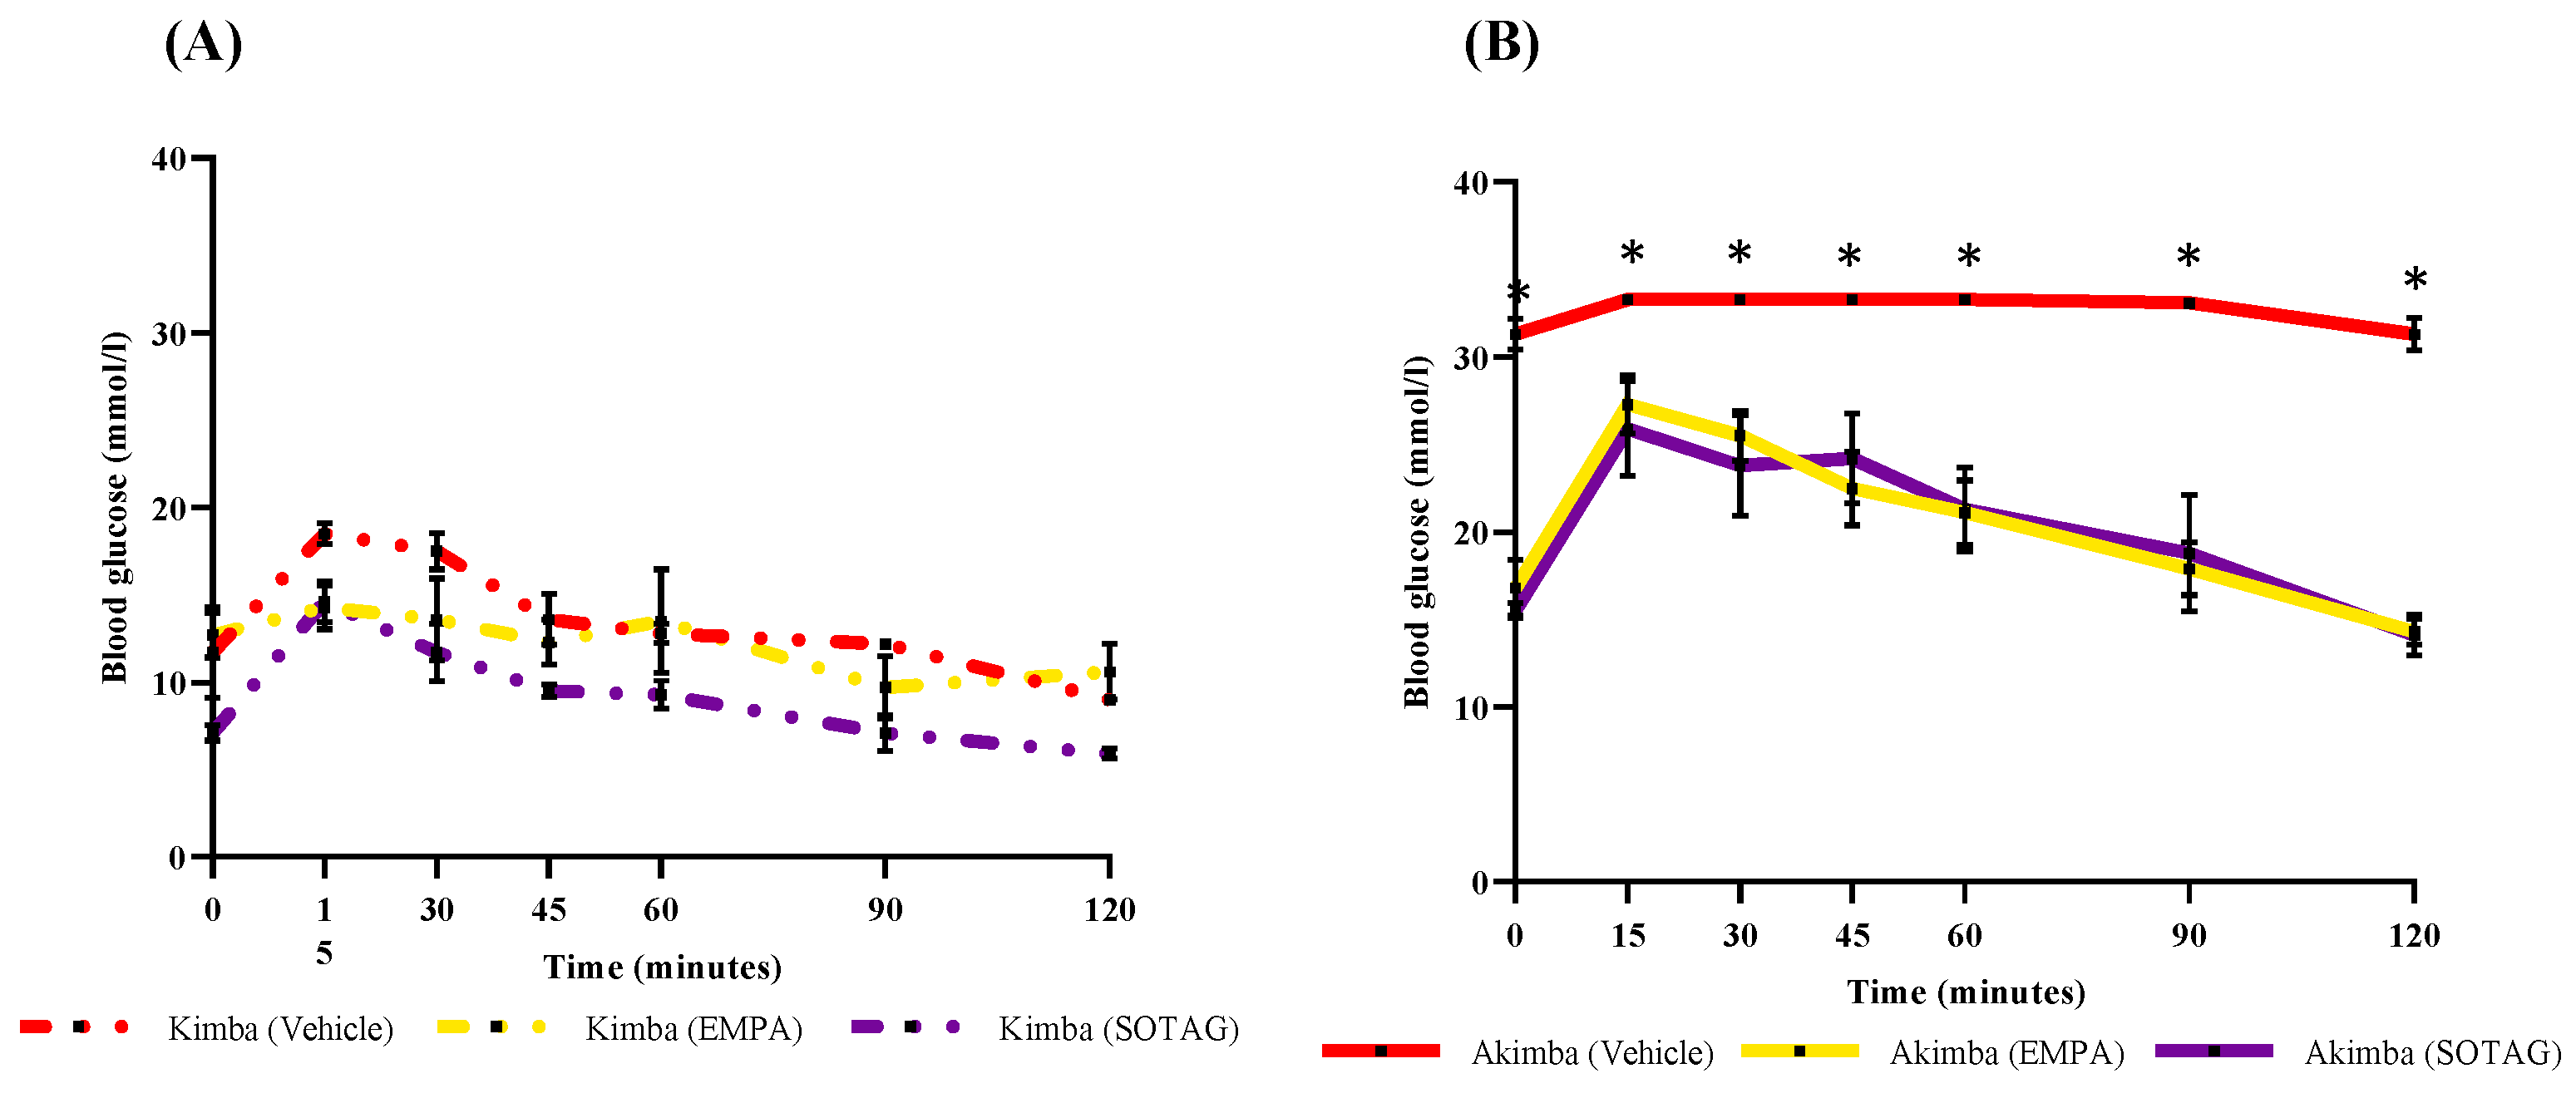
Figure 9.
Effect of EMPA and SOTAG on water intake in diabetic Akimba mice. Statistical sigificance was determined with a student t-test. Differences (Δ) in water intake from Week 0 to Week 8 are presented (*p<0.0001 **p=0.0004 ***p=0.017. n=6 (Akimba Vehicle), n=5 (Akimba EMPA and SOTAG).
Figure 9.
Effect of EMPA and SOTAG on water intake in diabetic Akimba mice. Statistical sigificance was determined with a student t-test. Differences (Δ) in water intake from Week 0 to Week 8 are presented (*p<0.0001 **p=0.0004 ***p=0.017. n=6 (Akimba Vehicle), n=5 (Akimba EMPA and SOTAG).
Disclaimer/Publisher’s Note: The statements, opinions and data contained in all publications are solely those of the individual author(s) and contributor(s) and not of MDPI and/or the editor(s). MDPI and/or the editor(s) disclaim responsibility for any injury to people or property resulting from any ideas, methods, instructions or products referred to in the content. |
© 2024 by the authors. Licensee MDPI, Basel, Switzerland. This article is an open access article distributed under the terms and conditions of the Creative Commons Attribution (CC BY) license (http://creativecommons.org/licenses/by/4.0/).
Copyright: This open access article is published under a Creative Commons CC BY 4.0 license, which permit the free download, distribution, and reuse, provided that the author and preprint are cited in any reuse.


