
Submitted:
05 February 2024
Posted:
06 February 2024
You are already at the latest version
Abstract
(1) Background/Objectives: Accurate determination of chronological age is crucial in legal dental identification. This study aimed to compare the effectiveness of different formulas in estimating the age of a Brazilian subpopulation by analyzing the pulp/tooth ratio of the maxillary canine and mandibular second premolar in panoramic and periapical radiographs. (2) Methods: The sample consisted of panoramic and periapical radiographs of 247 individuals. The file of each radiograph was opened in the Adobe Photoshop CS4® program to outline and obtain values in pixels for calculating the pulp/tooth ratio. Statistical analysis was conducted using the SPSS program, with a significance level set at 5%. (3) Results: The interclass correlation coefficient demonstrated excellent intra-observer agreement (0.990 – 0.999). The determination coefficients (R2) suggested that only 30-35% of the actual age results could be explained by the pulp/tooth ratio. Smallest differences were observed with Cameriere's formula for the mandibular second premolar on panoramic radiographs (+4.1 years). The greatest differences were found with the formulas for the mandibular second premolar in panoramic radiographs of the Korean (+12.5 years) and Portuguese (-12.1 years) populations. (4) Conclusions: The equations employed allowed for estimating the age of a Brazilian subpopulation and showed little agreement between the actual age and the estimated age.
Keywords:
human identification
; age estimation by teeth
; forensic dental radiography
; forensic science
; forensic dentistry
1. Introduction
The identification of individuals through dental arch remains is commonly employed in disaster victim cases and forensic scenarios to ascertain dates of birth and death [1,2]. Accurate determination of chronological age is crucial in legal dental identification, cases requiring proof of a subject being underage, matters related to alimony, retirement claims [3], criminal majority, and public policies for individuals with no personal documentation [4,5,6,7,8].
Global migration and the settlement of refugees worldwide have increased the need for physicians and forensic dentists to determine the chronological age of individuals using biological age estimation techniques [9,10]. Radiographic examinations, being readily available, non-invasive, and reproducible, are extensively used for this purpose [1,4,6,10,11,12,13,14,15,16,17,18].
Age estimation in the adult population represents a real challenge, given that the changes in teeth and supporting structures are more subtle compared to the stages of tooth formation and eruption [7,19]. Forensic literature generally accepts a margin of error between 6-8 years [20], preferably less than 10 years [7]. Current recommended methods involve evaluating the continuous process of dental mineralization that occurs with advancing age [17,21] through the calculation of the pulp/tooth ratio on radiographs [5,19,22,23,24,25,26,27] or linear measurements of pulp/root length; length of pulp/tooth; tooth length/root; pulp/root width in three levels [7,28,29,30].
Given Brazil’s mixed population [13], the relationships and variations in the pulp/tooth ratio may differ significantly when compared to more ethnically uniform populations [10,18,30,31,32,33]. The present study aimed to compare the effectiveness of different equations in estimating the age of an adult Brazilian subpopulation by calculating the pulp/tooth ratio of the maxillary canine and mandibular second premolar in panoramic and periapical radiographs, and to develop equations for estimating age based on values obtained from this sample.
2. Materials and Methods
This study included 247 individuals of both genders, ranging in age from 20 to 82 years (Table 1). Panoramic and periapical radiographs from the database of a dental imaging diagnostic center in Goiânia-GO, Brazil, were utilized for assessment. This study underwent thorough review and received approval from the Research Ethics Committee of the Evangelical University of Goiás, Brazil (CAAE 53107721.0.0000.5076).
Inclusion criteria comprised the presence of at least one healthy maxillary canine and one mandibular second premolar on both the right and left sides, without endodontic treatment, crowns, and prosthetic posts. Additionally, participants had to exhibit an absence of calcification in the root canal, external or internal root resorption, fully formed apex, no history of orthodontic treatment, and no developmental disorders and pathological processes. Images with blurriness, distortions, low density, and poor contrast were excluded from the study.
The points were marked, and the dental structures delineated using the polygonal lasso tool of the Adobe Photoshop CS4® program (Adobe Systems Inc., San Jose, CA, USA). A high-resolution Samsung® monitor, model S24E310 (Samsung, Manaus, AM, Brazil), was used for image visualization. All images were outlined using a pen and Huon® Inspiroy 420 graphics tablet (Shenzhen Huion Animation Technology Co. Ltd., Shenzhen, Guangdong, China). The teeth were classified according to the FDI World Dental Federation notation [32]. Initially, teeth 13 and 45 were evaluated. In the absence of either of these, teeth 23 and 35 were evaluated. Measurements were taken on the maxillary canine and mandibular second premolar on panoramic radiographs, followed by measurements on periapical radiographs. At least 20 points outlining the contour of the tooth and at least 10 points delineating the contour of the pulp were marked (Figure 1 and Figure 2). This process determined the total area in pixels of the tooth and pulp [2,5,11-13].
All data were recorded in a Microsoft Excel® spreadsheet (Microsoft Corporation, One Microsoft Way, Redmond, WA, USA) and later exported to the IBM® SPSS program version 20.0 (IBM Corporation, New Orchard Road, Armonk, NY, USA).
Age estimates were conducted by applying the pulp/tooth ratio values obtained from maxillary canines and mandibular second premolars on panoramic and periapical radiographs, utilizing specific formulas [2,5,11-13] (Table 2).
Linear regression was used to assess the correlation between the pulp/tooth ratio values in pixels of the maxillary canines and mandibular second premolars and the age of the participants in the sample. Additionally, specific equations were constructed for the Brazilian adult subpopulation based on these findings.
All measurements were conducted by a single observer, a dental radiology specialist with 30 years of professional experience, who underwent prior calibration. To assess intra-observer reproducibility, a random sample of 50 radiographs (25 panoramic and 25 periapical) was measured after a 30-day interval.
The normality of quantitative variables was evaluated using the Kolmogorov-Smirnov test. The intraclass correlation coefficient (ICC) was used to assess intra-observer agreement. The values were interpreted using the Domeinc Cicchetti classification: values < 0.4 = Poor agreement, 0.4 to 0.6 = Fair agreement, 0.6 to 0.75 = Good agreement, and 0.75 to 1.0 = Excellent agreement [34]. Categorical variables were described by frequencies. Quantitative variables with normal distribution were presented as mean and standard deviation, while those with asymmetrical distribution were described using median and interquartile range (25th and 75th percentiles). Quantitative variables with normal distribution were compared using Student's t-test for paired samples and asymmetric variables using the Wilcoxon test. The Bland and Altman technique was used to assess the agreement between the ages calculated by the different formulas and the actual age. A significance level of 5% was considered for all analyses.
3. Results
The ICC data are presented as the median values of the measurements conducted at different times. All measurements exhibit ICC values exceeding 0.99% (Table 3).
Table 4 presents a comparison of the estimated age of the Brazilian adult subpopulation by calculating the pulp/tooth ratio of the maxillary canine using the equations developed by Cameriere et al. [5], Cameriere et al. [2], Azevedo et al. [11], Lee et al. [12] and Anastácio et al. [13]. Table 5, on the other hand, focuses on equations applied to mandibular premolars.
The results of the t-test indicated a low statistical correlation. Additionally, the Bland and Altman test with a 95% confidence interval revealed that the values, both positive and negative, were highly dispersed and distant from the mean, indicating minimal agreement between the data. The smallest differences were observed with Cameriere's formula [2] for the mandibular second premolar on panoramic radiographs (+4.1 years) (Table 5). The greatest differences were found with the formulas for the mandibular second premolar in panoramic radiographs of the Korean [12] (+12.5 years) and Portuguese [13] (-12.1 years) populations.
The average values of the pulp/tooth ratio for the maxillary canines in the panoramic and periapical radiographs were 0.1025 and 0.1064, respectively (Table 6). For the mandibular premolars, the average values were 0.0992 in panoramic radiographs and 0.0937 in periapical radiographs (Table 6).
The representations of the variables in this study, represented by the pulp/tooth ratio and the actual age, are illustrated in the form of boxplot charts for the maxillary canines and mandibular second premolars in both panoramic and periapical radiographs Figure 3). Additionally, the data were organized in dispersion diagrams which show the relationship between age and the pulp/tooth ratio, with separate analysis for each gender (Figure 4).
The boxplot charts of the pulp/tooth ratio of the maxillary canines on panoramic radiographs (Figure 3a) illustrate medians with positive and negative asymmetrical distributions, particularly accentuated between 60 and 69 years of age. The data exhibit substantial dispersion, resulting in a wide range across all age groups. High interquartile ranges indicate similar pulp/tooth ratio values in over 50% of the cases among the 30-39, 40-49, and 50-59 age groups. The dispersion diagram of the pulp/tooth ratio of the maxillary canines on panoramic radiographs (Figure 4a) did not reveal any discernible linear or non-linear relationship between age and the pulp/tooth ratio, with the same occurring when the genders are evaluated.
The boxplot charts of the pulp/tooth ratio of the maxillary canines on periapical radiographs (Figure 3c) illustrate medians with positive and negative asymmetrical distributions, particularly noticeable between the ages of 20-29, 50-59, and 70 years or older. The data exhibit considerable dispersion, resulting in a range across all age groups. High interquartile ranges indicate similar pulp/tooth ratio values in over 50% of the cases among the 30-39, 40-49, 50-59, and 70 years or older age groups, as well as between 60-69 and 70 years or older age groups. The dispersion diagram of the pulp/tooth ratio of the maxillary canines on periapical radiographs (Figure 4b) did not demonstrate any discernable linear or non-linear relationship between age and the pulp/tooth ratio, with the same occurring when the genders are evaluated.
The boxplot charts of the pulp/tooth ratio of the pulp/tooth ratio of the mandibular second premolars on the panoramic radiographs (Figure 3b) illustrate medians with positive and negative asymmetrical distributions, particularly noticeable between the ages of 30-39 and 60-69 years. The data exhibit significant dispersion, resulting in a wide range across all age groups. High interquartile ranges indicate similar pulp/tooth ratio values in over 50% of the cases among the 30-3, 40-49, 50-59, and between 60-69 and 70 years or older age groups. The dispersion diagram of the pulp/tooth ratio of the mandibular premolars on panoramic radiographs (Figure 4c) did not demonstrate any discernable linear or non-linear relationship between age and the pulp/tooth ratio, the same occurring when genders are evaluated.
The boxplot charts of the pulp/tooth ratio of the mandibular second premolars on the periapical radiographs (Figure 3d) illustrate medians with positive and negative asymmetrical distributions, particularly noticeable between the ages of 40-49, 60-69, and 70 years or older. The data exhibit significant dispersion, resulting in a wide range across all age groups. High interquartile ranges indicate similar pulp/tooth ratio values in over 50% of the cases among the 30-39, 40-49, 50-59, and between 60-69 and 70 years or older age groups. The dispersion diagram of the pulp/tooth ratio of the mandibular second premolars on periapical radiographs (Figure 4d) did not demonstrate any discernable linear or non-linear relationship between age and the pulp/tooth ratio, the same occurring when the genders are evaluated.
Table 7 presents the equations derived from linear regression analysis between the pixel values of the pulp/tooth ratio of the maxillary canines and mandibular second premolars and the ages of the sampled individuals in the Brazilian subpopulation. These linear regressions yielded four specific formulas applicable to maxillary canines and mandibular second premolars in both panoramic and periapical radiographs. The determination coefficients (R2) revealed that only 30 to 35% of the actual age could be explained by the pulp/tooth ratio. The average age of the sampled Brazilian subpopulation was 36.3 years, with an SD of ± 12.7 years, indicating a dispersion primarily between 23.6, and 49 years.
4. Discussion
The present study aimed to compare the effectiveness of different formulas in estimating the age of a Brazilian subpopulation by calculating pulp/tooth ratio values in maxillary canines and mandibular second premolars using panoramic and periapical radiographs. The results revealed minimal agreement between the actual and estimated ages using the equations developed by Cameriere et al. [5], Cameriere et al. [2], Azevedo et al. [11], Lee et al. [12] and Anastácio et al. [13].
Among the conventional radiographic methods for estimating age in adults, those proposed by Cameriere [1,2] and Kvaal [3] are the most widely studied and utilized [4]. The Cameriere method was chosen for this experiment due to its ease of reproducibility and the proportional nature of the obtained values [2,5], as opposed to the metric approach of Kvaal's method [3,6,7]. Additionally, Cameriere’s method is less prone to geometric errors commonly found in radiographic images [8-9].
Previous studies employing the pulp/tooth ratio strategy typically selected single-rooted teeth, as they undergo fewer morphological changes over time. Among the dental groups investigated, maxillary canines and mandibular premolars were the most used [2,5,7,10-15]. It is noteworthy that Cameriere’s methodology [5] recommends using a minimum of 20 points for outlining the tooth and 10 points for outlining the pulp. For the execution of this study, a pen and digitizing table were chosen to ensure ease, precision, and standardization of markings [16]. The consistently high ICC values exceeding 0.99% across all measurements underscore the reproducibility and standardization achieved in this study.
In this study, the formulas utilizing the pulp/tooth ratio of canines showed the smallest difference between actual and estimated age when using the equation proposed by Cameriere et al [5] with periapical radiographs (+7 years). Although originally developed for application in periapical radiographs, its application in panoramic radiographs resulted in a difference of +9.1 years. Interestingly, this value closely aligned with the difference obtained (+8.9 years) using a specific formula for the Brazilian population with periapical radiographs [11].
For lower premolars, the smallest difference (+4.1 years) was observed on panoramic radiographs after applying the equation by Cameriere et al. [2]. While this formula was initially developed for panoramic radiographs, its application to periapical radiographs yielded a difference of +6.1 years. Notably, this value closely resembled the actual age when compared to the values obtained using specific formulas for Korean [12] and Portuguese [13] populations produced in panoramic radiographs.
Although the original formulas developed for maxillary canines and mandibular premolars [2,5] yielded lower values when compared to other formulas [11,12,13], all results demonstrated statistically significant differences (p < 0.001). In the case of maxillary canines, the estimated ages surpassed the actual ages. The standard deviation (SD) ranged from ±10 [11] to ±12.6 years [2], indicating considerable variability in the data. Additionally, the confidence interval (CI) exhibited wide values, signifying limited agreement.
Similarly, the estimated ages for mandibular second premolars also exceeded the actual ages, except when using the formula for the Portuguese population [13]. The SD ranged from ±1.8 [13] to ±10.5 years [12]. Like the canines, the CI displayed large values, indicating limited agreement, despite the forensic literature accepting a margin of error between 6 to 8 years [17], preferably less than 10 years [4].
The measurements obtained in this study underwent linear regressions, resulting in the construction of four equations tailored for each type of radiograph (panoramic and periapical) (Table 7). This approach is warranted due to specific geometric variations inherent in panoramic and periapical radiographs [8,9,18]. Previous studies have often applied the same formula to both panoramic and periapical radiographs [15,19].
The number of exams/patients included in the studies exhibits considerable variation. The smallest sample size observed was 30 individuals [20], while the largest included 606 individuals [2]. Challenges with sample sizes are inherent in studies aimed at determining age in adults, particularly after applying stringent inclusion and exclusion criteria [6,17]. Similar challenges were encountered in the present study. Research in this field suggests incorporating formulas derived from diverse populations or augmenting the sample size [7,10,15,21,22,23,24].
The absence of methodological standardization impedes or complicates the establishment of correlations and hinders the explanation of certain results [4]. Some studies express data in terms of standard error (SE) [5,12,25], while others use SD [11,26]. Additionally, some studies provide the R2 values [15,27], while simultaneously reporting values for EP and mean error (EM) [13]. In contrast, this research, alongside R2, presented its results in terms of SD, mean absolute error (EMA), and EP. This approach facilitated comparisons with the original formulas [4].
The linear regression analysis of maxillary canines on periapical radiographs revealed R2= 0.35 and EP= 10.26. These values are notably discrepant and higher when compared to the original formula [5], which reported R2 = 0.86 and EP=5.45. Similarly, the linear regression values for mandibular premolars on panoramic radiographs showed R2 = 0.32 and EP= 10.47, whereas the original formula indicated R2 = 0.75; EP= 7.42 [2].
The extreme quartile diagrams suggest a direct correlation between increasing age and secondary dentin deposition, as evidenced by the gradual decrease in pulp/tooth ratio values among individuals aged 20 to 70 years or older. However, these diagrams also exhibit wide ranges and lack concentration of data points, indicating a weak correlation between age group and pulp/tooth ratio. In essence, individuals across different age groups exhibit similar values, aligning with findings for mandibular second premolars in the Portuguese population [13], but diverging from results reported in other studies [1,2,5,15], where this correlation appeared stronger.
The scatter plots did not reveal a linear correlation, consistent with the findings from the extreme quartile plots. This observation suggests the absence of sexual dimorphism, aligning with previous reports in the literature [2,5,11,12,13].
The estimation of the age in living individuals requires higher accuracy compared to age estimation in cadavers or skeletons [26]. However, the range of applicable methods is limited [17], categorized into morphophysiological, radiographic, and biomechanical [28], each with its indications and specificities [29,30]. Among the non-invasive methods, imaging tests are widely employed due to their ease, reproducibility, and applicability in both in vivo and ex vivo settings [6,28,31,32]. It’s evident that imaging tests utilized in children and adolescents, which classify or measure during the mineralization, formation, development, and eruption phases of the teeth present, yield more precise results compared to the methods used in adults, even when applying foreign formulas [33,34,35,36,37,38].
Periapical radiographs can exhibit distortions, particularly in the vertical angle, resulting in elongated or shortened images, despite the use of radiographic positioners [8]. Panoramic radiographs, besides magnification, may also show vertical and horizontal distortion [9], inherent to each device, individual anatomical variations, or arising from minor positioning errors [8,18,39,40,41,42,43,44]. Another limitation of conventional exams is the projection of two-dimensional images of three-dimensional structures [45], restricting any analysis, quantitative or qualitative, to the vertical and mesiodistal dimensions of teeth or anatomical structures [46]. The morphology of the root canal can change over time, with secondary dentin deposition occurring with aging [47,48]. Young patients exhibit greater variations compared to older patients [49]. Inclusion specialists in Dental Radiology in the research team could enhance sample selection and measurement execution [4].
Cone beam computed tomography represents a new technology with increased significance across various dental disciplines. Numerous studies investigating age estimation have emerged utilizing this tool [48,50,51]. Despite promising prospects [47], challenges akin to those encountered in conventional methods have been noted [50,51,52,53,54,55]. Human programming and artificial intelligence stand as potential techniques to mitigate sample selection and evaluation biases in the future [56,57,58]. New investigations should be encouraged with larger sample sizes and the development of specific population formulas. It is pertinent for forensic dentistry that future studies compare the results obtained through different imaging modalities.
5. Conclusions
1. There was little agreement between the actual age and the estimated age when using the equations.
2. New equations were developed specifically for estimating the age of adult individuals using maxillary canines and mandibular second premolars in both panoramic and periapical radiographs.
Author Contributions
Conceptualization, I.N.N, O.A.G, and C.E.; Methodology, I.N.N, O.A.G., C.R.A.E., and C.E.; Validation, C.R.A.E., and C.E.; Formal analysis, I.N.N, L.T.A.C., and L.R.A.E.; Investigation, I.N.N., O.A.G., L.R.A.E., and C.R.A.E.; Resources, C.E.; Data curation, I.N.N., L.R.A.E., and C.R.A.E.; Writing - Original Draft Preparation, I.N.N., O.A.G., L.R.A.E. and C.R.A.E.; Writing - Review & Editing, L.T.A.C., and C.E.; Supervision, C.R.A.E. and C.E.; Project administration, C.E. All authors have read and agreed to the published version of the manuscript.
Funding
This research received no external funding
Institutional Review Board Statement
The study was conducted in accordance with Declaration of Helsinki and approved by the Institutional Review Board of Evangelical University of Goiás (IRB No 5288660, 24 April 2019).
Informed Consent Statement
Informed consent was obtained from all subjects involved in the study.
Data Availability Statement
The data are available in this article.
Conflicts of Interest
The authors declare no conflict of interest.
References
- Cameriere, R.; Ferrante, L.; Cingolani, M. Variations in pulp/tooth area ratio as an indicator of age: A preliminary study. J. Forensic Sci. 2004, 49, 317–319. [Google Scholar] [CrossRef] [PubMed]
- Cameriere, R.; De Luca, S.; Alemán, I.; Ferrante, L.; Cingolani, M. Age estimation by pulp/tooth ratio in lower premolars by orthopantomography. Forensic Sci. Int. 2012, 214, 105–112. [Google Scholar] [CrossRef] [PubMed]
- Kvaal, S.I.; Kolltveit, K.M.; Thomsen, I.O.; Solheim, T. Age estimation of adults from dental radiographs. Forensic Sci. Int. 1995, 74, 175–185. [Google Scholar] [CrossRef]
- Marroquin, T.Y.; Karkhanis, S.; Kvaal, S.I.; Vasudavan, S.; Kruger, E.; Tennant, M. Age estimation in adults by dental imaging assessment systematic review. Forensic Sci. Int. 2017, 275, 203–211. [Google Scholar] [CrossRef]
- Cameriere, R.; Ferrante, L.; Belcastro, M.G.; Bonfiglioli, B.; Rastelli, E.; Cingolani, M. Age estimation by pulp/tooth ratio in canines by peri-apical x-rays. J. Forensic Sci. 2007, 52, 166–170. [Google Scholar] [CrossRef] [PubMed]
- Cunha, E.; Wasterlain, S. Estimativa da idade por métodos dentários. In Identificação em Medicina Dentária; 2015. [Google Scholar]
- Miranda, J.C.; Azevedo, A.C.S.; Rocha, M.; Michel-Crosato, E.; Biazevic, M.G.H. Age estimation in Brazilian adults by Kvaal’s and Cameriere’s methods. Braz. Oral Res. 2020, 34, e051. [Google Scholar] [CrossRef] [PubMed]
- Mallya, S.; Lam, E. White & Pharoah’s Oral Radiology, 8th ed.; Mosby: St. Louis, USA, 2018. [Google Scholar]
- Schulze, R.; Krummenauer, F.; Schalldach, F.; d’Hoedt, B. Precision and accuracy of measurements in digital panoramic radiography. Dentomaxillofac. Radiol. 2000, 29, 52–56. [Google Scholar] [CrossRef] [PubMed]
- Jeevan, M.B.; Kale, A.D.; Angadi, P.V.; Hallikerimath, S. Age estimation by pulp/tooth area ratio in canines: Cameriere’s method assessed in an Indian sample using radiovisiography. Forensic Sci. Int. 2011, 204, 209.e1–209.e5. [Google Scholar] [CrossRef] [PubMed]
- Azevedo, A.d.C.; Alves, N.Z.; Michel-Crosato, E.; Rocha, M.; Cameriere, R.; Biazevic, M.G. Dental age estimation in a Brazilian adult population using Cameriere’s method. Braz. Oral Res. 2015, 29, S1806-83242015000100215. [Google Scholar] [CrossRef]
- Lee, J.H.; Lee, C.; Battulga, B.; Na, J.Y.; Hwang, J.J.; Kim, Y.H.; Han, S.S. Morphological analysis of the lower second premolar for age estimation of Korean adults. Forensic Sci. Int. 2017, 281, 186.e1–186e6. [Google Scholar] [CrossRef]
- Anastácio, A.C.; Serras, C.; Vargas de Sousa Santos, R.F.; Palmela Pereira, C. Validation of Cameriere’s medical-legal age estimation method using seconds premolars in a Portuguese population. J. Forensic Leg. Med. 2018, 60, 30–34. [Google Scholar] [CrossRef] [PubMed]
- Aguilera-Muñoz, F.; Garay-Barrientos, A.; Moreno-Lazcano, I.; Navarro-Cáceres, P.; Fonseca, G.M. Dental age estimation by pulp/tooth ratio in mandibular canines: Study in a Chilean sample by Camerierer’s method. Int. J. Morphol. 2020, 38, 322–327. [Google Scholar] [CrossRef]
- Shah, P.; Venkatesh, R.; More, C. Age estimation in Western Indian population by Cameriere’s and Drusini’s methods. J. Oral Maxillofac. Pathol. 2022, 26, 116–120. [Google Scholar] [CrossRef] [PubMed]
- Figueiredo, R.T.; Vizioli, S.H.T. Comparative study between the new digital tools used in freehand drawings. Blucher Design Proceedings 2014, 1, 87–91. [Google Scholar]
- Schmeling, A.; Geserick, G.; Reisinger, W.; Olze, A. Age estimation. Forensic Sci. Int. 2007, 165, 178–181. [Google Scholar] [CrossRef] [PubMed]
- Yeom, H.-G.; Kim, J.-E.; Huh, K.-H.; Yi, W.-J.; Heo, M.-S.; Lee, S.-S.; Choi, S.-C. Development of a new ball-type phantom for evaluation of the image layer of panoramic radiography. Imaging Sci. Dent. 2018, 48, 255–259. [Google Scholar] [CrossRef]
- Saxena, S. Age estimation of Indian adults from orthopantomographs. Braz. Oral Res. 2011, 25, 225–229. [Google Scholar] [CrossRef] [PubMed]
- De Luca, S.; Alemán, I.; Bertoldi, F.; Ferrante, L.; Mastrangelo, P.; Cingolani, M.; Cameriere, R. Age estimation by tooth/pulp ratio in canines by peri-apical x-rays: reliability in age determination of Spanish and Italian medieval skeletal remains. J. Archaeol. Sci. 2010, 37, 3048–3058. [Google Scholar] [CrossRef]
- Lavez, G.P.; Terada, A.S.S.D.; Dezem, T.U.; Galo, R.; da Silva, R.H.A. Age estimation using Olze’s method in an adult Brazilian population. J. Forensic Leg. Med. 2017, 52, 241–244. [Google Scholar] [CrossRef]
- Dehghani, M.; Shadkam, E.; Ahrari, F.; Dehghani, M. Age estimation by canines’ pulp/tooth ratio in an Iranian population using digital panoramic radiography. Forensic Sci. Int. 2018, 285, 44–49. [Google Scholar] [CrossRef]
- Hisham, S.; Abdullah, N.; Mohamad Noor, M.H.; Franklin, D. Quantification of secondary dentin formation using dental orthopantomographs in a contemporary Malaysian population. Aust. J.Forensic Sci. 2019, 51, S180–S183. [Google Scholar] [CrossRef]
- Zelic, K.; Pavlovic, S.; Mijucic, J.; Djuric, M.; Djonic, D. Applicability of pulp/tooth ratio method for age estimation. Forensic Sci. Med. Pathol. 2020, 16, 43–48. [Google Scholar] [CrossRef] [PubMed]
- Babshet, M.; Acharya, A.B.; Naikmasur, V.G. Age estimation in Indians from pulp/tooth area ratio of mandibular canines. Forensic Sci. Int. 2010, 197, 125.e1–125.e4. [Google Scholar] [CrossRef] [PubMed]
- Cameriere, R.; Brogi, G.; Ferrante, L.; Mirtella, D.; Vultaggio, C.; Cingolani, M.; Fornaciari, G. Reliability in age determination by pulp/tooth ratio in upper canines in skeletal remains. J. Forensic Sci. 2006, 51, 861–864. [Google Scholar] [CrossRef] [PubMed]
- Juneja, M.; Devi, Y.B.; Rakesh, N.; Juneja, S. Age estimation using pulp/tooth area ratio - A digital image analysis. J. Forensic Dent. Sci. 2014; 6, 160–165. [Google Scholar]
- Verma, M.; Verma, N.; Sharma, R.; Sharma, A. Dental age estimation methods in adult dentitions: An overview. J. Forensic Dent. Sci. 2019, 11, 57–63. [Google Scholar] [CrossRef] [PubMed]
- Hill, A.J.; Hewson, I.; Lain, R. The role of the forensic odontologist in disaster victim identification: Lessons for management. Forensic Sci. Int. 2011, 205, 44–47. [Google Scholar] [CrossRef] [PubMed]
- Hinchliffe, J. Forensic odontology, Part 1. Dental identification. Br. Dent. J. 2011, 210, 219–224. [Google Scholar] [CrossRef] [PubMed]
- Pretty, I.A. Forensic dentistry: 1. Identification of human remains. Dent. Update 2007, 34, 621–622, 624–626, 629–630 passim. [Google Scholar] [CrossRef] [PubMed]
- Phulari, R.G.S.; Dave, E.J. Evolution of dental age estimation methods in adults over the years from occlusal wear to more sophisticated recent techniques. Egypt J. Forensic Sci. 2021, 11, 36. [Google Scholar] [CrossRef]
- Esan, T.A.; Yengopal, V.; Schepartz, L.A. The Demirjian versus the Willems method for dental age estimation in different populations: A meta-analysis of published studies. PLoS One. 2017, 12, e0186682. [Google Scholar] [CrossRef]
- Wang, J.; Ji, F.; Zhai, Y.; Park, H.; Tao, J. Is Willems method universal for age estimation: A systematic review and meta-analysis. J. Forensic Leg. Med. 2017, 52, 130–136. [Google Scholar] [CrossRef] [PubMed]
- Gonçalves do Nascimento, L.; Ribeiro Tinoco, R.L.; Lacerda Protasio, A.P.; Arrais Ribeiro, I.L.; Marques Santiago, B.; Cameriere, R. Age estimation in north east Brazilians by measurement of open apices. J. Forensic Odontostomatol. 2020, 38, 2–11. [Google Scholar] [PubMed]
- Machado, A.L.R.; Borges, B.S.; Cameriere, R.; Machado, C.E.P.; da Silva, R.H.A. Evaluation of Cameriere and Willems age estimation methods in panoramic radiographs of Brazilian children. J. Forensic Odontostomatol. 2020, 38, 8–15. [Google Scholar]
- Uenoyama Dezem, T.; Franco, A.; Machado Palhares, C.E.; Deitos, A.R.; Alves da Silva, R.H.; Marques Santiago, B.; Lima Arrais Ribeiro, I.; Daruge Junior, E. Testing the Olze and Timme methods for dental age estimation in radiographs of Brazilian subadults and adults. Acta Stomatol. Croat. 2021, 55, 390–396. [Google Scholar] [CrossRef] [PubMed]
- Hostiuc, S.; Diaconescu, I.; Rusu, M.C.; Negoi, I. Age estimation using the Cameriere methods of open apices: A meta-analysis. Healthcare. 2021, 9, 237. [Google Scholar] [CrossRef]
- Biggerstaff, R.H.; Phillips, J.R.A. Quantitative comparison of paralleling long-cone and bisection-of-angle periapical radiography. Oral Surg. Oral Med. Oral Pathol. 1976, 41, 673–677. [Google Scholar] [CrossRef] [PubMed]
- Huh, K.-H.; Lee, S.-S.; Jeon, I.-S.; Yi, W.-J.; Heo, M.-S.; Choi, S.-C. Quantitative analysis of errors in alveolar crest level caused by discrepant projection geometry in digital subtraction radiography: An in vivo study. Oral Surg.Oral Med. Oral Pathol. Oral Radiol. Endod. 2005, 100, 750–755. [Google Scholar] [CrossRef] [PubMed]
- Jamdade, AS. Modified bisecting angle technique in eliminating zygomatic superimposition over apices of maxillary molars. Indian J. Dent. Res. 2014, 2, 521–526. [Google Scholar] [CrossRef] [PubMed]
- Jain, S.; Nagi, R.; Daga, M.; Shandilya, A.; Shukla, A.; Parakh, A.; Laheji, A.; Singh, R. Tooth coronal index and pulp/tooth ratio in dental age estimation on digital panoramic radiographs—A comparative study. Forensic Sci. Int. 2017, 277, 115–121. [Google Scholar] [CrossRef]
- Coskun, E.; Kocak Topbas, N. Successful dental implantation: Evaluating the accuracy of horizontal and vertical measurements on panoramic radiographs using dental implants as reference objects. Minerva Dent. Oral Sci. 2022, 70, 269–275. [Google Scholar] [CrossRef]
- Martins, L.A.C.; Nascimento, E.H.L.; Gaêta-Araujo, H.; Oliveira, M.L.; Freitas, D.Q. Mapping of a multilayer panoramic radiography device. Dentomaxillofac.Radiol. 2022, 51, 20210082. [Google Scholar] [CrossRef] [PubMed]
- Dalessandri, D.; Tonni, I.; Laffranchi, L.; Migliorati, M.; Isola, G.; Visconti, L.; Bonetti, S.; Paganelli, C. 2D vs. 3D radiological methods for dental age determination around 18 years: A systematic review. Appl. Sci. 2020, 10, 3094. [Google Scholar] [CrossRef]
- Issrani, R.; Prabhu, N.; Sghaireen, M.G.; Ganji, K.K.; Alqahtani, A.M.A.; ALJamaan, T.S.; Alanazi, A.M.; Alanazi, S.H.; Alam, M.K.; Munisekhar, M. S. Cone-beam computed tomography: A new tool on the horizon for forensic dentistry. Int. J. Environ. Res. Public Health. 2022, 19, 5352. [Google Scholar] [CrossRef] [PubMed]
- Merdietio Boedi, R.; Shepherd, S.; Mânica, S.; Franco, A. CBCT in dental age estimation: A systematic review and meta analysis. Dentomaxillofac. Radiol. 2022, 51, 20210335. [Google Scholar] [CrossRef] [PubMed]
- Merdietio Boedi, R.; Shepherd, S.; Oscandar, F.; Mânica, S.; Franco, A. Regressive changes of crown-root morphology and their volumetric segmentation for adult dental age estimation. J. Forensic Sci. 2022, 67, 1890–1898. [Google Scholar] [CrossRef] [PubMed]
- Iqbal, A.; Karobari, M.I.; Alam, M.K.; Khattak, O.; Alshammari, S.M.; Adil, A.H.; Noorani, T.Y.; Algarani, H.A.; Alonazi, M.A.; Sirivastava, K.C.; Issrani, R. Evaluation of root canal morphology in permanent maxillary and mandibular anterior teeth in saudi subpopulation using two classification systems: A CBCT study. BMC Oral Health 2022, 22, 171. [Google Scholar] [CrossRef] [PubMed]
- Porto, L.V.M.G.; Celestino da Silva Neto, J.; Anjos Pontual, A. dos; Catunda, R.Q. Evaluation of volumetric changes of teeth in a Brazilian population by using cone beam computed tomography. J. Forensic Leg. Med. 2015, 36, 4–9. [Google Scholar] [CrossRef] [PubMed]
- Moreira Andrade, V.; Uenoyama Dezem, T.; Breda de Souza, A.C.; Possante de Almeida, C.A.; Francesquini Junior, L.; Daruge Junior, E. Three-dimensional radiological methods for age estimation in adults by using the pulp/tooth relation: An integrative review. Braz. J. Forensic Sci. Medical Law Bioethics 2021, 1, 97–110. [Google Scholar] [CrossRef]
- Asif, M.K.; Nambiar, P.; Mani, S.A.; Ibrahim, N.B.; Khan, I.M.; Sukumaran, P. Dental age estimation employing CBCT scans enhanced with mimics software: comparison of two different approaches using pulp/tooth volumetric analysis. J. Forensic Leg. Med. 2018, 54, 53–61. [Google Scholar] [CrossRef]
- Akay, G.; Gungor, K.; Gurcan, S. The applicability of Kvaal methods and pulp/tooth volume ratio for age estimation of the Turkish adult population on cone beam computed tomography images. Aust. J. Forensic Sci. 2019, 51, 251–265. [Google Scholar] [CrossRef]
- Al-Omoush, S.A.; Alhadidi, A.; Al-Kayed, A.; Saoud, H.; Alsoleihat, F. Do upper third molars provide more accurate age estimation in the adult based on the pulp-to-tooth ratio than lower third molars? A cone-beam CT study. Saudi Dent. J. 2021, 3, 702–706. [Google Scholar] [CrossRef] [PubMed]
- Vossoughi, M.; Movahhedian, N.; Ghafoori, A. The impact of age mimicry bias on the accuracy of methods for age estimation based on Kvaal’s pulp/tooth ratios: A bootstrap study. Int. J. Legal Med. 2022, 136, 269–278. [Google Scholar] [CrossRef] [PubMed]
- Cameriere, R.; De Luca, S.; Egidi, N.; Bacaloni, M.; Maponi, P.; Ferrante, L.; Cingolani, M. Automatic age estimation in adults by analysis of canine pulp/tooth ratio: Preliminary results. J. Forensic Radiol. Imaging 2015, 3, 61–66. [Google Scholar] [CrossRef]
- Khanagar, S.B.; Al-ehaideb, A.; Maganur, P.C.; Vishwanathaiah, S.; Patil, S.; Baeshen, H.A.; Sarode, S.C.; Bhandi, S. Developments, application, and performance of artificial intelligence in dentistry – A systematic review. J. Dent. Sci. 2021, 16, 508–522. [Google Scholar] [CrossRef]
- Putra, R.H.; Doi, C.; Yoda, N.; Astuti, E.R.; Sasaki, K. Current applications and development of artificial intelligence for digital dental radiography. Dentomaxillofac. Radiol. 2022, 51, 20210197. [Google Scholar] [CrossRef]
Figure 1.
Measurements of tooth and pulp areas and pixel values on panoramic radiograph. (a-b) maxillary canine; (c-d) mandibular second premolar.
Figure 1.
Measurements of tooth and pulp areas and pixel values on panoramic radiograph. (a-b) maxillary canine; (c-d) mandibular second premolar.
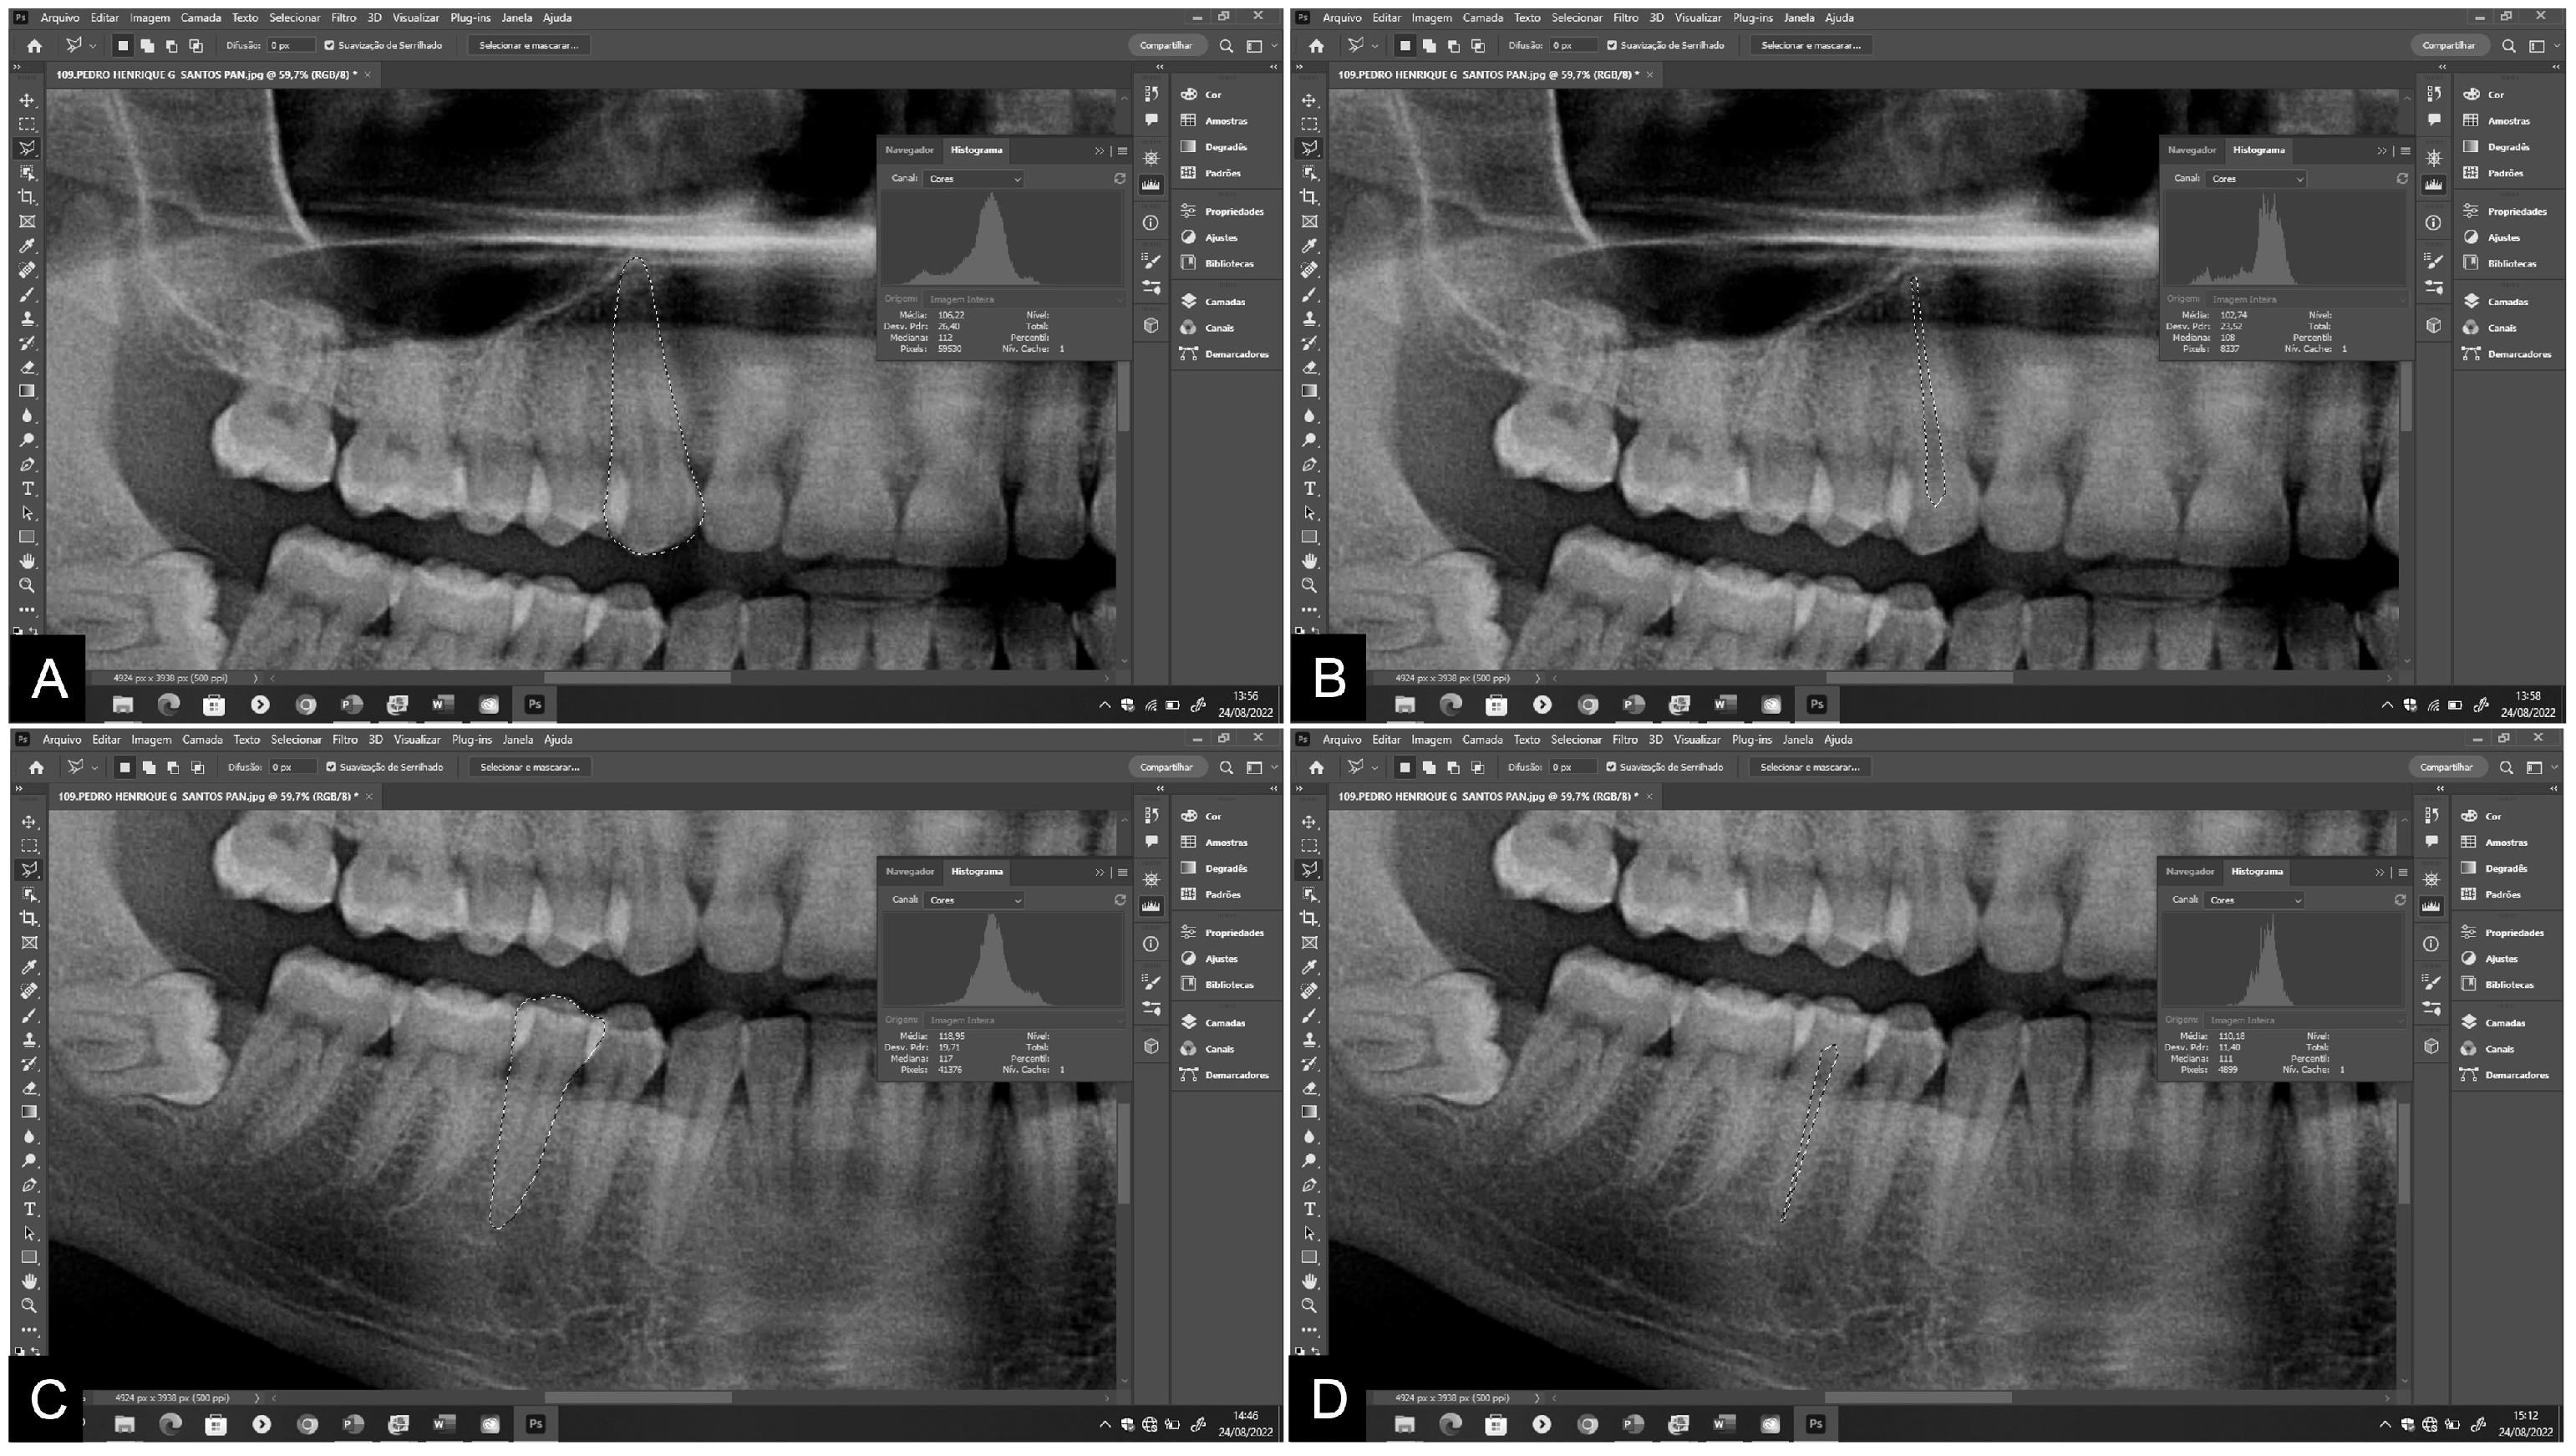
Figure 2.
Measurements of tooth and pulp areas and pixel values on periapical radiograph. (a-b) maxillary canine; (c-d) mandibular second premolar.
Figure 2.
Measurements of tooth and pulp areas and pixel values on periapical radiograph. (a-b) maxillary canine; (c-d) mandibular second premolar.
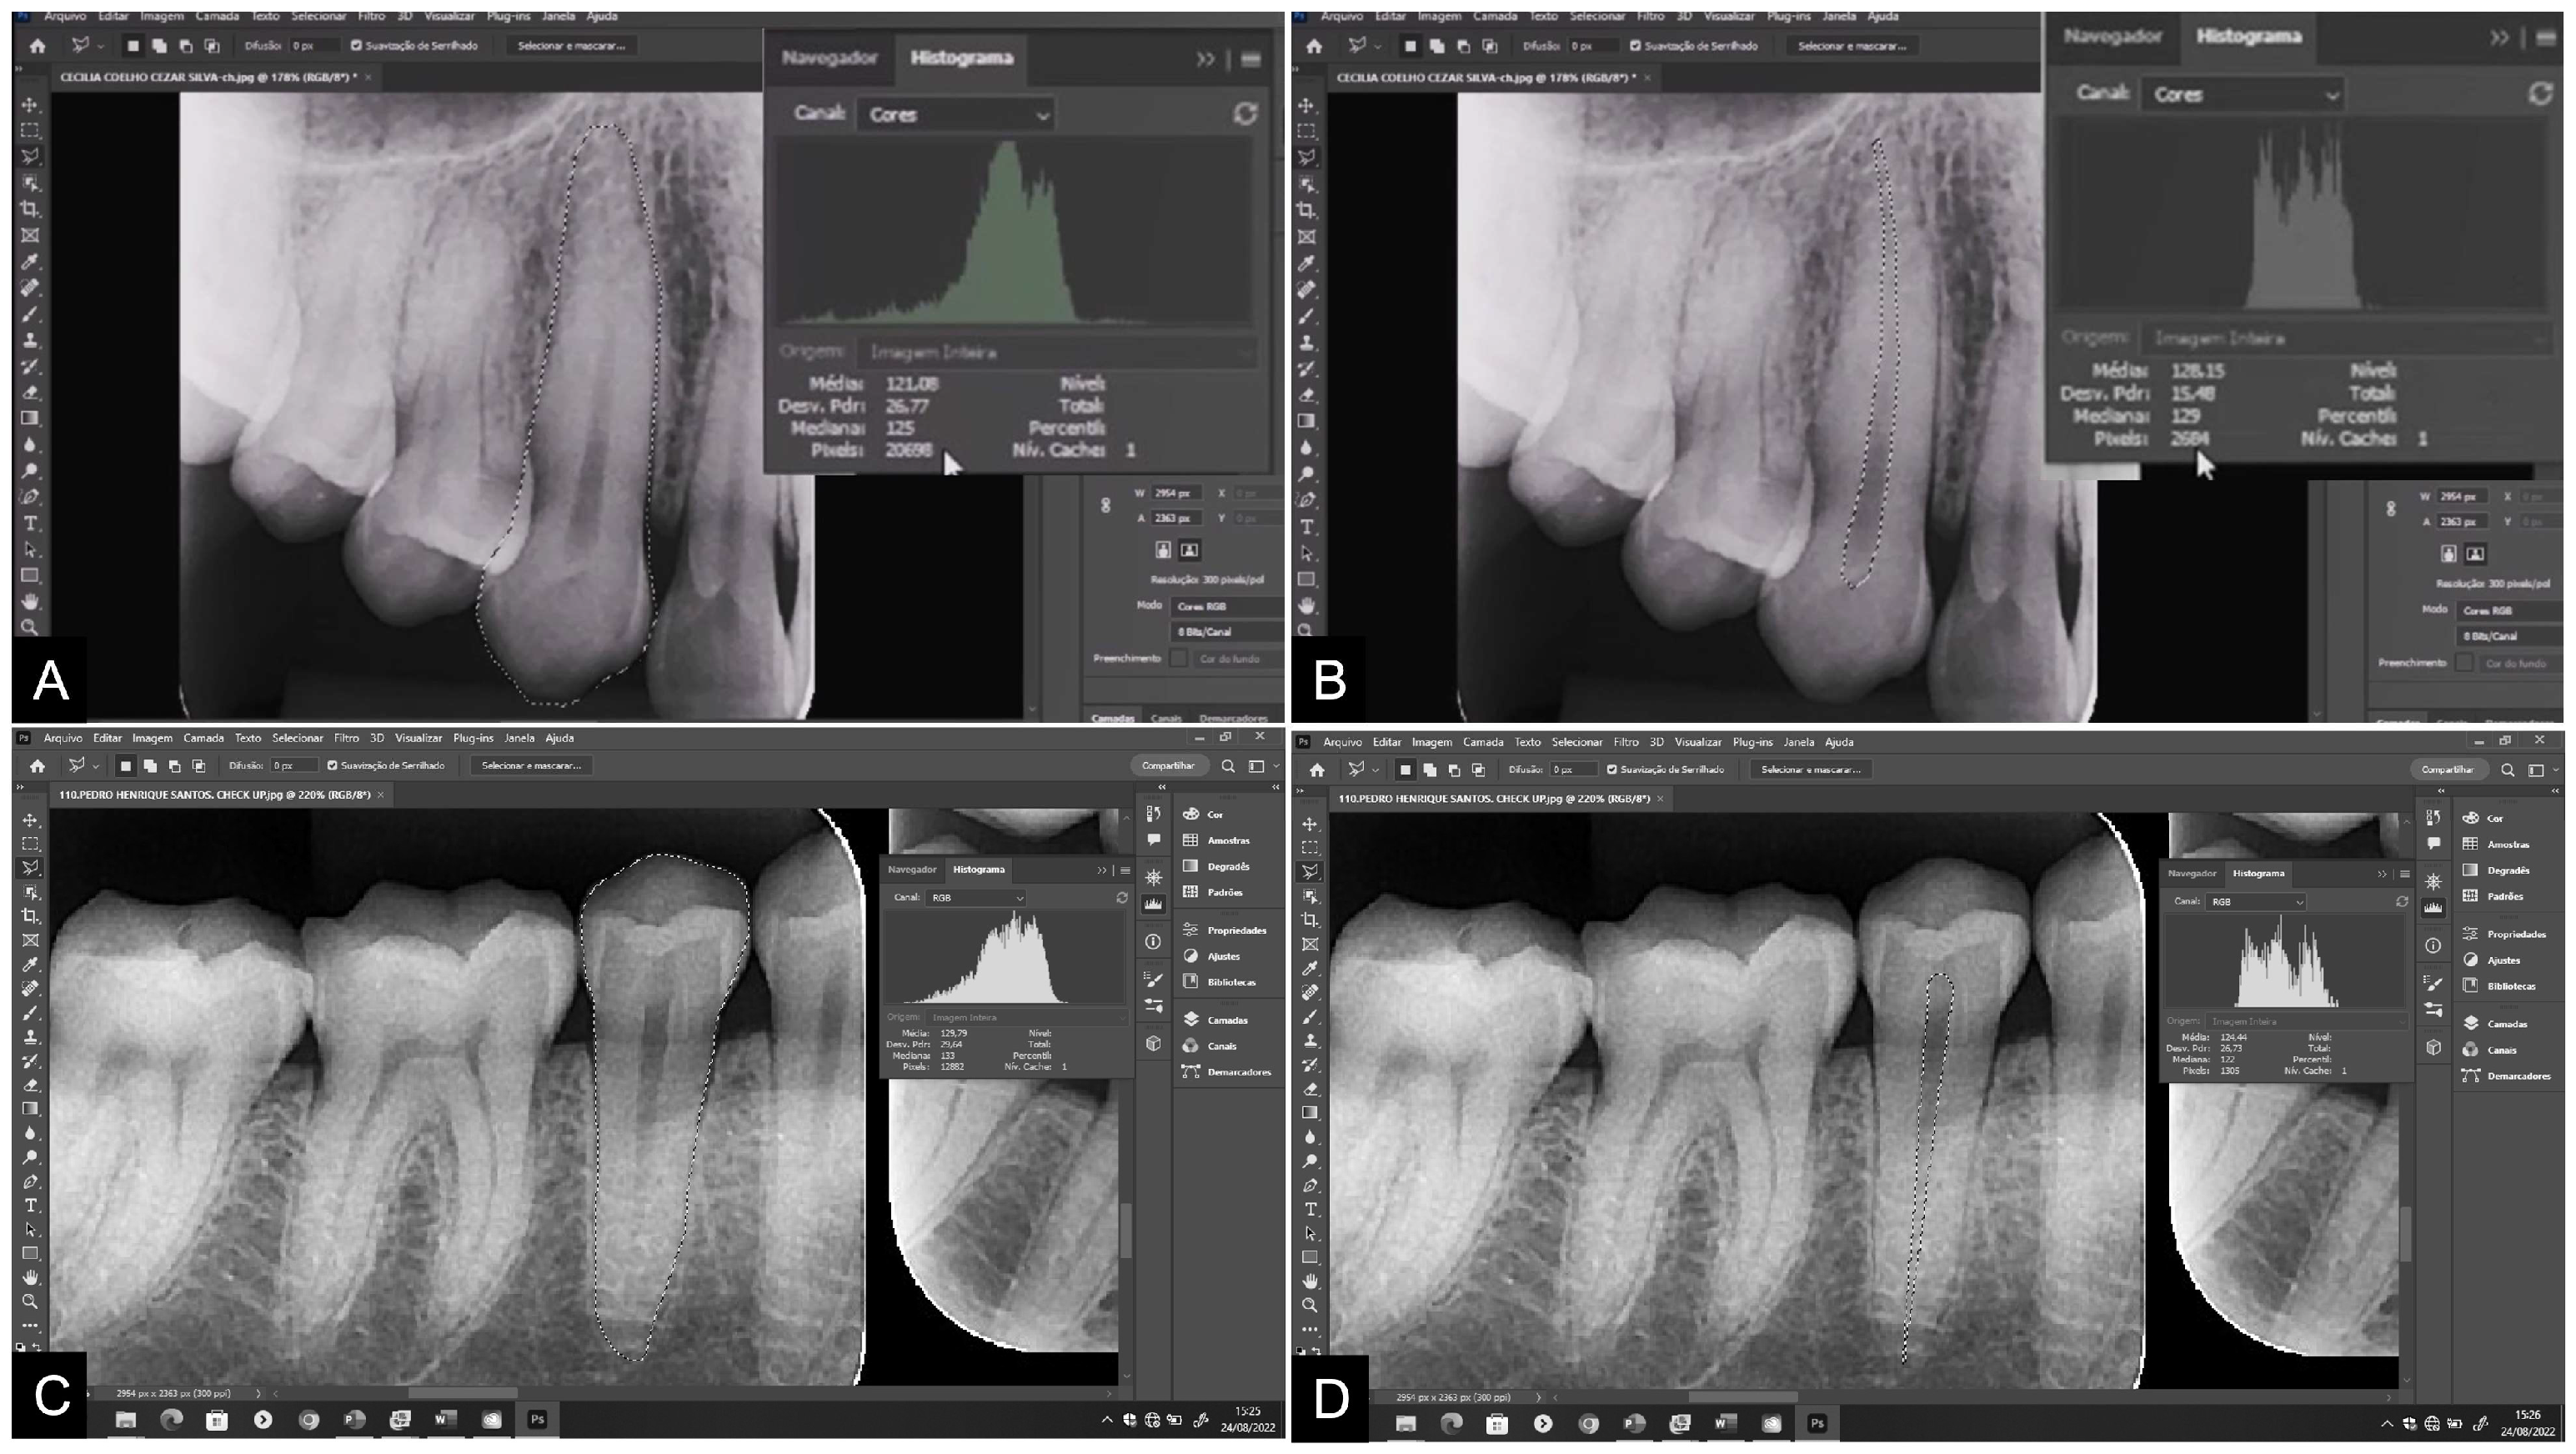
Figure 3.
Boxplot charts of the pulp/tooth ratio of maxillary canines (a and c) and mandibular second premolars (b and d) on panoramic and periapical radiographs. Pan: panoramic radiography. Peri: periapical radiography.
Figure 3.
Boxplot charts of the pulp/tooth ratio of maxillary canines (a and c) and mandibular second premolars (b and d) on panoramic and periapical radiographs. Pan: panoramic radiography. Peri: periapical radiography.
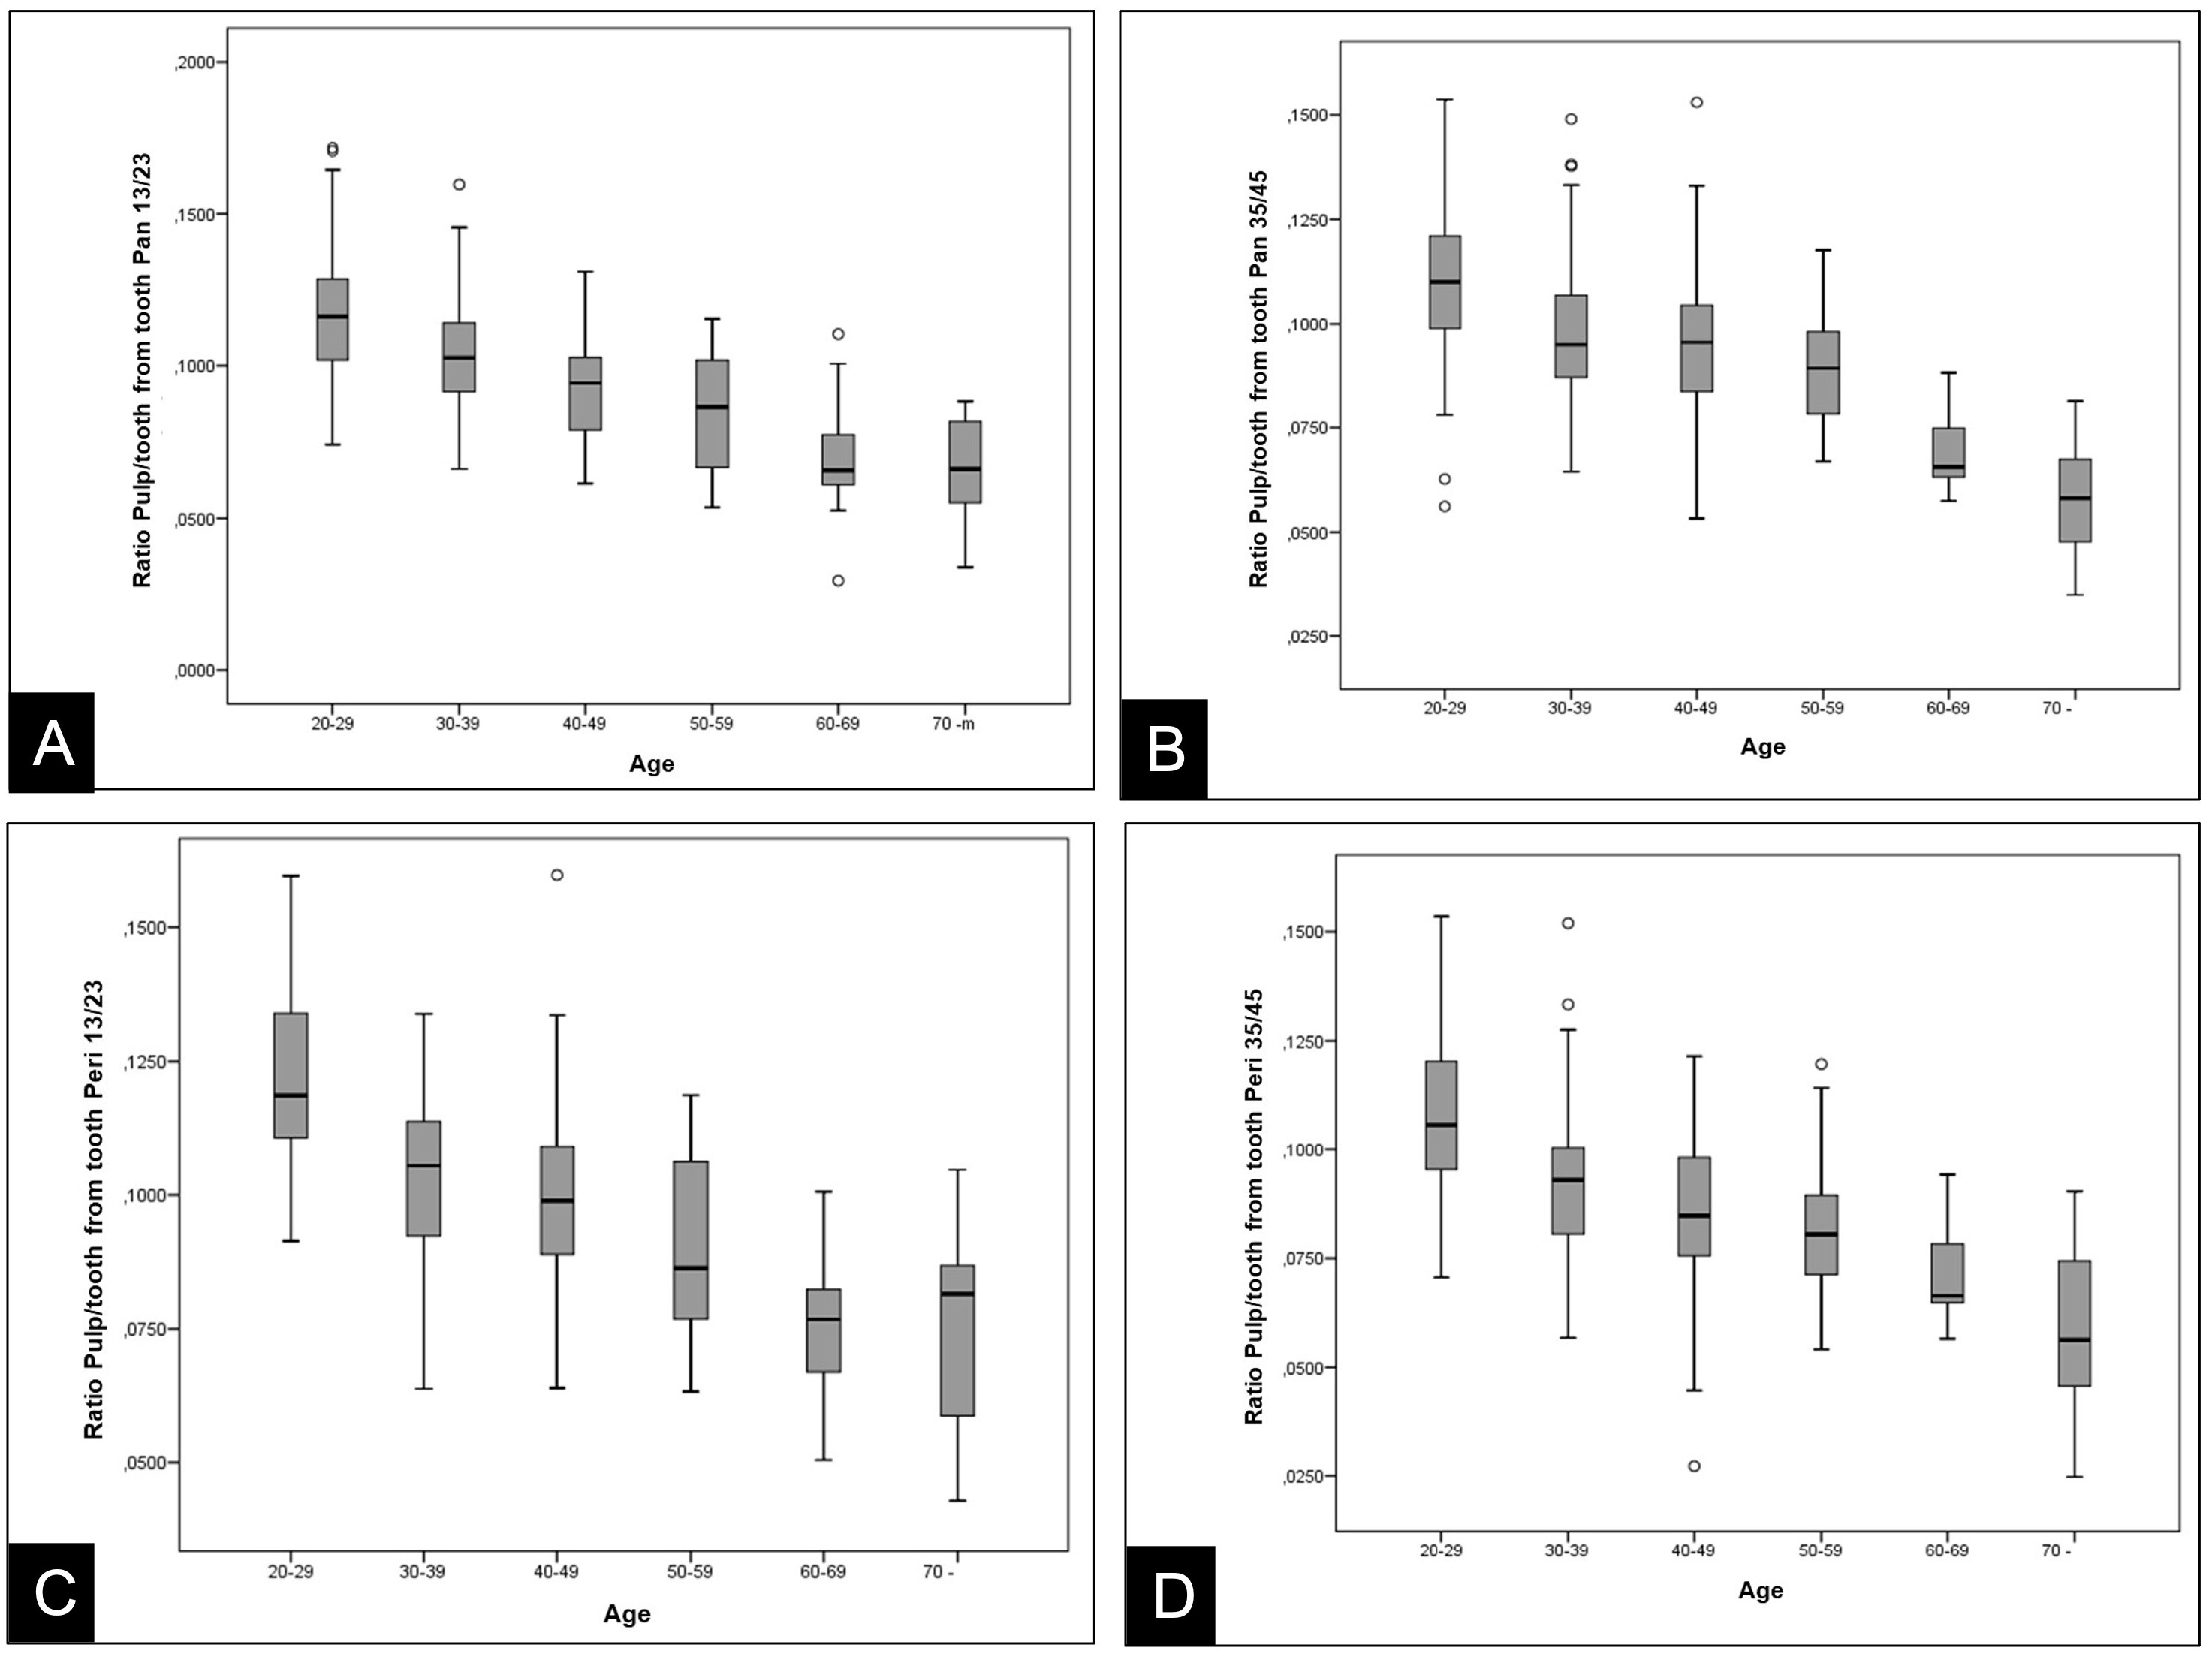
Figure 4.
Dispersion diagrams of the pulp/tooth ratio of de maxillary canines (a and b) and mandibular second premolars (c and d) on panoramic and periapical radiographs. Pan: panoramic radiography. Peri: periapical radiography.
Figure 4.
Dispersion diagrams of the pulp/tooth ratio of de maxillary canines (a and b) and mandibular second premolars (c and d) on panoramic and periapical radiographs. Pan: panoramic radiography. Peri: periapical radiography.
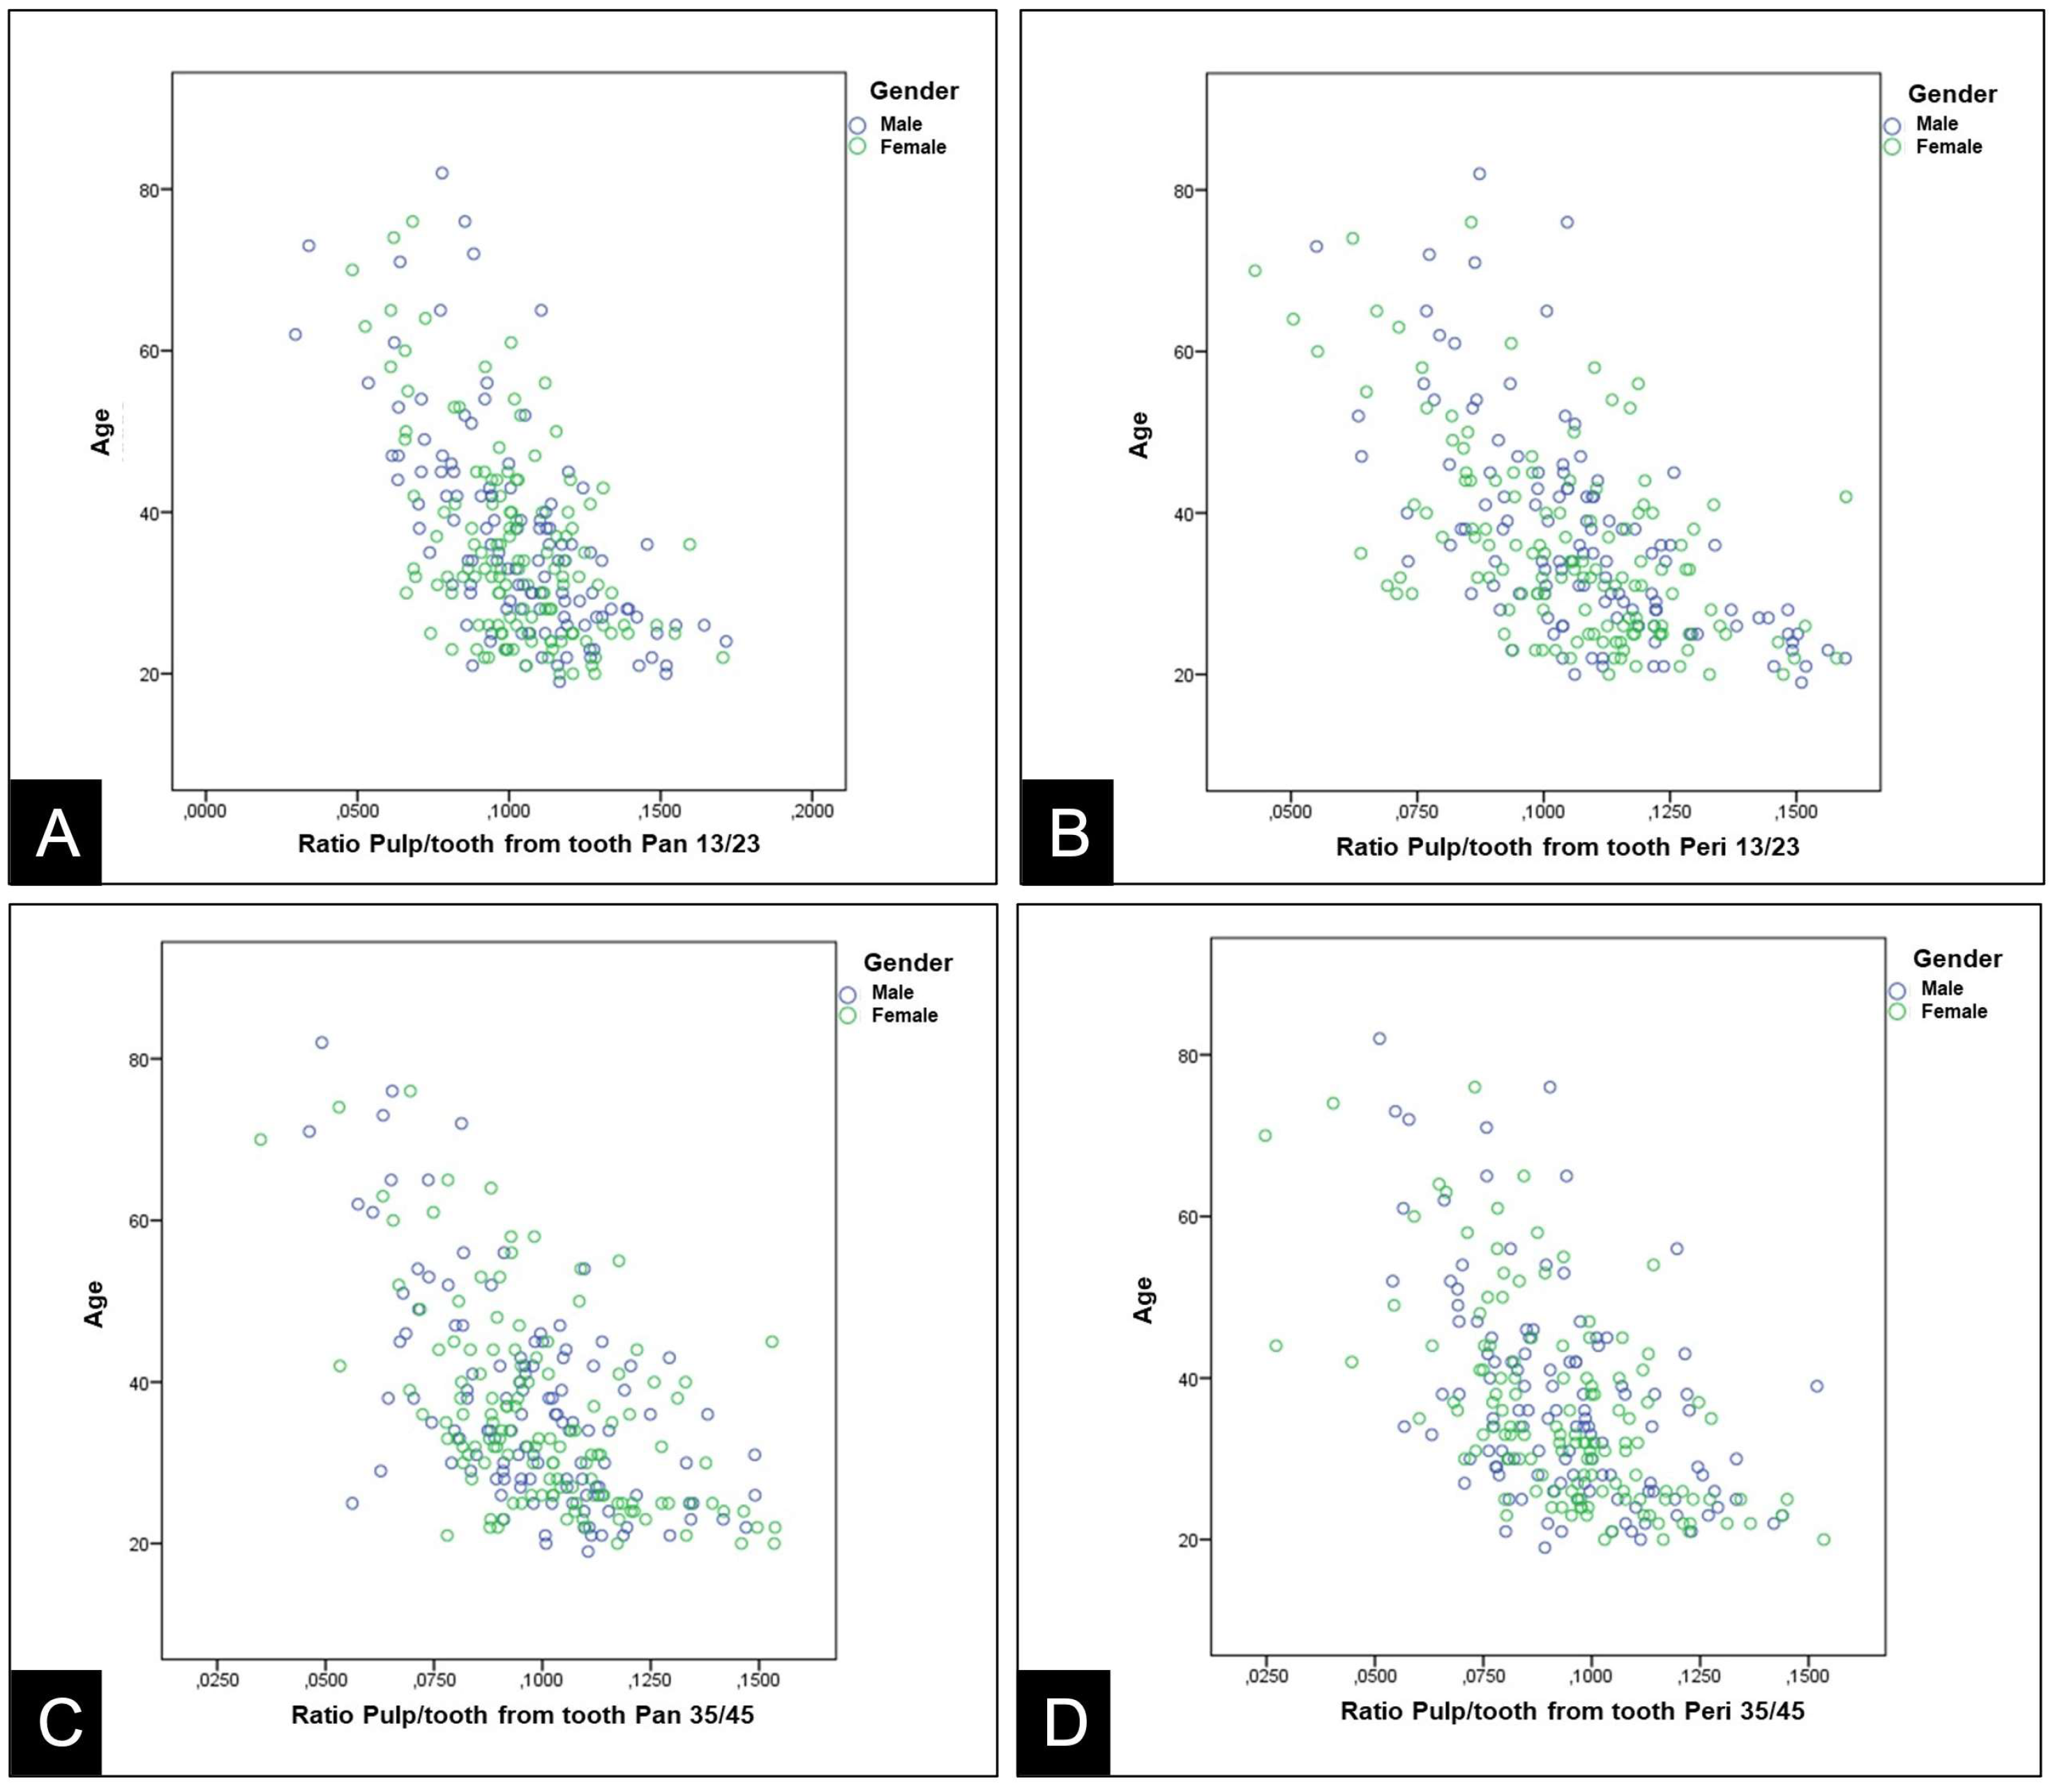

Table 1.
Distribution of sample by age and gender.
| Age | Male | Female | Total |
|---|---|---|---|
| 20-29 years old | 40 | 44 | 84 |
| 30-39 years old | 38 | 46 | 84 |
| 40-49 years old | 22 | 22 | 44 |
| 50-59 years old | 8 | 10 | 18 |
| 60-69 years old | 4 | 5 | 9 |
| 70 years old or older | 5 | 3 | 8 |
| Total | 117 | 130 | 247 |
Table 2.
Studies, radiographic examinations, and applied equations for age estimation.
| Author | Radiographic Exam | Equation |
|---|---|---|
| Cameriere et al. [5] | Periapical | A.E = 99.973 - 532.775*R13 |
| Cameriere et al. [2] | Panoramic | A.E = 76.29 - 362.57*R45 |
| Azevedo et al. [11] | Periapical | A.E = 94.706 – 465.358*R13 |
| Lee et al. [12] | Panoramic | A.E = 97.083 – 487.415*R45 |
| Anastácio et al. [13] | Panoramic | A.E = 32.493 - 83.890*R45 |
A.E: age estimate. *Multiplication. R: pulp/tooth ratio.
Table 3.
ICC for inter-observer assessment of pixel measurements.
| Measure 1 | Measure 2 | p* | ICC (CI 95%) | |
|---|---|---|---|---|
| Pan T13/23 | ||||
| Tooth area | 19013 | 18762 | 0.579 | 0.999 |
| Pulp area | 2110 | 2081 | 0.606 | 0.997 |
| Peri T13/23 | ||||
| Tooth area | 22501 | 22686 | 0.643 | 0.990 |
| Pulp area | 2523 | 2552 | 0.239 | 0.996 |
| Pan T35/45 | ||||
| Tooth area | 15139 | 15610 | 0.717 | 0.999 |
| Pulp area | 1623 | 1619 | 0.116 | 0.998 |
| Peri T35/45 | ||||
| Tooth area | 15656 | 15540 | 0.055 | 0.999 |
| Pulp area | 1534 | 1449 | 0.557 | 0.995 |
Data presented by the median. *Wilcoxon test. ICC: interclass correlation coefficient. CI: confidence interval. Pan: panoramic radiography. T13/23: tooth 13/23. Peri: periapical radiography. T35/45: tooth 35/45.
Table 4.
Comparison of actual age and estimated age by various equations for canines (n=247).
| Equation | Mean ± SD (years) | Difference in years | p* | CI(95%)** |
|---|---|---|---|---|
| Cameriere et al. [5] | ||||
| Pan T13/23 | 45.4 ± 12.6 | +9.1 | < 0.001 | -13.4 to 31.6 |
| Peri T13/23 | 43.3 ± 11.4 | +7.0 | < 0.001 | -14.5 to 28.5 |
| Azevedo et al. [11] | ||||
| Peri T13/23 | 45.2 ± 10.0 | +8.9 | < 0.001 | -11.7 to 29.5 |
SD: standard deviation. *Student´s t-test for paired samples. CI: confidence interval. **agreement by the Bland and Altman technique. Pan: panoramic radiography. Peri: periapical radiography. T13/23: tooth 13/23.
Table 5.
Comparison of actual age and estimated age by various formulas for premolars (n=247).
| Equation | Mean ± SD (years) | Difference in years | p* | CI(95%)** |
|---|---|---|---|---|
| Cameriere et al. [2] | ||||
| Pan T35/45 | 40.3 ± 7.8 | +4.1 | < 0.001 | -16.5 to 24.7 |
| Peri T35/45 | 42.3 ± 7.6 | +6.1 | < 0.001 | -14.7 to 26.9 |
| Lee et al. [12] | ||||
| Pan T35/45 | 48.7 ± 10.5 | +12.5 | < 0.001 | -9.1 to 34.1 |
| Anastácio et al. [13] | ||||
| Pan T35/45 | 24.2 ± 1.8 | -12.1 | < 0.001 | -11.0 to 35.2 |
SD: standard deviation. *Student´s t-test for paired samples. CI: confidence interval. **agreement by the Bland and Altman technique. Pan: panoramic radiography. Peri: periapical radiography. T35/45: tooth 35/45.
Table 6.
Pixel values of pulp/tooth ratio obtained in teeth 13/23 and 35/45 in panoramic and periapical radiographs.
Table 6.
Pixel values of pulp/tooth ratio obtained in teeth 13/23 and 35/45 in panoramic and periapical radiographs.
| Radiography/Tooth | n | Mean | SD | Min | Max |
|---|---|---|---|---|---|
| Pan 13/23 | 247 | 0.1025 | 0.0236 | 0.0295 | 0.1716 |
| Peri 13/23 | 247 | 0.1064 | 0.0215 | 0.0429 | 0.1598 |
| Pan 35/45 | 247 | 0.0992 | 0.0214 | 0.0350 | 0.1537 |
| Peri 35/45 | 247 | 0.0937 | 0.0210 | 0.0247 | 0.1535 |
SD: standard deviation. Min: minimum. Max: maximum. Pan: panoramic radiography. Peri: periapical radiography.
Table 7.
Equations obtained by applying the linear regression model in the Brazilian subpopulation.
| Radiography/Tooth | Brazilian subpopulation equation | R2 | MAE | SD |
|---|---|---|---|---|
| Pan T13/23 | Age = 68.348 – 313.070*R13/23 | 0.34 | 106.47 | 10.32 |
| Peri T13/23 | Age = 73.245 – 347.648*R13/23 | 0.35 | 105.20 | 10.26 |
| Pan T45/35 | Age = 69.447 – 334.606*R35/45 | 0.32 | 109.53 | 10.47 |
| Peri T45/35 | Age = 67.067 – 328.886*R35/45 | 0.30 | 113.34 | 10.65 |
R2: determination coefficient. MAE: mean absolute error. SD: standard deviation. Pan: panoramic radiography. T13/23: tooth 13/23; Peri: periapical radiography. T35/45: tooth 35/45.
Disclaimer/Publisher’s Note: The statements, opinions and data contained in all publications are solely those of the individual author(s) and contributor(s) and not of MDPI and/or the editor(s). MDPI and/or the editor(s) disclaim responsibility for any injury to people or property resulting from any ideas, methods, instructions or products referred to in the content. |
© 2024 by the authors. Licensee MDPI, Basel, Switzerland. This article is an open access article distributed under the terms and conditions of the Creative Commons Attribution (CC BY) license (http://creativecommons.org/licenses/by/4.0/).
Copyright: This open access article is published under a Creative Commons CC BY 4.0 license, which permit the free download, distribution, and reuse, provided that the author and preprint are cited in any reuse.


