Submitted:
01 February 2024
Posted:
01 February 2024
You are already at the latest version
Abstract
The vacuolar proton translocating ATPase (V-ATPase) is a transmembrane multi-protein complex fundamental in maintaining a normal intracellular pH. In the tumoral contest, its role is crucial since the metabolism is mainly based on anaerobic glycolytic reactions. Moreover, the neoplastic cells use the V-ATPase to extrude chemotherapy drugs to the extra-cellular compartment, as a drug-resistance mechanism. In glioblastoma (GBM), the most malignant and incurable primary brain tumor, the expression of this pump is upregulated, making it a new possible therapeutic target. In this work, the bafilomycin A1 induced-inhibition of V-ATPase in patients-derived glioma stem cell (GSC) lines was evaluated together with temozolomide, the first-line line therapy against GBM. In contrast with previous published data, the proposed treatment did not overcome the resistance to the standard therapy. In addition, our data showed that nanomolar dosages of bafilomycin A1 lead to the blockage of the autophagy process and cellular necrosis, making the drug unusable in models that are more complex. Nevertheless, the increased expression of V-ATPase following bafilomycin A1 suggests a critical role of the proton pump in GBM stem component, encouraging the search for novel strategies to limit its activity in order to get around the resistance to the conventional therapy.
Keywords:
glioblastoma
; GBM
; glioma stem cells
; GSCs
; chemoresistance
; V-ATPase
; bafilomycin A1
; temozolomide
; autophagy process
1. Introduction
High grade gliomas are malignant primary brain tumors, among them, glioblastoma (GBM) is the most frequent. They account for 69% of all gliomas and for 12 - 15% of all primary brain tumors [1,2]. The current treatment consists of maximal safe surgical resection followed by concomitant chemo-radiotherapy [3,4,5]. First-line chemotherapy involves the administration of temozolomide (TMZ), an alkylating agent that induces a DNA damage in tumoral cells. This action is particularly effective in patients with an increased methylation level at the promoter of the DNA-repair enzyme O6-methylguanine-DNA methyltransferase (MGMT), thus configuring MGMT as a prognostic and predictive marker in GBM [6,7]. Patients with methylated MGMT are known to have the best overall survival among patients with GBM [6,7,8]. On the contrary, patients with low level of methylation of MGMT are known to have the worst overall survival, and this is due to a lower efficiency of the alkylating agents [5,7]. Although the recent addition of tumor-treating fields (TTF), as a first-line therapy, has proved to increase tumor local control, tumor recurrence is almost always expected, causing a poor outcome for patients [9]. Tumor recurrence is a consequence of the tumor’s high resistance to chemo-radiotherapy [10]. Several therapeutic options are under investigation, and probably future treatment for patients with GBM will involve tailored therapy based on molecular tumor features [11,12].
The vacuolar proton translocating ATPase (V-ATPase) is a cellular membrane multi-subunit proton pump that is involved in maintaining intracellular pH through an ATP-dependent transport of H+ from the cytoplasm to the extracellular environment and is also involved in the acidification of endosomes and lysosomes in eukaryotic cells [13,14,15,16]. It is made of a membrane-embedded V0 sector, which regulates proton permeability, and an enzymatic V1 ATPase sector [14,16,17]. In carcinogenesis, anaerobic glycolysis takes over as the primary metabolic pathway for neoplastic cells. This activity produces lactates and H+, although it can readily provide ATP through the consumption of glucose [17]. Lactate overproduction would cause the intracellular pH to drop and, as a result, trigger apoptotic events that would kill cancerous cells [18]. Under these conditions, it has been demonstrated that V-ATPase plays a critical function in restoring intracellular pH levels that support cellular self-renewal and counteracting the excess H+ generated [17]. Moreover, several authors have proposed that V-ATPase can be involved in drug-resistance by participating in drug extrusion from the intracellular environment [13,15]. Lastly, it is also thought that high H+ efflux causes the extracellular matrix to become acidic. This condition would allow a protonation of the drugs and, therefore, a lower entry into the tumor cells and, consequently, a lower effectiveness of the chemotherapy [15,19,20]. Inhibition of V-ATPase is supposed to be a therapeutic way to block the tumoral metabolic machinery that leads the cancerous cells to apoptosis and overcome drug-resistance [21].
GBM originates from stem cells that are called glioma stem cells (GSCs) and that are thought to be responsible for tumor self-maintenance, spreading, and resistance to adjuvant treatments [22,23]. Many biological mechanisms are thought to be involved in GBM drug and radio-resistance [23].
From previous studies, V-ATPase is known to be a key player in gliomagenesis, especially in isocitrate dehydrogenase 1 or 2 (IDH1 or IDH2) wild-type gliomas [24,25,26,27,28]. Moreover, V-ATPase is supposed to participate in the drug-resistance that characterizes high-grade gliomas, and it may be involved in the acidification of the glioma environment [26,29]. Finally, the expression of V-ATPase is associated with the glioma grade, with increasing expression proportionally to the tumor grade [29]. Although some experiences are reported in the literature, it is still poorly known how V-ATPase inhibitors could be administered to patients and what role they could play in a neuro-oncological setting (administrated as single chemotherapy agents or as combined or adjuvant therapy). For all of the above, finding, an in vitro model for V-ATPase inhibition would be of benefit to GBM patients in order to potentially plan a translation from the bench to the bed of the patient. This would be especially important for those patients with a low level of methylation of MGMT who nowadays lack an alternative therapeutic option to TMZ as a first-line treatment.
In this view, the aim of our work is to analyze the effects of V-ATPase inhibition by bafilomycin A1 (Baf) on patients’ derived GSC lines in order to characterize antitumoral effects, toxicities, and potential applications in vivo. Our data questioned the potential use of Baf alongside TMZ because of both the absence of efficacy in reverting TMZ resistance and the presence of a strong cytotoxicity of the drug already significant in GSC lines tested.
2. Results
2.1. Sensitivity of glioma stem cell lines to temozolomide in vitro is largely independent of MGMT promoter methylation
Temozolomide (TMZ) represents the first-line chemotherapy drug in glioblastoma (GBM) treatment. In order to assess the well-known resistance of the stem component to this standard drug [30], cytotoxicity assays were performed on three patient-derived glioma stem cell lines (GSC7, GSC22 and GSC23). Cells were treated with 100 and 200 µM TMZ for 48 and 72 h. No concentrations of TMZ were able to significantly reduce the cell viability at both time points (Figure 1).
The methylation status of the MGMT promoter is a favorable prognostic marker in GBM since it is correlated to chemosensitivity to the alkylating agent TMZ. In order to evaluate if the TMZ resistance observed in the GSC lines was correlated to MGMT methylation status, a quantitative CpG methylation analysis was performed by pyrosequencing. The analysis was executed both on the tumor core (TC) bulks and the derived GSC lines (Table 1).
The methylation status of MGMT promoter was preserved between the two types of sample, even if differences in methylation percentage were seen in TC-GSC pair number 7 and 22. Nevertheless, the methylation status did not correlate with the response to TMZ. Indeed, despite all the GSC lines being resistant to TMZ, two of them (GSC22 and GSC23) had the MGMT promoter hyper-methylated, and it would suggest a sensitive phenotype that instead was not observed.
These results showed that the methylation status of MGMT promoter is not the exclusive mechanism that regulates the chemoresistance of GBM to alkylating agents, like TMZ.
2.3. V-ATPase is overexpressed in tumor core bulks and GSC lines
Since the GSC lines are resistant to TMZ, finding new therapeutic targets hampering GBM progression and supporting TMZ therapy is necessary. Previous studies have shown that the vacuolar proton translocating ATPase (V-ATPase) could be a good therapeutic target for treating GBM given its role in gliomagenesis and its overexpression in high grade gliomas [25,28,29]. Therefore, the expression of ATP6V1G1, a subunit of the V1 sector of the H+ transporting pump, was evaluated in our cell lines. The ATP6V1G1 expression was assessed in the TC bulks by IHC using an anti-V-ATPase-G1 antibody. Even if all the samples expressed the protein, the levels of immunoreactivity were variable among them, TC7 had 70% of positive cells, TC22 40% and TC23 80% (Figure 2 a). The consultation of Gene Expression Profiling Interactive Analysis 2 (GEPIA2) platform proved the result in a larger cohort of GBM tissues where tumor specimens were compared to normal brain ones (Figure 2 b,c), suggesting once again V-ATPase’s potential role as therapeutic target.
We evaluated the V1G1 subunit expression in the derived GSC lines by western blotting analysis. No statistical difference was observed among the three GSC lines and the HCT116 colon cancer cell line, probably because of the wide variability observed in all the samples. HCT116 colon cancer cell line was used as positive control, since the subunit is known to be over-expressed also in colon cancers (Figure 3) [31]. GSC7 showed a good accordance with the high level of expression of V1G1 in the TC sample. This did not occur for the other two samples.
Finally, we checked the correct localization of the proton pump by immunofluorescence experiments on GSCs. Antibody positivity was visualized both on the plasma membrane and on internal membranes (data not shown). These results produce data in favor of the over-expression of the V-ATPase pump in GSC lines.
2.4. Nanomolar doses of bafilomycin A1 do not overcome temozolomide resistance in GSC lines
We wanted to evaluate if inhibition of V-ATPase pump could revert the TMZ resistance in GSC lines. In this regard, we selected bafilomycin A1 (Baf) as an inhibitor of V-ATPase since it is the first-line molecule identified with this purpose and it is efficient in a wide range of organisms at nanomolar concentrations [32]. Firstly, dose-response curves of nanomolar doses of Baf were tested for 48 h, in order to identify GSC line-specific sub-lethal dosage potentially effective in reverting the TMZ resistance (Figure 4).
With this intent, we arbitrarily selected for each GSC line the highest dose of Baf where the percentage of cell viability was ≥ 90% (GSC7 10 nM, GSC22 5 nM and GSC23 5 nM). Then, GSCs were co-treated for 48 h with Baf selected dose and TMZ 100 µM. We used two different treatment plans of drugs combination to identify the better way to potentially recover the resistance to TMZ: simultaneous administration for 48 hours (plan 1); 24 h Baf and then TMZ addition up to 48 h of treatment (plan 2) (Figure 5).
Results showed that the combination of sub-lethal doses of Baf with TMZ did not overcome the resistance of GSC lines to the alkylating agent in either of the two administration plans used. Subsequently, in order to assess whether the inefficiency of the proposed treatments was due to a low Baf dose, we repeated the treatments boosting the dose of Baf to 20 nM (Figure 6).
Generally, the viability of all the GSC lines was reduced after Baf administration, both in single or combined in the two plans of treatment, while the resistance to TMZ was confirmed for all of them. In particular, GSC7 showed a significant sensitivity only to the combination of Baf and TMZ with the plan 2. Conversely, GSC22 and GSC23 showed a significant sensitivity to Baf given both alone and in the two combination plans. Interestingly, the combined plan 1 and 2 showed benefits in terms of significant reduction of the cell viability. Indeed, plan 1 was effective in GSC22 and GSC23, while plan 2 in all of the three samples, if compared to the CTR DMSO. However, almost the same reduction of cell viability achieved by the combined treatments was obtained by administrating Baf alone.
2.5. Effect of bafilomycin A1 treatment on V-ATPase protein expression
In order to investigate a possible role of Baf on the V-ATPase protein expression we assessed through western blotting its level after 48 h of treatment. Interestingly the protein level of the V1G1 subunit significantly increased at both the doses used (20 nM and 40 nM) compared with the untreated condition (CTR DMSO) in the three GSC lines. In addition no differences were highlighted between the two drug doses (Figure 7).
2.6. Autophagy pathway in GSC lines is blocked by bafilomycin A1
Since it is known that, at micromolar doses, Baf inhibits the late stages of autophagy pathway [33], we investigated this mechanism to explain the cytotoxic effect observed with Baf nanomolar doses. We used LC3I and LC3II as markers of autophagy, since during autophagy, LC3I is converted to the lipidated form LC3II, which is subsequently degraded in the final step of the pathway [34]. The protein levels of LC3I and LC3II in GSC lines after Baf 20 nM and 40 nM treatments for 48 h were compared to the untreated condition (CTR DMSO) (Figure 8 a).
Firstly, once again a wide intra-sample variability was observed in all the three GSC lines. At both drug doses all the GSC lines showed an accumulation of LC3II in comparison to the loading control (vinculin). The results were statistically significant compared to CTR DMSO, indicating that treatment with Baf prevents LC3II degradation (Figure 8 b). Secondly, the LC3II/LC3I ratio increases were observed in all the GSC lines after the exposure to the drug at both doses (Figure 8 c). These results suggest that nanomolar doses of Baf inhibit the late stages of autophagy in GSC lines.
2.7. Bafilomycin A1 induces necrosis in GSC lines
Flow cytometry analysis was performed to assess cell death induced by 20 nM Baf as single or combined treatment. For this analysis we selected the combined treatment performed at different time (plan 2, as described before), since it is efficient in all the three lines as previously shown in cytotoxicity assays. The percentage of viable, early apoptotic and late apoptotic/necrotic cells, was determined by Annexin V/Propidium Iodide staining. The basal level of viability (CTR DMSO) varied among the GSC lines, ranging from 69,7% to 77,8% (Figure 9). Furthermore, all the GSC lines confirmed their resistance to TMZ showing percentage of alive cells similar to the ones of their own control (Figure 10).
In TMZ treated GSC7 and GSC22 samples, the cytotoxicity seemed to be related to late apoptosis/secondary necrosis; while in TMZ treated GSC23 line there was also a necrotic cell death component. The Baf treatment caused in GSC7 cells mainly necrosis; this latter process was equally balanced with late apoptosis/secondary necrosis in GSC22 and GSC23 samples (Figure 9). Considering plan 2, the cytotoxic effects observed for each GSC lines seemed to be the combination of the cellular death pathways caused by the single drugs.
3. Discussion
Glioblastoma (GBM) remains a tumor with poor prognosis. Nowadays, progression free survival and overall survival are obtained with maximal safe surgical resection followed by adjuvant concomitant chemo-radiotherapy followed by adjuvant chemotherapy and tumor-treating fields [9].
In this scenario, the median progression free survival is 6.7 months and median overall survival is 20.9 months [9]. Such poor chances of survival are due to resistance of GBM to chemo-radiotherapy. In addition, the presence of a stem component inside GBM, naturally resistant to the conventional therapies and responsible of the tumor maintenance and progression, further complicates finding efficient therapies [35].
Nevertheless, an improvement of the median overall survival to 31.6 months is achieved by patients with a hyper-methylation on the promoter of the MGMT. Indeed the reduced expression of MGMT, main chemoresistance factor of GBM, increases the responsiveness of the patients to temozolomide (TMZ) [9,36]. The troubling phenomenon of TMZ resistance remains a long-standing issue since it has been demonstrated that MGMT is not the unique mechanism of drug-resistance and because the insidious glioma stem cells component is the main character of this problem [37]. Therefore, survival data on patients sensitized to alkylating agents encourage research to find novel therapeutic approaches that overcome resistance to alkylating agents eliminating both the entire tumor bulk and also glioma stem cells (GSC) [38,39].
In order to address this clinical challenge, using in vitro model based on glioma stem cells derived from patients could be a good chance to study what happens in clinics and it represents a good way to conduct a first-line screening of new potential therapeutic approaches. Not to mention that cultures derived from patients maintain the heterogeneous scenario characteristic of the tumor, which is fundamental to understanding the cancer biology and finding effective strategies to eradicate it.
With these in mind, in this study we used three patient-derived glioma stem cell lines to test a new approach to overcome the resistance to the conventional therapy. We firstly showed that patient-derived GSC were resistant to the standard treatment with TMZ as already highlighted in the literature [35].
In all the GSC lines, the methylation percentage of the MGMT promoter increased in comparison to the tumor bulks by which they originated. Nevertheless, none of them were found to be sensitive to the drug in vitro. This data proved once again that MGMT is not the only mechanism of drug-resistance in GBM, though it is the most studied. In fact, the cytotoxic action of TMZ is limited by an alteration in the mismatch-repair (MMR) complex, which, if not impaired, leads to cell cycle arrest and apoptosis, recognizing mis-paired DNA [40,41]. Another drug-resistance mechanism might be related to the vacuolar proton translocating ATPase (V-ATPase), a multi-subunit proton pump localized on both the cell membrane and intracellular organelles’ membranes. In previous works, V-ATPase has been demonstrated to be overexpressed in gliomas according to their grade and has been supposed to be involved in gliomagenesis and glioma aggressiveness [25,28,29]. Its physiological role is to control the proton efflux through the cellular membranes in order to maintain a normal intracellular pH and acidify the endosomes for their activation [42]. Through its activity, V-ATPase modifies the tumor microenvironment and consequently enhancing drug-resistance mechanism. On one hand, with the intent of contrasting the excessive production of lactates caused by the glycolytic metabolism of the tumor cells, the extracellular space gets more acidic, which leads to the protonation and inactivation of the drugs [17,20]. Also, V-ATPase can act as ATP-binding cassettes (ABC) transporters that hamper the delivery of the drugs throughout the membrane [29,43]. Such premises are quite relevant since, in recent years, new research strategies have aimed to revert the resistance to TMZ using the so-called “TMZ enhancers”, drugs and molecules that contrast the resistance mechanism in order to increase the action of the first-line treatment [44,45]. Based on this, once we assessed the resistance of the patient-derived glioma stem cell lines to TMZ, our intent was to use bafilomycin A1 (Baf) as a “TMZ-enhancer”, inhibiting the V-ATPase. Our idea was supported by previous studies, where the combination of TMZ and a low dose of Baf (10 nM) resulted in reduced cellular viability of the GBM cells [29,46]. We firstly demonstrated the overexpression of the V-ATPase in GBM tissue of patients. Then we verified if the stem component preserved or not this characteristic, and we observed that only one sample had an increased level of V-ATPase both in the tumor tissue and in the derived stem line. In order to circumvent the well-known toxicity of Baf [47], the effects of customized dosages of Baf were then investigated in conjunction with TMZ, taking into account that each GSC line expressed varying quantities of the target. Contrary to what expected from the literature, none of the lines showed a reduction in cell viability after the treatment, neither by giving the drugs simultaneously nor at different times. Even increasing the dosages of Baf to 20 nM, the combination with TMZ was not effective. This result might be related to the fact that GSC can develop multiple drug-resistance strategies in order to reduce chemotherapy effects [48], while the effectiveness of the combined treatment reported in the literature, for example by Kanzawa, was obtained by treating the not-stem component of the tumor [46]. Also, we hypothesized that the inhibition of the V-ATPase by nanomolar dosages of Baf might be deleterious for stem cells, which would increase the expression of the pump as a consequence. The overexpression of the target is one of the mechanisms adopted to escape the action of a drug [49]. Interestingly, we evaluated the expression levels of the V-ATPase, and we observed a general increase of the pump’s level in all the lines after the treatment, supporting our hypothesis.
Even if this result might confirm the role of the V-ATPase pump in the drug-resistance phenotype of the GSCs, it also shows an important limit of using Baf. In fact, in-depth investigations on the effect of Baf treatment on the glioma stem cells proved the cytotoxicity of the drug, even if used at low nanomolar dosages. According to a 2015 study by Yuan and colleagues, administering modest dosages of Baf selectively inhibits V-ATPase while having no effect on the autophagy pathway [33]. Here, we observed a global blockage of the autophagy in all the samples after treatment with 20 nM Baf. In addition, the activation of necrotic processes at different levels was evidenced. This data suggests two hypotheses: maybe the toxicity is determined by the dosages of the treatment, so changing one or both factors could avoid an unspecified death; on the other hand, in our model, Baf may have off-targets whose inhibition finally leads to an unexpected necrosis. In fact, it is reported that Baf mainly induces apoptotic processes via increasing the production of ROS and not necrotic ones, as observed in our study [43].
In conclusion, our study questioned the previous studies where the combination of Baf with TMZ was effective, maybe because they mostly focused on the not-stem component of GBM. On the one hand, our data pointed out the possible presence of other mechanisms of drug-resistance conserved in the stem component of the tumor. On the other hand, the Baf treatment performed in this study cannot be applicable to a more complex model, since the cytotoxicity of the drug is already evident in the cellular model.
4. Materials and Methods
4.1. Patient-derived specimens
The collection of patient-derived specimens was part of the study approved by the ethic committee “Comitato Etico Monza e Brianza” (study number: 0031436—GLIODRUG-V, approved on 3 January 2020).
Tumor biopsies were collected from patients undergoing a craniotomy for a high-grade glioma at the Neurosurgery Unit of the Fondazione IRCCS San Gerardo dei Tintori (Monza Brianza, Italy) after the informed consent was signed. The diagnosis for glioblastoma (GBM) was based on the recommendations of the 2021 WHO classification of CNS tumors [1]. The immuno-molecular phenotype and the genomic profile of each biopsy was published in Giambra et al. 2021 [50].
GSC7, GSC22 and GSC23 were isolated from tumor biopsies thanks to a protocol developed in Giambra et al. 2021 where their stemness characteristic and genomic profile were assessed as well. The culturing conditions were also described in Giambra et al. 2021 [50].
4.2. Cytotoxicity assay
Cell viability assays were performed after temozolomide (TMZ) (Sigma-Aldrich, St. Louis, MI, USA) and bafilomycin A1 (Baf) (Sigma-Aldrich, St. Louis, MI, USA) administration using Cell Counting Kit-8 (CCK-8) (Sigma-Aldrich, St. Louis, MI, USA), following the manufacturer’s instructions. TMZ and Baf were dissolved in DMSO (Euroclone S.p.A., Milan, Italy) at a 50 mM and 50 µM stock solution, respectively.
Briefly, GSC lines were plated in a 96-well plate at a density ranging from 15,000 to 20,000 cells per well. Once 70% of growth confluency was achieved, cells were treated with variable concentration of TMZ and Baf for 48 h or 72 h, alone or in combination (simultaneous administration for 48 hours - plan 1; 24 h Baf and then TMZ addition up to 48 h of treatment - plan 2). Cells treated with DMSO (drug vehicle) were used as control. At the end of the treatment, CCK-8 solution was added to each well of the plate and incubated at 37 °C for 4 h. The absorbance of each well was measured at 450 nm using a microplate reader (TECAN Infinite 200 Pro). Cell viability percentage was calculated dividing the treatment average absorbance by the control average absorbance, and multiplying per 100. For each sample, at least three independent experiments were performed.
4.3. MGMT Methylation Analysis
The analysis in the tumor bulks was performed as reported in Marchi et al. 2019 [51], as part of clinical diagnosis. Pyrosequencing experiments on the derived GSC lines were performed following the indications reported in Malacrida et al. 2022 [52] by Pyro Mark ID instrument in the PSQ HS 96 System (Biotage AB, Uppsala, Sweden), according to the manufacturer’s instructions. Raw data were analyzed using the Q-CpG software v1.0.9 (Biotage AB, Uppsala, Sweden). For each sample, the methylation value represents the mean between two independent PCR and pyrosequencing experiments.
4.4. Immunohistochemistry
V1G1 subunit expression was evaluated by immunohistochemistry (IHC) on paraffin-embedded GBM patients’ tissues. EnVision FLEX - High pH kit (Agilent Technologies, Santa Clara, CA, USA) with Dako Omnis (Agilent Technologies, Santa Clara, CA, USA) was used following the manufacturer’s instructions. Briefly, the automated protocol involves a first cycle of deparaffinization followed by antigenic heat unmasking with high pH EnV Flex TRS reagent and distilled water (dH2O). After the incubation of the primary antibody AntiV-ATPase-G1 (D5) (Santa Cruz Biotechnology, Santa Cruz, CA, USA, dilution 1:100) and the blockage of endogenous enzymes with Env Flex Perox/Blocking Agent, the labeled polymer was supplied (EnVision FLEX/HRP). Then, the chromogenic substrate EnVision Flex Substrate was added, followed by nuclear counterstaining with hematoxylin. In the end, sample images were acquired with an Olympus microscope and CellSens Entry software (Evident Scientific Olympus). The percentage of positive cells was calculated counting the number of positive cells out of 100 cells in 3 independent sections.
4.5. Gene Expression Profiling Interactive Analysis 2 platform consultation
Gene Expression Profiling Interactive Analysis 2 (GEPIA2) (http://gepia.cancer-pku.cn, Zhang Lab, Peking University, Beijing, China, last access date: 30 May 2023) [53] platform was used to evaluate the expression of V1G1 subunit in GBM. The platform exploits RNA sequencing data from the The Cancer Genome Atlas (TCGA) and the Genotype Tissue Expression (GTEx) projects in order to compare the V1G1 expression in GBM and in normal brain tissue. RNA sequencing data were analysed using the parameter log10 (TPM+1) (transcripts per kilobase of exon model per million mapped reads).
4.6. Western blotting
V1G1 and LC3I/II protein levels were investigated both at untreated condition and after 48 h of treatment with 20 nM and 40 nM of Baf in GSC7, GSC22 and GSC23 lines. Cells treated with DMSO (drug vehicle) were used as control. Alpha-tubulin and vinculin were used as loading control. Briefly, after the extraction, the same amount of proteins for each condition were separated by electrophoresis using 4-12% acrylamide Bolt Bis-Tris gels (ThermoFisher Scientific, Waltham, MA, USA), as concern V1G1 experiments, and 14% gradient Trys-Glycin precast gel (Invitrogen, ThermoFisher Scientific, Waltham, MA, USA), as concern LC3I/II experiments, and transferred on nitrocellulose membrane for V1G1 experiments and on PVDF membrane for LC3I/II experiments. Membranes were incubated with the primary monoclonal antibodies: antiV-ATPase-G1 (D5) produced in mouse (Santa Cruz Biotechnology, Santa Cruz, CA, USA, dilution 1:100), LC3I/II produced in rabbit (Cell Signaling Technology, dilution 1:1000), anti-α-tubulin produced in rabbit (Cell Signaling Technology, Davers, MA, USA, dilution 1:1000), and anti-vinculin V284 produced in mouse (Merk Millipore, Burlington, MA, USA, dilution 1:5000). The secondary antibodies were: anti-mouse IgG-HRP produced in goat (ThermoFisher Scientific, Waltham, MA, USA, dilution 1:10000) and anti-rabbit IgG-HRP produced in monkey (ThermoFisher Scientific, Waltham, MA, USA, dilution 1:10000) were used in V1G1 experiments; and anti-rabbit NA934V (Sigma-Aldrich, St. Louis, MI, USA, dilution 1:5000) and anti-mouse NA931 (Sigma-Aldrich, St. Louis, MI, USA, dilution 1:5000), were used in LC3I/II experiments. The detection was made throughout the Enhanced Chemiluminescence assay (ECL). Images were acquired with Amersham Imager 600 (GE Healthcare, Milan, Italy) and Gbox iChem, using software GeneSys. Bands were finally quantified with ImageQuantTL (GE Healthcare, Milan, Italy). For each condition, three different biological replicates were analyzed.
4.7. Flow cytometry
In order to assess cell death after 48 h of treatment with 100 μM of TMZ alone, 20 nM of Baf alone and in combination at deferred time, the FITC-conjugated Annexin V - propidium iodide (PI) apoptosis detection kit (BD Biosciences, Buccinasco, Italy) was used according to the manufacturer’s instructions. Cells treated with the highest concentration of DMSO (drug vehicle) for each experimental setting were used as control. Briefly, cells were seeded in 6-wells plate at a density ranging from 400,000 to 600,000 cells per well, once 70% confluence was achieved, the treatment was administered. At the end of the treatment, both floating and attached cells were harvested, washed with PBS and, finally, suspended in a binding buffer containing Annexin V and PI. After 15-min incubation in the dark, the presence of apoptotic cells was analysed by the FACSCantoI flow cytometer (BD Biosciences, Buccinasco, Italy). At least 10,000 events / sample were acquired in an operator defined region on a forward scatter – side scatter dot plot. The relative percentage of live/dead cells were assessed on an Annexin-V/PI dot using FacsDiva software.
4.8. Statistical analysis
In cytotoxicity assays, data were represented as mean ± S.D. of at least three independent experiments; paired t-test was performed as statistical analysis on the raw data. Gene expression data from the TCGA and GTEx databases using GEPIA2 platform were analyzed using one-way ANOVA. In western blotting, data were represented as mean ± S.D. of three different biological replicates; paired t-test was performed as statistical analysis on ratios. Analysis of flow cytometry data were represented as mean ± S.D. of three independent experiments; paired t-test was performed as statistical analysis on the raw data. In all the experiments p < 0.05 was considered the minimum statistically significant p value; in GEPIA2 analysis p < 0.01 was considered the minimum statistically significant p value.
Author Contributions
Conceptualization, M.G., A.D.C. and A.B.; data curation, M.G., A.D.C., D.F., M.B. and A.B.; formal analysis, M.G., F.R., R.R., D.C., G.Chiarello, S.M.T.; investigation, M.G., M.B., D.F. and A.B.; methodology, M.G., L.A.; resources, G.N., G.Carrabba., M.L. and A.B.; writing—original draft preparation, M.G., G.Carrabba and A.D.C.; writing—review and editing, M.G., A.D.C., G. Carrabba, C.G., R.R., F.R., S.M.T., L.A., G.N. and A.B.; visualization, M.G.; supervision, M.G., A.D.C. and A.B.; project administration, M.L., C.G, G.Carrabba. and A.B; funding acquisition, M.L. and A.B. All authors have read and agreed to the published version of the manuscript.
Funding
This research was funded by 2021-ATE-0404 grant from the University of Milano-Bicocca (to Angela Bentivegna); by Horizon 2020 Project number: 874719, Project acronym: Instand-NGS4P (to Marialuisa Lavitrano); Fondazione Giovanni Celeghin (www.fondazioneceleghin.it) (to Gabriella Nicolini).
Institutional Review Board Statement
The study was conducted in accordance with the Declaration of Helsinki, and approved by the Ethics Committee of “Comitato Etico della provincia Monza e Brianza” (study GLIODRUG-V, approved on 3 January 2020).
Informed Consent Statement
Informed consent was obtained from all subjects involved in the study.
Data Availability Statement
The data used to support the findings of this study are available from the corresponding author upon request.
Acknowledgments
The authors would like to express their very great appreciation to Virginia Rodriguez-Menendez, Eleonora Messuti, Melissa Zambuto, Matilde Marzorati and Roberto Paludi for their support in data collection.
Conflicts of Interest
The authors declare no conflicts of interest.
References
- Louis, D.N.; Perry, A.; Wesseling, P.; Brat, D.J.; Cree, I.A.; Figarella-Branger, D.; Hawkins, C.; Ng, H.K.; Pfister, S.M.; Reifenberger, G.; et al. The 2021 WHO Classification of Tumors of the Central Nervous System: A Summary. Neuro Oncol 2021, 23, 1231–1251. [Google Scholar] [CrossRef]
- Ostrom, Q.T.; Cote, D.J.; Ascha, M.; Kruchko, C.; Barnholtz-Sloan, J.S. Adult Glioma Incidence and Survival by Race or Ethnicity in the United States From 2000 to 2014. JAMA Oncol 2018, 4, 1254–1262. [Google Scholar] [CrossRef] [PubMed]
- De Witt Hamer, P.C.; Robles, S.G.; Zwinderman, A.H.; Duffau, H.; Berger, M.S. Impact of Intraoperative Stimulation Brain Mapping on Glioma Surgery Outcome: A Meta-Analysis. J Clin Oncol 2012, 30, 2559–2565. [Google Scholar] [CrossRef] [PubMed]
- Molinaro, A.M.; Hervey-Jumper, S.; Morshed, R.A.; Young, J.; Han, S.J.; Chunduru, P.; Zhang, Y.; Phillips, J.J.; Shai, A.; Lafontaine, M.; et al. Association of Maximal Extent of Resection of Contrast-Enhanced and Non-Contrast-Enhanced Tumor With Survival Within Molecular Subgroups of Patients With Newly Diagnosed Glioblastoma. JAMA Oncol 2020, 6, 495–503. [Google Scholar] [CrossRef] [PubMed]
- Stupp, R.; Mason, W.P.; van den Bent, M.J.; Weller, M.; Fisher, B.; Taphoorn, M.J.B.; Belanger, K.; Brandes, A.A.; Marosi, C.; Bogdahn, U.; et al. Radiotherapy plus Concomitant and Adjuvant Temozolomide for Glioblastoma. N Engl J Med 2005, 352, 987–996. [Google Scholar] [CrossRef]
- Hegi, M.E.; Diserens, A.-C.; Gorlia, T.; Hamou, M.-F.; de Tribolet, N.; Weller, M.; Kros, J.M.; Hainfellner, J.A.; Mason, W.; Mariani, L.; et al. MGMT Gene Silencing and Benefit from Temozolomide in Glioblastoma. N Engl J Med 2005, 352, 997–1003. [Google Scholar] [CrossRef]
- Stupp, R.; Hegi, M.E.; Mason, W.P.; van den Bent, M.J.; Taphoorn, M.J.B.; Janzer, R.C.; Ludwin, S.K.; Allgeier, A.; Fisher, B.; Belanger, K.; et al. Effects of Radiotherapy with Concomitant and Adjuvant Temozolomide versus Radiotherapy Alone on Survival in Glioblastoma in a Randomised Phase III Study: 5-Year Analysis of the EORTC-NCIC Trial. Lancet Oncol 2009, 10, 459–466. [Google Scholar] [CrossRef] [PubMed]
- Hegi, M.E.; Genbrugge, E.; Gorlia, T.; Stupp, R.; Gilbert, M.R.; Chinot, O.L.; Nabors, L.B.; Jones, G.; Van Criekinge, W.; Straub, J.; et al. MGMT Promoter Methylation Cutoff with Safety Margin for Selecting Glioblastoma Patients into Trials Omitting Temozolomide: A Pooled Analysis of Four Clinical Trials. Clin Cancer Res 2019, 25, 1809–1816. [Google Scholar] [CrossRef]
- Stupp, R.; Taillibert, S.; Kanner, A.; Read, W.; Steinberg, D.; Lhermitte, B.; Toms, S.; Idbaih, A.; Ahluwalia, M.S.; Fink, K.; et al. Effect of Tumor-Treating Fields Plus Maintenance Temozolomide vs Maintenance Temozolomide Alone on Survival in Patients With Glioblastoma: A Randomized Clinical Trial. JAMA 2017, 318, 2306–2316. [Google Scholar] [CrossRef]
- Giambra, M.; Di Cristofori, A.; Valtorta, S.; Manfrellotti, R.; Bigiogera, V.; Basso, G.; Moresco, R.M.; Giussani, C.; Bentivegna, A. The Peritumoral Brain Zone in Glioblastoma: Where We Are and Where We Are Going. J Neurosci Res 2023, 101, 199–216. [Google Scholar] [CrossRef]
- Ranjan, T.; Howard, C.M.; Yu, A.; Xu, L.; Aziz, K.; Jho, D.; Leonardo, J.; Hameed, M.A.; Karlovits, S.M.; Wegner, R.E.; et al. Cancer Stem Cell Chemotherapeutics Assay for Prospective Treatment of Recurrent Glioblastoma and Progressive Anaplastic Glioma: A Single-Institution Case Series. Transl Oncol 2020, 13, 100755. [Google Scholar] [CrossRef] [PubMed]
- Ranjan, T.; Sengupta, S.; Glantz, M.J.; Green, R.M.; Yu, A.; Aregawi, D.; Chaudhary, R.; Chen, R.; Zuccarello, M.; Lu-Emerson, C.; et al. Cancer Stem Cell Assay-Guided Chemotherapy Improves Survival of Patients with Recurrent Glioblastoma in a Randomized Trial. Cell Rep Med 2023, 4, 101025. [Google Scholar] [CrossRef]
- Fais, S.; De Milito, A.; You, H.; Qin, W. Targeting Vacuolar H+-ATPases as a New Strategy against Cancer. Cancer Res 2007, 67, 10627–10630. [Google Scholar] [CrossRef]
- Forgac, M. A New Twist to V-ATPases and Cancer. Oncotarget 2018, 9, 31793–31794. [Google Scholar] [CrossRef]
- Luciani, F.; Spada, M.; De Milito, A.; Molinari, A.; Rivoltini, L.; Montinaro, A.; Marra, M.; Lugini, L.; Logozzi, M.; Lozupone, F.; et al. Effect of Proton Pump Inhibitor Pretreatment on Resistance of Solid Tumors to Cytotoxic Drugs. J Natl Cancer Inst 2004, 96, 1702–1713. [Google Scholar] [CrossRef] [PubMed]
- McGuire, C.; Cotter, K.; Stransky, L.; Forgac, M. Regulation of V-ATPase Assembly and Function of V-ATPases in Tumor Cell Invasiveness. Biochim Biophys Acta 2016, 1857, 1213–1218. [Google Scholar] [CrossRef] [PubMed]
- Stransky, L.; Cotter, K.; Forgac, M. The Function of V-ATPases in Cancer. Physiol Rev 2016, 96, 1071–1091. [Google Scholar] [CrossRef]
- Pérez-Sayáns, M.; Somoza-Martín, J.M.; Barros-Angueira, F.; Rey, J.M.G.; García-García, A. V-ATPase Inhibitors and Implication in Cancer Treatment. Cancer Treat Rev 2009, 35, 707–713. [Google Scholar] [CrossRef]
- Rofstad, E.K.; Mathiesen, B.; Kindem, K.; Galappathi, K. Acidic Extracellular pH Promotes Experimental Metastasis of Human Melanoma Cells in Athymic Nude Mice. Cancer Res 2006, 66, 6699–6707. [Google Scholar] [CrossRef]
- Guo, Y.; Wang, M.; Zou, Y.; Jin, L.; Zhao, Z.; Liu, Q.; Wang, S.; Li, J. Mechanisms of Chemotherapeutic Resistance and the Application of Targeted Nanoparticles for Enhanced Chemotherapy in Colorectal Cancer. Journal of Nanobiotechnology 2022, 20, 371. [Google Scholar] [CrossRef]
- Asgharzadeh, M.R.; Barar, J.; Pourseif, M.M.; Eskandani, M.; Jafari Niya, M.; Mashayekhi, M.R.; Omidi, Y. Molecular Machineries of pH Dysregulation in Tumor Microenvironment: Potential Targets for Cancer Therapy. Bioimpacts 2017, 7, 115–133. [Google Scholar] [CrossRef]
- D’Alessio, A.; Proietti, G.; Sica, G.; Scicchitano, B.M. Pathological and Molecular Features of Glioblastoma and Its Peritumoral Tissue. Cancers (Basel) 2019, 11, 469. [Google Scholar] [CrossRef]
- Persano, L.; Rampazzo, E.; Della Puppa, A.; Pistollato, F.; Basso, G. The Three-Layer Concentric Model of Glioblastoma: Cancer Stem Cells, Microenvironmental Regulation, and Therapeutic Implications. ScientificWorldJournal 2011, 11, 1829–1841. [Google Scholar] [CrossRef]
- Bertolini, I.; Storaci, A.M.; Terrasi, A.; Di Cristofori, A.; Locatelli, M.; Caroli, M.; Ferrero, S.; Altieri, D.C.; Vaira, V. Interplay between V-ATPase G1 and Small EV-miRNAs Modulates ERK1/2 Activation in GBM Stem Cells and Non-Neoplastic Milieu. Mol Cancer Res 2020, 18, 1744–1754. [Google Scholar] [CrossRef]
- Bertolini, I.; Terrasi, A.; Martelli, C.; Gaudioso, G.; Di Cristofori, A.; Storaci, A.M.; Formica, M.; Braidotti, P.; Todoerti, K.; Ferrero, S.; et al. A GBM-like V-ATPase Signature Directs Cell-Cell Tumor Signaling and Reprogramming via Large Oncosomes. EBioMedicine 2019, 41, 225–235. [Google Scholar] [CrossRef]
- Grillon, E.; Farion, R.; Reuveni, M.; Glidle, A.; Rémy, C.; Coles, J.A. Spatial Profiles of Markers of Glycolysis, Mitochondria, and Proton Pumps in a Rat Glioma Suggest Coordinated Programming for Proliferation. BMC Res Notes 2015, 8, 207. [Google Scholar] [CrossRef]
- Qi, C.; Lei, L.; Hu, J.; Wang, G.; Liu, J.; Ou, S. Identification of a Five-Gene Signature Deriving from the Vacuolar ATPase (V-ATPase) Sub-Classifies Gliomas and Decides Prognoses and Immune Microenvironment Alterations. Cell Cycle 2022, 21, 1294–1315. [Google Scholar] [CrossRef] [PubMed]
- Terrasi, A.; Bertolini, I.; Martelli, C.; Gaudioso, G.; Di Cristofori, A.; Storaci, A.M.; Formica, M.; Bosari, S.; Caroli, M.; Ottobrini, L.; et al. Specific V-ATPase Expression Sub-Classifies IDHwt Lower-Grade Gliomas and Impacts Glioma Growth in Vivo. EBioMedicine 2019, 41, 214–224. [Google Scholar] [CrossRef]
- Di Cristofori, A.; Ferrero, S.; Bertolini, I.; Gaudioso, G.; Russo, M.V.; Berno, V.; Vanini, M.; Locatelli, M.; Zavanone, M.; Rampini, P.; et al. The Vacuolar H+ ATPase Is a Novel Therapeutic Target for Glioblastoma. Oncotarget 2015, 6, 17514–17531. [Google Scholar] [CrossRef] [PubMed]
- Auffinger, B.; Spencer, D.; Pytel, P.; Ahmed, A.U.; Lesniak, M.S. The Role of Glioma Stem Cells in Chemotherapy Resistance and Glioblastoma Multiforme Recurrence. Expert Rev Neurother 2015, 15, 741–752. [Google Scholar] [CrossRef] [PubMed]
- Supino, R.; Scovassi, A.I.; Croce, A.C.; Dal Bo, L.; Favini, E.; Corbelli, A.; Farina, C.; Misiano, P.; Zunino, F. Biological Effects of a New Vacuolar-H,-ATPase Inhibitor in Colon Carcinoma Cell Lines. Ann N Y Acad Sci 2009, 1171, 606–616. [Google Scholar] [CrossRef]
- Bowman, E.J.; Siebers, A.; Altendorf, K. Bafilomycins: A Class of Inhibitors of Membrane ATPases from Microorganisms, Animal Cells, and Plant Cells. Proc Natl Acad Sci U S A 1988, 85, 7972–7976. [Google Scholar] [CrossRef]
- Yuan, N.; Song, L.; Zhang, S.; Lin, W.; Cao, Y.; Xu, F.; Fang, Y.; Wang, Z.; Zhang, H.; Li, X.; et al. Bafilomycin A1 Targets Both Autophagy and Apoptosis Pathways in Pediatric B-Cell Acute Lymphoblastic Leukemia. Haematologica 2015, 100, 345–356. [Google Scholar] [CrossRef]
- Kabeya, Y.; Mizushima, N.; Ueno, T.; Yamamoto, A.; Kirisako, T.; Noda, T.; Kominami, E.; Ohsumi, Y.; Yoshimori, T. LC3, a Mammalian Homologue of Yeast Apg8p, Is Localized in Autophagosome Membranes after Processing. EMBO J 2000, 19, 5720–5728. [Google Scholar] [CrossRef]
- Eramo, A.; Ricci-Vitiani, L.; Zeuner, A.; Pallini, R.; Lotti, F.; Sette, G.; Pilozzi, E.; Larocca, L.M.; Peschle, C.; De Maria, R. Chemotherapy Resistance of Glioblastoma Stem Cells. Cell Death Differ 2006, 13, 1238–1241. [Google Scholar] [CrossRef]
- Verbeek, B.; Southgate, T.D.; Gilham, D.E.; Margison, G.P. O6-Methylguanine-DNA Methyltransferase Inactivation and Chemotherapy. Br Med Bull 2008, 85, 17–33. [Google Scholar] [CrossRef]
- Singh, N.; Miner, A.; Hennis, L.; Mittal, S. Mechanisms of Temozolomide Resistance in Glioblastoma - a Comprehensive Review. Cancer Drug Resist 2021, 4, 17–43. [Google Scholar] [CrossRef]
- Yalamarty, S.S.K.; Filipczak, N.; Li, X.; Subhan, M.A.; Parveen, F.; Ataide, J.A.; Rajmalani, B.A.; Torchilin, V.P. Mechanisms of Resistance and Current Treatment Options for Glioblastoma Multiforme (GBM). Cancers (Basel) 2023, 15, 2116. [Google Scholar] [CrossRef]
- Lin, K.; Gueble, S.E.; Sundaram, R.K.; Huseman, E.D.; Bindra, R.S.; Herzon, S.B. Mechanism-Based Design of Agents That Selectively Target Drug-Resistant Glioma. Science 2022, 377, 502–511. [Google Scholar] [CrossRef]
- Stritzelberger, J.; Distel, L.; Buslei, R.; Fietkau, R.; Putz, F. Acquired Temozolomide Resistance in Human Glioblastoma Cell Line U251 Is Caused by Mismatch Repair Deficiency and Can Be Overcome by Lomustine. Clin Transl Oncol 2018, 20, 508–516. [Google Scholar] [CrossRef]
- Zhang, J.; Stevens, M.F.G.; Bradshaw, T.D. Temozolomide: Mechanisms of Action, Repair and Resistance. Curr Mol Pharmacol 2012, 5, 102–114. [Google Scholar] [CrossRef]
- Collins, M.P.; Forgac, M. Regulation and Function of V-ATPases in Physiology and Disease. Biochim Biophys Acta Biomembr 2020, 1862, 183341. [Google Scholar] [CrossRef]
- Chen, F.; Kang, R.; Liu, J.; Tang, D. The V-ATPases in Cancer and Cell Death. Cancer Gene Ther 2022, 29, 1529–1541. [Google Scholar] [CrossRef]
- Jiapaer, S.; Furuta, T.; Tanaka, S.; Kitabayashi, T.; Nakada, M. Potential Strategies Overcoming the Temozolomide Resistance for Glioblastoma. Neurol Med Chir (Tokyo) 2018, 58, 405–421. [Google Scholar] [CrossRef]
- Ohmoto, A.; Yachida, S. Current Status of Poly(ADP-Ribose) Polymerase Inhibitors and Future Directions. Onco Targets Ther 2017, 10, 5195–5208. [Google Scholar] [CrossRef]
- Kanzawa, T.; Germano, I.M.; Komata, T.; Ito, H.; Kondo, Y.; Kondo, S. Role of Autophagy in Temozolomide-Induced Cytotoxicity for Malignant Glioma Cells. Cell Death Differ 2004, 11, 448–457. [Google Scholar] [CrossRef]
- Manabe, T.; Yoshimori, T.; Henomatsu, N.; Tashiro, Y. Inhibitors of Vacuolar-Type H(+)-ATPase Suppresses Proliferation of Cultured Cells. J Cell Physiol 1993, 157, 445–452. [Google Scholar] [CrossRef]
- Phi, L.T.H.; Sari, I.N.; Yang, Y.-G.; Lee, S.-H.; Jun, N.; Kim, K.S.; Lee, Y.K.; Kwon, H.Y. Cancer Stem Cells (CSCs) in Drug Resistance and Their Therapeutic Implications in Cancer Treatment. Stem Cells Int 2018, 2018, 5416923. [Google Scholar] [CrossRef]
- Palmer, A.C.; Kishony, R. Opposing Effects of Target Overexpression Reveal Drug Mechanisms. Nat Commun 2014, 5, 4296. [Google Scholar] [CrossRef]
- Giambra, M.; Messuti, E.; Di Cristofori, A.; Cavandoli, C.; Bruno, R.; Buonanno, R.; Marzorati, M.; Zambuto, M.; Rodriguez-Menendez, V.; Redaelli, S.; et al. Characterizing the Genomic Profile in High-Grade Gliomas: From Tumor Core to Peritumoral Brain Zone, Passing through Glioma-Derived Tumorspheres. Biology (Basel) 2021, 10, 1157. [Google Scholar] [CrossRef]
- Marchi, F.; Sahnane, N.; Cerutti, R.; Cipriani, D.; Barizzi, J.; Stefanini, F.M.; Epistolio, S.; Cerati, M.; Balbi, S.; Mazzucchelli, L.; et al. The Impact of Surgery in IDH 1 Wild Type Glioblastoma in Relation With the MGMT Deregulation. Front Oncol 2020, 9, 1569. [Google Scholar] [CrossRef] [PubMed]
- Malacrida, A.; Di Domizio, A.; Bentivegna, A.; Cislaghi, G.; Messuti, E.; Tabano, S.M.; Giussani, C.; Zuliani, V.; Rivara, M.; Nicolini, G. MV1035 Overcomes Temozolomide Resistance in Patient-Derived Glioblastoma Stem Cell Lines. Biology (Basel) 2022, 11, 70. [Google Scholar] [CrossRef] [PubMed]
- Tang, Z.; Kang, B.; Li, C.; Chen, T.; Zhang, Z. GEPIA2: An Enhanced Web Server for Large-Scale Expression Profiling and Interactive Analysis. Nucleic Acids Res 2019, 47, W556–W560. [Google Scholar] [CrossRef] [PubMed]
Figure 1.
Cytotoxicity assay by Cell Counting Kit-8 (CCK-8) of glioma stem cell lines (GSC) 7, 22 and 23 treated for 48 h (a) and 72 h (b) with temozolomide (TMZ) (100 and 200 µM). Data were represented as the mean percentage of three independent experiments ± S.D. compared to control (CTR DMSO, vehicle control) arbitrarily set to 100%. Statistical analysis was performed on raw data.
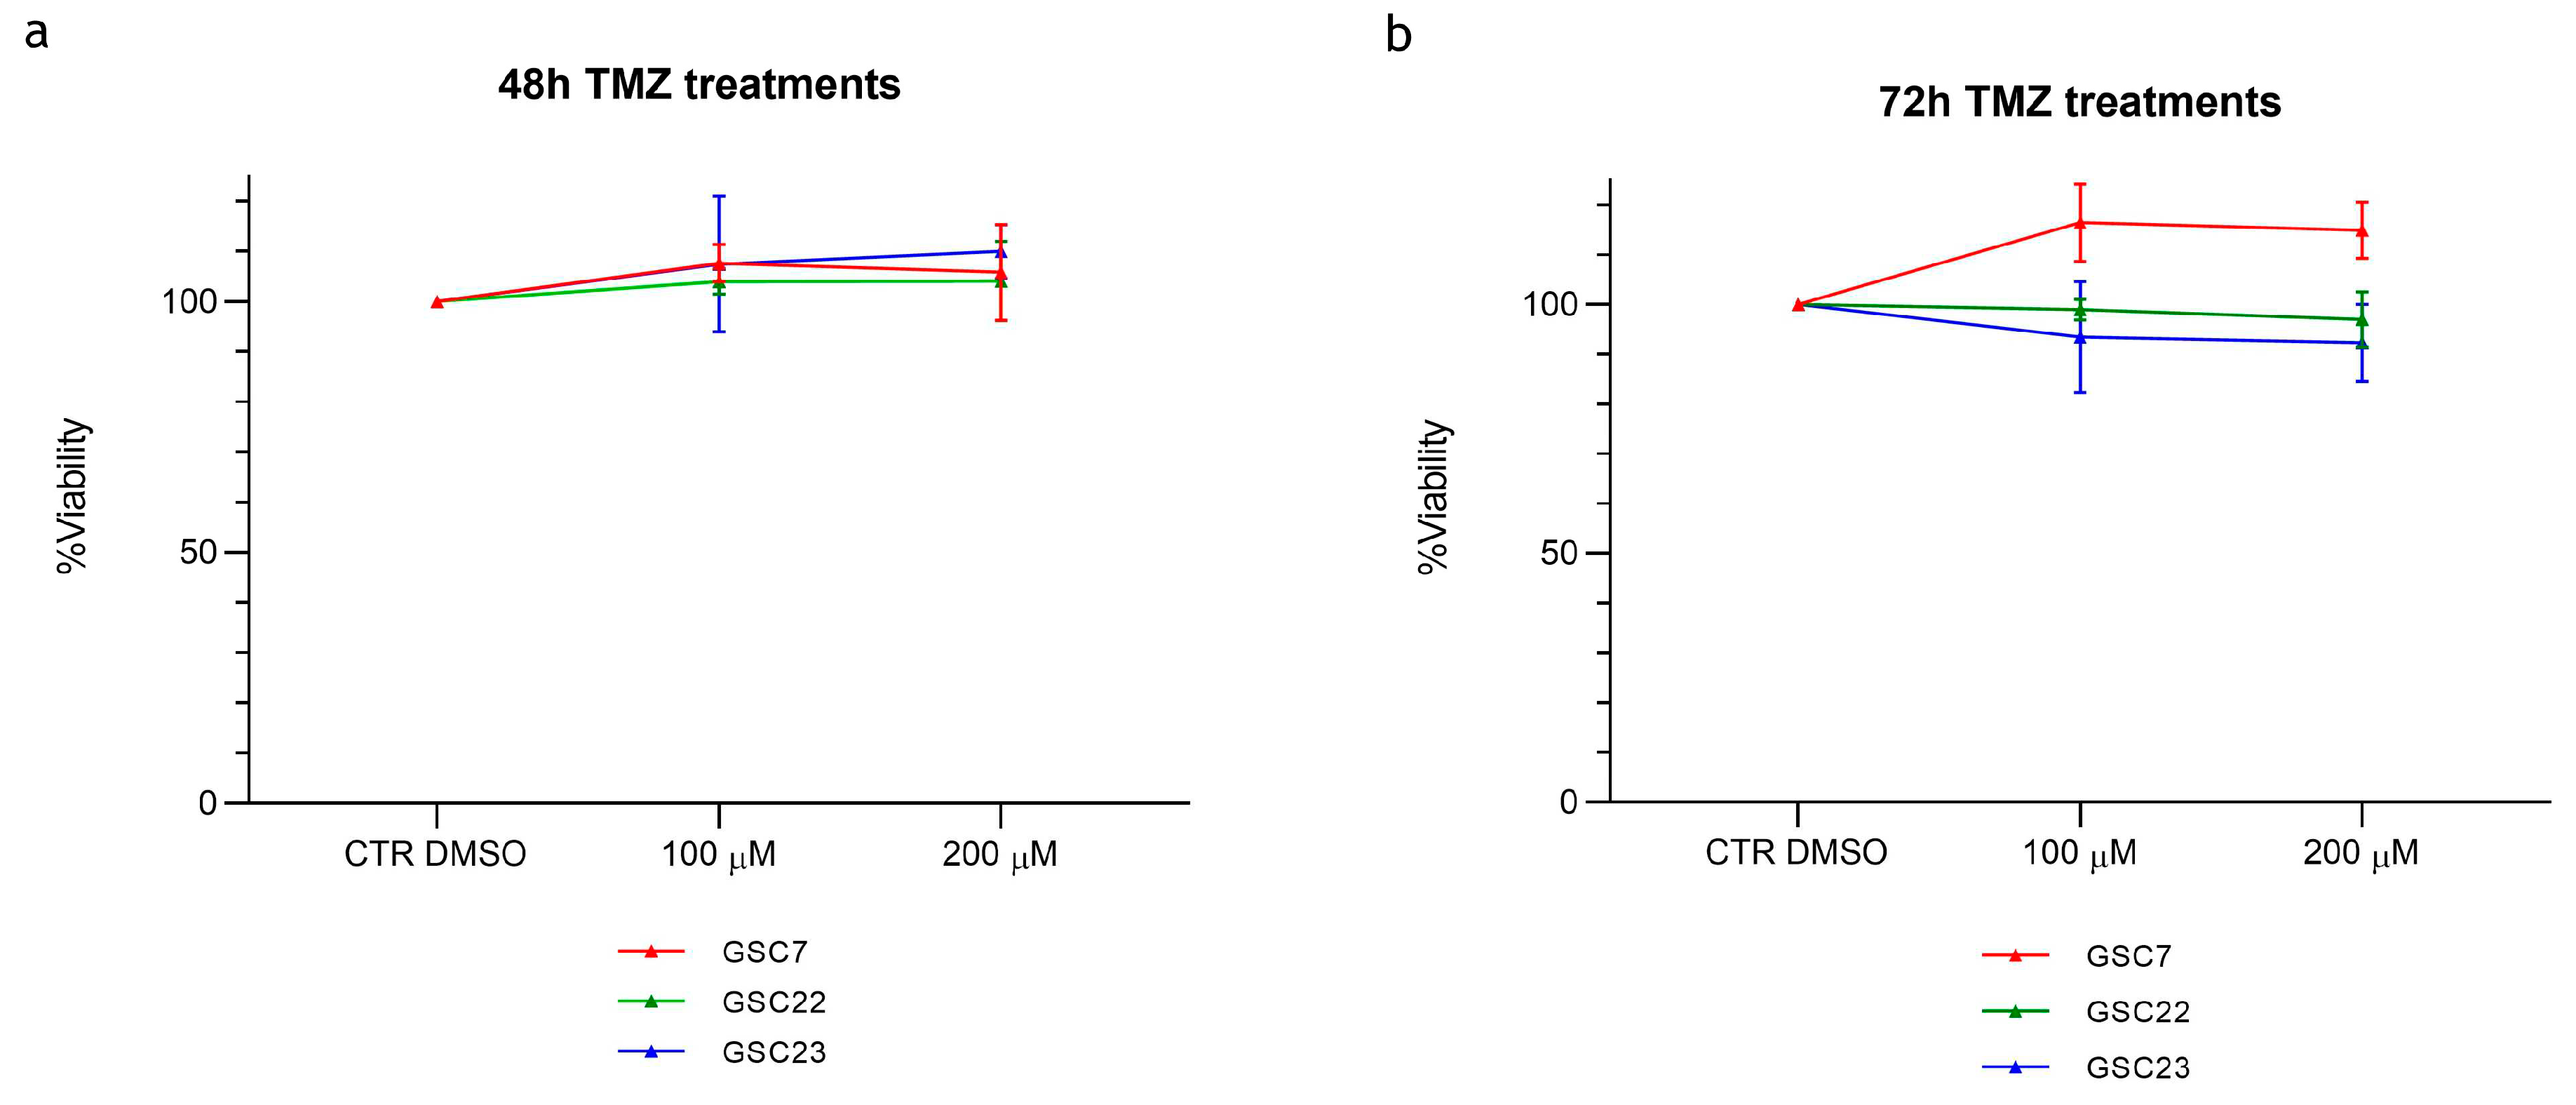
Figure 2.
Expression of V-ATPase V1-G1 subunit in glioblastoma. (a) Immunohistochemistry on tumor core (TC) formalin-fixed, paraffin-embedded (FFPE) specimens: anti- V-ATPase-G1 (brown signal) and haematoxylin nuclear staining (blue signal). Images were captured at 20X magnification. Unit of measurement bar = 20 µm. (b) Differential ATP6V1G1 expression between glioblastoma (GBM) and normal brain tissue by GEPIA2 platform. Box-plot showed different expression levels between GBM (163 cases) and normal brain tissues (207 cases). The Red box indicates GBM and the grey box indicates normal brain tissue. TPM: transcripts per kilobase of exon model per million mapped reads. ** p < 0.01. (c) The median expression of ATP6V1G1 mRNA in GBM and normal brain tissue expressed in TPM was reported in the table.
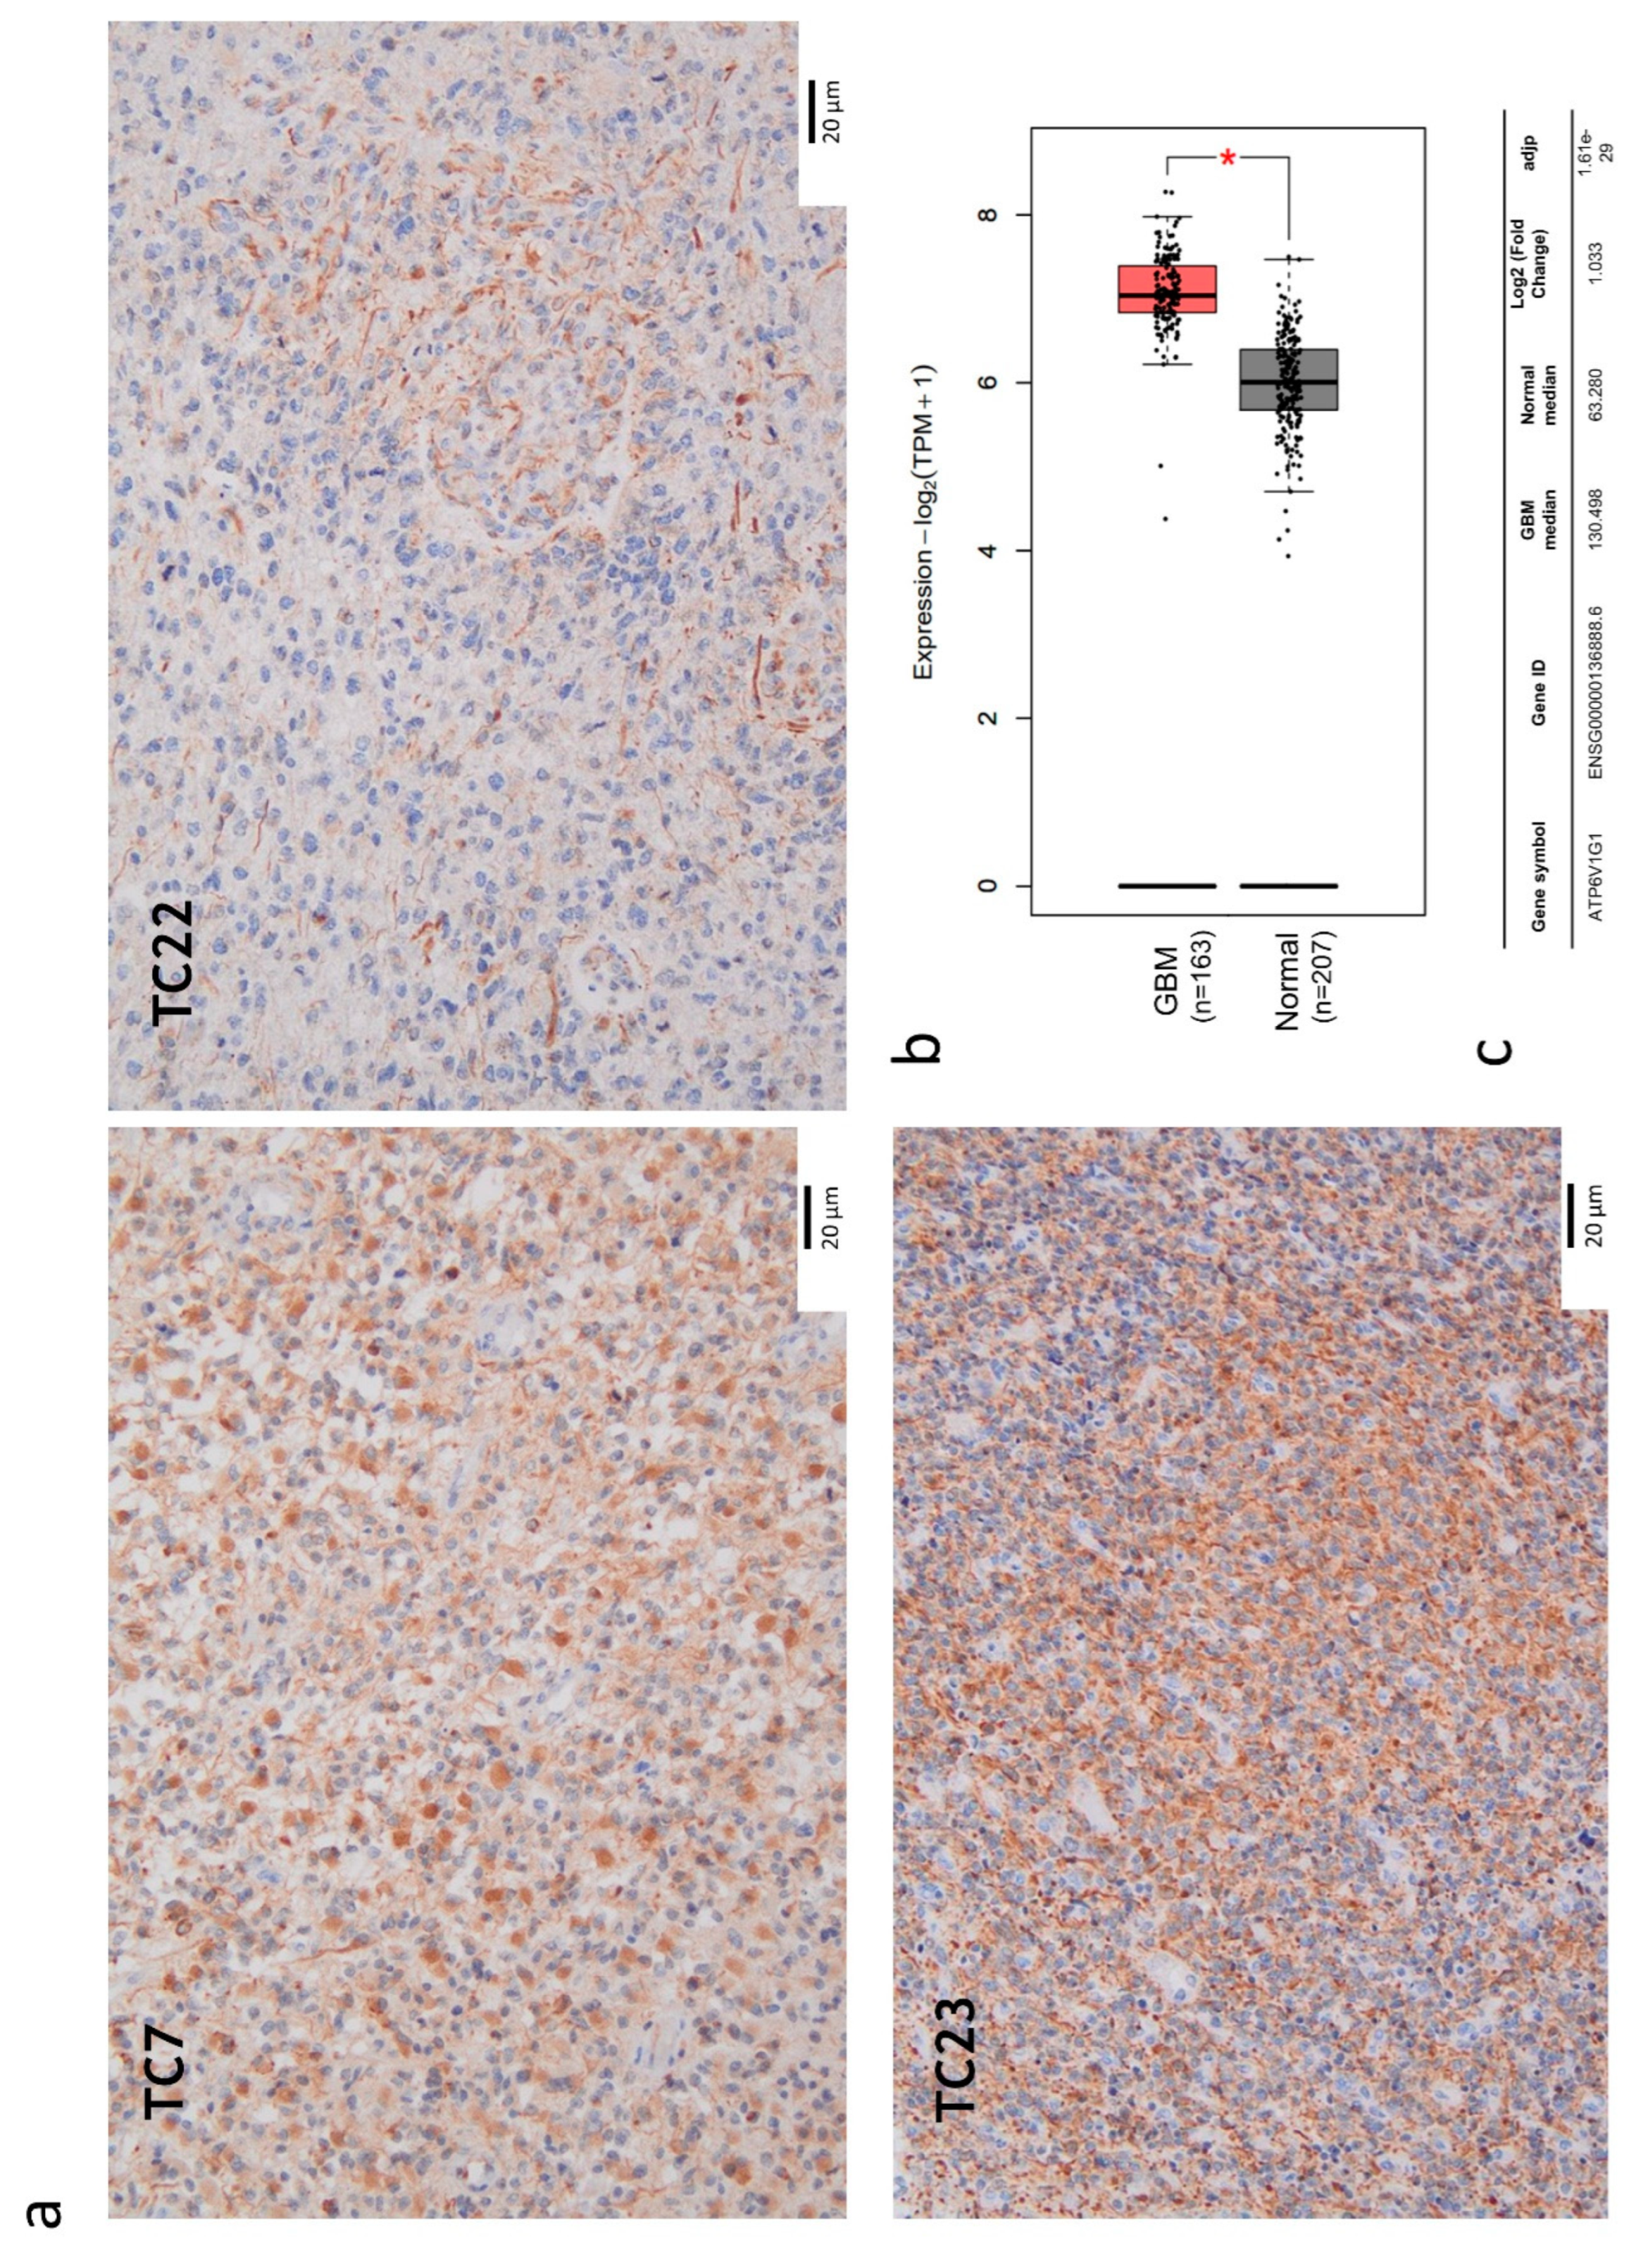
Figure 3.
Expression of V-ATPase V1-G1 subunit in three glioma stem cell (GSC) lines. (a) Western blotting analysis of the protein V1G1. CTR: positive control colon cancer cell line HCT116. (b) Quantification of V1G1 relative expression as V1G1/ α-tubulin ratio. Data were reported as the mean of three independent experiments ± S.D.; statistical analysis was performed comparing samples’ ratios to the one of the control (HCT116).
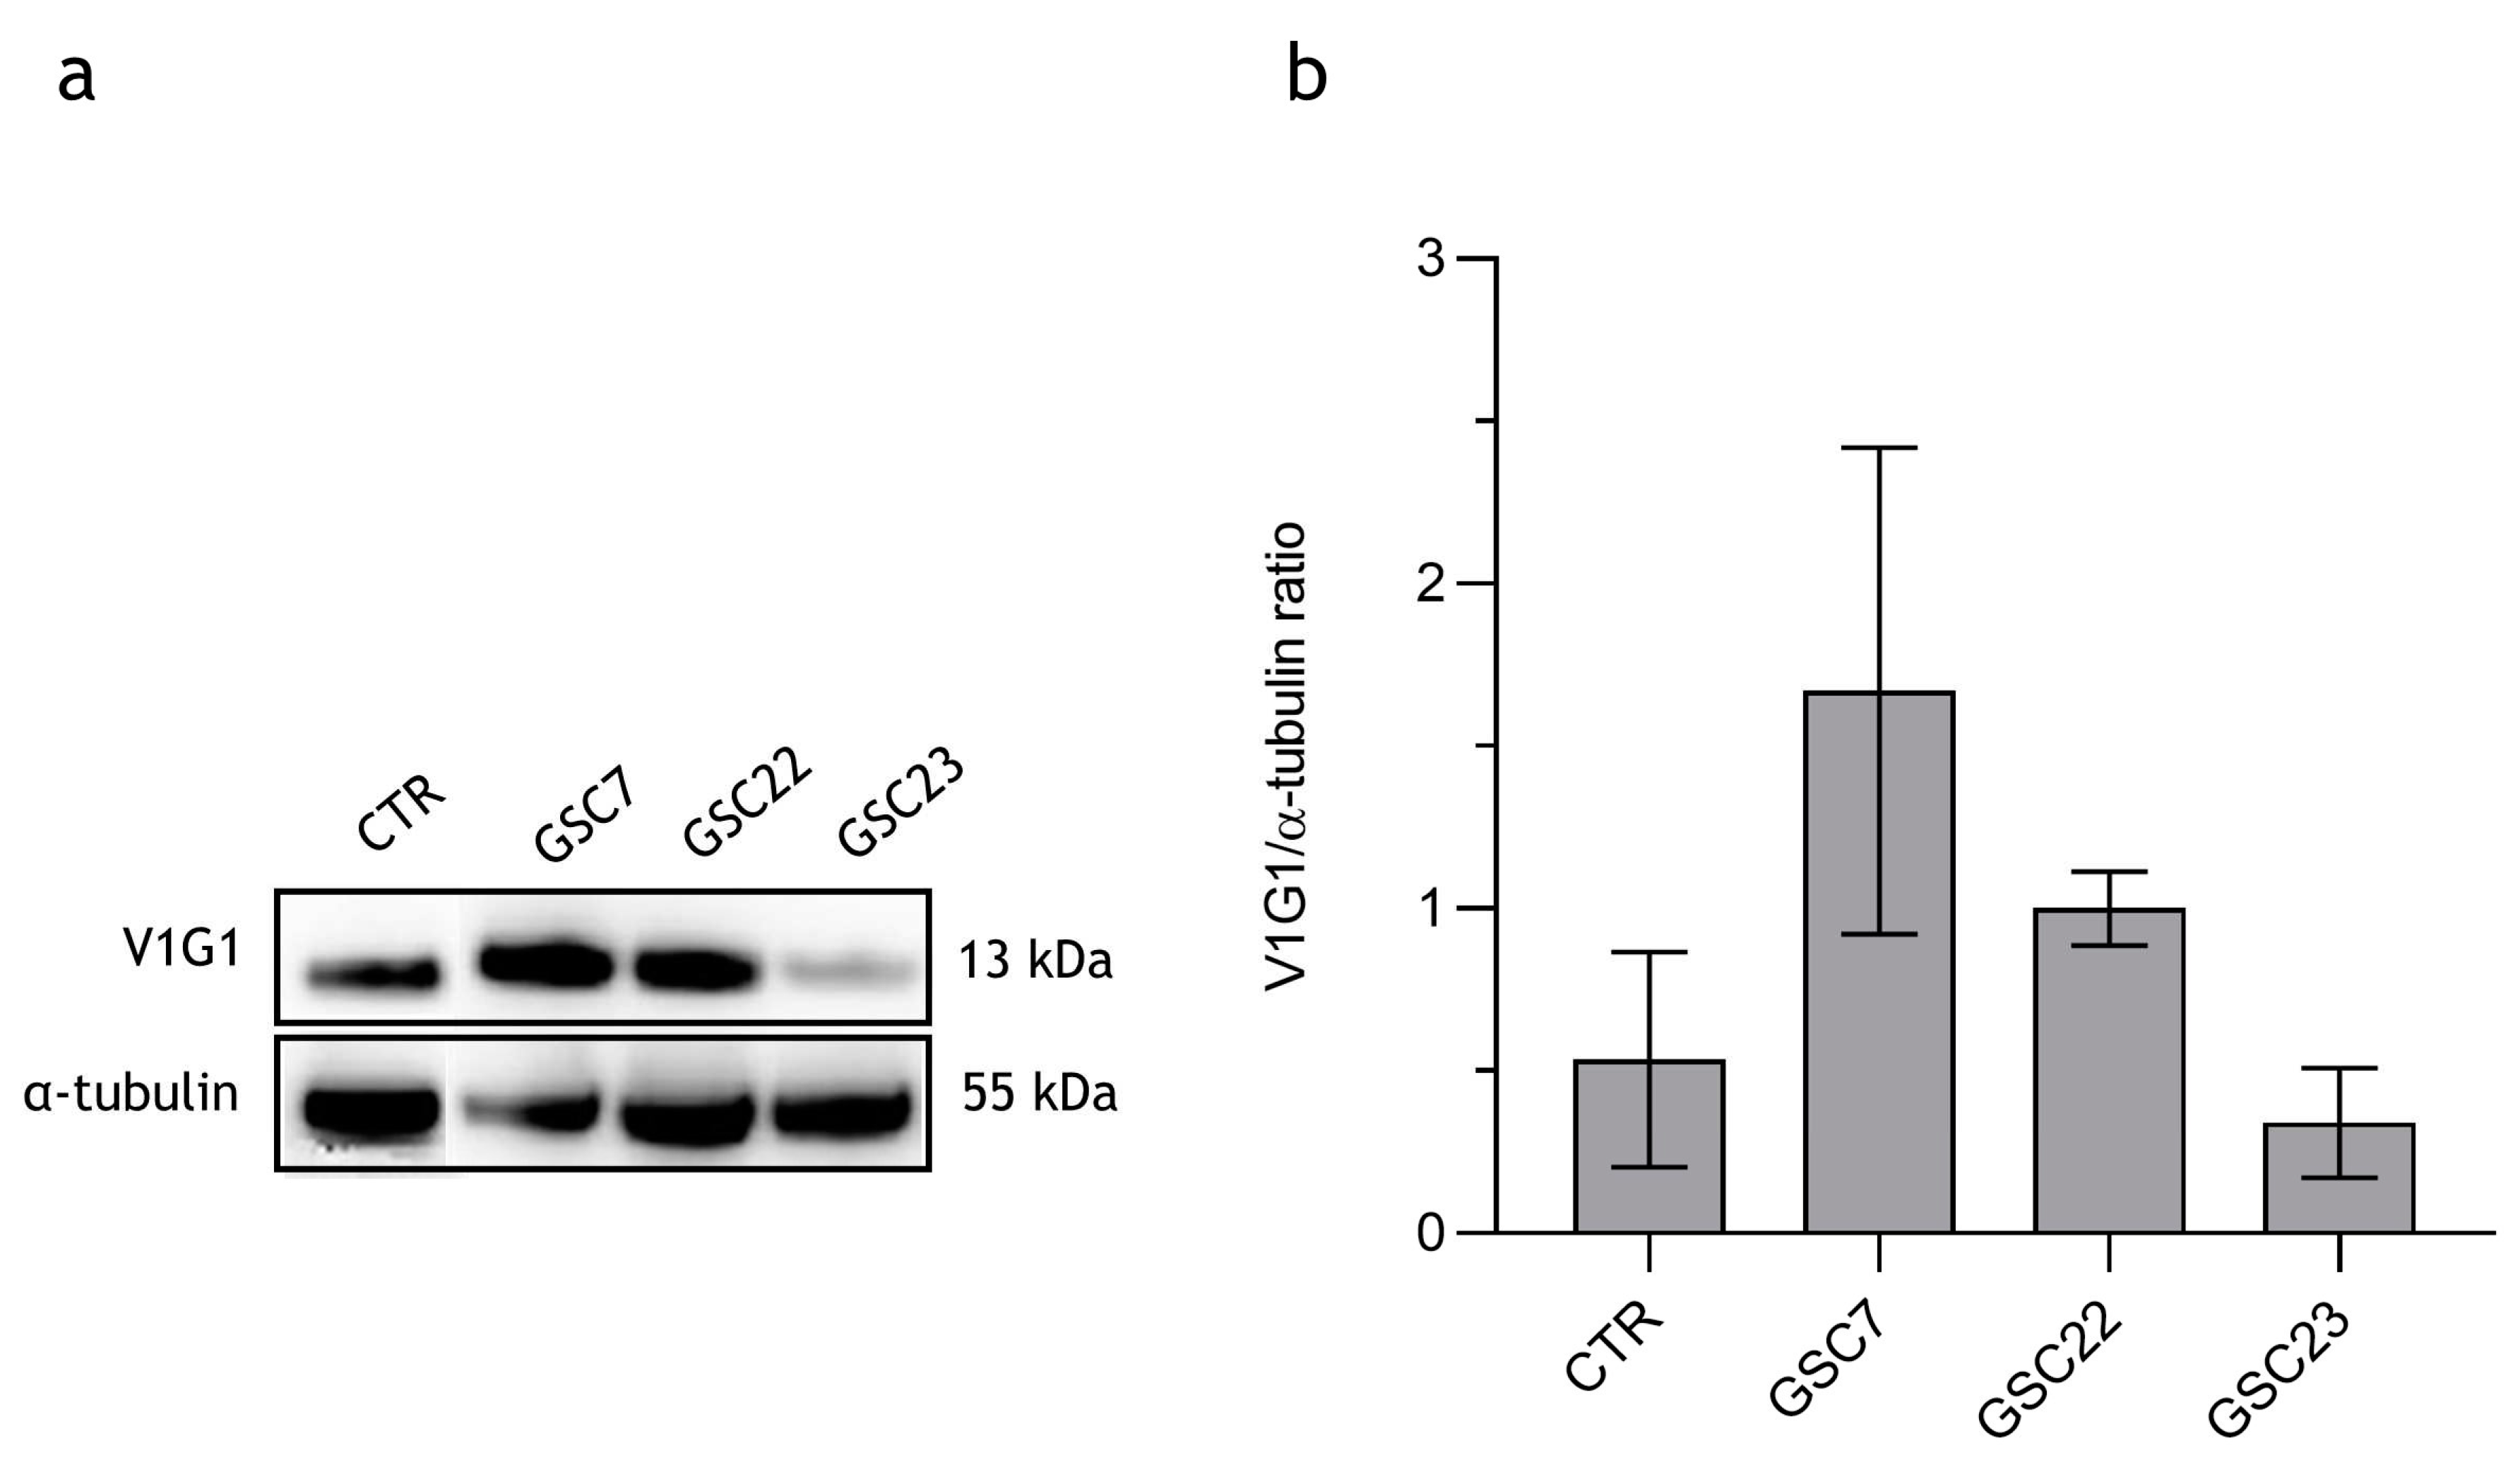
Figure 4.
Bafilomycin A1 (Baf) dose-response curves performed on glioma stem cell (GSC) lines by Cell Counting Kit-8 (CCK-8) assay. GSC lines were treated for 48 h with nanomolar doses of Baf (0,5, 1, 3, 5, 10 nM). Data were represented as the mean percentage of three independent experiments ± S.D. compared to the controls (CTR DMSO, vehicle control) arbitrarily set to 100%. Statistical analysis was performed on raw data, *: p value < 0,05, **: p value < 0,01. Red arrows indicate the sub-lethal dosage of Baf identified for each GSC line.
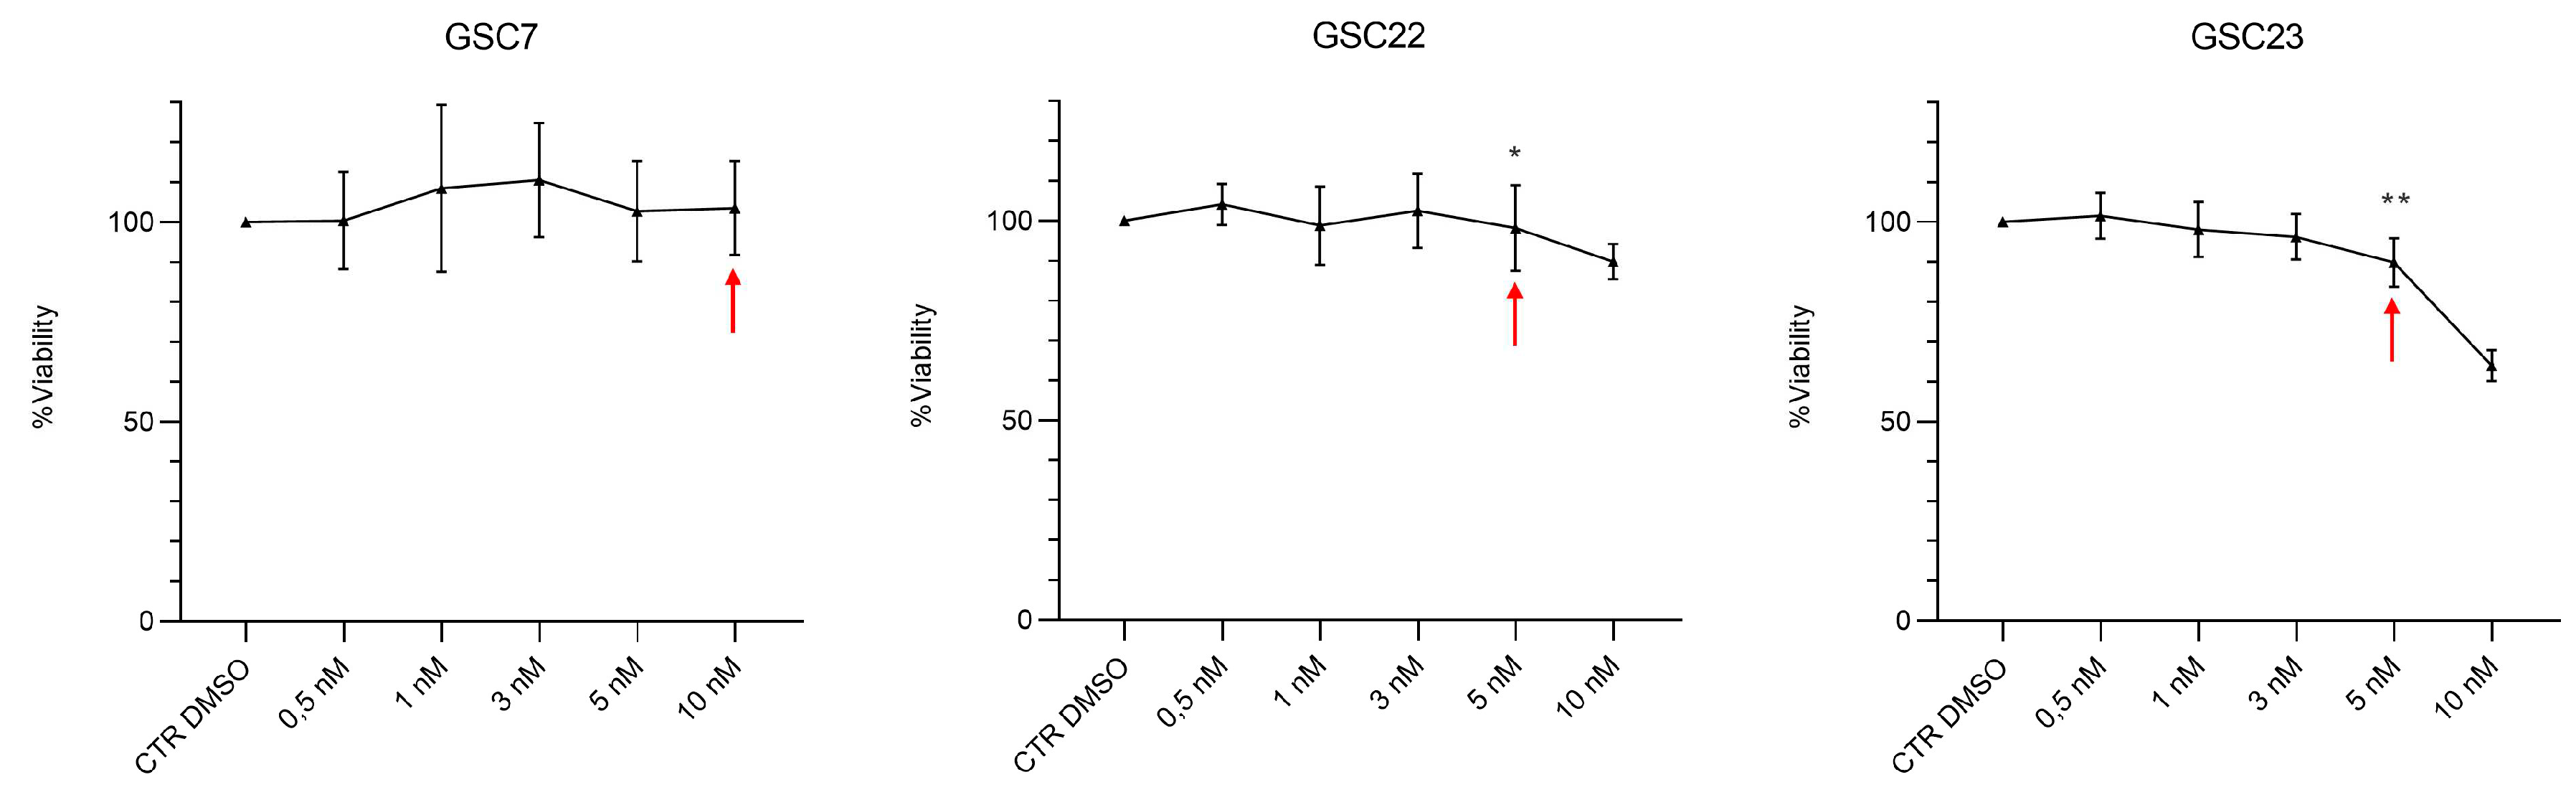
Figure 5.
Cytotoxicity assay by Cell Counting Kit-8 (CCK-8) of glioma stem cell lines (GSC) 7, 22 and 23. GSC lines were treated for 48 h with temozolomide (TMZ, 100 μM) or bafilomycin A1 (Baf, GSC line-specific dosage: GSC7 10 nM, GSC22 5 nM and GSC23 5 nM), and in combination, simultaneously (plan 1) and at deferred times (24 h Baf and then TMZ addition, plan 2). Data were represented as the mean percentage of three independent experiments ± S.D. compared to the controls (CTR DMSO, vehicle control) arbitrarily set to 100%. Statistical analysis was performed on raw data, *: p value < 0,05.
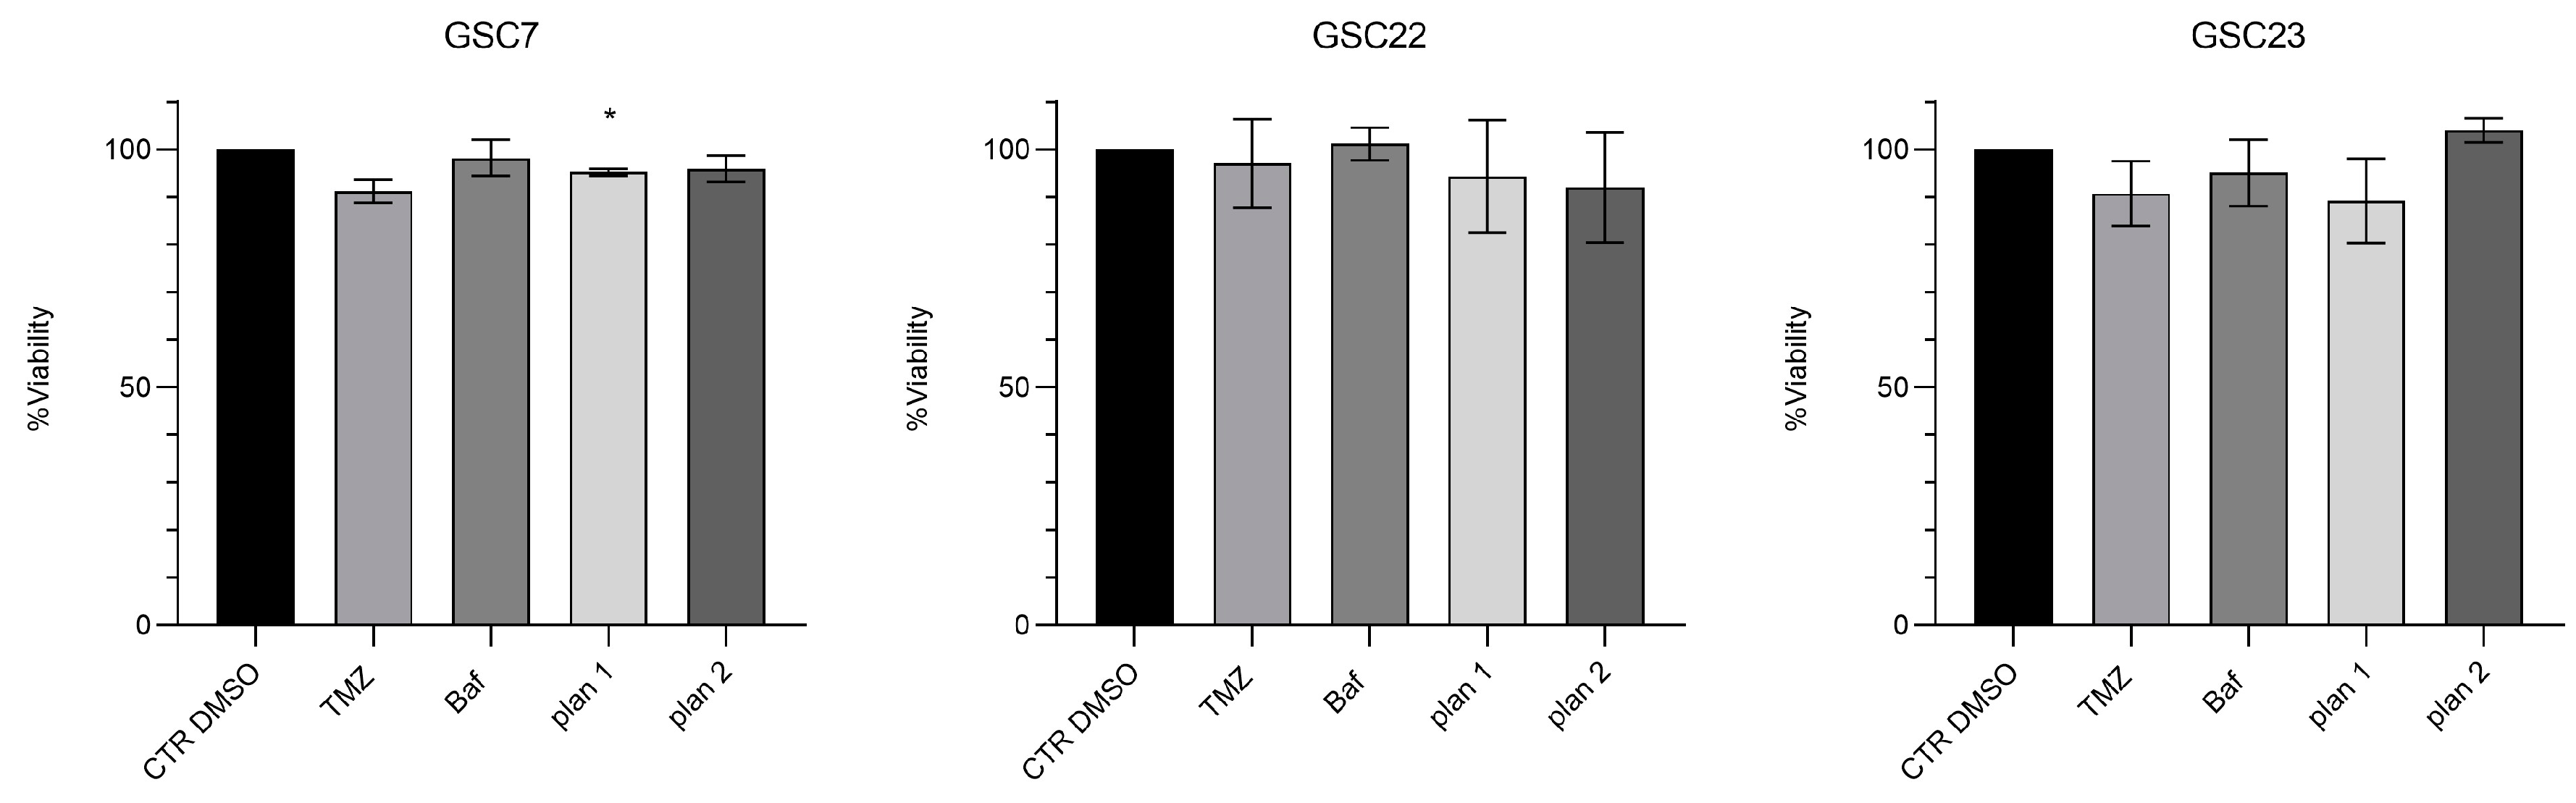
Figure 6.
Cytotoxicity assay by Cell Counting Kit-8 (CCK-8) of glioma stem cell lines (GSC) 7, 22 and 23. GSC lines were treated for 48 h with temozolomide (TMZ, 100 μM) or bafilomycin A1 (Baf, 20 nM), and in combination, simultaneously (plan 1) and at deferred times (24 h Baf and then TMZ addition, plan 2). Data were represented as the mean percentage of three independent experiments ± S.D. compared to the controls (CTR DMSO, vehicle control) arbitrarily set to 100%. Statistical analysis was performed on raw data, *: p value < 0,05, **: p value < 0,01.
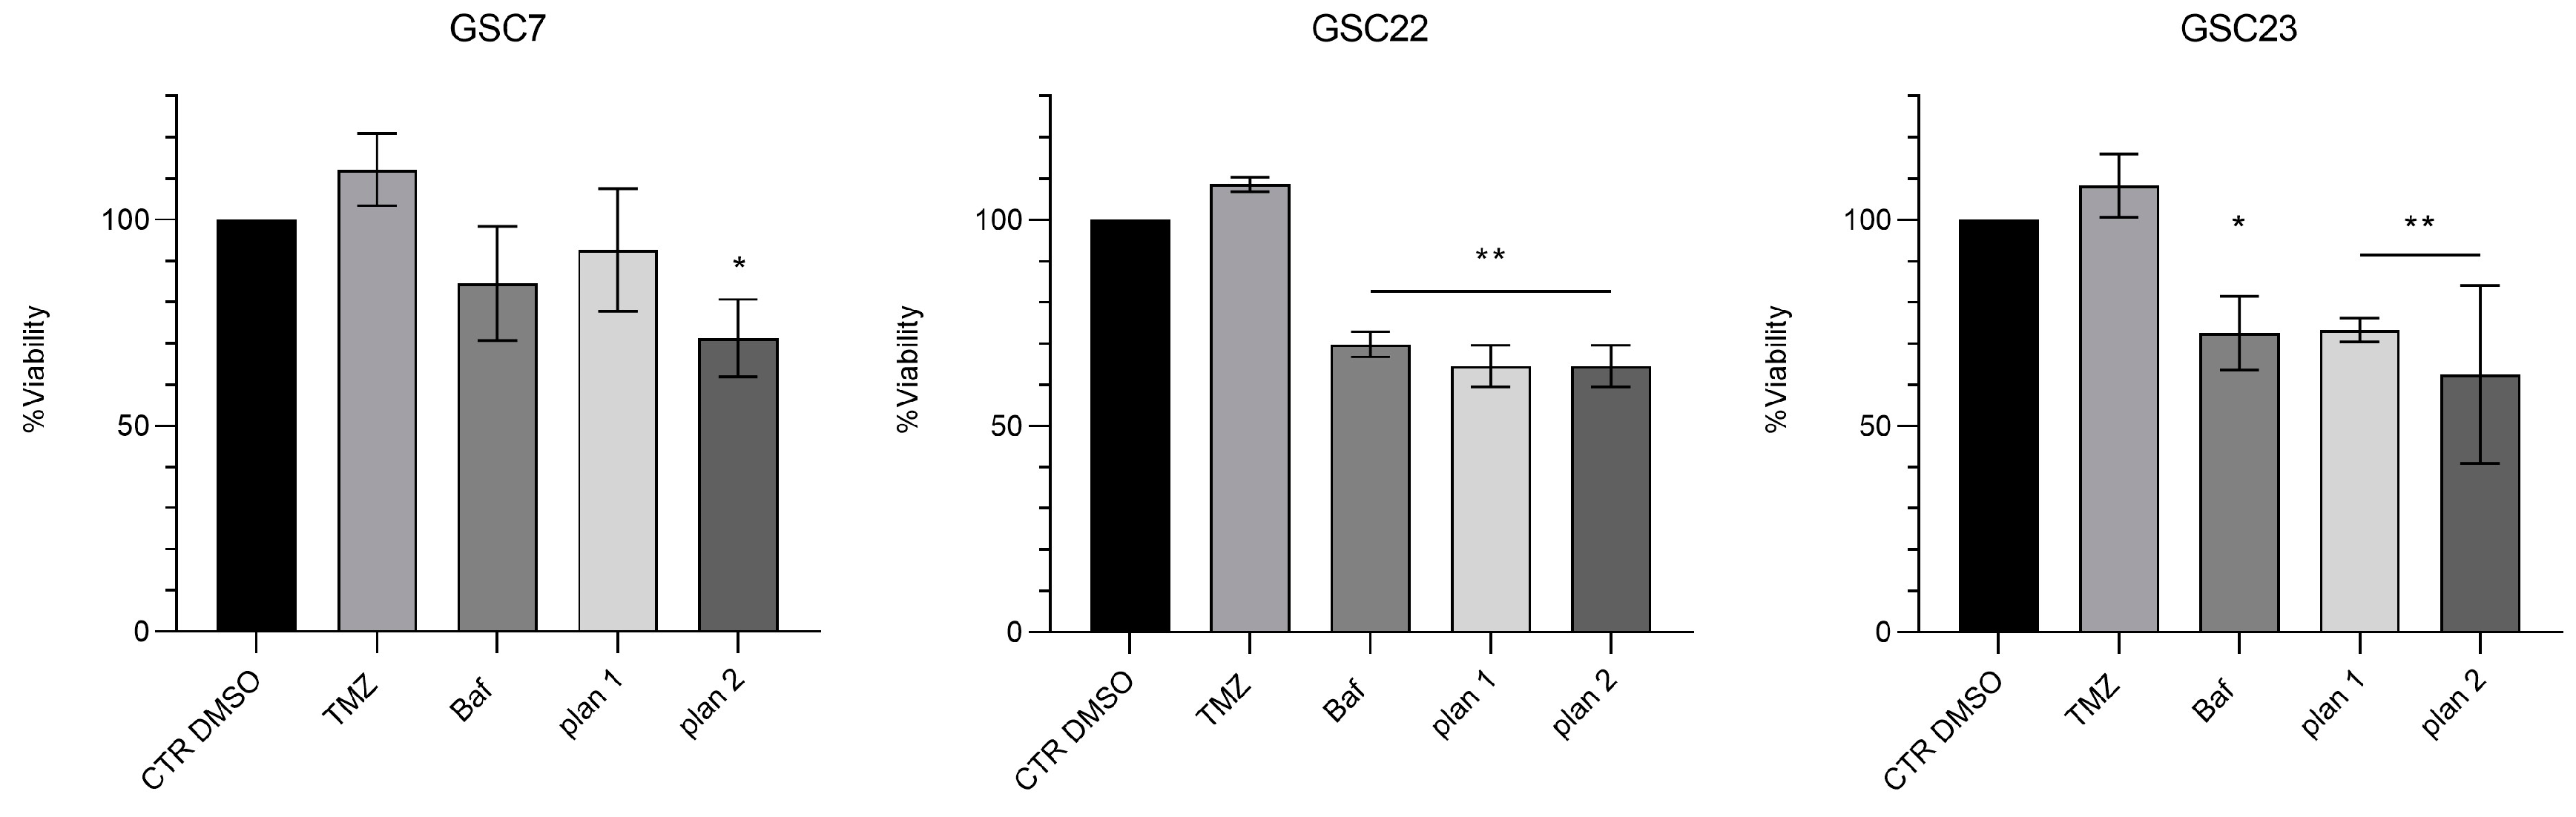
Figure 7.
Expression of V-ATPase V1-G1 subunit in glioma stem cell (GSC) lines after 48 h of treatment with bafilomycin A1 (20 nM and 40 nM). (a) Western blotting analysis of the protein V1G1; α-tubulin was used as loading control. CTR DMSO represented the untreated condition (cell treated with the vehicle DMSO). (b) Quantification of V1G1 relative expression as V1G1/ α-tubulin ratios. Data were reported as the mean ± S.D. of three independent experiments. Statistical analysis was performed both comparing treatments’ ratios to the one of the CTR DMSO and comparing ratios between treatments; *: p value < 0,05.
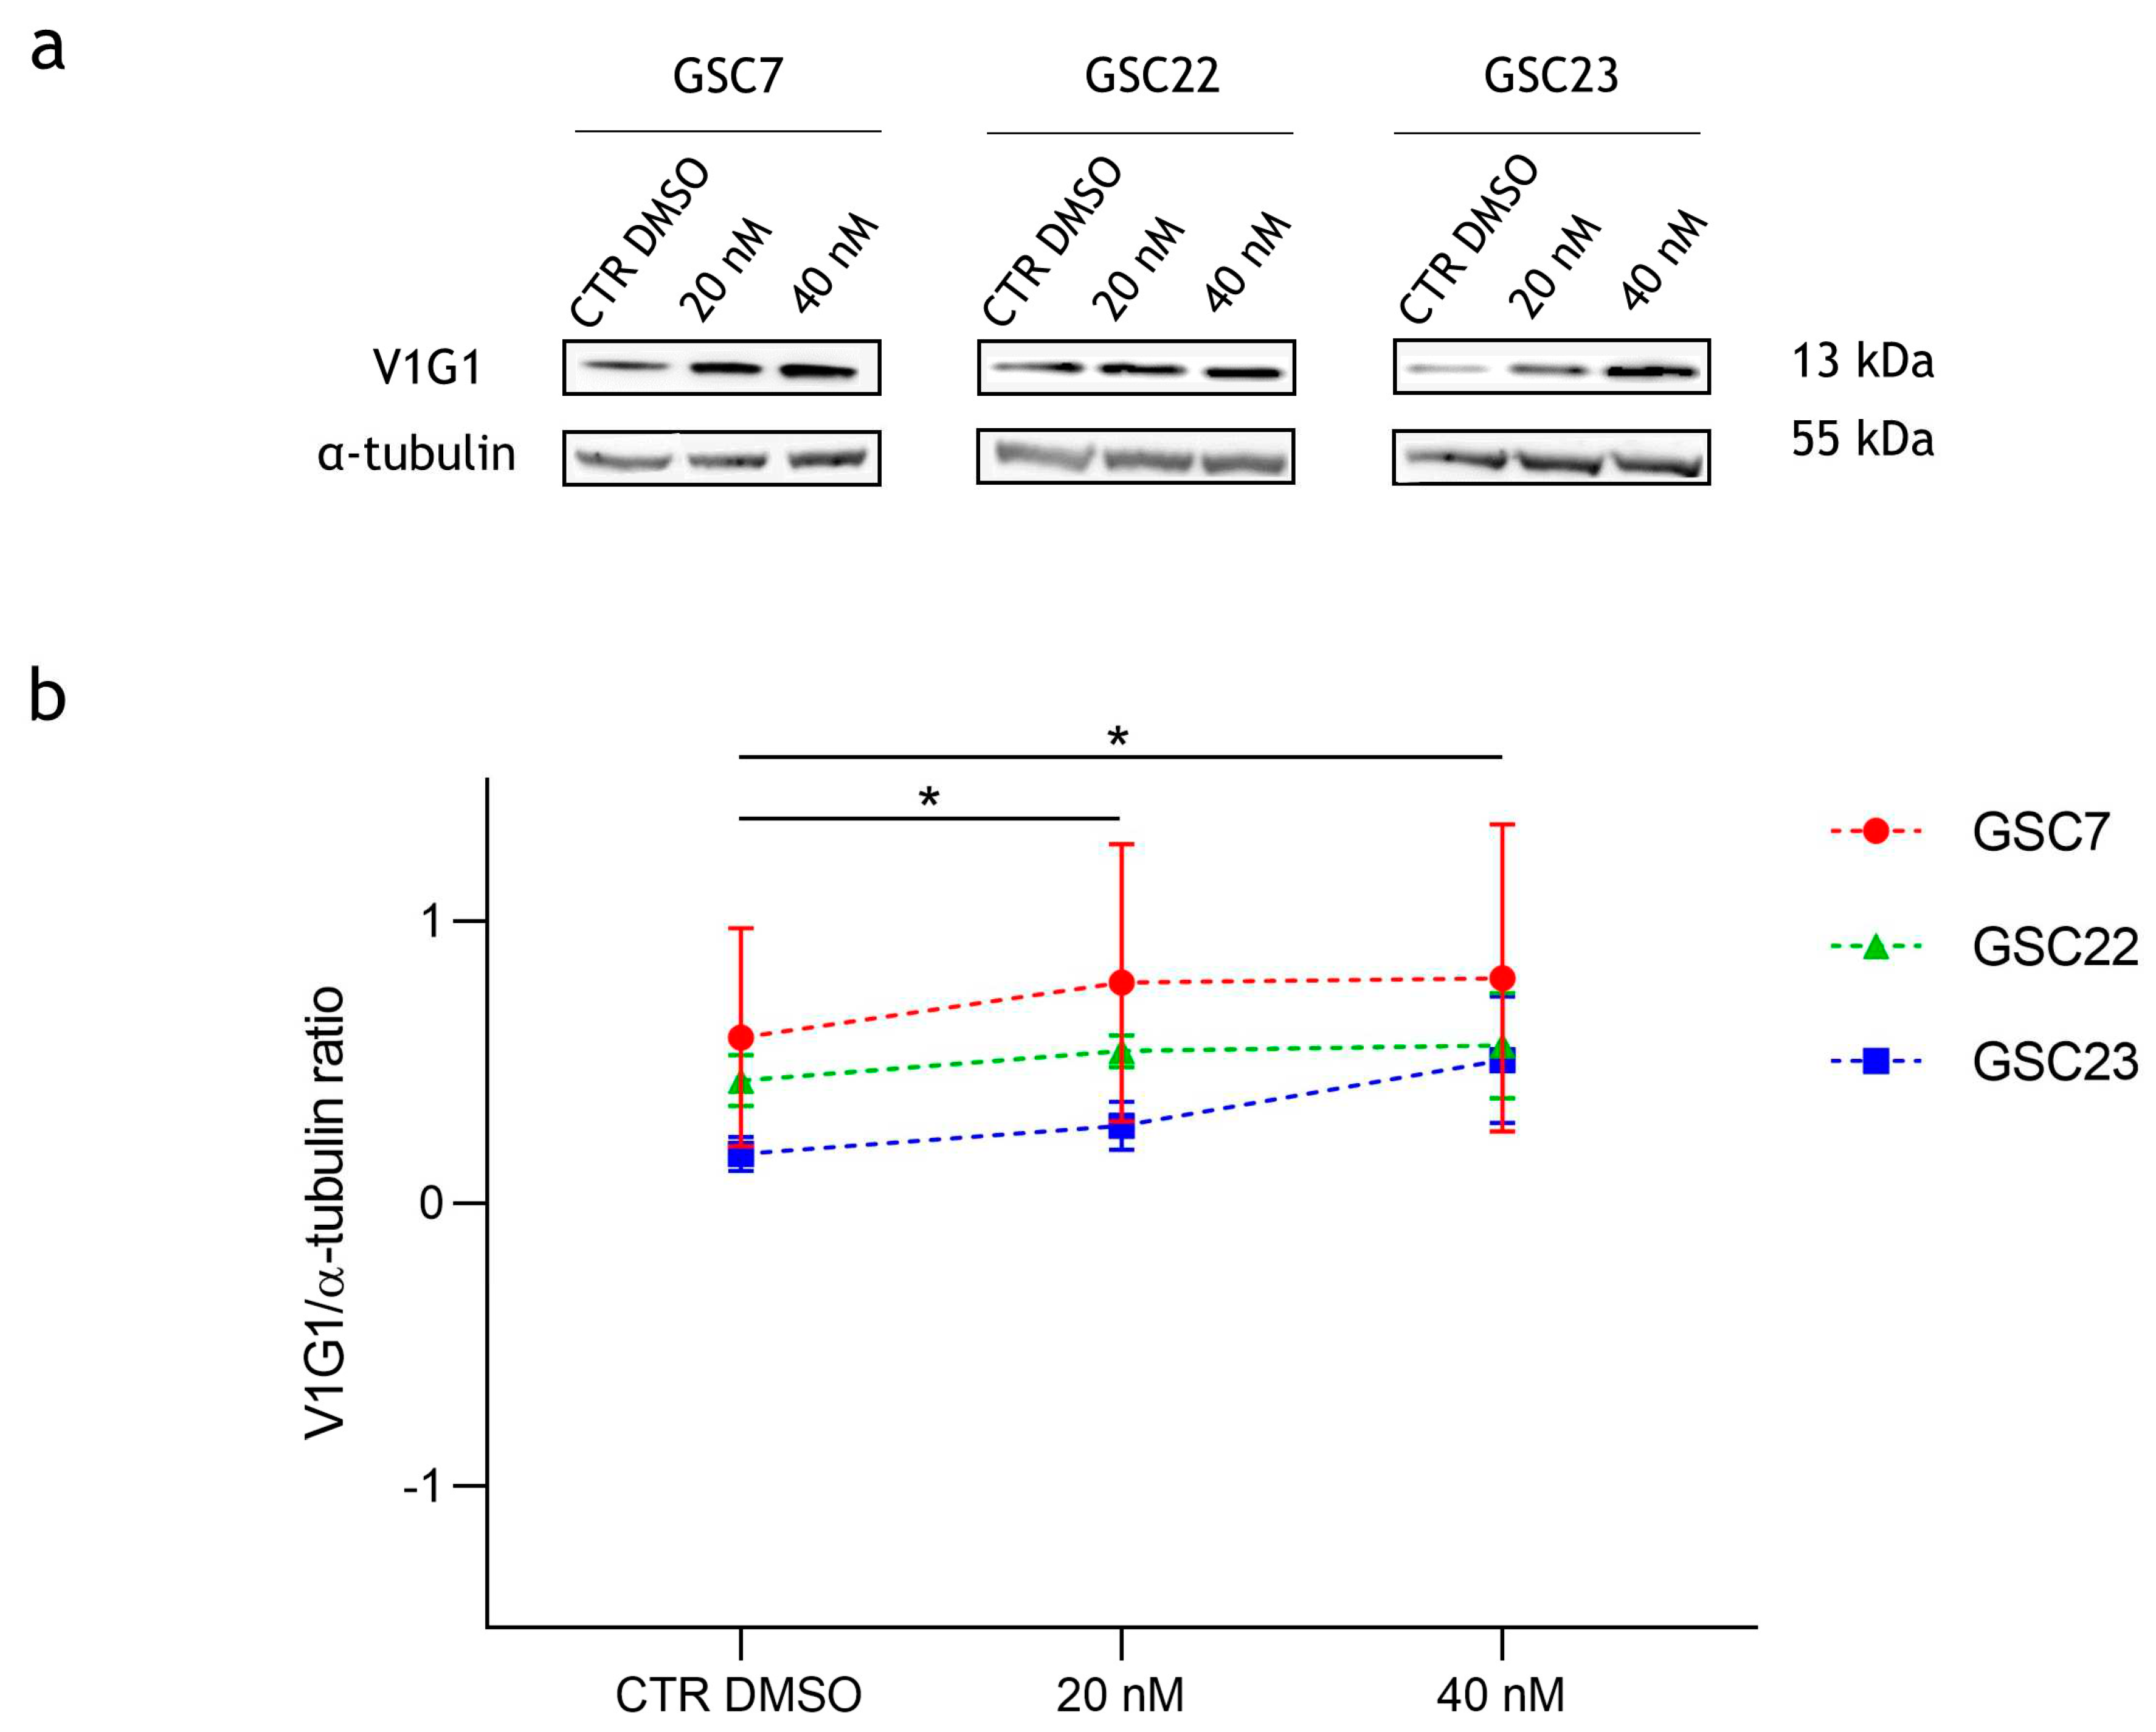
Figure 8.
Expression of autophagy-associated proteins in glioma stem cell (GSC) lines after 48 h of treatments with bafilomycin A1 (20 nM and 40 nM). (a) Western blotting analysis of the proteins LC3I and LC3II; vinculin was used as loading control. CTR DMSO represented the untreated condition (cell treated with the vehicle DMSO). (b) Quantification of LC3II relative expression as percentage of LC3II/vinculin ratios. (c) Quantification of LC3II relative expression as percentages of LC3II/I ratios. Data were reported as mean of three independent experiments ± S.D.; statistical analysis was performed comparing samples’ ratios to the ones of the CTR DMSO arbitrarily set to 100% *: p value < 0,05, **: p value < 0,01.
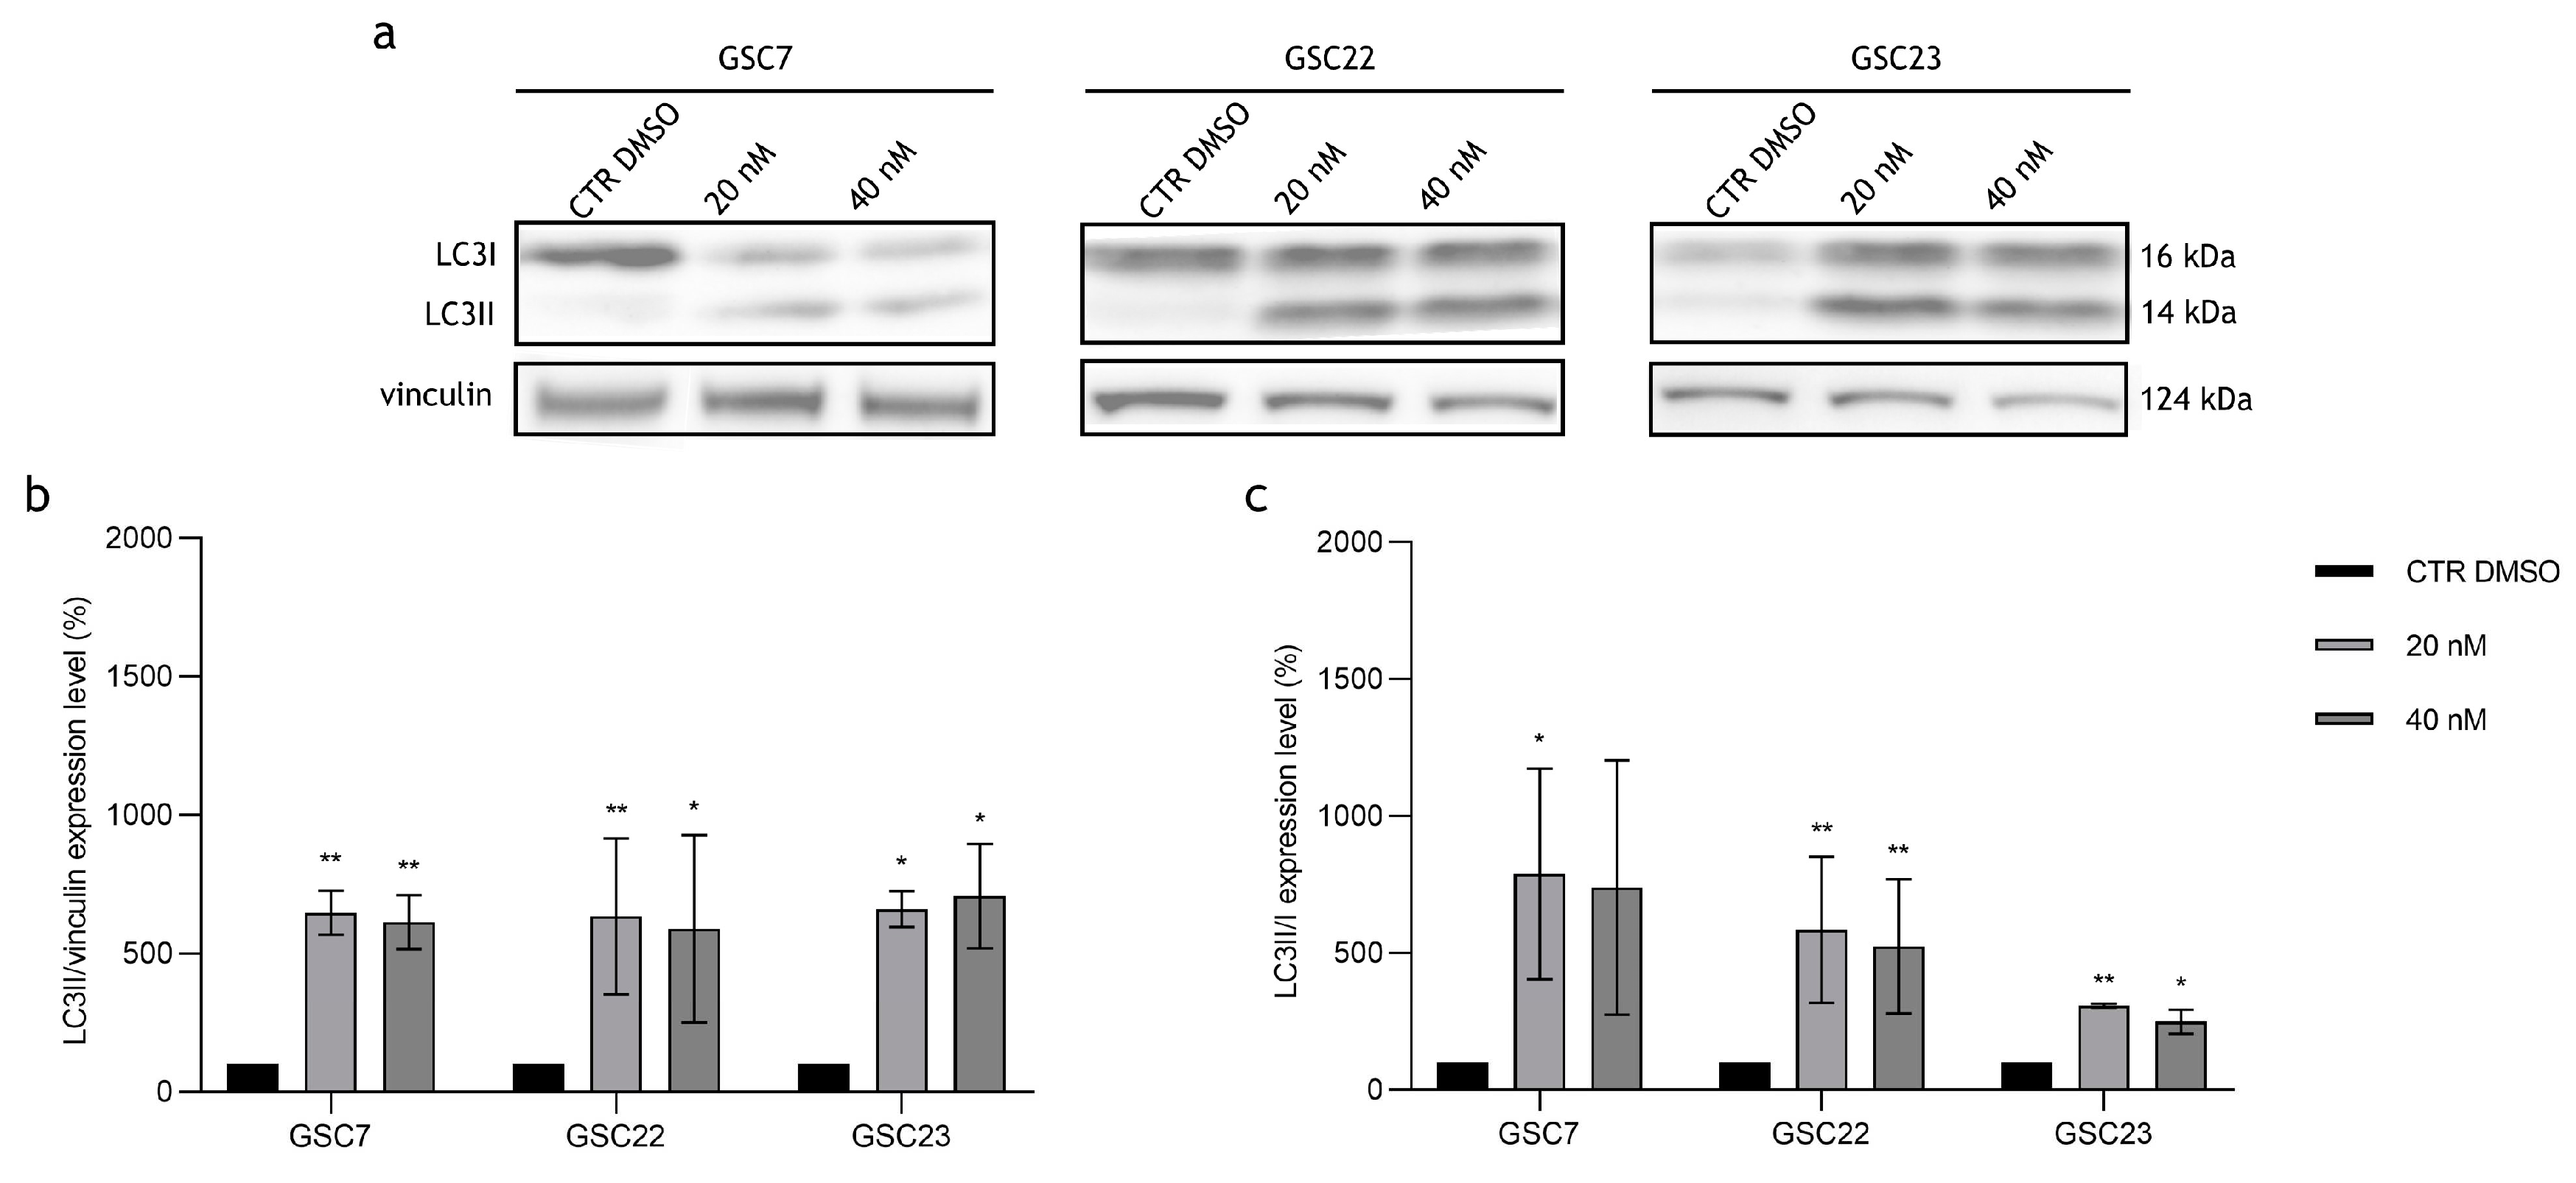
Figure 9.
Assessment of the cellular death after treatments by flow cytometry. Dot plots of the glioma stem cell (GSC) lines at the untreated condition (cell treated with the vehicle DMSO), and after 48 h of treatments with temozolomide (TMZ, 100 μM) and bafilomycin A1 (Baf, 20 nM) given alone and in combination at deferred times (plan 2, as described before). Horizontal axis shows Annexin V- Fitc staining (AV), vertical axis Propidium Iodide staining (PI). Viable cells were recovered in the lower left quadrant (double negative); early apoptotic cells retrieved in the lower right quadrant (PI-negative and Annexin V-positive); late apoptosis/secondary necrotic cells were in the upper right quadrant (double positive); necrotic cells were in the upper left quadrant (PI-positive and Annexin V-negative). Mean percentages of cells counted in each condition were reported as well. In each quadrant was reported the mean percentage of events of three independent experiments.
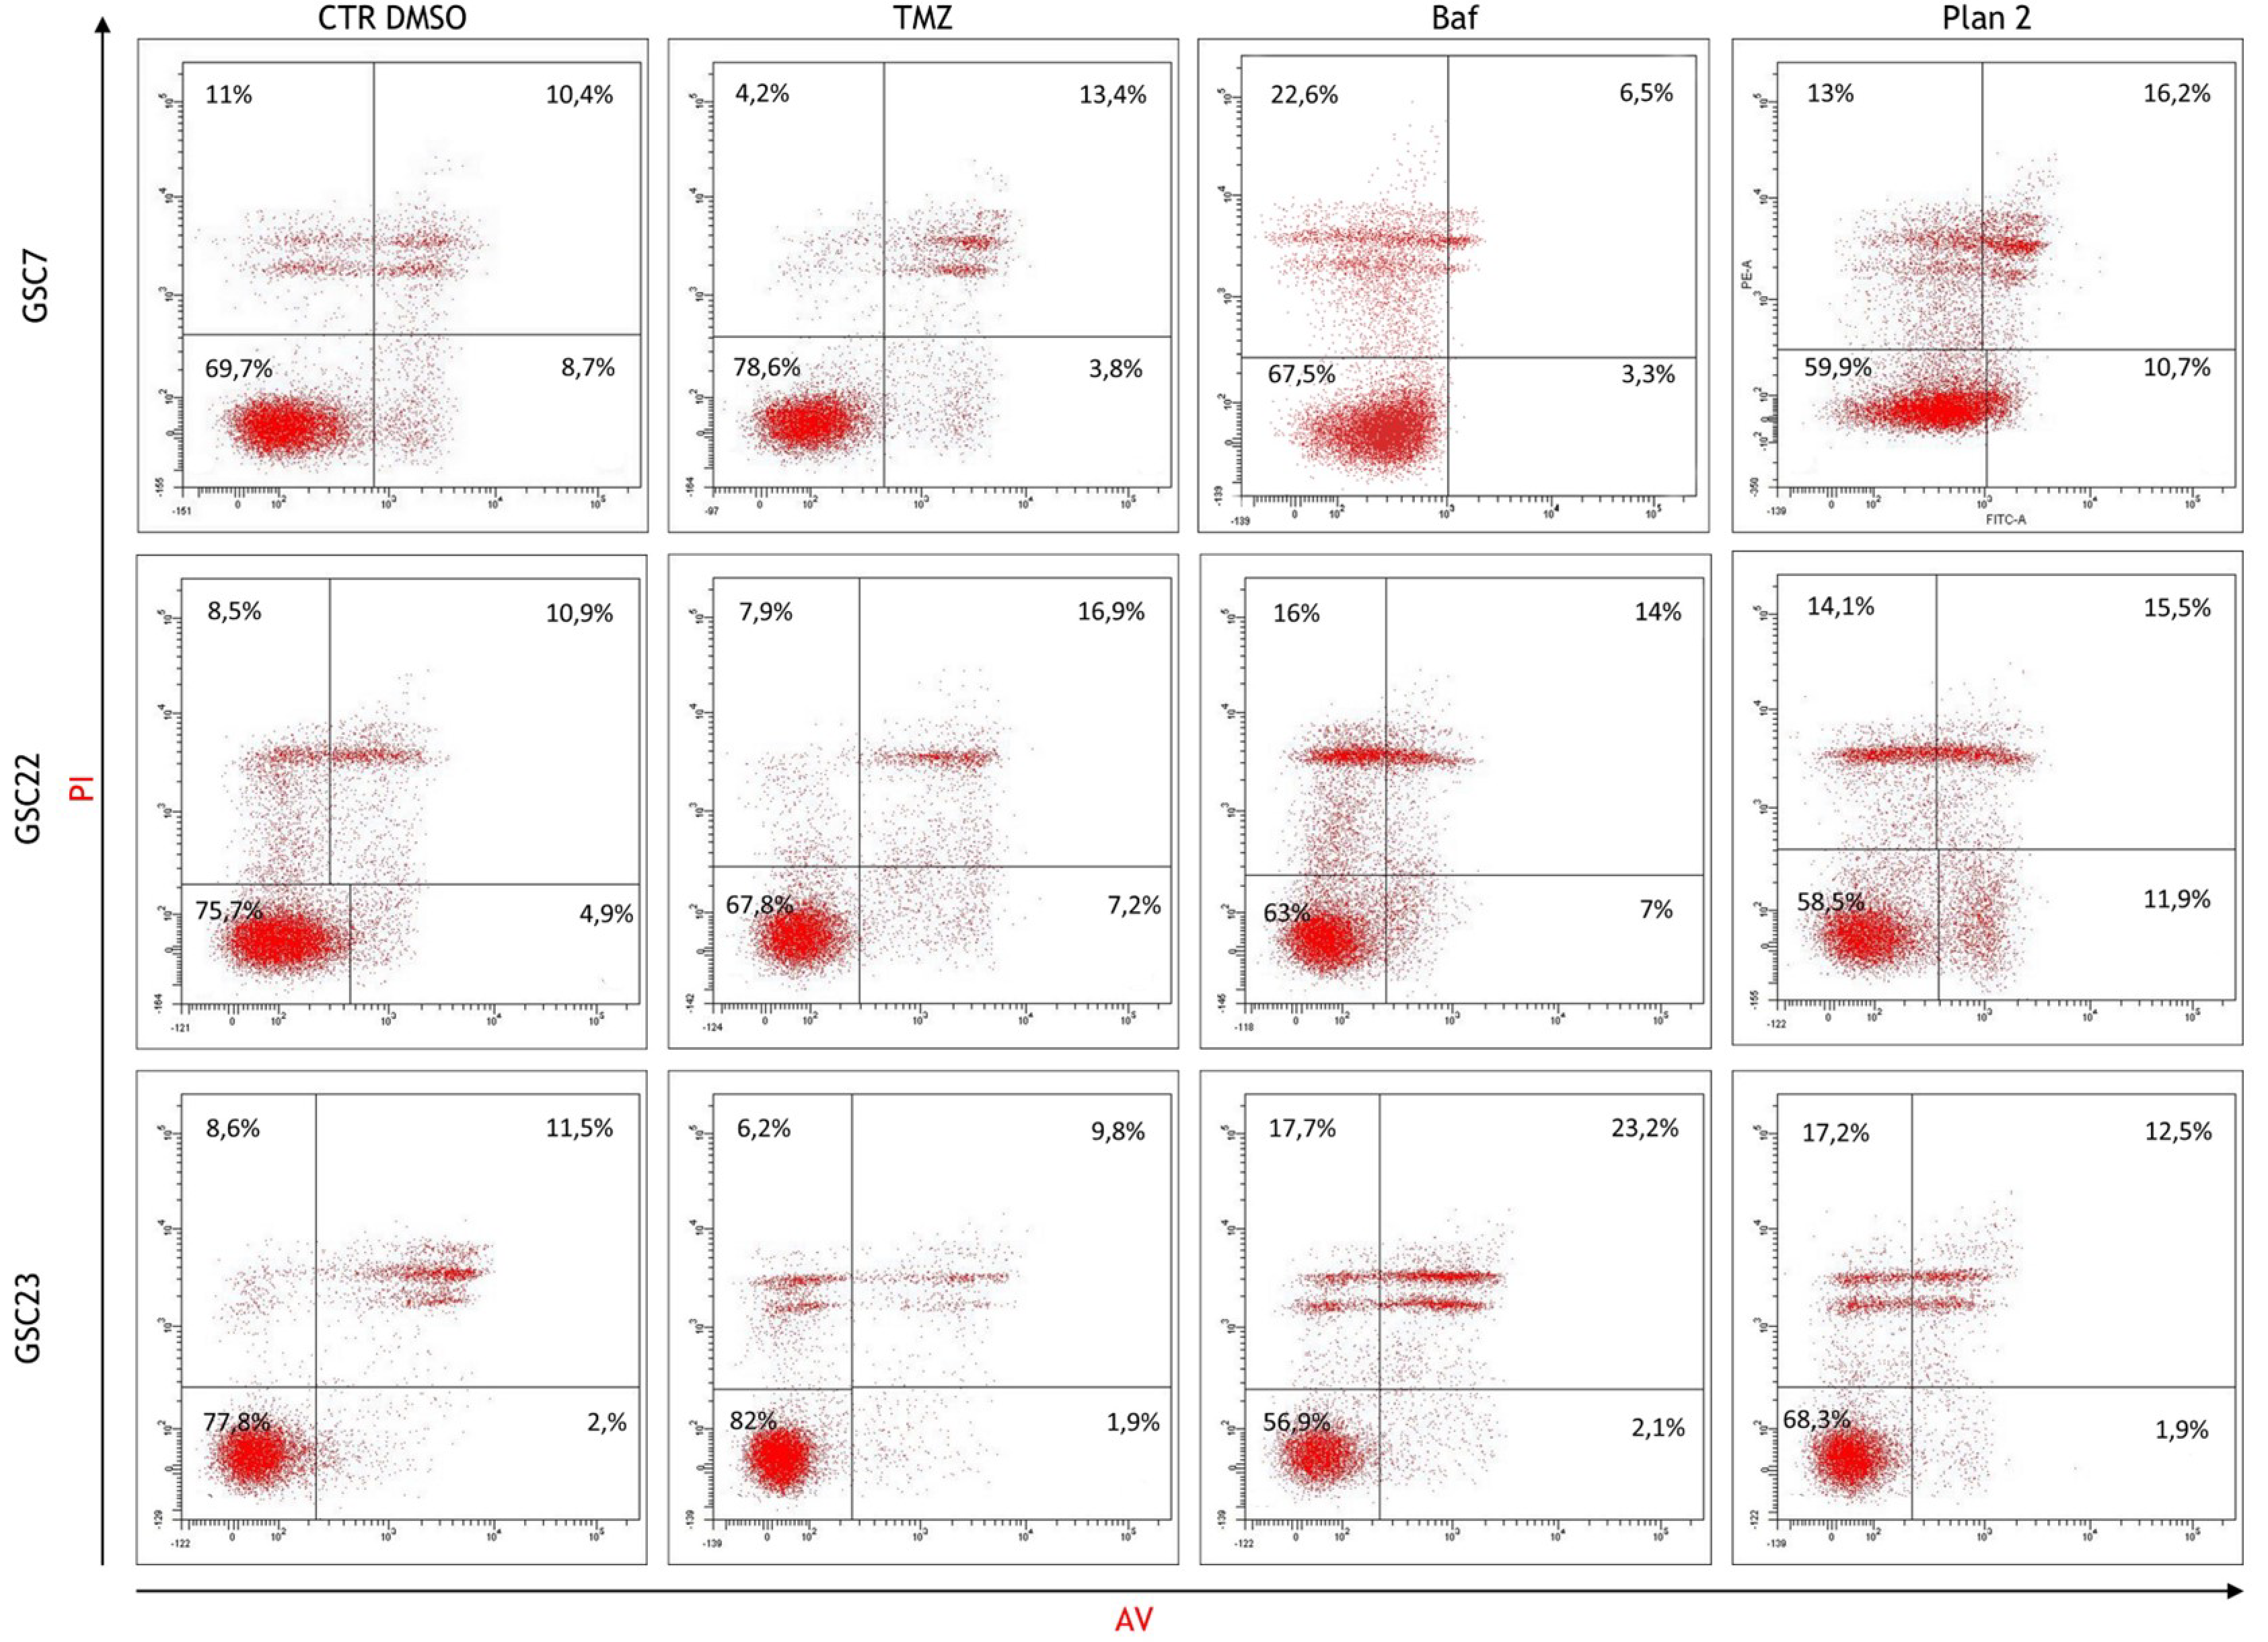
Figure 10.
Percentage of the alive cells portion (cells negative for Annexin V - AV and propidium iodide - PI staining) after treatments by flow cytometry. Alive cells of each condition were compared to the control (CTR DMSO, vehicle control) arbitrarily set to 100%. Data were represented as the mean percentage of three experiments ± S.D.; statistical analysis was performed on raw data.
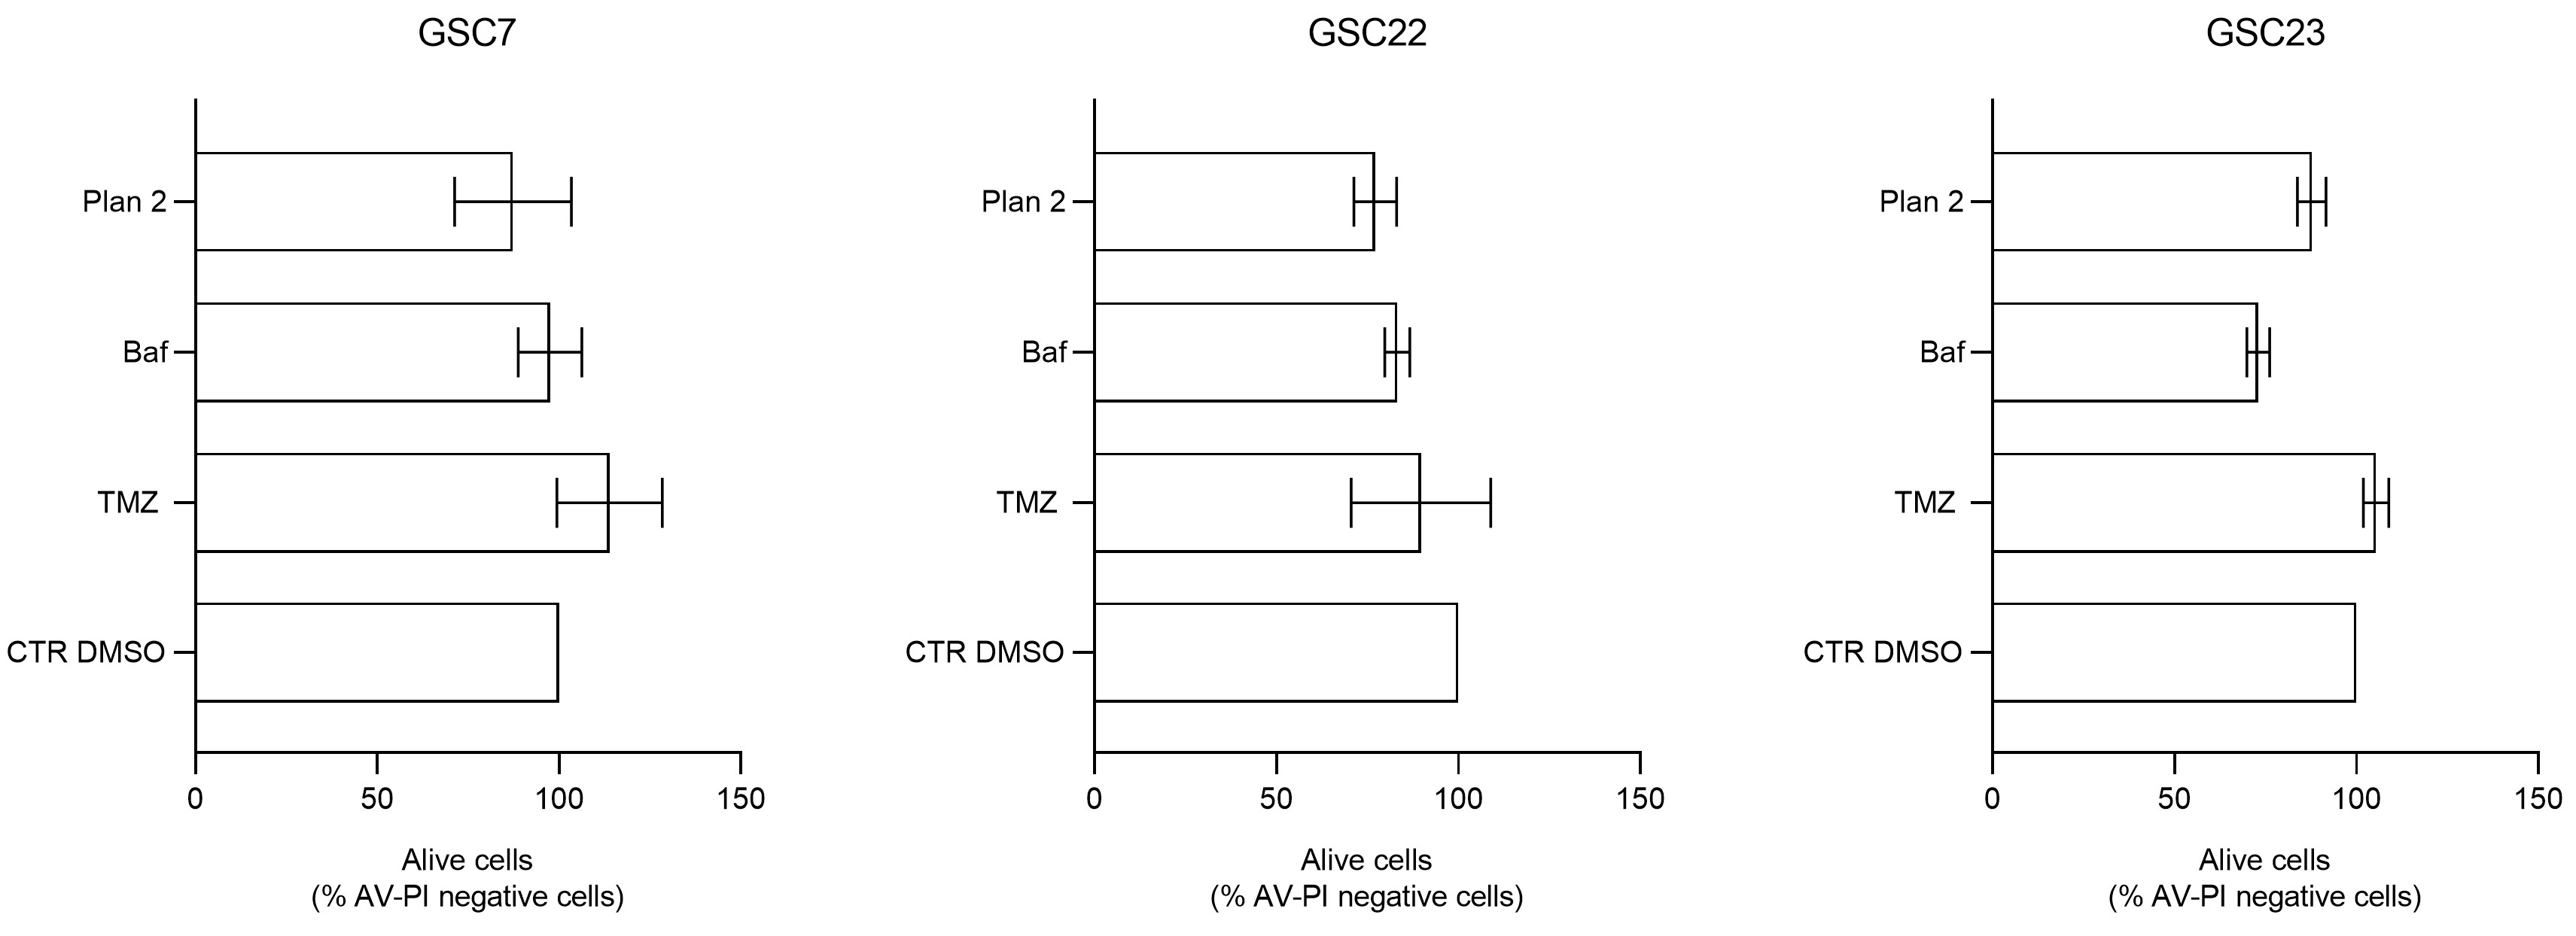

Table 1.
MGMT promoter methylation levels in tumor core (TC) bulks and matched glioma stem cell lines (GSC) derived from three patients.
Table 1.
MGMT promoter methylation levels in tumor core (TC) bulks and matched glioma stem cell lines (GSC) derived from three patients.
| Patient | % of methylation | Status | |
|---|---|---|---|
| TC | GSC | ||
| 7 | 1% | 10% | - |
| 22 | 17% | 78% | + |
| 23 | 38% | 41% | + |
Cut-off for hyper-methylation was set to ≥ 10%. Symbol + indicates hyper-methylation; symbol - indicates hypo-methylation.
Disclaimer/Publisher’s Note: The statements, opinions and data contained in all publications are solely those of the individual author(s) and contributor(s) and not of MDPI and/or the editor(s). MDPI and/or the editor(s) disclaim responsibility for any injury to people or property resulting from any ideas, methods, instructions or products referred to in the content. |
© 2024 by the authors. Licensee MDPI, Basel, Switzerland. This article is an open access article distributed under the terms and conditions of the Creative Commons Attribution (CC BY) license (http://creativecommons.org/licenses/by/4.0/).
Copyright: This open access article is published under a Creative Commons CC BY 4.0 license, which permit the free download, distribution, and reuse, provided that the author and preprint are cited in any reuse.


