Submitted:
31 January 2024
Posted:
02 February 2024
You are already at the latest version
Abstract
Cadmium(Cd) is a highly toxic and cumulative environmental pollutant. Siderophores are heavy metal chelators with high tolerance to heavy metals such as Cd. Furthermore, ryegrass (Lolium perenne L.) has potential remediation capacity for soils contaminated by heavy metals. Consequently, using ryegrass alongside beneficial soil microorganisms that produce siderophores may be an effective means to remediate soils contaminated with Cd. In this study, Bacillus strains WL1210 and CD303 that were previously isolated from the rhizospheres of Nitraria tangutorum in Wulan and Peganum harmala L in Dachaidan, respectively, both arid sandy environments, were evaluated for heavy metal pollution mitigation. The results indicate that both strains of Bacillus exhibit favorable biological characteristics and stress resistance, and they are both producers of siderophores, which promote the growth of ryegrass under Cd stress.
Keywords:
Biological activity
; Cadmium contamination
; Cd2+ tolerance
; Siderophore-producing Bacillus
; Ryegrass
1. Introduction
Heavy metal pollution has become a global concern due to the acceleration of industrialization and continuous human population growth. Cd has significant mobility in the soil environment and is more easily absorbed by plants than other metals, Cd is absorbed and transported and accumulated in the edible parts of plants [1,2,3]. After Cd is absorbed and used by plants, it is transmitted through the food chain and eventually enriched in humans due to its stable, non-degradable characteristics, consequently seriously threatening ecosystem stability and human health [4]. Cd toxicity leads to excessive production of reactive oxygen species (ROS), damage to plant cell membranes and organelles, Simultaneously, it inflicts various types of damage on the plant, starting from the germination stage and extending to the suppression of production [5,6]. Plant physiological functions such as water interactions, essential mineral absorption and photosynthesis are also impaired by Cd [6].
Microorganisms can transform toxic and harmful heavy metals into non-toxic or low-toxicity metal precipitates via adsorption, oxidation, or reduction [7]. The remediation of Cd-polluted soils using beneficial microorganisms isolated from natural environments has become a research focus in recent years, owing to low cost, high operability, high efficiency, and environmentally protective effects [8]. Bacillus, as beneficial microorganisms, not only exhibit adsorption capabilities for metal ions, but also enhance plant growth by producing plant hormones. Additionally, they facilitate the acquisition of essential nutrients such as iron, nitrogen, and phosphorus by plants through the production of siderophores and nitrogen fixation, as well as phosphorus solubilization [9].
Recently, remediation of heavy metal-polluted soils using Bacillus has achieved significant progress in China. In this process, iron carriers are used as heavy metal chelators due to their high tolerance for heavy metals. For example, Wang et al. [10] observed that inoculating Bacillus strains T1 and Y2 that produce iron carriers into Solanum nigrum Linn soils significantly promoted (p < 0.05) Cd absorption in soils and strengthened the ability of Solanum nigrum Linn to remediate soils polluted by Cd. Furthermore, Zhang et al. [11] reported that Bacillus subtilis B1 can trigger the production of stronger surface-active proteins and biofilm formation after exposure to Cd, consequently increasing Cd adsorption of biofilms and protecting them from Cd stress. In addition, Li et al. [12] reported that Bacillus subtilis could adsorb Cd and improve Cd tolerance in Poa annua L. and alfalfa (Medicago sativa L.) soils. Likewise, Liu et al. [13] demonstrated that the combined action of B. subtilis and Pseudomonas palustris (Molisch) van Niel. effectively reduced Cd accumulation and promoted the growth and development of Brassica chinensis L. ryegrass as observed by rapid growth, strong cover percentages, long growth cycles, increased disease resistance, and increased and comprehensive nutritive values. Moreover, inoculation can improve soil physical structures, leading to improved tolerance to pollution by heavy metal ions such as Cd, Pb, and Cu. Consequently, B. chinensis ryegrass is often used as a plant for remediation of heavily metal-contaminated soils [14]. Additional studies have shown that inoculation of Cd-tolerant bacteria in Cd-contaminated soils can enhance the photosynthesis of ryegrass and promote Cd absorption, transport, and accumulation in ryegrass, thereby improving remediation of Cd-contaminated soils [15].
Therefore, we hypothesized that siderophore bacillus isolated from extreme habitats could chelate heavy metal ions in the soil, thereby alleviating the stress effect of heavy metals on ryegrass. Moreover, this study provides novel strain resources that can be used in the development of microbial pesticides with high economic value and environmentally protective effects.
Materials and Methods
2.1. Materials
The plant material used in this study was ryegrass (Lolium perenne L.), variety “ESQUIRE 1” that originated in Denmark. The Bacillus strains WL1210 and CD303 were isolated from the rhizospheres of Nitraria tangutorum in Wulan and Peganum harmala L in Dachaidan, respectively. Both plants were present in arid and sandy environments. Primer synthesis was conducted at the Nanjing Jinshui Company using Cd chloride (CdCl2, Zhan Yun Chemical Co., Ltd., Shanghai, China) and ferrophilin test solution (CAS test solution, Koolabo Technology Co., Ltd., Beijing, China). LB medium was made using a previously described experimental method [16]. mannitol salt agar (MSA) medium was produced as previously described [17]. The Silicate Bacteria Culture Medium and The Monkina Inorganic Phosphorus Bacterial Medium, as described in [18].
2.2. Molecular Identification of Strains
2.2.1. 16S rDNA Identification
16S rDNA amplification was performed using genomic DNA from strains WL1210 and CD303 as templates. PCRs were conducted with the forward primer 27F: 5′-AGAGTTTGATCMTGGCTCAG-3′ and reverse primer 1492R: 5′-GGYTACCTTGTTACGACTT-3′. PCR amplification conditions included 95°C for 4 min; followed by 34 cycles of 94°C for 1 min, 50°C for 1 min, and 72°C for 2 min; all followed by a hold at 72°C for 10 min. 16S rDNA amplification products were purified and sequenced. The sequences were then taxonomically identified by comparison against the NCBI database, and phylogenetic trees were generated in the MEGA7.0 software program [19].
2.2.2. gryB gene Identification
Genomic DNA from strains WL1210 and CD303 was also used as templates for gyrBgene amplification using the forward primer UP2r: 5′-AGCAGG-GTACGGATGTGCGAGCCRTCNACRTCNGCRTCNGT-CAT-3′ and reverse primer UP1: 5′-GAAGTCATCATGAC-CGTTCTGCAYGCNGGNGGNAARTTYGA-3′. PCR amplification conditions included 95°C for 4 min; followed by 30 cycles of 98°C for 10 s, 62°C for 1 min, 72°C for 2 min; all followed by a final hold at 72°C for 8 min. gyrB amplification products were purified and sequenced, as described above, followed by phylogenetic analysis with MEGA7.0 [14].
2.3. Determination of Siderophore-Producing Activity
2.3.1. Quantitative and Qualitative Measurements
To identify siderophore production by strains WL1210 and CD303, they were inoculated into 5 mL of liquid LB medium and grown for 24 h. Holes were cored on a solid CAS medium, followed by the addition of bacterial culture broth or sterile water (as the control) into the holes. After 3 days of cultivation at 30°C, the presence of orange halos around the colonies was assessed.
Subsequently, strains were inoculated into 5 mL of liquid MSA medium and grown at 30°C, with shaking at 150 r/min for 48 h, followed by centrifugation at 6,000 r/min for 10 min. Then, 1.5 mL of supernatant and 1.5 mL of CAS solution were added to a 5 mL centrifuge tube and thoroughly mixed. After letting stand for 1 h, the absorption value (A) at 630 nm was determined, while deionized water was used as the control. In addition, 1.5 mL CAS solution was added to 1.5 mL of liquid MSA medium without bacterial culture and thoroughly mixed. The light absorption value was then determined as above and referred to as the reference ratio (Ar). The production of siderophores was calculated with the following standard formula (Equation (1)) and expressed as siderophore units (%SU). A/Ar was used as a quantitative index. Smaller ratios indicate greater yields of iron carriers. The general reference standard was A/Ar: 0–0.2, +++++; 0.2–0.4, ++++; 0.4–0.6, ++++; 0.6–0.8, ++; 0.8–1.0, + [20].
%SU (siderophore units) = (Ar – As)/Ar × 100
Identification of the Type of Ferrophilin Chelating Groups
Ferrophiles can be divided into four categories according to the structure of their molecular chelating groups: hydroxamic acid, catechol, hydroxycarboxylate and mixed (i.e., including more than two chelating groups). FeCl3 experiment, Arnow’s experiment and Shenker’s experiment were used to determine the chelating group structure type of ferrophilin produced by the strain [16].
(1)FeCl3 experiment: add 1−5 mL FeCl3 solution (2%) to 1 mL of supernatant, if it turns red or purple, there is ferrophilin, and if 1 mL of FeCl3 solution is added to 1 mL of supernatant and immediately turns red, it is hydroxamic acid type; If 1 mL of supernatant becomes red or purple after adding more than 1 mL of FeCl3 solution, it is catecholic.
(2) Arnow’s experiment: 1 mL of 0.5 mol/L HCl and 1 mL of 10% sodium molybdate-sodium nitrite solution were added to 1 mL of supernatant, and if there was a catechol structure in the solution, the nitrite decomposed to form a yellow ligand, and the solution turned yellow; Continue to add 1 mL of NaOH (1 mol/L) solution, which turns red (does not change color for at least 1 h) if it contains catechol ferrophile, and has a characteristic absorption peak at 510 nm on a UV spectrophotometer.
(3) Shenker’s experiment: 1 mL of CuSO4 (750 μmol/L) solution and 2 mL of acetate buffer (pH=4.0) were added to 1 mL of supernatant. The wavelengths in the range of 190−280 nm were scanned in a UV spectrophotometer to see if there were corresponding absorption peaks.
2.4. Indole-Acetic Acid Production, GA, CTK Capacity
To assess IAA production capacity, strains WL1210 and CD303 were inoculated into 5 mL of liquid LB medium and incubated at constant temperature, with shaking for 7 days. The strain cultures were then combined with Salkowski coloritic solution (10 mL 0.5 mol/L FeCl3 + 30 mL distilled water + 50 mL 98% H2SO4) at a 2:1 volume ratio, mixed into a white ceramic plate, and let stand in darkness for 30 min, followed by evaluation of color change. The procedure was repeated in triplicate. A color change to red indicated that the strain produced IAA.
Refer to the gibberellin ELISA detection kit for the reference. Cultivate the strains at 37 °C with 200 r/min shaking for 14 hours. Transfer 1.5 mL to a 2 mL centrifuge tube and centrifuge at 1000 r/min for 20 minutes. Take 0.5 mL of the supernatant and process it with the detection reagent from the kit, then place it in a 96-well plate. Measure the absorbance at OD450 using an enzyme-linked immunosorbent assay (ELISA) reader, construct a standard curve, and calculate the concentration of gibberellin and cytokinin in the strains [21].
After 24 h of growth, bacterial cultures were centrifuged (4°C, 10,000 r/min) for 10 min. Then, 2 mL of supernatant was taken and placed in a centrifuge tube, followed by the addition of an equal amount of colorimetric solution and determination of OD530 values after letting stand for 30 min in darkness. The amount of IAA produced by the strain was calculated according to a standard curve.
2.5. Phosphate Solubilization and Potassium Release Capacity
Inoculate the strains to be screened with sterilized toothpicks onto the plates of the Montjuina inorganic phosphorus bacterial medium and silicate bacterial medium. Cultivate them at a constant temperature of 28°C for 7 days and 1-2 days respectively. Observe and select the colonies that show phosphorus solubilization zones and oil droplet-like colonies for functional validation to determine their phosphorus solubilization and potassium release effects.
2.6. Determination of Cd2+ Tolerance
Strains WL1210 and CD303 were cultured on a solid LB medium containing 20, 40, 60, and 80 mg/L Cd2+ for 1 d to observe their growth under Cd2+ stress [22]. CdCl2 was also added to the pre-prepared liquid LB medium at Cd2+ concentrations of 20, 40, 60, and 80 mg/L. The OD value at 600 nm was then determined based on turbidity using a liquid LB medium as the control (CK). Absorbances were measured every 6 h from 0 h onward until 48 h. The growth of the strains under Cd2+ stress was then observed.
2.7. Effect of Strains on Ryegrass Growth under Cd2+ Stress
2.7.1. Determination of Cd2+ Effects on Ryegrass Seed Germination
Ryegrass seeds of uniform size and that were full were selected and disinfected with 20% sodium hypochlorite solution for 30 min. They were then repeatedly rinsed with deionized water 3–4 times, and CdCl2 solutions of 0 (CK), 20, 40, 60, and 80 mg/L were prepared. After high-temperature sterilization, 5 mL of CdCl2 solutions of the same volume but different concentrations were added to the clean petri dish to saturate the filter paper. Seeds were seeded in the petri dish, with 30 seeds treated per group, and triplicate dishes per group. Sterile water treatment was used as the control and was cultured at room temperature (21°C), with a light/dark period of 12 h/12 h.
The number of germinated seeds in each treatment was recorded every day until the seeds no longer germinated. The germinated seedlings were gently removed with tweezers, followed by the determination of seedling heights and root lengths. Survey data were used to determine germination potential, germination rate, germination index, and the vitality index of treated seeds, as previously described [23,24]. Germination potential was calculated by (GV,%) = (number of germinated seeds after 7 days/number of tested seeds)×100%. Germination rate was calculated as (GR,%) = (number of germinated seeds after 10 days/number of tested seeds) ×100%. The germination index was calculated as (GI) = ΣGt/Dt, where Gt is the number of germinated seeds at time t and Dt is the corresponding days of germination. Finally, the vitality index was calculated as (VI) = GI×S, where GI is the germination index and S is the seedling length for a certain period.
2.7.2. The Effect of the Strain on Ryegrass Growth under Cd2+ Stress
To evaluate the effect of strain inoculation on ryegrass growth due to Cd2+ stress, a Bacillus suspension was prepared and cultured in 5 mL of liquid LB medium for 12–14 h at 37°C and with shaking at 180 r/min. The culture was then transferred to a 50 mL centrifuge tube and centrifuged at 10°C and 8,000 r/min for 10 min. The cell pellet was aseptically washed three times, and 50 mL of sterile water was added to generate a bacterial suspension. LB liquid alone was used as the control. The OD600 values were measured and cell concentrations were adjusted to 1 × 10⁷ CFU/mL (OD600 = 1.0) [25].
To evaluate the effects of strains on ryegrass growth, natural soil and vermiculite were mixed at a 2:1 ratio and sterilized by autoclaving at 121°C for 1 h, followed by laying soils on plastic. The prepared Cd2+ solutions at different concentrations were sprayed on the sterilized soil, evenly mixed, and allowed to sit for 15 days to achieve heavy metal stabilization. To allow Cd2+ to fully absorb into soils to prevent leaching loss in later watering, sterilized soil was used as the control (CK) and ryegrass seeds were soaked in a 20% sodium hypochlorite solution for 30 min and rinsed with sterile water.
Thirty disinfected ryegrass seeds were randomly selected and planted in 0.35 L flowerpots with a diameter of 10 cm and a height of 10 cm for pot experiments, followed by culturing in an intelligent artificial climate box (25°C, light/dark period of 16 h/8 h). When seedling heights reached 5–10 cm, the plants were irrigated with 50 mL of a bacterial suspension once every 3 days, while the control group was treated with the same volume of sterile water. After 20 days of cultivation, seedlings were removed for root washing treatment, and 15 ryegrass seedlings from each group under different treatments were used to measure indicators such as plant height, root length, and fresh weight [26].
Here’s a tabular representation of the treatment groups as described (Table 1).
This table provides a clear overview of the experimental setup, including the control group, the application of bacterial suspension (WL1210 or CD303), and the different levels of Cd2+ stress treatment.
2.7.3. The Effects of the Strain on Physiological Indicators of Ryegrass under Cd2+ Stress
Measurement of chlorophyll content
The experimental guide of plant physiology was used as a reference for measuring chlorophyll 26[26]. A total of 0.4 g of ryegrass leaves were placed in a mortar, and a small amount of quartz sand was added, in addition to calcium carbonate powder and 5 mL of 95% ethanol, followed by grinding the mixture to a homogenate. A small amount of ethanol was added, and the mixture was ground until the tissue turned white, and then it was allowed to sit for 30 min. The mixture was then strained into a 50 mL brown volumetric bottle, the mortar and glass rod were washed with ethanol, and the bottle was filled with 95% ethanol up to 50 mL. This process was repeated twice. The solution was poured into a colorimetric dish, and the absorbances were measured at wavelengths of 663, 645, and 470 nm. Each replicate was measured three times at different wavelengths, and the values were averaged. The concentrations of chlorophyll a and chlorophyll b were added together to obtain the total chlorophyll concentration using the formulas below(Equation (2)).
Calculation of pigment concentration in 95% ethanol extract:
Ca (chlorophyll a) = 13.95A665 − 6.8A649
Cb (chlorophyll b) = 24.96A649 − 7.32A665
CT (chlorophyll)= Ca + Cb = 18.16A649 + 6.63A665
Measurement of proline content
A plant proline ELISA detection kit was used to measure proline concentrations. Briefly, 0.05 g of fresh ryegrass leaves were added to 0.5 mL of extract solution and ground to a homogenate in an ice bath. The mixture was then extracted in a boiling water bath for 10 min and centrifuged at room temperature for 10 min at 10,000 r/min. The supernatant was then measured and allowed to cool before measurement. A standard curve of the equation Y=kx+b was used to calculate the measured proline concentrations. Measures were calculated according to sample fresh weight as Pro(g/g fresh weight) = Y × V inverse total ÷ (V sample ÷ V sample total × W) = 3XY ÷ W, where W refers to sample quality.
Measurement of protein content
Protein concentrations were detected using a BCA protein content kit. Briefly, 0.05 g of ryegrass leaves were added to 0.5 mL of distilled water in an ice bath, followed by grinding to a homogenate and centrifuging at 12,000 rpm at 4°C for 10 min. The supernatant was then used for measurement. Standard curves were prepared and used for calculations. Sample fresh weight calculations were conducted using the equation: Cpr fresh weight (mg/g) = [(Y + 0.0046) present 0.188 x 10⁻³] present (V1 present V (W) * D = 1.06 * (Y + 0.0046) present W * D, where W is sample quality and D is the dilution ratio, with undiluted defined as 1.
2.8. Whole Genome Sequencing
Genome sequencing was conducted for strain Bacillus CD303 inoculated into 5 mL of liquid LB medium that was incubated at 37°C, with shaking at 200 r/min for 14 h, followed by centrifugation at 10,000 r/min for 10 min. The resultant cell pellet was quick-frozen in liquid nitrogen and subjected to genomic sequencing at the Shanghai Meiji Biomedical Science and Technology Co.
2.9. Statistical Analysis
The plant indexes of different treatments were analyzed by one-way analysis of variance (ANOVA) in SPSS 25. The level of significance between different treatments was tested at P < 0.05 using multiple comparisons (LSD test). Before data analysis, the single sample Kolmogorov-Smirnov test was used to test the normality of the data to indicate whether the data followed the normal distribution and the graphs were drawn by Origin (2021). tRNAscan-SE v2.0 software (http://trna.ucsc.edu/software/) was used to predict the tRNA contained in the genome.
3. Results
3.1. Molecular Characterization of Strains
16S rDNA and gyrB genes were amplified from strains WL1210 and CD303. Comparison of 16S rDNA genes with the NCBI database revealed that strains WL1210 and CD303 exhibited 100% homology with 16S rDNA genes of B. atrophaeus BA59 and B. atrophaeus HYB6, respectively (Figure 1A). gyrB comparisons indicated that strains WL1210 and CD303 exhibited 100% homology with B. atrophaeus WU-6 and B. atrophaeus EG1131, respectively (Figure 1B). Consequently, strains WL1210 and CD303 were identified as B. atrophaeus.
3.2.1 Siderophore-Producing Activities
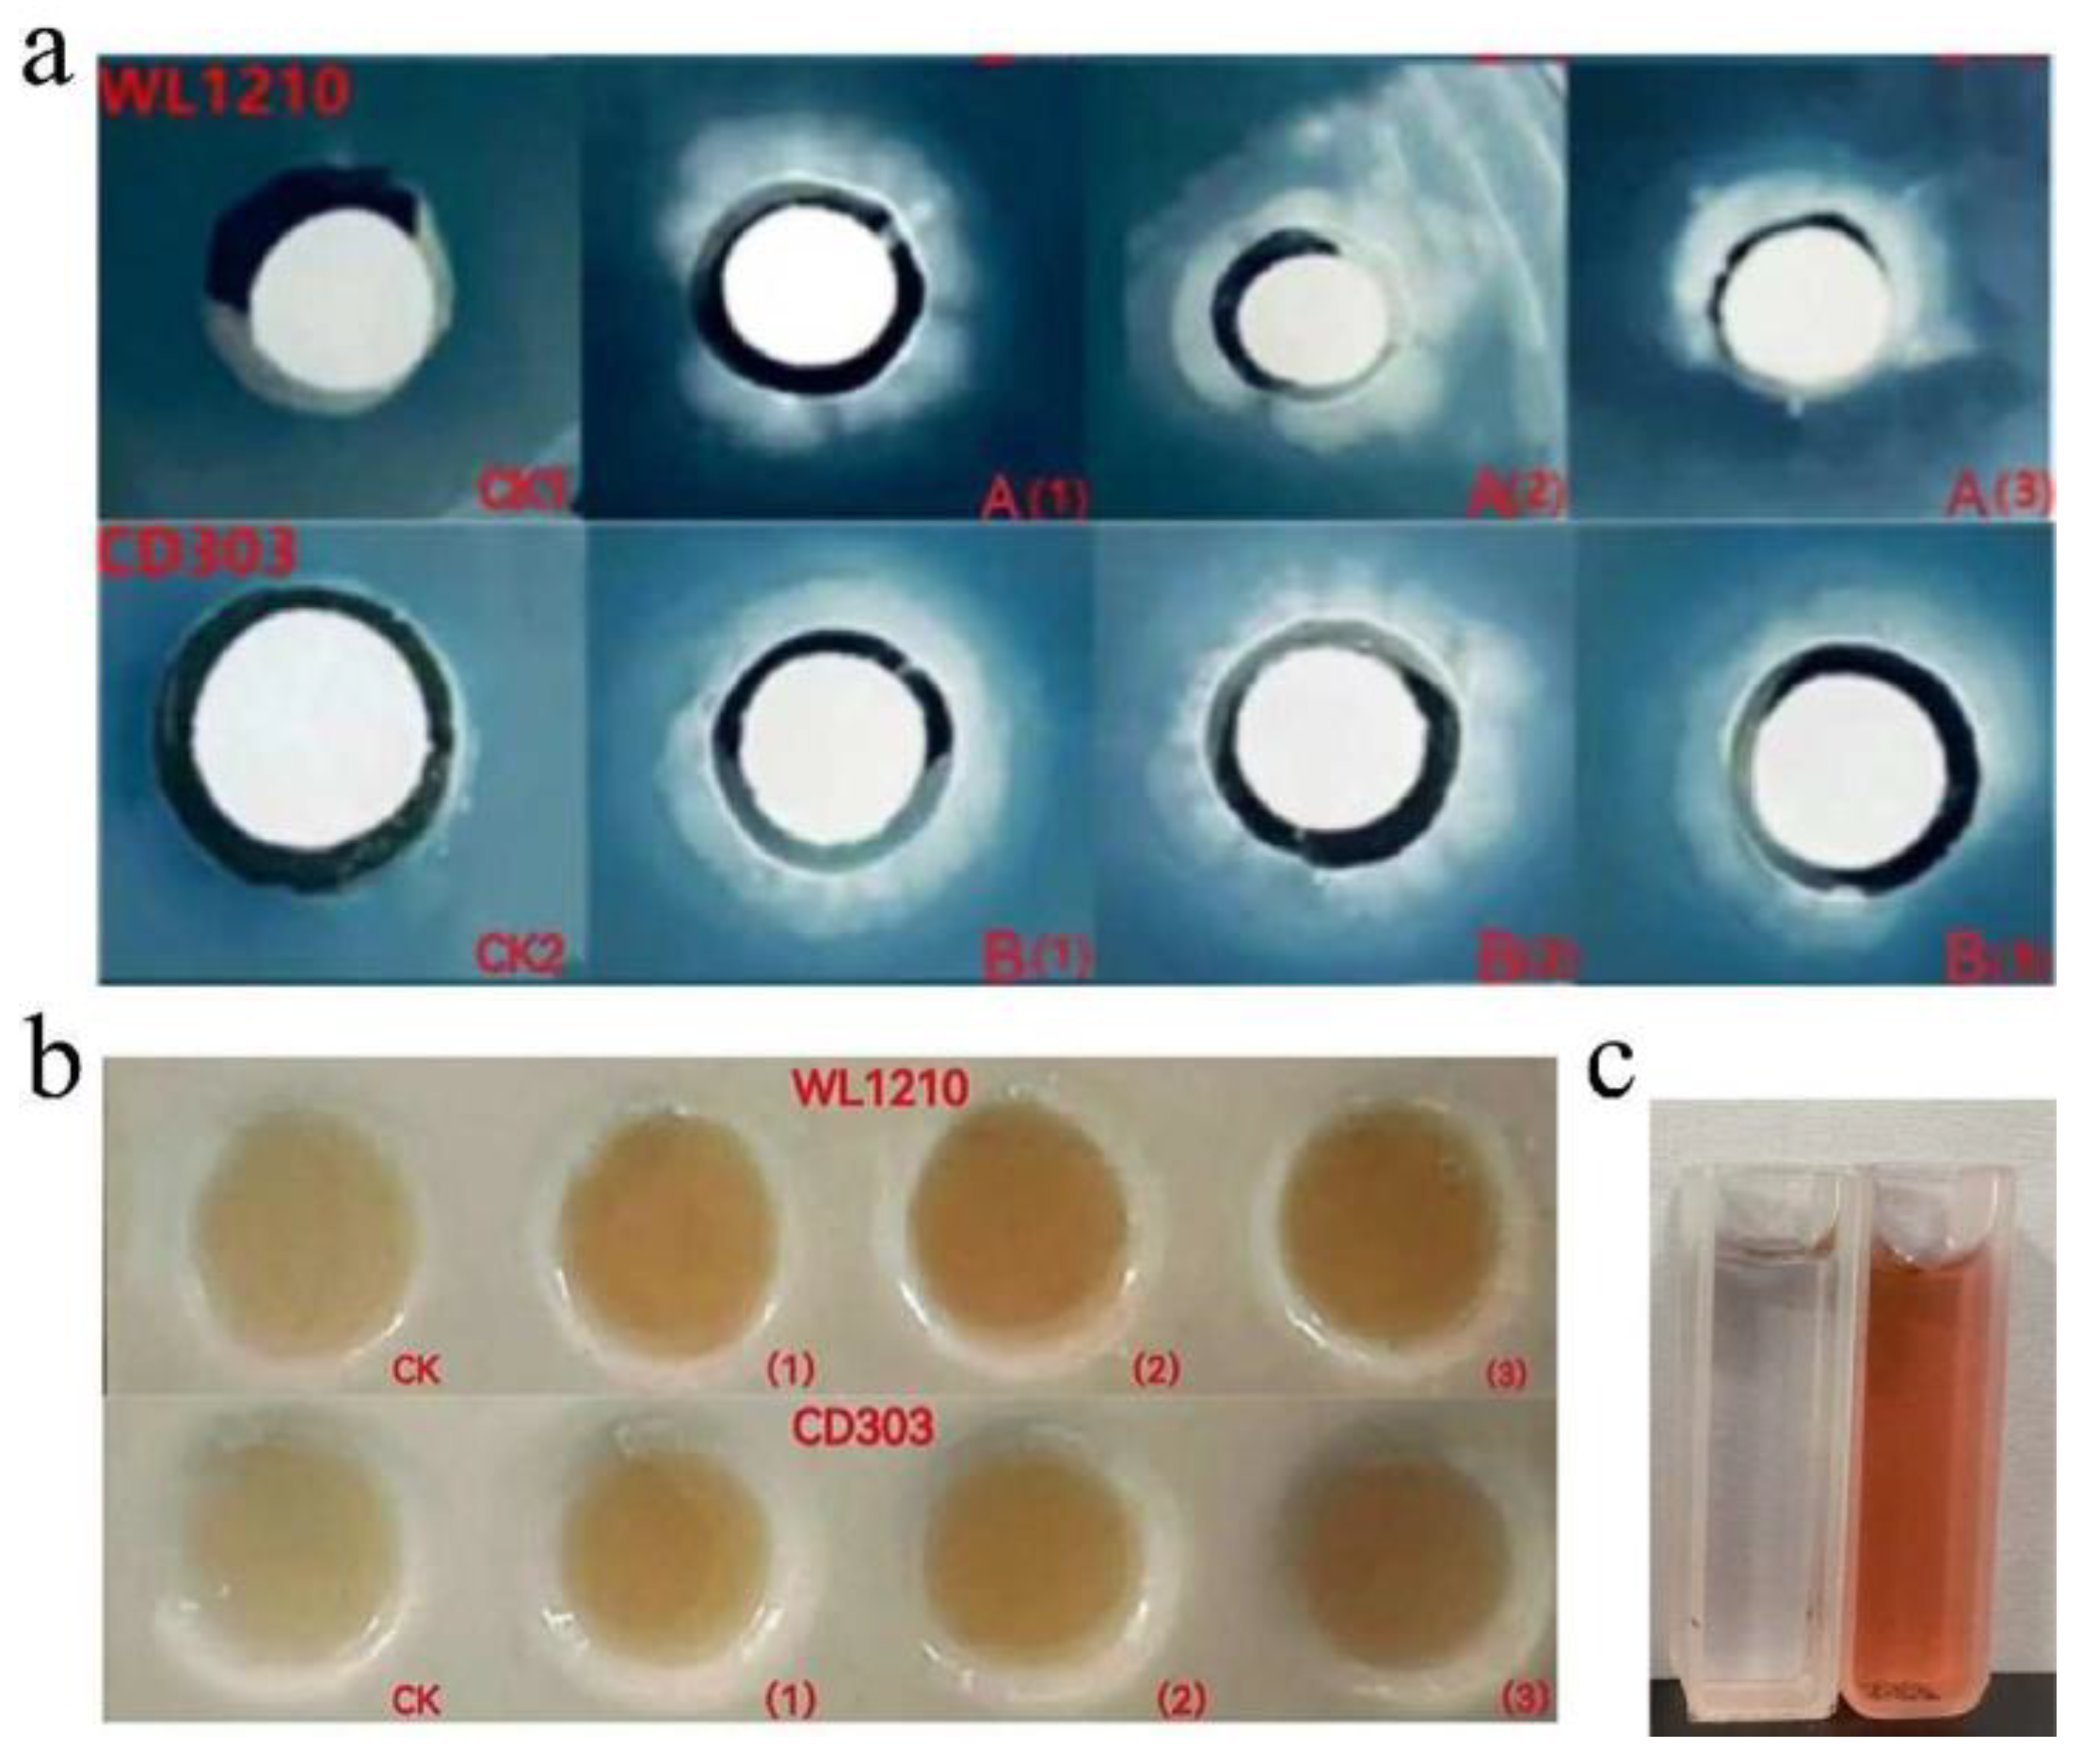
Color changes due to strains WL1210 and CD303 on CAS media were observed, with light yellow halos identified around the colonies (Figure 3a). The OD values for strains WL1210 and CD303 at 630 nm were 1.545 and 1.213, respectively. Consequently, the ferriferic activity of strains WL1210 and CD303 was 36.16% and 49.88%, respectively (Table 2), indicating that both strains exhibited good siderophore production ability.
3.2.2. Identification of the Type of Ferrophilin Chelating Groups
Using the Arnow method, the WL1210 solution turned red immediately after NaOH was added to the fermentation supernatant (Figure 3c), and an absorption peak was detected at 510 nm. The ferrophilin produced by the strain CD303was identified as catechols (Figure 2); The Shenker method was used to detect the maximum absorption peak of strain CD303 at 190-280 nm, so the degree of strain CD303 was identified as carboxylic acid ferrophilin.
3.3. Strains Ability to Produce CTK, GA and IAA
The standard curve of cytokinin and gibberellin were made, and the standard equations were obtained: Y=0.0419X+0.0683 and Y=4.762X+0.0673. It was found that the yields of CTK and GA of strains WL1210 and CD303 were 5.18 nmol/L, 4.30 nmol/L, 3.54 nmol/L and 4.82 nmol/L respectively.
The IAA production abilities of the strains were qualitatively and quantitatively measured. The strains caused the Salkowski solution to turn red, indicating IAA production capacity. The equation for the standard curve was y = 0.032x + 0.019, while the absorbance of strains WL1210 and CD303 at 530 nm was 0.276 and 0.241, respectively. Thus, the IAA concentrations secreted by strains WL1210 and CD303 were 8.03 and 6.94 mg/L, respectively, consequently indicating good IAA production capacity (Figure 3b).
Figure 3.
Siderophore production of strains on CAS blue plates. (a); IAA chromoproduction by strains. (b); The color testing results of structure types of siderophore chelating groups. (c).
Figure 3.
Siderophore production of strains on CAS blue plates. (a); IAA chromoproduction by strains. (b); The color testing results of structure types of siderophore chelating groups. (c).
3.4. Phosphorus Solubilization and Potassium Release Activity Assay
Phosphorus and potassium are essential nutrients for plant growth, and play an extremely important role in the growth and development of plants. The bacterial suspension of the strains was inoculated on the organophosphorus medium of Monascus for 3d, and it was found that both strains could dissolve organophosphorus to different degrees; the strains were inoculated on the plate of silicate bacterial medium and cultured in a constant temperature incubator for 1-2d, and it was observed that there were oil droplet colonies in the plates of the two strains, which indicated that the two strains had a better function of potassium solubilisation (Figure 4).
3.5. Cd2+ Tolerance of Strains
The Cd2+ tolerances of strains WL1210 and CD303 were determined. Strains WL1210 and CD303 could slowly grow after 24 h of culture on solid LB medium with Cd2+ concentrations of 20, 40, 60, and 80 mg/L. The absorbance values at 600 nm were measured every 6 h under Cd2+ exposure. Increases in Cd2+ concentration caused a gradual slowing of strain growth, indicating that Cd2+ stress inhibited growth. Nevertheless, the two strains could grow under different Cd2+ concentrations and exhibited slow growth over 48 h. Thus, the two strains exhibited some tolerance to different Cd2+ concentrations (Figure 5).
3.6 Effect of Strains on Ryegrass Growth Promotion under Cd2+ Stress
3.6.1. Effects of Cd2+ Stress on Ryegrass Seed Germination
The germination rate of ryegrass seeds under Cd2+ stress was determined. Compared with the control group (CK), the seed germination rate was less affected by Cd2+ following exposure to concentrations of 20, 40, and 60 mg/L for 7 days of cultivation, with germination rates remaining above 75%. After the 10th day, the germination rate remained above 80%, while the GI and VI were above 4.8 and 8.7, respectively. At 80 mg/L Cd2+ concentration, the germination rates of seeds were significantly inhibited. The seed germination rate of ryegrass after 7 days was only 18%. After 10 d, the germination rate remained above 34.67%, while the GI and VI were only about 1.4. Thus, the ryegrass seeds exhibited Cd tolerance and could normally germinate when Cd2+ concentrations were low. However, at Cd2+ concentrations of 80 mg/L, toxicity resistance was reduced and seed germination was limited (Table 3 and Table 4).
3.6.2. Effects of Strains on Ryegrass Biomass under Cd2+ Stress
The germination experiments revealed that ryegrass seed germination was inhibited due to 80 mg/L Cd2+ stress. Under different concentrations of Cd2+ stress, WL1210 and CD303 strain suspension inoculation significantly promoted ryegrass seedling growth. Compared with the control group (CK), after root irrigation with strain WL1210 and CD303, the ryegrass of plant heights, root lengths increased by 27.7%, 13.6%(44.7%,35.1%), respectively, all showed significant differences. Plant height and root length were better than those of ryegrass treated with cadmium stress only at different concentrations, indicating that the addition of bacterial suspension could promote the growth of ryegrass to a certain extent. 20 mg/L Cd2+ concentration showed a significant difference in plant height, indicating that cadmium stress at low concentrations had a promotional effect on the growth of ryegrass, and certain cadmium ion stress can promote root growth. After adding WL1210 and CD303 strain suspensions (80+W and 80+C) under 80 mg/L Cd2+ stress, ryegrass growth maintained some Cd tolerance and was less affected by Cd2+ stress relative to controls. A strong chelation effect has been observed between siderophores and heavy metal ions in recent years, with siderophore-producing strains generally having higher tolerance to heavy metals, further supporting that the two strains promote the growth of ryegrass under Cd stress (Figure 6).
3.6.3. Effects of Strains on Chlorophyll Contents of Ryegrass under Cd2+ Stress
Compared with the control (CK), the chlorophyll contents of ryegrass increased by 80% and 77.8% after treatment with WL1210 and CD303 suspensions respectively. The protein content of ryegrass with the same volume of bacterial suspension added at 20 mg/L, 40 mg/L Cd2+ concentrations were elevated and significantly different from the chlorophyll content under cadmium stress treatment only when compared to the control, whereas the chlorophyll content was elevated at 60 mg/L, 80 mg/L concentrations when compared to the control, but there was no significant difference. Cd stress inhibited plant photosynthesis. After adding WL1210 and CD303 strain suspensions under 80 mg/L Cd2+ stress, the chlorophyll contents decreased compared with the control (CK), although the effect was small. Furthermore, the plants maintained relatively normal photosynthesis activity, indicating that the two strains significantly affected plant resistance to toxicity (Figure 7A,B).
3.6.4. Effects of Strains on Proline Content of Ryegrass under Cd2+ Stress
Proline concentrations in plants reflect their stress resistance. A standard proline curve was established by the equation: Y=164.75X+8.3415. Compared with control (CK), plant proline content increased after bacterial suspension inoculations (WL1210 and CD303), Increases of 23.6% and 35.9%, respectively. under different concentrations of Cd2+ stress, after adding the same volume of bacterial suspensions, Proline content was also increased in all. At 80 mg/kg Cd2+ stress, the proline contents of WL1210 and CD303 bacterial suspension-treated plants after root administration were up to 46.85 and 56.88 g/g, respectively. Thus, the ryegrass proline contents under Cd stress increased and inoculation with strains WL1210 and CD303 can reduce Cd stress damage to ryegrass through cellular osmosis regulation and enhance plant stress resistance (Figure 7C,D).
3.6.5. Effect of Cd2+ and Strain Inoculation on Ryegrass Protein Concentrations
Proteins can participate in plant enzymatic reactions and maintain the stability of cellular environments. A standard equation was obtained for protein quantification: Y=0.188X-0.0046. Compared with the control (CK), the protein contents of ryegrass were significantly higher by 80% and 77.8%, respectively, after inoculation with bacterial suspensions (WL1210 and CD303, respectively), representing significant differences from the control (CK). Under different concentrations of Cd2+ stress, the protein concentrations increased when considering the pairwise comparisons, indicating that the two strains promoted the growth of ryegrass seedlings and maintained normal plant growth under Cd stress. These results reflect the indirect growth promotion effects of the strains (Figure 7E,F).based on a t-test.
3.7. Genomic Characteristics of Strain CD303
The whole genome of strain CD303 comprised a circular chromosome of length 4,288,753 bp (Figure 8). Average GC content was 43.19%, the number of total reads was 54,544, and the total base length was 608,867,443 bp. A total of 4,084 coding sequences were identified, and the total length of coding genes was 3,716,880 bp, while the average coding sequence length was 910.11 bp. The genome encoded 24 rRNA genes, including 8 16S, 8 23S, and 8 5S rRNA genes, in addition to 82 tRNAs and 89 sRNAs. A total of 38 tandem repeats were identified covering a total length of 13,852 bp. Logged as CP135964.
3.8. Functional Genes within the CD303 Genome
3.8.1. Growth-Promoting Functional Genes
Gene functional annotation analysis revealed the presence of glpQ, hxlA, and hxlB in the CD303 genome that are key genes involved in growth hormone synthesis and the tryptophan-dependent IAA synthesis pathway of Bacillus. Numerous studies have shown that Bacillus can synthesize IAA that promotes plant growth. In addition, the genes miaA and miaB related to cytokinin synthesis were identified in the genome. Cytokinin can participate in plant growth and development, in addition to improving plant tolerance to abiotic stress. In addition, the CD303 genome encodeds various functional genes involved in direct growth promotion of Bacillus, including ndhF, YBCL, frmA, phnB, glnA, and glnR that are involved in the synthesis of nutrients required for plant growth and development, nitrogen fixation, phosphorus dissolution, and other processes that improve soil environments, thereby promoting plant growth. fnr and iscA encode proteins related to the synthesis and transport of iron carriers that can increase the iron content of plants by chelating iron. Consequently, these iron-producing carrier proteins can indirectly promote the growth of plants by binding heavy metal ions, thereby reducing the toxicity of metals in plants (Table 5).
3.8.2. Functional Annotation of the CD303 Gene
COG annotation results: the genome sequence of strain CD303 was compared with the eggNOG database for COG functional annotation. A total of 3,258 genes were annotated, accounting for 79.77% of all genes, and four classifications and 23 types were performed. Among the predicted known functional genes, the number of genes related to the functions of amino acid transport and metabolism, carbohydrate transport and metabolism, general function prediction and translation, ribosome structure and biogenesis, and signal transduction mechanism was high (Figure 9).
3.8.3. Stress Tolerance-Related Functional Genes
The CD303 genome also encoded key genes involved in inducing plant stress resistance. For example, glmS and tarS can improve mechanical strength, help maintain cell shape, and assist cell movement and growth. A gene cluster was identified that encoded lipopeptid antibacterial proteins, including LicA, LicB, LicC, Pangraptin, and surfactant proteins that can significantly inhibit the growth of Fusarium fungi. Furthermore, the CD303 genome harbored functional genes encoding osmoregulatory proteins involved in responses to abiotic stress. Specifically, the gene cluster containing mgtC was encoded that regulates intracellular pH, maintains ionic homeostasis, and promotes cell growth under stress. Furthermore, proB and proC were identified that encode proline and betaine osmotic proteins that can increase tolerance to osmotic stress. The genome also encoded several drug-resistant genes, with a total of 283 drug-resistant genes identified, including clusters with bsdA and oxa (Table 5).
4. Discussion
Soil is a non-renewable resource that is generated at a rate of a few centimeters per millennium. It provides a habitat for most species on Earth and plays a key role in supporting ecosystems and human society as a medium for crop production [27,28]. However, human activities are causing widespread soil contamination and degradation, with heavy metal pollutants being the main soil contaminants [29,30]. The five most common heavy metals in soil include cadmium. The three main schemes for the remediation of heavy metal-contaminated soil are phytoremediation, microbial remediation and integrated methods [31]. Bioremediation tends to be more sustainable than traditional remediation. Bioremediation also brings other sustainability benefits, including reduced costs, improved worker safety, and a smaller lifecycle environmental footprint, thereby maximizing the economic, social, and environmental benefits of soil remediation [32,33]. These benefits have prompted the restoration industry to switch to this nature-based solution [31].
Beneficial soil microorganisms, specifically Bacillus spp., possess intrinsic characteristics that are instrumental in promoting plant growth and safeguarding against environmental stressors. Plant hormones, as endogenous metabolic products within plants, serve as critical signaling molecules that are integral to the entire growth and development process of the plant, exerting significant influence throughout its life cycle. During various stages of plant development, a variety of plant hormones engage in synergistic or antagonistic interactions to guide normal plant growth, including adaptation to environmental conditions and resistance to both abiotic and biotic stressors. The functions of Bacillus, such as phosphorus solubilization and potassium release, are of paramount importance for enhancing soil fertility, reducing the application of chemical fertilizers, and advancing sustainable agricultural practices [34]. Siderophore-producing bacteria (SPB) are growth-promoting microorganisms that exhibit high resistance to heavy metals and can alleviate the toxicity of heavy metals to plants, thereby improving plant tolerance to heavy metals [35]. The beneficial bacillus WL1210 and CD303 can promote the growth of ryegrass. Here, we investigate the properties of WL1210 and CD303 at the physiological and genetic levels. The results showed that the plant height and root length of ryegrass irrigated with WL1210 and CD303 bacterial suspensions increased, and the chlorophyll and protein content of ryegrass increased, while the proline content decreased, but the proline content increased with the increase of cadmium concentration. Studies have reported a considerable proportional increase in proline content as the concentration of heavy metals increases. Cadmium has been shown to be the strongest inducer of proline accumulation. Therefore, we hypothesized that the accumulation of proline could serve as a marker to detect the level of heavy metal pollution [39].
Some bacteria can adsorb heavy metal ions through functionally active groups and protein groups on the surface of the cell wall, or they can precipitate and chelate heavy metals through protein binding [36]. The toxicity and stress effects of heavy metals are attenuated by various redox effects in the cytoplasm of bacterial cells, such as the change of heavy metal ions from a toxic state to a low-toxicity or non-toxic state. Extracellular metabolites, such as organic acids and siderophores, can also be secreted into the soil. The chelation of these compounds can promote the conversion of heavy metal ions in the soil from insoluble to soluble, thereby improving bioavailability [37].
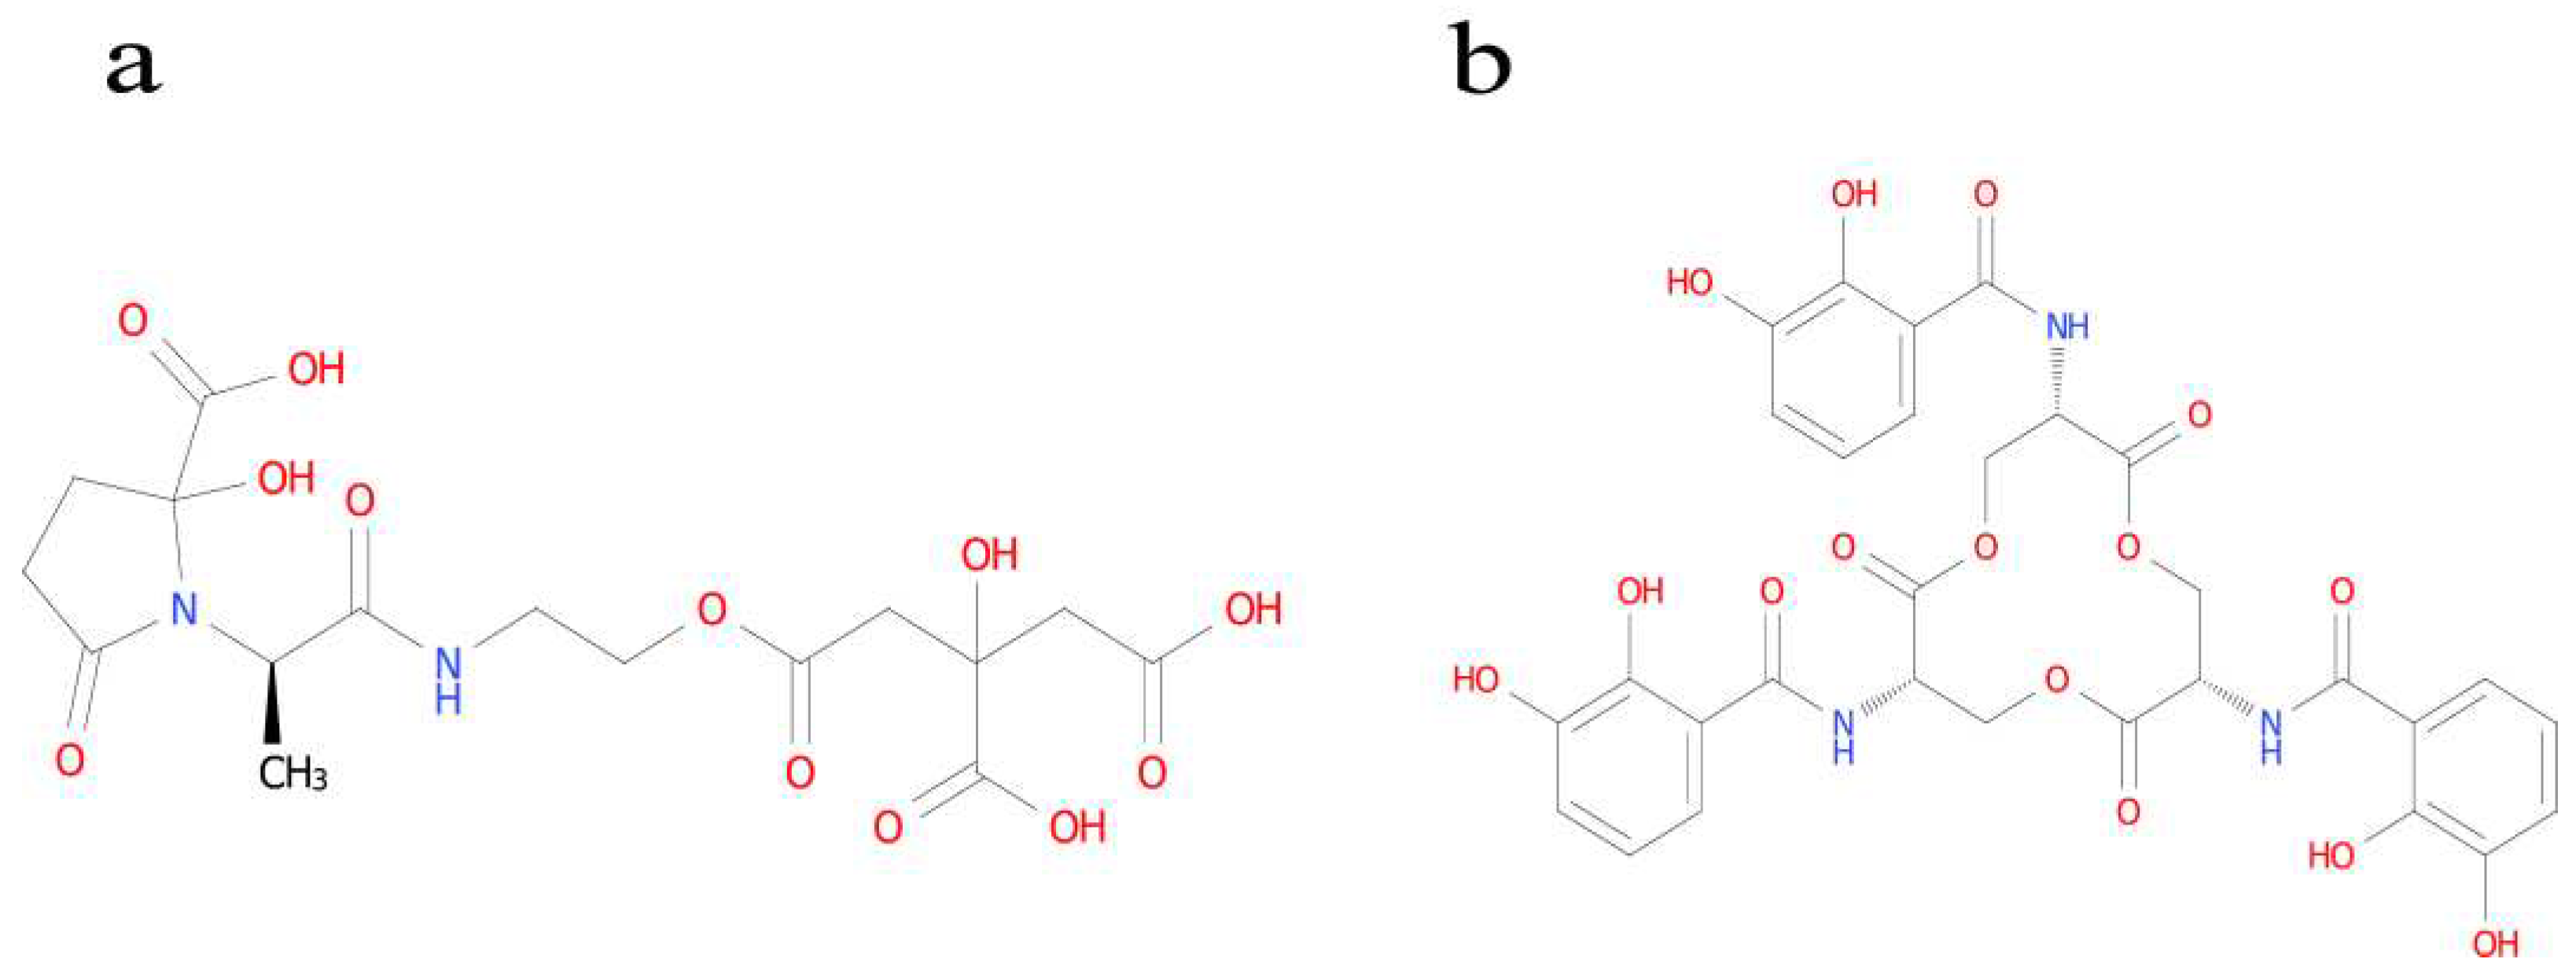
In the process of determination of strains WL1210 and CD303, we found that both strains had the ability to produce iron carriers, which is very satisfactory. Subsequently, the identification of iron carrier types was carried out. The WL1210 is a catecholic type (Figure 11a), and CD303 was identified as carboxylic acid ferrophilin (Figure 11b). Carboxylate ferrophore is a siderophore containing carboxylic acid groups, which can form carboxylate complexes with cadmium ions, thereby chelating cadmium ions, and the chelating ability is relatively good. Through tRNA prediction after whole-genome sequencing of CD303, it was found that it contains aspartic acid [38], which constitutes carboxylate ferrophores, so CD303 may alleviate the contamination of soil by cadmium ions by chelating cadmium ions through its ability to produce carboxylate ferrophores.
Figure 10.
Pathways of Bacillus CD303 and WL1210 to alleviate ryegrass stress under heavy metal stress.
Figure 10.
Pathways of Bacillus CD303 and WL1210 to alleviate ryegrass stress under heavy metal stress.
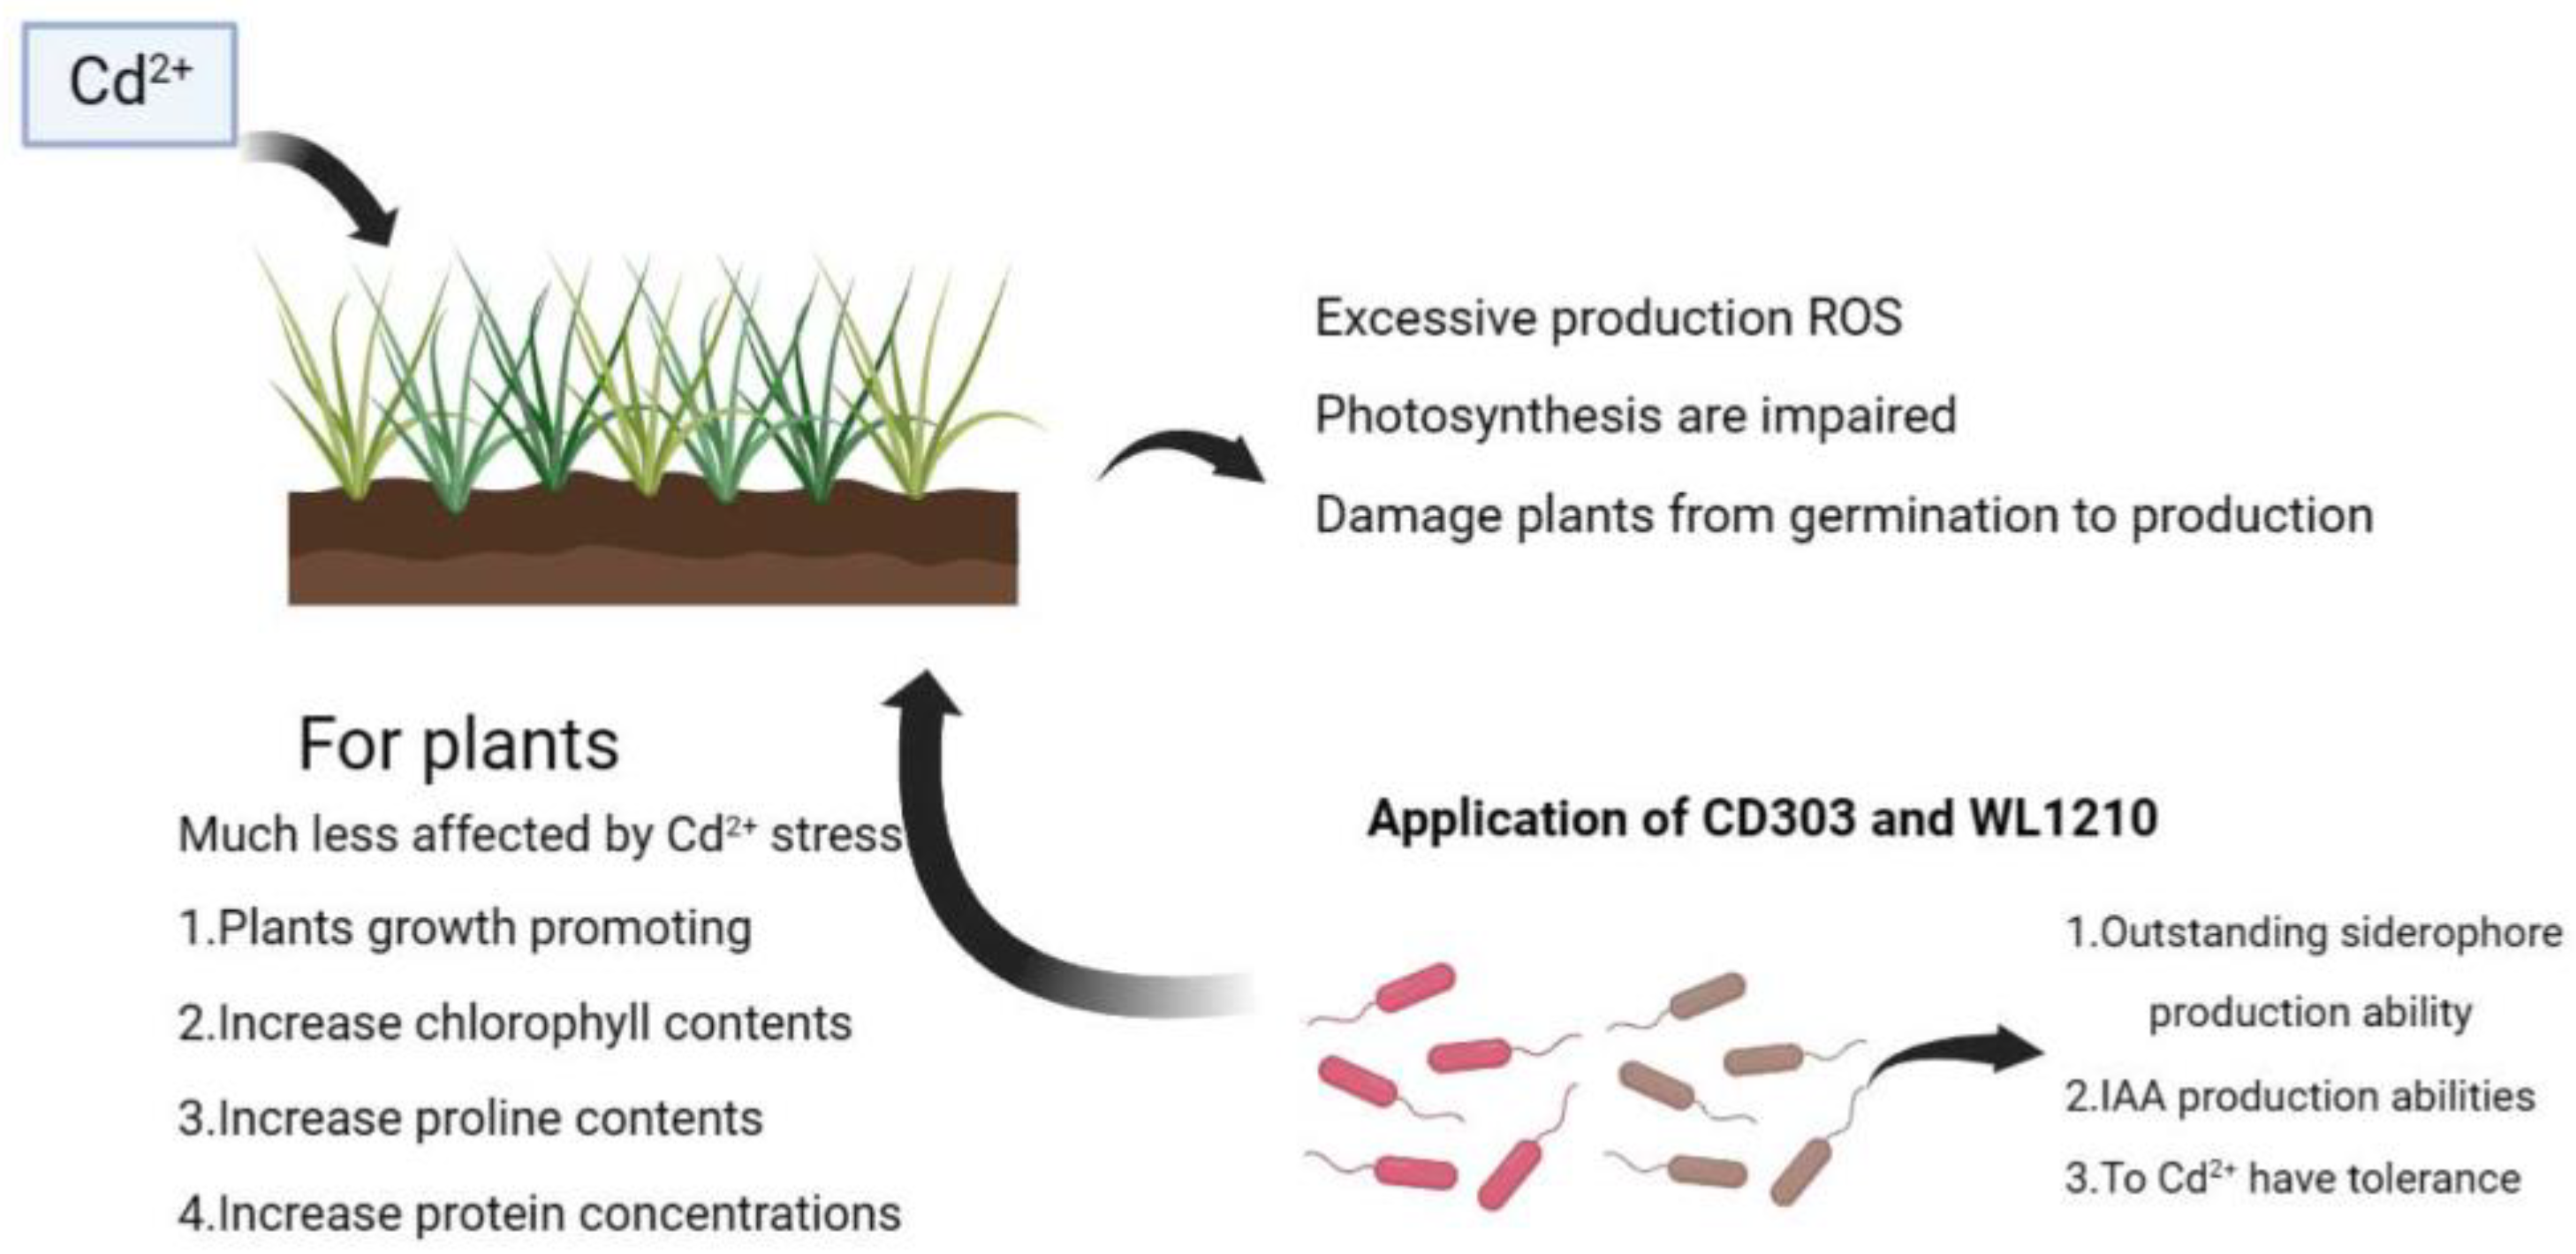
Figure 11.
Structure of:catecholate siderophore: enterobactin(a);carboxylate siderophore: vibrioferrin(b).
Figure 11.
Structure of:catecholate siderophore: enterobactin(a);carboxylate siderophore: vibrioferrin(b).
Supplementary Materials
The following supporting information can be downloaded at the website of this paper posted on Preprints.org. Author Contributions: J.L.F. wrote the manuscript. M.A.R.V. and M.C. have meticulously reviewed and suggested modifications to the manuscript. All authors have read and agreed to the published version of the manuscript.
Author Contributions
L.L.W. wrote the manuscript. Y.L.X. and J.X.L have meticulously reviewed and suggested modifications to the manuscript. All authors have read and agreed to the published version of the manuscript.
Funding
This study was funded by the Applied Basic Research Project of Qinghai Provincial Science and Technology Department (2023-ZJ-709) and the National Natural Science Foundation of China (32160030).
Data Availability Statement
All the data are presented in the paper.
Acknowledgments
The authors thank the Director of the College of Agriculture and Animal Husbandry, Qinghai University.
Conflicts of Interest
The authors declare no conflict of interest.
References
- Zulfiqar, U.; Haider, F.U.; Maqsood, M.F.; et al. Recent Advances in Microbial-Assisted Remediation of Cadmium-Contaminated Soil. Plants 2023, 12, 3147. [Google Scholar] [CrossRef]
- Zulfiqar, U.; Jiang, W.; Xiukang, W.; et al. Cadmium Phytotoxicity, Tolerance, and Advanced Remediation Approaches in Agricultural Soils; A Comprehensive Review. Front. Plant Sci. 2022, 13, 773815. [Google Scholar] [CrossRef] [PubMed]
- Adil, M.; Sehar, F.; et al. Cadmium-zinc cross-talk delineates toxicity tolerance in rice via differential genes expression and physiological/ultrastructural adjustments. Ecotoxicol. Environ. Saf. 2020, 190, 110076. [Google Scholar] [CrossRef]
- Ge, J.; Liu, L.L.; Cui, Z.G.; et al. Comparative study on protective effect of different selenium sources against cadmium-induced nephrotoxicity via regulating the transcriptions of selenoproteome. Ecotoxicol. Environ. Saf. 2021, 215, 112135. [Google Scholar] [CrossRef]
- Zulfiqar, U.; Ayub, A.; Hussain, S.; et al. Cadmium Toxicity in Plants: Recent Progress on Morpho-physiological Effects and Remediation Strategies. J. Soil Sci. Plant Nutr. 2022, 22, 212–269. [Google Scholar] [CrossRef]
- Zulfiqar, U.; Jiang, W.; Xiukang, W.; et al. Cadmium Phytotoxicity, Tolerance, and Advanced Remediation Approaches in Agricultural Soils; A Comprehensive Review. Front. Plant Sci. 2022, 13, 773815. [Google Scholar] [CrossRef] [PubMed]
- Liu, H.; Yuan, R.; Sarkodie, E.K.; et al. Insight into functional microorganisms in wet-dry conversion to alleviate the toxicity of chromium fractions in red soil. Front. Microbiol. 2022, 13, 977171. [Google Scholar] [CrossRef] [PubMed]
- Hua, D.S.; Jie, L.; Qibiao, L.; et al. Highly effective adsorption and passivation of Cd from wastewater and soil by MgO- and Fe3O4-loaded biochar nanocomposites. Front. Environ. Sci. 2023, 11. [Google Scholar] [CrossRef]
- Akhtar, N.; Ilyas, N.; Yasmin, H.; et al. Role of Bacillus cereus in Improving the Growth and Phytoextractability of Brassica nigra (L.) K. Koch in Chromium Contaminated Soil. Molecules 2021, 26, 1569. [Google Scholar] [CrossRef]
- Wang, D.S.; Wang, L.L.; Li, T.Q.; et al. Enhancing effect of siderophore-producting bacteria on remediation of cadmium-contaminated soil by Solanum nigrum L. J. Environ. Eng. 2018, 12, 2311–2319. [Google Scholar]
- Zhang, Y.; He, L.; Zeng, Q.; Sheng, X. Surfactin production by Bacillus subtilis B12 under Cd stress and its effect on biofilm formation and Cd removal. Microbiol. China 2021, 48, 1883–1894. [Google Scholar]
- Li, Q.; Xing, Y.; Huang, B.; et al. Rhizospheric mechanisms of Bacillus subtilis bioaugmentation-assisted phytostabilization of cadmium-contaminated soil. Sci. Total Environ. 2022, 825, 154136. [Google Scholar] [CrossRef]
- Liu, Y.C.; Li, B.Z.; Wang, T.; et al. Study of Two Microbes Combined to Remediate Field Soil Cadmium Pollution. J. Soil Water Conserv. 2020, 34, 364–369. [Google Scholar]
- Yuan, L.; Guo, P.; Guo, S.; et al. Influence of electrical fields enhanced phytoremediation of multi-metal contaminated soil on soil parameters and plants uptake in different soil sections. Environ. Res. 2021, 198, 111290. [Google Scholar] [CrossRef] [PubMed]
- Ke, T.; Guo, G.; Liu, J.; et al. Improvement of the Cu and Cd phytostabilization efficiency of perennial ryegrass through the inoculation of three metal-resistant PGPR strains. Environ. Pollut. 2021, 271, 116314. [Google Scholar] [CrossRef] [PubMed]
- n WN. Plant Growth-promoting and Stress Tolerance Effect of Marine habitat Bacillus velezensis CT262. Zhejiang Agriculture and Forestry University, 2021.
- Liu, C.Z.; Jiang, X.L.; Cai, Q.Z.; Zhou, L.Y.; Yang, Q. Zhongguo Zhong Yao Za Zhi. 2021, 46, 5247–5252.
- Jiao, H.; Wang, R.; Qin, W.; Yang, J. Screening of rhizosphere nitrogen fixing, phosphorus and potassium solubilizing bacteria of Malus sieversii (Ldb.) Roem. and the effect on apple growth. J. Plant Physiol. 2024, 292, 154142. [Google Scholar] [CrossRef]
- Chen, L.; Xie, Y.L.; Wu, X.H.; et al. Molecular Identification and Bioactivity Analysis of Four Bacillus Strains Promoting the Growth of Alfalfa. Northwest J. Agric. 2023, 32, 212–221. [Google Scholar]
- Sarvepalli, M.; Velidandi, A.; Korrapati, N. Optimization of Siderophore Production in Three Marine Bacterial Isolates along with Their Heavy-Metal Chelation and Seed Germination Potential Determination. Microorganisms 2023, 11, 2873. [Google Scholar] [CrossRef] [PubMed]
- Ballén, V.; Gabasa, Y.; Ratia, C.; Sánchez, M.; Soto, S. Correlation Between Antimicrobial Resistance, Virulence Determinants and Biofilm Formation Ability Among Extraintestinal Pathogenic Escherichia coli Strains Isolated in Catalonia, Spain. Front. Microbiol. 2022, 12, 803862. [Google Scholar] [CrossRef]
- Chen, L.; Xie, Y.L.; Wu, X.H.; et al. Avena sativa growth-promoting activity of Bacillus atrophaeus CKL1 under salt stress and the functional genes. Microbiol. Bull. 2022, 49, 3150–3164. [Google Scholar]
- Jin, Y.L.; Yao, T.; Lan, X.J.; et al. Screening of Antagonistic Bacteria of Oat Root Rot and Studies of Antibacterial Properties. J. Grassl. Sci. 2022, 30, 1095–1101. [Google Scholar]
- Zhang, Z.; Ma, Q.L.; Zhang, D.K.; et al. Effects of Exogenous Hormone on Seed Germination of Agriophyllum squarrosum. Chin. Agron. Bull. 2023, 39, 40–44. [Google Scholar]
- Amri, M.; Rjeibi, M.R.; Gatrouni, M.; et al. Isolation, Identification, and Characterization of Phosphate-Solubilizing Bacteria from Tunisian Soils. Microorganisms 2023, 11, 783. [Google Scholar] [CrossRef] [PubMed]
- Martinez, V.A.; Clément, E.; Arlt, J.; et al. A combined rheometry and imaging study of viscosity reduction in bacterial suspensions. Proc. Natl. Acad. Sci. USA 2020, 117, 2326–2331. [Google Scholar] [CrossRef] [PubMed]
- Chieb, M.; Gachomo, E.W. The role of plant growth promoting rhizobacteria in plant drought stress responses. BMC Plant Biol. 2023, 23, 407. [Google Scholar] [CrossRef] [PubMed]
- Jansson, J.K.; Hofmockel, K.S. Soil microbiomes and climate change. Nat. Rev. Microbiol. 2020, 18, 35–46. [Google Scholar] [CrossRef] [PubMed]
- Atta, M.I.; Zehra, S.S.; Dai, D.Q.; et al. Amassing of heavy metals in soils, vegetables and crop plants irrigated with wastewater: Health risk assessment of heavy metals in Dera Ghazi Khan, Punjab, Pakistan. Front. Plant Sci. 2023, 13, 1080635. [Google Scholar] [CrossRef]
- Sharma, J.K.; Kumar, N.; Singh, N.P.; Santal, A.R. Phytoremediation technologies and their mechanism for removal of heavy metal from contaminated soil: An approach for a sustainable environment. Front. Plant Sci. 2023, 14, 1076876. [Google Scholar] [CrossRef]
- Hou, D.; O’Connor, D.; Igalavithana, A.D.; et al. Metal contamination and bioremediation of agricultural soils for food safety and sustainability. Nat. Rev. Earth Environ. 2020, 1, 366–381. [Google Scholar] [CrossRef]
- Sodhi, K.K.; Singh, C.K.; Kumar, M.; Singh, D.K. Whole-genome sequencing of Alcaligenes sp. strain MMA: insight into the antibiotic and heavy metal resistant genes. Front. Pharmacol. 2023, 14, 1144561. [Google Scholar] [CrossRef]
- Hou, D. Sustainable Remediation of Contaminated Soil and Groundwater: Materials, Processes, and Assessment (Butterworth-Heinemann. 2019.
- Waadt, R.; Seller, C.A.; Hsu, P.K.; Takahashi, Y.; Munemasa, S.; Schroeder, J.I. Plant hormone regulation of abiotic stress responses. Nat. Rev. Mol. Cell. Biol. 2022, 23, 680–694. [Google Scholar] [CrossRef] [PubMed]
- Sun, X.; Zhang, C.; Bei, S.; et al. High bacterial diversity and siderophore-producing bacteria collectively suppress Fusarium oxysporum in maize/faba bean intercropping. Front. Microbiol. 2022, 13, 972587. [Google Scholar] [CrossRef] [PubMed]
- Jiang, Z.; Zhang, M.; Liu, K.; Xue, Y.; Li, X.; Dong, C. Phylogeny of the HO family in cyprinus carpio and the response of the HO-1 gene to adding Bacillus coagulans in feed under Cd2+ stress. Fish Physiol. Biochem. 2022, 48, 117–131. [Google Scholar] [CrossRef] [PubMed]
- Raza, A.; Habib, M.; Kakavand, S.N.; et al. Phytoremediation of Cadmium: Physiological, Biochemical, and Molecular Mechanisms. Biology 2020, 9, 177. [Google Scholar] [CrossRef]
- Khan, A.; Singh, P.; Srivastava, A. Synthesis, nature and utility of universal iron chelator—Siderophore: A review. Microbiol. Res. 2018, 212–213, 103–111. [Google Scholar] [CrossRef]
- Dąbrowski, P.; Keutgen, A.J.; Keutgen, N.; et al. Photosynthetic efficiency of perennial ryegrass (Lolium perenne L.) seedlings in response to Ni and Cd stress. Sci. Rep. 2023, 13, 5357. [Google Scholar] [CrossRef]
Figure 1.
Phylogenetic tree construction of strains. Phylogenetic tree constructed based on 16S rDNA gene sequences. (A); Phylogenetic tree based on gyrB gene sequences. (B).
Figure 1.
Phylogenetic tree construction of strains. Phylogenetic tree constructed based on 16S rDNA gene sequences. (A); Phylogenetic tree based on gyrB gene sequences. (B).
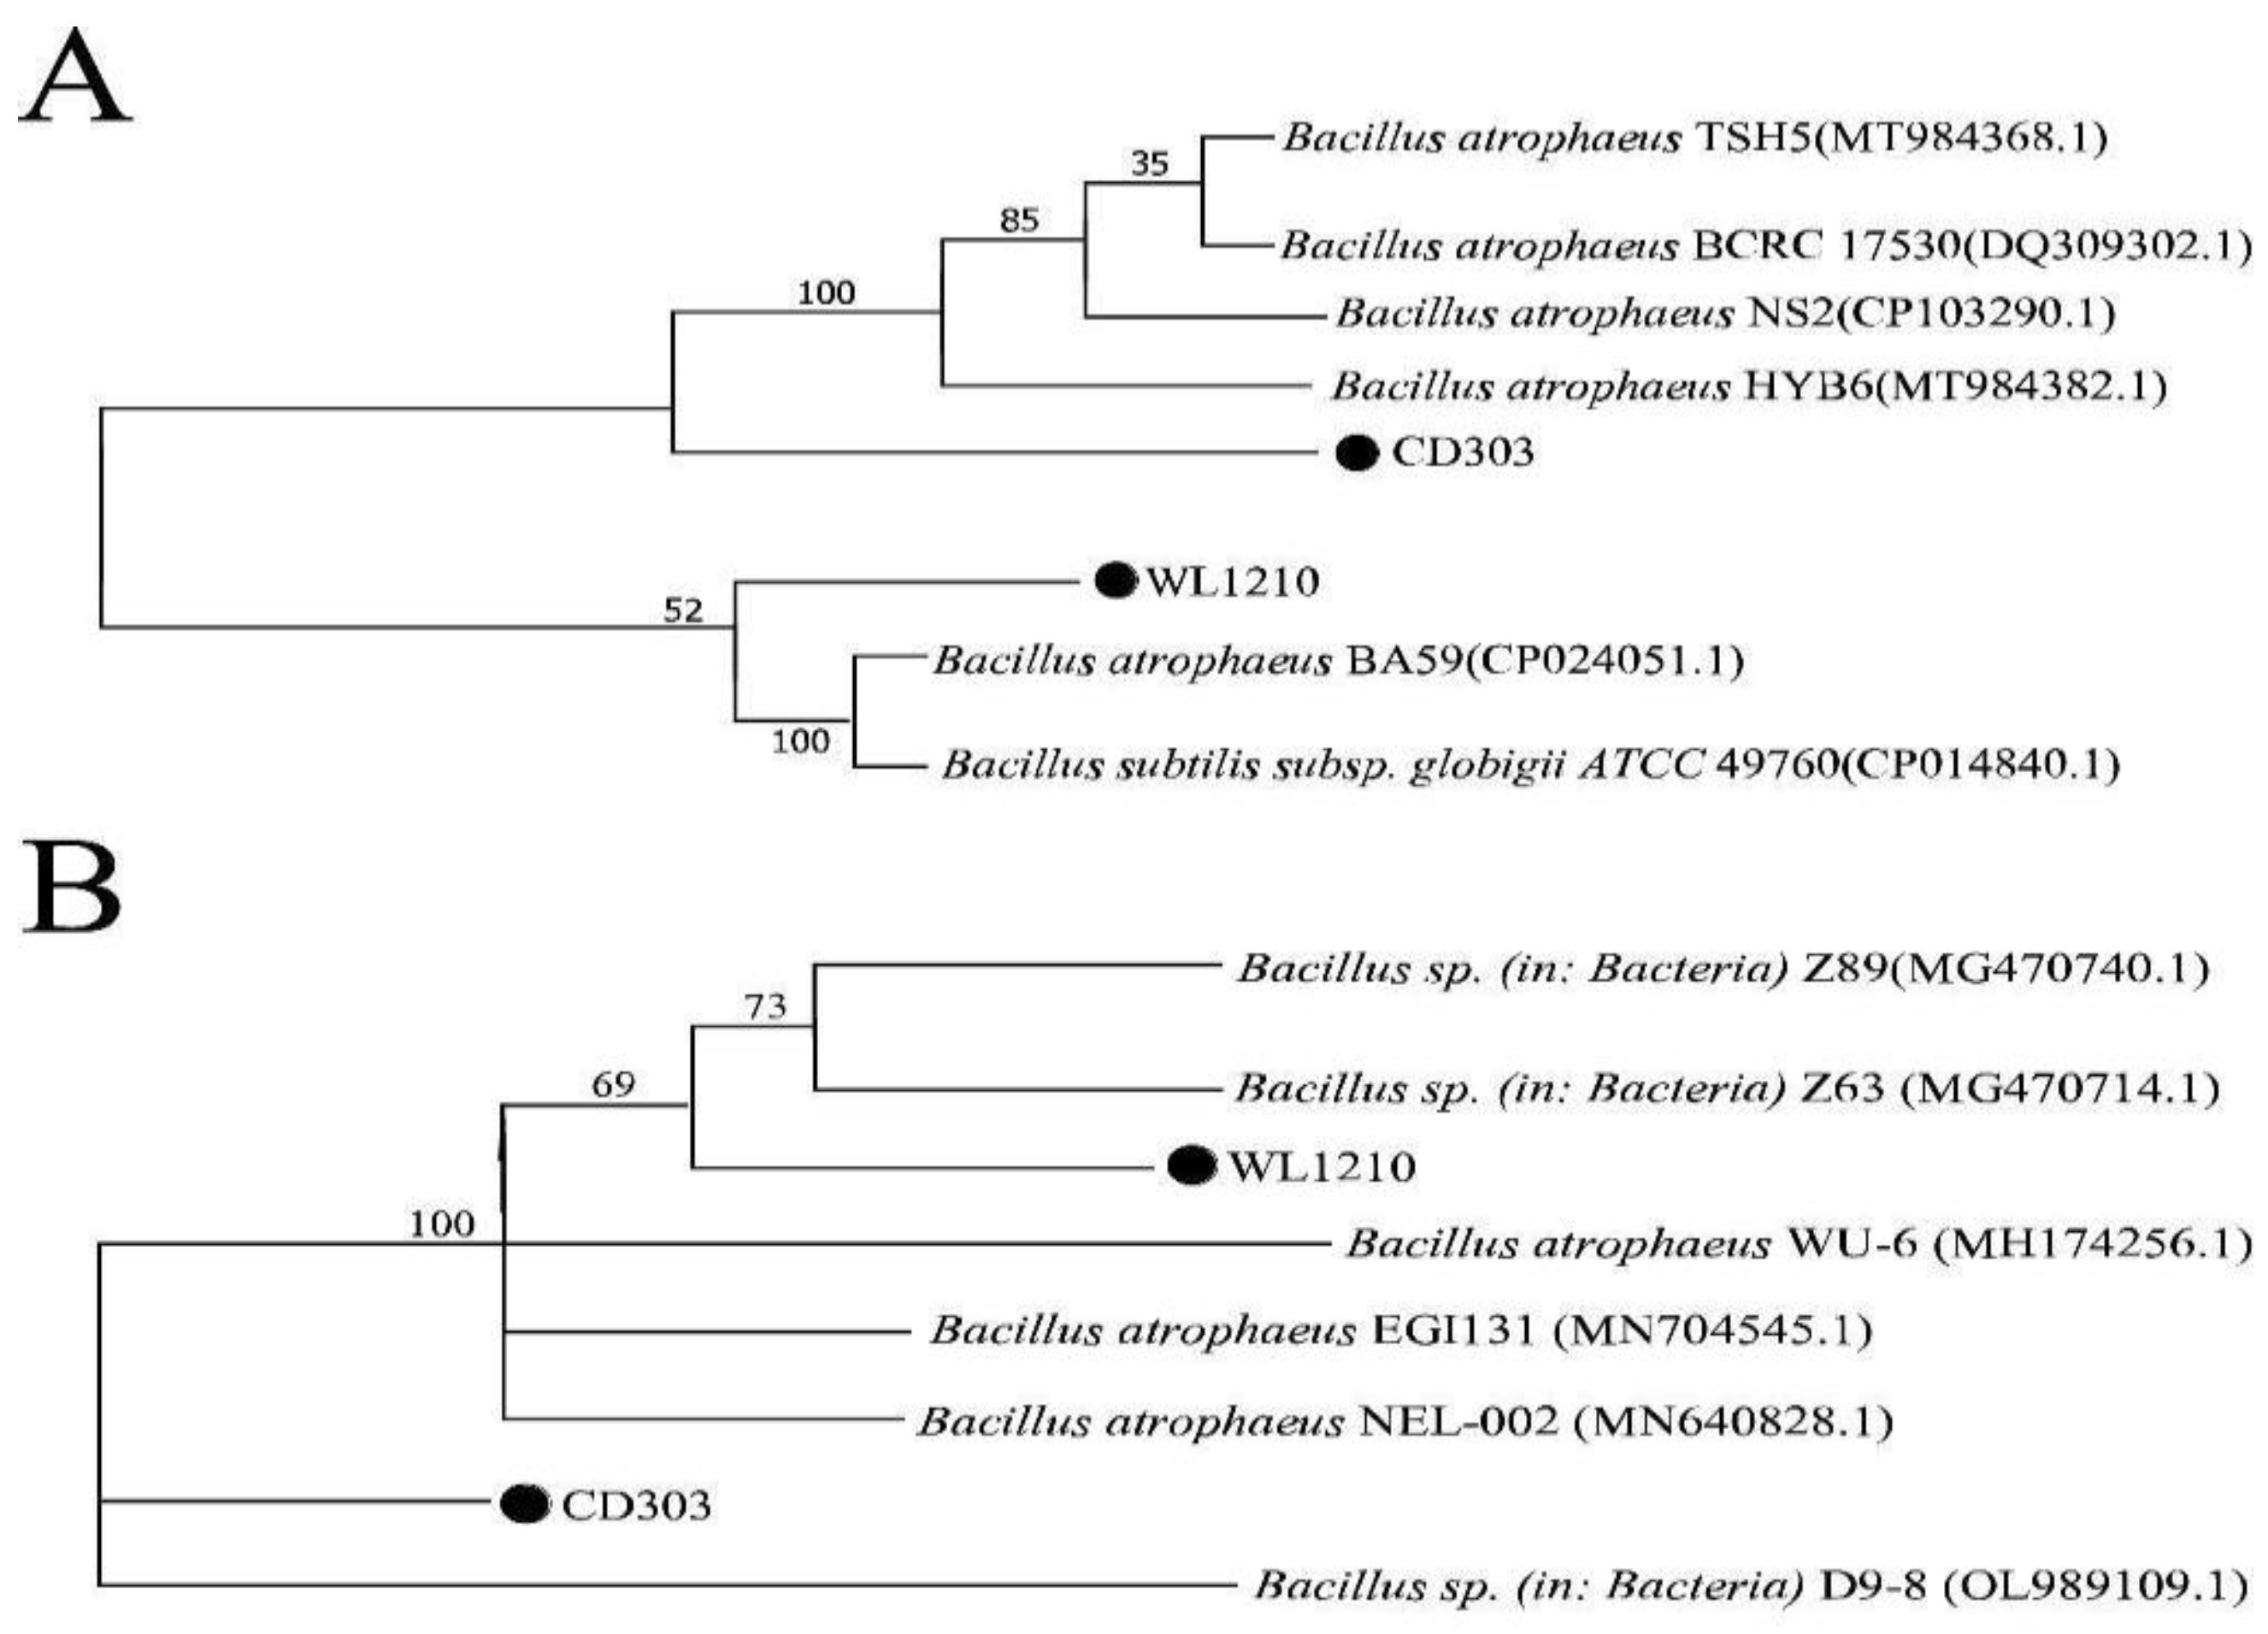
Figure 2.
Full spectrum scan of strain CD303 carboxylic acid ferrophilin.
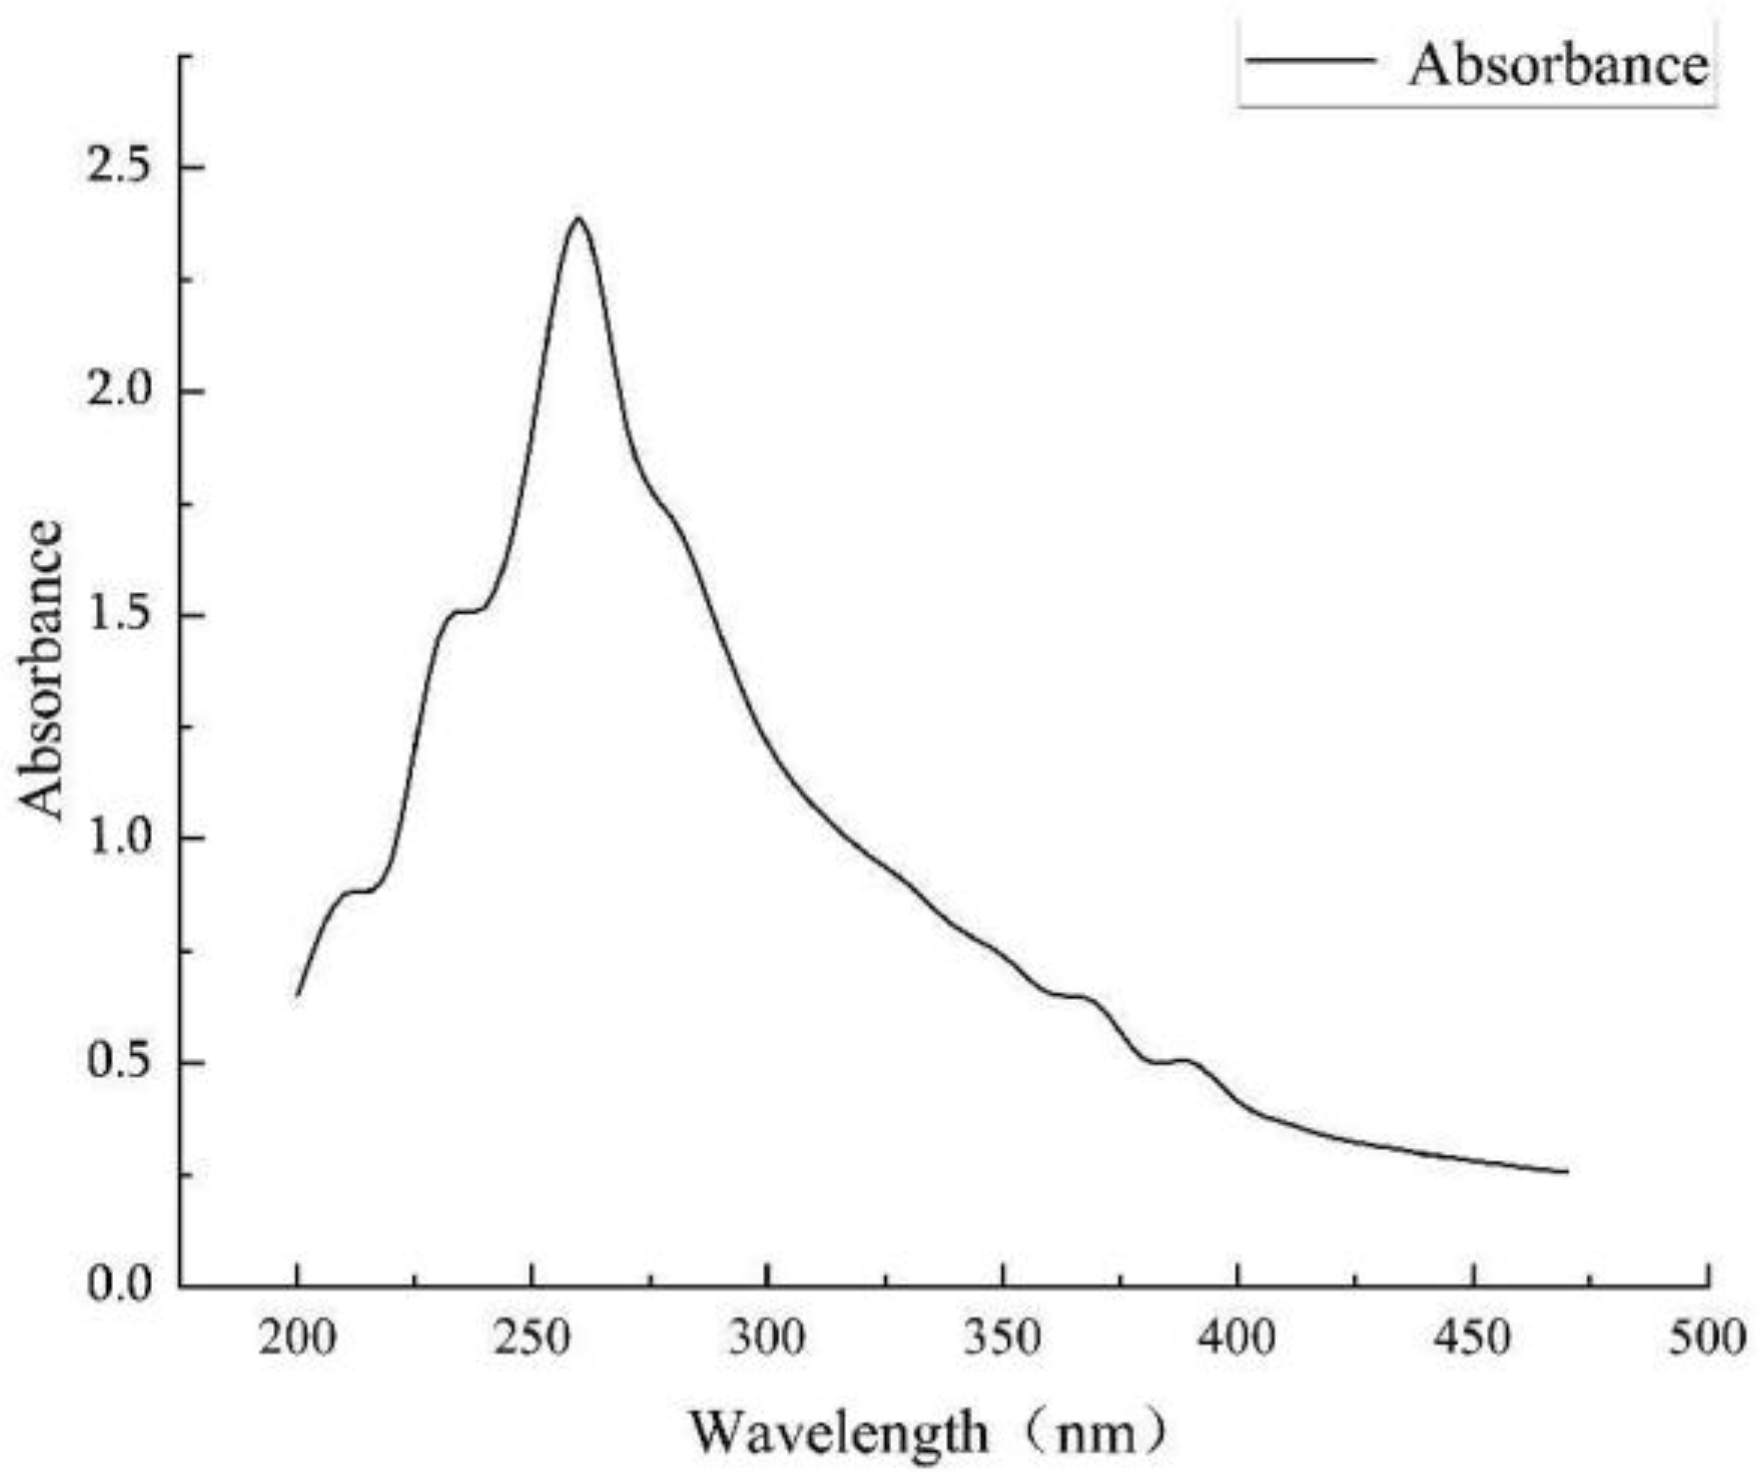
Figure 4.
Determination of phosphorus and potassium solubilising capacity of bacterial strains. A) Phosphorus solubilising capacity of strain WL1210. B) Phosphorus solubilising capacity of strain CD303. C) Potassium solubilising capacity of strain WL1210. D) Potassium solubilising capacity of strain CD303.
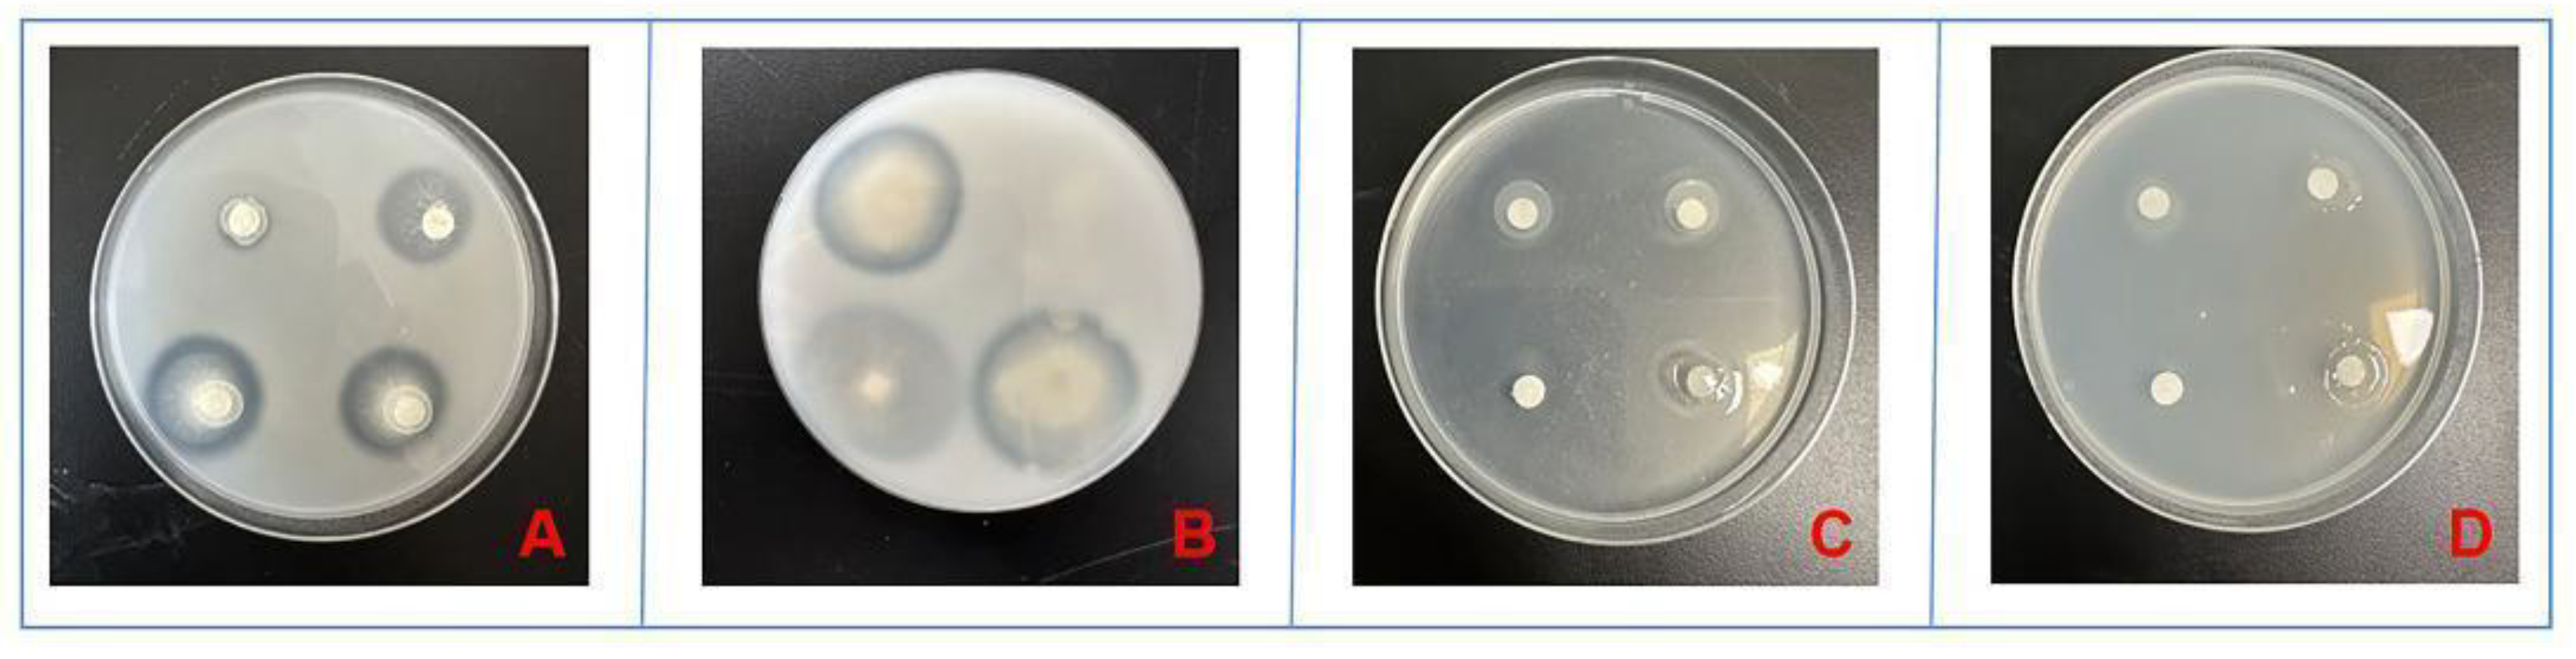
Figure 5.
Growth of strains under Cd2+ stress.
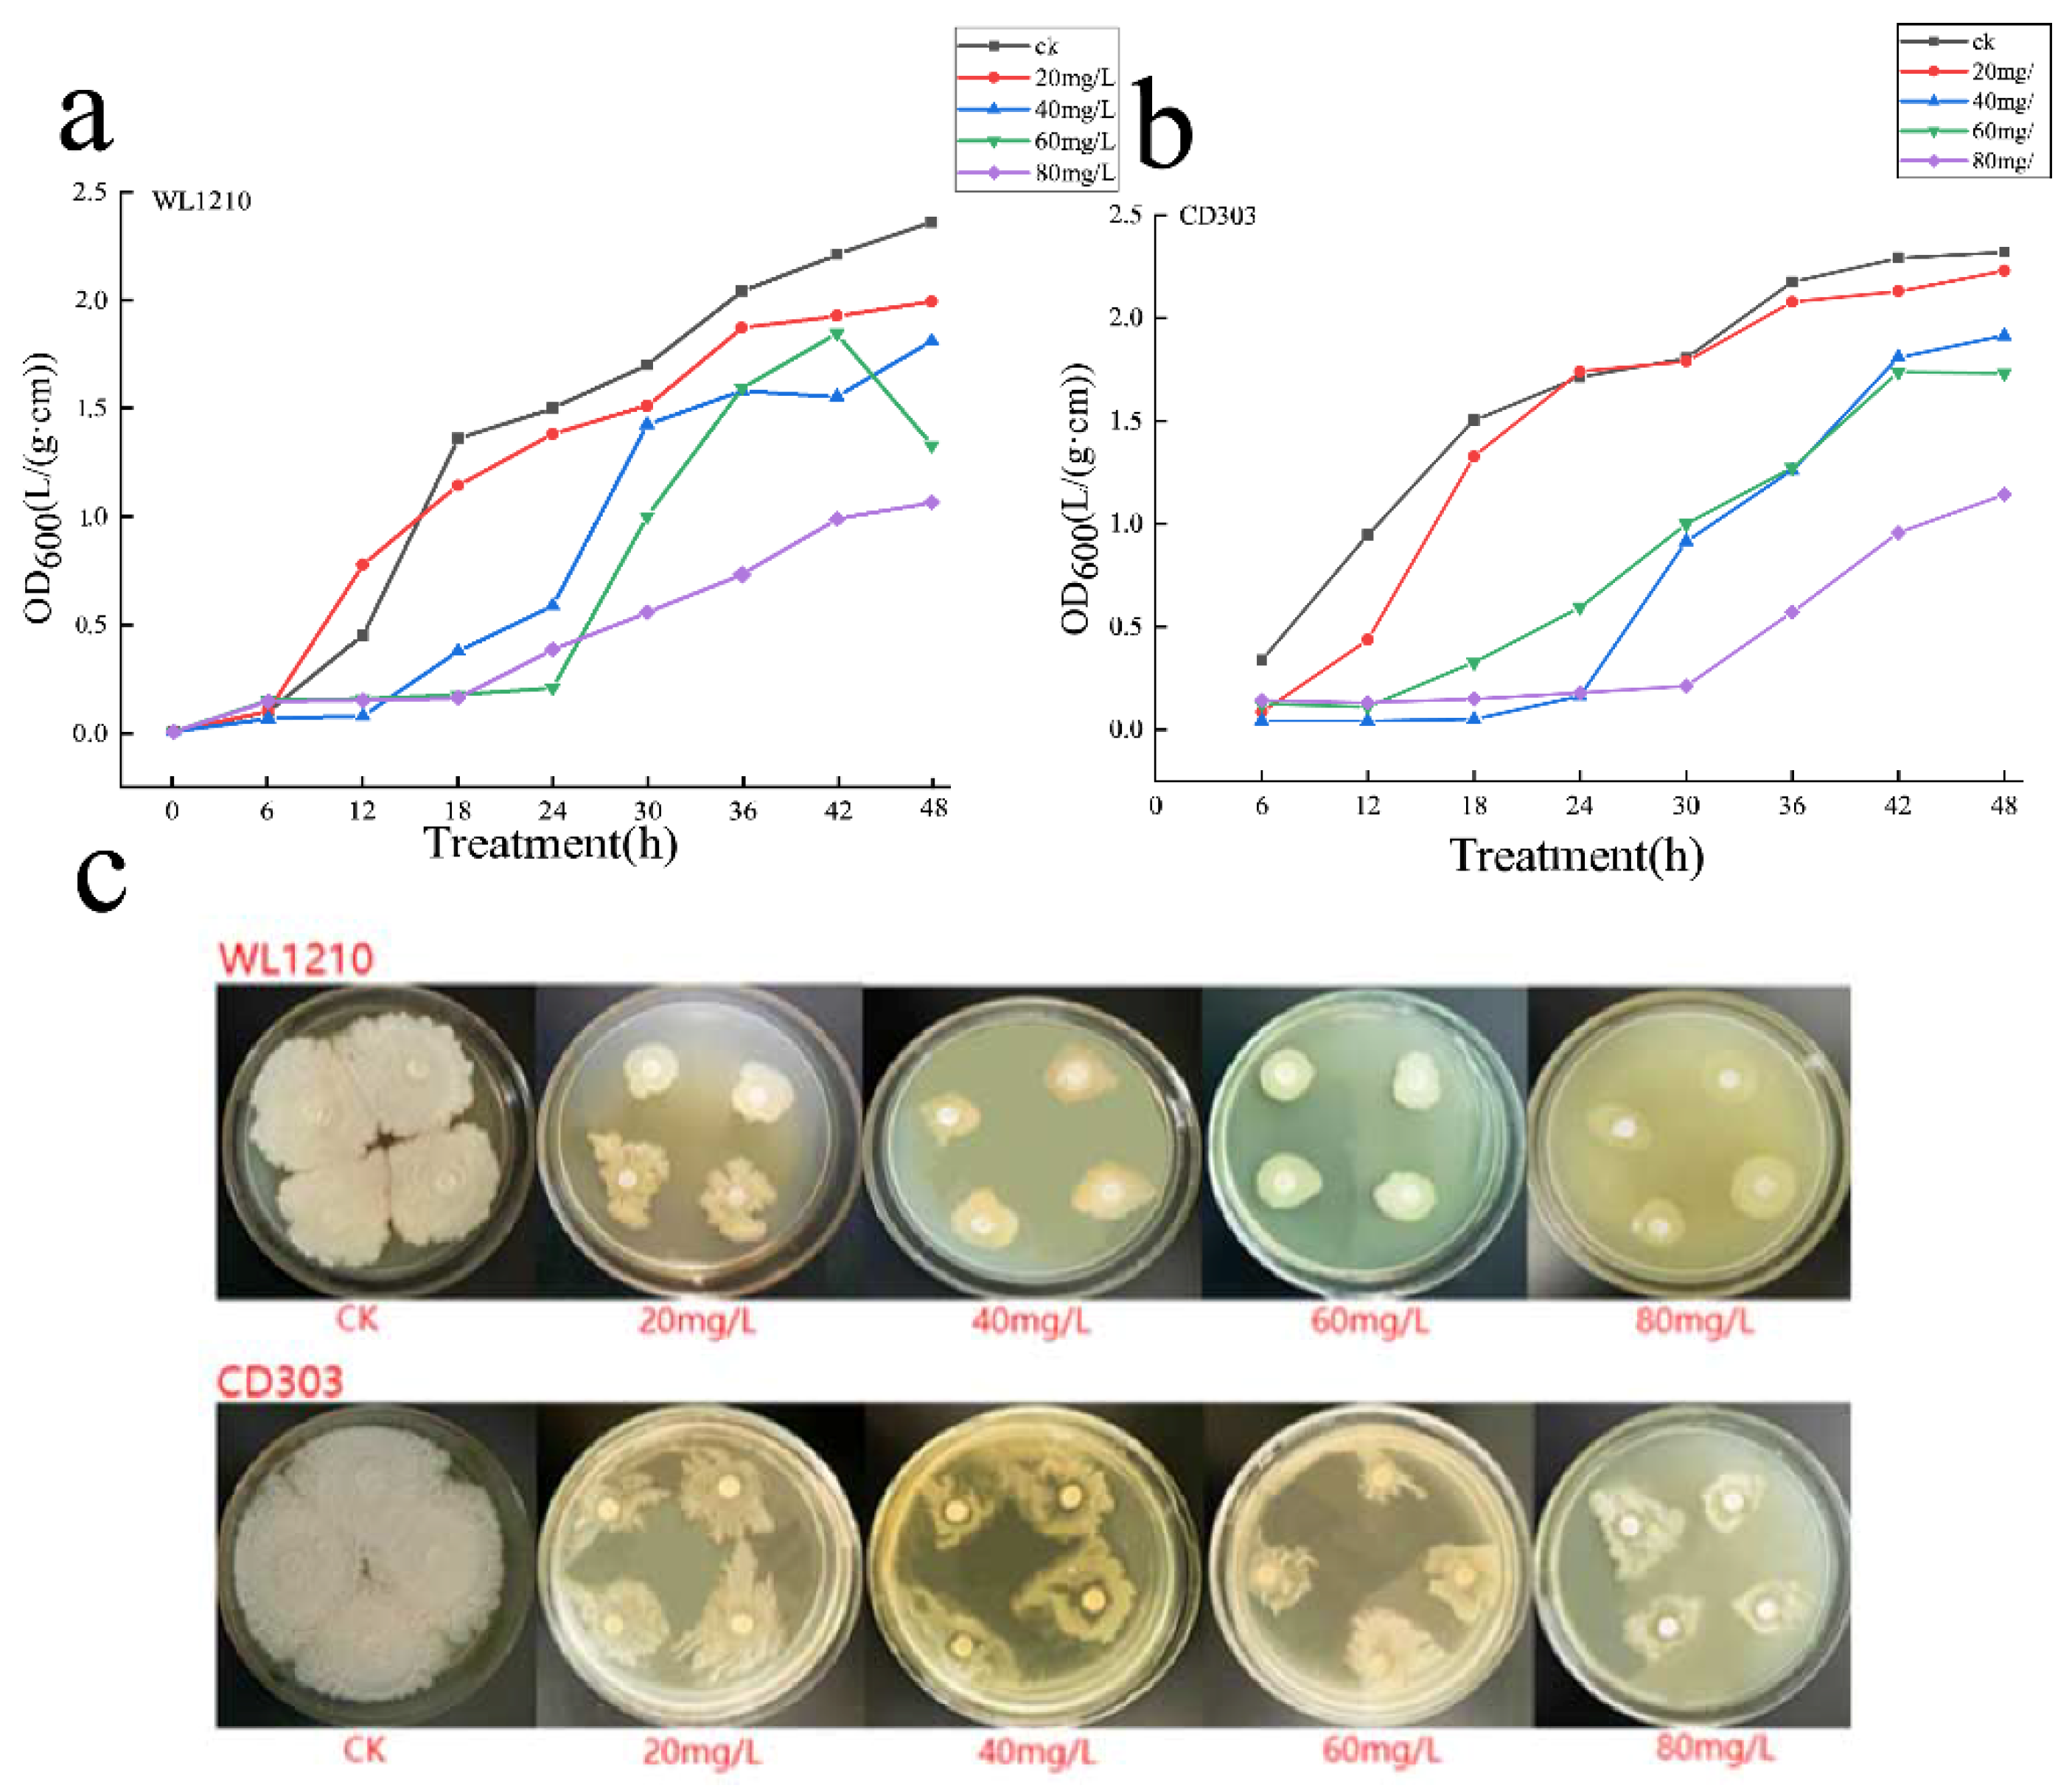
Figure 6.
Ryegrass biomass under various levels of Cd2+ stress and after treatment with strains. A) Biomass after treatment with strain WL1210. B) Biomass after treatment with strain CD303. Different letters at each treatment indicate significance between inoculated and uninoculated conditions at P ≤ 0.05 level.
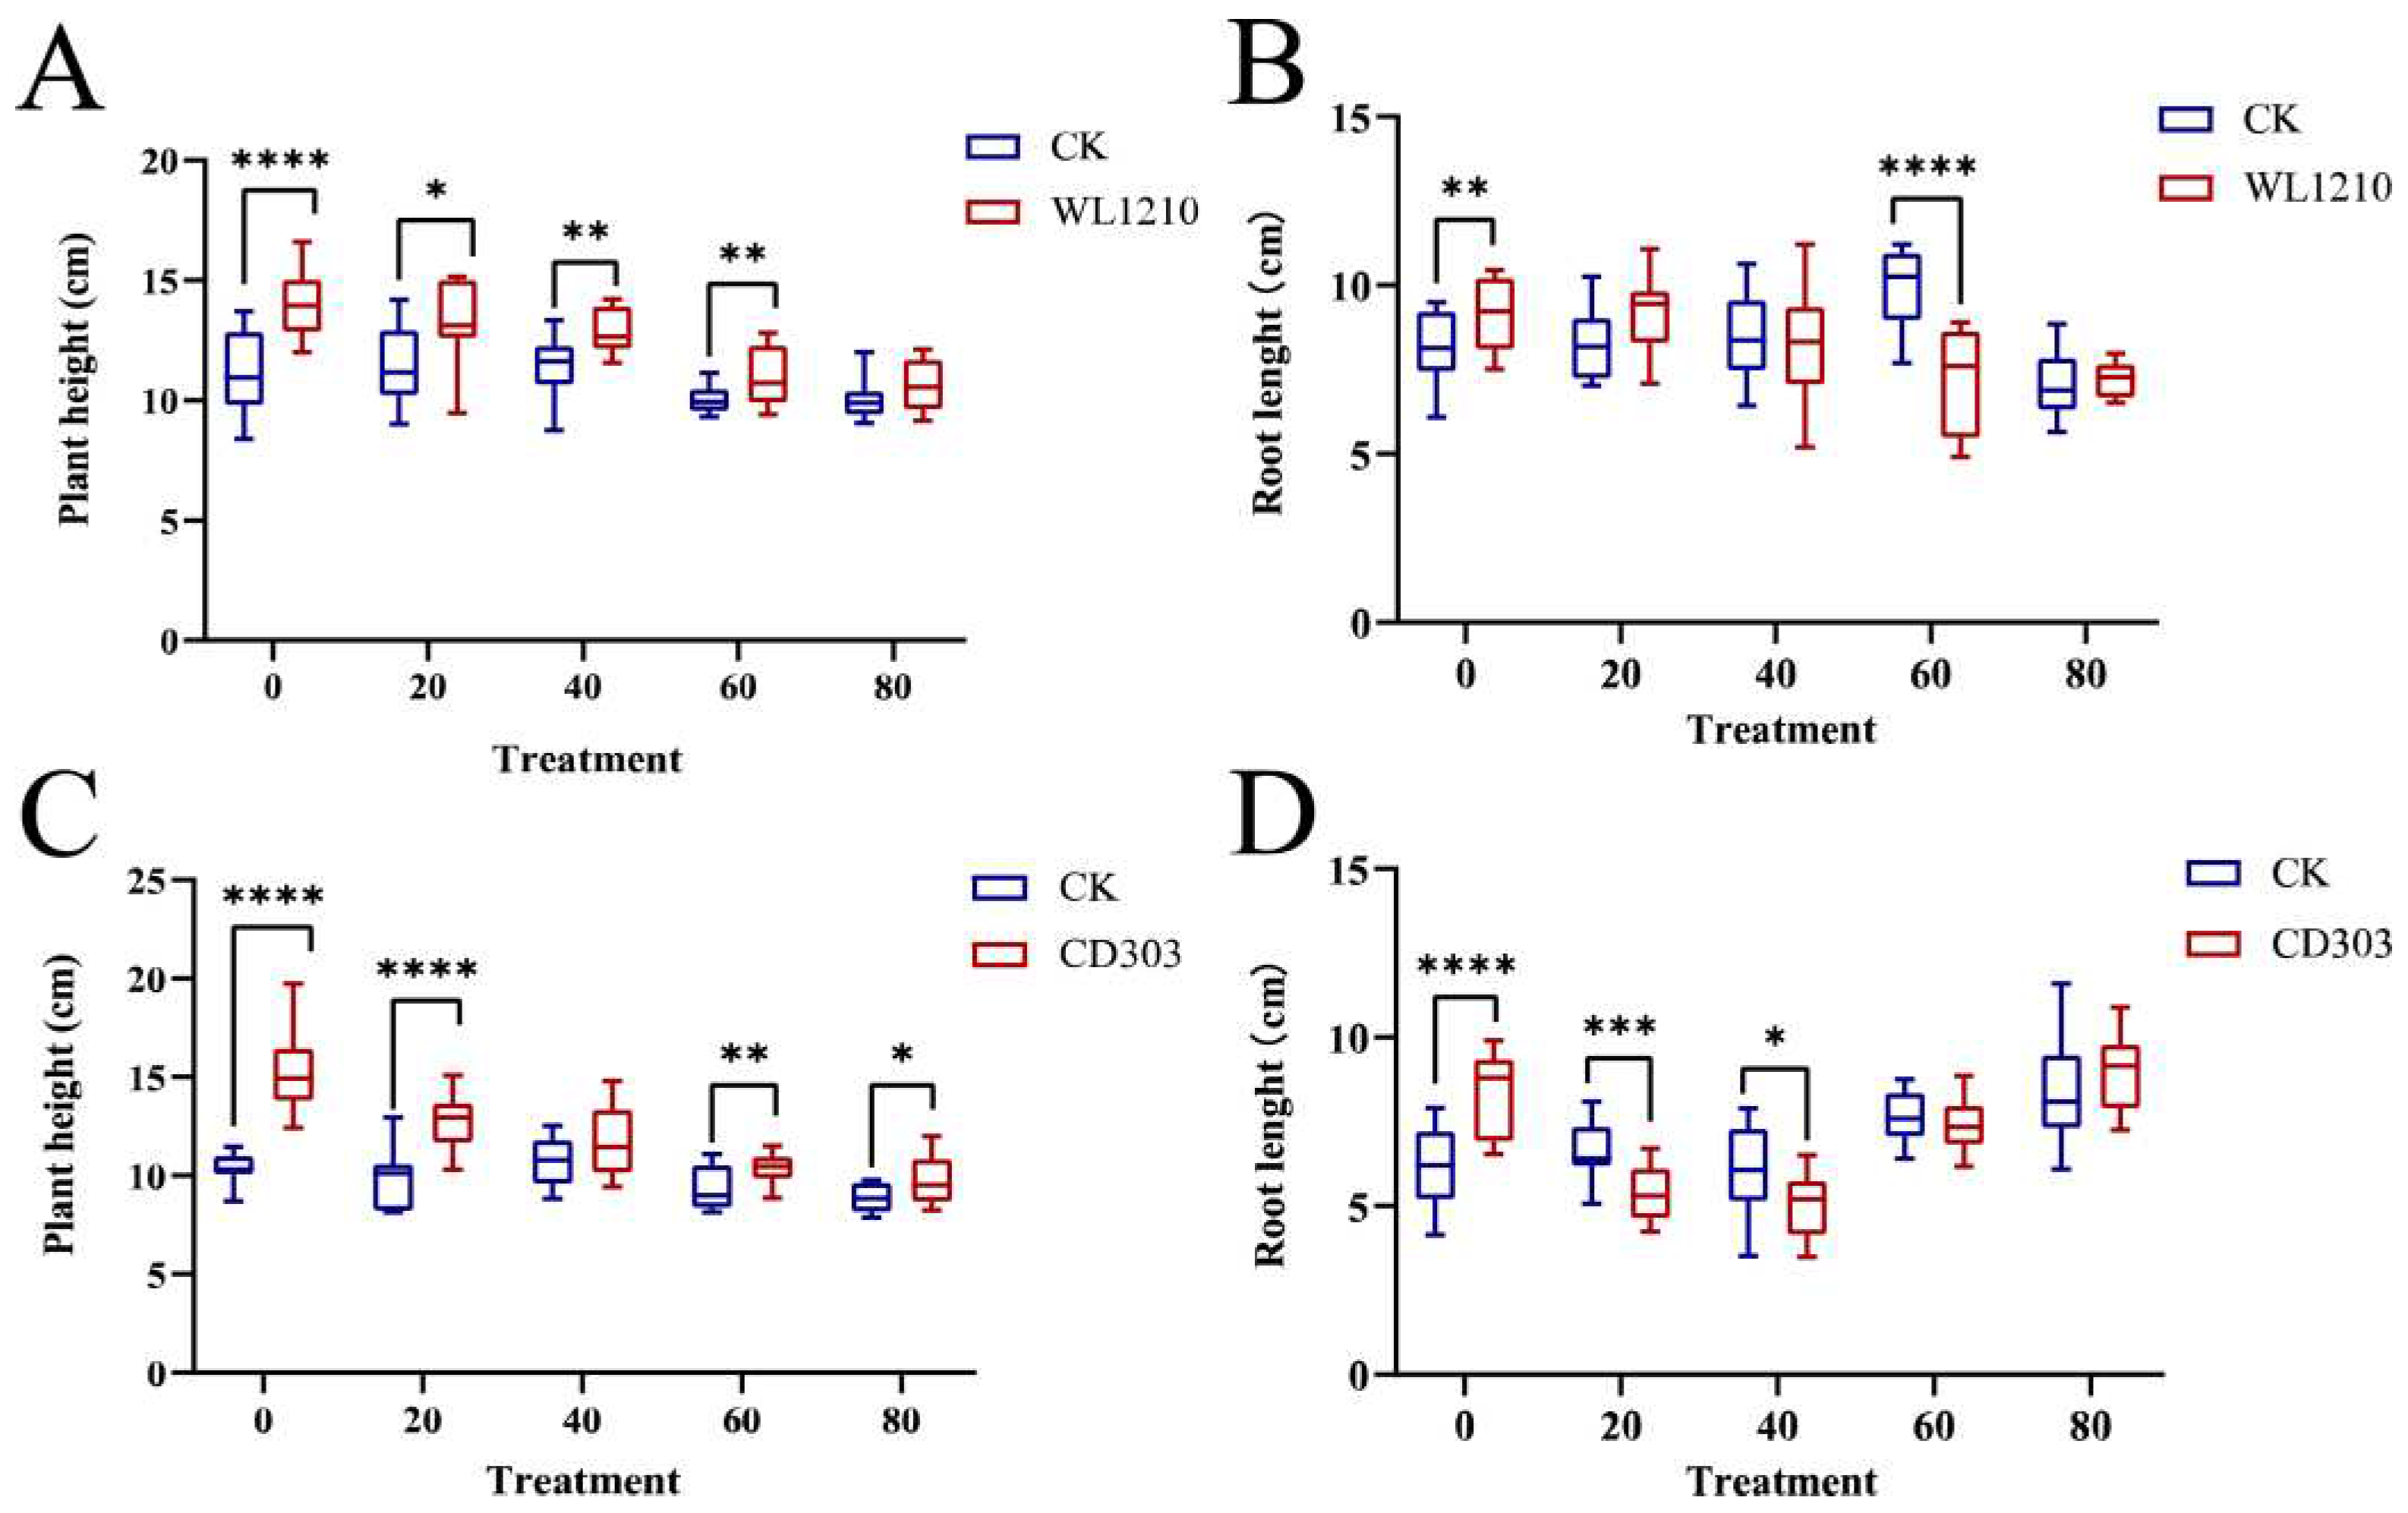
Figure 7.
Chlorophyll contents in ryegrass after treatment with strains. (A-B); Ryegrass proline content after strain treatment. (C-D); Ryegrass protein concentrations after Cd2+ exposure and treatment with strains. (E-F). Different letters at each treatment indicate significance between inoculated and uninoculated conditions at P ≤ 0.05 level based on a t-test.
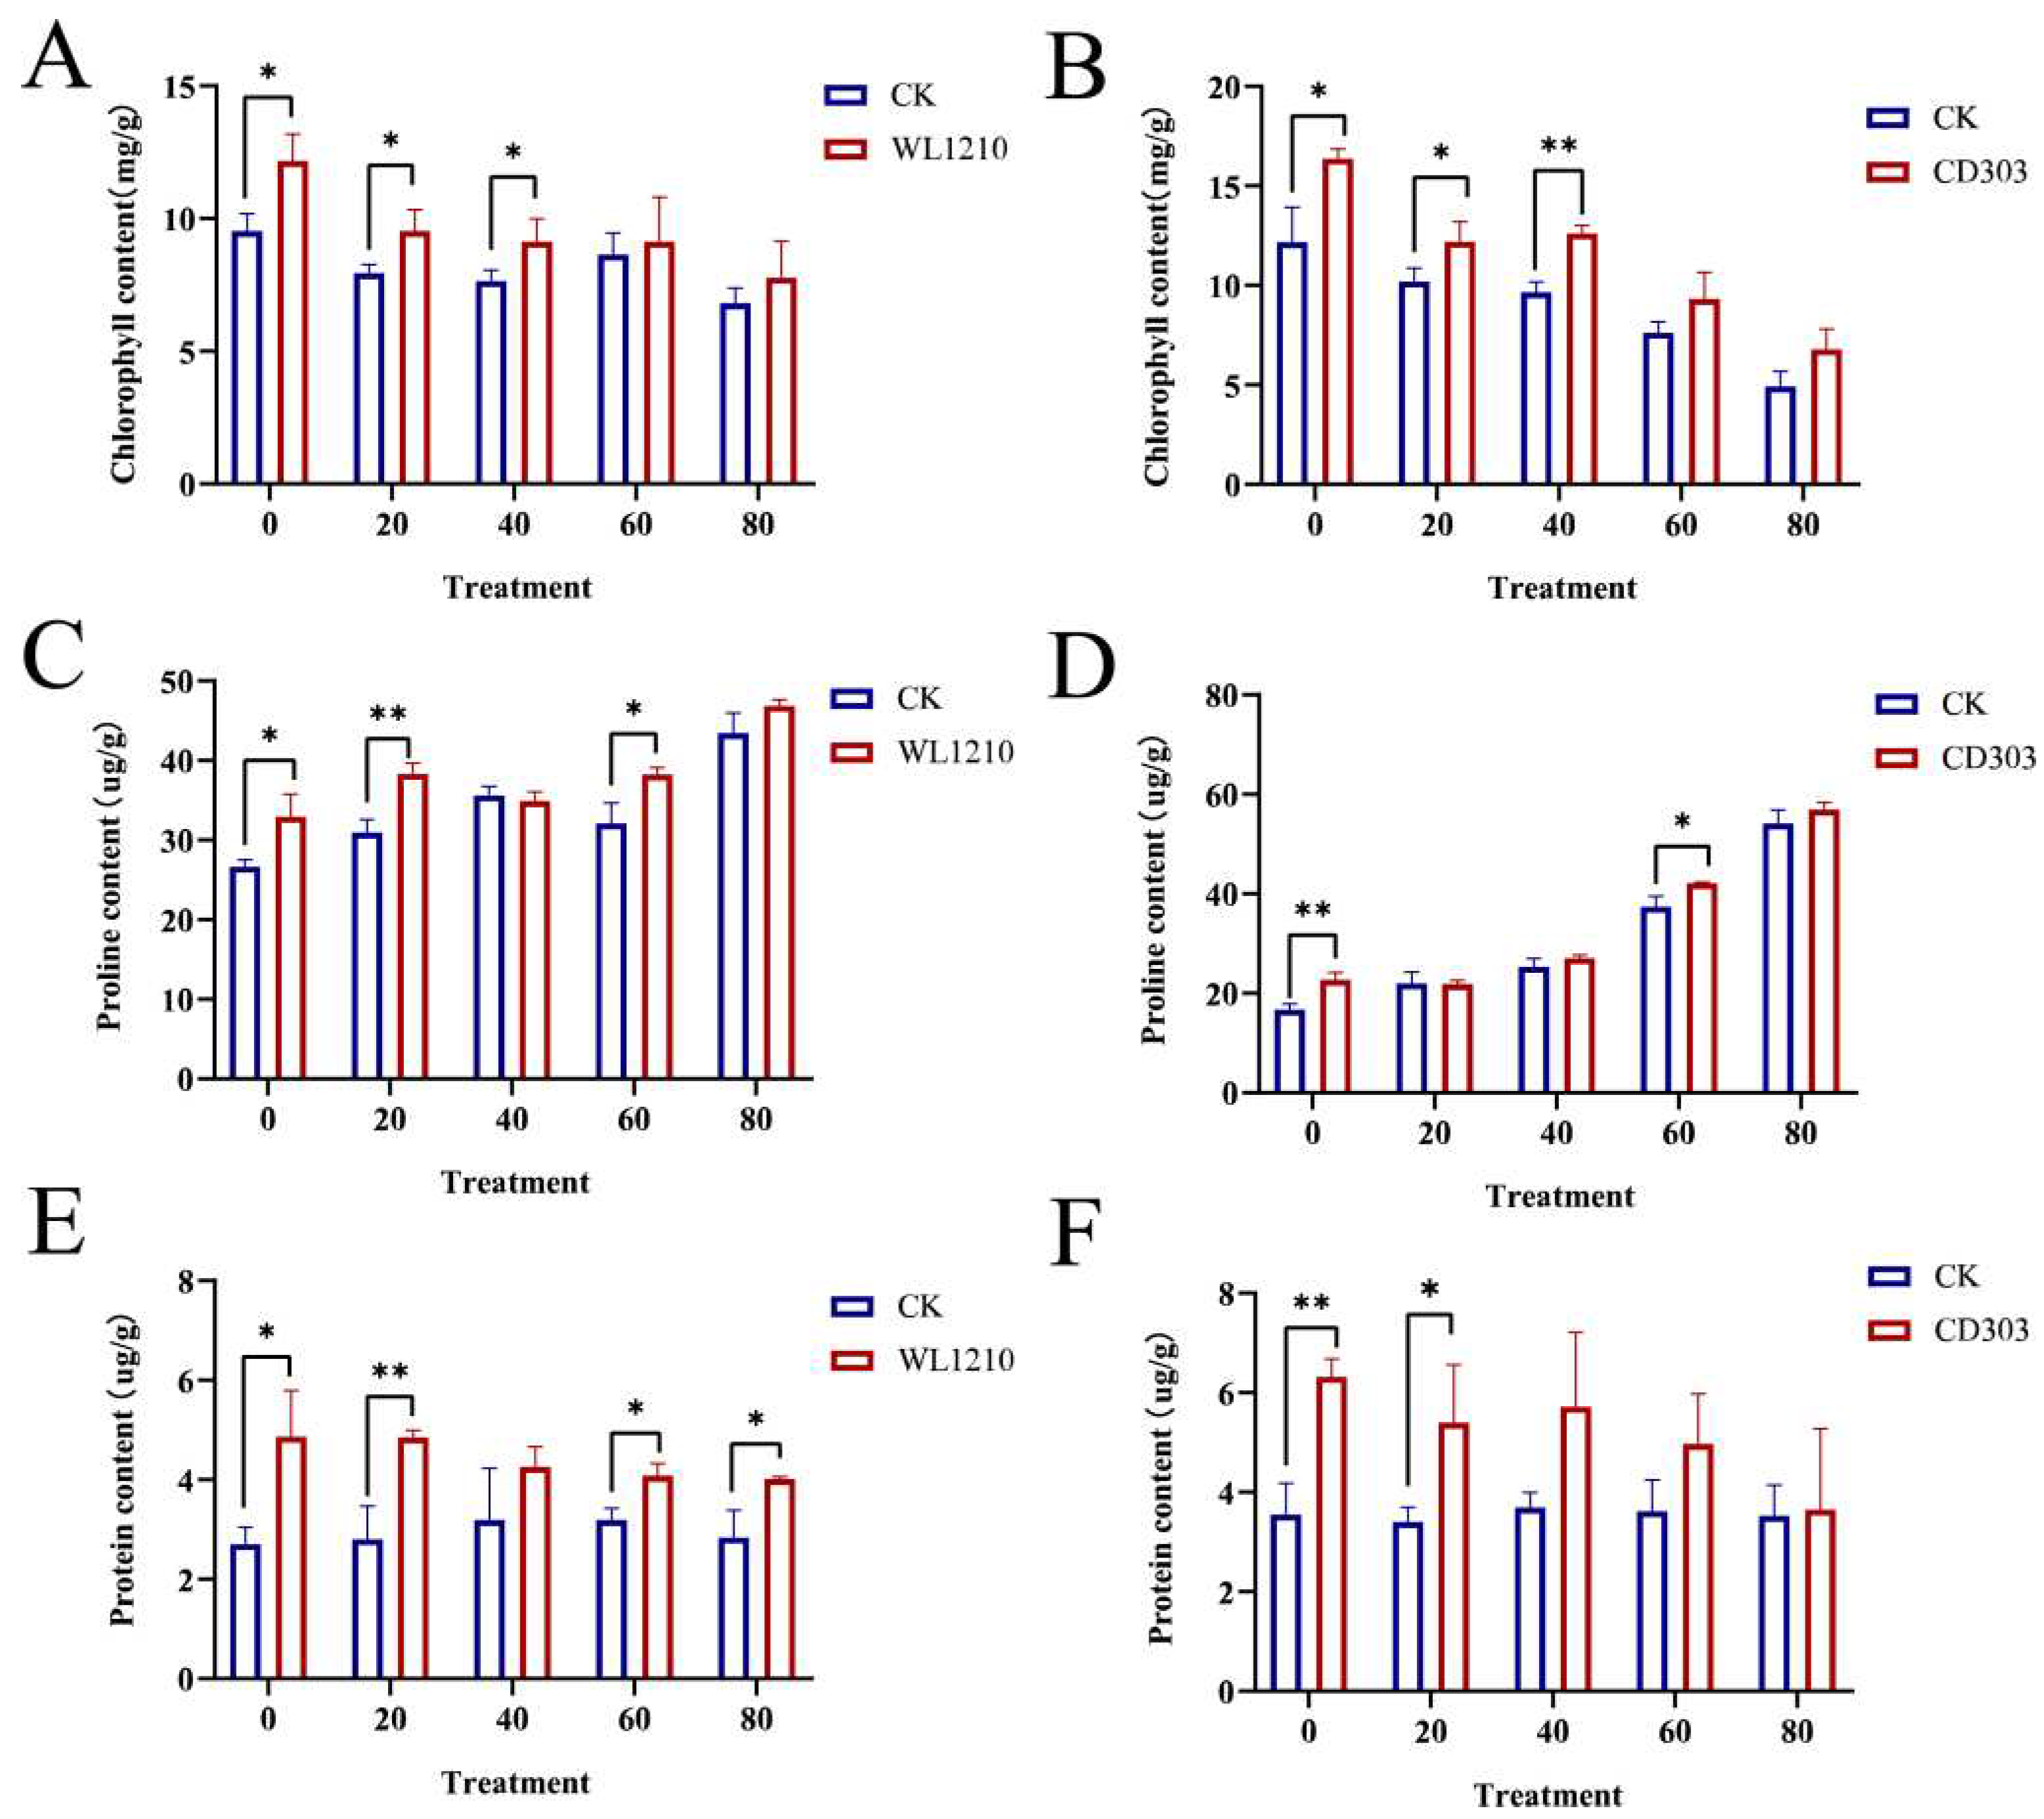
Figure 8.
Circular map of the Bacillus CD303 genome.
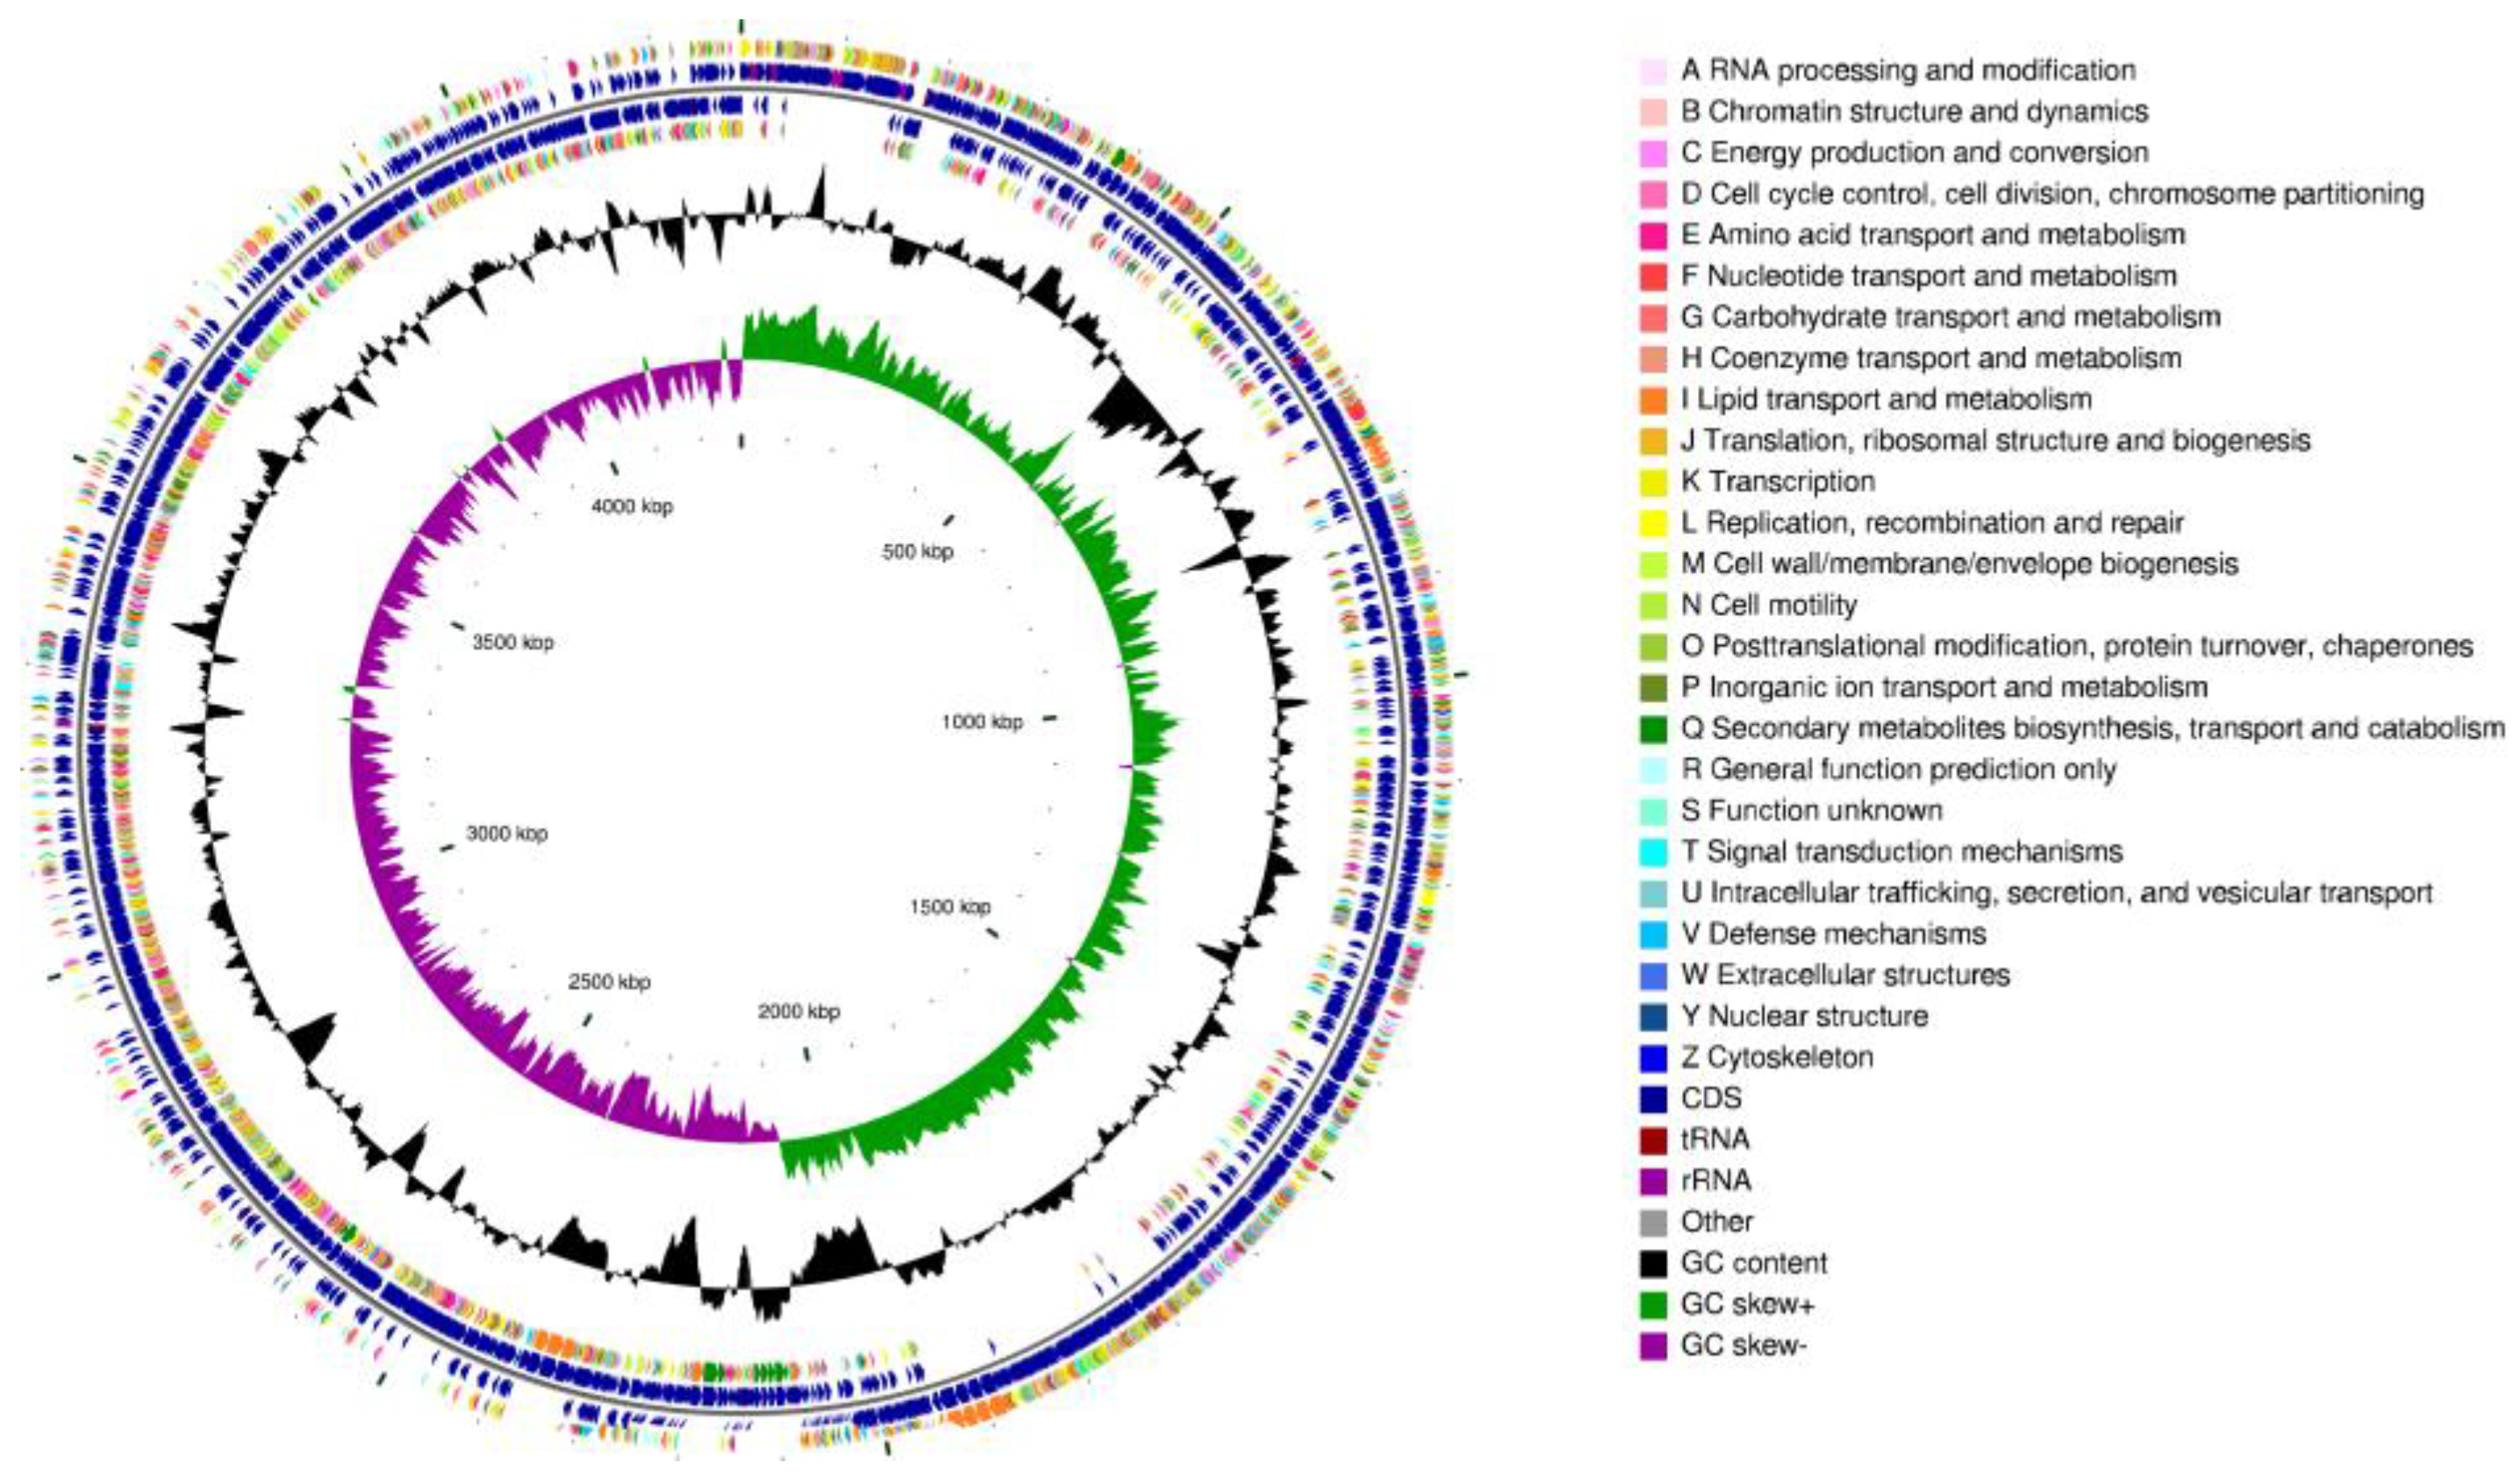
Figure 9.
Functional annotation of the Bacillus CD303.
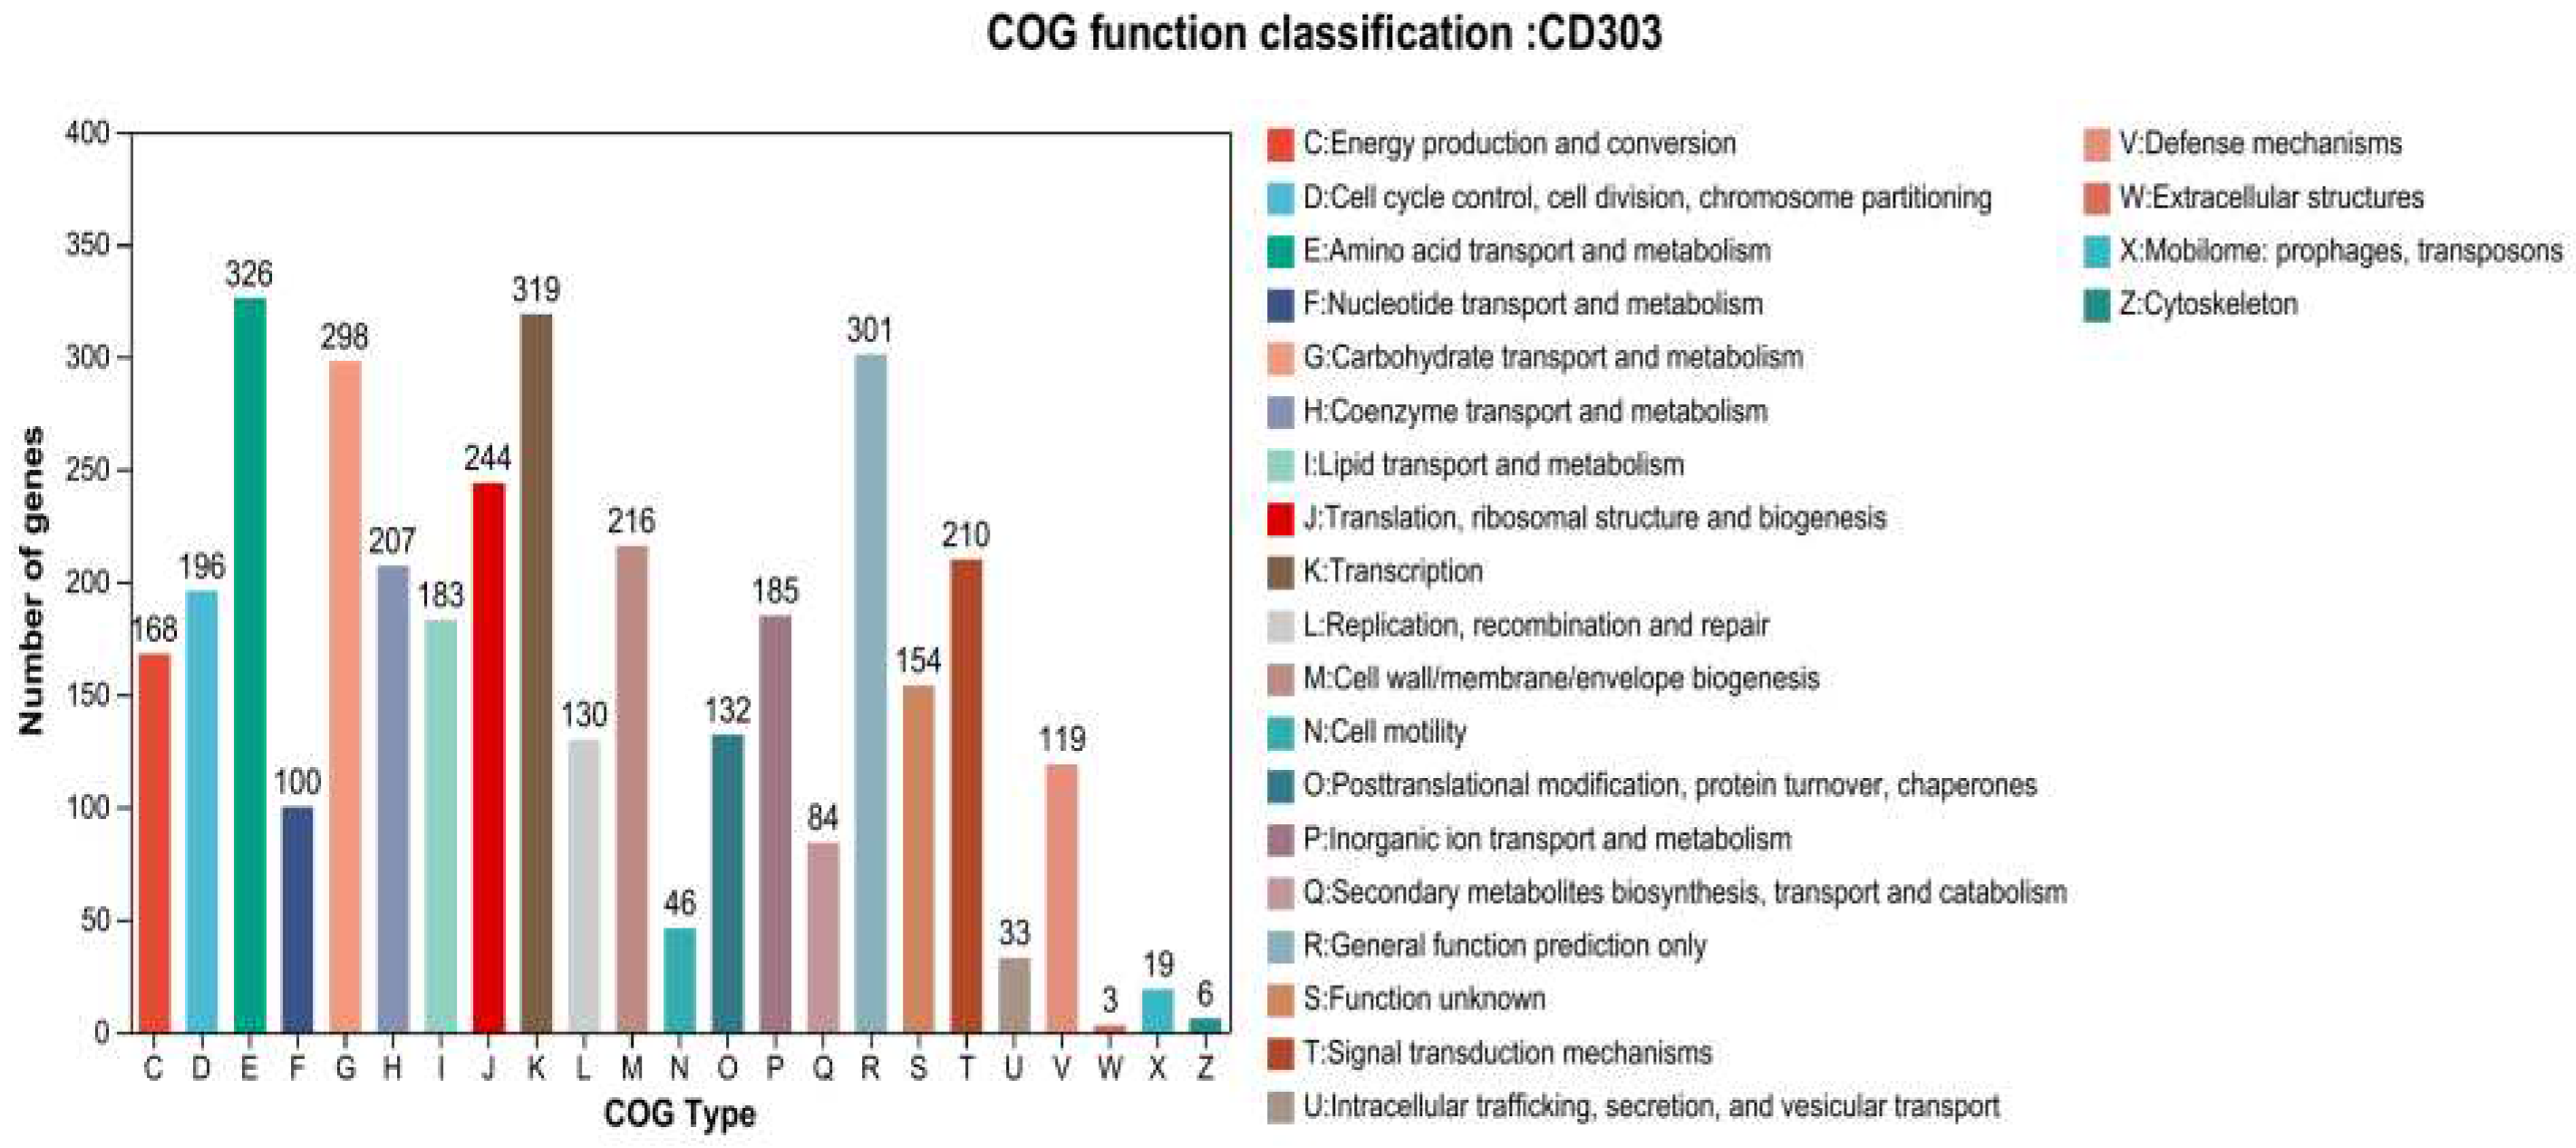

Table 1.
Different treatment groups.
| Treatment Group | Description | Bacterial Suspension | Cd2+ Stress Treatment (mg/L) |
|---|---|---|---|
| CK | Control | - | 0 |
| WL1210CD303 | WL1210 (CD303) Irrigation | + | 0 |
| 20 | 20 mg/L Cd2+ Stress + WL1210 (CD303) Irrigation | + | 20 |
| 40 | 40 mg/L Cd2+ Stress + WL1210 (CD303) Irrigation | + | 40 |
| 60 | 60 mg/L Cd2+ Stress + WL1210 (CD303) Irrigation | + | 60 |
| 80 | 80 mg/L Cd2+ Stress + WL1210 (CD303) Irrigation | + | 80 |
Table 2.
Siderophore production activity of strains.
| Strain | Siderophore activity (%) | A/Ar |
|---|---|---|
| WL1210 | 36.16 | ++ |
| CD303 | 49.88 | +++ |
Table 3.
Effect of different Cd2+ concentrations on seed germination rates of ryegrass.
| Treatment concentration (mg/L) | Germination rate per day after bed placement (%) 7 d 8 d 9 d 10 d |
|||
|---|---|---|---|---|
| 0 | 78.00±4.00 | 81.3±5.77 | 85.33±9.45 | 91.33±6.11 |
| 20 | 76.00±5.29 | 78.6±8.08 | 84.0±12.00 | 88.00±12.41 |
| 40 | 78.00±3.46 | 83.3±6.42 | 84.00±9.16 | 88.67±9.45 |
| 60 | 77.33±6.11 | 81.3±5.77 | 83.00±8.71 | 83.33±9.45 |
| 80 | 18.00±4.00 | 18.6±3.06 | 29.33±11.37 | 34.67±11.79 |
Table 4.
Effects of different Cd2+ concentrations on the germination index (GI) and viability index (VI) of ryegrass seeds.
Table 4.
Effects of different Cd2+ concentrations on the germination index (GI) and viability index (VI) of ryegrass seeds.
| Concentration (mg/L) | GV (%) | GR (%) | GI | VI |
|---|---|---|---|---|
| 0 | 78.00a | 91.33a | 4.99±0.44a | 15.92±3.04a |
| 20 | 76.0a | 88.00a | 4.85±0.44ab | 13.45±1.09ab |
| 40 | 78.00a | 88.67a | 4.99±0.50a | 10.89±1.06bc |
| 60 | 77.33a | 83.33a | 4.91±0.69a | 8.74±1.14c |
| 80 | 18.00b | 34.67b | 1.45±0.27b | 1.41±0.59d |
Table 5.
Relevant functional genes identified in the genome of CD303.
| Gene name | Location | Length | Function |
|---|---|---|---|
| glpQ | 236068-236355 | 288 bp | Glycerophosphodiester phosphodiesterase |
| hxlA | 380639-381271 | 633 bp | 3-hexulose-6-phosphate synthase |
| hxlB | 380075-380632 | 558 bp | Carbohydrate derivative metabolic process, isomerase activity, carbohydrate derivative binding |
| miaA | 1957705-1958649 | 945 bp | Isopentenyl adenine gene, considered the main cytokinin |
| miaB | 1861144-1862673 | 1530 bp | Isopentenyl adenine gene, considered the main cytokinin |
| ndhF | 197749-199266 | 1518 bp | NADH dehydrogenase subunit 5, Chloroplast functional genes |
| YBCL | 204425-205597 | 1173 bp | MFS transporter, encodes the Rubisco enzymes in plants, capable of converting carbon dioxide into organic matter |
| frmA | 372000-373136 | 1137 bp | Threonine dehydrogenase or related Zn-dependent dehydrogenase |
| phnB | 408798-409163 | 366 bp | Zn-dependent glyoxalase, PhnB family |
| fnr | 3382739-3383740 | 1002 bp | Ferredoxin--NADP reductase 2 |
| iscA | 3385318-3385680 | 363 bp | Iron-sulfur cluster assembly protein |
| ggt | 2146580-2148346 | 1767 bp | Plant stress tolerance enhancer |
| mgtC | 791225-791917 | 693 bp | Magnesium uptake protein YhiD/SapB, involved in acid resistance |
| proB | 2158357-2159481 | 1125 bp | Involved in proline or betaine synthesis, alleviates cell apoptosis |
| proC | 2159505-2160305 | 801 bp | Involved in proline or betaine synthesis, alleviates cell apoptosis |
| glnA | 1969335-1970669 | 1335 bp | Involved in the regulation of nitrogen fixation |
| glnR | 1968870-1969277 | 408 bp | Involved in the regulation of nitrogen fixation |
| licA | 382536-393302 | 10767 bp | Surfactin non-ribosomal peptide synthetase SrfAA |
| licB | 393324-404093 | 10770 bp | Surfactin non-ribosomal peptide synthetase SrfAB |
| licC | 404112-407942 | 3831 bp | Non-ribosomal peptide synthetase |
| srfATE | 407970-408704 | 735 bp | Surfactin biosynthesis thioesterase SrfAD |
| acpT | 411550-412224 | 675 bp | 4′-phosphopantetheinyl transferase superfamily protein |
| tcyC | 413260-414003 | 744 bp | Amino acid ABC transporter ATP-binding protein |
| bsdA | 415642-416514 | 873 bp | LysR family transcriptional regulator |
| oxa | 231253-232089 | 837 bp | Penicillin-binding protein transpeptidase domain |
Disclaimer/Publisher’s Note: The statements, opinions and data contained in all publications are solely those of the individual author(s) and contributor(s) and not of MDPI and/or the editor(s). MDPI and/or the editor(s) disclaim responsibility for any injury to people or property resulting from any ideas, methods, instructions or products referred to in the content. |
© 2024 by the authors. Licensee MDPI, Basel, Switzerland. This article is an open access article distributed under the terms and conditions of the Creative Commons Attribution (CC BY) license (http://creativecommons.org/licenses/by/4.0/).
Copyright: This open access article is published under a Creative Commons CC BY 4.0 license, which permit the free download, distribution, and reuse, provided that the author and preprint are cited in any reuse.


