
Submitted:
30 January 2024
Posted:
31 January 2024
You are already at the latest version
Abstract
This paper provides a comprehensive analysis of food security in Sudan by adopting a unique approach of Hesitant Fuzzy Entropy (HFE) analysis to discern the key determinants influencing food security levels and aligning the findings with the Integrated Food Security Phase Classification (IPC) framework. The research utilized a dataset comprising 32 crucial variables related to food security assessment. Employing entropy values, weight coefficients, heatmaps, and scatterplots, the analysis aimed to unravel the intricate distribution of food security levels among Sudanese individuals in our study area. The study reveals that approximately 26% of the Sudanese population in our study region is poised to experience food security, with an additional 24% categorized as marginally food secure. Moreover, an estimated 35% are expected to confront moderate food insecurity, while 15% are projected to face severe food insecurity between January and June 2024. Anticipations for the period from January 2024 to June 2024 project more than 15 million individuals to encounter IPC Phase 3 and fall under moderately or severely food insecure levels. These findings emphasize the urgent need for both short-term humanitarian aid and long-term strategies to address Sudan's deepening food insecurity crisis.
Keywords:
agriculture
; food insecurity
; hesitant fuzzy sets
; humanitarian crisis
; Sudan
1. Introduction
Sudan, a country with a diverse cultural heritage and a history marked by both challenges and resilience, presents a compelling case for studying food security. Located in Northeast Africa, Sudan's landscape ranges from the arid deserts of the north to the savannahs and mountains in the south. Despite its geographical diversity, the nation has been marred by conflicts, economic instability, and social disparities. These issues have significantly influenced its food security landscape. The concept of food security is conventionally understood in terms of four dimensions: availability, access, utilization, and stability [1,2]. Availability pertains to the physical presence of food, often influenced by factors such as agricultural productivity, trade, and food production [3,4]. However, mere availability does not guarantee access, as economic and social barriers can limit people's capability to procure food even when it is physically present. The utilization dimension relates to the body's ability to absorb and benefit from the nutrients in the food, which can be impeded by factors like health, sanitation, and dietary practices. Lastly, stability refers to the vulnerability of these dimensions to external shocks, which can lead to sudden fluctuations in food security status [5].
Sudan's topography primarily consists of fertile agricultural land, particularly suitable for cultivating instant cereal crops like sorghum, wheat, and millets. These crops dominate Sudan's agricultural production, providing around 53% of the population's daily calorie needs [6,7]. While a wide variety of crops are grown in Sudan, sorghum is the primary staple in central and northern regions, while millet takes precedence in western areas. As of 2023, Sudan's population exceeded 45.66 million and is projected to grow by 2.7% annually [8]. Food consumption patterns have changed due to increasing income and rural-to-urban migration. Angel curve analyses of food consumption behavior in Sudan have demonstrated differences across households at different socio-economic levels [9]. A dynamic trend emerges when we compare the dietary energy consumption (kcal/person/day) in different states of Sudan. Generally, food consumption in Africa was lower during 2006-2008, likely influenced by global food price fluctuations [10]. Projections suggest that African developing countries will reach a per capita food consumption of 3050 kcal per day by 2030 [11].
Sudan has faced considerable political and economic difficulties, including conflicts, internal displacement, and economic sanctions, which have all contributed to the nation's food insecurity. These challenges have disrupted the availability and distribution of food, as well as hindered the population's access to it. The World Food Program (WFP) predicts that approximately 15 million Sudanese people will experience acute food insecurity in 2024, highlighting the urgent need for a comprehensive understanding of the underlying factors [12,13]. The White Nile State observed a slight decrease in food insecurity, dropping by 1% since 2022. El Jableen, Guli, and El Salam reported the highest rates of food insecurity, all at 27%, with El Salam also having the highest severe food insecurity rate at 5% [14,15].
In North Kordofan, food insecurity experienced a marginal 2% increase, with Sodari, Om Rwaba, and West Bara having the highest rates of food insecurity. Coping strategies based on food and livelihoods notably increased, and inadequate food intake also rose [14,15]. North Darfur, on the other hand, saw a 9% decrease in food insecurity from 2022 to 2023, attributed to improved agricultural production, especially sorghum. Kuma, Kebkabiya, and Tawila reported the highest food insecurity levels. South Darfur witnessed a slight increase in food insecurity, and East Jabel Marra, Bielel, and El Wihda had the highest food insecurity rates. West Darfur had a 9% decrease in food insecurity, despite remaining one of Sudan's most food-insecure states. Halaib had the highest severe food insecurity rate in Sudan. Red Sea state changes were attributed to cultural eating practices, micronutrient deficiencies, and high malnutrition rates [14,15]. Recent studies on food consumption in Sudan are limited, with more focus on poverty, food security, malnutrition, and balanced diets [16,17,18,19]. It's crucial to recognize that food security, a fundamental human right, is intertwined with well-being and livelihoods. This paper extensively explores food insecurity assessment, with a focus on consumption patterns and their implications in Sudan, utilizing the IPC assessment framework [20].
Specifically, the paper seeks to investigate the complexities surrounding food insecurity, consumption patterns, and the implications of the Integrated Food Security Phase Classification (IPC) framework in Sudan. Employing a specialized analytical approach known as hesitant fuzzy entropy (HFE) analysis, we aim to unravel the intricate relationships within this multifaceted context. The convergence of food insecurity, consumption patterns, and the IPC framework holds transformative potential for Sudanese communities. However, comprehending the nuanced interplay and underlying factors demands a sophisticated analytical tool, making HFE analysis particularly relevant. HFE serves as a quantitative technique designed to navigate uncertainties in multi-criteria decision-making scenarios [21,22,23,24]. It establishes a structured framework for assessing the significance of diverse factors while accommodating the inherent vagueness and uncertainty present in real-world data.
By applying HFE analysis to the domains of food insecurity and consumption patterns, a deeper understanding can be gained regarding the influential variables at play. The computed values of hesitant fuzzy entropy enable a quantitative assessment of the importance of these variables, shedding light on their impact on the food security landscape [21,22,23,24]. Identifying pivotal determinants affecting food insecurity and consumption patterns allows for the formulation of strategies to enhance food security initiatives, tailor consumption patterns to specific needs, and improve the overall food ecosystem for Sudanese communities. This study specifically aims to achieve the following objectives: (1) ascertain the factors influencing food insecurity in Sudan, (2) employ hesitant fuzzy entropy analysis to dissect the variables affecting consumption patterns and food security, and (3) provide insights into the perspectives of relevant institutions regarding the current state of food security in Sudan, considering the existing economic and political challenges.
The remainder of this paper is organized as follows: Section 2 provides an in-depth exploration of existing literature on food security, consumption patterns, and the IPC framework. Section 3 outlines the data collection and methodology employed in the study. The detailed results of food consumption and food insecurity in different states of Sudan are given in Section 4. The Integrated Food Security Phase Classification (IPC) in Sudan which evaluates the effectiveness of the IPC framework in the Sudanese context. Finally, section 5 concludes the study, emphasizing the intricate connections between food insecurity, consumption patterns, and the IPC framework.
2. Literature Review
The analysis of food consumption patterns has become a focal point for both researchers and nations due to its reflection of consumer behavior. Researchers have recognized that income allocation, including food, durable consumer goods, and investments in human capital such as education, healthcare, and marriage, represents various forms of investment expenditures [9]. This has spurred interest in studying food consumption patterns, particularly in developing nations where food consumption policies hold significant importance [25,26,27,28,29,30,31,32,33,34,35,36,37,38,39]. Notably, disparities in food consumption among households are influenced by factors like individual preferences, food pricing, availability, and resource constraints [30].
Researchers, including Li et al. [31], have confirmed that income, education, and household livestock rearing significantly influence food consumption behaviors. Fluctuations in food prices also impact food consumption habits, often leading to shifts from less nutritious to healthier food choices [32]. Various factors affecting food consumption in India encompass regional distinctions, the pace of urbanization, household size, and seasonal variations [33]. An increase in income tends to increase food consumption, affecting water requirements, individual tastes, beliefs, and cultural traditions [11,34]. Additionally, women's education and employment play a significant role in the portion of total expenditure allocated to food, ultimately leading to increased food consumption [35]. Climate change has emerged as a significant driver of global changes in food consumption patterns, influencing dietary habits [36,37,38]. In low-income countries, increases in GDP often correspond to shifts in food consumption patterns, revealing disparities between supply and actual consumption [39]. The influence of televised food advertisements on dietary habits is noteworthy [16]. Income and consumption patterns also exhibit specific variations over different seasons, influenced by off-farm sources of income and seasonal variability [40,41,42]. Seasonal food prices tend to drop during demand peaks [43], with pronounced food market seasonality in Africa, resulting in varying seasonal gaps across different food items [44].
Research into food price elasticities and associated demand models is extensive. Colen et al. [45] observed that income elasticities tend to decrease as nations become more affluent. Food own-price elasticities, as noted by Rathnayaka et al. [46], typically exhibit a negative and price-inelastic nature, emphasizing the influence of food prices on consumption patterns. This often results in income inelasticity concerning food demand [45]. Tan et al. [47] and Abdulai [48] employed the QUAIDS model to analyze living expenses, emphasizing the significant impact of food expenditures on overall expenses. Riches [49] argue that discussing food insecurity in developed countries is crucial due to concerning statistics. For instance, the US has 49 million people classified as food insecure, and 43 million are at risk of food insecurity in the EU [49]. Literature primarily defines food insecurity at the household or population level, emphasizing elements like availability, accessibility, affordability, and stability to ensure a secure food environment [50,51,52].
The hesitant fuzzy set has undeniably evolved as a crucial tool for managing uncertain data. Within this context, hesitant fuzzy entropy serves as a significant metric in the decision-making process. However, prevalent entropy measures encounter various issues, including counterintuitive outcomes. Traditional decision-making methods like the TOPSIS method, when applied to decision problems in hesitant fuzzy frameworks, assume absolute rationality on the part of decision-makers, leading to irrational calculation results. Xin and Ying [22] addressed these challenges by presenting a comprehensive hesitant fuzzy entropy in which a new axiomatic definition of hesitant fuzzy entropy is introduced, followed by the establishment of comprehensive hesitant fuzzy entropy grounded in the dual aspects of fuzziness and vagueness. Subsequently, the enhanced TOPSIS method is employed to evaluate the comprehensive entropy measure, and simulations are conducted to validate the efficacy of the proposed approach. The findings indicate that, compared to existing entropy measures, the comprehensive hesitant fuzzy entropy more precisely captures the uncertainty of hesitant fuzzy elements while maintaining the advantages of simplicity and ease of comprehension.
Zheng et al. [23] addressed challenges in large-scale group decision-making by proposing a novel method, the hesitant fuzzy linguistic bi-objective clustering approach. Existing methods exhibit limitations such as fixed consistency thresholds and neglect of both relationship similarity and information quality in clustering. The proposed method introduces a preference information selection procedure and a bi-objective clustering approach, considering consensus and information entropy. This enables efficient identification of suitable experts and robust clustering for comprehensive preference information. An example related to COVID-19 defense strategies showcases the method's effectiveness, demonstrating validity, strong performance, and robustness in large-scale group decision-making scenarios. Gao and Sun [24] addressed the inadequacies of traditional monetary-centric approaches to measuring poverty in China by proposing a multidimensional model incorporating non-monetary indicators. Utilizing data from the China Health and Nutrition Survey and employing a fuzzy set method, the research evaluates poverty across different regions. It calculates one-dimensional and multidimensional poverty indices, including dimensions like education, health, assets, and living standards, offering a comprehensive analysis of rural family poverty. The findings highlight the sensitivity of the fuzzy set method to overall population distribution in the poverty dimension compared to the poverty line method. The study emphasizes the need to enhance rural infrastructure, increase educational investment, and improve the overall quality of the impoverished population in China.
In a related context, Wan et al. [53] introduced an innovative strategy for multi-criteria group decision-making using hesitant fuzzy Preference Ranking Organization Method for Enrichment Evaluations (PROMETHEE), specifically applied to green supplier selection. This novel approach establishes a hesitancy index for hesitant fuzzy elements and introduces a comprehensive hesitant fuzzy Hausdorff distance that considers both membership values and hesitancy. Furthermore, a composite hesitant fuzzy entropy incorporates both fuzziness and hesitancy entropy. Objective decision-maker weights are derived through a linear programming model, while criteria weights are determined through a nonlinear model. The application of PROMETHEE facilitates individual rankings, and a multi-objective assignment model generates collective rankings. This innovative strategy enhances decision-making by integrating hesitant fuzzy elements and employing advanced techniques for complex scenarios like green supplier selection.
Similarly, Naeem et al. [54] present an enhanced and innovative approach rooted in the Technique for Order Preference by Similarity to Ideal Solution (TOPSIS) for multi-criteria group decision-making (MCGDM) within a probabilistic hesitant fuzzy framework. This framework is particularly suitable for situations where both expert and criteria weights are not predetermined. The foundation of this approach delves into the concept of Probabilistic Hesitant Fuzzy Sets (PHFs), along with score functions and fundamental operational principles. To compute elusive weight details, a generalized distance measure for PHFs is established by leveraging the Probabilistic Hesitant Fuzzy Entropy measure. Subsequently, the MCGDM method is outlined, incorporating the PHF-based decision-making process. This innovative strategy advances MCGDM by addressing uncertainties in weight assignments and seamlessly integrating probabilistic hesitant fuzzy elements into the decision-making paradigm. Xu et al. [55] conducted a pioneering investigation into defining fuzzy entropy for individual elements within the domain of weak probabilistic hesitant fuzzy elements (WPHFEs), which aligns with the distribution characteristics of fuzziness. The study establishes axiomatic definitions for both fuzzy entropy and hesitancy entropy of WPHFEs. This groundwork serves as a basis for developing a comprehensive definition of overall entropy for WPHFEs by integrating the concepts of fuzzy entropy and hesitancy entropy. Additionally, novel methodologies for ranking and decision-making are introduced, leveraging these newly proposed entropic measures. The practical viability and effectiveness of these innovative approaches are demonstrated through an illustrative example and two comparative analyses.
Narayanamoorthy et al. [56] introduced inventive methodologies known as Hesitant Fuzzy-Criteria Importance Through Intercriteria Correlation and Hesitant Fuzzy-Multi Attribute Utility Theory for ranking turbine models based on attributes such as quality, power level, voltage, and capacity. These methodologies incorporate the utilization of the NWHF technique to extract comprehensive insights from decision-makers. In a separate exploration, Xia and Xu [57] investigated the concept of aggregating hesitant fuzzy information to support decision-making processes. In another study, Xu and Xia [58] delved into the application of hesitant fuzzy entropy and cross entropy within the context of Multiple Attribute Decision Making (MADM). Similarly, Berrached and de Korvin [59] effectively applied fuzzy set theory to consolidate data from multiple sensors at the cluster level, enhancing the quality of information derived from original data and facilitating accurate decision-making on relevant matters. Additionally, Swathiga and Chandrasekar [60] addressed network congestion through a fuzzy strategy. While this strategy reduces data redundancy, it overlooks the potential impact of data fusion on data accuracy, potentially resulting in data distortion. Anees et al. [21] proposed an innovative approach for opportunistic clustering and data fusion in heterogeneous Wireless Sensor Networks (WSNs) using hesitant fuzzy entropy. This novel algorithm involves collecting local sensory data from sensor nodes and employing a multi-attribute decision model based on hesitant fuzzy entropy for the cluster head election process.
3. Materials and Methods
The data collection during the harvest season encompassed seven states: White Nile, North Kordofan, Red Sea State, North Darfur, South Darfur, West Darfur, and East Darfur. Data collection for households occurred between July 2022 and March 2023, with the goal of providing a comprehensive representation of households at the locality level. The survey employed a two-stage stratified sample methodology, where samples were stratified by states and localities. Within each locality, two primary sampling units (PSUs) were randomly selected, and 20 households were surveyed within each PSU. Due to the high levels of illiteracy in the region, most respondents underwent verbal interviews following questionnaire pre-testing. On average, 40 households were examined per locality, resulting in a sample size of 4,480 households across 112 localities in seven states. The research delved into demographic and socioeconomic variables affecting household food security, including age, gender, education, employment status, remittances, annual income, assets, market access, food aid, credit access, distance from nearby city, livestock’s, natural disasters, etc. The assessment of food insecurity utilizes the Consolidated Approach to Reporting Indicators of Food Security (CARI), a corporate indicator of the WFP [61]. CARI categorizes households into four distinct groups for descriptive purposes: food secure, marginally food secure, moderately food insecure, and severely food insecure.
The hesitant fuzzy entropy (HFE) method was used to analyze and interpret the data. HFE is a mathematical concept utilized to measure the degree of uncertainty or hesitancy inherent in hesitant fuzzy sets. Within these sets, individual elements are linked to multiple degrees of membership across different fuzzy sets, illustrating the uncertainty or hesitancy in assigning a single membership value. HFE quantifies the diversity and ambiguity found in these hesitant fuzzy sets, offering insights into the intricacies of decision-making and individual preferences. The establishment of hesitant fuzzy sets involves the application of triangular membership functions. Wang et al. [62] elaborated that when a fixed set X is subjected to a hesitant fuzzy set α, it generates a subset within the range of [0, 1]. Let denote the count of values in α(x), with representing the ith smallest value within α(x), where i ranges from 1, 2, … to . To compute the cross entropy of two hesitant fuzzy sets, α and β, it is assumed that both sets have the same length. Alternatively, if α contains only one value, it is repeated to match the length of β. Additionally, when dealing with a single hesitant fuzzy set, both α and its complement are utilized in the cross-entropy calculation. The calculation of hesitant fuzzy entropy is performed using Equations (1) and (2).
where
where , q > 0.
Then, we calculate the entropy weight coefficients using (4) after generating entropy matrix in (3).
where 0 ≤ ≤ 1, and . In the next step, we find the average data value of variables, i.e.,
and then synthesize the value of each variable to find threshold variable value using (6) as:
The decision about CARI distinctive groups i.e. food secure, marginally secure, moderately food insecure and severely food insecure depends on the probability distribution of food security levels. In this paper, we calculate the probability distribution of food security levels by using hesitant fuzzy entropy analysis. In this regard, we compare the DFj values with that of the threshold values and then define certain groups of most significant variables used in food security assessment and consumption pattern analysis to give us an indication about the likelihood of different food security levels in Sudan. It is evident from the figure that those Sudanese who having access to market, receive food aid, receive remittance and their annual income is above low levels can be considered as food secured according to HFE analysis. Similarly, those who are have inherited rural/urban assets, have food aid, annual income is low and do not receive any sort of remittances from abroad must be fallen in marginally food secured category. Furthermore, farmers living in rural areas who do not have access to market, have to travel larger distances, no food aid, no remittance, no assets but only depend on livestock must be in moderately food insecure category. This distinctive group have a moderate effect of floods, diseases and drought as well. In the severely food insecure group, we put those Sudanese who have very limited food aid due to remote locations, no remittance, no assets, no livestock and additionally they are affected by natural disasters like floods, drought, earthquakes etc.
4. Results and Discussion
The characteristics of households are examined in this study as depicted from Table 1. Information is collected by contacting the household head since all decisions regarding households, particularly those involving finances, are typically made by the head of the household. Respondents are categorized by gender: 3001 (67%) are male and 1479 (33%) were female. In most households, the male is the head due to the predominantly male-dominated nature of society. Respondents are generally mature in terms of age and their ability to provide for their families. They are distributed as follows: 493 (11%) are under 20, 927 (20.7%) are aged 20–29, 1210 (27%) are aged 30–39, 1066 (23%) are aged 40–49, and 784 (18.3%) are 50 years old or above. In terms of education, 1596 (33.3%) had completed primary schooling, 641 (14.3%) had completed high school, 542 (12.1%) had attended college, 381 (8.5%) had attended university, and 1420 (31.7%) had other certifications and diplomas. Employment status, attributed to the cause of food insecurity due to unemployment, holds a degree of membership of [0.3, 0.7], highlighting its significant impact on food security. Receipt of remittances, with a degree of membership of [0.32, 0.68], emerges as another influential factor. Ownership of assets, assessed with a degree of membership of [0.11, 0.89], also plays a crucial role. The distance from the nearby city, categorized as low, medium, or high, showcases degrees of membership of [0.31, 0.45, 0.24], reflecting its nuanced impact on food security. Annual income, categorized as low, medium, or high, reveals degrees of membership of [0.67, 0.26, 0.07], underlining income as a significant determinant. Market access, with a degree of membership of [0.63, 0.37], and receipt of food aid, with a degree of membership of [0.18, 0.82], contribute to the complexity of food security dynamics. Livestock ownership, access to credit, and natural disasters (floods, diseases, drought) are also considered, each with its respective degree of membership, showcasing the multifaceted nature of factors influencing food security in Sudan.
It is worth noting that our objective for this case study is to identify attributes common among Sudanese, irrespective of their geographical location. This approach is adopted to ensure that a wide range of Sudanese could benefit from the HFE analysis based on food security assessment, consumption patterns, and IPC classification. Given that each attribute possesses distinct [min max] values, it was necessary to standardize the data to achieve a uniform scale. This standardization process aimed to align all attributes and transform the collected data values into hesitant fuzzy sets. To accomplish this, we segmented the attribute values into ten intervals based on their [min, max] range and subsequently assigned corresponding values within the range of 0 to 1.0. The attribute values, which have been normalized and standardized within the hesitant fuzzy set, are further mapped to a linguistic term set S using a triangular membership function. To generate linguistic terms for the alternatives based on various criteria values, a context-free grammar GCF [63] is employed. Subsequently, the membership values within the hesitant fuzzy set are converted into hesitant fuzzy linguistic term sets (HFLTS) through a transformation function. This process ensures the representation of the data in linguistic terms, facilitating meaningful analysis and interpretation. Table 1 represents the hesitant fuzzy set of variables after data standardization process in terms of degree of membership values. These hesitant fuzzy sets are further exploited to calculate hesitant fuzzy entropy using equation (3) and their corresponding entropy weight coefficients using equation (4). The hesitant fuzzy entropy is needed to obtain the statistical measure of uncertainty in our decision process about the distinctive groups i.e. food secure, marginally food secure, moderately food insecure, and severely food insecure. Figure 1 and Figure 2 represent the hesitant fuzzy entropy values and their corresponding weight coefficients i.e. .
Also, we have used the heat maps of entropy values (Figure 3). Heat maps can provide a visual representation of the HFE values for multiple variables. Each cell in the heat map corresponds to the HFE value of that variable. Heat maps are useful for identifying relationships between multiple variables simultaneously.
Foregoing in view, the mean value of all variables and entropy weight coefficients can be utilized to measure the threshold value of all variables using equation (6). The data attribute values of each variable and the threshold values DFj can be depicted from Figure 4 and Figure 5 in form of a horizontal bar chart and scatterplot. Consequently, we computed the probability distribution of food security levels using some of the most significant variables and then correlated them against IPC classification data analysis.
Figure 6 depicts the comparison of probability of most significant variables, i.e. assets, remittances, annual income, and distance from nearby city. These variables could significantly influence the food security levels.
The food security analysis conducted for various states in Sudan, employing the IPC reveals nuanced patterns of vulnerability across regions. Figure 7 shows the percentage distribution of phases (1-5) for different states of Sudan. It is evident from that assets and annual income totally outperform remittances and distance from nearby city for Sudanese.
In East Darfur, 23% of the population experiences significant food insecurity, with 44% facing challenges categorized under Phase 3 and above. North Darfur exhibits a substantial portion (29%) in Phase 3 and above, indicating a pressing need for targeted interventions. A similar trend is observed in North Kordofan, with 29% of the population affected. South Darfur faces a critical situation, as 37% of its population is in Phase 3 and above, necessitating immediate and comprehensive strategies. West Darfur presents a severe challenge, with 51% in Phase 3 and above, demanding urgent and sustained efforts. White Nile, comparatively better, still requires targeted interventions for its 20% population in Phase 3 and above. The Red Sea region shows concern, with 25% in Phase 3 and above, emphasizing the need for mitigation measures. This analysis underscores the diverse and dynamic nature of food security challenges in Sudan, urging region-specific strategies to address the unique needs of each state for the well-being of its population [64,65].
Figure 8 demonstrates the heatmap of phase percentage distribution of different states of Sudan from October 2023 to February 2024. In the heatmap, each cell corresponds to a specific state and IPC phase combination. The intensity of color, ranging from lighter to darker shades, represents the magnitude of the population percentage in a particular phase for a given state. Darker shades indicate higher population percentages, while lighter shades indicate lower percentages. Beyond its visual appeal, this heatmap can provide researchers with a wealth of numerical insights. These values represent the percentage of the population in a specific IPC phase for a particular state. This numerical information enables a granular comparison of food security statuses across states and different phases.
The DFj values for each variable signify their impact on food security levels, aligning with IPC classifications. The computed probabilities for food secure, marginally food secure, moderately food insecure, and severely food insecure individuals are indicative of the likelihood of individuals falling into these IPC phases (Figure 9). These probabilities provide valuable insights into consumption patterns and vulnerability to food insecurity, allowing for a more nuanced understanding of the factors influencing food security. The normalized probabilities serve as a quantitative measure, aiding in the assessment of food security scenarios and the identification of key variables affecting the population's access to food resources.
The probability distribution shows that 26% of Sudanese in the study area are likely to be food secured, whereas 24% will be marginally food secured, 35% will be moderately food insecure, and 15% will be severely affected in terms of food security for the next two quarters, i.e., January– June 2024. This information is crucial for policymakers and researchers in designing targeted interventions and addressing specific challenges in the pursuit of improved food security.
5. Conclusions
This research has undertaken a comprehensive examination of food security assessment in Sudan, with a specific focus on conducting HFE analysis to identify influential factors affecting food security levels and IPC food security classification. This study utilized a dataset comprising 32 significant variables, encompassing aspects of food security assessment. The analysis involved entropy values, weight coefficients, heatmaps, and scatterplots to unravel the complexity of food security level distribution for Sudanese living in our study area. The results in terms of probability distribution of food security levels correlates with that of IPC food security classification for different phases. The likelihood distribution indicates that within our study region, approximately 26% of the Sudanese population is expected to experience food security, while 24% are projected to fall into the category of marginal food security. Additionally, around 35% are anticipated to face moderate food insecurity, and 15% are expected to be significantly affected, experiencing severe food insecurity during the upcoming two quarters, spanning from January to June 2024.
Author Contributions
Conceptualization, A.F. and G.T.; methodology, A.F. and G.T.; software, A.F. and F.S.; validation, F.S, V.E., A.E., and A.R.; formal analysis, F.S., V.E., A.E. and W.M.; investigation, A.F., V.E., A.E., A.R. and W.M.; resources, V.E., F.S., A.E., A.R. and W.M.; data curation, A.F., V.E., and A.R.; writing—original draft preparation, A.F.; writing—review and editing, V.E.; visualization, A.F. and V.E.; supervision, G.T; project administration, A.F. and V.E.; funding acquisition, A.F. and G.T. All authors have read and agreed to the published version of the manuscript.
Funding
This research is supported by the Heilongjiang Province Philosophy and Social Sciences Research Planning Project "Promoting Sino Russian Agricultural Cooperation Research Based on Institutional Innovation of China (Heilongjiang) Pilot Free Trade Zone" (22JYH064).
Institutional Review Board Statement
Not applicable.
Informed Consent Statement
Not applicable.
Data Availability Statement
The data presented in this study are available on request from the corresponding author.
Conflicts of Interest
The authors declare no conflict of interest. The funders had no role in the design of the study; in the collection, analyses, or interpretation of data; in the writing of the manuscript; or in the decision to publish the results.
References
- Vågsholm, I.; Arzoomand, N.S.; Boqvist, S. Food Security, Safety, and Sustainability - Getting the Trade-Offs Right. Frontiers in Sustainable Food Systems 2020, 4, 16. [Google Scholar] [CrossRef]
- Erokhin, V.; Gao, T.; Chivu, L.; Andrei, J.V. Food security in a food self-sufficient economy: A review of China’s ongoing transition to a zero hunger state. Agricultural Economics – Czech 2022, 68(12), 476–487. [Google Scholar] [CrossRef]
- Stefanis, C. Global Food Security: An Agricultural Perspective. Journal of Agriculture and Sustainability 2014, 6(1), 69–87. [Google Scholar]
- Erokhin, V. Factors influencing food markets in developing countries: An approach to assess sustainability of the food supply in Russia. Sustainability 2017, 9, 1313. [Google Scholar] [CrossRef]
- Headey, D.; Ecker, O. Rethinking the measurement of food security: From first principles to best practice. Food Security 2013, 5, 327–343. [Google Scholar] [CrossRef]
- FAO-SIFSIA. Sudan Institutional Programme, FAO/SIFSIA Programme in northern Sudan. Food Security Information for Action (SIFSIA); FAO: Rome, Italy, 2010. [Google Scholar]
- Ibnouf, F.O. Challenges and possibilities for achieving household food security in the Western Sudan region: The role of female farmers. Food Security 2011, 3(2), 215–231. [Google Scholar] [CrossRef]
- World Bank. Empowering girls and women in South Sudan; World Bank: Washington, DC, USA, 2023. [Google Scholar]
- Hassan, R.M.; Babu, S.C. Measurement and determinants of rural poverty: Household consumption patterns and food poverty in rural Sudan. Food Policy 1991, 16(6), 451–460. [Google Scholar] [CrossRef]
- FAO. The 2007–2008 food price episode impact and policies in Eastern and Southern Africa; FAO: Rome, Italy, 2009. [Google Scholar]
- Vasileska, A.; Rechkoska, G. Global and regional food consumption patterns and trends. Procedia - Social and Behavioral Sciences 2012, 44, 363–369. [Google Scholar] [CrossRef]
- Luka, E.E.; Burgess, A. Famine and its effects on health in South Sudan. South Sudan Medical Journal 2017, 10(3), 69–70. [Google Scholar]
- Callister, L.C. Food insecurity has increased around the world. MCN, The American Journal of Maternal/Child Nursing 2023, 48(2), 106. [Google Scholar] [CrossRef]
- United Nations. Sudan: Comprehensive food security and vulnerability assessment (CFSVA) - Summary Report, Q1 2023 - June 2023; United Nations: New York, NY, USA, 2023. [Google Scholar]
- United Nations. Sudan: Comprehensive food security and vulnerability assessment (CFSVA) - Summary Report, Q1 2022 - June 2022; United Nations: New York, NY, USA, 2022. [Google Scholar]
- Musaiger, A.O. Socio-cultural and economic factors affecting food consumption patterns in the Arab countries. Journal of the Royal Society of Health 1993, 113(2), 68–74. [Google Scholar] [CrossRef]
- Ali Taha, S.A. Household food consumption in five villages in the Sudan. Ecology of Food and Nutrition 1978, 7(3), 137–142. [Google Scholar] [CrossRef]
- Teklu, T.; Von Braun, J.; Zaki, E. Drought and famine relationships in Sudan: policy implications. Food and Nutrition Bulletin 1992, 14(2), 1–3. [Google Scholar] [CrossRef]
- Khalid, F.A.; Ali, A.K.; Ali, S.A.; Mosmar, Z.Y.; Salih, S.S.; Salman, T.K.; Desogi, M.A.; Soghaier, M.A.; Mohammed, E.E.; Mohammed, A.A. Households’ dietary habits and food consumption patterns in Hamishkoreib locality, Kassala State, Sudan. Journal of Ethnic Foods 2017, 4(3), 181–186. [Google Scholar] [CrossRef]
- Maxwell, D.; Adan, G.; Hailey, P.; Day, M.; Odhiambo, S.B.J.; Kaindi, L.; Njiri, J.; Venkat, A.; Marshak, A. Using the household hunger scale to improve analysis and classification of severe food insecurity in famine-risk conditions: Evidence from three countries. Food Policy 2023, 118, 102449. [Google Scholar] [CrossRef]
- Anees, J.; Zhang, H.-C.; Baig, S.; Guene Lougou, B.; Robert Bona, T.G. Hesitant fuzzy entropy-based opportunistic clustering and data fusion algorithm for heterogeneous wireless sensor networks. Sensors 2020, 20, 913. [Google Scholar] [CrossRef]
- Xin, G.; Ying, L. Multi-attribute decision-making based on comprehensive hesitant fuzzy entropy. Expert Systems with Applications 2024, 237, 121459. [Google Scholar] [CrossRef]
- Zheng, Y.; Xu, Z.; He, Y.; Tian, Y. A hesitant fuzzy linguistic bi-objective clustering method for large-scale group decision-making. Expert Systems with Applications 2021, 168, 114355. [Google Scholar] [CrossRef]
- Gao, S.; Sun, K. Poverty measure based on hesitant fuzzy decision algorithm under social network media. Symmetry 2020, 12(3), 384. [Google Scholar] [CrossRef]
- Delgado, C.L. Rising consumption of meat and milk in developing countries has created a new food revolution. The Journal of Nutrition 2003, 133(11), 3907S–3910S. [Google Scholar] [CrossRef]
- Kearney, J. Food consumption trends and drivers. Philosophical Transactions of the Royal Society B: Biological Sciences 2010, 365(1554), 2793–2807. [Google Scholar] [CrossRef]
- Zezza, A.; Carletto, C.; Fiedler, J.L.; Gennari, P.; Jolliffe, D. Food counts. Measuring food consumption and expenditures in household consumption and expenditure surveys (HCES). Introduction to the special issue. Food Policy 2017, 72, 1–6. [Google Scholar] [CrossRef]
- Erokhin, V.; Gao, T. Impacts of COVID-19 on trade and economic aspects of food security: Evidence from 45 developing countries. International Journal of Environmental Research and Public Health 2020, 17(16), 5775. [Google Scholar] [CrossRef]
- Erokhin, V.; Diao, L.; Gao, T.; Andrei, J.-V.; Ivolga, A.; Zong, Y. The supply of calories, proteins, and fats in low-income countries: A four-decade retrospective study. International Journal of Environmental Research and Public Health 2021, 18(14), 7356. [Google Scholar] [CrossRef]
- Humphries, D.L.; Dearden, K.A.; Crookston, B.T.; Woldehanna, T.; Penny, M.E.; Behrman, J.R. Household food group expenditure patterns are associated with child anthropometry at ages 5, 8 and 12 years in Ethiopia, India, Peru and Vietnam. Economics & Human Biology 2017, 26, 30–41. [Google Scholar] [CrossRef]
- Li, Y.; Yu, W. Households food security in poverty-stricken regions: Evidence from western rural China. Agriculture and Agricultural Science Procedia 2010, 1, 386–395. [Google Scholar] [CrossRef]
- Green, R.; Cornelsen, L.; Dangour, A.D.; Turner, R.; Shankar, B.; Mazzocchi, M.; Smith, R.D. The effect of rising food prices on food consumption: Systematic review with meta-regression. The BMJ 2013, 346. [Google Scholar] [CrossRef]
- Abdulai, A.; Jain, D.K.; Sharma, A.K. Household food demand analysis in India. American Journal of Agricultural Economics 1999, 50(2), 316–327. [Google Scholar] [CrossRef]
- Liu, J.; Savenije, H.H.G. Food consumption patterns and their effect on water requirement in China. Hydrology and Earth System Sciences Discussion 2008, 12(3), 887–898. [Google Scholar] [CrossRef]
- Abdulai, A.; Aubert, D. A cross-section analysis of household demand for food and nutrients in Tanzania. Agricultural Economics 2004, 31(1), 67–79. [Google Scholar] [CrossRef]
- Rodríguez, C.; Naves, J.; Fernández-Gil, A.; Obeso, J.R.; Delibes, M. Long-term trends in food habits of a relict brown bear population in northern Spain: the influence of climate and local factors. Environmental Conservation 2007, 34(1), 36–44. [Google Scholar] [CrossRef]
- Popp, A.; Lotze-Campen, H.; Bodirsky, B. Food consumption, diet shifts and associated non-CO2 greenhouse gases from agricultural production. Global Environmental Change 2010, 20(3), 451–462. [Google Scholar] [CrossRef]
- Hasegawa, T.; Fujimori, S.; Shin, Y.; Takahashi, K.; Masui, T.; Tanaka, A. Climate change impact and adaptation assessment on food consumption utilizing a new scenario framework. Environmental Science & Technology 2014, 48(1), 438–445. [Google Scholar] [CrossRef]
- Gerbens-Leenes, P.; Nonhebel, S.; Krol, M.S. Food consumption patterns and economic growth. Increasing affluence and the use of natural resources. Appetite 2010, 55(3), 597–608. [Google Scholar] [CrossRef]
- Khandker, S.R. Seasonality of income and poverty in Bangladesh. Journal of Development Economics 2012, 97(2), 244–256. [Google Scholar] [CrossRef]
- Handa, S.; Mlay, G. Food consumption patterns, seasonality and market access in Mozambique. Development Southern Africa 2006, 23(4), 541–560. [Google Scholar] [CrossRef]
- Dercon, S.; Krishnan, P. Vulnerability, seasonality and poverty in Ethiopia. The Journal of Development Studies 2000, 36(6), 25–53. [Google Scholar] [CrossRef]
- MacDonald, J.M. Demand, information, and competition: Why do food prices fall at seasonal demand peaks? The Journal of Industrial Economics 2000, 48(1), 27–45. [Google Scholar] [CrossRef]
- Gilbert, C.L.; Christiaensen, L.; Kaminski, J. Food price seasonality in Africa: Measurement and extent. Food Policy 2007, 67, 119–132. [Google Scholar] [CrossRef]
- Colen, L.; Melo, P.; Abdul-Salam, Y.; Roberts, D.; Mary, S.; Paloma, S.G.Y. Income elasticities for food, calories and nutrients across Africa: A meta-analysis. Food Policy 2018, 77, 116–132. [Google Scholar] [CrossRef]
- Rathnayaka, S.; Selvanathan, S.; Selvanathan, S. Consumption patterns in Sri Lanka: A decomposition analysis. Applied Economics 2019, 51(37), 4056–4072. [Google Scholar] [CrossRef]
- Tan, T.; Zhang, Y.; Wen, B.; Zhang, X.; Zhan, J. Household consumption distribution in rural China: A consistent two-step estimation. Canadian Journal of Agricultural Economics 2017, 65(1), 119–133. [Google Scholar] [CrossRef]
- Abdulai, A. Household demand for food in Switzerland. A quadratic almost ideal demand system. Swiss Journal of Economics and Statistics 2002, 138(1), 1–18. [Google Scholar]
- Riches, G. Thinking and acting outside the charitable food box: Hunger and the right to food in rich societies. Development in Practice 2011, 21(4-5), 768–775. [Google Scholar] [CrossRef]
- Kruzslicika, M. Analytical instruments for measuring food security at macroeconomic level. Agricultural Management 2015, 7(1), 57–63. [Google Scholar]
- Leroy, J.; Ruel, M.; Frongillo, E.; Harris, J.; Ballard, T. 2015. Measuring the food access dimension of food security: A critical review and mapping of indicators. Food and Nutrition Bulletin 2015, 36(2), 167–195. [Google Scholar] [CrossRef]
- Lebel, A.; Noreau, D.; Tremblay, L.; Oberle, C.; Girard-Gadreau, M.; Duguay, M.; Block, J. Identifying rural food deserts: Methodological considerations for food environment interventions. Canadian Journal of Public Health 2014, 107 (Suppl 1), eS21–eS26. [Google Scholar] [CrossRef]
- Wan, S.P.; Zou, W.C.; Zhong, L.G.; Dong, J.Y. Some new information measures for hesitant fuzzy PROMETHEE method and application to green supplier selection. Soft Computing 2020, 24, 9179–9203. [Google Scholar] [CrossRef]
- Naeem, M.; Khan, M.A.; Abdullah, S.; Qiyas, M.; Khan, S. Extended TOPSIS method based on the entropy measure and probabilistic hesitant fuzzy information and their application in decision support system. Journal of Intelligent & Fuzzy Systems 2021, 40(6), 11479–11490. [Google Scholar] [CrossRef]
- Xu, T.T.; Zhang, H.; Li, B.Q. Fuzzy entropy and hesitancy entropy in probabilistic hesitant fuzzy information and their applications. Soft Computing 2022, 26(18), 9101–9115. [Google Scholar] [CrossRef]
- Narayanamoorthy, S.; Ramya, L.; Kang, D.; Baleanu, D.; Kureethara, J.V.; Annapoorani, V. A new extension of hesitant fuzzy set: An application to an offshore wind turbine technology selection process. IET Renewable Power Generation 2021, 15(11), 2340–2355. [Google Scholar] [CrossRef]
- Xia, M.; Xu, Z. Hesitant fuzzy information aggregation in decision making. International Journal of Approximate Reasoning 2011, 52, 395–407. [Google Scholar] [CrossRef]
- Xu, Z.; Xia, M. Hesitant fuzzy entropy and cross-entropy and their use in multiattribute decision-making. International Journal of Intelligent Systems 2012, 27, 799–822. [Google Scholar] [CrossRef]
- Berrached, A.; de Korvin, A. Data fusion in wireless sensor networks using fuzzy set theory. In Proceedings of the Seventh International Conference on Sensor Technologies and Applications, Barcelona, Spain, 25–31 August 2013; pp. 7108–7112. [Google Scholar]
- Swathiga, U.U.S.; Chandrasekar, C. An efficient fuzzy based congestion control technique for wireless sensor networks. International Journal of Computer Applications 2012, 40, 47–54. [Google Scholar] [CrossRef]
- United Nations World Food Programme. Consolidated approach to reporting indicators of food security (CARI) guidelines; World Food Programme: Washington, DC, USA, 2015. [Google Scholar]
- Wang, J.; Tawose, O.T.; Jiang, L.; Zhao, D. A new data fusion algorithm for wireless sensor networks inspired by hesitant fuzzy entropy. Sensors 2019, 19, 784. [Google Scholar] [CrossRef]
- Banerjee, P.S.; Mandal, S.N.; De, D.; Maiti, B. RL-sleep: Temperature adaptive sleep scheduling using reinforcement learning for sustainable connectivity in wireless sensor networks. Sustainable Computing: Informatics and Systems 2020, 26, 100380. [Google Scholar] [CrossRef]
- Integrated Food Security Phase Classification. IPC Sudan Acute Food Insecurity Oct 2023 - Feb 2024 Report. Available online: https://www.ipcinfo.org/fileadmin/user_upload/ipcinfo/docs/IPC_Sudan_Acute_Food_Insecurity_Oct2023_Feb2024_Report.pdf (accessed on 15 January 2024).
- Humanitarian Data Exchange. Sudan Acute Food Insecurity Country Data. Available online: https://data.humdata.org/dataset/sudan-acute-food-insecurity-country-data (accessed on 15 January 2024).
Figure 1.
Hesitant Fuzzy Entropy values for each variable included in the study. Source: authors’ development.
Figure 1.
Hesitant Fuzzy Entropy values for each variable included in the study. Source: authors’ development.
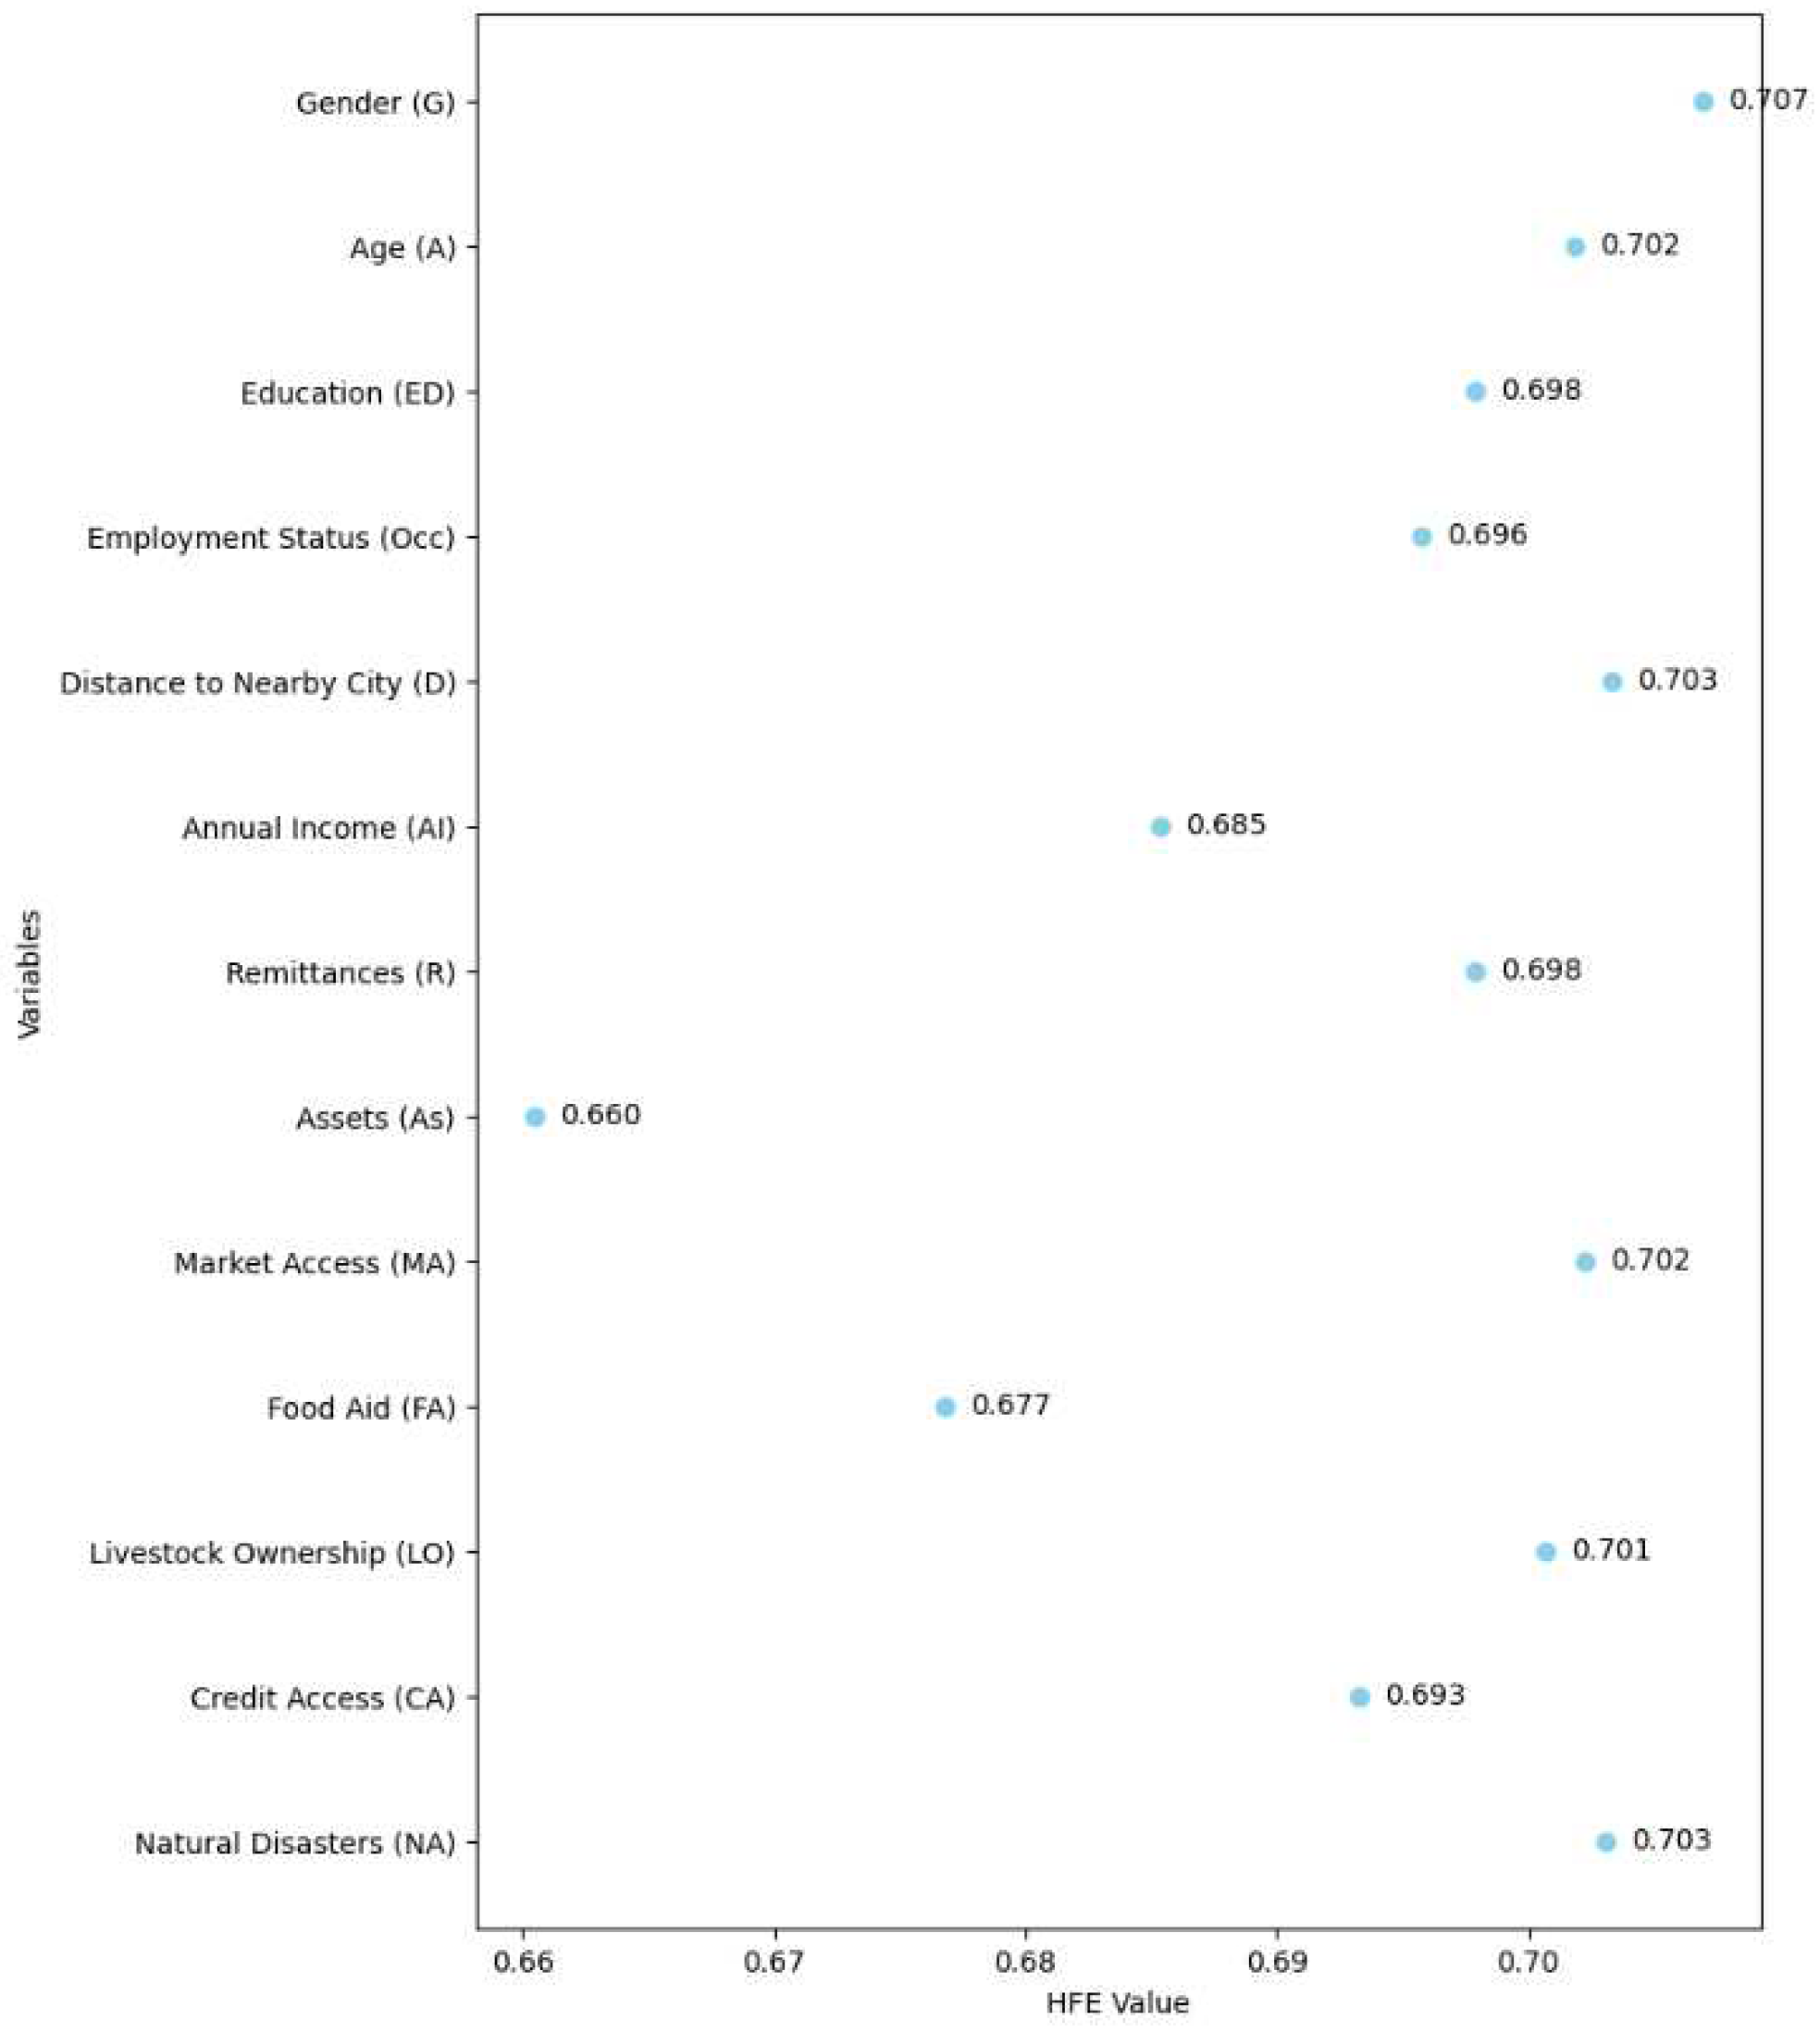
Figure 2.
Corresponding entropy weights of each variable. Source: authors’ development.
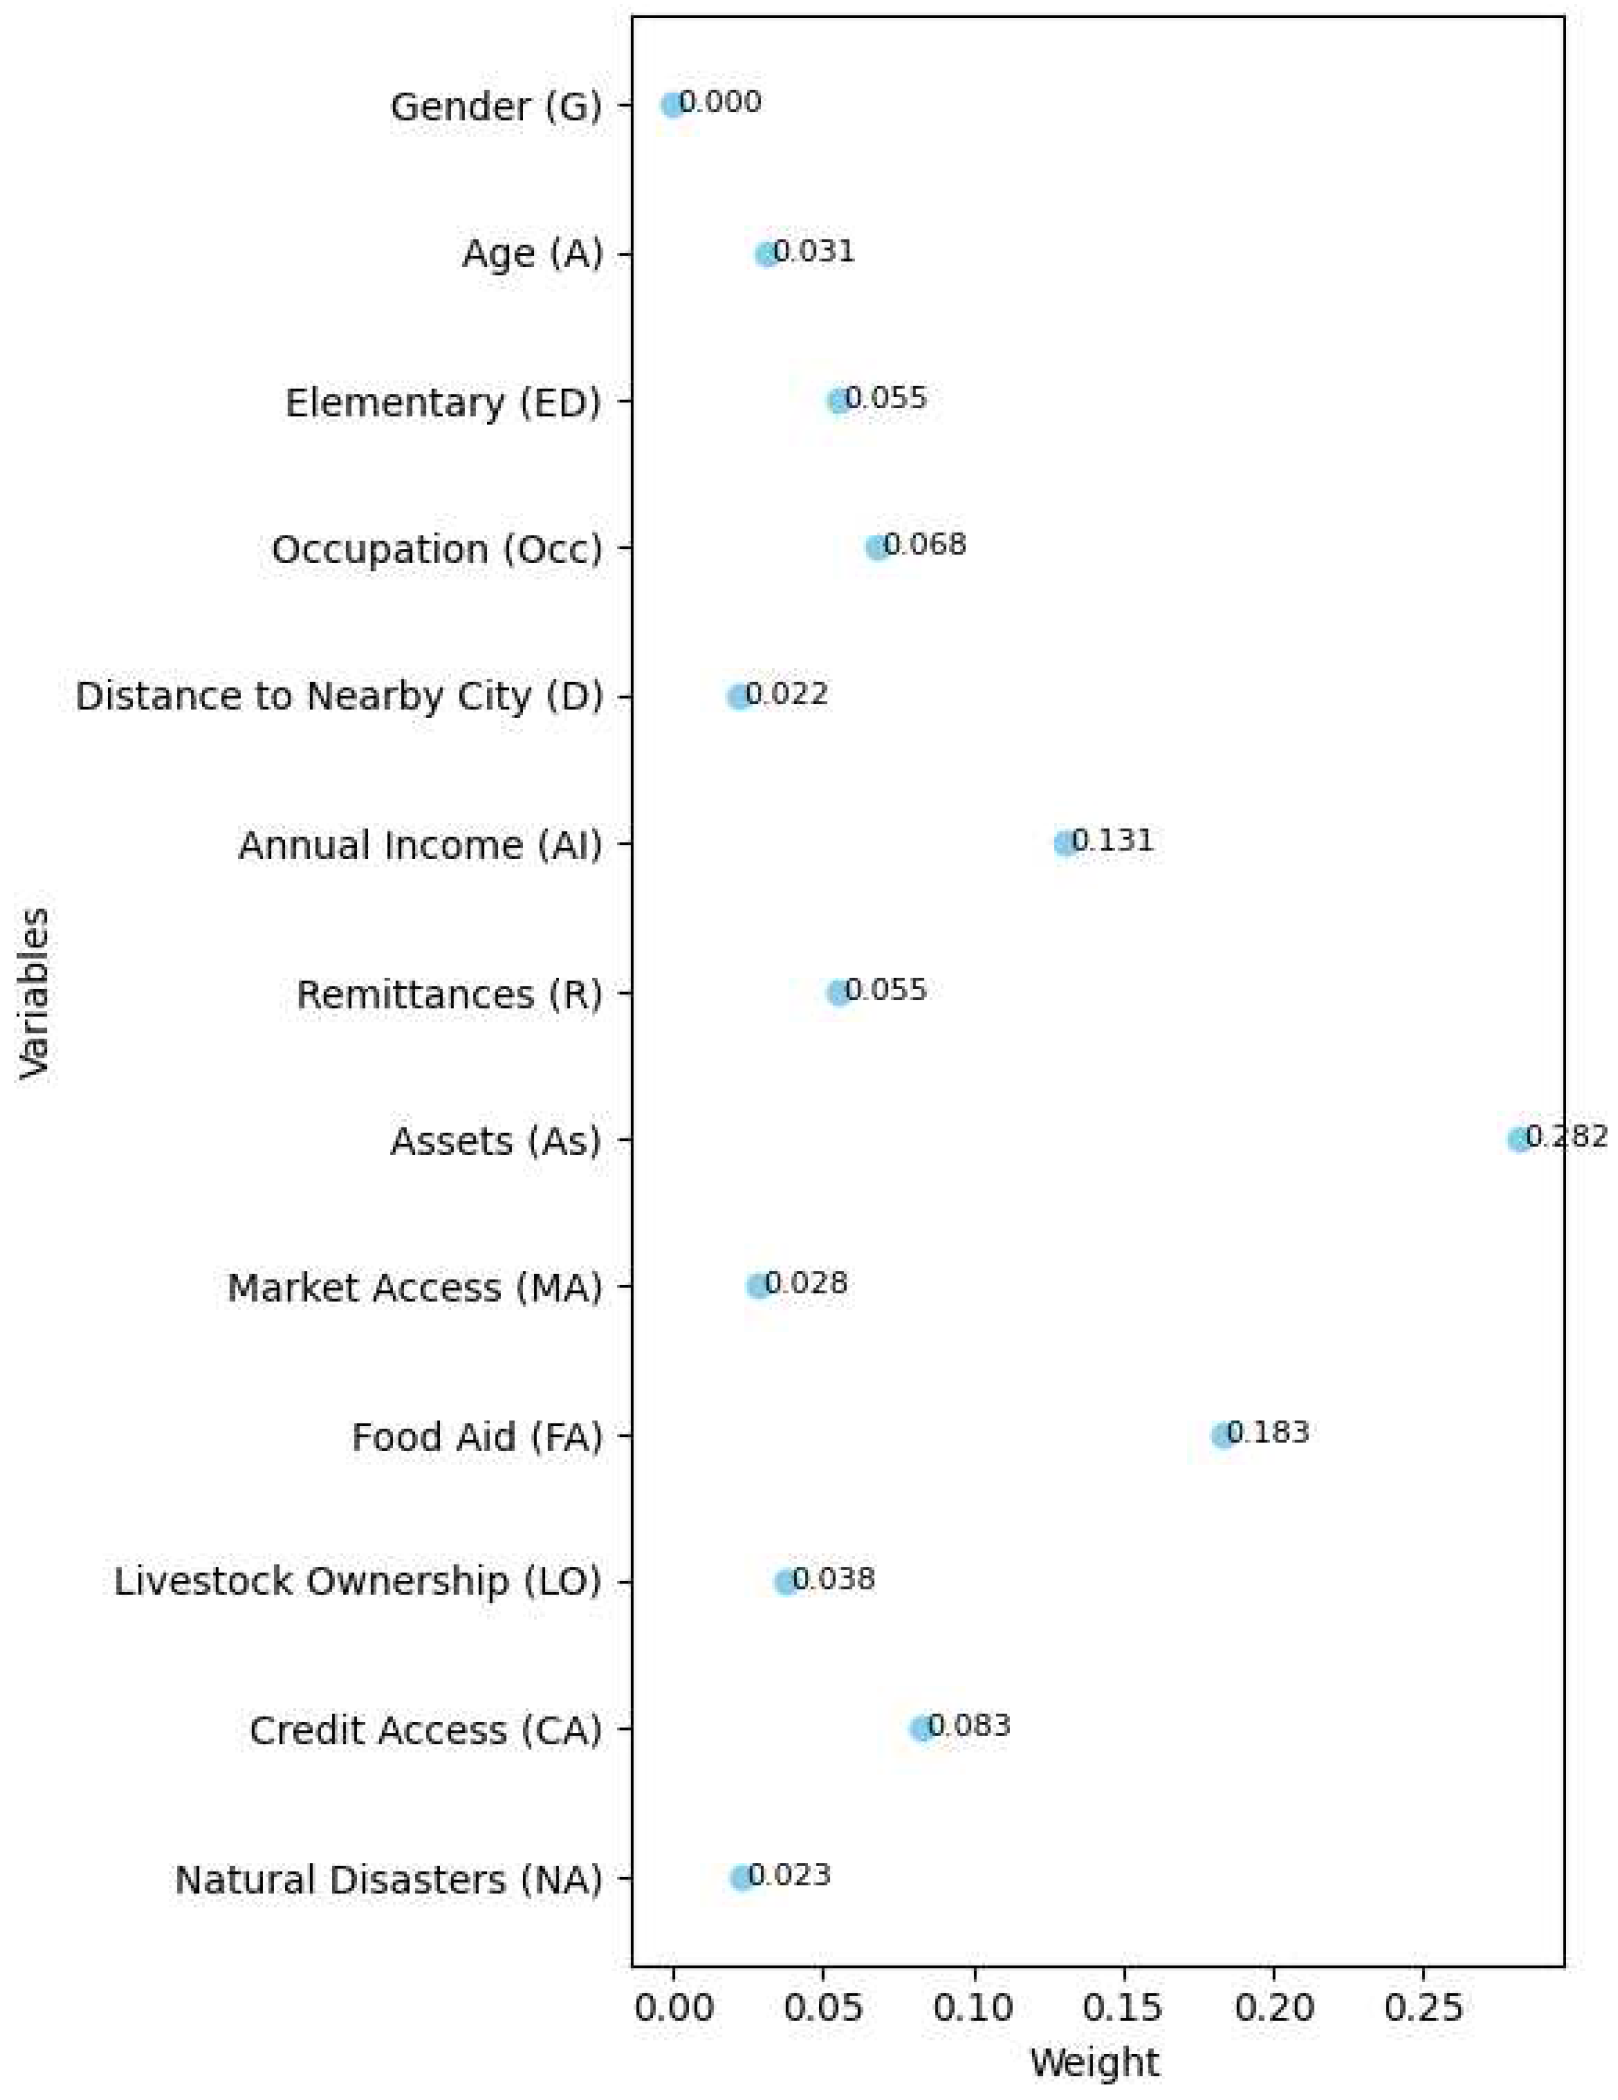
Figure 3.
Heatmap of entropy values of each variable. Source: authors’ development.
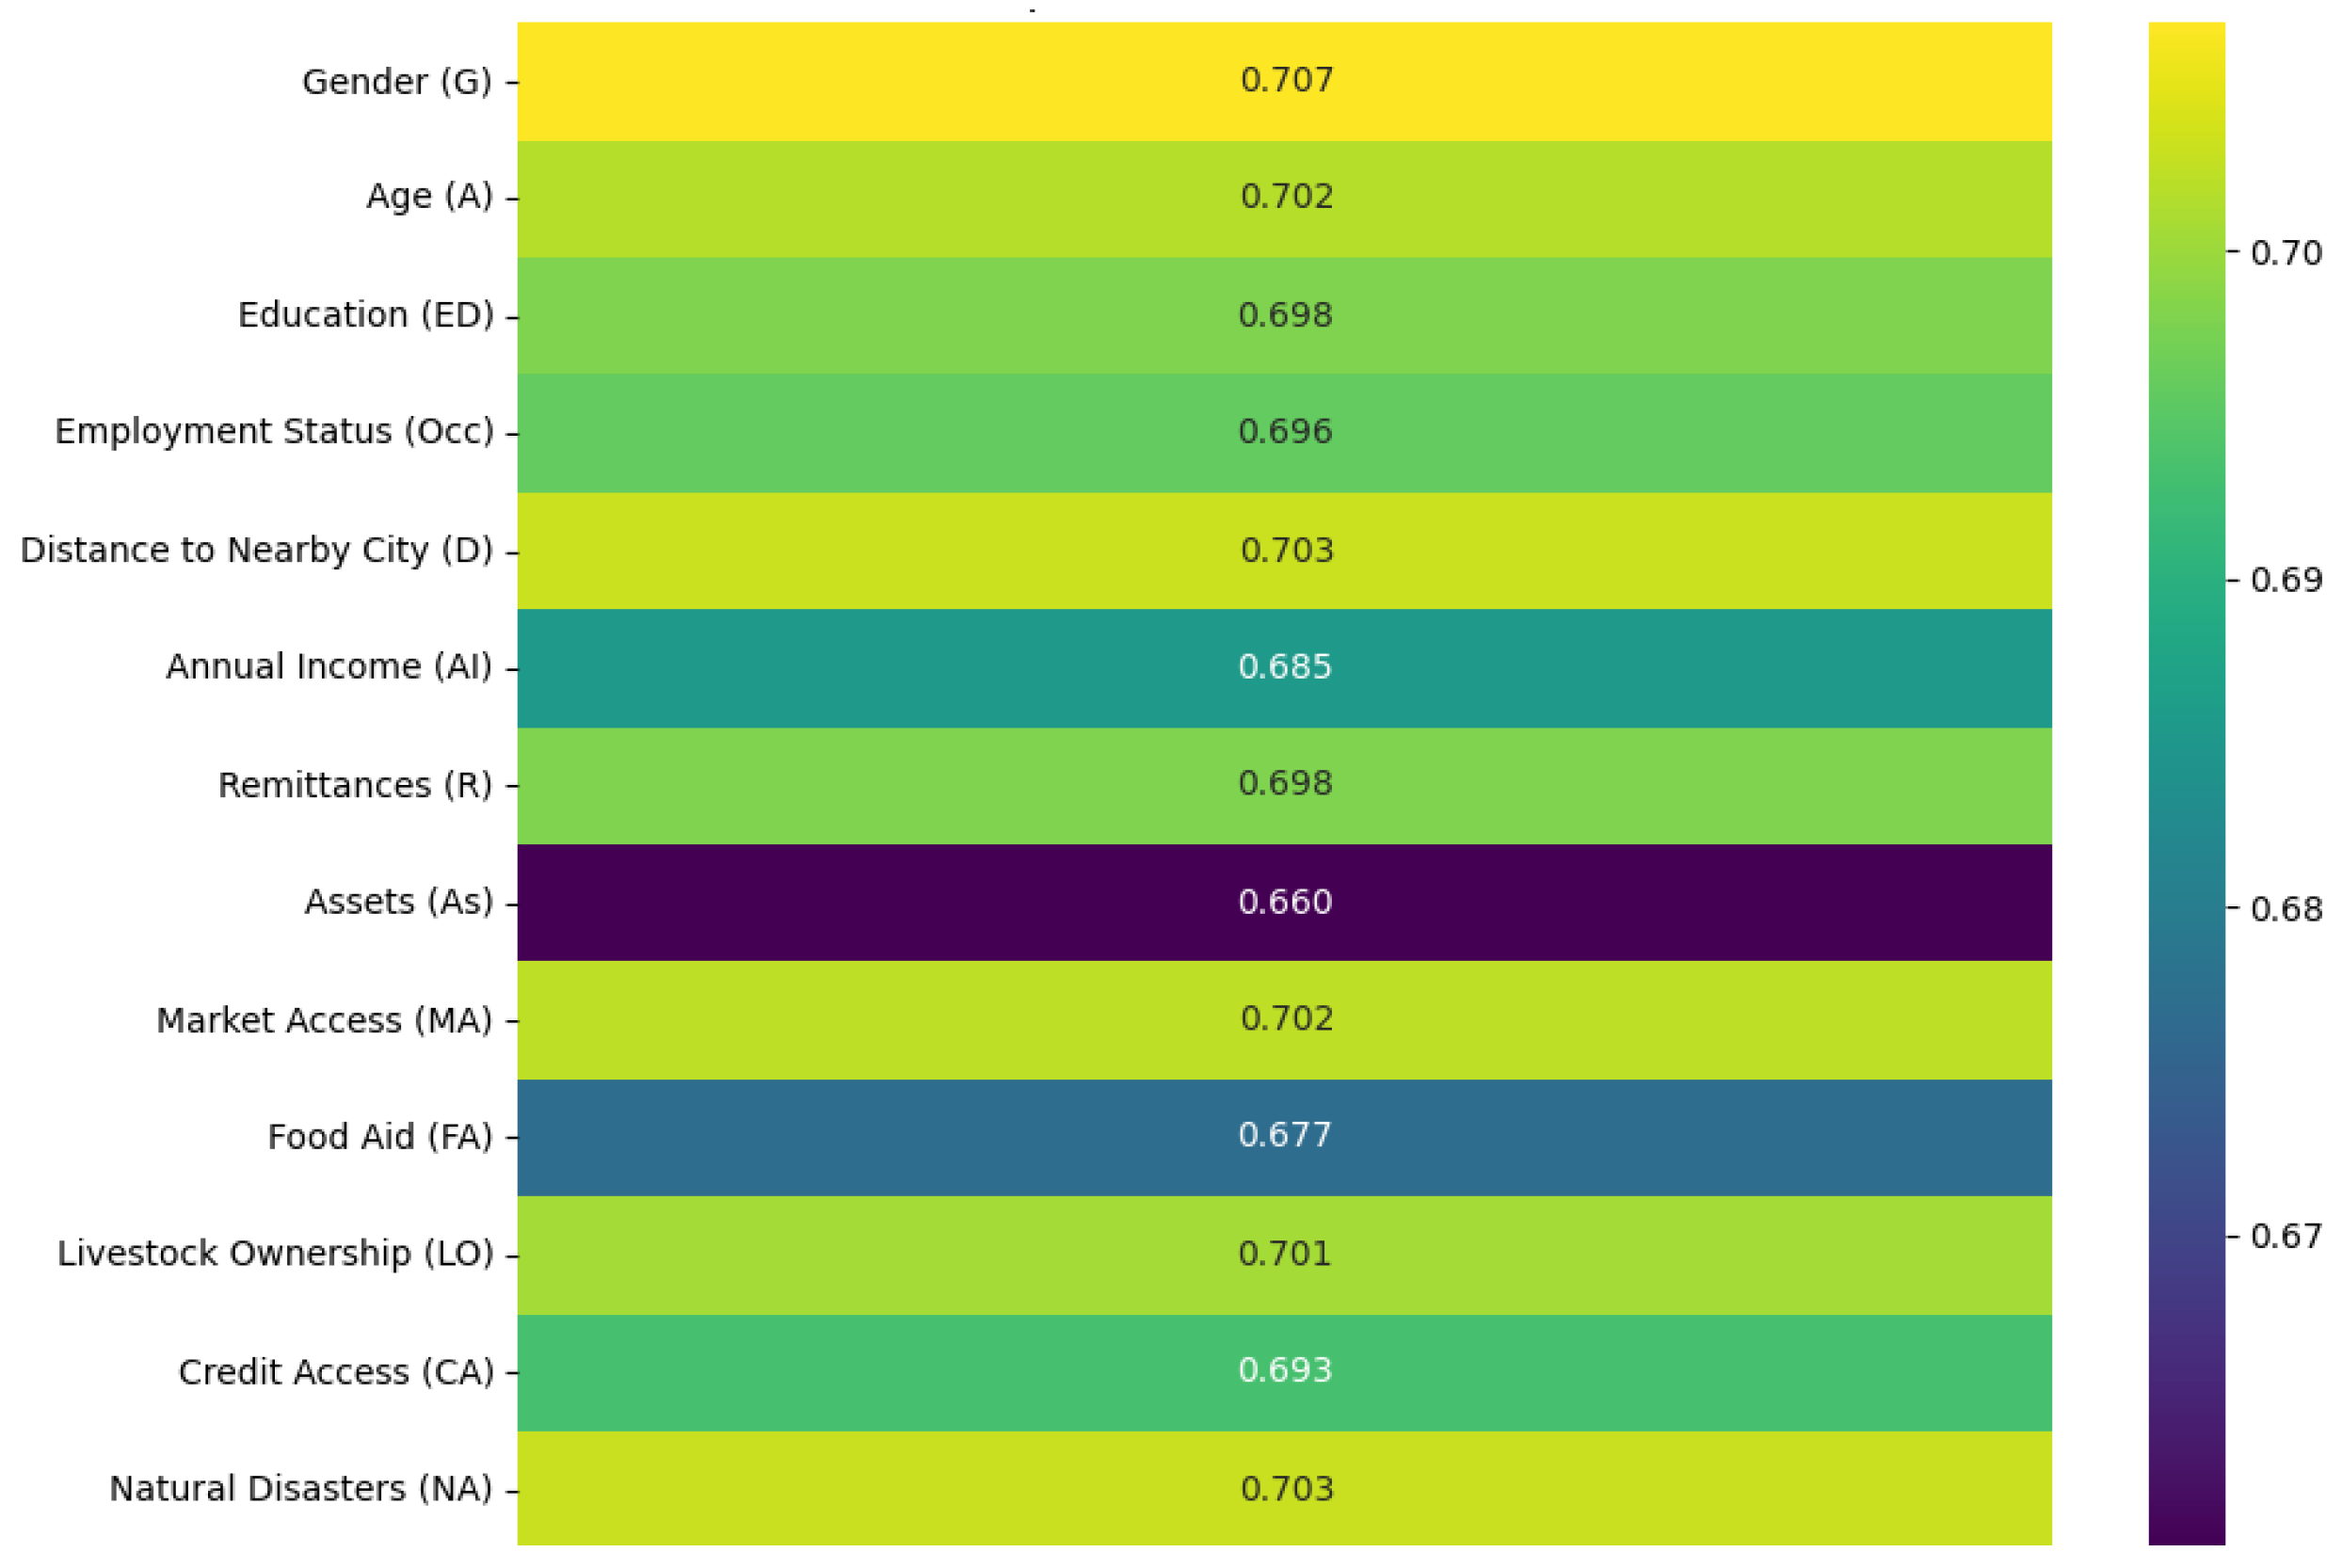
Figure 4.
Data attribute values of each variable involved in the food security assessment. Source: authors’ development.
Figure 4.
Data attribute values of each variable involved in the food security assessment. Source: authors’ development.
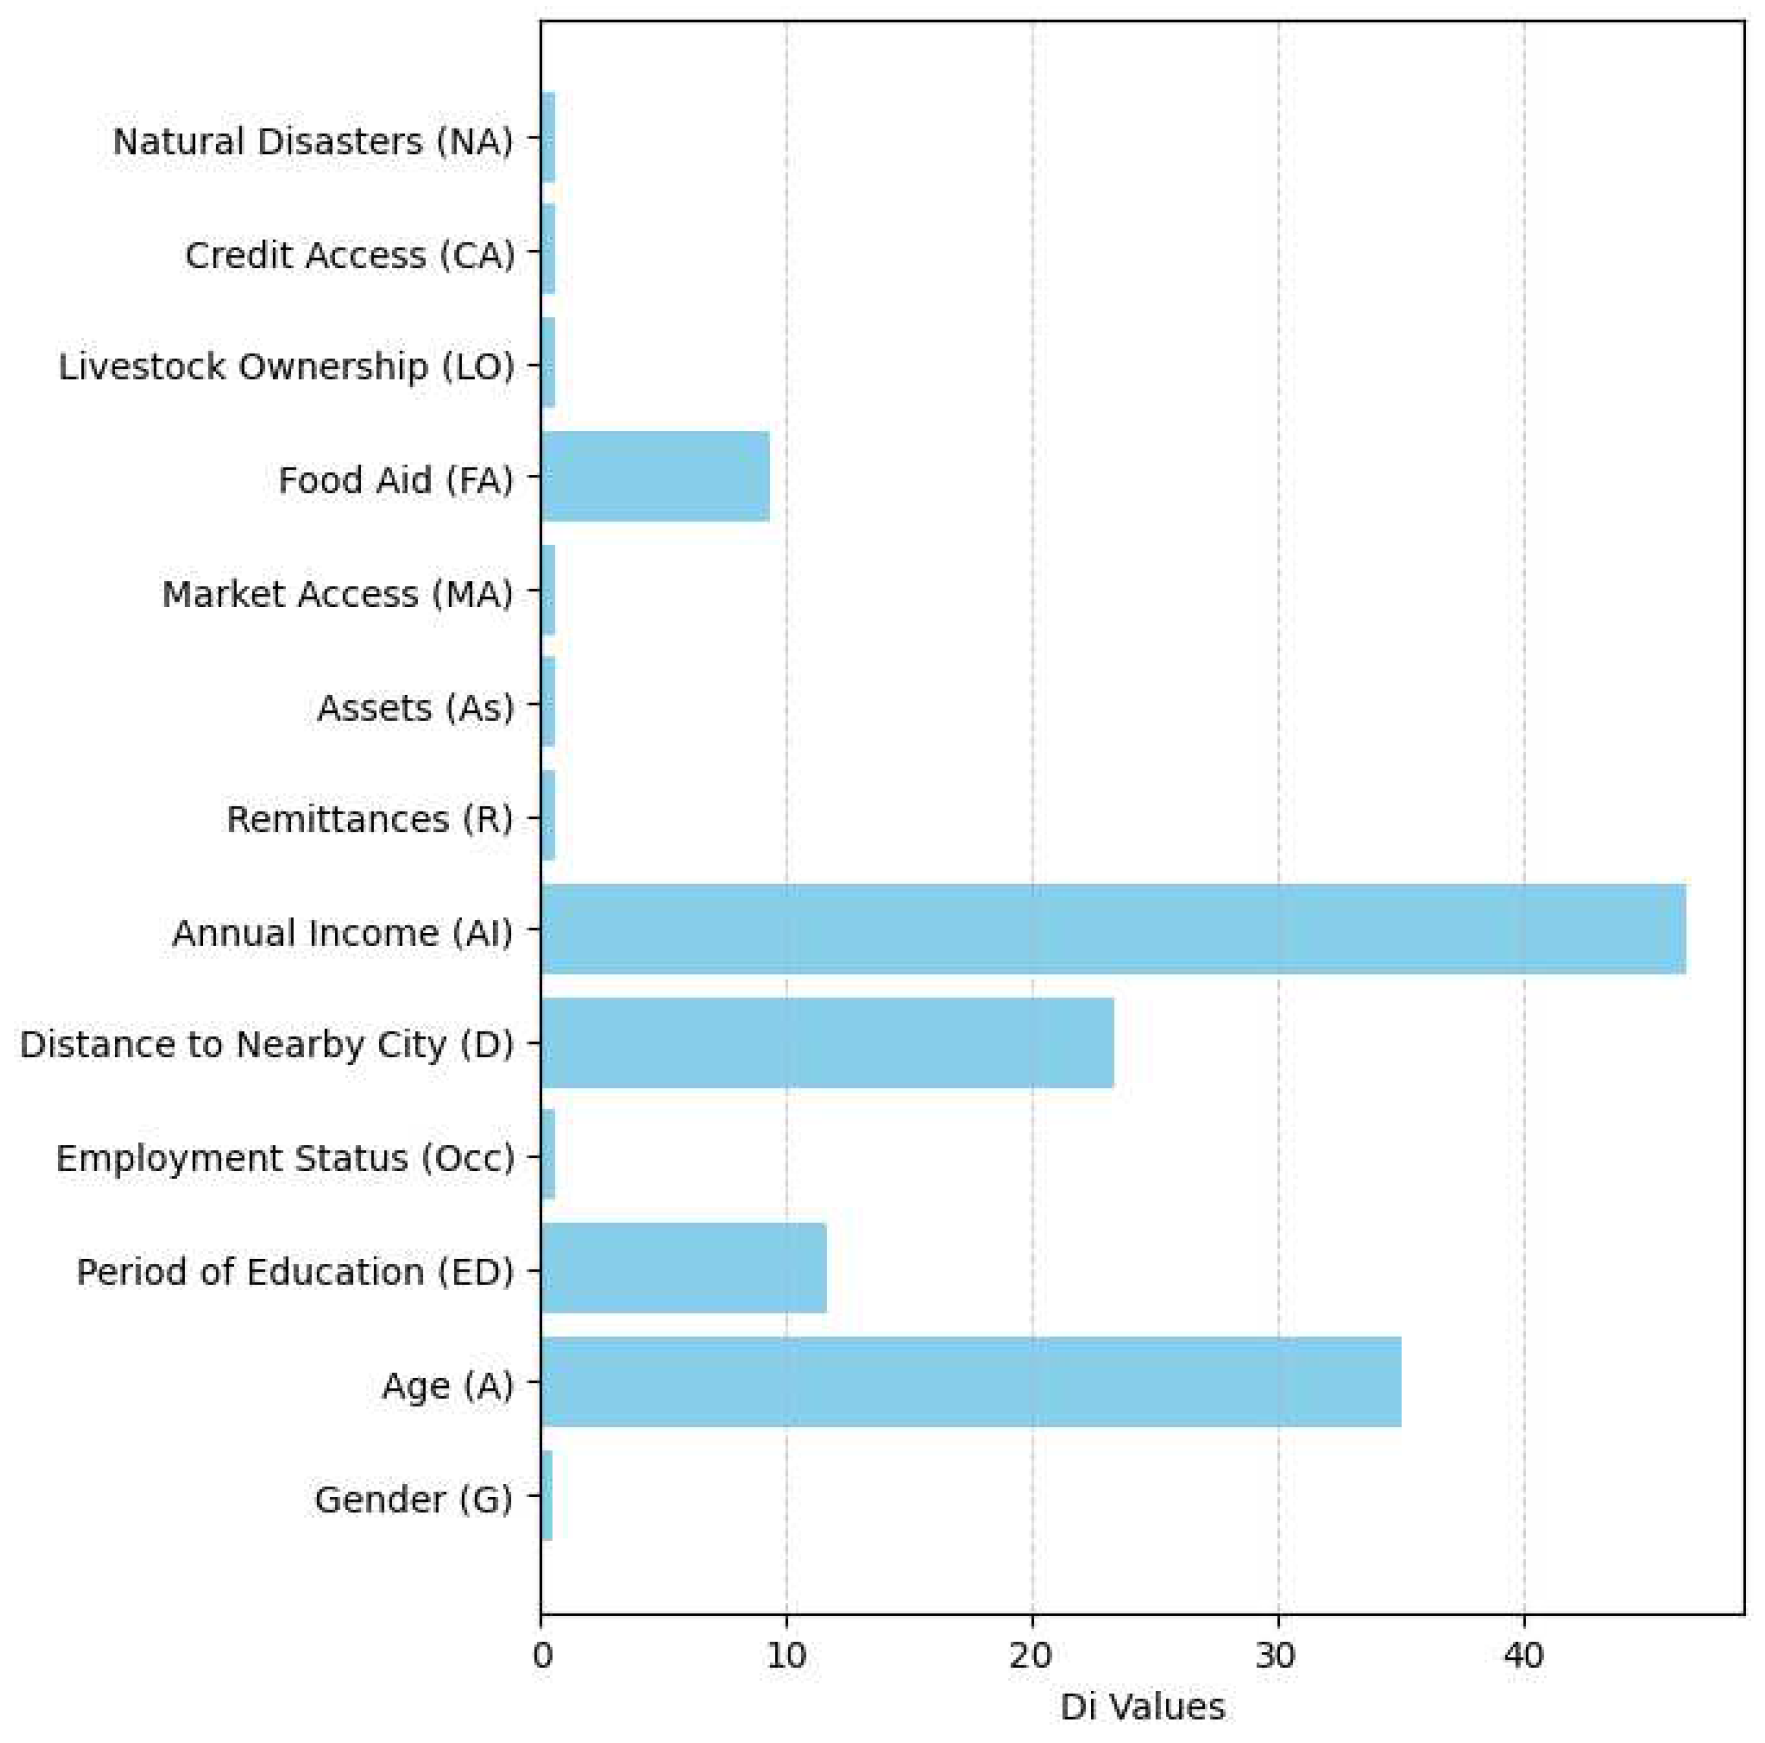
Figure 5.
Scatterplot of DFj values of each variable. Source: authors’ development.
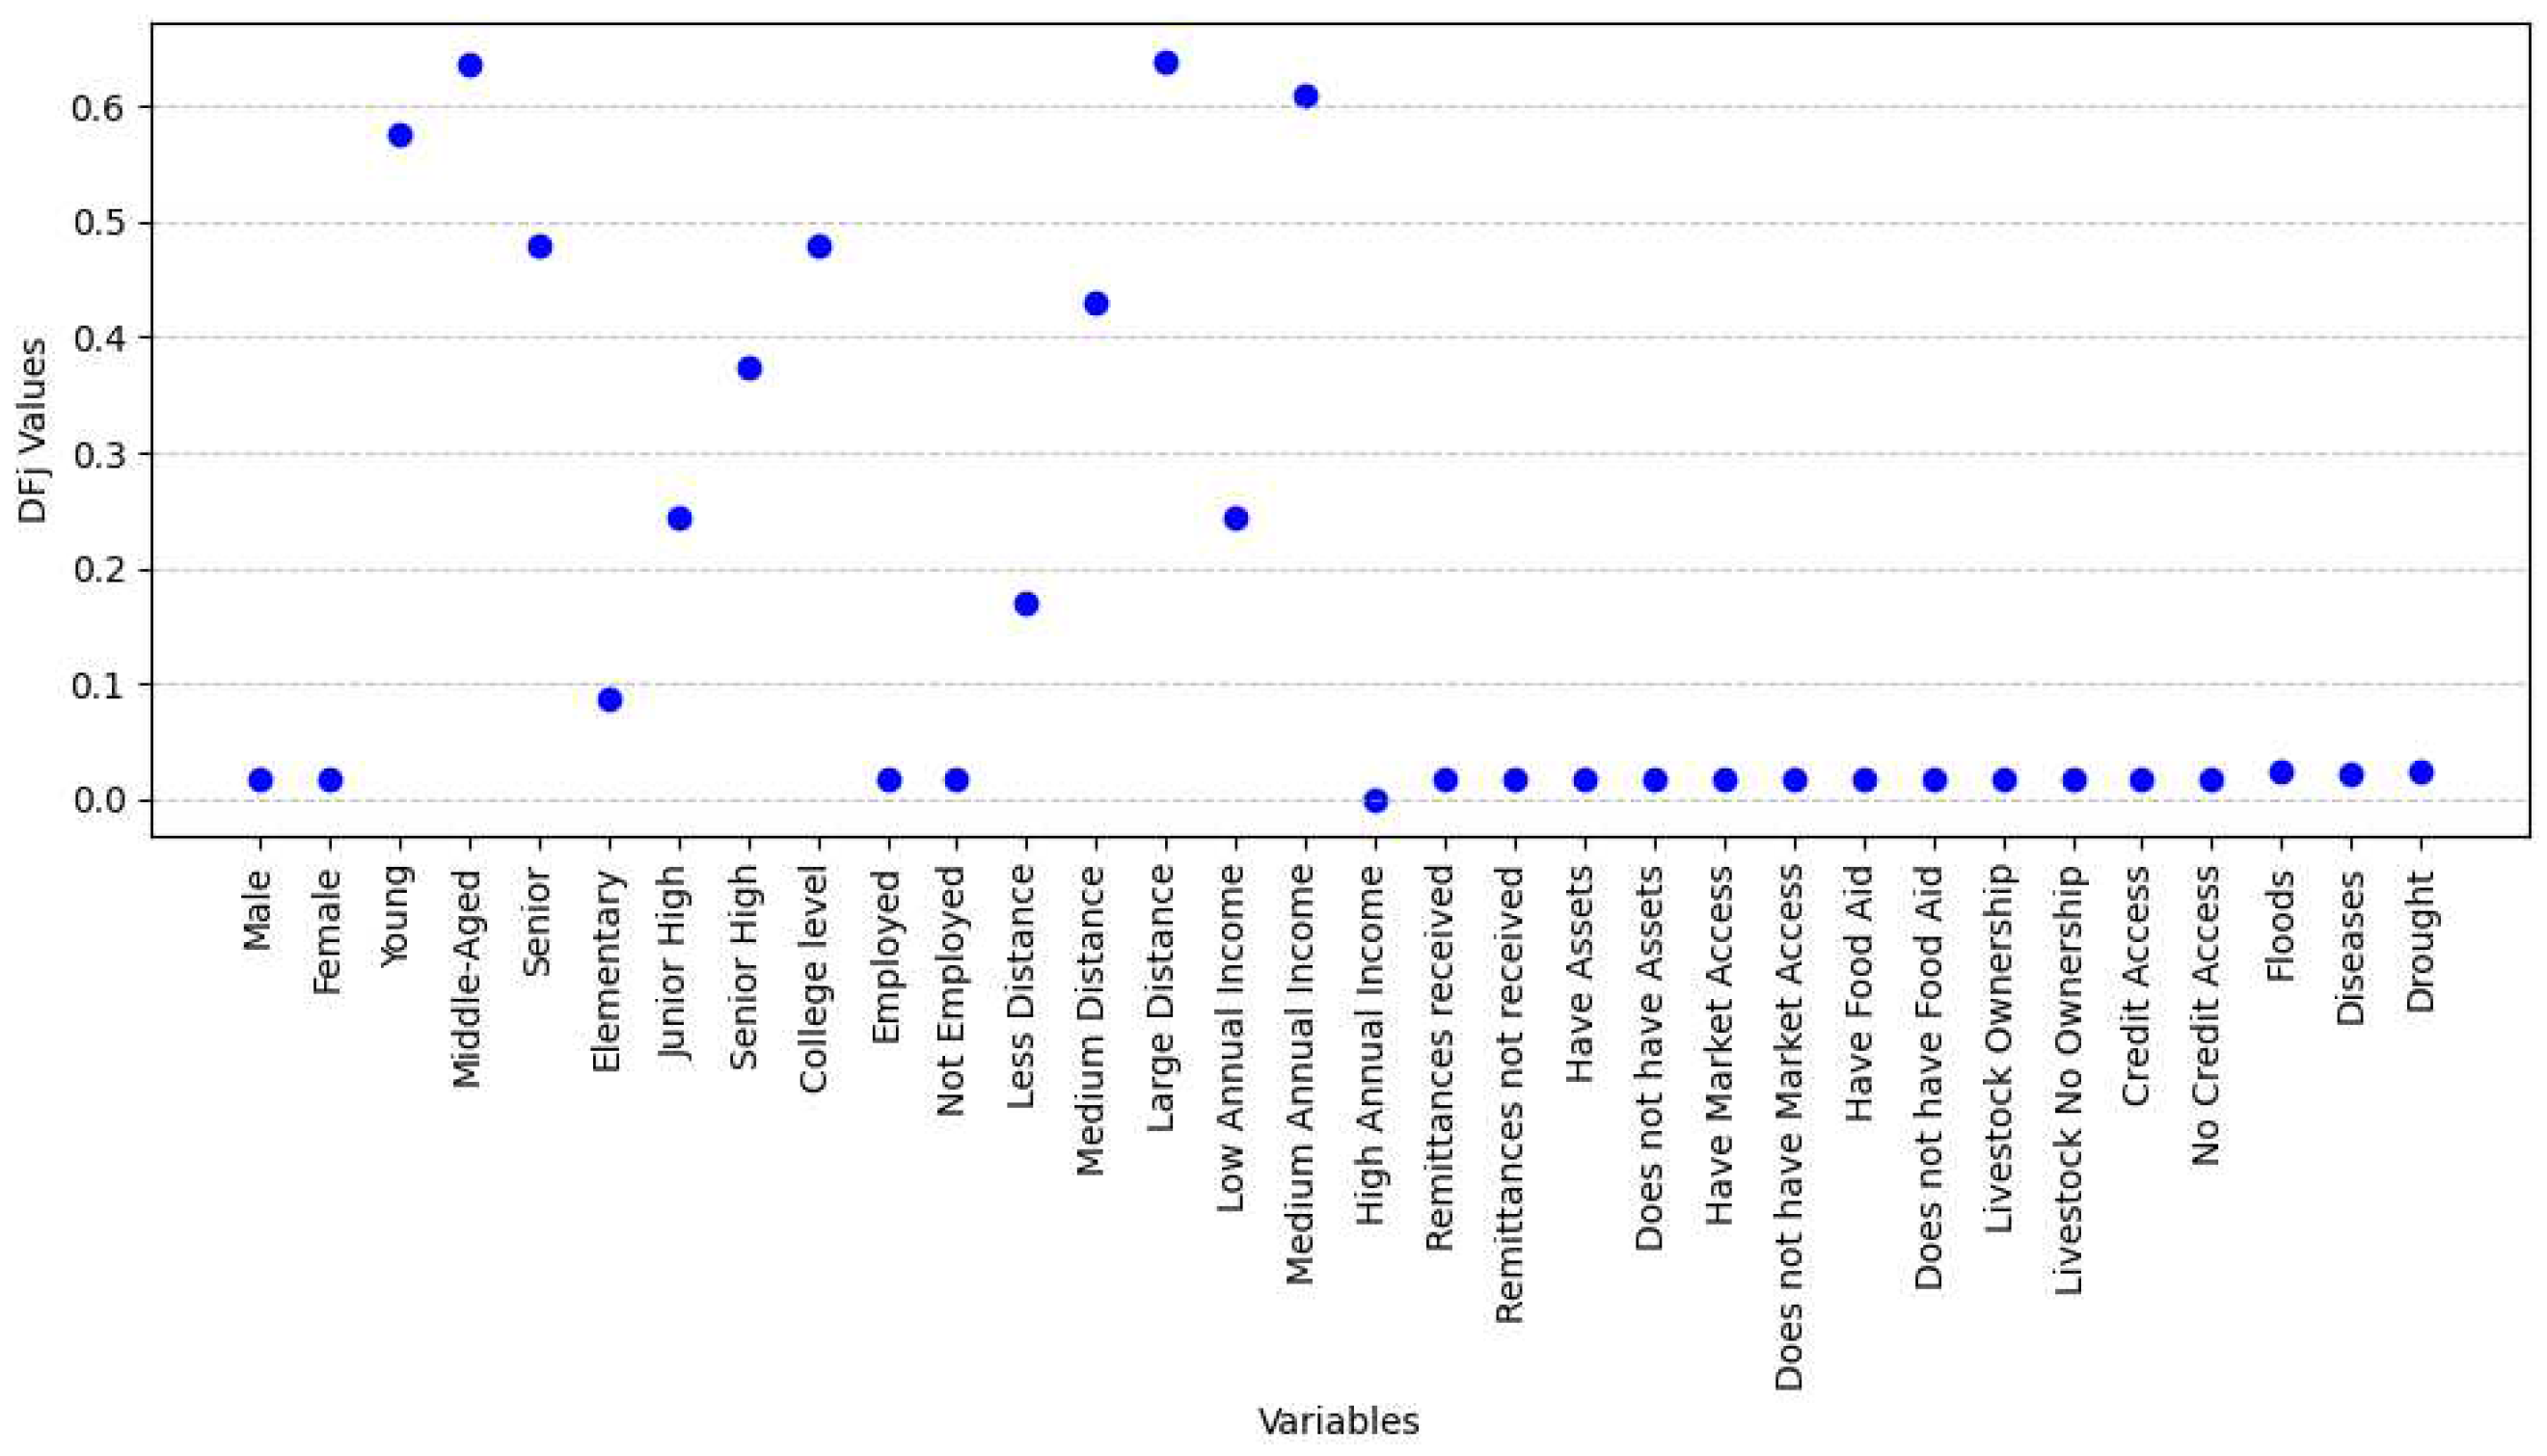
Figure 6.
Comparison of probability of most significant variables influencing food security levels. Source: authors’ development.
Figure 6.
Comparison of probability of most significant variables influencing food security levels. Source: authors’ development.
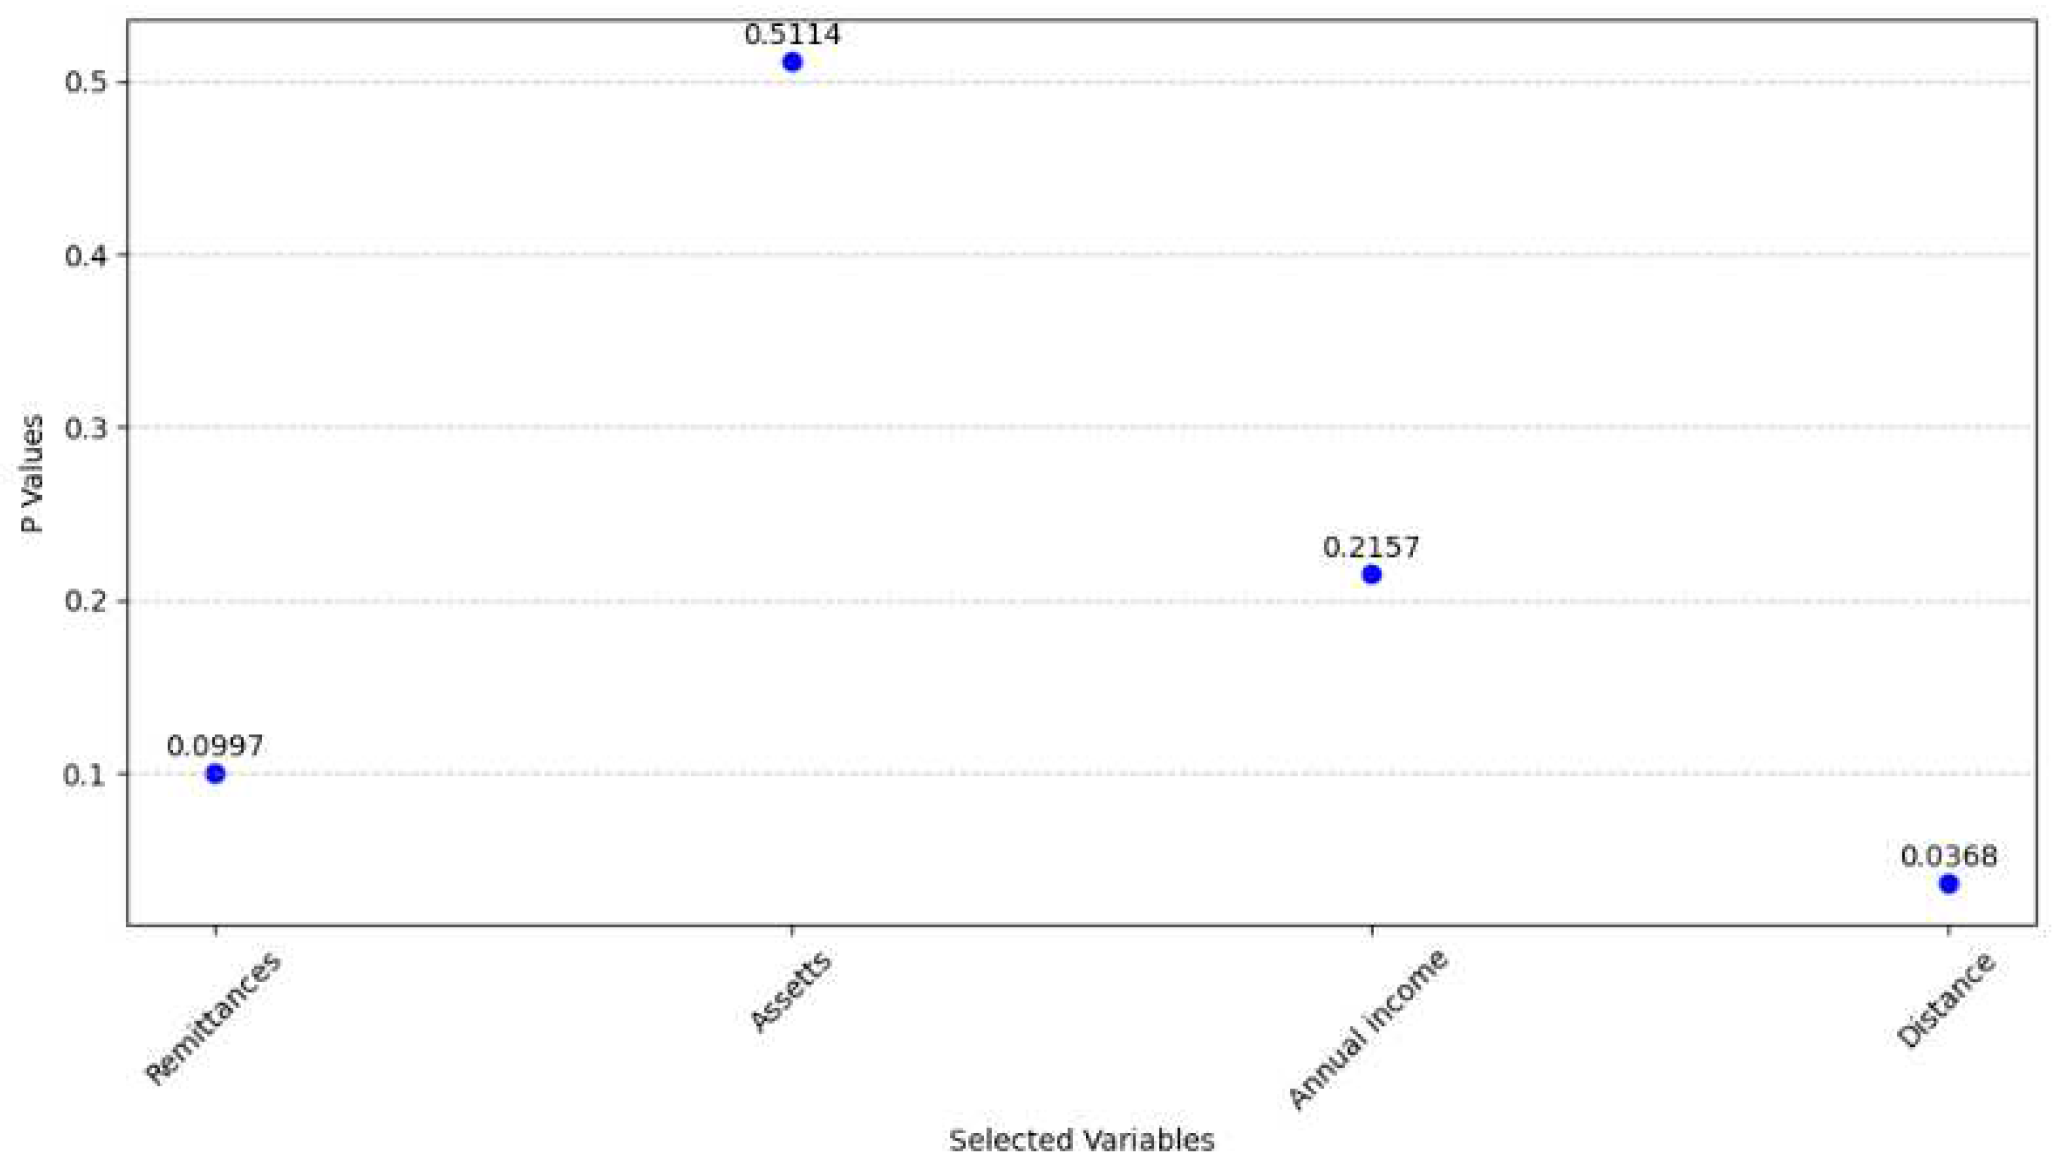
Figure 7.
Percentage distribution of Phases(1-5) for different states of Sudan. Source: authors’ development.
Figure 7.
Percentage distribution of Phases(1-5) for different states of Sudan. Source: authors’ development.
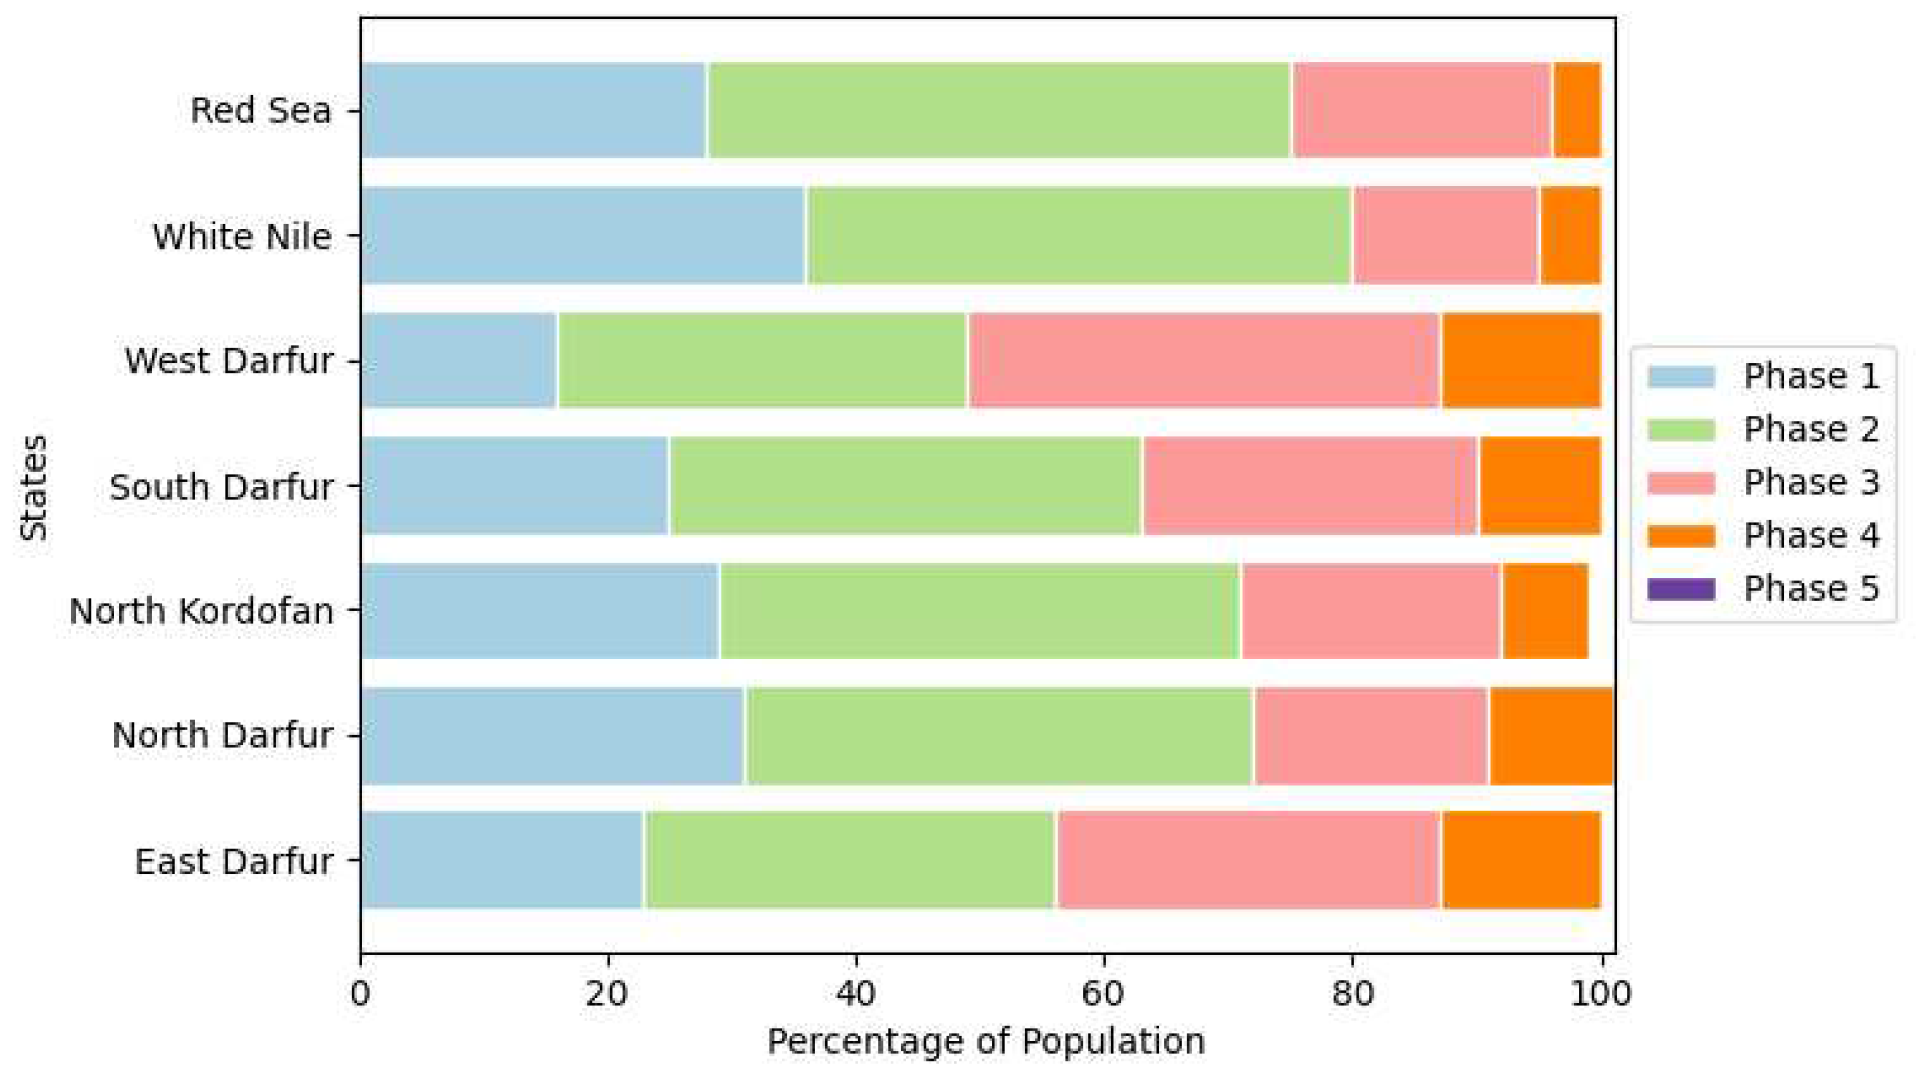
Figure 8.
Heatmap of phase percentage distribution of different states of Sudan. Source: authors’ development.
Figure 8.
Heatmap of phase percentage distribution of different states of Sudan. Source: authors’ development.
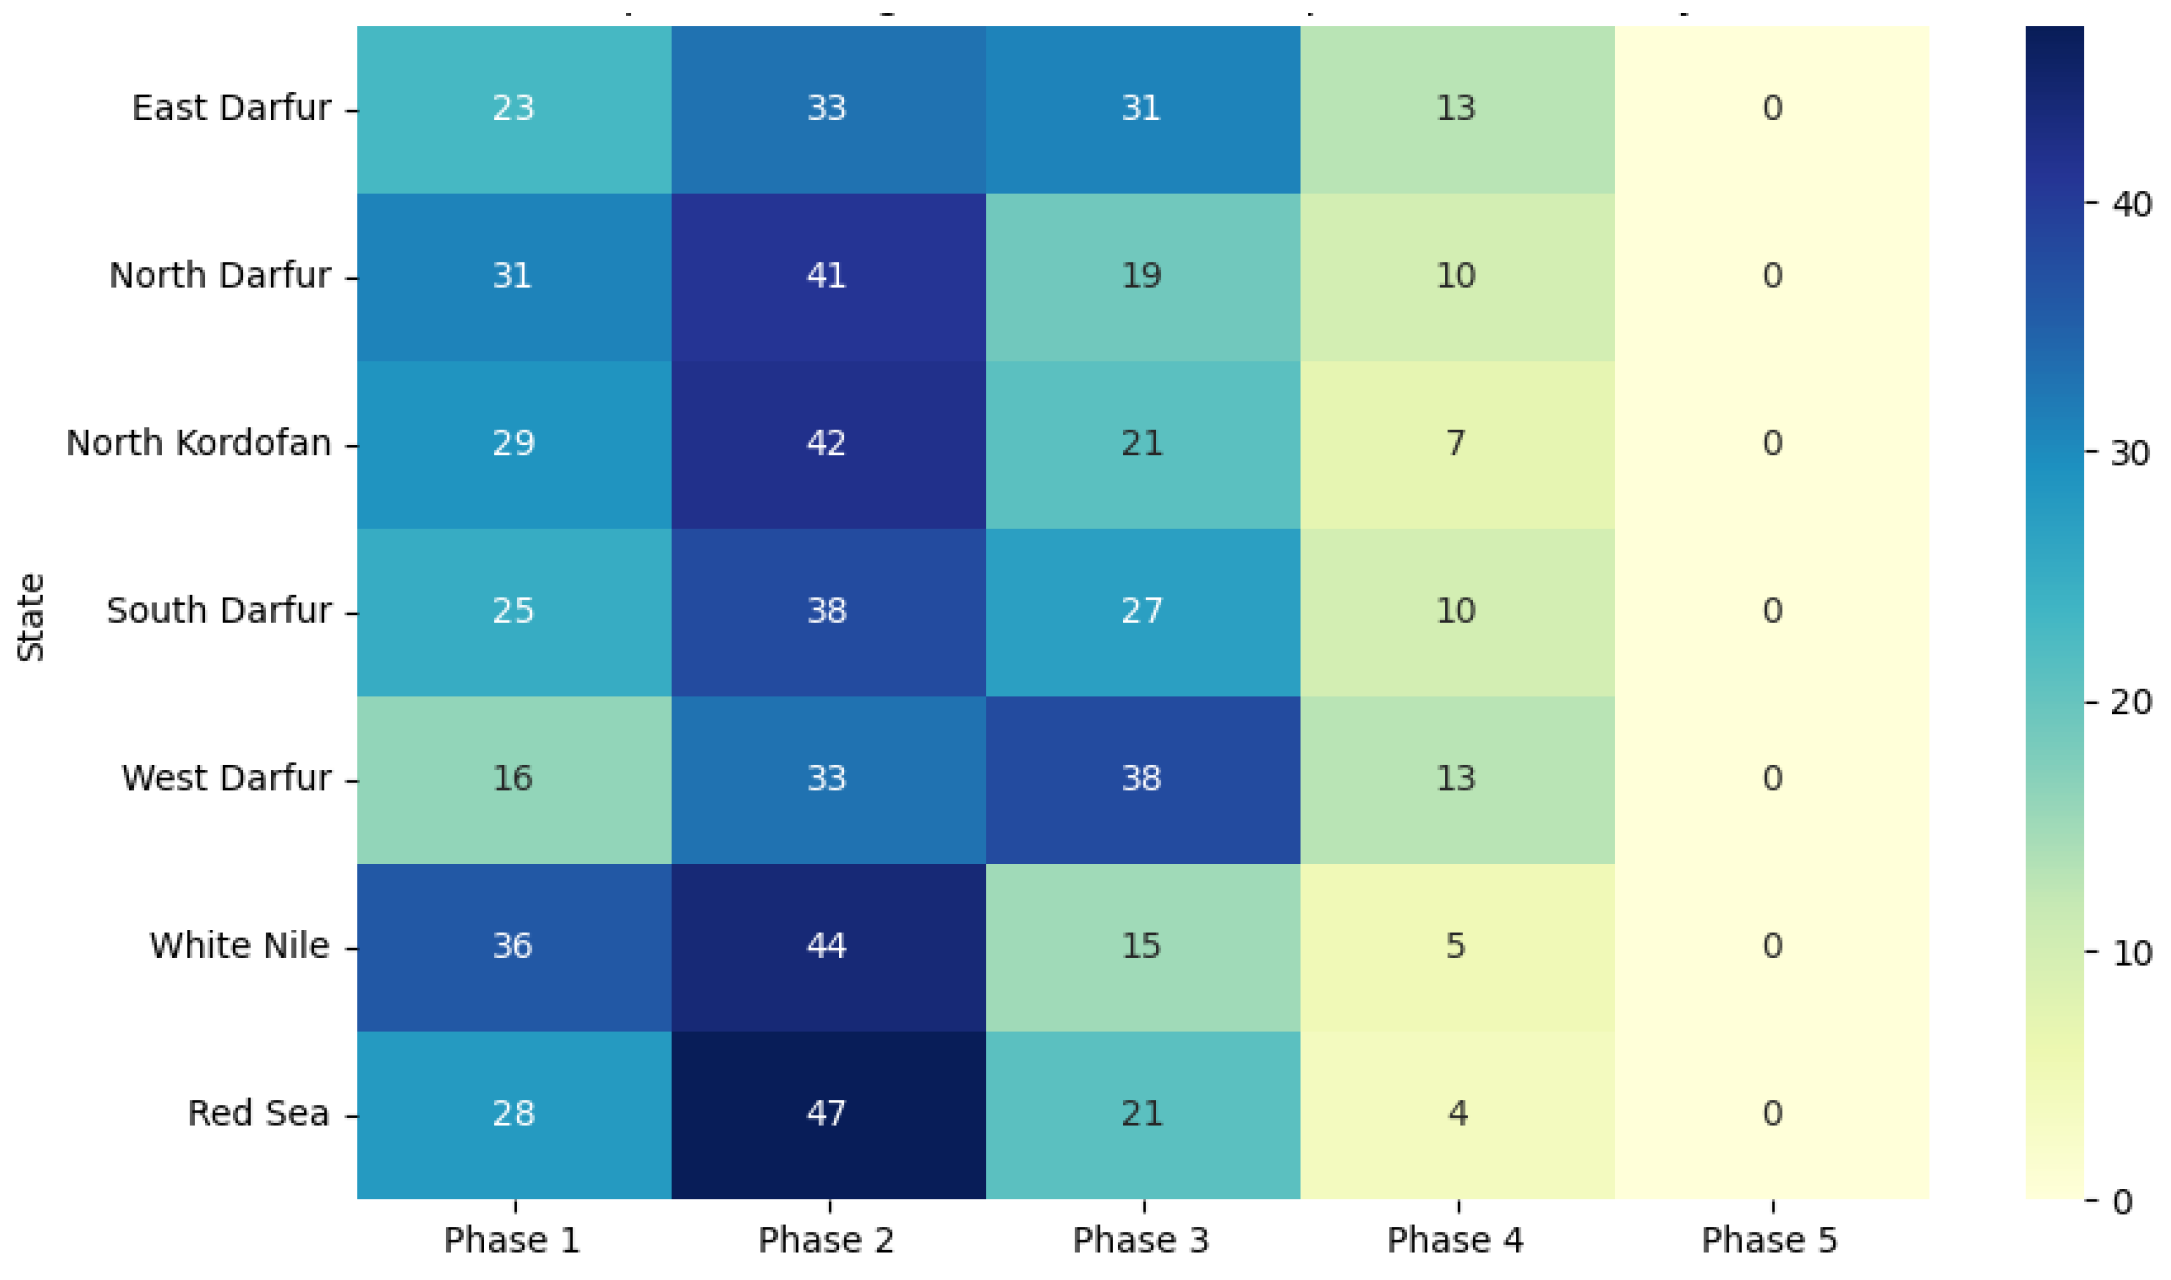
Figure 9.
Probability distribution of food security levels. Source: authors’ development.
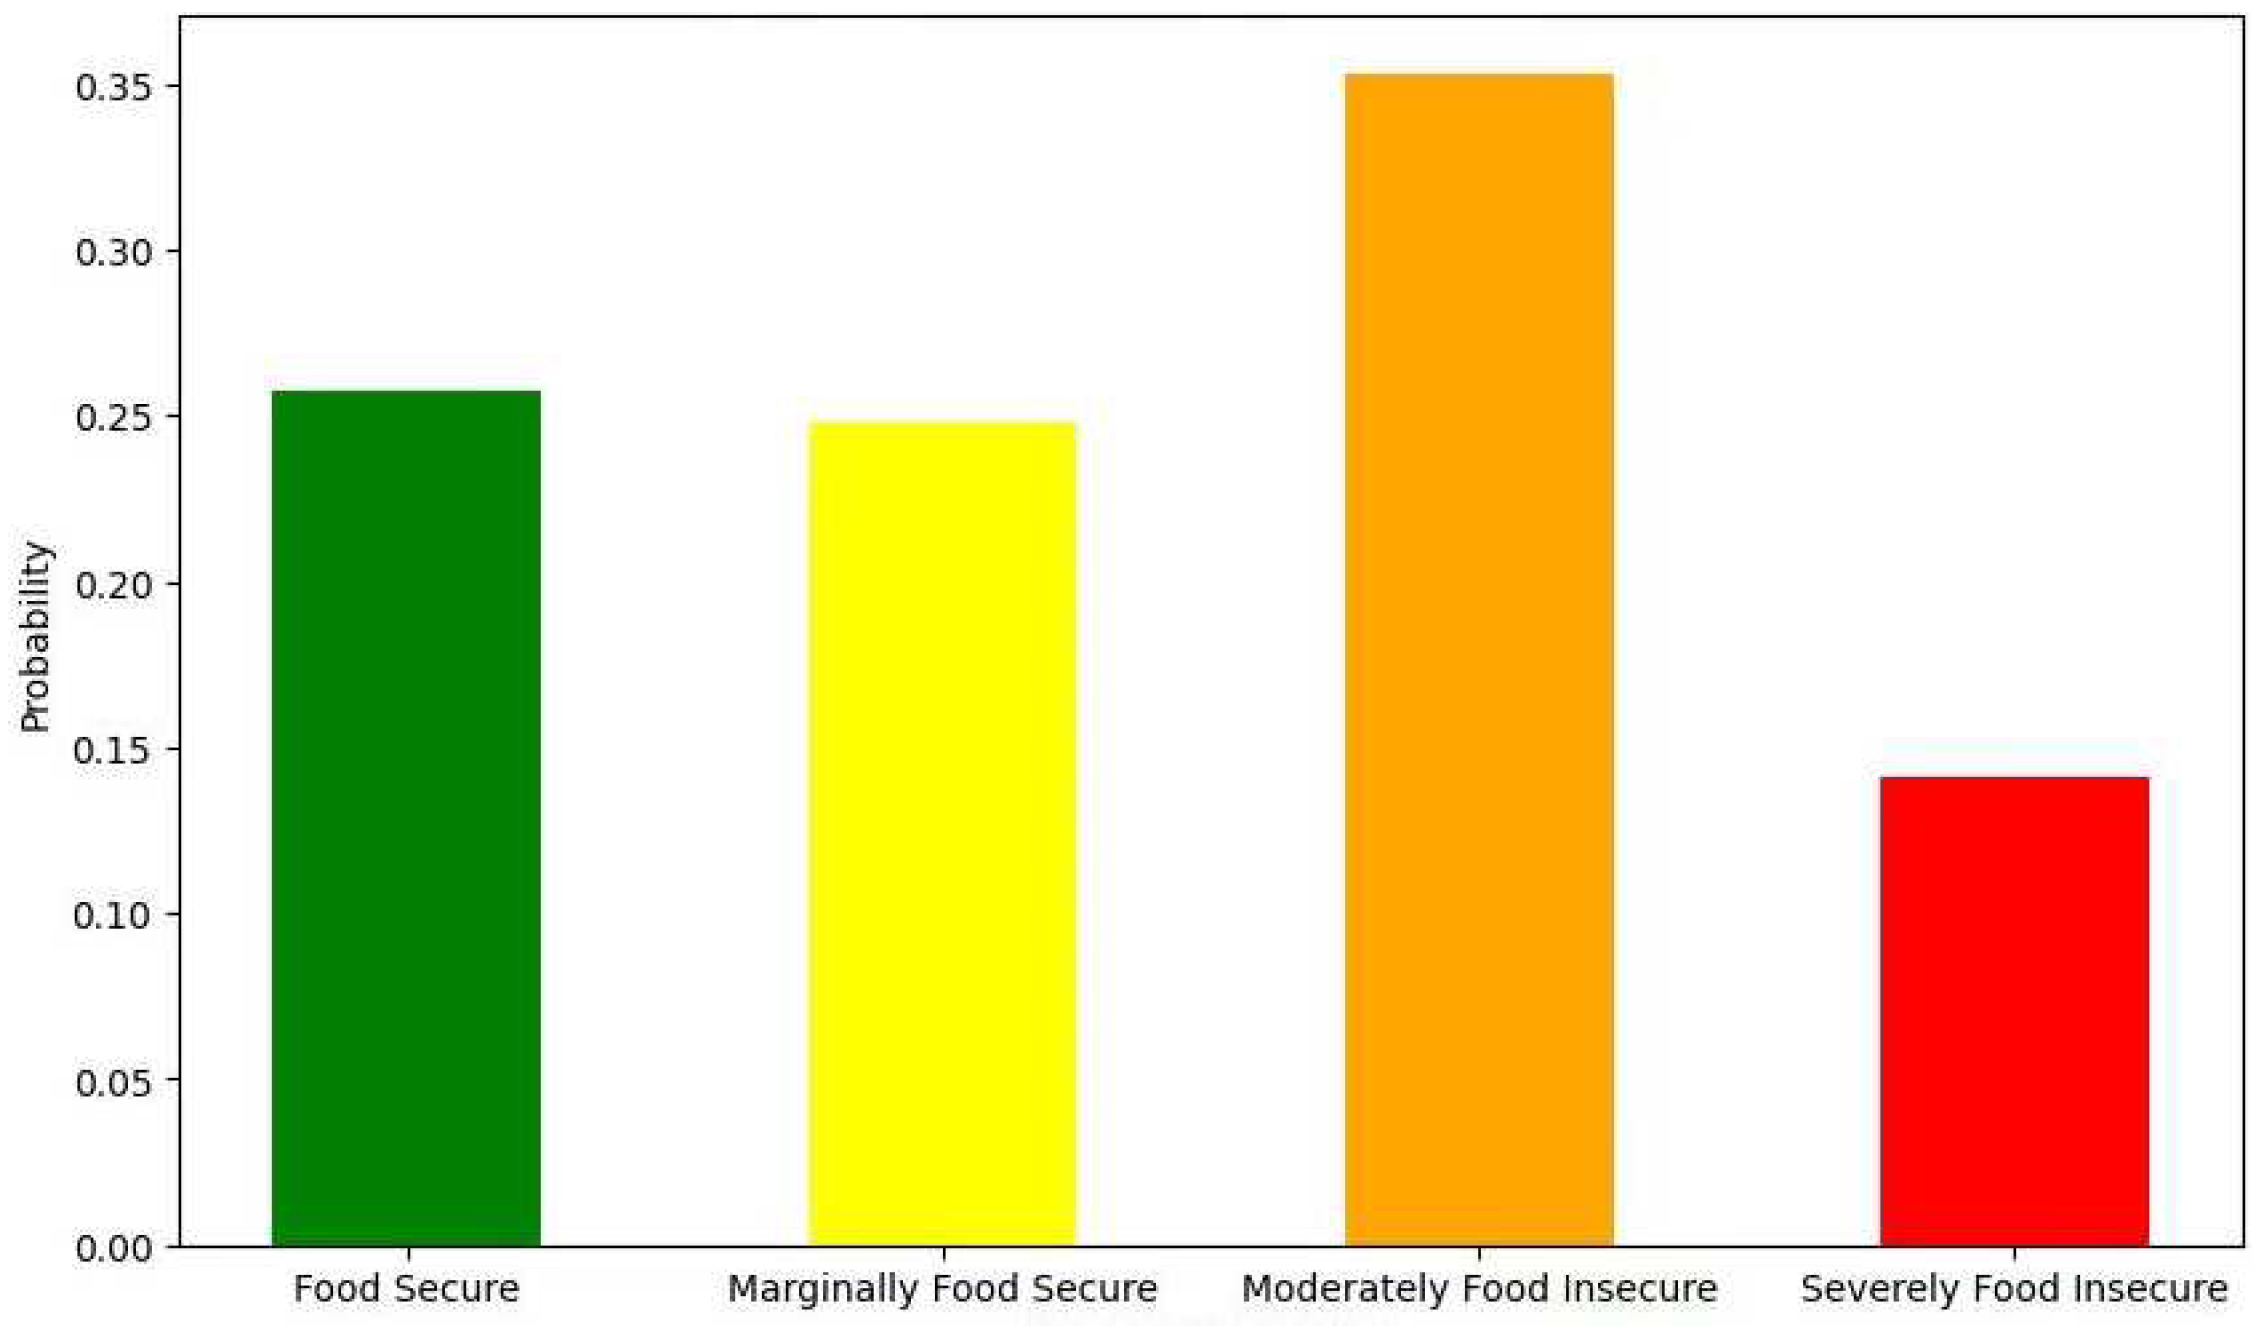

Table 1.
Measured values of the variables used in HFE Analysis.
| Variables | Description | Degree of membership |
|---|---|---|
| Gender | Gender of the household head | [0.67, 0.33] |
| Age | Age of the household head in number of years | [0.317, 0.5, 0.183] |
| Education | Literacy of the household head | [0.495, 0.121, 0.085, 0.317] |
| Employment Status | Cause of food insecurity due to unemployment | [0.3, 0.7] |
| Remittances | Receipt of remittances | [0.32, 0.68] |
| Assets | Ownership of assets | [0.11, 0.89] |
| Distance from nearby city (low, medium, high) | Distance in kilometers from the village to the nearby city | [0.31, 0.45, 0.24] |
| Annual income(low, medium, high) | Income generated in a year | [0.67, 0.26, 0.07] |
| Market access | Access to markets | [0.63, 0.37] |
| Food aid | Receipt of food aid | [0.18, 0.82] |
| Livestock ownership | Ownership of livestock | [0.65, 0.35] |
| Credit access | Access to credit | [0.28, 0.72] |
| Natural disasters (floods, diseases, drought) | Cause of food insecurity due to natural disasters | [0.4, 0.33, 0.27] |
Source: authors’ development.
Disclaimer/Publisher’s Note: The statements, opinions and data contained in all publications are solely those of the individual author(s) and contributor(s) and not of MDPI and/or the editor(s). MDPI and/or the editor(s) disclaim responsibility for any injury to people or property resulting from any ideas, methods, instructions or products referred to in the content. |
© 2024 by the authors. Licensee MDPI, Basel, Switzerland. This article is an open access article distributed under the terms and conditions of the Creative Commons Attribution (CC BY) license (http://creativecommons.org/licenses/by/4.0/).
Copyright: This open access article is published under a Creative Commons CC BY 4.0 license, which permit the free download, distribution, and reuse, provided that the author and preprint are cited in any reuse.


