1. Introduction
In an extensive review on recent order picking
trends and research topics, Casella et al. (2023) analyzed 269 journal papers
from 2007 to 2022, emphasizing the crucial importance of optimizing order
picking in warehouses. The study addresses various topics related to storage
allocation policies, including the lack of research on correlated storage
assignment strategy (CSAS) as one of the identified gaps. This strategy
involves grouping items based on their historical correlation in customer
orders. Frazelle (1989) pioneered the use of combined probabilities of pairs of
items occurring in the same order as an item allocation method to minimize
total travel distance. This approach that involves grouping items into zones
was referred to as correlated assignment strategy in the work of Frazelle and
Sharp (1989). Subsequently, many heuristic algorithms for this strategy have
been developed. However, there is still a lack of dedicated research on
correlated storage assignment. The review by Casella et al. also examined
routing policies and note that the routing planning can be considered as a
special case of the traveling salesman problem (TSP), which is known to be
NP-hard. Finding an optimal solution in polynomial-time for the TSP is not
always feasible. Additionally, due to the requirement for real-time operational
decisions for picker routings, researchers commonly employ heuristic and
meta-heuristic approaches to efficiently find near-optimal routing solutions.
The review also highlights the interrelationship between routing and storage
allocation policies. Optimal storage allocation is recognized as a key factor
in routing optimization due to their dependence. Heuristic algorithms for
routing problems were frequently proposed in conjunction with various storage
assignment policies, particularly random storage; while meta-heuristic
algorithms were commonly paired with random and class-based storage policies.
The review also identified a lack of available exact or meta-heuristic
algorithms for routing problems that specifically designed for correlated
storage policy case studies. In contrast to the routing problem, the storage
assignment does not require a real-time solution, and an optimal solution is
preferred over a near-optimal one, especially considering the impact that
storage optimization can have on routing planning. Furthermore, an exact
solution for the storage assignment is appropriate for relatively small problem
size. However, incorporating travel distance assessments into the storage
assignment model, as in routing models, presents considerable computational
challenges. This is primarily due to the potential transformation of the
storage assignment problem into NP-hard, unless the model is designed
effectively. Despite these difficulties, it is crucial to consider the broader
framework of warehouse strategies when addressing a particular problem in order
to offer an integrated optimization. By adopting an integrated approach and
carefully considering the effects of various aspects of warehouse operations,
the optimization has the ability to significantly improve performance. While
failing to account for the impact of other operations can have a negative
effect on the system. Therefore, it is imperative to conduct a comprehensive
evaluation of the interdependent consequences of combining strategies to ensure
optimal outcomes. In the context of a multi-picker system, for example,
concentrating highly correlated items in one zone may lead to congestion issues
if dedicated zones are not implemented. Similarly, assigning all correlated
items closer to the depot in one zone may negatively affect staff utilization
and increase idle time in dedicated-zone systems.
In this paper we introduce a new approach to
minimizing travel distance in a distribution center's single-order,
synchronized zone picking system. We present a model for implementing CSAS by
taking into account the influence of achieved average order size as a key
factor in minimizing travel distance. The mixed integer non-linear programming
(MINLP) model specifically designed to offer multiple local optimal solutions
by varying defined criteria. Additionally, we have developed a simulation-based
model to evaluate the performance of various scenarios. Unlike other methods
that rely on heuristic or meta-heuristic algorithms, we simplify the complexity
of the MINLP problem and incorporate the integrated heuristic procedures within
the MINLP solver to expedite the convergence. This approach reduces problem
complexity and enables efficient exploration of the solution space.
Furthermore, we have applied other techniques to simplify and optimize the
convergence of the MINLP model. For instance, rather than optimizing travel
distance by incorporating historical order demand of significant volume (order
x item) to directly calculate the achieved average order size or total trips,
we employed a correlation frequency matrix (item x item) and utilized the item
picking frequency information available in that matrix. The simplified matrix
not only provides significantly reduced memory usage, but also encompasses all
the necessary information for minimizing total trips and influencing the
average order size per zone indirectly. By employing this matrix, we were able
to effectively minimize computational consumption while still achieving optimal
outcomes. Those techniques have proven to be highly effective in expediting the
convergence to achieve specific targets based on defined ratios, which can be
extended to other optimization models such as resource allocations. The
optimization model is designed to offer seamless integration with existing
warehouse strategies. The model maximizes the overall zone correlation score
while considering deviations from weighted centroids. To accurately measure
deviations, we implemented two methods within our penalty term: Positive
Centroid Deviation (PCD) and Negative Centroid Deviation (NCD). The model can
achieve multiple local optimal solutions based on predefined zone ratios for
correlation score and picking frequency. The main objective is to prioritize
maximize the correlation score while minimizing the picking frequency for the
zones farthest from the depot. This approach enables us to implement an item
allocation strategy that increases the average order size for these distant
zones. Conversely, we prioritize minimizing the correlation score and
maximizing the picking frequency in the closest zones, resulting in frequent
trips and shorter average order size. By considering the average order size as
a key factor in our optimization model, we effectively minimize the travel
distance and enhance operational efficiency. This ultimately leads to a
significant reduction in overall travel time by decreasing the need for pickers
in distant zones to frequently travel to the staging area. To evaluate the
performance of our approach, we conducted simulations to test various scenarios
in terms of total travel distance achieved. The results demonstrate significant
performance improvements, with reductions in travel distance of up to 36.75%,
and a sustainable improvement of 33.59% reduction for recent data. This
research contributes to the existing literature on order picking optimization
and provides valuable insights into addressing the limitations associated with
correlated strategies. By offering a simplified problem-specific approach, we
aim to enhance order picking operations, improve efficiency, and shed light on
the challenges involved in implementing such methodology.
The paper is structured into six sections to
effectively address the research objectives. The Literature Review (Section 2) summarizes related work. The Problem
Settings (Section 3) offers a
comprehensive understanding of the research framework. The Methodology (Section 4) includes a Simulation Model (Section 4.1) and a Mathematical Programming
Model (Section 4.2). The Optimization
Result Analysis (Section 5) highlights
the outcomes and performance of proposed CSAS. Finally, the Conclusion (Section 6) summarizes key findings.
2. Literature Review
Casella et al. (2023) examine the topic of order
picking to highlight emerging trends. Their analysis covers storage allocation
policies, and emphasizes the lack of research on correlated storage assignment.
Islam and Uddin (2023) provide another review to summarize techniques for
solving correlated storage location assignment problems (CSLAP) that mostly
expressed as NP-hard integer programming models. The authors review 60
publications and categorize solution methods as heuristic, meta-heuristic, and data
mining approaches. This assignment method is found to be more effective in
reducing travel distance compared to other storage allocation systems, as
indicated by several studies including Zhang et al. (2019) and Lee et al.
(2020). According to the review, the objective functions in these studies aim
to minimize total travel distance (Wutthisirisart et al., 2015; Diaz, 2016; Xie
et al., 2018; Krishnamoorthy & Roy, 2019; Zhang et al., 2019; Jiang et al.
2021; Li et al., 2021; Yuan et al., 2021; Trindade et al., 2022), minimizing
travel time (Mirzaei et al., 2021a, 2021b), and maximizing correlation between
stock keeping units (SKUs) (Lee et al., 2020; Yang, 2022). De Koster et al.
(2007) highlight the importance of zoning as an effective strategy for optimizing
order picking processes. Zoning involves dividing the order picking area into
specific zones and assigning dedicated pickers accordingly. The advantages of
this approach include reduced travel distance for each picker, decreased
traffic congestion, and enhanced familiarity with item locations. Two methods,
progressive assembly (pick-and-pass) and synchronized picking, can be used to
overcome the challenge of consolidating orders before shipping. Product
properties such as size, weight, temperature requirements, and safety are
considered for effective implementation of zoning. Mantel et al. (2007)
introduces the Order Oriented Slotting (OOS) strategy, which aims to optimize
item allocation for multi-item orders to minimize the travel distance. The authors
classify slotting strategies into item-oriented such as the Cube per Order
Index approach (COI), and order-oriented approaches such as OOS, with
correlated storage lying in between. They note that OOS does not work well
together with order batching and extensive zoning, and it performs best when an
average order consists of a moderate number of SKUs to be picked. The author
suggests implementing a method for storage assignment that is optimal for both
frequent single-item orders and multi-item orders. Wutthisirisart et al. (2015)
present a two-phased heuristic algorithm for relation-based item assignment to
minimize the travel distance. The algorithm considers item correlation and
order characteristics, such as order frequency and size, to allocate items. Zhang
(2016) implements clustering-based algorithms using a correlation frequency
matrix to optimize travel distance. Kuo et al. (2016) developed metaheuristic
algorithms to implement the CSAS in a synchronized-zone order picking system.
Their model minimizes the sum of item correlation frequencies across zones,
aiming to reduce idle time and increase utilization rates by assigning highly
correlated items to different zones, picked simultaneously by multi pickers.
However, this approach increased workload and travel distance. The authors
recommended further studies to balance the trade-off between utilization and
workload. Diaz (2016) examines the impact of customer demand patterns and order
clustering on warehouse order-picking operations. The author proposes a
heuristic optimization approach that considers physical restrictions, such as
non-uniform density SKUs. Xie et al. (2018) presents a bi-level optimization
model with grouping constraints. Experimental results validate the
effectiveness of the model and the superiority of the tabu search method over
random search. Krishnamoorthy & Roy (2019) introduce a storage assignment
strategy that utilizes a top-k high utility itemset mining technique and a
heuristic algorithm to assign items effectively. Zhang et al. (2019) present an
integer programming model using heuristic and simulated annealing methods that
considers item correlation. The study by Lee et al. (2020) introduces a
correlated and traffic balanced storage assignment. It minimizes travel time
and congestion by clustering items based on travel efficiency and traffic flow
balance. Using multi-objective evolutionary algorithms, the authors identified
clusters, followed by implementing an optimized assignment. In their case
study, the model outperformed random, class-based, and correlated approaches.
Jiang et al. (2021) implemented a storage strategy that allows product to be
stored in multiple locations, taking into account their co-occurrence in
orders. The problem is formulated as an integer programming model to minimize
the weighted sum of distances between products. The paper by Li et al. (2021)
introduces a heuristic method that utilizes data mining to optimize order
picking distance. It focuses on grouping similar items and considering
nonuniform product weights. Yuan et al. (2021) present an optimization approach
for storage assignment in a Robotic Mobile Fulfillment System (RMFS). Their
method improves order picking efficiency by reducing pod visits, optimizing
travel distance, and mitigating system congestion. Mirzaei et al. (2021b)
propose an integrated cluster allocation method that incorporates product
affinity and product turnover information to assign related products to the
same storage location. This approach reduces retrieval time by up to 40%
compared to conventional storage policies. The authors (2021a) propose a
comprehensive approach that considers turnover frequency, product correlation,
and inventory dispersion strategies to minimize order picking travel time in
automated systems. They develop a mathematical model and heuristic method to
allocate products to clusters and zones effectively. The test demonstrates that
correlated dispersed assignment results in shorter travel times for larger
order sets compared to random, turnover frequency-based, correlated assignment
strategies. Trindade et al. (2022) proposed a heuristic approach for optimizing
the storage location assignment in multi-aisle warehouses through product
clustering. Their method addresses challenges related to non-uniform products
and incorporates additional allocation criteria. The results demonstrated a
potential reduction of travel distance by up to 15%. Yang (2022) examines the
impact of storage assignment and order batching policies on order picking in
RMFS. The author proposes using order and item similarity to batch orders and
assign storage locations. Numerical tests reveal that weighted support count-based
storage allocation combined with correlation-based order batching yields
optimal performance. Adaloudis (2023) examines different methods for optimizing
the storage assignment of autonomous mobile robot systems. Three optimization
approaches are developed: correlation-based heuristic, product
characteristic-based clustering, and surrogate-based genetic algorithm. A
simulation model is employed to evaluate their effectiveness, with the
clustering method based on product characteristics showing the most significant
improvement. The surrogate-based genetic algorithm also demonstrates solid
performance, while the correlation-based heuristic has the lowest performance
among the three methods.
Many authors follow a common approach in storage
assignment policies by locating frequently accessed items near the depot.
Buckow and Knust (2023) propose algorithms and optimization techniques to
reduce travel distances in a high-bay warehouse with an automated storage and
retrieval system (AS/RS) by rearrange the pallets based on their turnover rates
within a limited reshuffling time. Yuan et al. (2023) present a three-stage
method to optimize the storage allocation assignment of automated drug dispensing
machines in smart pharmacies. The method considers the daily demand to enhance
space utilization, drug grouping using the Jaccard similarity coefficient to
preventing cross-machine picking, and allocation optimization based on demand
frequency to reduce picking time. Other researchers have also addressed travel
distance optimization by considering multiple problems simultaneously. Kim et
al. (2020) present heuristic methods to optimize the item storage assignment to
minimize travel distance for order pickers. The authors propose slot selection
and frequent itemset grouping strategies based on association rule mining. The
paper also introduces a flexible routing policy to further enhance the
efficiency of the system. Zhang et al. (2024) propose a joint optimization of
item and pod storage assignment problems in robotic mobile fulfillment systems
by considering the correlation frequency of items in purchase orders. Their
main objective is to minimize the robots' travel distance and ensure workload
balance to avoid congestion. Additionally, the authors developed a genetic
algorithm to solve the mixed integer programming model. Wan et al. (2022)
present an integrated optimization for order picking systems by addressing
layout optimization, storage location assignment, and picker routing. The
authors propose a three-dimensional design for a fishbone layout, aiming to
minimize the average distance between storage locations and the depot. They
also establish storage location assignment models based on turnover and correlation
storage policies and employ the TSP to plan picker routing. In order to solve
the multiobjective optimization model, the authors design a cooperative
optimization algorithm (COA) that improves the average optimal travel distance
by 9% with consistency. They conclude that the fishbone layout can reduce
picking distance by 10-15% without considering aisle congestion. Bolaños-Zuñiga
et al. (2020) propose a mathematical model to address the integrated Storage
Location Assignment, Unique, Picker-Routing (SLAUPR) problem and minimize
travel time. One crucial aspect of the SLAUPR model is the inclusion of
precedence constraints. By considering these constraints, the model ensures
that the picking sequence is optimized to handle heavier items while maintaining
overall process efficiency. The authors highlight that this integrated
optimization model distinguishes their work from previous research, which often
focused on specific optimization factors or relied on heuristic methods.
Computational experiments conducted for the case study demonstrate that the
mathematical model produces optimal solutions for small and medium-sized
instances but faces challenges with larger instances. Consequently, the paper
suggests further research to tackle the problem's complexity and explore
additional enhancements. A subsequent study conducted by Bolaños-Zuñiga et al.
(2023) aimed to refine the SLAUPR model while addressing the computational
challenges highlighted in the earlier case study involving 185 available
storage locations (Bolaños-Zuñiga et al., 2020). The authors introduce two
formulations: SLAUPR_V2, which incorporates valid inequalities, and SLAUPR_V3,
which incorporates single commodity flow constraints to eliminate sub-tours.
Additionally, the authors developed an adaptive multi-start heuristic (AMH)
that utilizes an evaluation function defined by the demand frequency and weight
of products. This AMH serves as an approximation method to improve computation
time for larger instances. The experimental results demonstrated the
effectiveness of the proposed algorithm and models, with an increased number of
feasible and optimal solutions. The average time required to obtain the
feasible solutions is reduced to 117 seconds. Moreover, the product allocations
suggested by the proposed heuristic resulted in a significant improvement of
over 40% in picking times.
The MINLP is a branch of mathematical optimization
that involve continuous and integer variables, as well as non-linear
relationships between these variables. Berthold (2014) emphasizes the necessity
of MINLP models in addressing wide range of real-life applications, which
possess inherent nonlinear characteristics. The author acknowledges the vital
role of heuristic algorithms as integral components of advanced solvers for
such problems. One of the commercial tools that includes solvers for MINLP
problems is Lingo software. The specific details of how the solvers operate may
vary depending on the version and specific settings used, including the option
for the solver to decide. However, Lingo's solver takes a typical approach for
solving MINLP problems that includes employing a branch-and-bound algorithm,
which is a common technique used for solving MIP problems. During the
branch-and-bound process, the solver may apply various heuristics to guide the
search for feasible solutions and improve the efficiency of the algorithm
(Lindo Systems Inc., 2020). Tahami and Fakhravar (2022) highlight the
advantages of combining heuristics with exact algorithms for solving
optimization problems. They note that exact algorithms guarantee optimal
solutions but can be limited by their problem-specific nature and high memory
consumption. On the other hand, heuristics aim to find good approximate
solutions in a reasonable amount of time, providing scalability and
flexibility. The study also notes that most branch-and-bound approaches rely on
heuristics for bounding, and many hybrid approaches are heuristic-based.
This paper builds upon previous work in order
picking optimization and aims to contribute to the existing research by
addressing gaps in the field. We propose a new approach that minimizes travel
distance in a synchronized-zone, single-order picking system by considering the
average order size as a key factor. We implemented the CSAS using a MINLP model
that is solved by the Branch and Bound algorithm. In our study, we made several
key findings and recommendations. Firstly, we propose optimizing item correlation
across zone by offering flexibility in identifying multiple local optimal
solutions based on predefined criteria. This approach aims to address different
real-world case scenarios to fulfill their priorities in achieving balanced
workload in terms of travel distance. Additionally, we address the problem of
order splitting by decrease total trips to distant zones, while increasing frequently
ordered smaller lists at closer zones. This is achieved by considering both the
total zone correlation score and picking frequency to optimize the allocation
of items. This approach effectively minimizes travel distance by prioritizing
distant zones with larger average order sizes, thereby reducing order splitting
and number of trips to the depot. Finally, we suggest implementing an optimal
item ranking method for both single-item and multiple-item orders, taking into
account the average order size of each item. By incorporating these strategies,
the travel distance within the order picking system can be substantially
minimized. This reduction will ultimately result in enhanced efficiency and
productivity in warehouse operations.
3. Problem Settings
In this paper, we optimize the travel distance in a
pharmaceutical distribution center's synchronized-zone, single-order picking
system by implementing the CSAS based on an item correlation matrix constructed
from 15 months of historical data. According to Goetschalckx and Ashayeri
(1989), the complexity of an order picking system is influenced by both
internal and external factors. Internal factors, such as information
availability, warehouse dimensionality, routing, storage, batching, and zoning,
contribute to this complexity. These factors can be categorized into two levels
of decision-making as shown in Figure 1.
Figure 1.
Complexity of the Order Picking System Based on the Dimensionality of Internal Factors as Presented by Goetschalckx and Ashayeri (1989).
Figure 1.
Complexity of the Order Picking System Based on the Dimensionality of Internal Factors as Presented by Goetschalckx and Ashayeri (1989).
At the policy level, several decisions greatly
impact order picking performance. These decisions encompass five key areas:
storage assignment strategy, zoning, routing, batching, and order release mode.
Le-Duc (2005) defines these decisions as follows: Storage assignment strategy
refers to the rules used to allocate products to specific storage locations,
such as random, class-based, and dedicated storage assignments. Zoning involves
dividing the order picking area into zones and assigning pickers to specific
zones to reduce traffic congestion and travel distance, following either
progressive or synchronized zoning approaches. Routing determines the sequence
in which items are picked, utilizing methods like s-shape, return, mid-point,
largest gap, combined, and optimal routing. Batching involves either picking
orders individually or combining multiple orders in one tour, with approaches
such as sort-while-pick employed when order splitting is not allowed. If order
splitting is possible, sorting is done after the picking process is complete
(pick-and-sort). The order release mode consists of discrete (wave-picking) and
continuous methods, where wave picking releases multiple orders with a common
destination for picking in multiple warehouse areas. Typically, wave picking is
combined with batch picking, and the next picking wave begins after the
previous one is finished. The compatibility of these operational policies
significantly affects the performance of the order picking system. Therefore,
when considering the scope of an optimization problem, it is important to
consider the combination of all related policies. This ensures that the
proposed solution is applicable to similar systems and allows for further
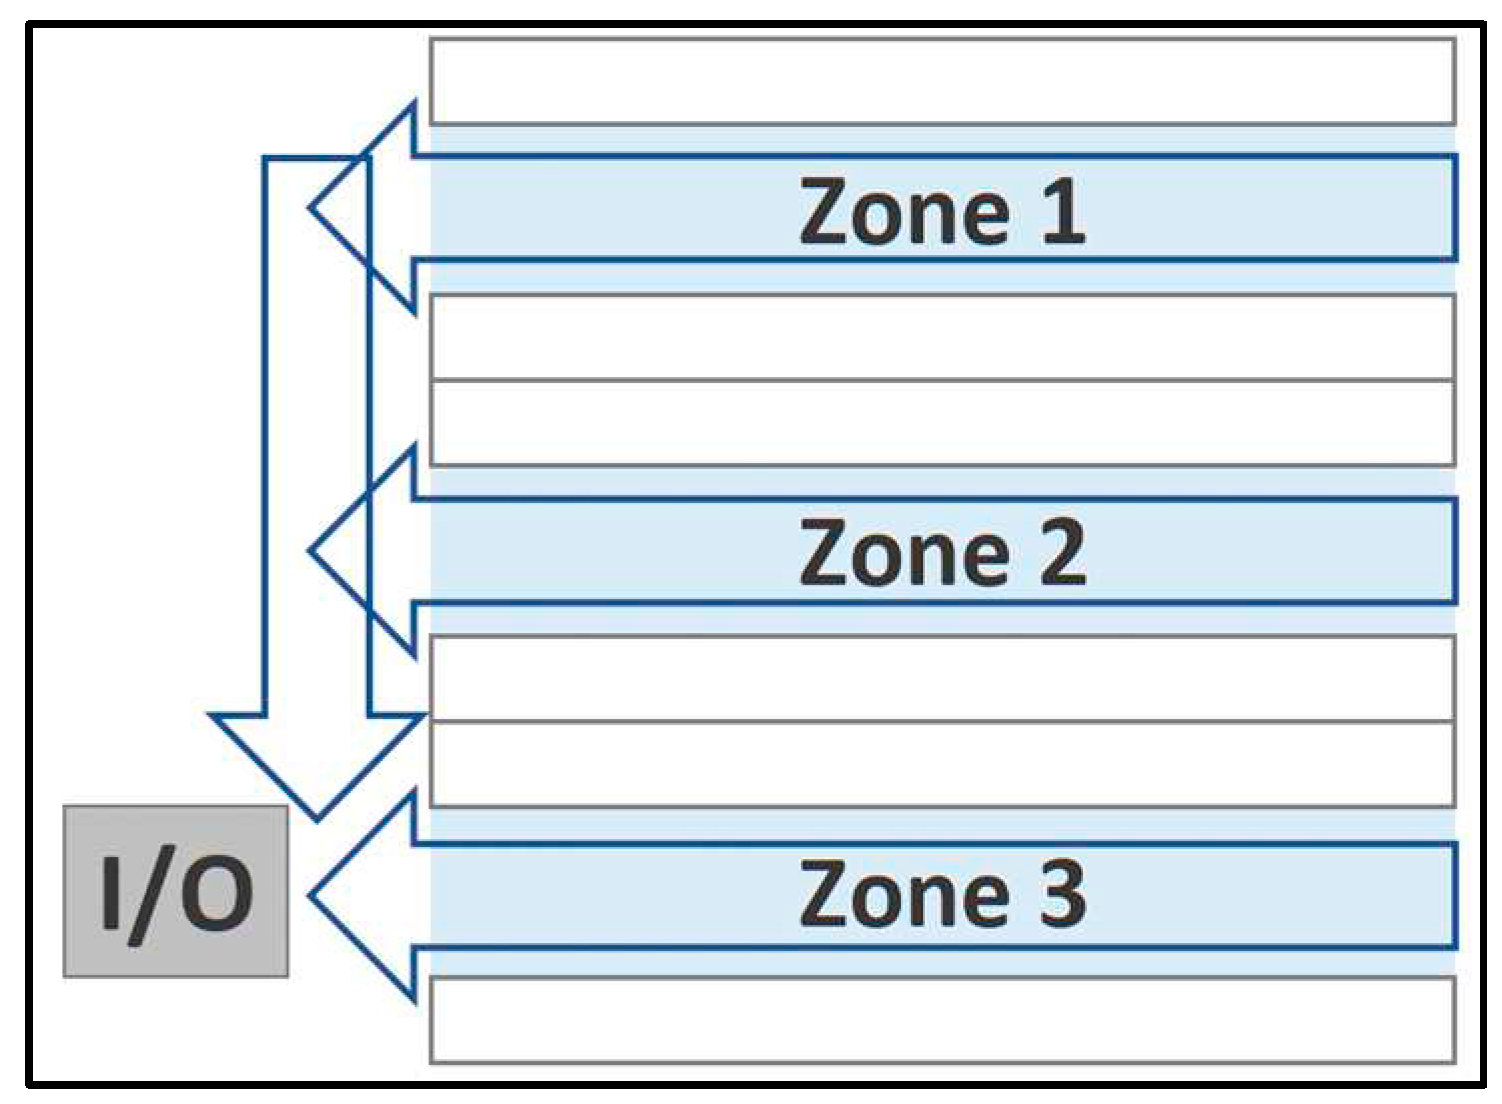
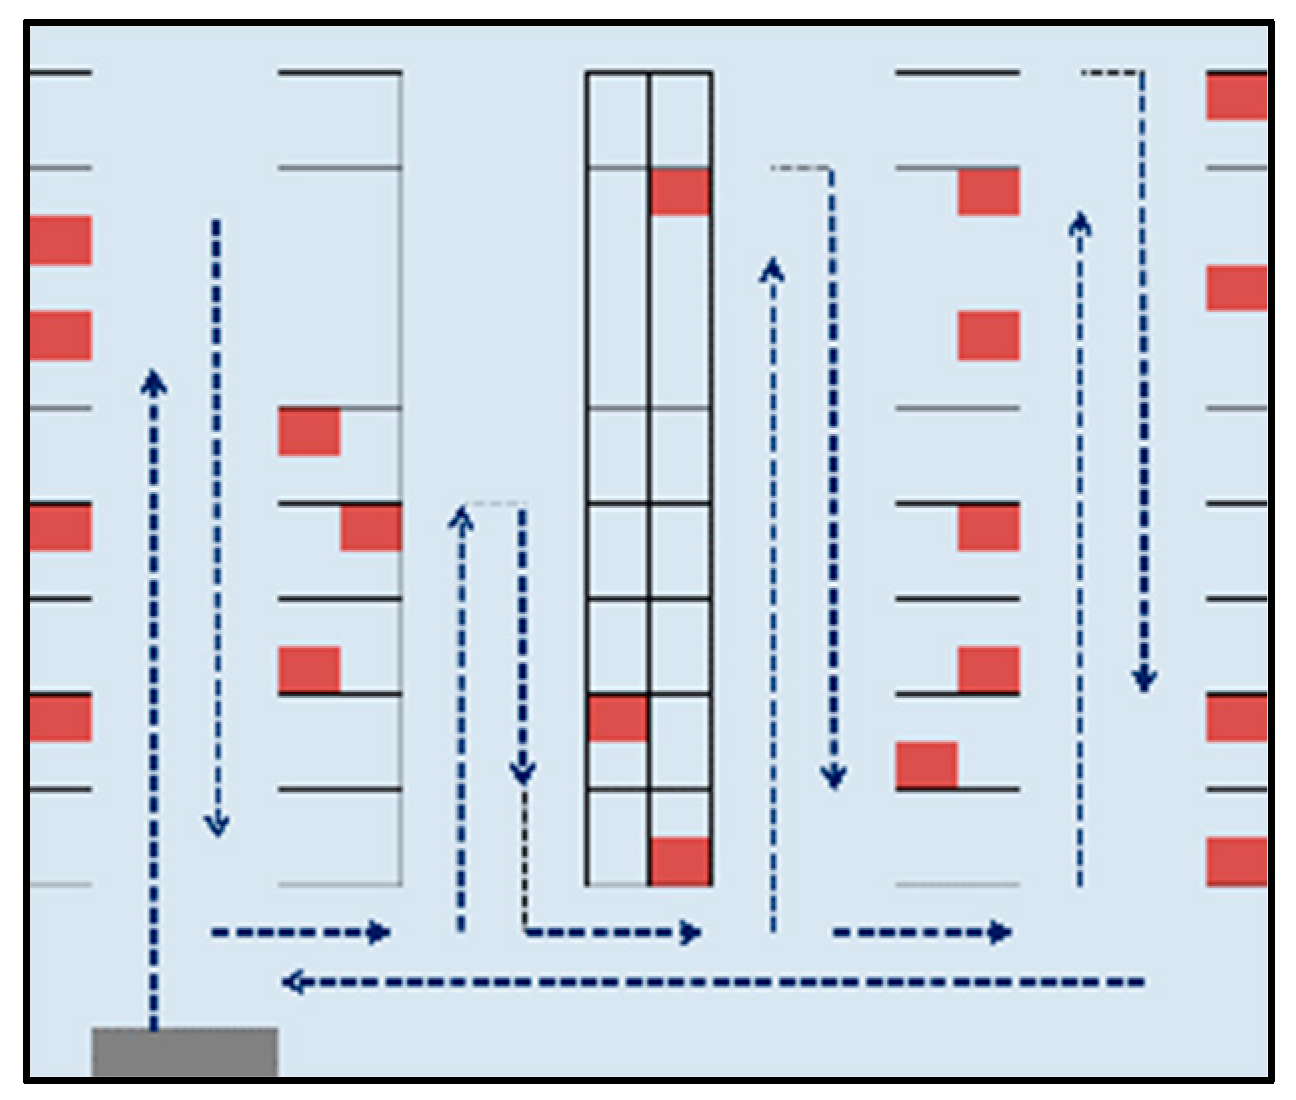
improvements in future related work. In this case study, the current order
picking system relies on manual operations supported by a Warehouse Management
System (WMS) and handheld devices, following a single-order method,
synchronized zone picking policy (Figure 2),
and return routing strategy (Figure 3).
Figure 3.
Return Routing.
Figure 3.
Return Routing.
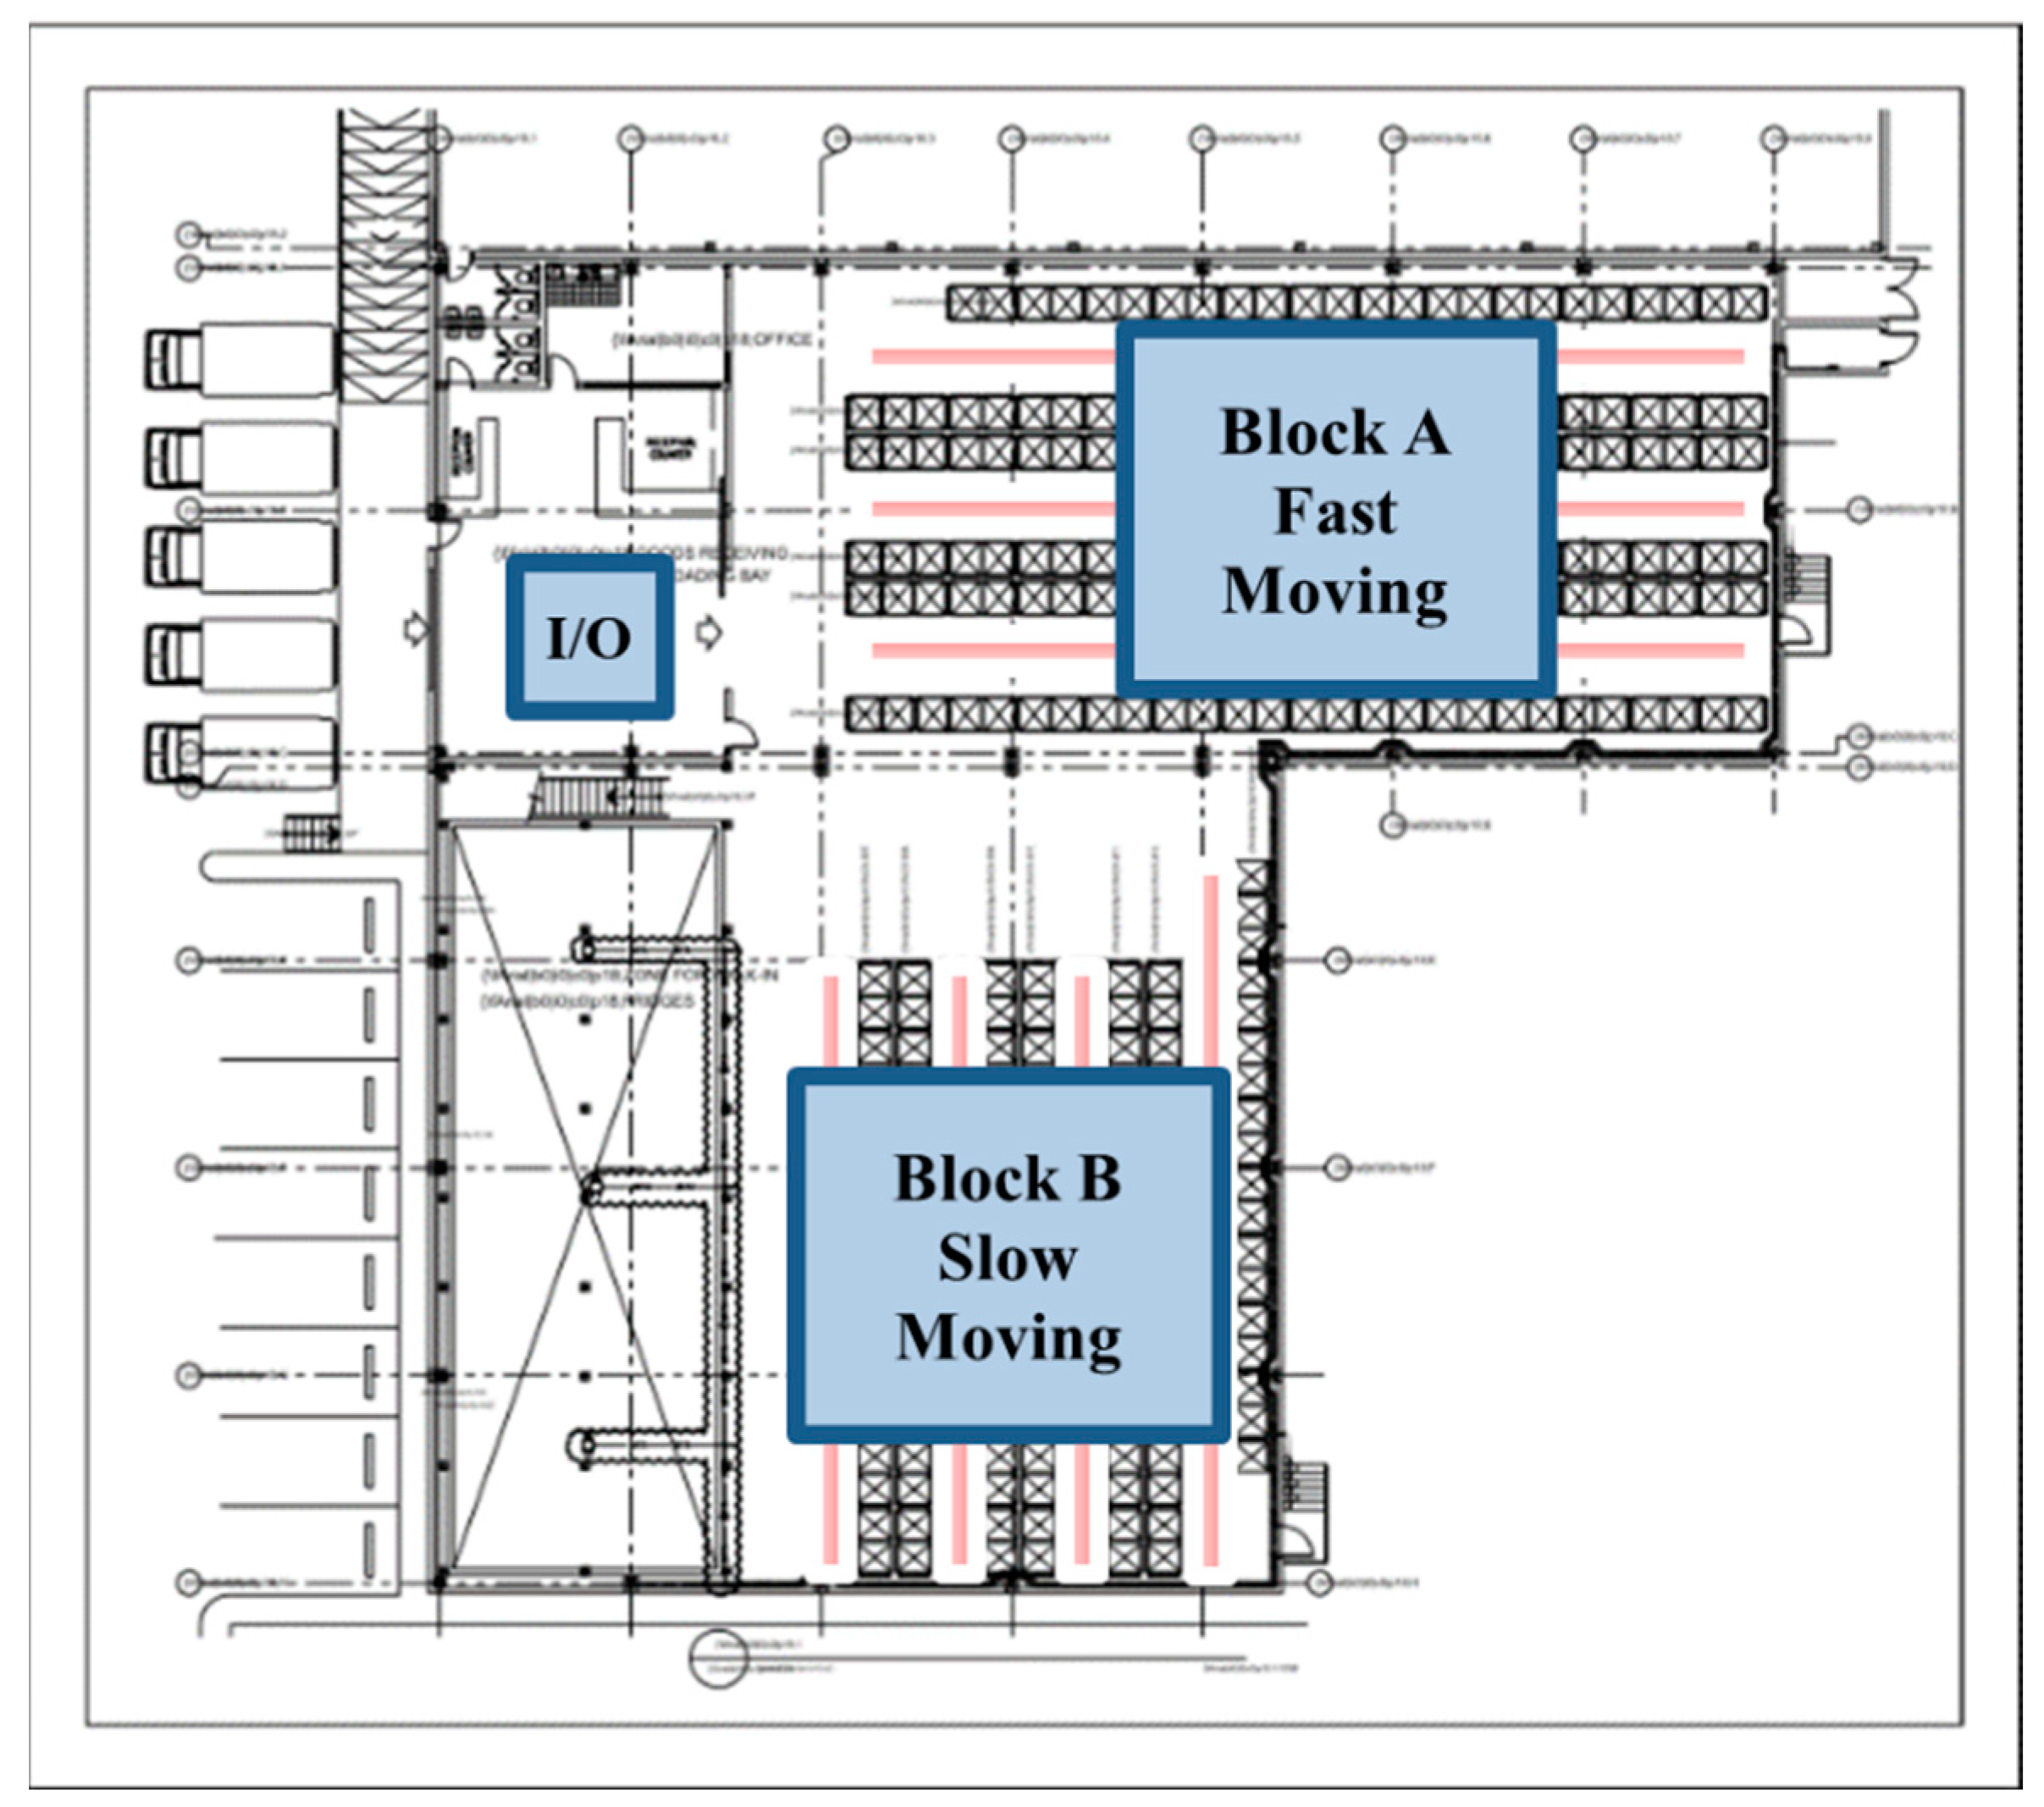
The existing storage assignment approach combines
class-based and random assignments, fast-moving (148) items are stored randomly
in a block area closer to the depot, while slow-moving (211) items are placed
further away (Figure 4). In order to
optimize the storage allocation, the CSAS has been implemented along with the
existing class-based method, replacing the random storage approach. To achieve
this optimization, a MINLP model has been developed to minimize travel distance
for each classed-based single-block storage area with a conventional layout
(Block A & B). The model employs the solver’s integrated heuristics
algorithms to better explore the solution space. To make the problem more
manageable, each block in the warehouse has its own model using a simplified
data-driven approach, in addition to following an efficient method that
indirectly impacts the travel distance without calculating the actual distance
from the depot. The model takes into account the number of items allocated in
each zone and incorporates other defined criteria for balancing resource
utilizations in terms of distance. By considering these constraints, the
storage allocation is optimized according to the actual framework of the order
picking system.
Figure 4.
The Distribution Center Layout.
Figure 4.
The Distribution Center Layout.
Additionally, a simulation model has been developed
using FlexSim to evaluate the performance of the proposed item storage
assignment. This simulation model was designed to offer maximum flexibility by
allowing the testing of various historical data sets and experimenting with
different arrangements for item storage assignment.
4. Methodology
Designing an MINLP model to converge to optimal
solution is challenging, especially when implementing precise constraints. This
is primarily due to the presence of non-convexity, which leads to multiple
local optimal solutions. Additionally, the complexity introduced by integer
variables and nonlinear functions, along with the difficulties in satisfying
constraints using approximation techniques. Moreover, the impracticality of
exploring the entire search space due to high dimensionality which add to the
computational demands of MINLP problems, making it harder to attain globally
optimal solutions. To improve the efficiency of solving MINLP problems, several
strategies can be employed. These include problem reformulation, variable
fixing, decomposition techniques, preprocessing, and model simplification
methods. Problem reformulation involves transforming the original MINLP problem
into a more manageable form, such as a MILP problem or a convex optimization
problem. By reformulating the problem, we can take advantage of existing
algorithms and solvers that are better suited for faster computational times.
Variable fixing is another useful strategy that involves identifying variables
with known values and fixing them at those values. This reduces the search space
and eliminates unnecessary computations. Decomposition techniques involve
breaking down the MINLP problem into smaller subproblems, which can be solved
independently. This allows for parallelization and the use of specialized
solvers for each subproblem, leading to faster convergence. Preprocessing and
model simplification techniques enhance solver efficiency through the analysis
of the problem structure and the elimination of redundancy. This reduces
complexity and removes unnecessary constraints or variables, resulting in a
more streamlined and tractable problem that improve solver performance. By
employing these strategies, we can enhance computation speed, reduce
complexity, and improve efficiency when solving MINLP problems.
This paper introduces optimization techniques for
storage allocation, incorporating the concept of weighted centroids as targets
for each zone. By utilizing correlation score ratios and frequency ratios as
coefficients, we have the ability to effectively influence the distribution of
items among zones by satisfying specific criteria that directly impact the
average order size. The incorporation of these weighted centroids is
instrumental in driving convergence towards preferred outcomes and effectively addressing
diverse scenarios. Consequently, this technique offers exceptional flexibility
and adaptability, making it highly suitable for testing and validating
different correlated storage arrangement. Additionally, we follow an efficient
methodology by breaking down the process into sub-problems and employing
separate models for the class-based blocks, A and B. Furthermore, we utilize
the Branch-and-Bound algorithm, which is employed by Lingo's MINLP Solver, to
narrow down the search for the local optimal solution. This algorithm reduces
computational complexity and improves overall efficiency by partitioning the
solution space and bounding the objective function value in each partition. To
further enhance memory consumption, we import the correlation frequency matrix
(item x item) directly into our model, eliminating the need to generate it from
the order history data during runtime. This matrix allows us to evaluate
different arrangements and assign items to zones based on defined correlation
score and picking frequency. Unlike traditional methods that solely aim to
maximize the total correlation score, our approach considers the impact of
average order size. We control the distribution of items by defining the ratios
of total correlation score and total picking frequency at each zone as key
factors in optimizing the travel distance. Instead of relying on iterative
processes and extensive calculations using a large volume of order history
records to estimate the average order size, which can render the model infeasible,
we incorporate the total picking frequency by summing the diagonal values
available in the matrix for all items that are correlating with themselves.
This significantly simplifies the process without compromising the model's
accuracy. By evaluating the performance in terms of travel distance achieved
for different ratios of these key factors, we highlight the impact of the
average size of newly generated orders or sub-orders across zones. This average
is influenced by the proposed item allocation to zones within the model. It
negatively correlates with the total picking frequency and positively
correlates with the total correlation score. Therefore, higher ratio of
correlation score and lower ratio of picking frequency indicate larger average
order size. In this case study, we prioritize the placement of items based on
these factors. Contrary to traditional methods that allocate items of higher
correlation closer to the depot, we strategically place items that collectively
achieve higher average order size in distant zones to minimize travel distance.
This optimization approach ensures workload distribution based on distance,
reducing the need for pickers assigned to further zones to frequently travel to
drop items at the staging area. As a result, overall travel time for pickers is
reduced, leading to improved efficiency.
In mathematical modeling, we propose the
utilization of the Positive Deviation (PD) measurement as an effective penalty
for achieving a target in maximizing problems. This approach penalizes positive
deviations and quantifies negative ones within feasible solutions. It
facilitates rapid convergence towards maximizing the objective function to
reach a specific target, while penalizing any deviation beyond that target.
Similarly, the Negative Deviation (ND) measurement is an effective method for
targets in minimizing problems. We use formulas for these measurements rather
than functions or logical conditions to facilitate better convergence. The ND
and PD are calculated to determine deviations from targeted weighted averages,
referred to as centroids. These measurements quantify each state and guide the
solver towards reaching targets rather than strictly penalizing all deviations.
By incorporating both PD and ND in our penalty terms, we are able to achieve
targeted centroids that exhibit a positive correlation. By utilizing the ND, we
prevent the centroid from decreasing below the target and allow it to increase,
while by utilizing the PD we discourage the centroid from increasing above the
target and permit it to decrease. This approach yields better results by
driving the convergence towards finding a local optimal solution that maximizes
specific centroids while simultaneously minimizes others to distribute items
that satisfies these specific criteria, which is opposing to their correlated
relationship. By implementing ND and PD, we observed a significant improvement
in convergence speed – approximately 3.5 times faster compared to using
absolute deviation. The solving time is further influenced by the penalty
parameter, which determines the balance between accuracy in achieving targets
and allowing for deviations to maximize the overall correlation score. A higher
penalty parameter promotes more accuracy, but requires more time to converge to
the local optimal solution. Balancing this trade-off allows us to control the
extent to which the deviation is permitted in maximizing the total score while
still aiming for the desired ratios per zone. The main objective of the MINLP
model is to propose item assignments across zones without explicitly ranking
them within each zone. However, our research paper investigates different
ranking methods and reveals that those based on the average order size of items
within each zone have shown better results in optimizing travel distance. By
prioritizing frequently ordered items that are less dependent on other items,
the item ranking methods effectively minimize travel distance, resulting in a
more efficient item storage assignment. We integrate all these strategies with
the objective of minimizing memory consumption and computation time to achieve
better optimization results. By doing so, we are able to achieve multiple local
optimal solutions based on desired ratios in an average solving time of 14
minutes. To evaluate the effectiveness of our approach, we conducted a simulation-based
model of the order picking system to compare the total travel distance achieved
using our methodology against the current system statistics. The results
demonstrated a remarkable improvement in performance, with reductions in travel
distance of up to 36.75%. To further validate our approach, we also evaluated
the results of recent historical order data to test the sustainability of the
optimization. The results showed significant reductions of up to 33.59%.
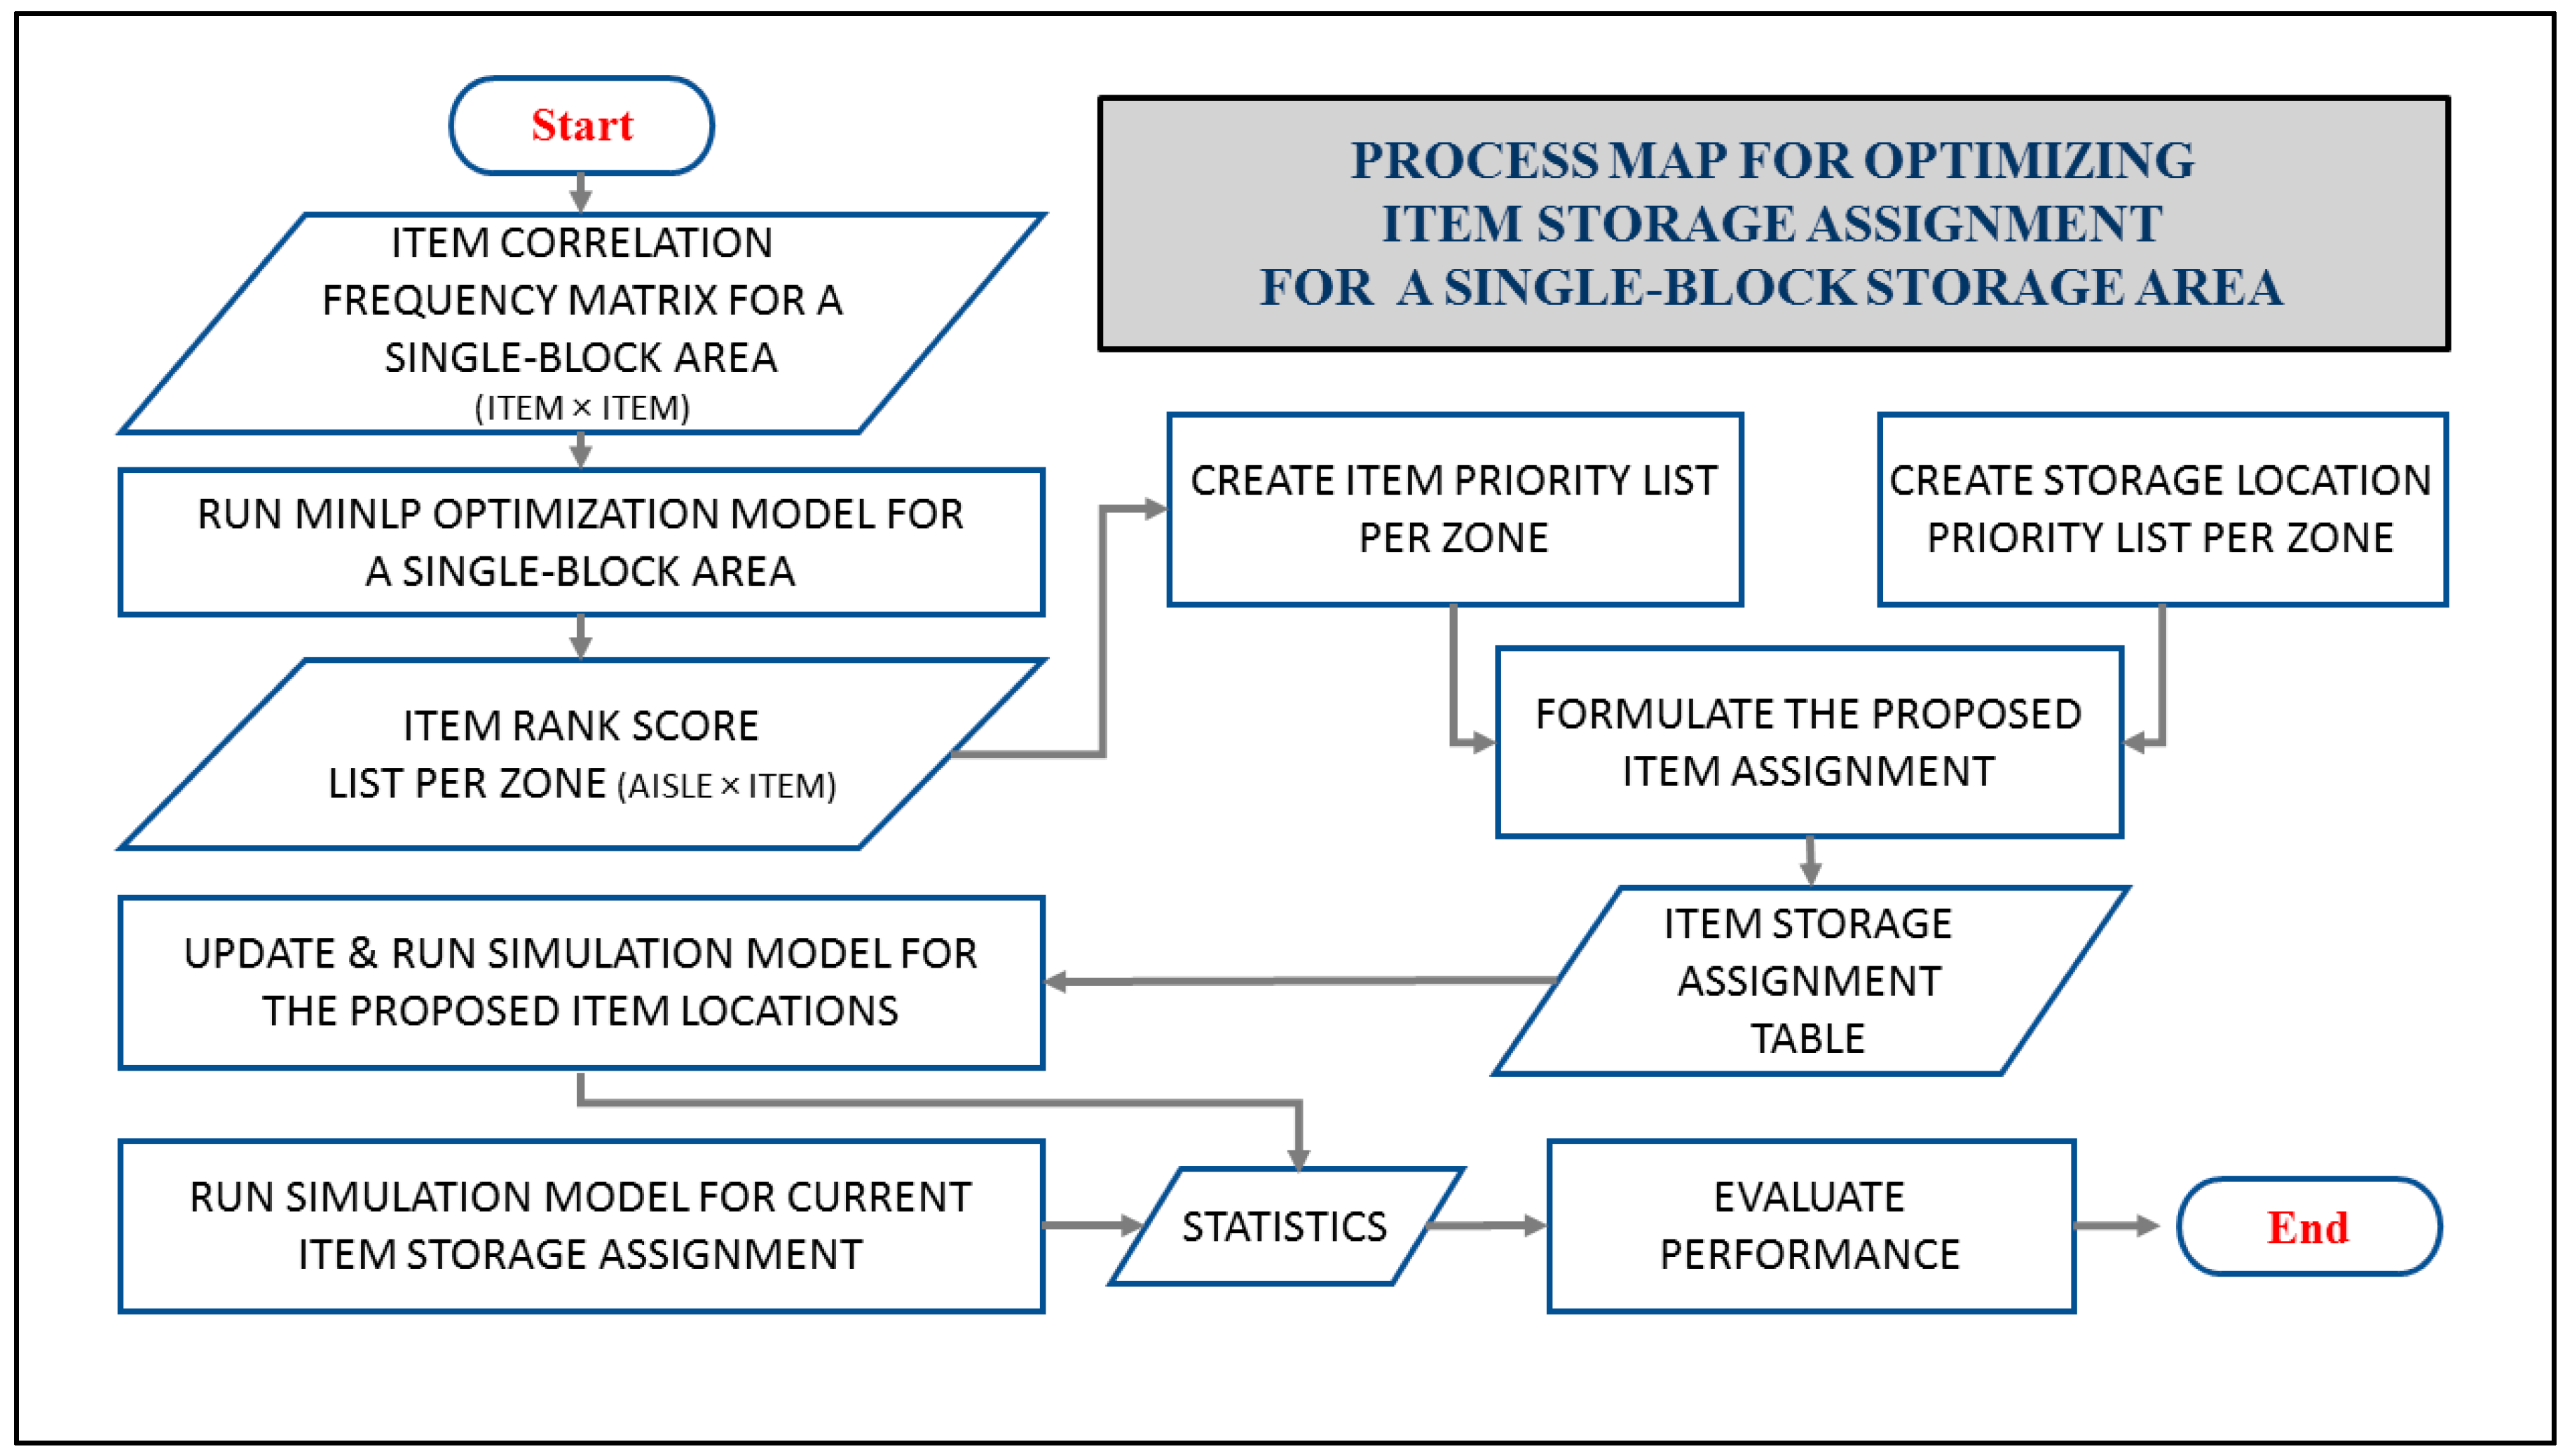
To sum up our methodology, we follow a systematic
approach consisting of several steps (Figure 5).
We begin by constructing a simulation model and developing a mathematical
programming model. Followed by formulating a storage location priority list and
implement CSAS based on our optimization model utilizing an item ranking method
that is optimal for both single-item and multi-item orders. Through this
process, we optimize the total travel distance and achieve desired workload
balance among pickers in terms of distance versus frequency of trips.
4.1. Simulation Model
A simulation model was developed using FlexSim
software to evaluate the performance of the order picking system under
different scenarios. The model captured workload distribution, resource
utilization, and travel distance performance. The first step in modeling
involved building a virtual environment that closely represents the system's
layout. This is done by scaling the 3D model based on the distribution center's
floor plan to provide accurate travel distance statistics and precise placement
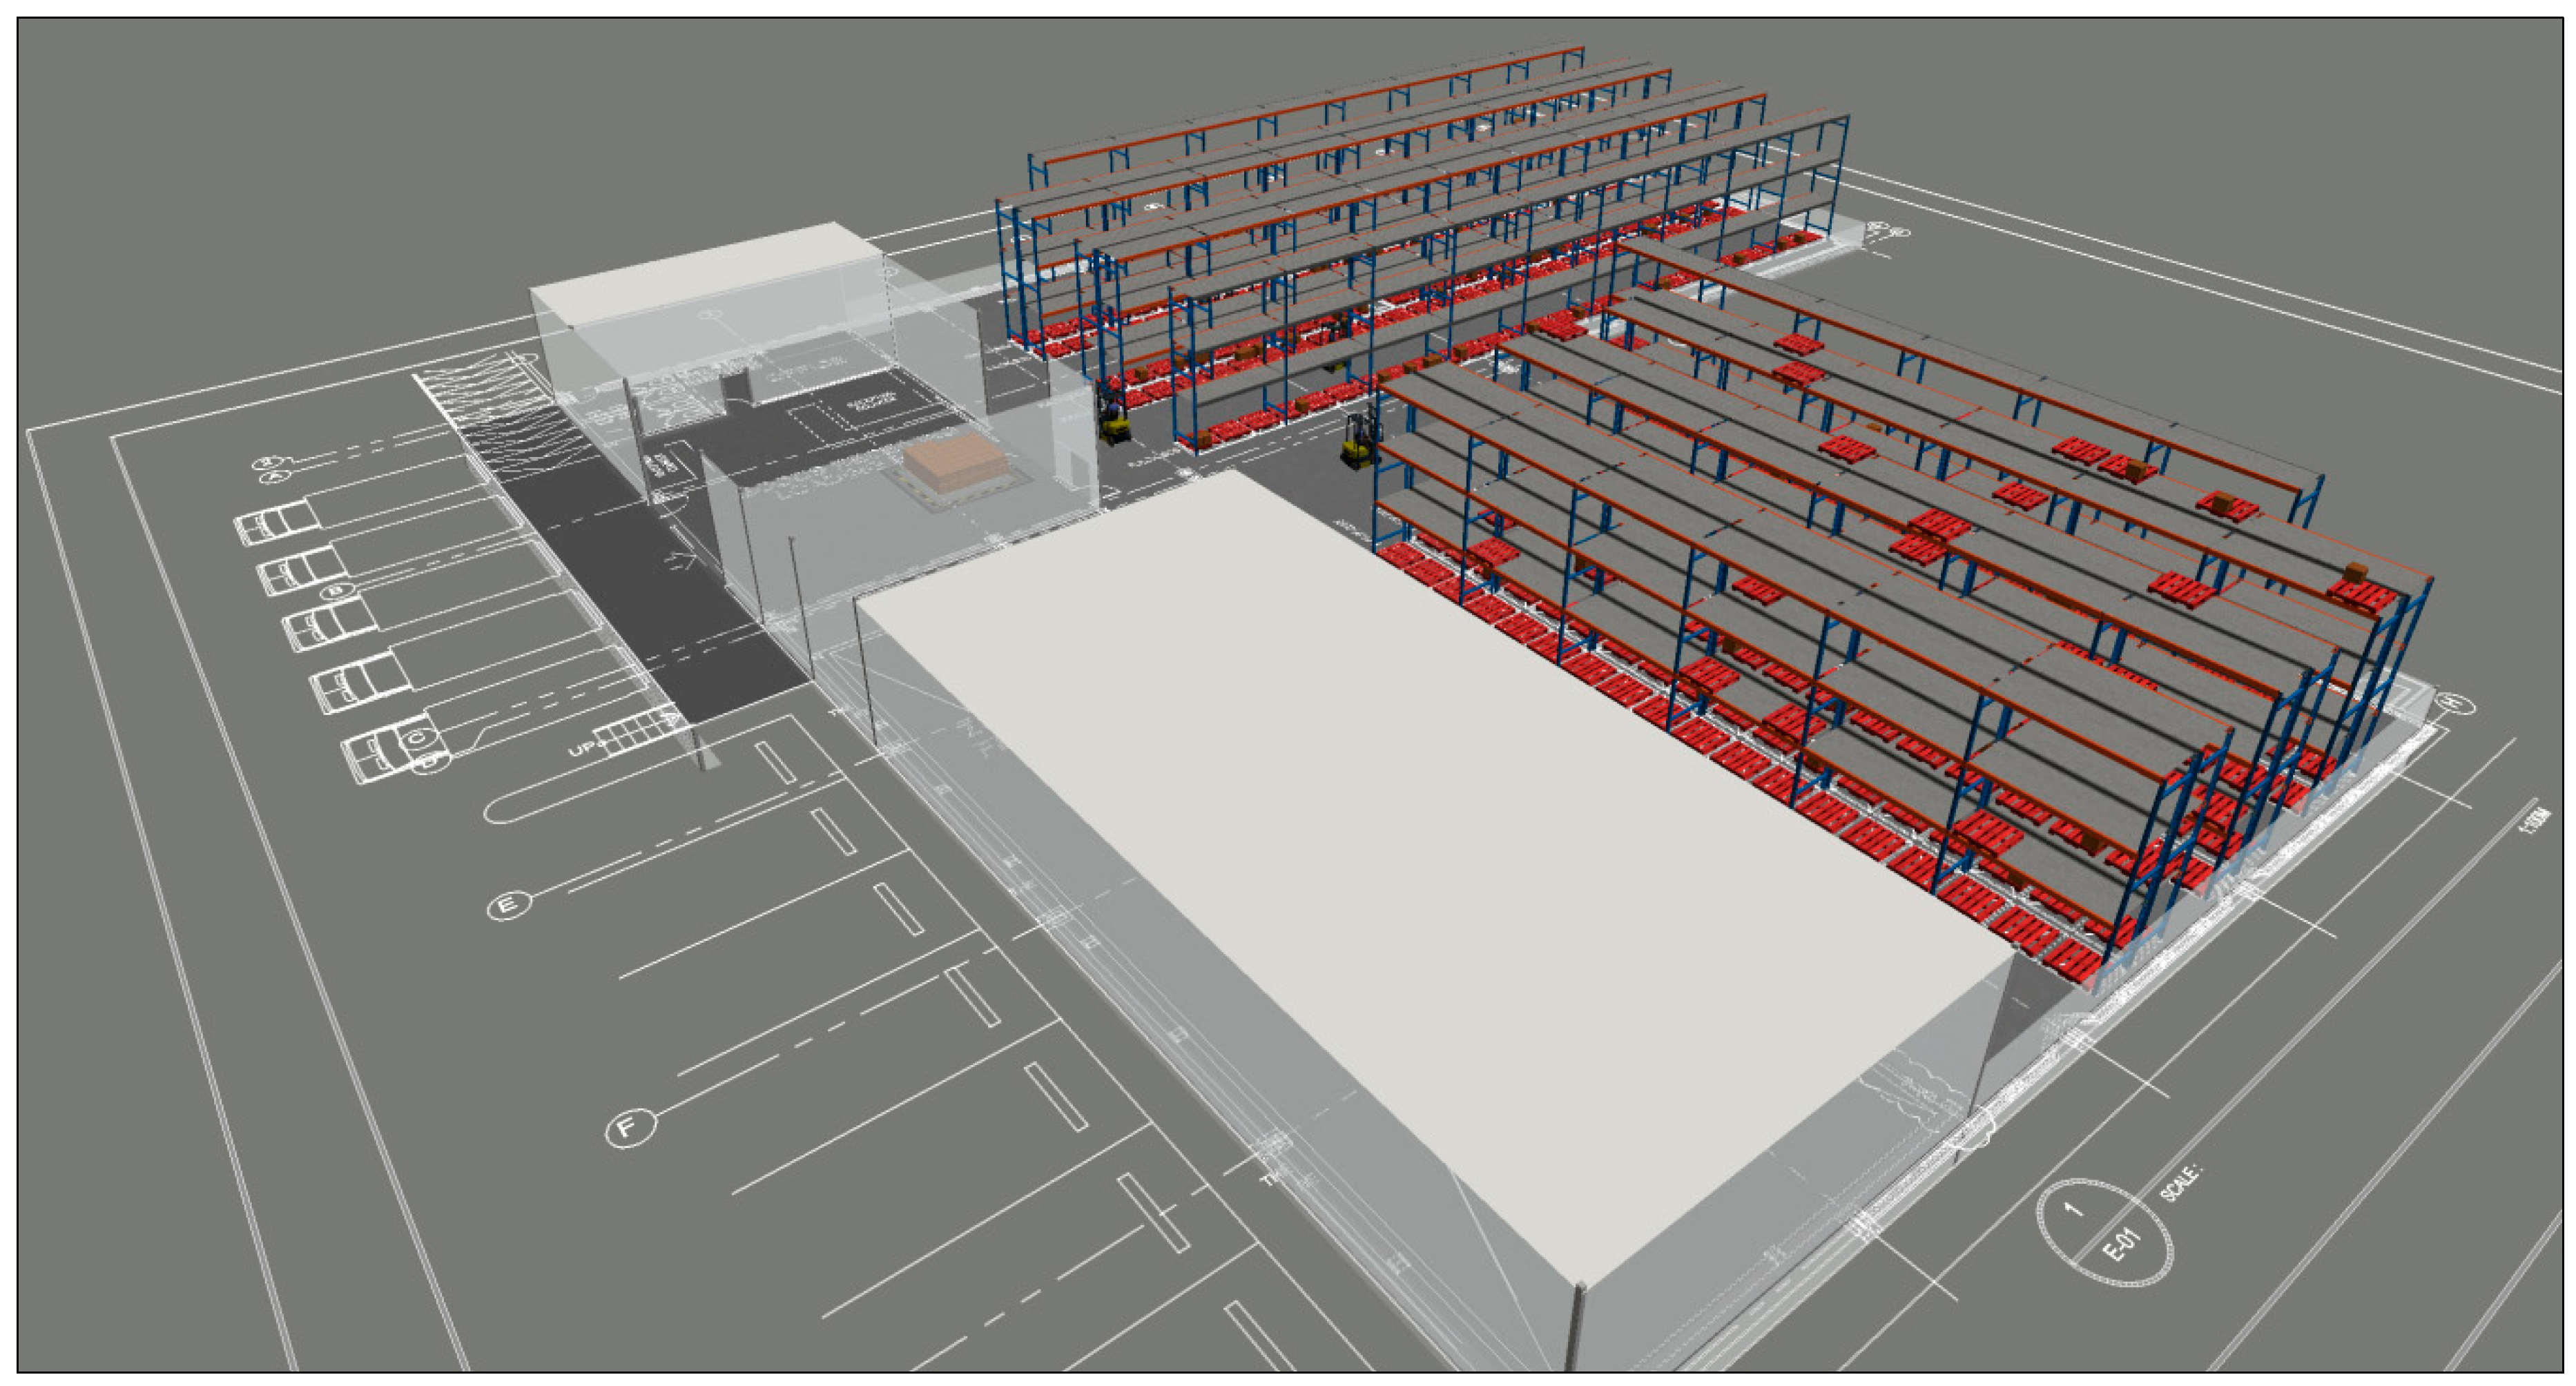
of objects. The model includes a total of 13 racks, one transporter assigned at
each of the 7 zones\aisles, a queue for the depot\staging area, navigation
networks, and a storage system to retrieve and assign items by slot address (Figure 6).
Figure 6.
3D Simulation Model.
Figure 6.
3D Simulation Model.
In order to capture the idle time caused by the
picker's waiting time after completing the picking task for the day, we define
a "zero" speed value for loading and unloading activities in the
simulation model. Furthermore, we made the assumption that the volume of item
picking would not interrupt the trip due to any capacity constraints. This
allowed us to accurately reflect the optimization performance of the proposed
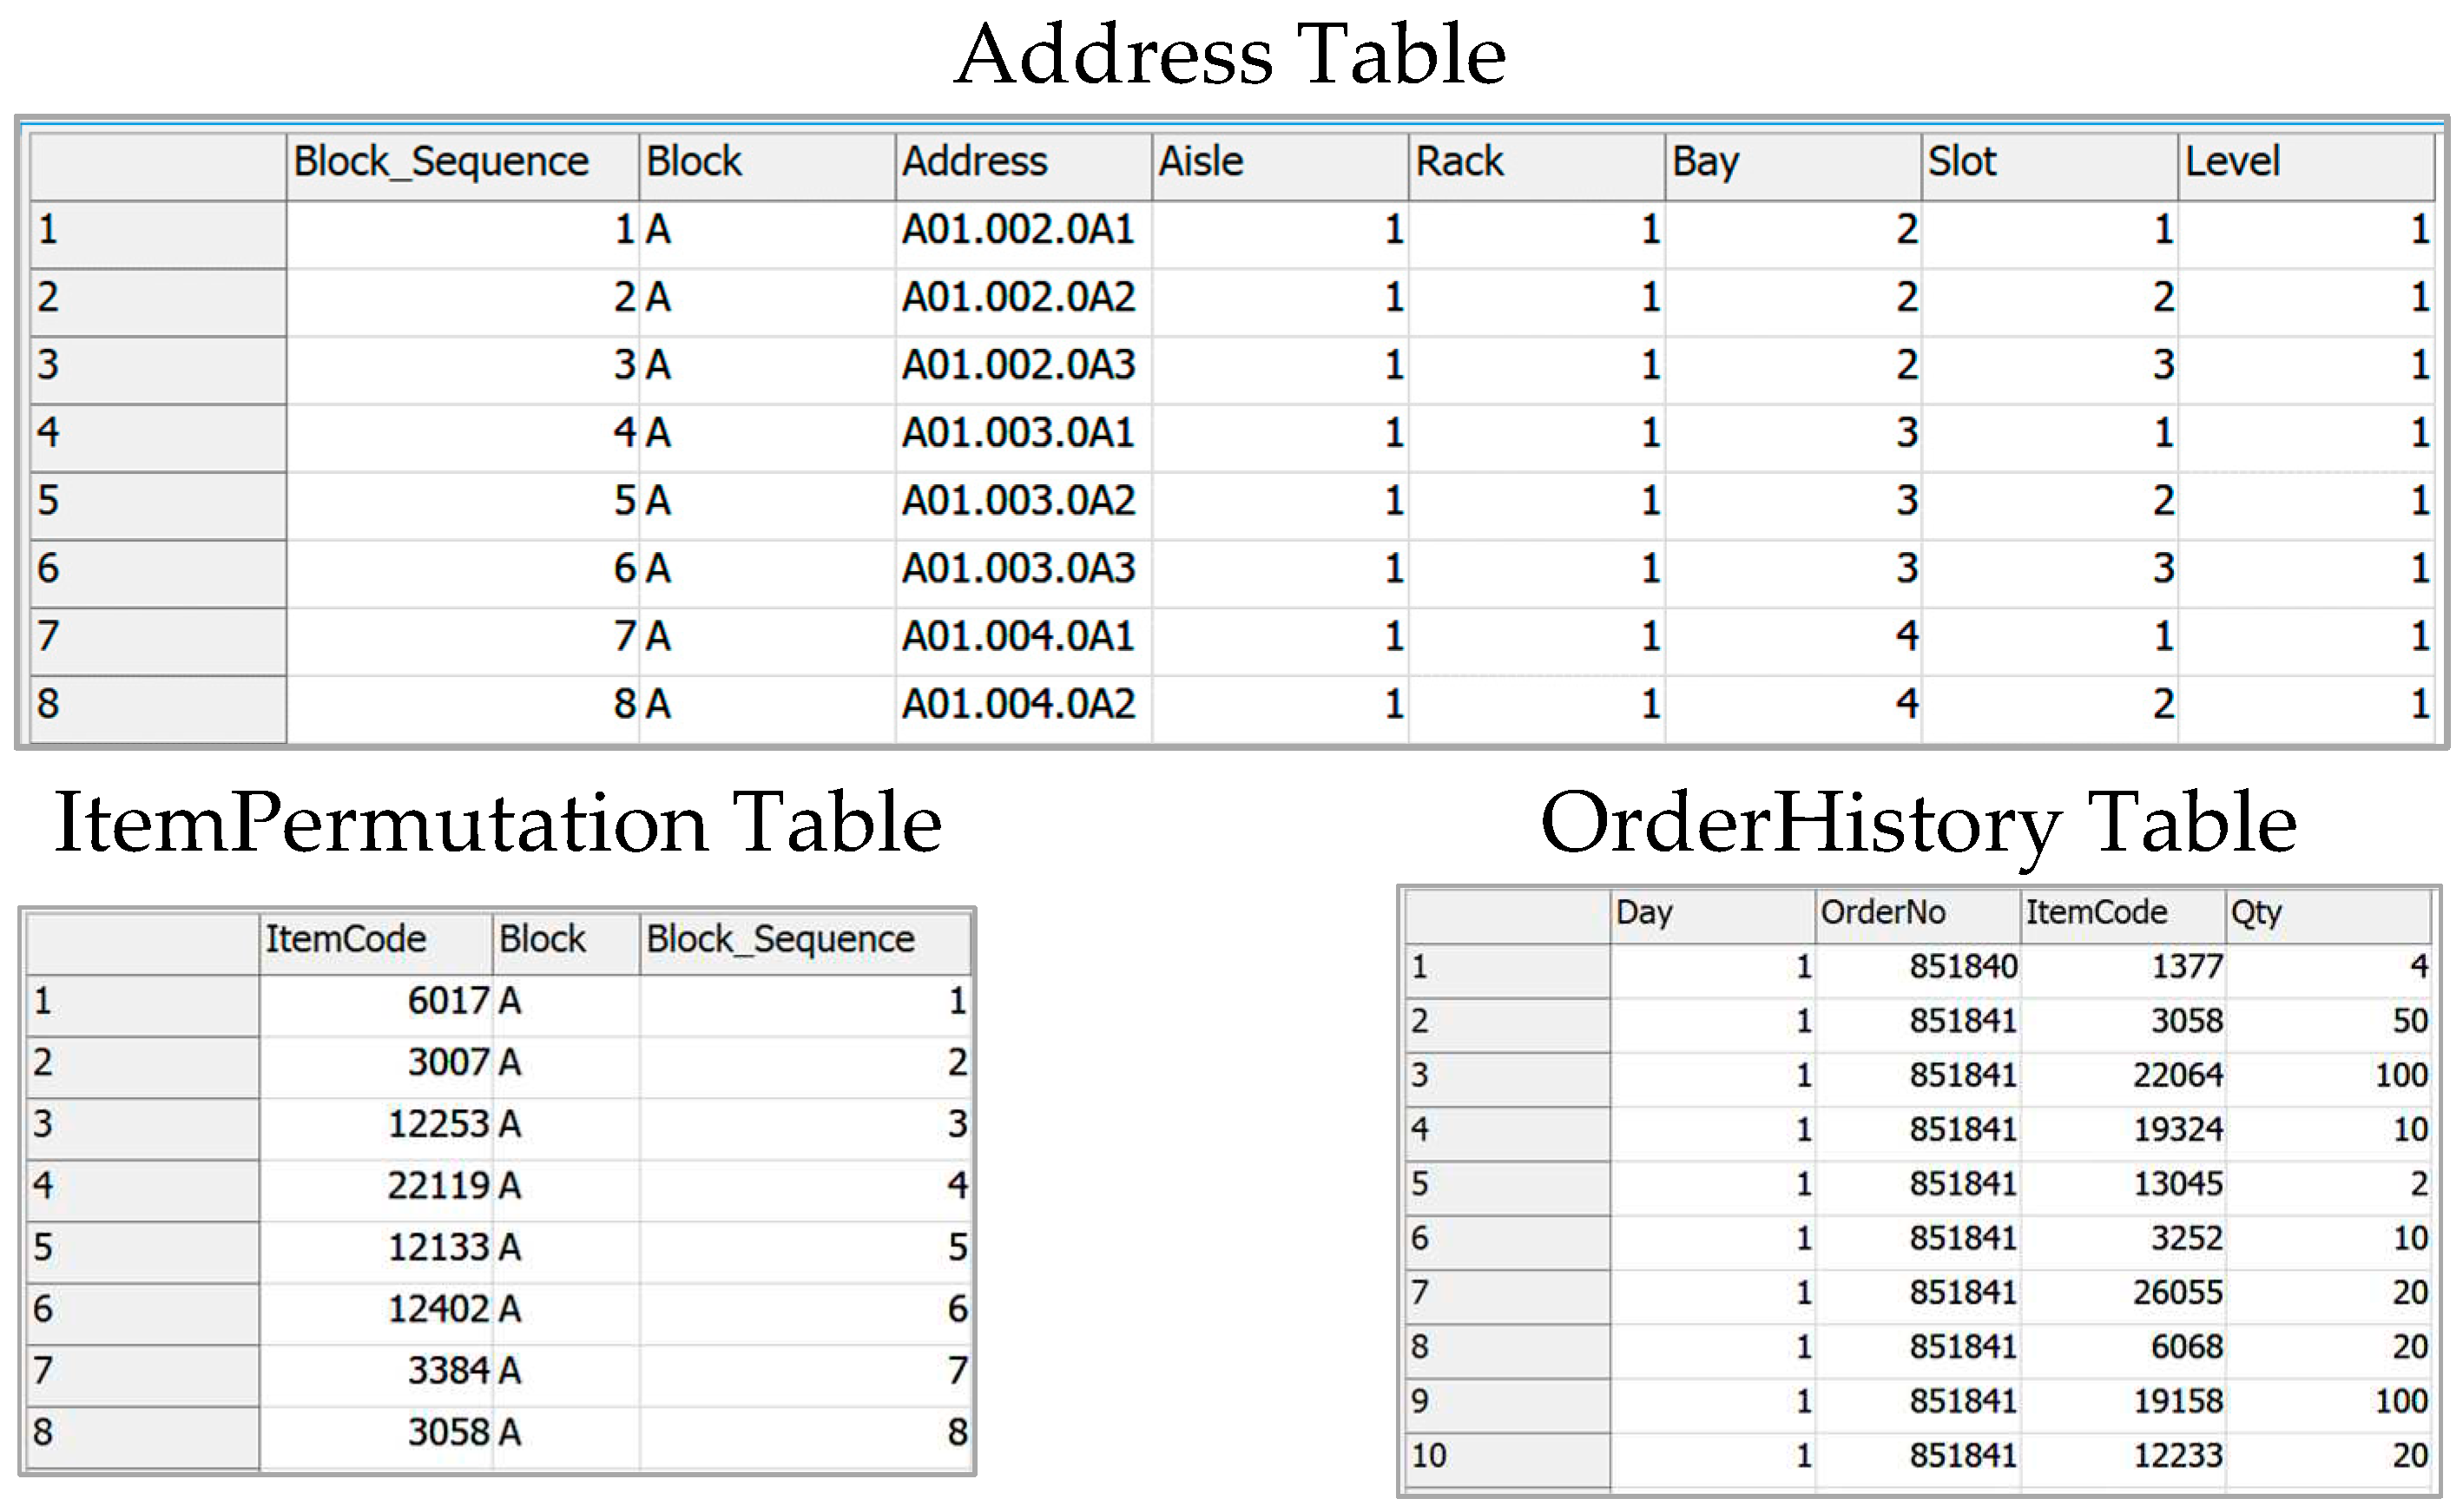
item storage assignment. An essential step in designing our model is generating
dynamic global tables from primary ones during the simulation runtime in order
to incorporate the dynamic aspects of the system and enable experimentations (Figure 7). These tables contain order volumes,
trip-related information, and item locations based on proposed item storage
assignments.
Figure 7.
Primary Global Tables.
Figure 7.
Primary Global Tables.
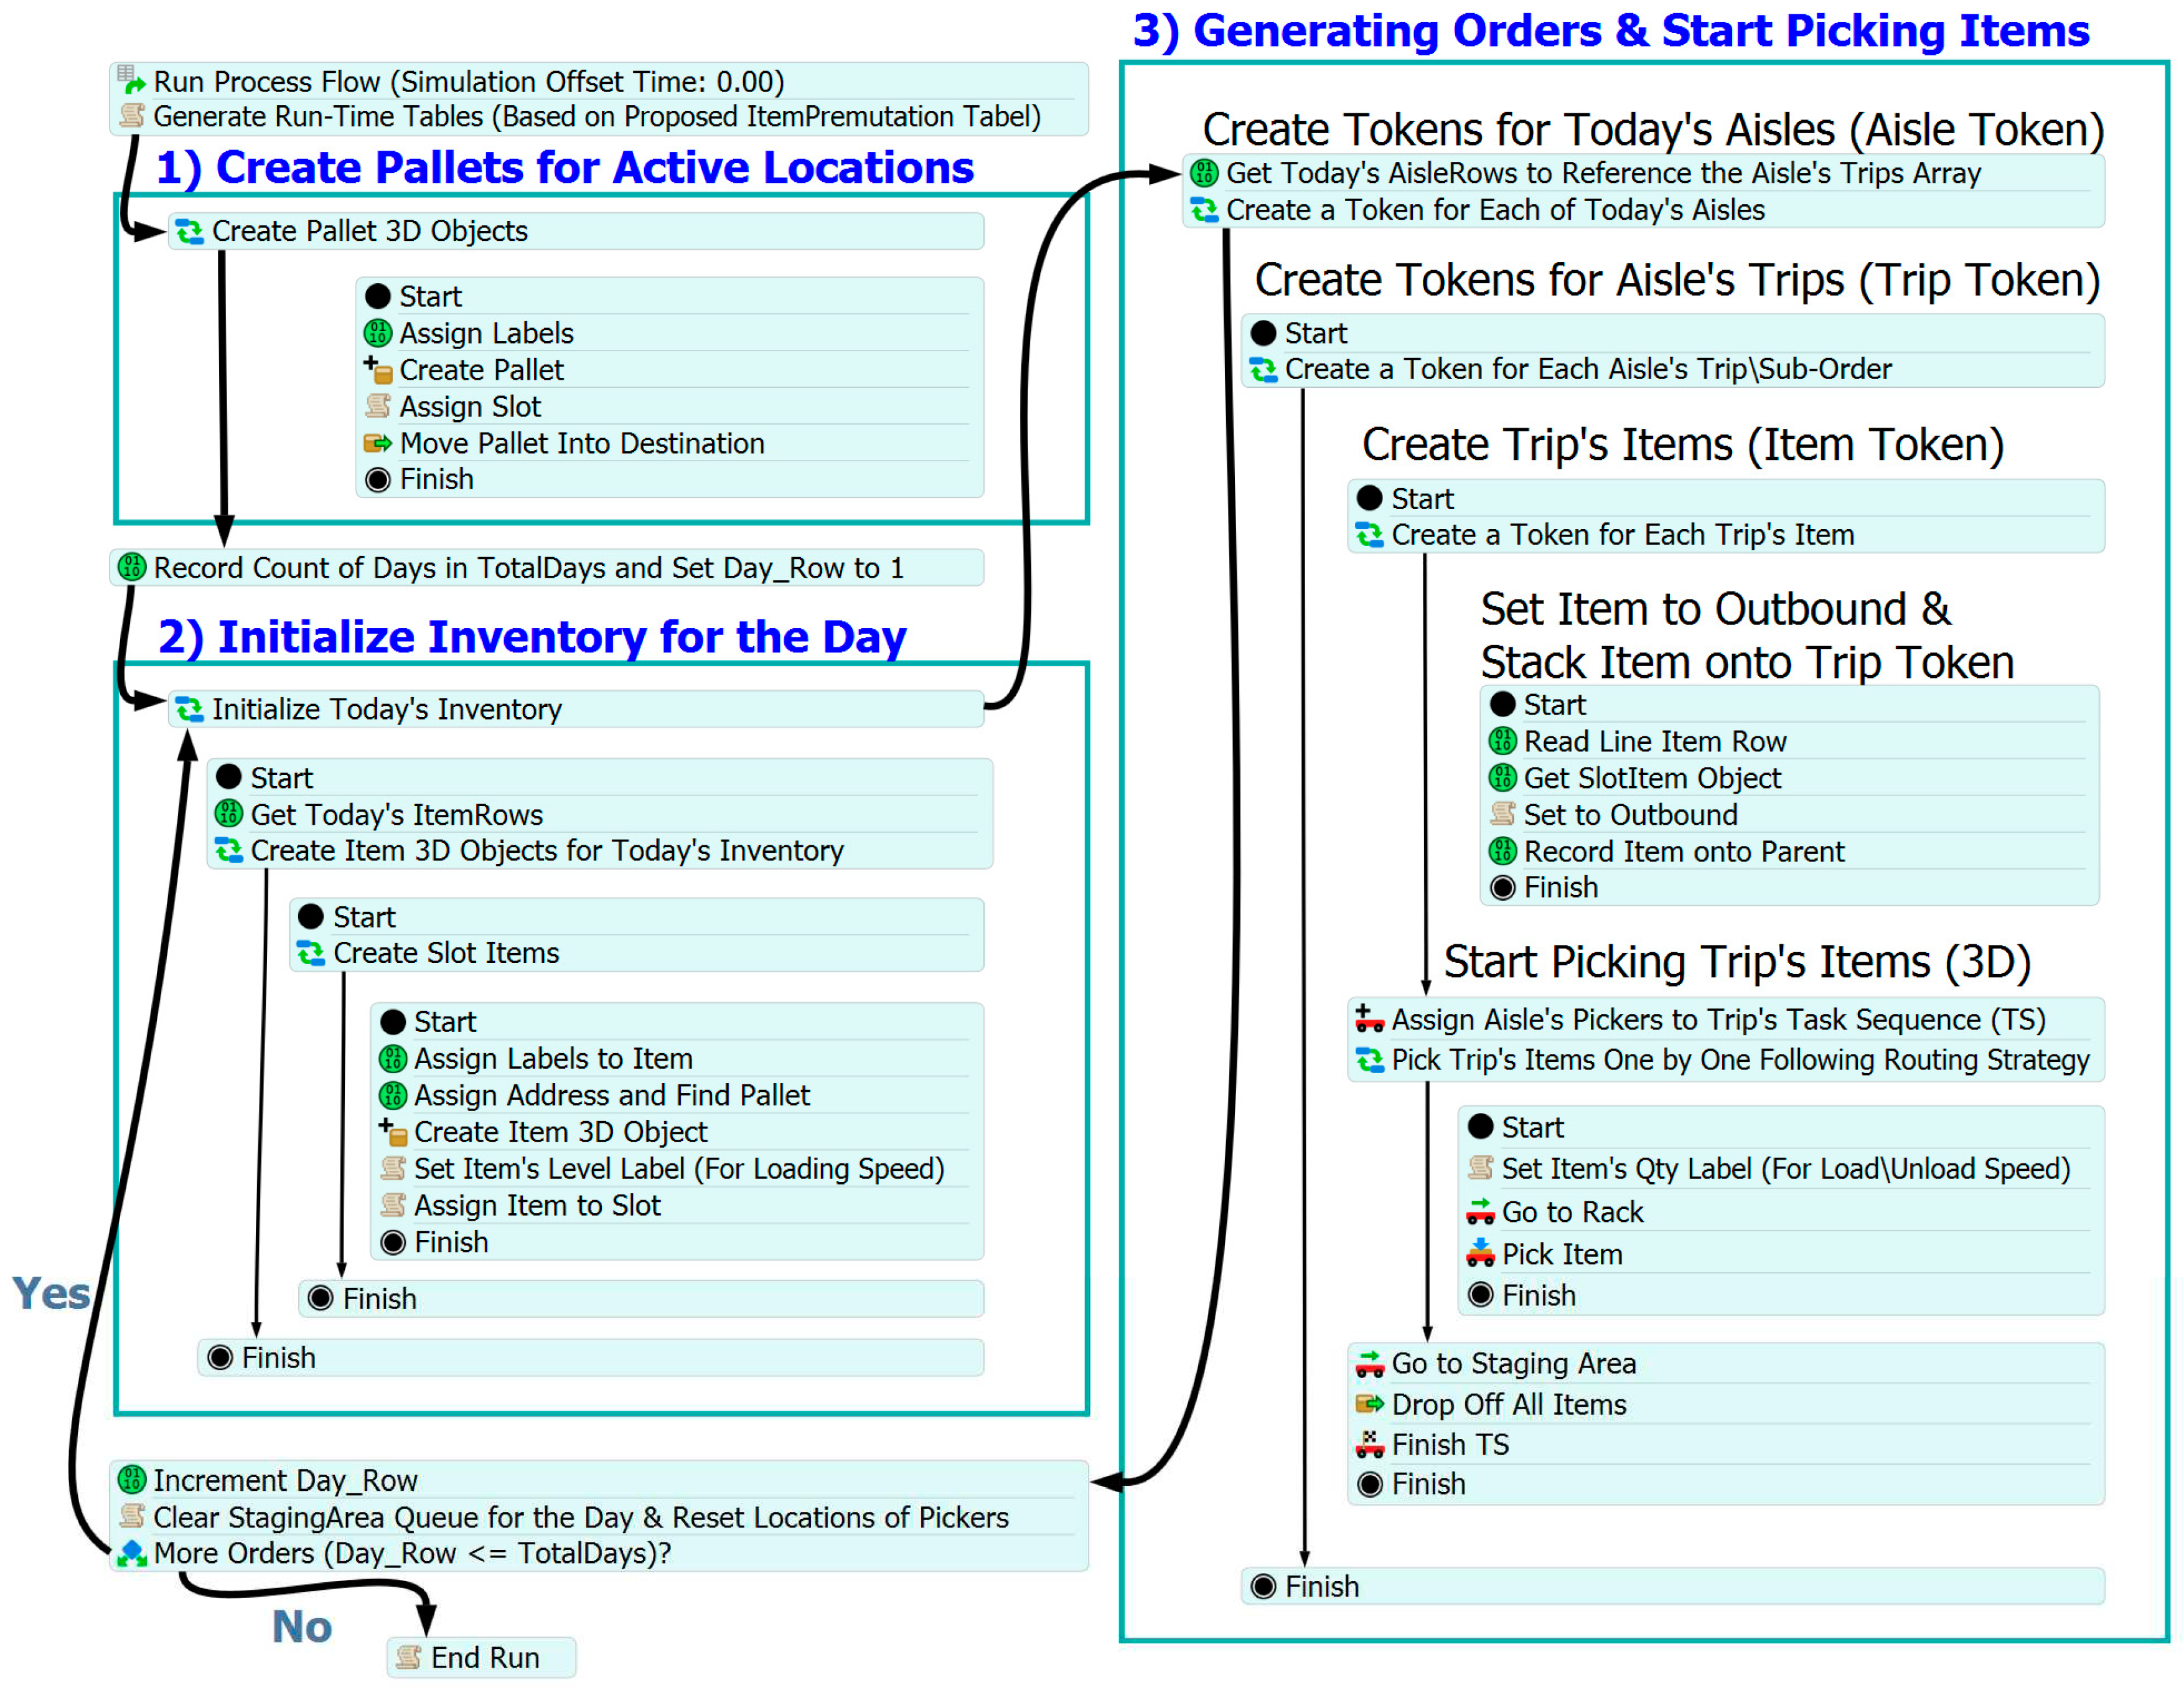
Another essential component is the design includes
the creation of the process flow logic of the picking system that was defined
by composing and coding the activity blocks within the simulation model (Figure 8).
Figure 8.
Process Flow Logic.
Figure 8.
Process Flow Logic.
These activity blocks represent the sequence of
actions and tasks performed in the system such as generating dynamic tables,
assigning picking lists to pickers, finding item addresses, and terminating the
simulation process. Accurately modeling the process flow enables the simulation
of activates based on the dependencies of the model components. Finally, a
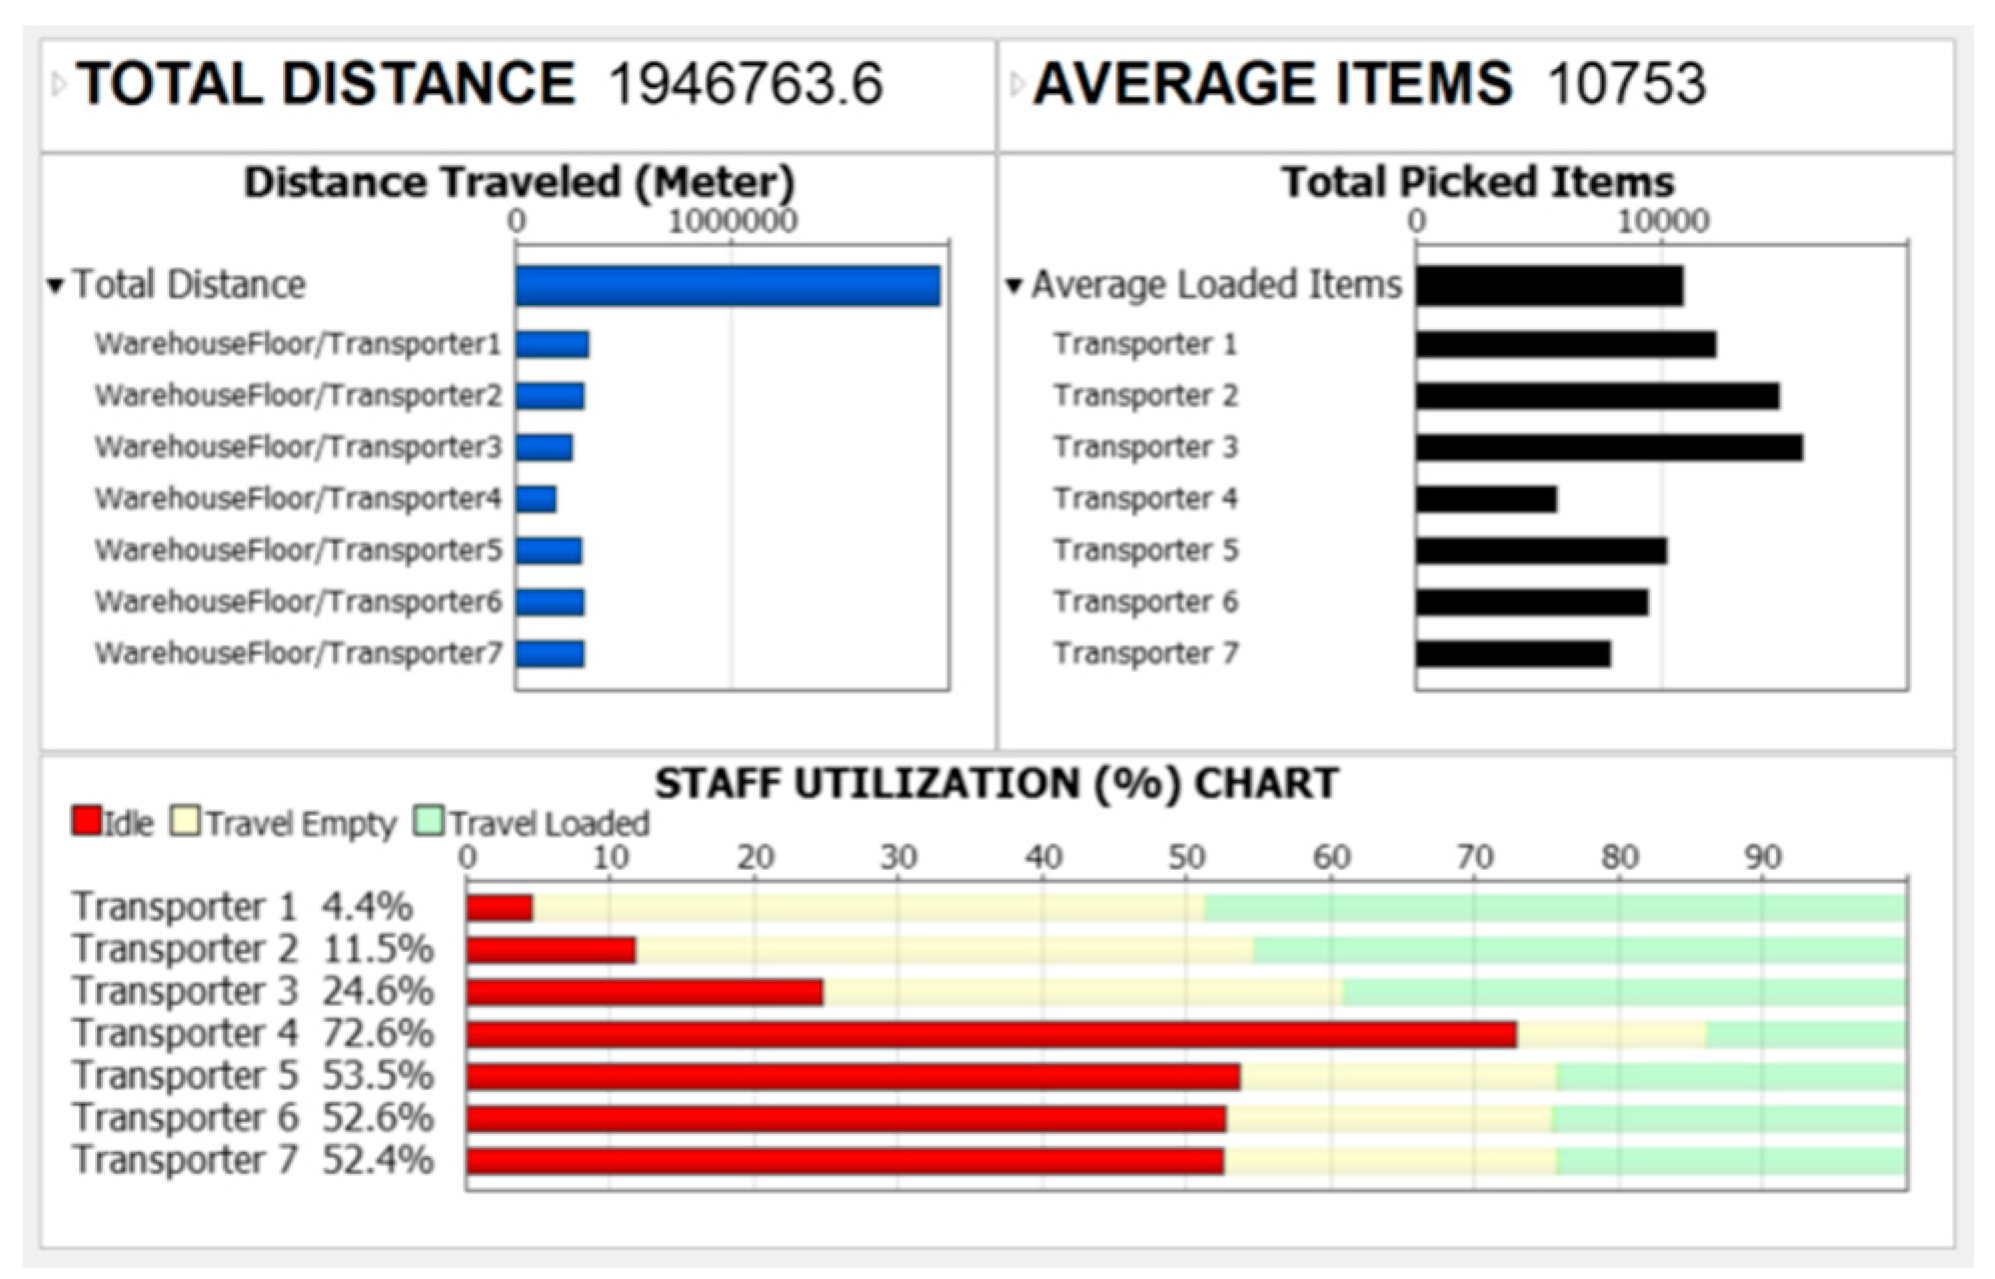
statistics dashboard was constructed within the simulation model to measure and
evaluate the performance of the picking system. The dashboard capture key
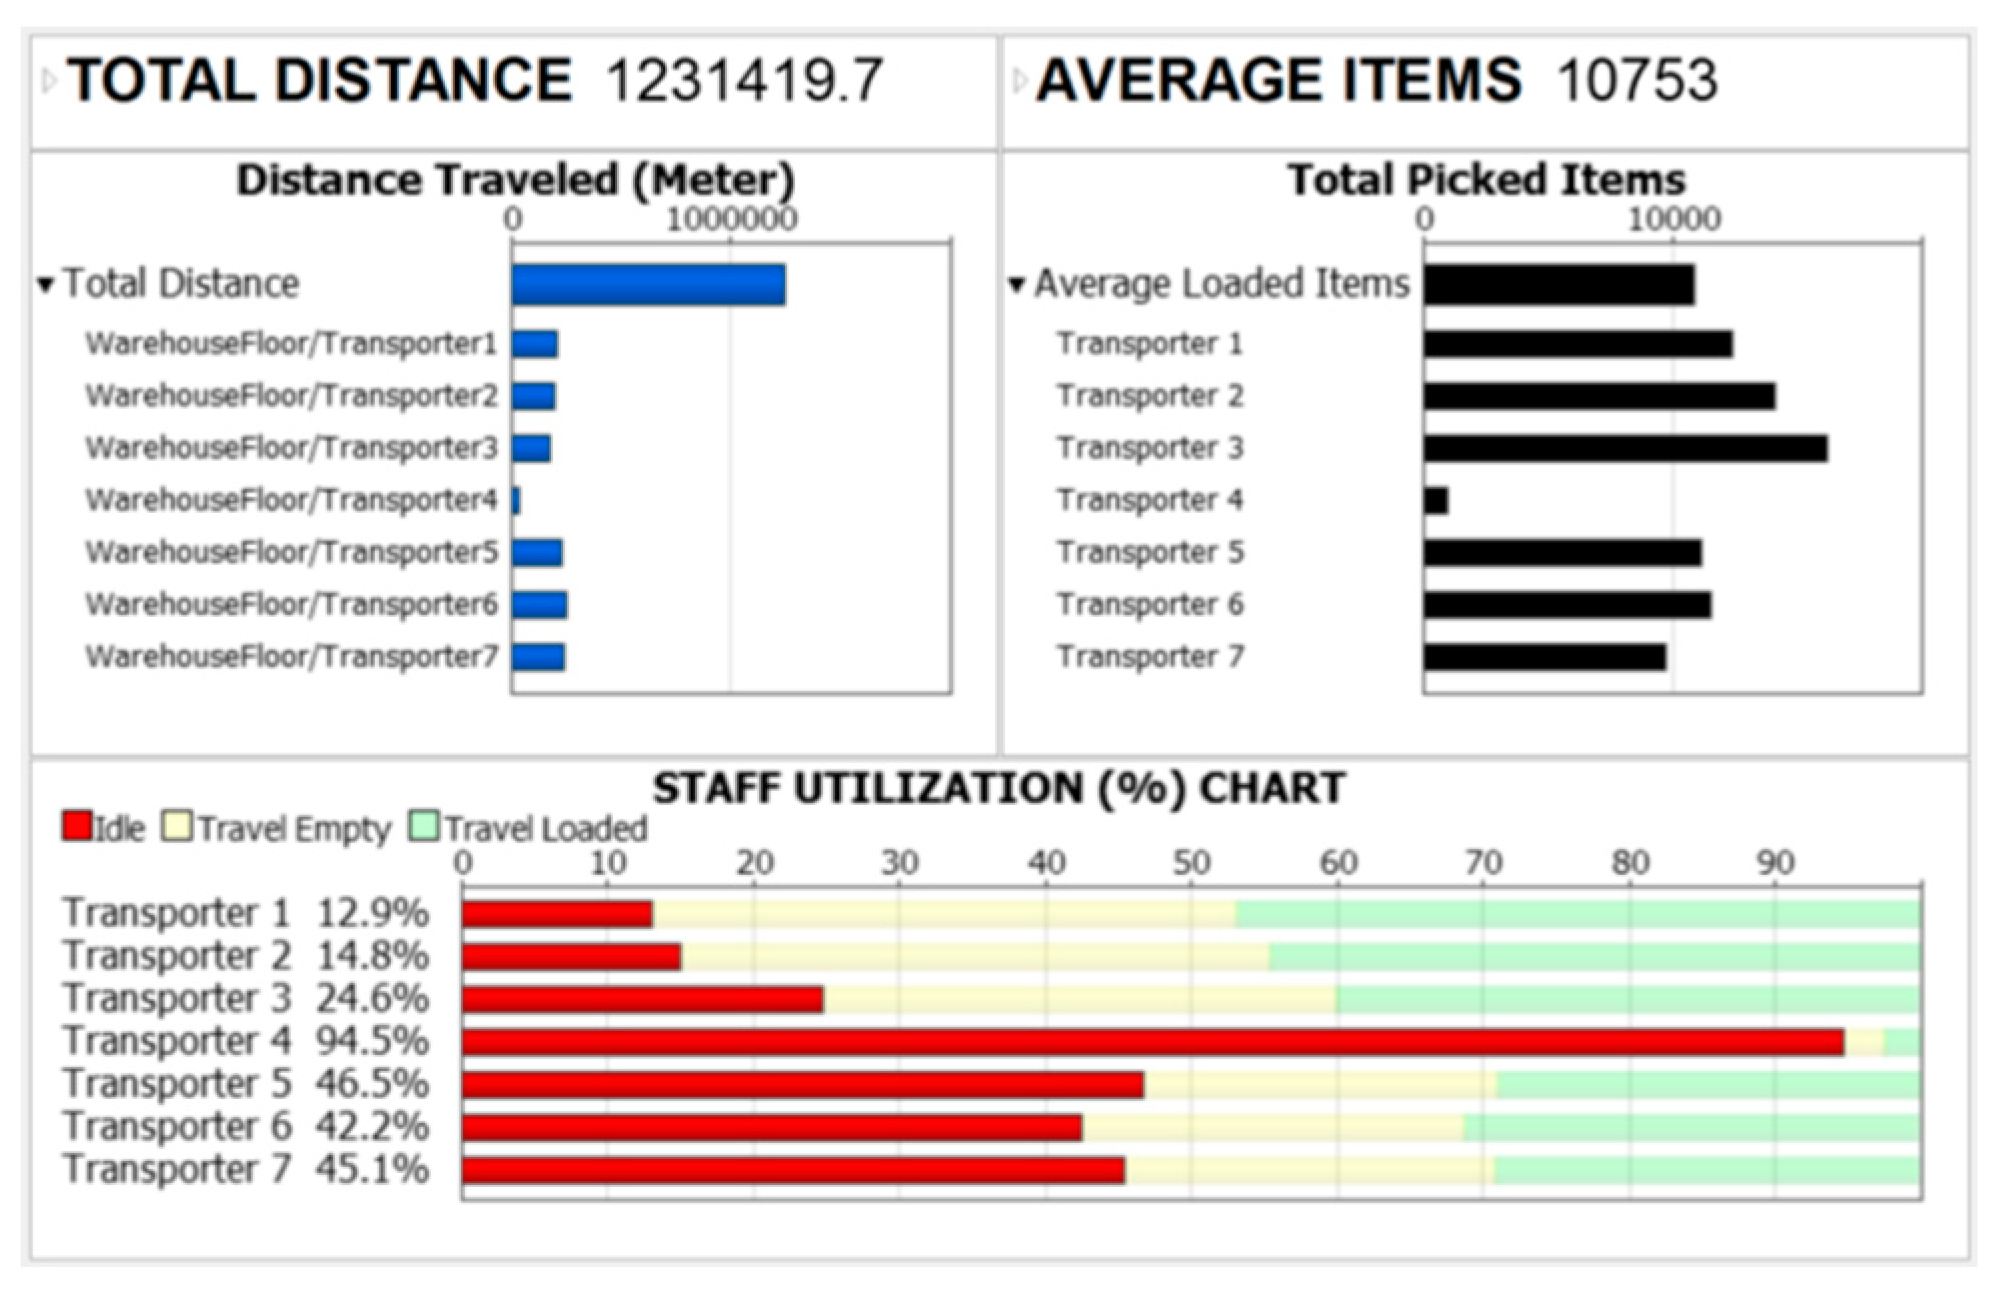
performance indicators such as total travel distance and resource utilization (Figure 9).
Figure 9.
Simulation-Based Statistics (Current).
Figure 9.
Simulation-Based Statistics (Current).
4.2. Mathematical Programming Model
There are various ways to convey a problem
statement and its solution when presenting an optimization model. The common
approach is to express the problem using simplified math equations to provide a
concise representation. However, in this section, we start with presenting the
code in Lingo’s mathematical modeling language. This approach offers several
advantages in terms of readability, usability, and the understanding of the
potential impact of the problem formulation on the solver's performance. This
allows us to include annotations, which can provide additional explanations as
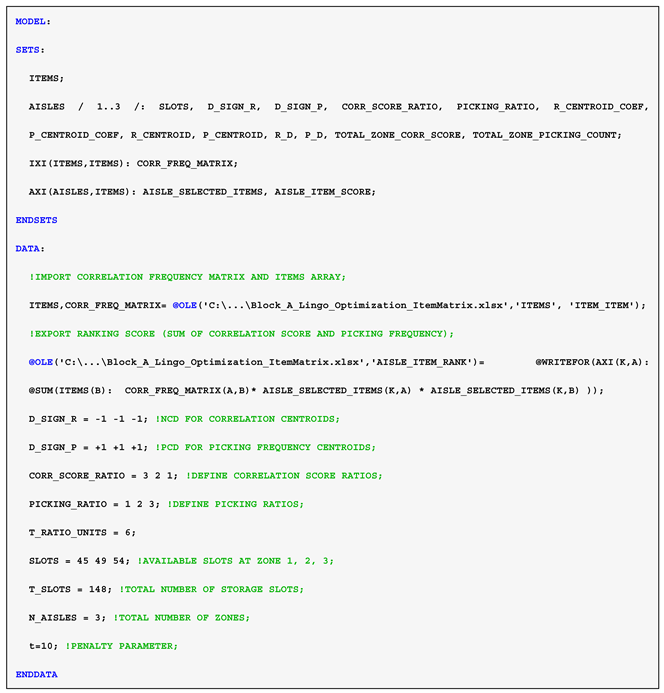
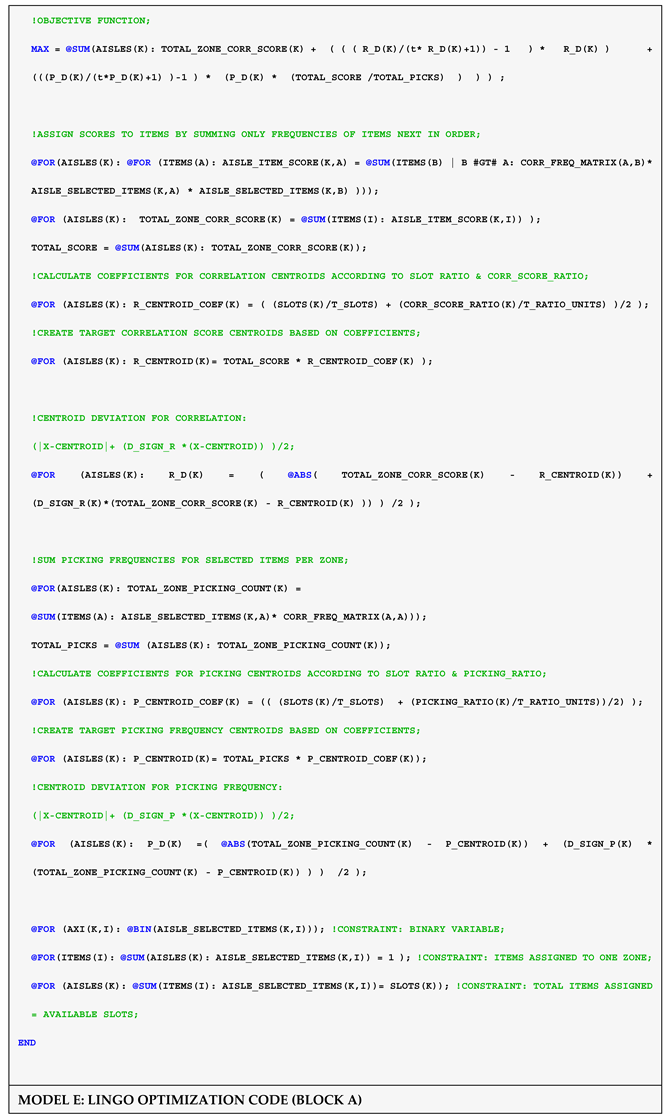
presented in “Model E: Lingo Optimization Code (Block A)”. An MINLP model is
created for each single-block to maintaining the current class-based storage
blocks for fast-moving and slow-moving items while implement the proposed CSAS.
The optimization aims to maximize the total zone correlation score while
penalizing deviations from weighted averages, referred to as centroids in this
model. By defining centroids from achieved total correlation score and total
picking frequency based on ratios, we can conduct scenario analysis to examine
their influence on travel distance optimization. To better measure deviation
from centroids and refine the objective function, we have introduced the
utilization of PD and ND as a more effective alternative penalty terms for
achieving targets. These measures aim to address the positive or negative
sources of deviation, particularly to prohibit it from increasing beyond or
below a target. The purpose of this approach is to quantify the feasible
solution to allow for better comparison against other states while approaching
the target from the opposite side of deviation. By incorporating deviation
penalty terms, we can expedite convergence towards maximizing the objective
function that ultimately lead to higher total correlation score in addition to
achieving specific targets.
In mathematical programming models, the positive or negative deviation is commonly defined through logical conditions, or employing functions that determine the maximum or minimum value between the deviation result and the zero value since, to the best of our knowledge, there is no standard formula available to measure this deviation. However, when dealing with optimization problems, the solvers translate the formulation into a mathematical representation. Therefore, to facilitate the calculation of these deviations and promote better convergence, we have employed the following simple formulas that enable the quantification of positive centroid deviation (PCD) and negative centroid deviation (NCD) for achieved score (x) and a targeted centroid (C):
To further refine our model, we incorporate a derivative-based deviation penalty term (P) that penalizes the deviations for each zone. The penalty parameter (t) adjusts the weight of the penalty term, striking a balance between maximizing the total correlation score and enforcing the desired weighted centroids per zone. We calculate the penalty (P) as a function of D, where (D) represents the PCD or NCD and (t) denotes the penalty parameter as presented in equation [3]:
By setting (t) to 10, the penalty approaches (for larger deviations, resulting in higher accuracy for targeted ratios compared to setting (t) to 2, and the model converges in less solving time compared to using the absolute deviation measure. On the other hand, if we set (t) to 2, the solving time decreases and the objective function achieves higher correlation scores as the penalty term approaches ( due to reduced penalization. Although it may seem that the term can be replaced by a fixed percentage, it actually plays a crucial role in expediting convergence. For instance, when solving one of the proposed scenarios in Model B with (t) set to 2, the solving time is 10 minutes and 53 seconds. However, replacing the term with ( ) increases the solving time to 27 minutes and 5 seconds, which is 2.5 times slower. It's important to note that both solutions are identical, but the difference in solving time demonstrates the formulation impact of the penalty term on the solver’s performance. Overall, incorporating the penalty term with an appropriate penalty parameter allows us to fine-tune the model's performance, achieving targets while optimizing solving time.
In this section, we introduce Model E, which has been developed to assess the effectiveness of implementing CSAS in optimizing travel distance within an order picking system that utilizes a zoning strategy. The model incorporates weighting coefficients to guide convergence towards targeted correlation scores and picking frequencies. By adjusting the ratios of targeted centroids, the model enables customization of item correlation distribution across zones, effectively balancing workload according to different desired customizations. The primary objective of the model is to achieve various local optimal solutions based on these defined coefficients, maximizing item correlation per zone and consequently increasing the average order size. To further increase the average order size in distant zones, we propose reducing the total picking frequency of items in these zones. This can be achieved by prioritizing the placement of items that collectively exhibit higher correlation and lower picking frequency in distant zones. Such approach effectively reduces travel distance by minimizing the need for frequent travel to the depot, thereby optimizing the picker's travel distance. In the result section, we present several scenarios to analyze the model's performance by testing different parameter configurations. For instance, in a system with three zones where the first zone is the furthest from the depot, setting the correlation score ratio for the coefficients to 3:2:1 and the picking frequency ratio to 1:2:3, as in scenario fourteen, enables the model to find a local optimal solution that satisfies these criteria. This leads to larger average order sizes in distant zones, ultimately minimizing travel distance. To quantify deviations from the targeted centroids, the presented models employ penalization using either the PCD or the NCD. In Model E, NCD is applied for all correlation centroids, while PCD is applied for all picking frequency centroids. This arrangement allows correlation scores to surpass the defined centroids, but restricts picking frequency centroids from exceeding their targets. However, it's important to note that setting extreme ratios and unattainable centroids may render this configuration unachievable. In such cases, when extreme targets are set, the model penalizes multiple targets and leans towards maximizing the total correlation score.
Here is the mathematical representation of Model B, D, and E:
The objective function in equation [4] aims to maximize the sum of item correlation score
for each zone
, while considering deviation penalty terms
and
, calculated using equations [10] and [11] respectively. For every zone
, the deviations
and
in the penalty terms are calculated by equations [12] and [15] for the achieved item correlation score
and the picking frequency
. These penalty terms account for the zone's correlation centroid
and picking centroid
, based on the deviation types
and
that are defined for each zone. These terms are formulated using acceleration convergence technique, with a penalty parameter
set to 10 in Model E, resulting in approximately 90% penalization for each deviation. The decision variables
in equation [5] are binary constraints representing the assignment of each item
to a zone
as in equation [9]. We ensure that the sum of
for all zones
is equal to 1 for every item
, restricting each item to be located in only one zone. This constraint is expressed in equation [6]. Furthermore, the sum of
for all items is constrained by the value of
for each zone
, as indicated in equation [7]. It should be noted that in the "E" model, the exported result for "Aisle_Item_Rank" is a combination of the item's correlation score and its picking frequency. This approach, referred to as method A, which was used initially for item ranking within zones. However, the presented results in
Table 1 for scenarios under Model E demonstrate the incorporation of method C. This method takes into account the average order size that is calculated from the order history data. Furthermore, an acceleration technique, which was previously used by Kuo et al. (2016) in their model, is incorporated in this model. This technique involves calculating the item correlation only once for two correlated items, resulting in a more efficient computation process. As a result, the total zone correlation score achieved in the model represents half of the actual zone correlation score, as shown in
Table 1. In this paper, however, the item correlation used in formulas for item ranking is defined as the sum of correlation frequencies for all items located in that particular zone.
5. Optimization Result Analysis
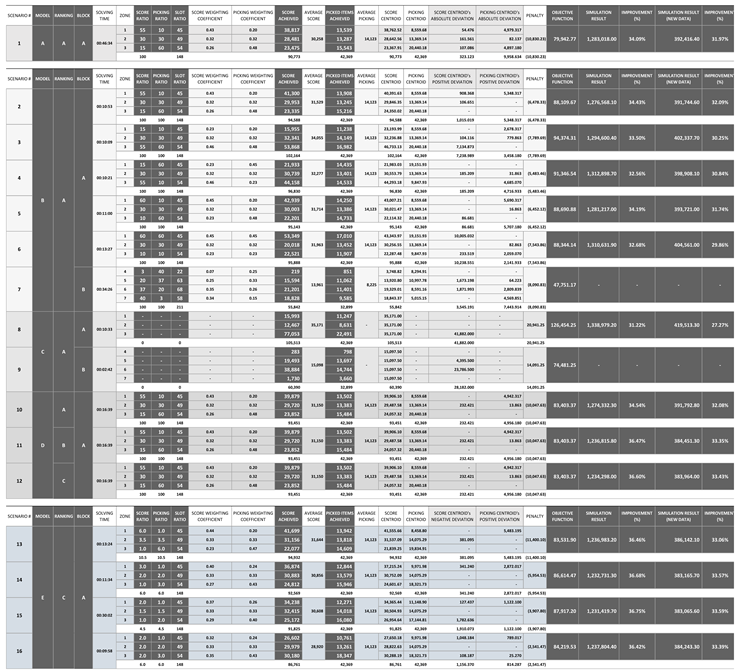
In this section, we present a comprehensive analysis of our integer, non-linear model, which incorporates the branch-and-bound solver. Since sensitivity analysis methods are not suitable due to the absence of continuous variables, the use of heuristic procedures including the solution sensitive to the solver configurations, we have adopted a scenario analysis approach to explore the behavior of our model under different parameter variations, as shown in
Table 1. Our model is designed to find multiple solutions based on specific parameter values. These parameters effectively guide the model towards convergence, with the assistance of penalty terms that further contribute to defining the optimal local solution. Therefore, to evaluate the performance and robustness of our model, we conducted a scenario analysis by varying these parameters. The analysis provides insights into the impact of these variations on the travel distance performance and overall efficiency. By exploring multiple configurations and scenarios, we aim to enhance our understanding of the key factors influencing the travel distance optimization for real-world applications. In
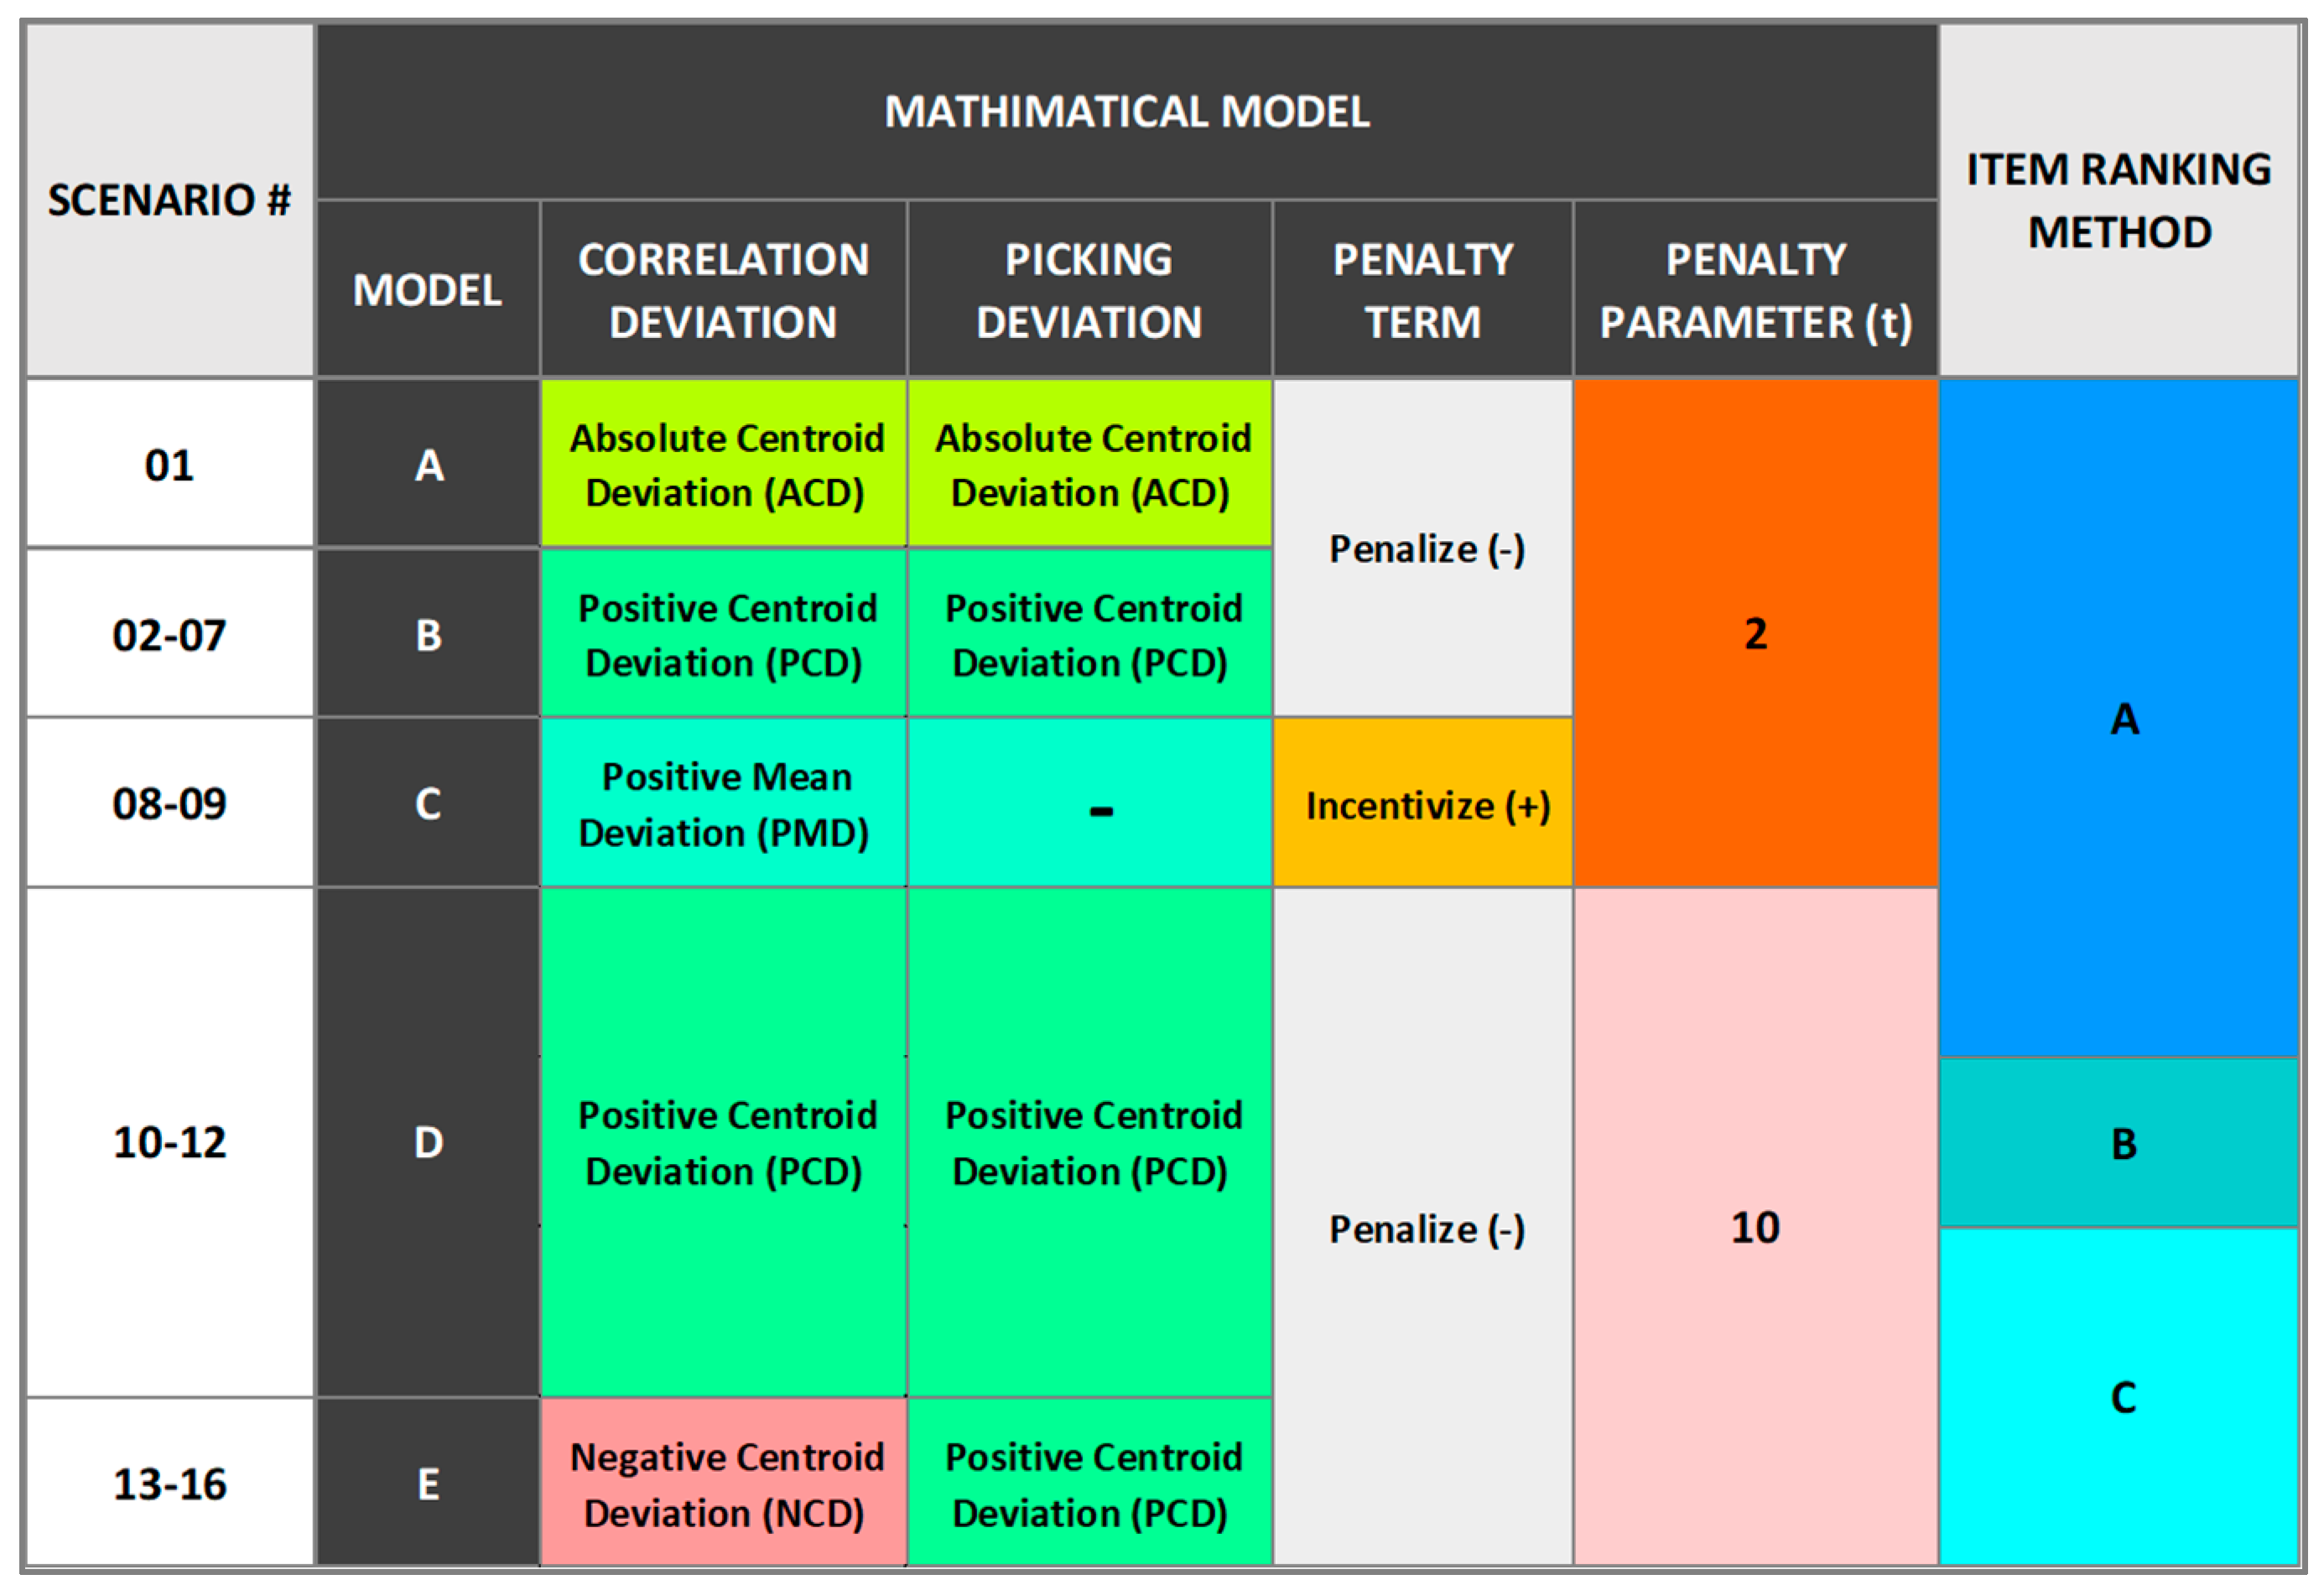
Figure 10, we summarize the configurations of 16 scenarios across models A to E, providing an overview of the type of deviation and value of the penalty parameter used in each scenario. The summary provided in
Table 1 presents a comprehensive overview of the optimization results for each of these scenarios. It showcases the performance on fitted data as well as recent data. By validating the optimization process against both datasets, we can determine the effectiveness and sustainability of the model.
The results demonstrate the performance achieved for these various scenarios in terms of travel distance (simulation results), optimization solving time, and the influence of defined ratios for achieved total picking frequency and total score on the travel distance optimization. The mathematical model suggests assignments for items within zones without explicitly prioritizing them. However, our research paper explores different approaches to ranking items. The following list represents the ranking methods that we implemented within our scenarios:
Ranking Method A is the sum of item correlation
and item picking frequency
for item
in a particular zone
:
Ranking Method B involves calculating equation [20] for ranking an item
in a particular zone
:
Ranking Method C for an item
involves calculating equation [21] for all orders
in the order history binary matrix
to determine the order size in the newly generated suborders with the optimization selection
of all items denoted by
in a particular zone
:
It's important to note that method B for item ranking takes a similar approach as method C in optimizing item placement by using an efficient calculation in terms of computation time. Both methods determine the item rank based on frequency and item order size. It’s worth noting that the value resulting from dividing the sum of total item correlation score and item frequency of picking by item frequency of picking is equivalent to the item average order size as presented in equation [22]:
Therefore, the ranking formula used for method B can be seamlessly integrated into optimization models and provides an efficient alternative to the optimal item ranking approach employed by method C. By prioritizing frequently requested items with little to no correlation with other items, the item ranking for method B and C places them closer to the depot, thereby minimizing travel distance. This strategy proves advantageous compared to scenarios where these items are placed further away, beyond other correlated items with the same total picking frequency. For example, let's consider 100 orders of size one for item A and 100 orders of size three for items B, C, and D. Moving item A further from slot number one to slot number four would increase the distance by 300 distance units (assuming one slot equals one distance unit). On the other hand, moving items B, C, and D closer by one slot would collectively decrease the distance by 100 distance units because these items are picked together for each order in one trip. Hence, item A must be prioritized over other items of higher average order size unless they achieve higher picking frequency that compensates for the difference, specifically ≥ 300 orders for B, C, and D. Therefore, calculating item ranking based on the average order size proves to be more effective in optimizing item placement. In the following specifications, we provide details for all models in
Figure 10:
Model A: Scenario no. one (Block A) implements Absolute Centroid Deviation (ACD) to penalize the objective function with a penalty parameter (t) of 2, and item ranking method A. In order to compare the performance result with scenario no. two (Model B – Block A), the optimization for this scenario was combined with the optimization selection of items for scenario no. seven (Model B – Block B)
Model B: The scenarios under this model implement PCD to penalize the objective function for all centroids, using a penalty parameter (t) of 2, and item ranking method A. This model includes a set of 6 scenarios with variations of ratios as shown in
Table 1. Scenario no. two achieved better result in terms of travel distance optimization compared to other scenarios under the same model. It has the same ratios as scenario no. one (Model A). In comparison, the results in
Table 1 demonstrate that scenario no. two is 4.5 times faster in terms of solving time, achieved higher total correlation scores, and slightly better travel distance optimization. All scenarios (Block A) in this model are combined with the optimization selection of items for scenario no. seven (Model B – Block B).
Model C: This model utilizes Positive Mean Deviation (PMD) for the correlation score centroids to incentivize the objective function and maximize the total correlation. The penalty term’s sign is reversed, and the model does not impose any restrictions through ratios. The centroids in this model represent the mean, and the item ranking method A is used. Two scenarios are presented in
Table 1 for Block A and Block B. The performance result presented for scenario no. eight (Block A) represents the combination of both. It is worth noting that scenario no. two (Model B) outperforms scenario no. eight in terms of travel distance optimization, despite the decrease in the overall item correlation achieved. This can be attributed to the process of order splitting that is resulting in a greater number of trips when the optimization of item assignment is solely based on item correlation frequency.
Model D: This model applies PCD to penalize the objective function with a penalty parameter (t) of 10, and item ranking method A. Compared to scenario no. two (Model B), which utilizes a penalty parameter of 2, scenario no. ten achieves a slightly better travel distance optimization and closer results to the targeted centroids. However, it is slower and achieves a lower total correlation score. The results for scenario no. ten are combined with the optimization selection of items for scenario no. seven (Model B - Block B). Additionally, scenarios no. eleven (item ranking method B) and no. twelve (item ranking method C) outperform scenario no. ten in terms of travel distance optimization.
Model E: The scenarios under this model combines NCD for correlation score centroids and PCD for picking frequency centroids to penalize the objective function with a penalty parameter (t) of 10, and item ranking method C. The results for the four scenarios (Model E - Block A) that implement different defined ratios are combined with the optimization selection of items for scenario no. seven (Model B - Block B). This model aims to better guide the convergence toward the targeted centroids for correlation scores and picking frequency, which are positively correlated. While the correlation scores can increase beyond the targeted centroids by penalizing only negative deviations, the picking frequency can be distributed across zones to minimize the total deviation by avoiding exceeding the defined targeted centroids. Despite our attempt to implement the model with the same ratios as scenario no. one to compare the results, the optimization process did not reach a local optimal solution within several hours before terminating the process. However, a feasible solution was obtained within few minutes. Finding the local optimal solution for these ratios appears to be challenging in this model. However, the feasible solution, which was not included in results, closely achieved the targets for correlation scores.
Among the evaluated scenarios, scenario no. fifteen in model "E" stands out with a remarkable reduction of 36.75% compared to the current system, as in
Figure 11. The choice of correlation score and picking frequency ratios in this scenario are specifically defined to optimize the travel distance for a system of three zones. This is achieved by prioritizing higher average order sizes in distant zones resulting in fewer trips for zones located farther away from the depot.
This scenario utilizes correlation score ratios of 2:1.5:1, which means that 44.44% of the high-correlation items are located in the first zone (furthest zone), 33.33% on moderately correlated items, and 22.22% on low-correlation items. In addition, the picking frequency ratios of 1:1.5:2 is implemented to determine the priority of item selection based on their frequency. This ratio implies that 22.22% of the emphasis is on low-frequency items are located in the first zone (furthest zone), 33.33% on moderately frequent items, and a significant 44.44% on high-frequency items. It is important to highlight that the weighting coefficients for these ratios have been appropriately adjusted based on the item slots available for each zone to moderate targets accordingly, as presented in Lingo's code (Model E – Block A). By combining these ratios, model "E" aims to achieve several objectives. Firstly, it encourages larger average order size by prioritizing high-correlated items to low-frequency items in distant zones. This reduces the number of required trips, resulting in improved efficiency. Secondly, the model seeks to increase the number of trips for items with low correlation in the closest zones to the depot. This strategy helps in minimizing order splitting and optimizing the overall picking process in terms of travel distance. To evaluate scenario no. fifteen, we analyzed a recent order history spanning 148 days, which resulted in a reduction percentage of 33.59%. This indicates that the model has been effective in achieving sustainability. It is important to note that while the correlation score can dynamically increase to achieve the desired targets, the total picking frequency for all items remains constant. Furthermore, the model has shown solid results and provided insights for optimizing the travel distance; however, it is still considered in the experimental stage. The ratios proposed in this case study may not be optimal for scenarios with imbalanced slot distributions across zones. For instance, the ratios presented for scenario no. seven (Model B - Block B) specifically address the shortage of available slots in zone no. four, which is the closest to the depot. Despite attempts to optimize travel distance by using ratios such as 1:2:3:4 for the correlation score and 4:3:2:1 for the picking frequency, the results did not surpass the selected ratios presented in
Table 1 for scenario no. seven. This was the case even after considering slot availability and adjusting the weighting coefficients for all zones. This because attempting to assign correlated items in zone no. four, which only has approximately a third of the available slots compared to any other zone in block B, would cause order splitting and additional trips to other zones. On the other hand, reducing the correlation score to the minimum value and increasing picking frequency for zone no. four allowed for larger average order sizes in distant zones that had enough slots to accommodate different combinations of correlated items that are frequently found in customer orders. Ultimately, this approach reduced the overall number of trips required. Therefore, it is recommended to place the most frequently ordered single-items in the zones closest to the depot, especially when there are fewer available slots.
6. Conclusion
In this paper, we employ a methodology to demonstrate that maximizing the correlation among items to optimize the storage assignment is not the only factor in order to minimize the travel distance. We have successfully implemented the CSAS by adopting an approach that aligns with the zoning system and incorporating an item ranking method that accommodates both single-item and multi-item orders within each zone. Our approach highlights the importance of considering the average order size based on distance from depot as a crucial factor, surpassing the sole reliance on maximizing the total item correlation per zone. By doing so, we are able to achieve better results in terms of travel distance optimization by minimizing trips in distant zones and decreasing order splitting. Additionally, our methodology offers flexibility to customize the assignment of correlated items based on real-world scenarios, ensuring adaptability and practicality in diverse operational contexts. It is crucial to acknowledge the challenges associated with achieving specific item distribution based on correlation and frequency. We initially attempted to incorporate distance-based soft constraints in our MINLP model to prioritize the placement of high-correlation to lower picking frequency items in distant zones. This involved assigning lower reward factors for placing such items for nearby zones in the objective function, while increasing the reward for their placement in distant zones. However, the model overcompensates and does not converge according to our targets. Furthermore, in our proposed model, defining ratios posed initial difficulties in achieving the desired outcome, particularly when dealing with extreme reverse ratios. That was mainly due to the positive correlation between the correlation score and picking frequency, coupled with the preference for maximizing the total correlation score rather than enforcing desired weighted centroids per zone. To address these challenges, we have implemented PCD and NCD penalty terms. These penalties aim to address the positive or negative sources of deviation, particularly to prohibit it from increasing beyond or below a target. It is important to note that the solution obtained by the solver is highly dependent on various configurations, such as type of derivatives used and other selected heuristic procedures. As a result, the solutions can vary in terms of solving time and the achieved objective function.
In this study, we evaluate sixteen scenarios under five optimization models (Models A to E) for implementing the CSAS. Our models are evaluated based on factors such as travel distance, total correlation score, and item picking frequency in order to optimize the order picking process. Scenario no. fifteen found to be the most effective, achieving a reduction of 36.75% compared to the current system. It prioritizes high-correlation items and low-frequency items in distant zones, promoting larger order sizes and reducing travel distance for these zones in contrast to closer ones. The presented results validate the effectiveness of the optimization models using both fitted and new datasets. The proposed approach for implementing the CSAS minimizes the travel distance by penalizing the objective function with the use of PCD and NCD penalty terms and a parameter of 10, ranking items based on their average order size using method C, and finally prioritizing higher ratios of correlation score to picking frequency for distant zones. For ranking items within zones, method C is found to be the most optimal. However, method B, which also considers the item average order size, is more efficient in terms of computation time. Both methods can be applied as a direct approach for optimizing the travel distance in a single-zone order picking system. Therefore, we recommend further research to test this proposed approach, providing insights into its advantages in terms of computational efficiency and optimality for both single and batch order picking systems. Additionally, we recommend further analysis for optimizing the travel distance using different datasets to address scenarios with imbalanced slot distributions across zones in a multi-zone system. Our proposed model considers the impact of higher correlation scores to lower picking frequencies while aiming to achieve larger average order sizes in order to prioritize the placement of these items in distant zones. This methodology is achieved by explicitly defining ratios of the proposed targets. With additional analysis to investigate imbalanced slot distribution using different datasets, this model can be improved to incorporate dynamic convergence techniques without the explicit need to define these ratio. The model could be developed to dynamically adjust the weighted centroids, taking into account their respective impacts on selecting items that collectively achieve larger order sizes, while considering the slot availability ratio at each zone to minimize order splitting. By adjusting the weights of the coefficients during the optimization process based on each case scenario, the model can adapt to different conditions and find an optimal solution for different datasets. It is also recommended to develop a model that follows a direct approach in evaluating the impact of order splitting while assigning correlated items across zones. Overall, this paper provides recommendations for optimizing order picking operations and highlights effective strategies for item placement. By adopting these strategies, the order fulfillment can be enhanced, leading to improved efficiency and cost savings. Furthermore, the techniques employed in our approach have the potential to be applied in various areas such as distributing resources, algorithms and mathematical models.
Acknowledgments
We would like to start by expressing our appreciation to Prof. Sobhi Mejjaouli, College of Engineering, Alfaisal University for his encouragement and support throughout our research journey. We are truly fortunate to have had his guidance. Additionally, we would like to extend our gratitude to Prof. Lotfi Tadj, College of Engineering, Alfaisal University, who played a instrumental role in shaping our understanding and approach to mathematical modeling. Prof. Tadj's exceptional expertise in operations research has been invaluable to our research endeavors. We are truly fortunate to have had the opportunity to learn from him. Furthermore, we would like to thank Markus Cueva, Director of Marketing and Business Development at FlexSim Software Products Inc., for providing us with the OptQuest license to support education and research. We appreciate his proactive initiative and the valuable assistance it provided in our endeavors.
References
- Adaloudis, N. (2023). Product storage assignment optimization in Robotic Mobile Fulfillment Systems (thesis).
- Berthold, T. (2014). Heuristic algorithms in global MINLP solvers. Ph.D. thesis, Technische Universität Berlin.
- Bolaños Zuñiga, J., Saucedo Martínez, J. A., Salais Fierro, T. E., & Marmolejo Saucedo, J. A. (2020). Optimization of the storage location assignment and the Picker-routing problem by using mathematical programming. Applied Sciences, 10(2), 534. [CrossRef]
- Bolaños-Zuñiga, J., Salazar-Aguilar, M. A., & Saucedo-Martínez, J. A. (2023). Solving location assignment and order Picker-routing problems in warehouse management. Axioms, 12(7), 711. [CrossRef]
- Buckow, J.-N., & Knust, S. (2023). The warehouse reshuffling problem with swap moves and time limit. EURO Journal on Transportation and Logistics, 12, 100113. [CrossRef]
- Casella, G., Volpi, A., Montanari, R., Tebaldi, L., & Bottani, E. (2023). Trends in order picking: A 2007–2022 review of the literature. Production & Manufacturing Research, 11(1). [CrossRef]
- de Koster, R., Le-Duc, T., & Roodbergen, K. J. (2007). Design and control of Warehouse Order Picking: A Literature Review. European Journal of Operational Research, 182(2), 481–501. [CrossRef]
- Diaz, R. (2016). Using dynamic demand information and zoning for the storage of non-uniform density stock keeping units. International Journal of Production Research, 54(8), 2487-2498. [CrossRef]
- Frazele, E. H., & Sharp, G. P. (1989). Correlated assignment strategy can improve any order-picking operation. Industrial Engineering, 21(4), 33-37.
- Frazelle, E. H. (1989). Stock location assignment and order picking productivity. Georgia Institute of Technology..
- Goetschalckx, M., & Ashayeri, J. (1989). Classification and design of order picking. Logistics World, 2(2), 99–106. [CrossRef]
- Islam, Md. S., & Uddin, Md. K. (2023). Correlated storage assignment approach in warehouses: A Systematic Literature Review. Journal of Industrial Engineering and Management, 16(2), 294. [CrossRef]
- Jiang, W., Liu, J., Dong, Y., & Wang, L. (2021). Assignment of duplicate storage locations in distribution centres to minimise walking distance in order picking. International Journal of Production Research, 59(15), 4457-4471. [CrossRef]
- Kim, J., Mendez, F., & Jimenez, J. (2020). Storage location assignment heuristics based on slot selection and frequent itemset grouping for large distribution centers. IEEE Access, 8, 189025–189035. [CrossRef]
- Krishnamoorthy, S., & Roy, D. (2019). An utility-based storage assignment strategy for e-commerce warehouse management. In 2019 International Conference on Data Mining Workshops (ICDMW) (997-1004). [CrossRef]
- Kuo, R., Kuo, P., Chen, Y. R., & Zulvia, F. (2016). Application of metaheuristics-based clustering algorithm to item assignment in a synchronized zone order picking system. Applied Soft Computing, 46, 143-150. [CrossRef]
- Le-Duc, T. (2005, September 23). Design and Control of Efficient Order Picking Processes. ERIM Ph.D. Series Research in Management. Retrieved from http://hdl.handle.net/1765/6910.
- Lee, I.G., Chung, S.H., & Yoon, S.W. (2020). Two-stage storage assignment to minimize travel time and congestion for warehouse order picking operations. Computers & Industrial Engineering, 139, 106129. [CrossRef]
- Li, Y., Méndez-Mediavilla, F.A., Temponi, C., Kim, J., & Jimenez, J.A. (2021). A heuristic storage location assignment based on frequent itemset classes to improve order picking operations. Applied Sciences, 11(4), 1839. [CrossRef]
- Lindo Systems Inc. (2020). Lingo: The Modeling Language and Optimizer. November 8, 2023, https://www.lindo.com/downloads/PDF/LINGO.pdf.
- Mantel, R. J., Schuur, P. C., & Heragu, S. S. (2007). Order oriented slotting: A new assignment strategy for warehouses. European J. of Industrial Engineering, 1(3), 301. [CrossRef]
- Mirzaei, M., Zaerpour, N., & de Koster, R. B. M. (2021a). How to benefit from order data: Correlated dispersed storage assignment in robotic warehouses. International Journal of Production Research, 60(2), 549–568. [CrossRef]
- Mirzaei, M., Zaerpour, N., & Koster, R. de (2021b). The impact of integrated cluster-based storage allocation on parts-to-picker warehouse performance. Transportation Research Part E: Logistics and Transportation Review, 146, 102207. [CrossRef]
- Tahami, H., &; Fakhravar, H. (2022). Literature review on combining heuristics and exact algorithms in combinatorial optimization. European Journal of Information Technologies and Computer Science, 2(2), 6–12. [CrossRef]
- Trindade, M.A., Sousa, P.S., & Moreira, M.R. (2022). Ramping up a heuristic procedure for storage location assignment problem with precedence constraints. Flexible Services and Manufacturing Journal, 34(3), 646-669. [CrossRef]
- Wan, Y., & Liu, Y. (2022). Integrating Optimized Fishbone Warehouse Layout, Storage Location Assignment and Picker Routing. IAENG International Journal of Computer Science, 49(3).
- Wutthisirisart, P., Noble, J.S., & Chang, C.A. (2015). A two-phased heuristic for relation-based item location. Computers & Industrial Engineering, 82, 94-102. [CrossRef]
- Xiao, J., & Zheng, L. (2012). Correlated storage assignment to minimize zone visits for BOM picking. International Journal of Advanced Manufacturing Technology, 61(5), 797-807. [CrossRef]
- Xie, J., Mei, Y., Ernst, A.T., Li, X., & Song, A. (2018). A bi-level optimization model for grouping constrained storage location assignment problems. IEEE Transactions on Cybernetics, 48(1), 385-398. [CrossRef]
- Yuan, M., Zhao, N., Wu, K., & Chen, Z. (2023). The storage location assignment problem of automated drug dispensing machines. Computers & Industrial Engineering, 184, 109578. [CrossRef]
- Yang, N. (2022). Evaluation of the Joint Impact of the Storage Assignment and Order Batching in Mobile-Pod Warehouse Systems. Mathematical Problems in Engineering, 2022, 1-13. [CrossRef]
- Yuan, R., Li, J., Wang, W., Dou, J., & Pan, L. (2021). Storage Assignment Optimization in Robotic Mobile Fulfillment Systems. Complexity, 2021, 1-11. [CrossRef]
- Zhang, J., Tian, L., & Zhou, Z. (2024). Joint optimization of item and pod storage assignment problems with picking aisles’ workload balance in robotic mobile fulfillment systems. Complexity, 2024, 1–15. [CrossRef]
- Zhang, R.Q., Wang, M., & Pan, X. (2019). New model of the storage location assignment problem considering demand correlation pattern. Computers & Industrial Engineering, 129, 210-219. [CrossRef]
- Zhang, Y. (2016). Correlated storage assignment strategy to reduce travel distance in order picking. IFAC-Papersonline, 49(2), 30–35. [CrossRef]
|
Disclaimer/Publisher’s Note: The statements, opinions and data contained in all publications are solely those of the individual author(s) and contributor(s) and not of MDPI and/or the editor(s). MDPI and/or the editor(s) disclaim responsibility for any injury to people or property resulting from any ideas, methods, instructions or products referred to in the content. |
© 2024 by the authors. Licensee MDPI, Basel, Switzerland. This article is an open access article distributed under the terms and conditions of the Creative Commons Attribution (CC BY) license (http://creativecommons.org/licenses/by/4.0/).

