Submitted:
30 January 2024
Posted:
31 January 2024
You are already at the latest version
Abstract
End-of-life electric vehicle (EV) batteries can be reused to reduce their environmental impact and economic costs. However, the growth of a second-life market is limited by the lack of information on the characteristics and performance of these batteries. As the volume of end-of-life EVs may exceed the amount of batteries needed for stationary applications, investigating the possibility of repurposing them in mobile applications is also necessary. This article presents an experimental test that can be used to collect the data necessary to fill a battery passport. The proposed procedure can facilitate the decision making process regarding the suitability of a battery for reuse at the end of its first life. Once the battery passport has been completed, the performance and characteristics of the battery are compared with the requirements of several mobile applications. Mobile charging stations and forklift trucks were identified as relevant applications for the reuse of high capacity prismatic cells. Finally, a definition of a state of health (SoH) is proposed to track the suitability of the battery during use in the second life application considering not only energy but also power and efficiency of the battery. This SoH shows that even taking into account accelerated ageing data, a repurposed battery can have an extended life of 11 years at 25~°C. It has also been shown that energy fade is the most limiting performance for lifetime and that cell-to-cell variation should be tracked as it has been shown to have a significant impact on battery life.
Keywords:
Second-life
; Circular Economy
; Lithium-ion battery
; Battery Life Cycle
; Battery Passport
; State of Health
; Mobile applications
; Electric Vehicle
1. Introduction
Policies to promote electric vehicles and renewable energy are being adopted around the world [1,2]. Lithium-ion batteries are becoming the ubiquitous energy storage technology due to their high energy density, low self-discharge rate and long cycle life [3]. In 2017, Sun et al. showed that batteries are mostly used to power consumer electronics applications, with electric mobility accounting for only a quarter of annual battery consumption [4]. The prominence of electronic batteries and the limited amount of energy they can store may explain why the linear economic approach of ’take, make and dispose’ has been largely favoured. The recent growth of electric mobility and renewable energy provides an opportunity to move towards more sustainable practices [5].
The principles of the circular economy provide valuable guidance by promoting actions to maintain the value of products for as long as possible while minimising the generation of waste [6]. Figure 1 illustrates the different actions promoted by the circular model.
The most preferable action to take is to extend as much as possible the lifespan of the application for which the battery was produced. Thermal management [8,9] and optimal charging strategies [10,11] are some solutions that can help to prolong battery lifetime [12]. When the battery is no longer suitable for its first application, the possibility of giving the battery a second life should be systematically considered. Battery second life can be defined as the complete (referred to as reuse in Figure 1) or partial (referred to as remanufacture in Figure 1) reuse of the battery for the original purpose for which it was designed [13].
In 2018, Martinez-Laserna et al. highlighted the economic, legal and technical barriers hindering the development of such a second life market [14]. Since then, significant progress has been made. Economic uncertainty about the future viability of this market appears to be limited, as companies such as Groupe Renault and Daimler have announced the creation of second-life battery factories [15,16]. Despite these encouraging announcements, a number of key challenges remain.
First, because reuse brings a paradigm shift in the way the battery market is organised: from a stock-based economy to a flow-based economy. When new batteries are used, product design involves drawing up a system specification and then determining the specifications and quantities of batteries required to power the system [17,18]. In this system, the main limiting factor is the cost of the batteries, which is directly related to the level of raw material reserves that can be economically extracted [19]. One solution to reduce the environmental impact of batteries is to reuse them. However, the second-life market faces a major constraint. A company wishing to reuse batteries has to adapt to the flow of end-of-life vehicles, i.e. those available at a given time and in a given geographical area. The use of such batteries means that the design of the system must be adapted to the batteries available at the end of their first life. The performance of these batteries will also limit the performance of the designed system and its possible uses.
Despite the growth of electric mobility, the market for end-of-life electric vehicle batteries remains small. In France, only 3,864 electric or hybrid vehicles reached the end of their life over the entire period from 2014 to 2020, compared to more than 8.6 million internal combustion vehicles [20,21]. These vehicles were distributed among the 1,680 car dismantling centres in France responsible for dismantling and recycling vehicles. On average, over the period 2014-2020, a car dismantling centre collected 1 electric or hybrid vehicle every 2 years and 5 months, compared to 14 internal combustion engine vehicles per day. This average should be treated with caution as there are large geographical differences in the distribution of end-of-life vehicles across the country. Nevertheless, this estimate highlights the small quantities of end-of-life electric and hybrid vehicles available.
The diversity of their technologies is another important barrier to the near-term growth of a reuse market. The wide variety of automotive battery designs is a major challenge, as they differ in size, electrodes chemistry, configuration and state of health, making reuse complex [22]. Different battery cells within the same vehicle can also experience different degradation, resulting in different internal impedances, capacities and self-discharge rates [23]. Table A1 shows the characteristics of the world’s best-selling vehicles between 2012 and 2022. Figure 2 shows a synthesis of the different battery technologies and formats used in the most sold vehicles between 2012 and 2022.
This delay before a significant increase in the volume of end-of-life EV batteries can help to anticipate an important challenge: determining the applications that can be powered by reused batteries. To date, stationary uses are very popular in the literature on battery reuse [24]. Table 1 provides some examples of work on the use of second-life batteries in stationary storage applications.
Stationary applications are often seen as ideal for second-life batteries, as they generally tolerate lower energy densities than electric vehicles [35]. They allow the use of modules or packs, which avoids prohibitive reconditioning costs [36]. Batteries reused for stationary applications are also subject to stresses comparable to those for mobility applications [37]. However, as the ageing process of degraded batteries is not yet well understood, they should not be used in applications critical to the stability of the grid or human health, for example for emergency power supply in hospitals.
The French electricity transmission grid operator RTE has expressed concern about the limited volumes of second-life batteries that could be reused in stationary applications. In its most optimistic scenario, up to 100 GWh i.e. 22 % of the volume of French batteries in 2050, could be reused in stationary applications in France [38].
Because of the diversity of battery technologies and applications, it is necessary to define a generic procedure for the experimental assessment of the performance of a battery at the end of its first life. The Battery Passport foreseen in the European Battery Regulation defines a set of minimum characteristics to be provided by sellers of used batteries [13]. This information on the characteristics and performance of the battery can help determine whether a battery can be reused.
This information needs to be updated throughout the life of the battery as it plays a key role in determining the economic value of the battery and its suitability for reuse [39]. Walden et al. have highlighted some of the challenges of battery passports [40]. In particular, the following locks are mentioned:
- to standardise the format for different product types,
- to standardise performance indicators and how they are measured,
- to clearly define the data to be included in the passport,
- to protect intellectual property and confidential information,
- to allow access to the data by repairers, recyclers and consumers.
Standardisation of information measurement is essential in the field of batteries, where several experimental techniques and definitions coexist to measure the same performance indicators [41,42]. Berger et al. propose to extend the Battery Passport concept beyond the requirements of the new Battery Directive recently proposed by the European Commission. They define the Battery Passport as a valuable and comprehensive source of data for the sustainable management of products [43,44]. This article favours this definition. As the digital product passport can help to promote circular practices, any information deemed useful to facilitate decision making on possible reuse is included in addition to the requirements of the European regulation [45,46].
The scientific literature on the Battery Passport and the assessment of its suitability for a second life in a particular application is sparse. Montes et al. [47] and Michelini et al. [48] have proposed lists of information that could be useful in making a decision on the suitability of a battery for a particular application, without however describing methods for obtaining this information. Beckers et al. presented an algorithm for determining the efficiency of an end-of-life automotive battery [39]. Thus, despite the growing number of experimental studies on end-of-life automotive batteries, none has presented a comprehensive methodology based on experimental work to assess the suitability of batteries for reuse in specific applications.
1.1. Contributions
This article aims to fill three gaps in the literature.
1. Experimental evaluation to fill the battery passport
A simple test that can be used to fill a battery passport is described in detail. The capacity, resistance and open circuit voltage of all the battery cells from a second life module are measured and key performance indicators of the battery are assessed. This experimental work contributes to the existing literature on second life batteries as it proposes an experimental framework for assessing the suitability of a certain battery type for repurposing.
2. Matching with second life application needs
Based on the experimental results, the suitability of EV batteries for second life is assessed by comparing measurements to the performance requirements of several applications. This study contributes to the existing literature as it proposes an experimental assessment of the suitability of a second life battery for several second life applications.
3. Definition of the state of health and estimation of the remaining useful life according to the second life application
A state of health is defined according to the new usage requirements. The different possible performances end of life thresholds are also presented and used to estimate the remaining useful life. This study contributes to the existing literature as it proposes adapted definitions of state of health and remaining useful life according to second life application.
1.2. Layout
The article is organized as follows: The introduction presented the context and the objective of the article, Section 2 presents the experimental evaluation of key performance indicators for second life battery selection. In Section 3, the suitability of the tested second life batteries for powering different mobile applications is assessed. Conclusions are drawn and an outlook is given in the final section.
2. Experimental Evaluation of Battery Suitability for Reuse
This section presents a procedure for establishing a battery passport, as required by the European directive [13], which can then be used to assess whether reuse is possible. This protocol is intended to be generic. It can be used for any type of battery. Each characteristic of the battery is first assessed and then the experimental measurements are used to complete a battery passport that will guide the decision on the battery’s eligibility for a second life.
2.1. Visual Inspection of the Battery
The first stage of the procedure involves a visual inspection of the battery. In this study, a module extracted from a BMW i3 electric vehicle have been used. This checks that the battery has no defects such as traces of impact or swelling on the cells [49]. The various indications shown in the Figure 3 show that the module was extracted from a vehicle produced in April 2017.
The QR codes available on this module can also be used to obtain the battery model. This information is particularly useful for obtaining the product datasheet and collecting literature on this technology. To complete this visual inspection, the module was measured for mass and dimensions. It weighs 28 kg and measures 410 mm by 300 mm by 150 mm, which corresponds to a volume of 18.4 L. It is made up of 12 lithium-ion cells connected in series, each weighing 2.1 kg and having a volume of 1 L. A BMW i3 vehicle is composed of 8 modules connected in series.
2.2. Experimental Characterisation of the Second Life Module
To complete the battery passport, a test consisting of a measurement of capacity, impedance and open circuit voltage is required. Figure 4 shows the current and voltage profiles for this test. Each cell of the module was tested separately.
Table 2 shows the different steps of the characterisation test and their approximate duration.
The measurement conditions should be adapted to the battery and its intended use. For example, the voltage thresholds and current rates must be adapted to the battery technology being tested. The datasheet defines the safety limits for voltage, current and temperature [50]. The Table 3 shows this information for the battery being tested. Obtaining this datasheet is therefore a prerequisite for carrying out this procedure. The load on the battery can also be adjusted according to the intended use in second life. The performance of the battery must be measured in a way that is as close as possible to the conditions of use in the second life application.
The test setup consisted of a Bitrode battery test system and a Vötsch VT 3050 climate chamber. To characterise the 12 cells at 25°C, the authors measured the power consumption during the experiment. During the 11 days and 18 hours of testing, the climate chamber consumed 141 kWh and the cycler 212 kWh, giving a total consumption of 353 kWh. In France, at the time of the experiment, this electrical consumption would have cost approximately 24.7 kg Co2 eq and 95€ [38]. In order to minimise the impact of this research, the data will been made open access. The authors hope that this data will benefit future research and allow a reduction in the number of experiments conducted.
The structure of this test could be adapted to reduce the test duration and its associated cost and impact. The capacity test could be reduced to a single cycle under nominal conditions. Impedance and low current could be measured only at nominal conditions and at 20 and 80 % state of charge. It would also be possible to make such measurements at module level to avoid time-consuming disassembly of the battery.
2.3. Capacity Measure and Estimation of Energy
Capacity is the amount of charge a battery can store or deliver at a given current rate and temperature. In this article, capacity is measured in discharge at a current of 1C during the constant current phase of the first step of the test shown in Figure 4. Data analysis was carried out using the open and free software DATTES [52]. Figure 5 shows the capacities of the 12 cells in the second-life module considered. Measurements were made on each cell individually.
The most degraded cell is significantly outperforming. As the module tested is a series assembly, its performance is limited by this degraded element.
The energy of a battery is a quantity that characterises the duration and intensity of the power it can deliver [53]. This quantity depends on the temperature and the current during the test and the degradation of the battery [54]. The measurement of the maximum available energy is necessary whatever the intended use. This value must be known in order to size the battery according to the requirements of the application. For mobile applications, the energy density of the battery must also be considered as the volume and mass available for the battery is generally limited. In this procedure, the energy available in each cell of the module is measured during step 1 of the characterisation test shown in Figure 4. The energy is calculated using the equation A6 at a current rate and temperature representative of the intended use. In this study, a discharge current of 1C (94 A) and a temperature of 25 °C were chosen, but these can be adapted in the case of an evaluation for a specific second life application. Figure 6 shows the energy of the cells tested. The light blue area indicates the loss of energy due to differences in cell performance.
In an series assembly, the energy in blue light is not available because of the performance dispersion among cells. Reducing the current rate is one of the solutions to reduce the amount of this energy loss.
2.4. Resistance and Power
Resistance and open circuit voltage are determined in steps 2 and 3 respectively of the characterisation test shown in Figure 4. The resistance is measured at a temperature and with current pulses representative of mobile use. Current pulses of 10 seconds duration measured at a current rate of 1C (94 A) and a temperature of 25 °C were used. These conditions can be adapted as part of an evaluation for a specific second life application. Figure 7 shows the results of the charge and discharge resistance measurements as a function of the state of charge on the elements making up this module.
This figure shows that the majority of cells have a resistance of the order of 1 . Three cells have a higher resistance than the others. The most degraded cell has a resistance of around 3 . The discharge and charge measurements are consistent since the most degraded cells are the same in charge and in discharge. Figure 8 shows the dispersion of discharge resistance measurements for the 12 cells in the module.
This graph shows that three cells have above-average resistance. The most degraded cell has a resistance value almost 2 standard deviations above the mean.
The power of a battery is a measure of the amount of energy it can supply or receive per unit of time. For any application, it is important to take power into account because it determines the speed of charging and discharging. Since the power of batteries decreases as they age, it is necessary to measure it to assess their suitability for a second life. The power that each cell can deliver is quantified according to the equation A3 for the discharge power [55]. To determine the power deliverable by a battery, its open circuit voltage must be known. The pseudo-open-circuit voltage was measured at a current rate of C/20 and a temperature of 25 °C during the third stage of the characterisation test presented in Figure 4. Figure 9 shows the open circuit voltage as a function of the state of charge.
The figure shows that all the cells behave very similarly. The variations in deliverable power can therefore be explained mainly by the dispersion of the resistances. Figure 10 shows the power that can be stored at charge and delivered at discharge by the module under test.
The figure shows that deliverable power is particularly sensitive to state of charge. An accurate estimate of the state of charge is therefore necessary to determine the deliverable power at any given time. The deliverable power during charging is also lower than that during discharging for most of the state of charge range (between 20 % and 100 %). This result has been observed in several other works [56,57].
2.5. Efficiency and Energy Losses
Energy efficiency is a parameter whose quantification is essential in all applications, as energy losses must be kept under control. Knowing the efficiency of the battery and the factors that influence it can therefore help to optimise the sizing and use of this energy storage system. The efficiency of each cell in the module is measured in step 1 of the characterisation test shown in Figure 4. For this test, a current rate of 1C (94 A) and a temperature of 25 °C have been chosen, but these can be adapted in the case of an evaluation for a specific second life application. The use of constant current phases makes it possible to calculate the efficiency at a given current rate. However, this choice reduces the range of variation in state of charge. Cell efficiency as a function of state of charge is calculated using the equation A4 [58]. Figure 11 shows their evolution.
Efficiency develops in two phases. Over the range of state of charge from 0 to 20 %, efficiency increases and then stabilises at higher state of charge. The three cells with the highest resistances are clearly visible on this graph, as their efficiencies are severely degraded. The module efficiency is shown in dashed line, it was calculated using the equation A5 by dividing the sum of these cell voltages during discharge by the sum of the voltages during charge. The calculation is based on the constant current phase. Discharge ends when one of the cells reaches the minimum voltage threshold, while charging ends when one of the cell reaches the maximum voltage threshold. This graph shows that the range of states of charge accessible when operating at constant current is limited between 20 % and 85 % state of charge due to the degraded cells. In order to minimise the effect of these elements, current reduction and the use of balancing are two methods that can be implemented [59,60]. The module efficiency can also be used to estimate energy losses. The difference between the ideal efficiency at the start of the battery’s life and that at the time of the laboratory measurement is used to quantify losses in the form of heat from the module. The datasheet does not indicate the efficiency at the beginning of the battery’s life. Assuming an ideal efficiency of 95 % for a new battery, the loss of efficiency over one cycle is 4 % at module level. For the module tested in this article, 144 Wh is lost. The cooling system must therefore be sized to dissipate this thermal energy.
Figure 12 shows the spread of the average efficiency in the module. The average efficiency is calculated by averaging the efficiency over the swept state of charge range for each cell.
The figure shows that three cells have below average efficiency. The low efficiency of cells 1, 2 and 9 can be partly explained by their high resistance.
European battery regulations also require the self-discharge rate to be estimated. For mobile use, self-discharge is not an essential characteristic as its effect is slow and limited to periods of less than a month. For the tested battery, the datasheet indicates that the self-discharge rate at 25 °C will reach up to 3.3 % loss of state of charge after 200 days of rest [51]. In addition, previous work has shown that when the battery is used in non-extreme conditions, the rate of self-discharge slows down as the battery degrades [58].
2.6. Performance Dispersion Inside the Module
Table 4 shows some statistical indicators of the performance distribution in the second-life battery module tested.
The performance dispersion are calculated from the equation A1. For this module, the relative dispersion of capacity, energy and efficiency are respectively 2.8 %, 2.2 % and 3.7 %. This level of dispersion corresponds to the order of magnitude of capacity measurements carried out in other studies involving batteries from electric vehicles [61,62,63,64,65,66]. These experimental results show that even four years after production, a battery can maintain excellent performance. At the beginning of their lives, the cells had a nominal discharge energy of 345 Wh when measured at 25 °C with a current rate of C/3 (31 A). After the first lifetime, the median energy available in the cells is 269.9 Wh. At module level, the total energy available is 3.2 kWh, which represents a loss of 22 % compared with the 4.1 kWh available in a new module. The relative dispersion of resistance is 43.3 %. This level of dispersion is much higher than for capacity, energy and efficiency measurements. This trend is observed in several works on batteries from electric vehicles [61,62,63,65,67].
2.7. Filling the Battery Passport
European legislation requires that any battery produced from 2026 with a capacity greater than 2 kWh must be associated with its battery passport [35,68,69,70]. In order to support decisions on resale or reuse, the passports will contain information on battery composition, performance and remaining useful life [71]. This digital document will be useful for second life service providers and recyclers to save money, time and reduce environmental impact by not having to test batteries to determine suitability for reuse [42,72]. The Table 5 presents the information mentioned in the Regulation. This information has been supplemented with elements considered useful to facilitate decision making on possible re-use.
This table has been filled in partly through visual inspection of the module and some measurements on the module. The rest of the information was obtained from the manufacturer’s datasheet [51] or from the scientific literature of the battery in question. One of the advantages of reusing batteries several years after their introduction on the market is that it allows to benefit from the scientific literature presenting experimental results on this battery technology. Publications describing electrochemical and ageing tests are particularly interesting for determining the chemical composition of the battery and estimating the number of cycles it is likely to be able to perform. Data shared under open licenses and processed with open software are also valuables as they enable to produce more reproducible results and may help to limit the cost, impact and time spent on experimentation [42].
3. Suitability Assessment of the Battery for a Mobile Application
The purpose of this paragraph is to determine whether the battery under test can power different mobile applications. Mobile usages are defined as movable systems powered by batteries. Table 6 presents some examples of work on the use of second-life batteries in mobile applications.
Compared to stationary ones, a limited number of articles have presented performance requirements for mobile uses [48,80]. To fill this gap in the literature, the requirements for certain uses were estimated on the basis of usage profiles shared in the literature [81]. By comparing the battery passport with the requirements of each application, we can conclude whether the battery is eligible for a second life. Figure 13 shows the conclusions of this comparison.
The figure shows that the prismatic format of the SAMSUNG 94 Ah cell is incompatible with the needs of small applications. For applications such as drones or electric bicycles, the cylindrical cells of a Tesla or the pouch cells of a Renault vehicle would be more suitable. The characteristics and performance of the BMW i3 battery make it suitable for reuse in a mobile charging station and in a forklift truck. To complete this result, two important pieces of information should be defined. First, a state of health should be defined based on the new application requirements. Secondly, the critical performance criteria should be identified to enable the definition of health indicators that could be used for rapid sorting of aged BMW i3 batteries.
When a battery is eligible for second-life use, it is necessary to monitor its performance in its new application. State of health is an indicator that can be used to characterise the battery’s ability to power a particular application in its current degraded state. In this work, a definition of this indicator adapted to a mobile charger is given by the equation 1.
with
- : the state of health for energy in %,
- : the state of health for charge power in %,
- : the state of health for discharge power in %,
- : the state of health for efficiency in %.
In this definition, state of health for energy is defined according to equation 2.
with
- : the state of health energy in %,
- : the maximal energy available in the battery at the instant t in watt-hours,
- : the end of life performance threshold related to energy available in the battery in watt-hours,
- : the maximal energy available in the battery at the beginning of its life in watt-hours.
State of health for charge power is defined according to equation 3.
with
- : the state of health charge power criteria in %,
- : the maximal charge power that the battery can receive at the instant t in watt,
- : the end of life performance threshold related to the charge power the battery can receive in watt,
- : the maximal charge power that the battery can receive at the beginning of its life in watt.
State of health for discharge power is defined according to equation 4.
with
- : the state of health discharge power criteria in %,
- : the maximal discharge power that the battery can provide at the instant t in watt,
- : the end of life performance threshold related to the discharge power the battery can provide in watt,
- : the maximal discharge power that the battery can provide at the beginning of its life in watt.
State of health for efficiency is defined according to equation 5.
with
- : the state of health efficiency in %,
- : the mean efficiency of the battery at the instant t in %,
- : the end of life performance threshold related to mean efficiency of the battery in %,
- : the mean efficiency of the battery at the beginning of its life in %.
In these definitions, the various end-of-life thresholds must be adapted to the use studied [82]. For a mobile charging station, these thresholds are determined on the basis of average daily journeys and the energy consumption of electric vehicles.
Based on simulation work, Tepe et al. have shown that an electric vehicle consumes between 0.18 and 0.3 kilowatt-hours per kilometre [37]. This consumption varies significantly according to vehicle size, since a vehicle with a 79.5 kWh battery consumes on average 20 % more than a vehicle with a 45 kWh battery. To define the charger’s end-of-life threshold, a consumption of 0.18 kWh/km is considered in this work. This value corresponds to the consumption of a vehicle with a smaller battery. The distance covered daily by a vehicle is used to determine the minimum energy required from a mobile charging station. In France, 80 % of daily car journeys are less than 55 km [83]. In a study analysing a database of 19,000 daily journeys, Plotz et al. showed that a distance of 55 km exceeds the median daily distance in countries such as Sweden, Germany and the USA [84]. Based on these figures, the notion of end-of-life energy is defined when the charger can no longer supply the energy required for a vehicle with a consumption of 0.18 kWh/km to travel 55 km. The minimum energy to be stored therefore corresponds to 10 kWh for a mobile charging station made of 4 modules i.e. 2.5 kWh per module.
The notion of end-of-life for charging and discharging power is defined when the mobile charger cannot receive or supply a power of 7.4 kW, which corresponds to standard vehicle charging power. Each of the four modules of the mobile charging station must therefore be able to receive or supply 1.85 kW.
Finally, the notion of end-of-life in terms of energy efficiency is defined when the average efficiency is less than 50 %, based on an assumption. A different threshold could be chosen, taking into account economic and environmental criteria appropriate to the use studied. These figures lead to the end-of-life performances presented in Table 7.
In this table, the data at the beginning of the module’s life are based on strong assumptions. Energy at the beginning of the module’s life is calculated by multiplying the nominal energy of a cell by the number of cells in a module. This assumes a perfectly homogeneous battery. Discharge power is calculated on the same assumption, by multiplying the nominal power of a cell by the number of cells in a module. The datasheet does not provide any measurements for charging power. The value for discharging power is therefore adopted. Finally, the datasheet does not indicate any efficiency measurement either. An ideal efficiency of 95 % is therefore assumed. Based on these assumptions, the battery state of health is limited by available energy. The minimal value being 44 % for state of health energy. It is important to notice that based on this definition of the state of health end of life is reached at zero. This result also suggest that capacity is the measurement that should be used to define the health indicators used for fast sorting of end of automotive life batteries.
European battery regulations also call for an estimate of the number of cycles before the battery’s end-of-life in its new application. This estimate can hardly be generic, since the load on the battery depends greatly on its use. For this work, the results shown in the datasheet are exploited. Data is collected using the software Webplotdigitizer. Estimating the remaining useful life involves determining the number of cycles that can be performed before reaching one of the end-of-life thresholds. In the datasheet, efficiency and charge power measurements over ageing are not shared. Remaining useful life is then only defined based on energy and discharge power. Two ageing campaigns were conducted by the manufacturer. Degradation of capacity and discharge resistance were measured during a cycling campaign at 25 °C and 45 °C [51]. Cycles were defined with current rate of C/2 during charge and 1C during discharge at 25 °C while charge and discharge were made at 1C at 45 °C. Cycles were full voltage windows which is known to be an ageing stress factor for lithium-ion batteries [85]. Two cells were tested in each experimental condition. Figure 14 shows the evolution of available energy and state of health for energy as a function of the number of cycles at 25 °C and 45 °C for the two tested cells.
Figures (a) and (b) show the evolution of energy and state of health for energy as a function of the number of cycles at cell level. A linear extrapolation of the curves is used to predict the remaining useful life. As expected, cells aged at 45 °C show faster degradation. This figure also shows the effect of cell-to-cell variation on lifetime, as two fresh cells aged under the same conditions can have significantly different lifespans. In a system, the first cell to reach end of life will end the life of the whole system. For discharge power, figures (c) and (d) show that a cell aged at 25 °C has a significantly shorter life. The influence of temperature on the discharge power is unclear as the other cell aged at 25°C and 45°C performed comparably. Further experiments would be required to investigate the influence of temperature on power fade. Cells degradation in this accelerated ageing campaign help to estimate the remaining lifetime. Estimations are presented in Table 8.
Lifetimes are given in number of cycles. Results at 25 °C are significantly better as for the best-performing cell end-of-life should be reached after 8,026 cycles against 4,710 cycles at 45 °C. Assuming two full voltage window cycles are made per day, this would lead to a minimal lifetime of 6.5 years at 45 °C and 11 years at 25 °C. It is important to point out that these results probably underestimate actual battery life, given that extrapolation was based on accelerated ageing curves. A better estimation of the lifespan could also be given by using cycles representative of a real usage. These results show the impact of dispersion on battery life. The most degraded cells significantly reduce assembly life. This study also tends to confirm the fact that energy fade is a more limiting factor than power fade [86,87]. This work also suggest that the selection of batteries eligible for repurposing can consequently be based mainly on capacity health indicators. This support a commonly made hypothesis [88,89,90,91].
4. Conclusion and Outlook
This article has presented a procedure for evaluating the performance of a battery, filling a battery passport and determining its suitability for being repurposed in a mobile application. Assessing the possibility to reuse batteries in non stationary use have been highlighted as a key enabler for the growth of more circular practices in the battery field.
The experimental study evaluated the performance of a second life battery. The capacity, resistance and efficiency of 12 cells were measured. The proposed experimental framework can be used as a reference test to evaluate battery suitability for second life. The proposed framework is compliant with the 2023 Battery Regulation of the European Union, which is the only existing regulation to date describing the data requirements to provide for second life batteries. To the best of the authors’ knowledge, this experimental work contributes to the existing literature on second life batteries as it is the first to provide such a complete framework.
Based on the experimental results, the energy, power and efficiency of a second life battery module were calculated. These performances were compared to the performance requirements of several mobile applications and the suitability of second life batteries for reuse was assessed. In terms of battery performance, the battery was tested four years after its production and after experiencing a first life in a vehicle. The experimental results show that it can still perform well. To the best of the authors’ knowledge, this article is also one of the first to experimentally evaluate the suitability of a second life battery for mobile second life applications.
Finally, a definition of health state based on application needs is provided. It can be used to track battery performance and suitability for second life applications. Mobile charging stations and forklift trucks were shown to be suitable applications for reuse of high capacity prismatic cells. This SoH definition was also used to estimate the remaining useful life. This estimate showed that second life batteries could be used for several thousand cycles in a mobile application, resulting in an 11 year life extension at 25°C. It also suggested that energy fade is the most limiting performance for lifetime, and that cell-to-cell variation should be considered as it may limit battery life.
This study has several limitations that can be the subject of further research efforts. Firstly, the described procedure should be tested on different battery technologies at module and pack level. Thermal and safety characteristics of the battery have been poorly considered in this article and there is limited research on these topics for second life batteries to date. Fast characterisation techniques may also be considered to fill in the battery passport information in a reduced time.
The authors also invite researchers to address these research gaps as it may contribute to the development of reuse and circularity in the battery field.
Author Contributions
Conceptualization: M.H., E.R.-I. and P.V.; Methodology: M.H., E.R.-I. and P.V.; Software: M.H. and E.R.-I.; Validation: M.H., E.R.-I. and P.V.; Data analysis: M.H.; Writing—original draft preparation: M.H.; Writing—review and editing: E.R.-I. and P.V.; Supervision: E.R.-I. and P.V.; Funding acquisition: E.R.-I. and P.V. All authors have read and agreed to the published version of the manuscript.
Funding
This research was lead as part of the project BAROM funded by Région Auvergne-Rhône-Alpes.
Data Availability Statement
The raw data supporting the conclusions of this article will be made available by the authors on request.
Acknowledgments
This article supports a project on the use of second life batteries in mobile charging station which would not have been possible without the help of Serge Pelissier, whom we would like to thank.
Conflicts of Interest
The authors declare no conflict of interest. The funders had no role in the design of the study; in the collection, analyses, or interpretation of data; in the writing of the manuscript; or in the decision to publish the results.
Appendix A. Equations
Performance Dispersion
- k: the relative dispersion of performance in %,
- : the standard deviation between performance measurements,
- : the average of performance measurements.
Charge Power Capability
- : the charge power capability in watt,
- : the battery open circuit voltage in volts,
- : the battery maximal voltage in volts,
- : the charge resistance of the battery in ohm.
Discharge Power Capability
- : the discharge power capability in watt,
- : the battery open circuit voltage in volts,
- : the battery minimal voltage in volts,
- : the discharge resistance of the battery in ohm.
Efficiency
- : the energy efficiency of a cell as a function of the state of charge in %,
- : the cell voltage during discharge in volts,
- : the cell voltage during charging in volts.
Module Efficiency
- : the module efficiency in %,
- : the sum of all cells voltages during discharge in volts,
- : the sum of all cells voltages during charge in volts.
Energy
- : the energy available in the cell in watt-hours,
- : the time at start of discharge in hours,
- : the time at end of discharge in hours,
- : the voltage measured in volts,
- : the current measured in amperes.
Appendix B. Most Sold Electric Vehicles Worldwide Annually between 2012 and 2022

Table A1.
Most sold electric vehicles worldwide annually since 2012. All information are for reference only. The actual specs are subject to change anytime. Empty cells indicate unknown data. The information was collected from the manufacturers’ websites. Sales figures are from [92].
Table A1.
Most sold electric vehicles worldwide annually since 2012. All information are for reference only. The actual specs are subject to change anytime. Empty cells indicate unknown data. The information was collected from the manufacturers’ websites. Sales figures are from [92].
| Pack Energy | Module Energy | Cell Energy | Max AC Power | Max DC Power | Vehicles sold | |||||
|---|---|---|---|---|---|---|---|---|---|---|
| Year | OEM | Model | (kWh) | (kWh) | (Wh) | (kW) | (kW) | Chemistry | Cell format | (in Thousands) |
| Tesla | Model Y | 57 | 15 | 566 | 11 | 170 | LFP | Prismatic | 771 | |
| Tesla | Model 3 | 51.9 | 12.9 | 17 | 11 | 170 | NCA | Cylindrical | 476 | |
| 2022 | Wuling | HongGuang Mini EV | 9.3 | 424 | 1.6 | - | LFP | Prismatic | 424 | |
| BYD | Song | 59.1 | 271 | 6.6 | 50 | LFP | Prismatic | 410 | ||
| BYD | Qin | 53.1 | 646 | 6.6 | 50 | LFP | Prismatic | 205 | ||
| Tesla | Model 3 | 51.9 | 12.9 | 17 | 11 | 170 | NCA | Cylindrical | 500 | |
| Wuling | HongGuang Mini EV | 9.3 | 424 | 1.6 | - | LFP | Prismatic | 424 | ||
| 2021 | Tesla | Model Y | 57 | 15 | 566 | 11 | 170 | LFP | Prismatic | 411 |
| VW | ID.4 | 52 | 5.8 | 271 | 7.2 | 110 | NMC | Cylindrical | 411 | |
| BYD | Qin | 53.1 | 646 | 6.6 | 50 | LFP | Prismatic | 65.1 | ||
| Tesla | Model 3 | 51.9 | 12.9 | 17.4 | 11 | 250 | NCA | Cylindrical | 365.2 | |
| Wuling | HongGuang Mini EV | 9.3 | 424 | 1.6 | - | LFP | Prismatic | 119.2 | ||
| 2020 | Renault | ZOE | 52 | 4.3 | 270.8 | 22 | 50 | NMC | Pouch | 100.4 |
| Tesla | Model Y | 74.5 | 18.6 | 16,9 | 11 | 120 | NCA | Cylindrical | 79.7 | |
| Hyundai | Kona | 64 | 12.8 | 218 | 7.2 | 77 | NMC | Pouch | 65.1 | |
| Tesla | Model 3 | 51.9 | 12.9 | 17.4 | 11 | 250 | NCA | Cylindrical | 300.1 | |
| BAIC | EU-Series EB | 54 | 7 | 60 | NMC | Prismatic | 111.0 | |||
| 2019 | Nissan | Leaf | 40 | 1.7 | 208 | 6.6 | 100 | NMC | Pouch | 69.9 |
| SAIC-GM | Baojun E100/E200 EV | 24 | 2 | - | LFP | Prismatic | 60.1 | |||
| BYD | e5 450 EV S | 60.5 | 4.6 | 360 | 7 | 60 | LFP | Prismatic | 58.0 | |
| Tesla | Model 3 | 51.9 | 12.9 | 17.4 | 11 | 250 | NCA | Cylindrical | 145.9 | |
| BAIC | EC180 | 20.3 | LFP | Prismatic | 90.6 | |||||
| 2018 | Nissan | Leaf | 40 | 1.7 | 208 | 6.6 | 100 | NMC | Pouch | 87.1 |
| JAC | iEV | 23 | 6 | - | LFP | Cylindrical | 55.6 | |||
| Tesla | Model S | 74 | 4.6 | 10.4 | 11 | 200 | NCA | Cylindrical | 50.0 | |
| BAIC | EC180 | 20.3 | 7 | - | LFP | Prismatic | 78.1 | |||
| Tesla | Model S | 74 | 4.6 | 10.4 | 11 | 200 | NCA | Cylindrical | 54.7 | |
| 2017 | Toyota | Prius PHEV | 4.4 | 4.4 | 79 | 2.3 | - | Ni-MH | Prismatic | 50.8 |
| Nissan | Leaf | 40 | 1.7 | 208 | 7 | 50 | NMC | Pouch | 47.2 | |
| Tesla | Model X | 80.5 | 5 | 11.3 | 16.5 | 150 | NCA | Cylindrical | 46.5 | |
| Tesla | Model S | 74 | 4.6 | 10.4 | 11 | 200 | NCA | Cylindrical | 50.9 | |
| Nissan | Leaf | 30 | 0.5 | 125 | 7 | 50 | LMO-LNO | Pouch | 43.5 | |
| 2016 | BYD | Tang PHEV | 18.5 | 86 | - | LFP | Prismatic | 31.4 | ||
| Chevrolet | Volt | 16 | 1.8 | 55 | 3.7 | - | NMC-LMO | Pouch | 28.3 | |
| Mitsubishi | Outlander PHEV | 12 | 2.4 | 150 | 3.7 | - | NMC | Prismatic | 27.8 | |
| Tesla | Model S | 74 | 4.6 | 10.4 | 11 | 200 | NCA | Cylindrical | 50.4 | |
| Nissan | Leaf | 30 | 0.5 | 125 | 7 | 50 | LMO-LNO | Pouch | 43.9 | |
| 2015 | Mitsubishi | Outlander PHEV | 12 | 2.4 | 150 | 3.7 | - | NMC | Prismatic | 43.3 |
| BYD | Qin | 13 | 1.3 | 7 | - | LFP | Prismatic | 31.9 | ||
| BMW | I3 | 21.6 | 2.7 | 225 | 3.7 | 50 | NMC | Prismatic | 24.1 | |
| Nissan | Leaf | 24.4 | 0.5 | 125 | 7 | 50 | LMO-LNO | Pouch | 60.6 | |
| Mitsubishi | Outlander PHEV | 12 | 2.4 | 150 | 3.7 | - | NMC | Prismatic | 31.2 | |
| 2014 | Tesla | Model S | 74 | 4.6 | 10.4 | 11 | 200 | NCA | Cylindrical | 30.4 |
| Chevrolet | Volt | 16 | 1.8 | 55 | 3.7 | - | NMC-LMO | Pouch | 20.0 | |
| Toyota | Prius PHEV | 4.4 | 4.4 | 79 | 2.3 | - | Ni-MH | Prismatic | 19.2 | |
| Nissan | Leaf | 24.4 | 0.5 | 125 | 7 | 50 | LMO-LNO | Pouch | 47.8 | |
| Chevrolet | Volt | 16 | 1.8 | 55 | 3.7 | - | NMC-LMO | Pouch | 28.2 | |
| 2013 | Toyota | Prius PHEV | 4.4 | 4.4 | 79 | 2.3 | - | Ni-MH | Prismatic | 23.1 |
| Tesla | Model S | 74 | 4.6 | 10.4 | 11 | 200 | NCA | Cylindrical | 22.2 | |
| Mitsubishi | Outlander PHEV | 12 | 2.4 | 150 | 3.7 | - | NMC | Prismatic | 18.4 | |
| Chevrolet | Volt | 16 | 1.8 | 55 | 3.7 | - | NMC-LMO | Pouch | 29.6 | |
| Toyota | Prius PHEV | 4.4 | 4.4 | 79 | 2.3 | - | Ni-MH | Prismatic | 27.1 | |
| 2012 | Nissan | Leaf | 24.4 | 0.5 | 125 | 7 | 50 | LMO-LNO | Pouch | 26.9 |
| Renault | Twizy | 7 | 1 | 125 | 3.7 | - | LMO-NMC | Pouch | 9.0 | |
| Mitsubishi | I-Miev | 16 | 1.6 | 182 | 3.7 | 50 | NMC | Prismatic | 7.9 |
References
- Lu, Y.; Khan, Z.A.; Alvarez-Alvarado, M.S.; Zhang, Y.; Huang, Z.; Imran, M. A critical review of sustainable energy policies for the promotion of renewable energy sources. Sustainability 2020, 12, 5078. [Google Scholar] [CrossRef]
- Xue, C.; Zhou, H.; Wu, Q.; Wu, X.; Xu, X. Impact of incentive policies and other socio-economic factors on electric vehicle market share: A panel data analysis from the 20 countries. Sustainability 2021, 13, 2928. [Google Scholar] [CrossRef]
- Armand, M.; Axmann, P.; Bresser, D.; Copley, M.; Edström, K.; Ekberg, C.; Guyomard, D.; Lestriez, B.; Novák, P.; Petranikova, M.; et al. Lithium-ion batteries–Current state of the art and anticipated developments. Journal of Power Sources 2020, 479, 228708. [Google Scholar] [CrossRef]
- Sun, X.; Hao, H.; Zhao, F.; Liu, Z. Tracing global lithium flow: A trade-linked material flow analysis. Resources, Conservation and Recycling 2017, 124, 50–61. [Google Scholar] [CrossRef]
- Etxandi-Santolaya, M.; Casals, L.C.; Montes, T.; Corchero, C. Are electric vehicle batteries being underused? A review of current practices and sources of circularity. J. Environ. Manage. 2023, 338, 117814. [Google Scholar] [CrossRef] [PubMed]
- commission, E. Closing the loop - An EU action plan for the Circular Economy. https://eur-lex.europa.eu/legal-content/EN/TXT/HTML/?uri=CELEX:52015DC0614&from=ES, accessed on 2024/01/13.
- Grimaud, G. Conception des scénarios de recyclage pilotée par l’évaluation des performances des procédés. PhD thesis, Paris, ENSAM, 2019.
- Abbas, A.; Rizoug, N.; Trigui, R.; Babin, A.; Redondo-Iglesias, E.; Pelissier, S. Thermal modeling of batteries for EV energy management. In Proceedings of the IEEE VPPC; IEEE, 2022; pp. 1–6. [CrossRef]
- Madaoui, S.; Vinassa, J.M.; Sabatier, J.; Guillemard, F. An Electrothermal Model of an NMC Lithium-Ion Prismatic Battery Cell for Temperature Distribution Assessment. Batteries 2023, 9, 478. [Google Scholar] [CrossRef]
- Houbbadi, A.; Redondo-Iglesias, E.; Trigui, R.; Pelissier, S.; Bouton, T. Optimal Charging Strategy to Minimize Electricity Cost and Prolong Battery Life of Electric Bus Fleet. In Proceedings of the IEEE VPPC; 2019; pp. 1–6. [CrossRef]
- Mathieu, R.; Briat, O.; Gyan, P.; Vinassa, J.M. Fast charging for electric vehicles applications: Numerical optimization of a multi-stage charging protocol for lithium-ion battery and impact on cycle life. Journal of energy storage 2021, 40, 102756. [Google Scholar] [CrossRef]
- Jin, S.; Huang, X.; Sui, X.; Wang, S.; Teodorescu, R.; Stroe, D.I. Overview of methods for battery lifetime extension. In Proceedings of the 2021 23rd European Conference on Power Electronics and Applications (EPE’21 ECCE Europe). IEEE, 2021, pp. 1–8. [CrossRef]
- EC. REGULATION (EU) 2023/1542 OF THE EUROPEAN PARLIAMENT AND OF THE COUNCIL of 12 July 2023 concerning batteries and waste batteries, amending Directive 2008/98/EC and Regulation (EU) 2019/1020 and repealing Directive 2006/66/EC., 2023.
- Martinez-Laserna, E.; Gandiaga, I.; Sarasketa-Zabala, E.; Badeda, J.; Stroe, D.I.; Swierczynski, M.; Goikoetxea, A. Battery second life: Hype, hope or reality? A critical review of the state of the art. Renewable and Sustainable Energy Reviews 2018, 93, 701–718. [Google Scholar] [CrossRef]
- Group, R. Groupe Renault creates the first european factory dedicated to the circular economy of mobility in Flins. https://media.renaultgroup.com/groupe-renault-creates-the-first-european-factory-dedicated-to-the-circular-economy-of-mobility-in-flins/?lang=eng, accessed on 2024/01/13.
- Mercedes-Benz. Business segments. https://www.mercedes-benz.com/en/mercedes-benz-energy/business-segments/, accessed on 2024/01/13.
- Hesse, H.C.; Martins, R.; Musilek, P.; Naumann, M.; Truong, C.N.; Jossen, A. Economic optimization of component sizing for residential battery storage systems. Energies 2017, 10, 835. [Google Scholar] [CrossRef]
- Fallahifar, R.; Kalantar, M. Optimal planning of lithium ion battery energy storage for microgrid applications: Considering capacity degradation. Journal of Energy Storage 2023, 57, 106103. [Google Scholar] [CrossRef]
- Helbig, C.; Bradshaw, A.M.; Wietschel, L.; Thorenz, A.; Tuma, A. Supply risks associated with lithium-ion battery materials. Journal of Cleaner Production 2018, 172, 274–286. [Google Scholar] [CrossRef]
- ADEME. Automobiles: données 2019. Technical report, ADEME, 2019.
- ADEME. Automobiles: données 2020. Technical report, ADEME, 2022.
- Dong, Q.; Liang, S.; Li, J.; Kim, H.C.; Shen, W.; Wallington, T.J. Cost, Energy, and Carbon Footprint Benefits of Second-Life Electric Vehicle Battery Use. iScience 2023. [Google Scholar] [CrossRef] [PubMed]
- Scholz, T.; Pautzke, F.; Schmuelling, B. Experimental Analysis of a Lithium-Ion Battery Pack after Long Service Life in a Conventional Electric Vehicle Considering Second-Life Applications. In Proceedings of the ESREL; 2023. [CrossRef]
- Zhao, Y.; Pohl, O.; Bhatt, A.I.; Collis, G.E.; Mahon, P.J.; Rüther, T.; Hollenkamp, A.F. A review on battery market trends, second-life reuse, and recycling. Sustainable Chemistry 2021, 2, 167–205. [Google Scholar] [CrossRef]
- Deng, Y.; Zhang, Y.; Luo, F.; Mu, Y. Operational planning of centralized charging stations utilizing second-life battery energy storage systems. IEEE Transactions on Sustainable Energy 2020, 12, 387–399. [Google Scholar] [CrossRef]
- Leonori, S.; Rizzoni, G.; Mascioli, F.M.F.; Rizzi, A. Intelligent energy flow management of a nanogrid fast charging station equipped with second life batteries. International Journal of Electrical Power & Energy Systems 2021, 127, 106602. [Google Scholar] [CrossRef]
- Janota, L.; Králík, T.; Knápek, J. Second life batteries used in energy storage for frequency containment reserve service. Energies 2020, 13, 6396. [Google Scholar] [CrossRef]
- White, C.; Thompson, B.; Swan, L.G. Repurposed electric vehicle battery performance in second-life electricity grid frequency regulation service. Journal of Energy Storage 2020, 28, 101278. [Google Scholar] [CrossRef]
- Lacap, J.; Park, J.W.; Beslow, L. Development and demonstration of microgrid system utilizing second-life electric vehicle batteries. Journal of Energy Storage 2021, 41, 102837. [Google Scholar] [CrossRef]
- Antunes, E.D.G.; López, A.G.; Lacressonnière, F.; Roboam, X.; Sareni, B. Life cycle assessment of a lithium ion battery: comparison between first and second life batteries environmental impacts in microgrid applications. In Proceedings of the SGE; L2EP, 2023.
- Colarullo, L.; Thakur, J. Second-life EV batteries for stationary storage applications in Local Energy Communities. Renewable and Sustainable Energy Reviews 2022, 169, 112913. [Google Scholar] [CrossRef]
- Thakur, J.; de Almeida, C.M.L.; Baskar, A.G. Electric vehicle batteries for a circular economy: Second life batteries as residential stationary storage. Journal of Cleaner Production 2022, 375, 134066. [Google Scholar] [CrossRef]
- Mathews, I.; Xu, B.; He, W.; Barreto, V.; Buonassisi, T.; Peters, I.M. Technoeconomic model of second-life batteries for utility-scale solar considering calendar and cycle aging. Applied Energy 2020, 269, 115127. [Google Scholar] [CrossRef]
- Steckel, T.; Kendall, A.; Ambrose, H. Applying levelized cost of storage methodology to utility-scale second-life lithium-ion battery energy storage systems. Applied Energy 2021, 300, 117309. [Google Scholar] [CrossRef]
- Börner, M.F.; Frieges, M.H.; Späth, B.; Spütz, K.; Heimes, H.H.; Sauer, D.U.; Li, W. Challenges of second-life concepts for retired electric vehicle batteries. Cell Reports Physical Science 2022, 3. [Google Scholar] [CrossRef]
- Lander, L.; Tagnon, C.; Nguyen-Tien, V.; Kendrick, E.; Elliott, R.J.; Abbott, A.P.; Edge, J.S.; Offer, G.J. Breaking it down: A techno-economic assessment of the impact of battery pack design on disassembly costs. Applied Energy 2023, 331, 120437. [Google Scholar] [CrossRef]
- Tepe, B.; Jablonski, S.; Hesse, H.; Jossen, A. Lithium-ion battery utilization in various modes of e-transportation. eTransportation 2023, 18, 100274. [Google Scholar] [CrossRef]
- RTE. Energy Pathways to 2050. Technical report, RTE, 2022.
- Beckers, C.; Hoedemaekers, E.; Dagkilic, A. al. Round-Trip Energy Efficiency and Energy-Efficiency Fade Estimation for Battery Passport. In Proceedings of the IEEE VPPC; 2023. [CrossRef]
- Walden, J.; Steinbrecher, A.; Marinkovic, M. Digital product passports as enabler of the circular economy. hemie Ingenieur Technik 2021, 93, 1717–1727. [Google Scholar] [CrossRef]
- Clark, S.; Bleken, F.L.; Stier, S.; Flores, E.; Andersen, C.W.; Marcinek, M.; Szczesna-Chrzan, A.; Gaberscek, M.; Palacin, M.R.; Uhrin, M.; et al. Toward a unified description of battery data. Advanced Energy Materials 2022, 12, 2102702. [Google Scholar] [CrossRef]
- Hassini, M.; Redondo-Iglesias, E.; Venet, P. Lithium–Ion Battery Data: From Production to Prediction. Batteries 2023, 9, 385. [Google Scholar] [CrossRef]
- Berger, K.; Schöggl, J.P.; Baumgartner, R.J. Digital battery passports to enable circular and sustainable value chains: Conceptualization and use cases. Journal of Cleaner Production 2022, 353, 131492. [Google Scholar] [CrossRef]
- Berger, K.; Baumgartner, R.J.; Weinzerl, M.; Bachler, J.; Preston, K.; Schöggl, J.P. Data requirements and availabilities for a digital battery passport–A value chain actor perspective. Cleaner Production Letters 2023, 4, 100032. [Google Scholar] [CrossRef]
- Adisorn, T.; Tholen, L.; Götz, T. Towards a digital product passport fit for contributing to a circular economy. Energies 2021, 14, 2289. [Google Scholar] [CrossRef]
- Uusitalo, T.; Karhu, M.; Majaniemi, S.; Kivikytö-Reponen, P.; Hanski, J.; Vatanen, S. Digital Product Passports in Circular Economy: Case Battery Passport. In EcoDesign for Sustainable Products, Services and Social Systems I; Springer, 2024; pp. 175–186. [CrossRef]
- Montes, T.; Etxandi-Santolaya, M.; Eichman, J.; Ferreira, V.J.; Trilla, L.; Corchero, C. Procedure for Assessing the Suitability of Battery Second Life Applications after EV First Life. Batteries 2022, 8. [Google Scholar] [CrossRef]
- Michelini, E.; Höschele, P.; Ratz, F.; Stadlbauer, M.; Rom, W.; Ellersdorfer, C.; Moser, J. Potential and Most Promising Second-Life Applications for Automotive Lithium-Ion Batteries Considering Technical, Economic and Legal Aspects. Energies 2023, 16, 2830. [Google Scholar] [CrossRef]
- Popp, A.; Fechtner, H.; Schmuelling, B.; Scholz, T.; Kremzow-Tennie, S.; Pautzke, F. Challenges in the Real-World Evaluation of Traction Batteries at the End of their First Life. In Proceedings of the ESREL; 2023. [CrossRef]
- Diao, W.; Kulkarni, C.; Pecht, M. Development of an informative lithium-ion battery datasheet. Energies 2021, 14, 5434. [Google Scholar] [CrossRef]
- PushEV. Samsung SDI 94Ah battery cell full specifications. https://pushevs.com/2018/04/05/samsung-sdi-94-ah-battery-cell-full-specifications/, accessed on 2024/01/13.
- Redondo-Iglesias, E.; Hassini, M.; Venet, P.; Pelissier, S. DATTES: Data analysis tools for tests on energy storage. SoftwareX 2023, 24, 101584. [Google Scholar] [CrossRef]
- Baghdadi, I.; Briat, O.; Gyan, P.; Vinassa, J.M. State of health assessment for lithium batteries based on voltage–time relaxation measure. Electrochimica Acta 2016, 194, 461–472. [Google Scholar] [CrossRef]
- Haber, M.; Azaïs, P.; Genies, S.; Raccurt, O. Stress factor identification and Risk Probabilistic Number (RPN) analysis of Li-ion batteries based on worldwide electric vehicle usage. Applied Energy 2023, 343, 121250. [Google Scholar] [CrossRef]
- USDOE. PNGV battery test manual. Technical report, USDOE, 1997. [CrossRef]
- Xiong, R.; He, H.; Sun, F.; Liu, X.; Liu, Z. Model-based state of charge and peak power capability joint estimation of lithium-ion battery in plug-in hybrid electric vehicles. Journal of Power Sources 2013, 229, 159–169. [Google Scholar] [CrossRef]
- Sun, F.; Xiong, R.; He, H. Estimation of state-of-charge and state-of-power capability of lithium-ion battery considering varying health conditions. Journal of Power Sources 2014, 259, 166–176. [Google Scholar] [CrossRef]
- Redondo-Iglesias, E.; Venet, P.; Pelissier, S. Efficiency degradation model of lithium-ion batteries for electric vehicles. IEEE Transactions on Industry Applications 2018, 55, 1932–1940. [Google Scholar] [CrossRef]
- Omariba, Z.B.; Zhang, L.; Sun, D. Review of battery cell balancing methodologies for optimizing battery pack performance in electric vehicles. IEEE Access 2019, 7, 129335–129352. [Google Scholar] [CrossRef]
- Yang, J.; Strickland, D.; Abedi-Varnosfaderani, M. Comparison of Different Battery Balancing Methods for use with Second Life Batteries. In Proceedings of the ICRERA; 2020; pp. 112–117. [CrossRef]
- Schuster, S.F.; Brand, M.J.; Berg, P.; Gleissenberger, M.; Jossen, A. Lithium-ion cell-to-cell variation during battery electric vehicle operation. Journal of Power Sources 2015, 297, 242–251. [Google Scholar] [CrossRef]
- Jiang, Y.; Jiang, J.; Zhang, C.; Zhang, W.; Gao, Y.; Guo, Q. Recognition of battery aging variations for LiFePO4 batteries in 2nd use applications combining incremental capacity analysis and statistical approaches. Journal of Power Sources 2017, 360, 180–188. [Google Scholar] [CrossRef]
- Xu, X.; Mi, J.; Fan, M.; Yang, K.; Wang, H.; Liu, J.; Yan, H. Study on the performance evaluation and echelon utilization of retired LiFePO4 power battery for smart grid. Journal of Cleaner Production 2019, 213, 1080–1086. [Google Scholar] [CrossRef]
- Zhang, Y.; Zhou, Z.; Kang, Y.; Zhang, C.; Duan, B. A quick screening approach based on fuzzy C-means algorithm for the second usage of retired lithium-ion batteries. IEEE Transactions on Transportation Electrification 2020, 7, 474–484. [Google Scholar] [CrossRef]
- Zhou, Z.; Duan, B.; Kang, Y.; Shang, Y.; Cui, N.; Chang, L.; Zhang, C. An efficient screening method for retired lithium-ion batteries based on support vector machine. Journal of Cleaner Production 2020, 267, 121882. [Google Scholar] [CrossRef]
- Braco, E.; San Martín, I.; Berrueta, A.; Sanchis, P.; Ursúa, A. Experimental assessment of first-and second-life electric vehicle batteries: Performance, capacity dispersion, and aging. IEEE Transactions on Industry Applications 2021, 57, 4107–4117. [Google Scholar] [CrossRef]
- Baumann, M.; Wildfeuer, L.; Rohr, S.; Lienkamp, M. Parameter variations within Li-Ion battery packs–Theoretical investigations and experimental quantification. Journal of Energy Storage 2018, 18, 295–307. [Google Scholar] [CrossRef]
- Koppelaar, R.H.; Pamidi, S.; Hajósi, E.; Herreras, L.; Leroy, P.; Jung, H.Y.; Concheso, A.; Daniel, R.; Francisco, F.B.; Parrado, C.; et al. A Digital Product Passport for Critical Raw Materials Reuse and Recycling. Sustainability 2023, 15, 1405. [Google Scholar] [CrossRef]
- Weng, A.; Dufek, E.; Stefanopoulou, A. Battery passports for promoting electric vehicle resale and repurposing. Joule 2023, 7, 837–842. [Google Scholar] [CrossRef]
- Gu, X.; Bai, H.; Cui, X.; Zhu, J.; Zhuang, W.; Li, Z.; Hu, X.; Song, Z. Challenges and opportunities for second-life batteries: Key technologies and economy. Renewable and Sustainable Energy Reviews 2024, 192, 114191. [Google Scholar] [CrossRef]
- Zorn, M.; Ionescu, C.; Klohs, D.; Zähl, K.; Kisseler, N.; Daldrup, A.; Hams, S.; Zheng, Y.; Offermanns, C.; Flamme, S.; et al. An approach for automated disassembly of lithium-ion battery packs and high-quality recycling using computer vision, labeling, and material characterization. Recycling 2022, 7, 48. [Google Scholar] [CrossRef]
- Naseri, F.; Gil, S.; Barbu, C.; Cetkin, E.; Yarimca, G.; Jensen, A.; Larsen, P.; Gomes, C. Digital twin of electric vehicle battery systems: Comprehensive review of the use cases, requirements, and platforms. Renewable and Sustainable Energy Reviews 2023, 179, 113280. [Google Scholar] [CrossRef]
- Schmid, A.U.; Kurka, M.; Birke, K.P. Reproducibility of Li-ion cell reassembling processes and their influence on coin cell aging. Journal of Energy Storage 2019, 24, 100732. [Google Scholar] [CrossRef]
- SDI, S. Safety data sheet. Technical report, SAMSUNG SDI, 2016.
- BMW. The BMW i3 rescue guideline. Technical report, BMW, 2016.
- Mandrile, F.; Pastorelli, M.; Musumeci, S.; Urkiri, I.A.; Remirez, A. Second Life Management from Battery Storage System of Electric Waterborne Transport Applications: Perspectives and Solutions. IEEE Access 2023. [Google Scholar] [CrossRef]
- Phophongviwat, T.; Polmai, S.; Maneeinn, C.; Hongesombut, K.; Sivalertporn, K. Technical Assessment of Reusing Retired Electric Vehicle Lithium-Ion Batteries in Thailand. World Electric Vehicle Journal 2023, 14, 161. [Google Scholar] [CrossRef]
- Chirumalla, K.; Kulkov, I.; Vu, F.; Rahic, M. Second life use of Li-ion batteries in the heavy-duty vehicle industry: Feasibilities of remanufacturing, repurposing, and reusing approaches. Sustainable Production and Consumption 2023, 42, 351–366. [Google Scholar] [CrossRef]
- Hassini, M.; Redondo-Iglesias, E.; Venet, P. Second-Life Batteries Modeling for Performance Tracking in a Mobile Charging Station. World Electric Vehicle Journal 2023, 14, 94. [Google Scholar] [CrossRef]
- Contò, C.; Bianchi, N. E-Bike Motor Drive: A Review of Configurations and Capabilities. Energies 2022, 16, 160. [Google Scholar] [CrossRef]
- Paw, Y.C.; Ang, E.Y.M. Battery cycle life assessment for a lift+ cruise electric vertical takeoff and landing transporter drone. Journal of Energy Storage 2023, 66, 107493. [Google Scholar] [CrossRef]
- Arrinda, M.; Oyarbide, M.; Macicior, H.; Muxika, E.; Popp, H.; Jahn, M.; Ganev, B.; Cendoya, I. Application dependent end-of-life threshold definition methodology for batteries in electric vehicles. Batteries 2021, 7, 12. [Google Scholar] [CrossRef]
- Le Duigou, A.; Guan, Y.; Amalric, Y. On the competitiveness of electric driving in France: Impact of driving patterns. Renewable and Sustainable Energy Reviews 2014, 37, 348–359. [Google Scholar] [CrossRef]
- Plötz, P.; Jakobsson, N.; Sprei, F. On the distribution of individual daily driving distances. Transportation research part B: methodological 2017, 101, 213–227. [Google Scholar] [CrossRef]
- Chowdhury, N.R.; Smith, A.J.; Frenander, K.; Mikheenkova, A.; Lindström, R.W.; Thiringer, T. Influence of state of charge window on the degradation of Tesla lithium-ion battery cells. Journal of Energy Storage 2024, 76, 110001. [Google Scholar] [CrossRef]
- Saxena, S.; Le Floch, C.; MacDonald, J.; Moura, S. Quantifying EV battery end-of-life through analysis of travel needs with vehicle powertrain models. J. Power Sources 2015, 282, 265–276. [Google Scholar] [CrossRef]
- Greenbank, S.; Howey, D. Automated feature extraction and selection for data-driven models of rapid battery capacity fade and end of life. IEEE Transactions on Industrial Informatics 2021, 18, 2965–2973. [Google Scholar] [CrossRef]
- Quinard, H.; Redondo-Iglesias, E.; Pelissier, S.; Venet, P. Fast electrical characterizations of high-energy second life lithium-ion batteries for embedded and stationary applications. Batteries 2019, 5, 33. [Google Scholar] [CrossRef]
- Xiong, W.; Mo, Y.; Yan, C. Online state-of-health estimation for second-use lithium-ion batteries based on weighted least squares support vector machine. IEEE Access 2020, 9, 1870–1881. [Google Scholar] [CrossRef]
- Liu, C.; Wen, X.; Zhong, J.; Liu, W.; Chen, J.; Zhang, J.; Wang, Z.; Liao, Q. Characterization of aging mechanisms and state of health for second-life 21700 ternary lithium-ion battery. Journal of Energy Storage 2022, 55, 105511. [Google Scholar] [CrossRef]
- Zhao, D.; Zhou, Z.; Zhang, P.; Zhang, Y.; Feng, Z.; Yang, Y.; Cao, Y. Health condition assessment of satellite li-ion battery pack considering battery inconsistency and pack performance indicators. Journal of Energy Storage 2023, 60, 106604. [Google Scholar] [CrossRef]
- EV-Volumes. The electric vehicle world sales database. https://www.ev-volumes.com/, accessed on 2024/01/13.
Figure 1.
Technical cycles of the circular battery. The notion of second life can refer to reuse or remanufacture. Reproduced with permission from Guilhem Grimaud [7].
Figure 1.
Technical cycles of the circular battery. The notion of second life can refer to reuse or remanufacture. Reproduced with permission from Guilhem Grimaud [7].
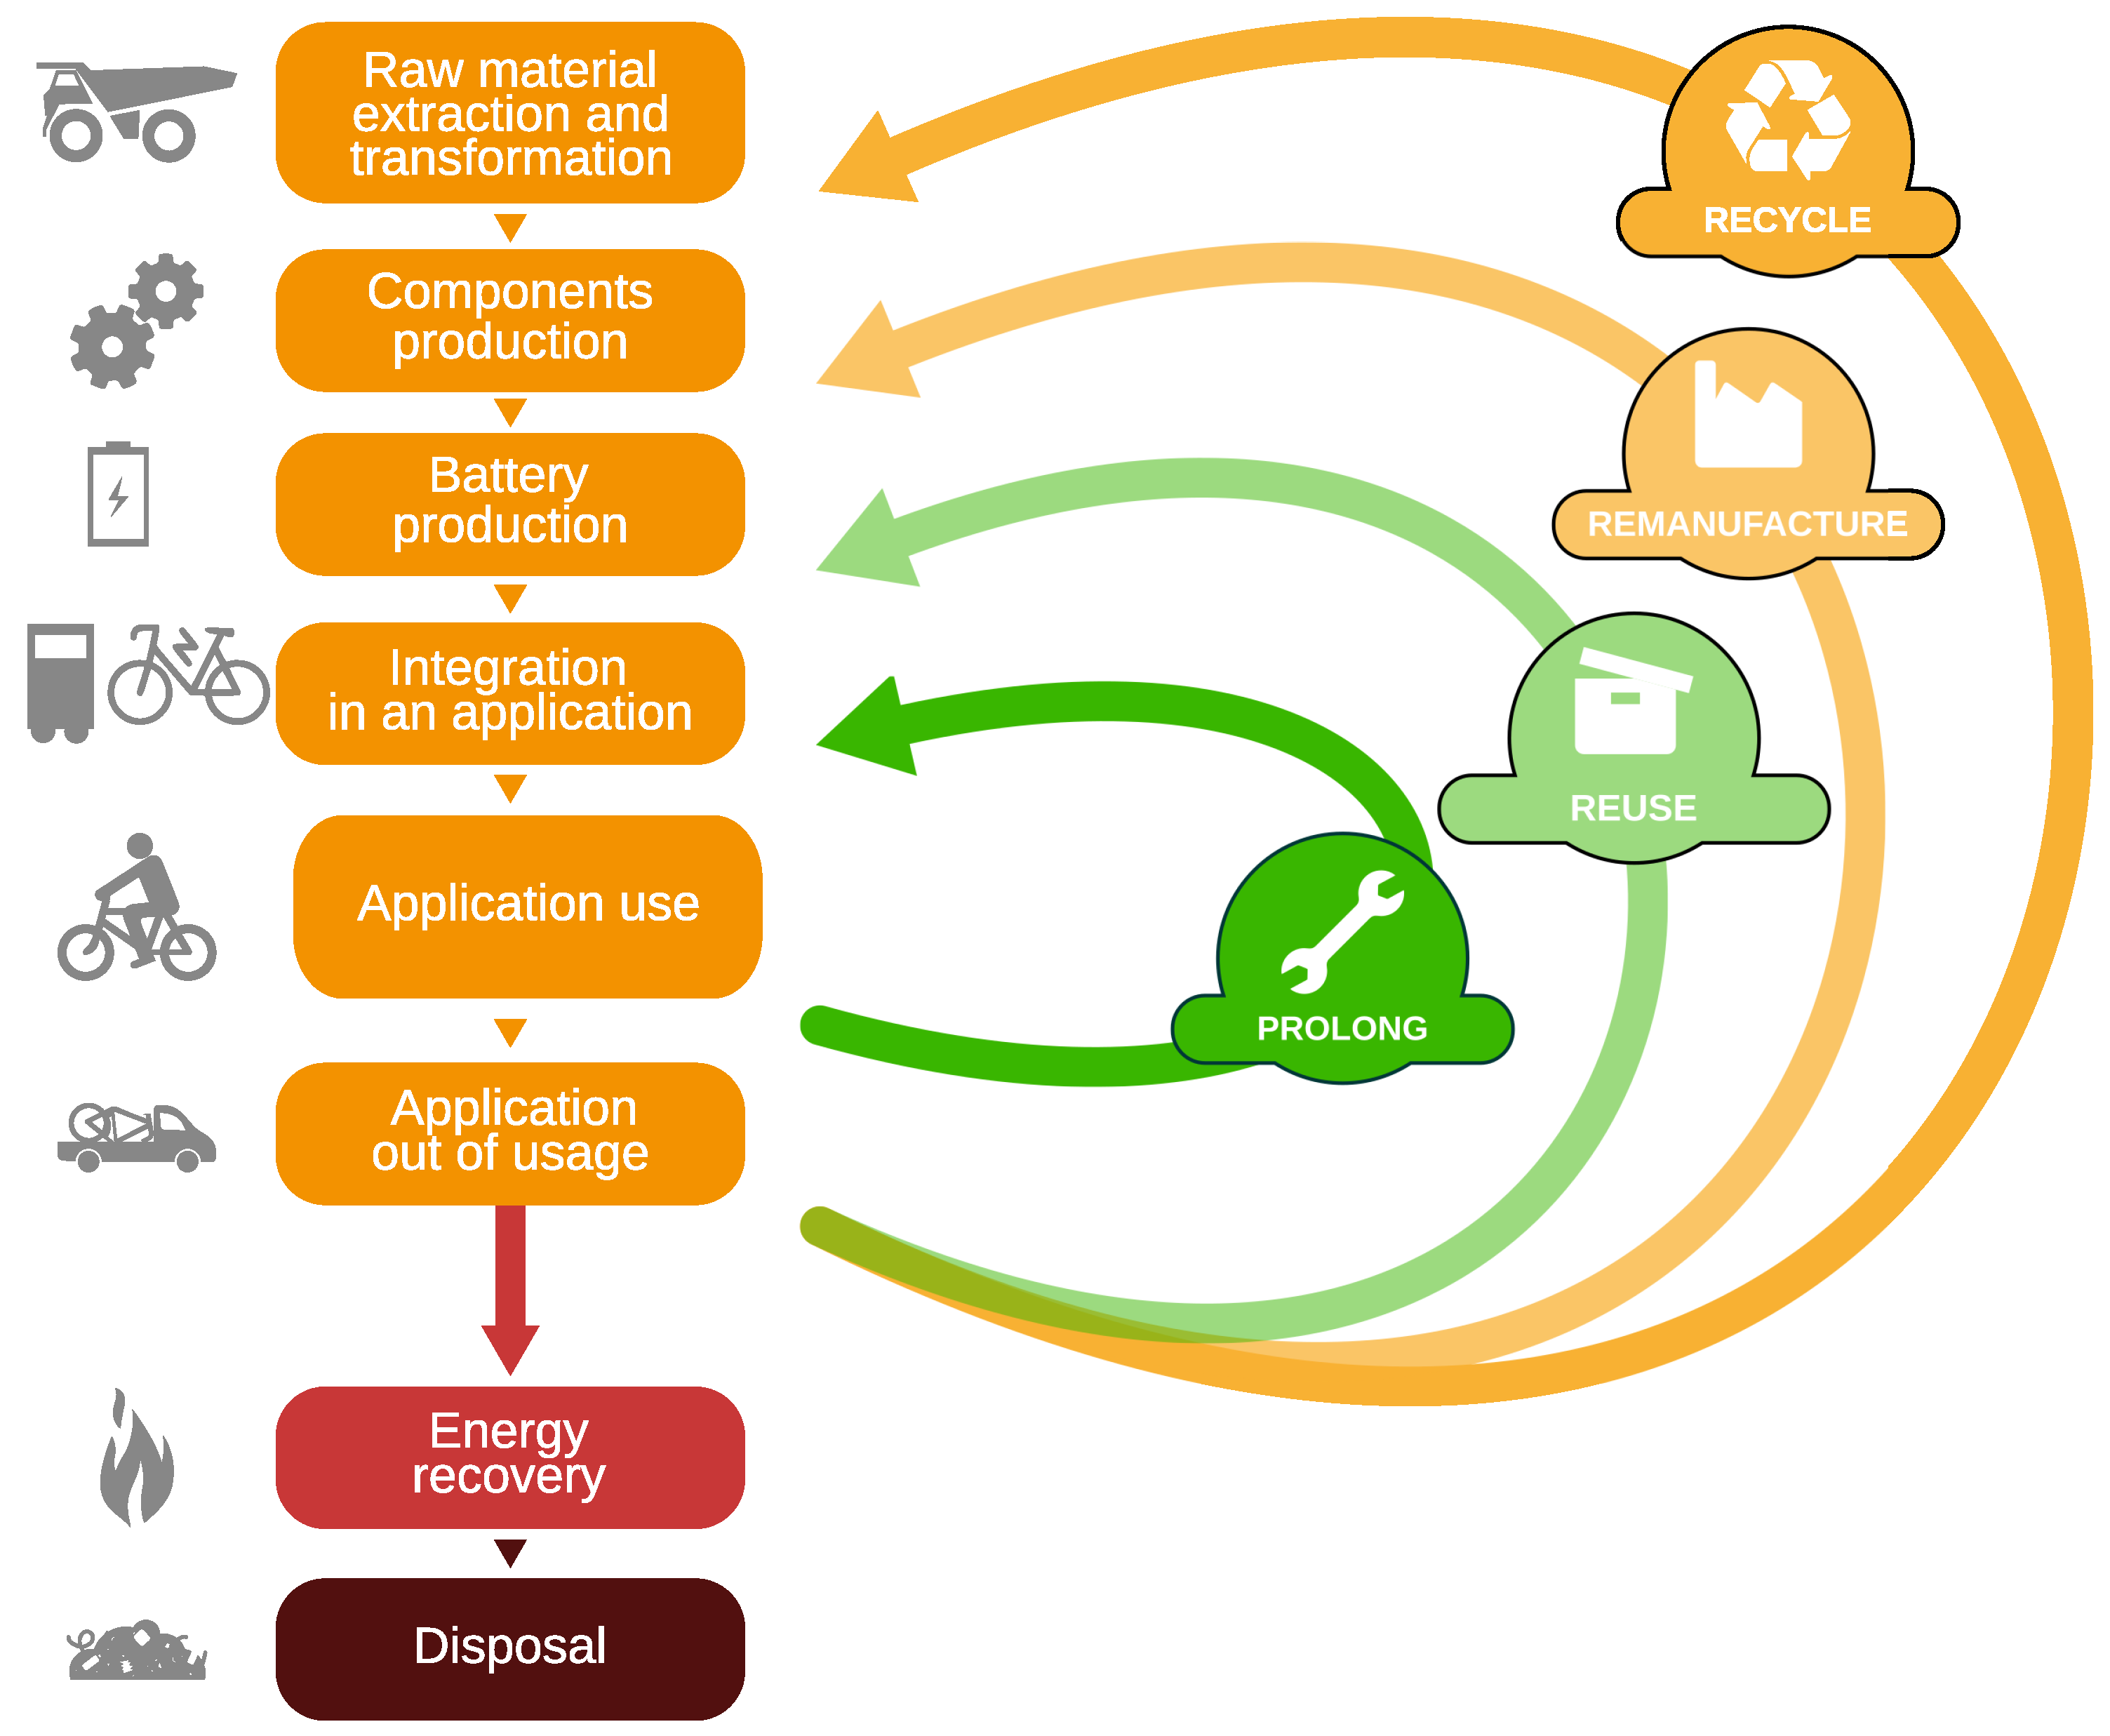
Figure 2.
Diversity of batteries technologies and formats used in the most sold vehicles from 2012. Made from data in Table A1. Shares are based in figures weighted by the number of sales.
Figure 2.
Diversity of batteries technologies and formats used in the most sold vehicles from 2012. Made from data in Table A1. Shares are based in figures weighted by the number of sales.
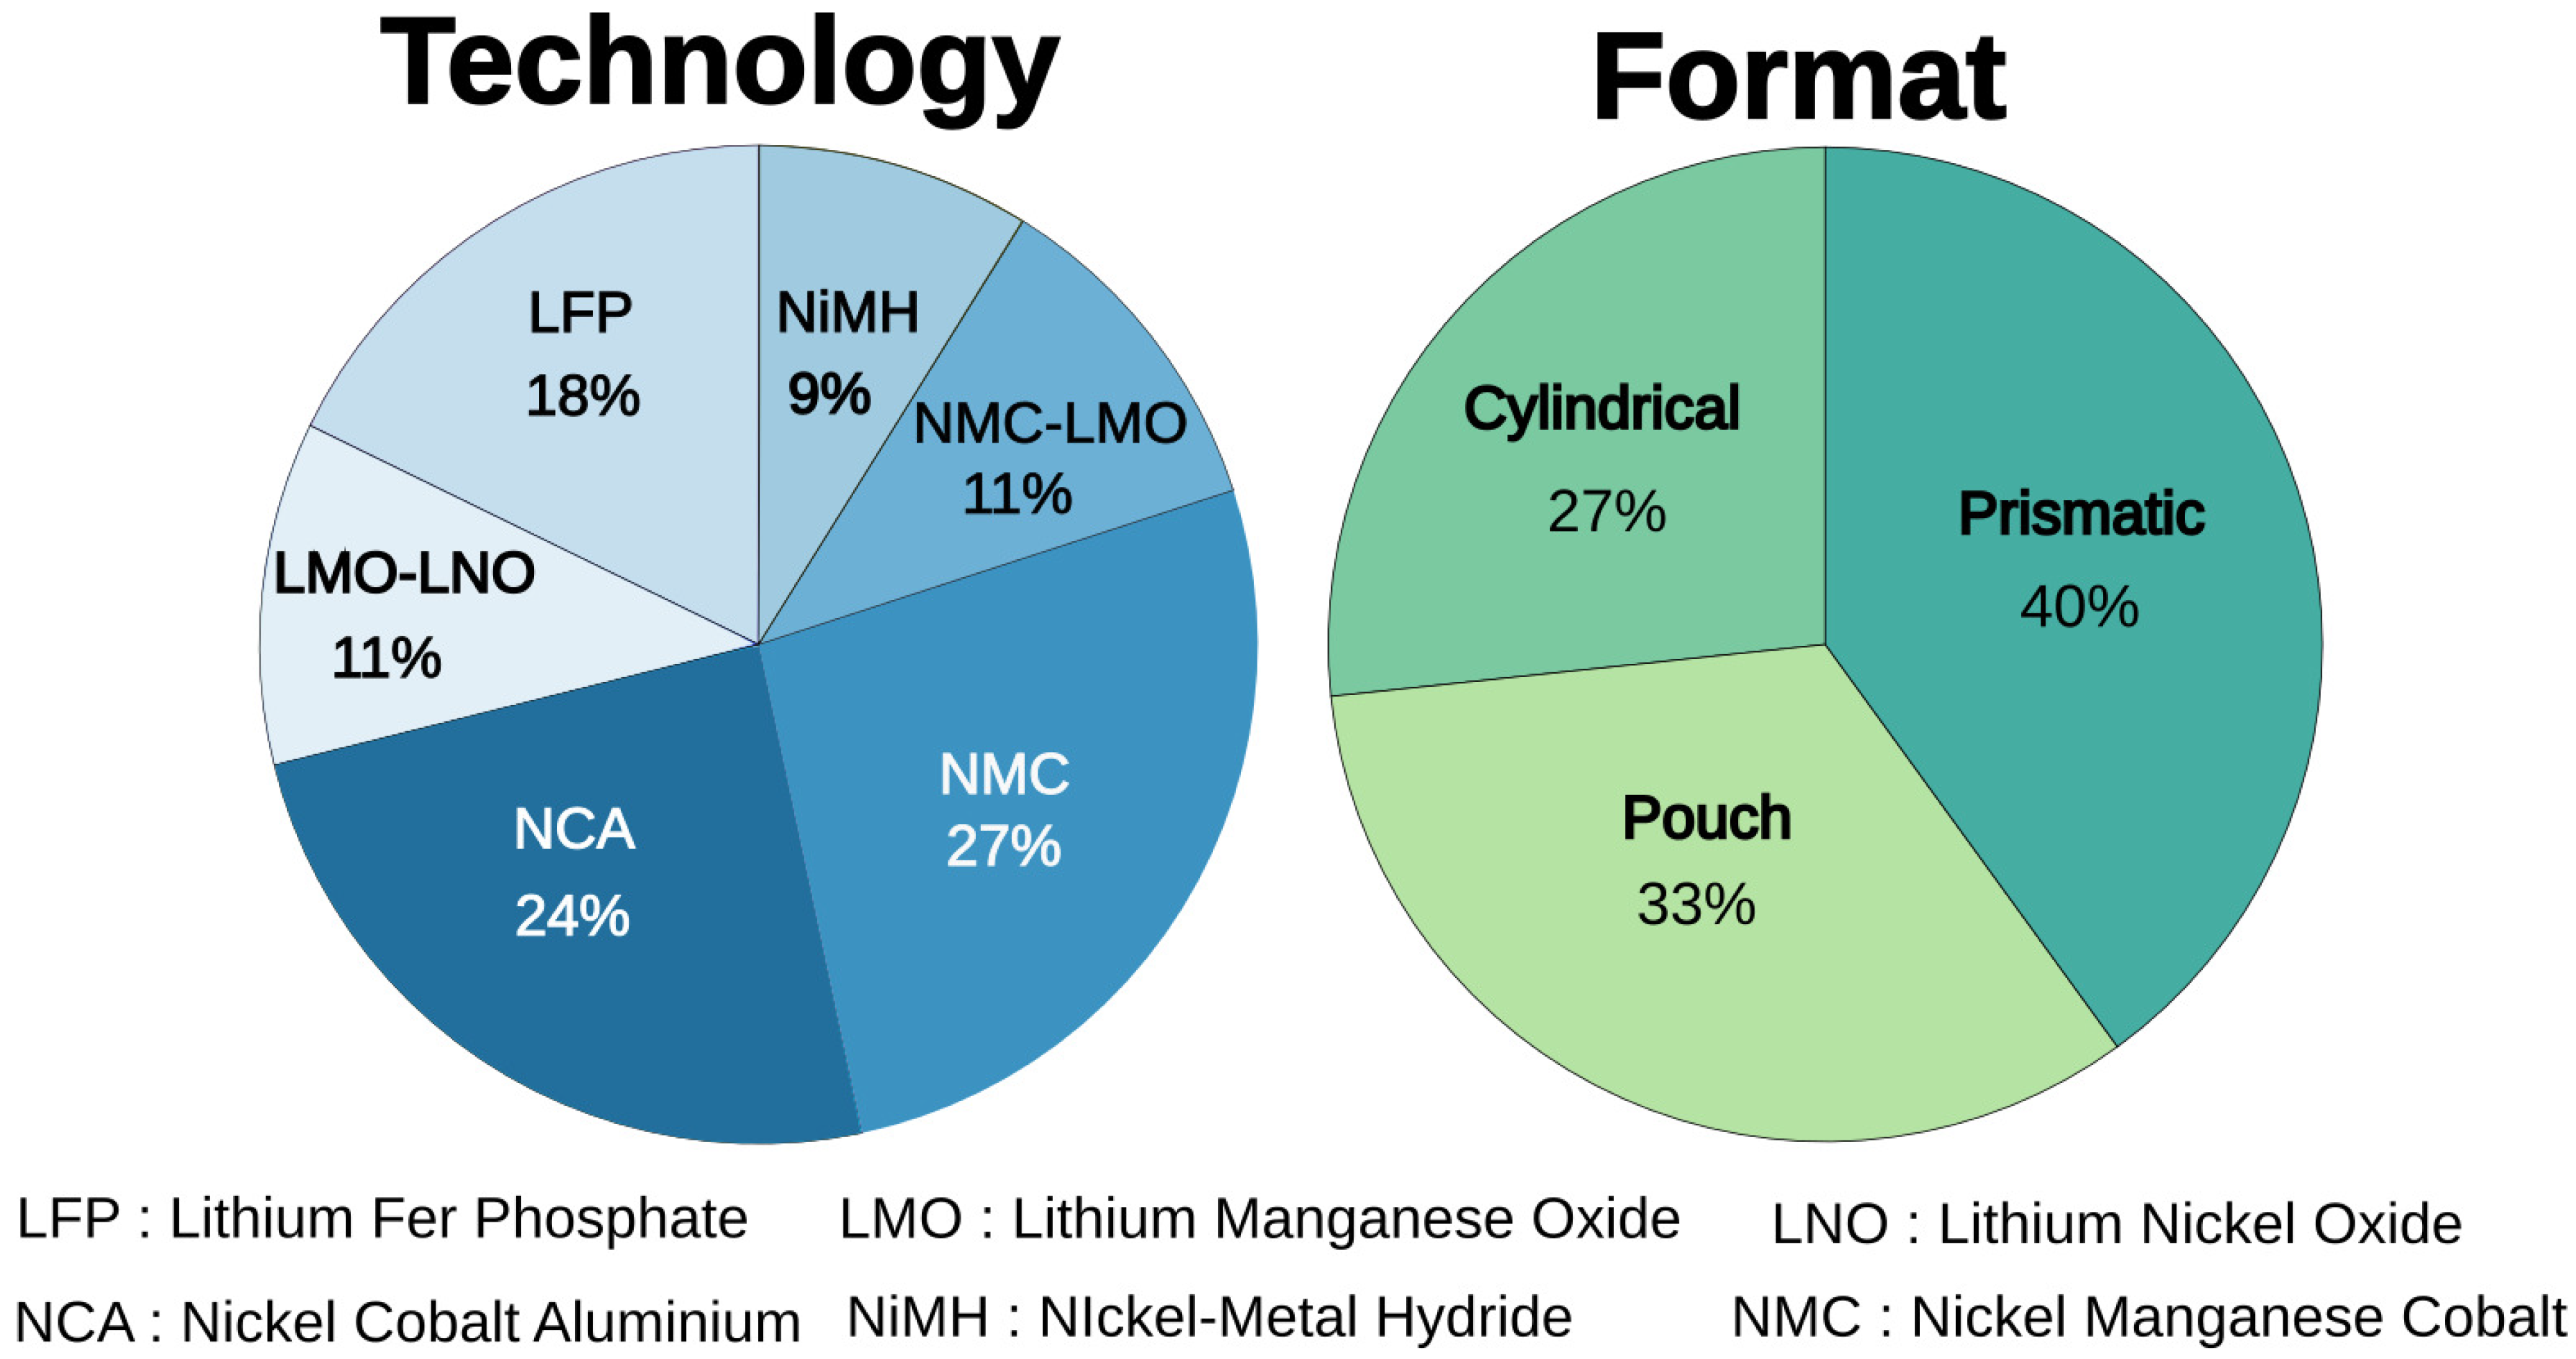
Figure 3.
BMW i3 module production date.
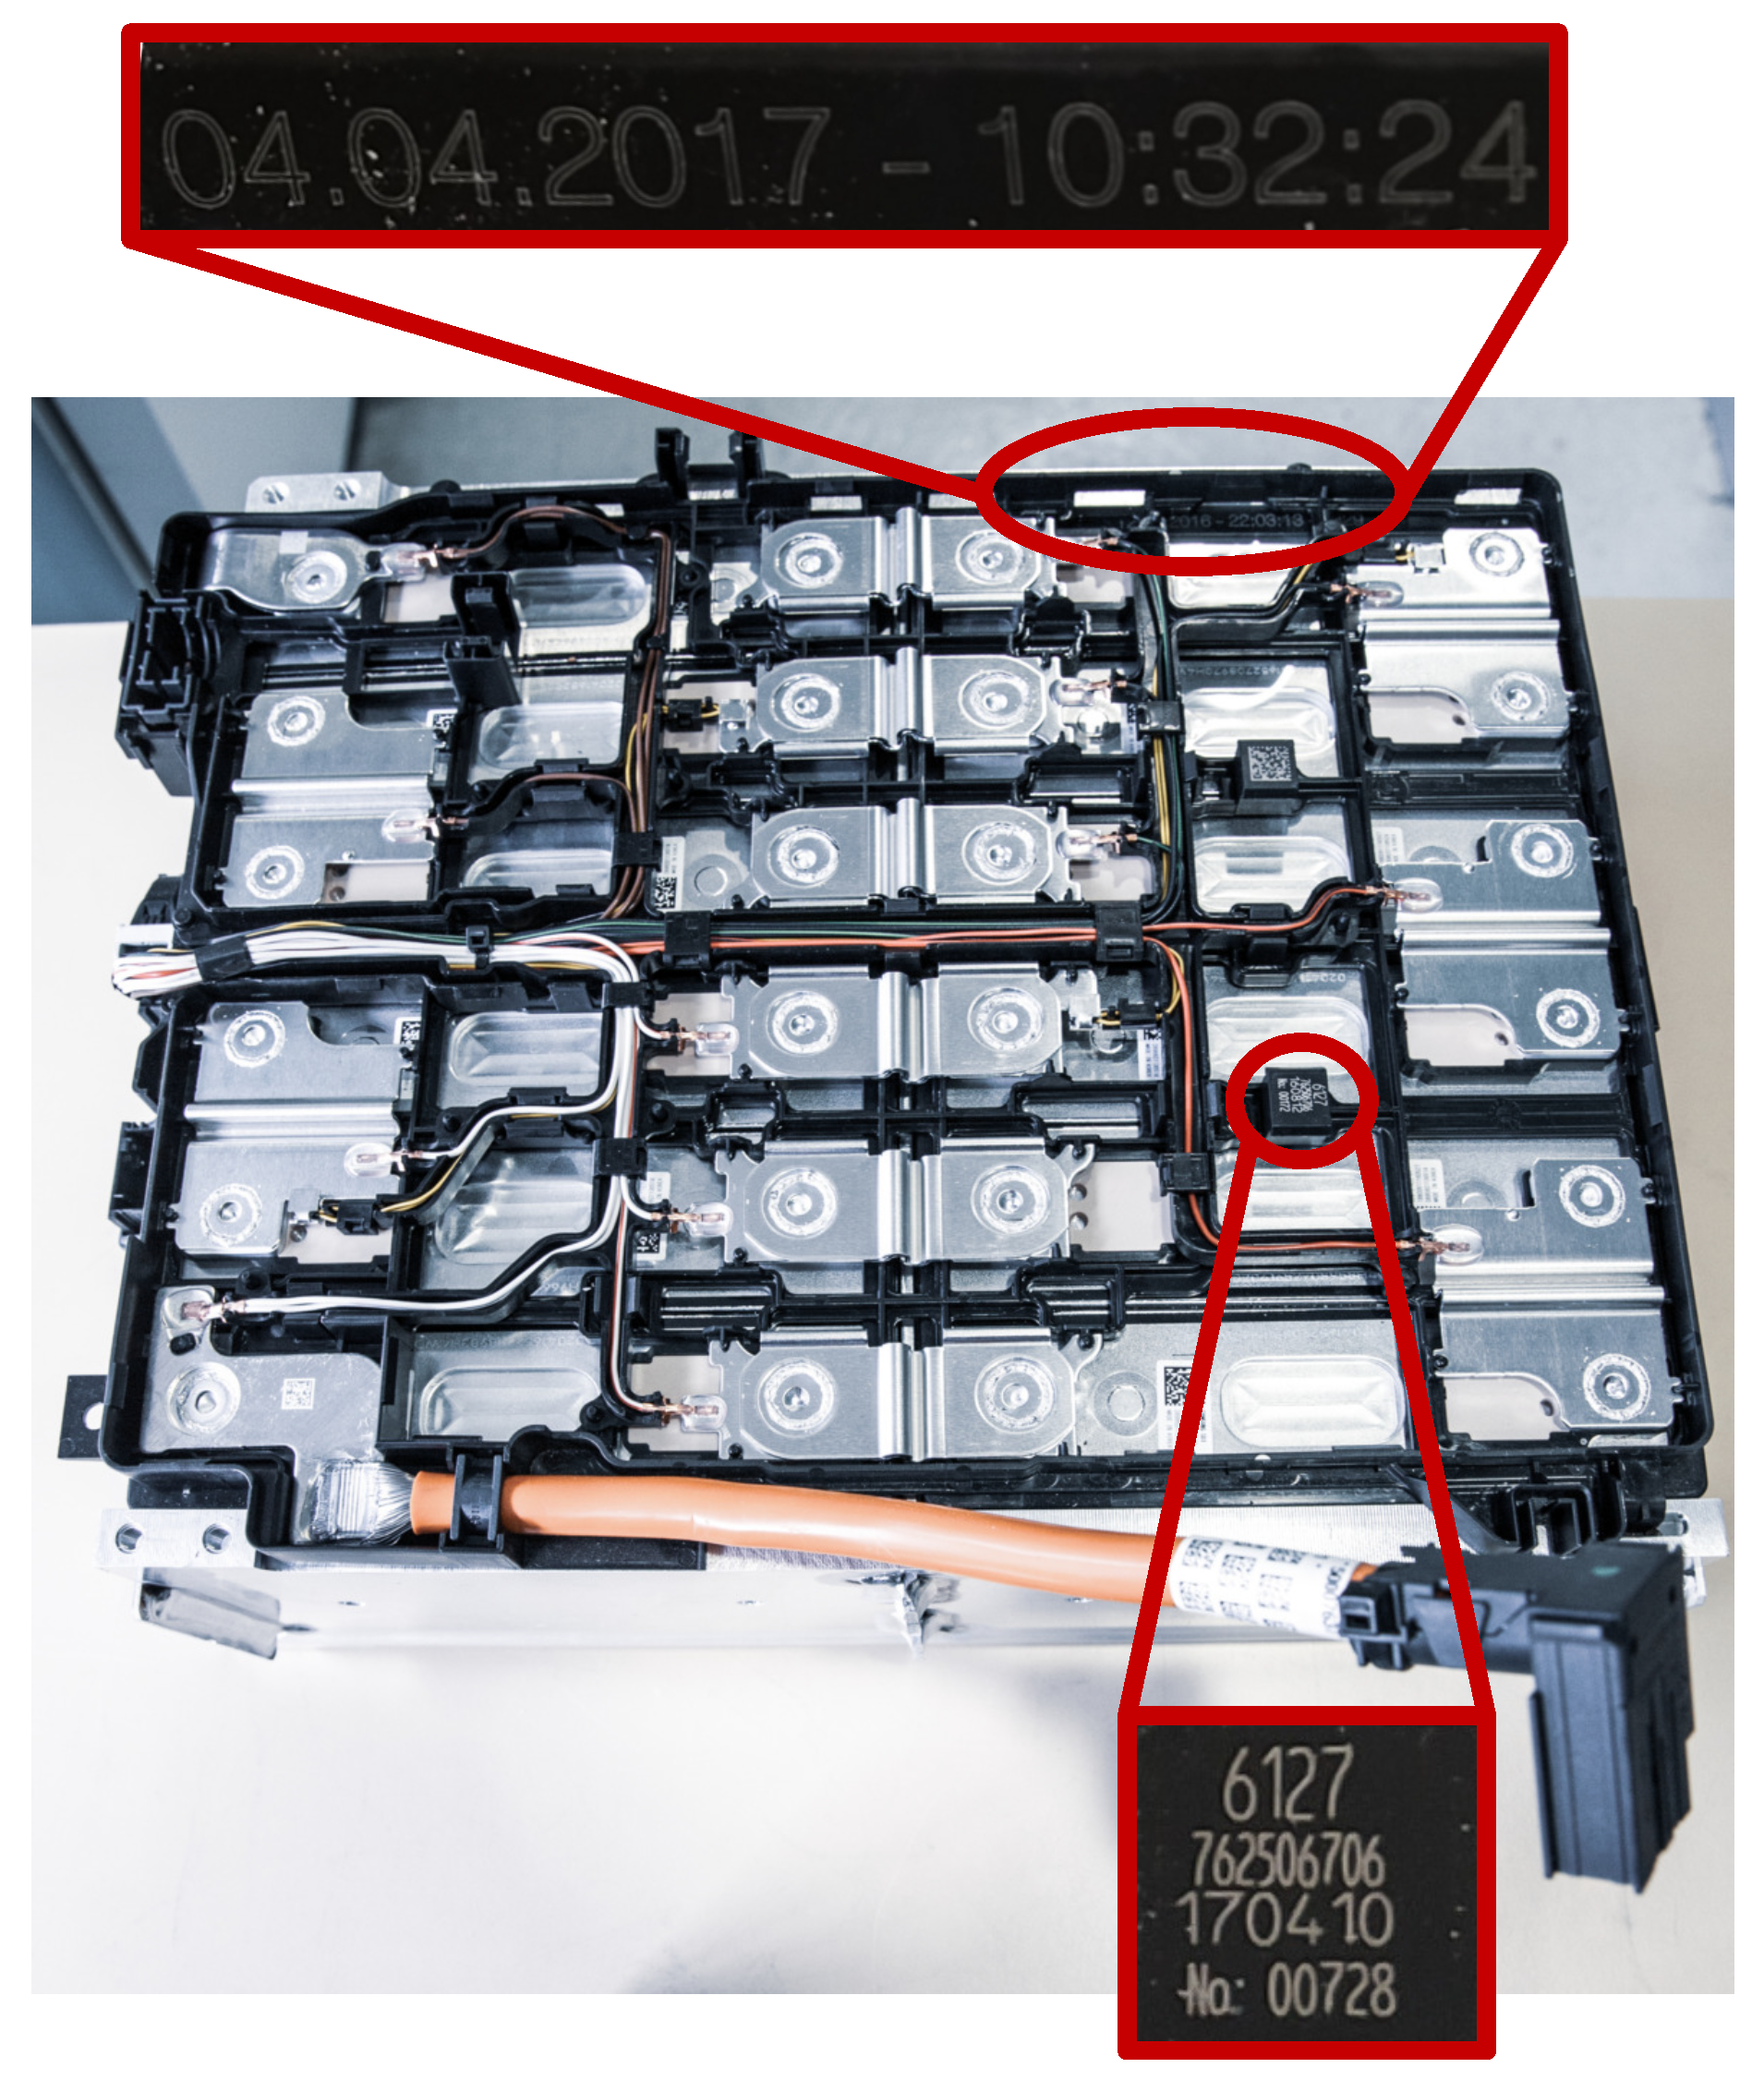
Figure 4.
Current and voltage evolution during the characterisation test.
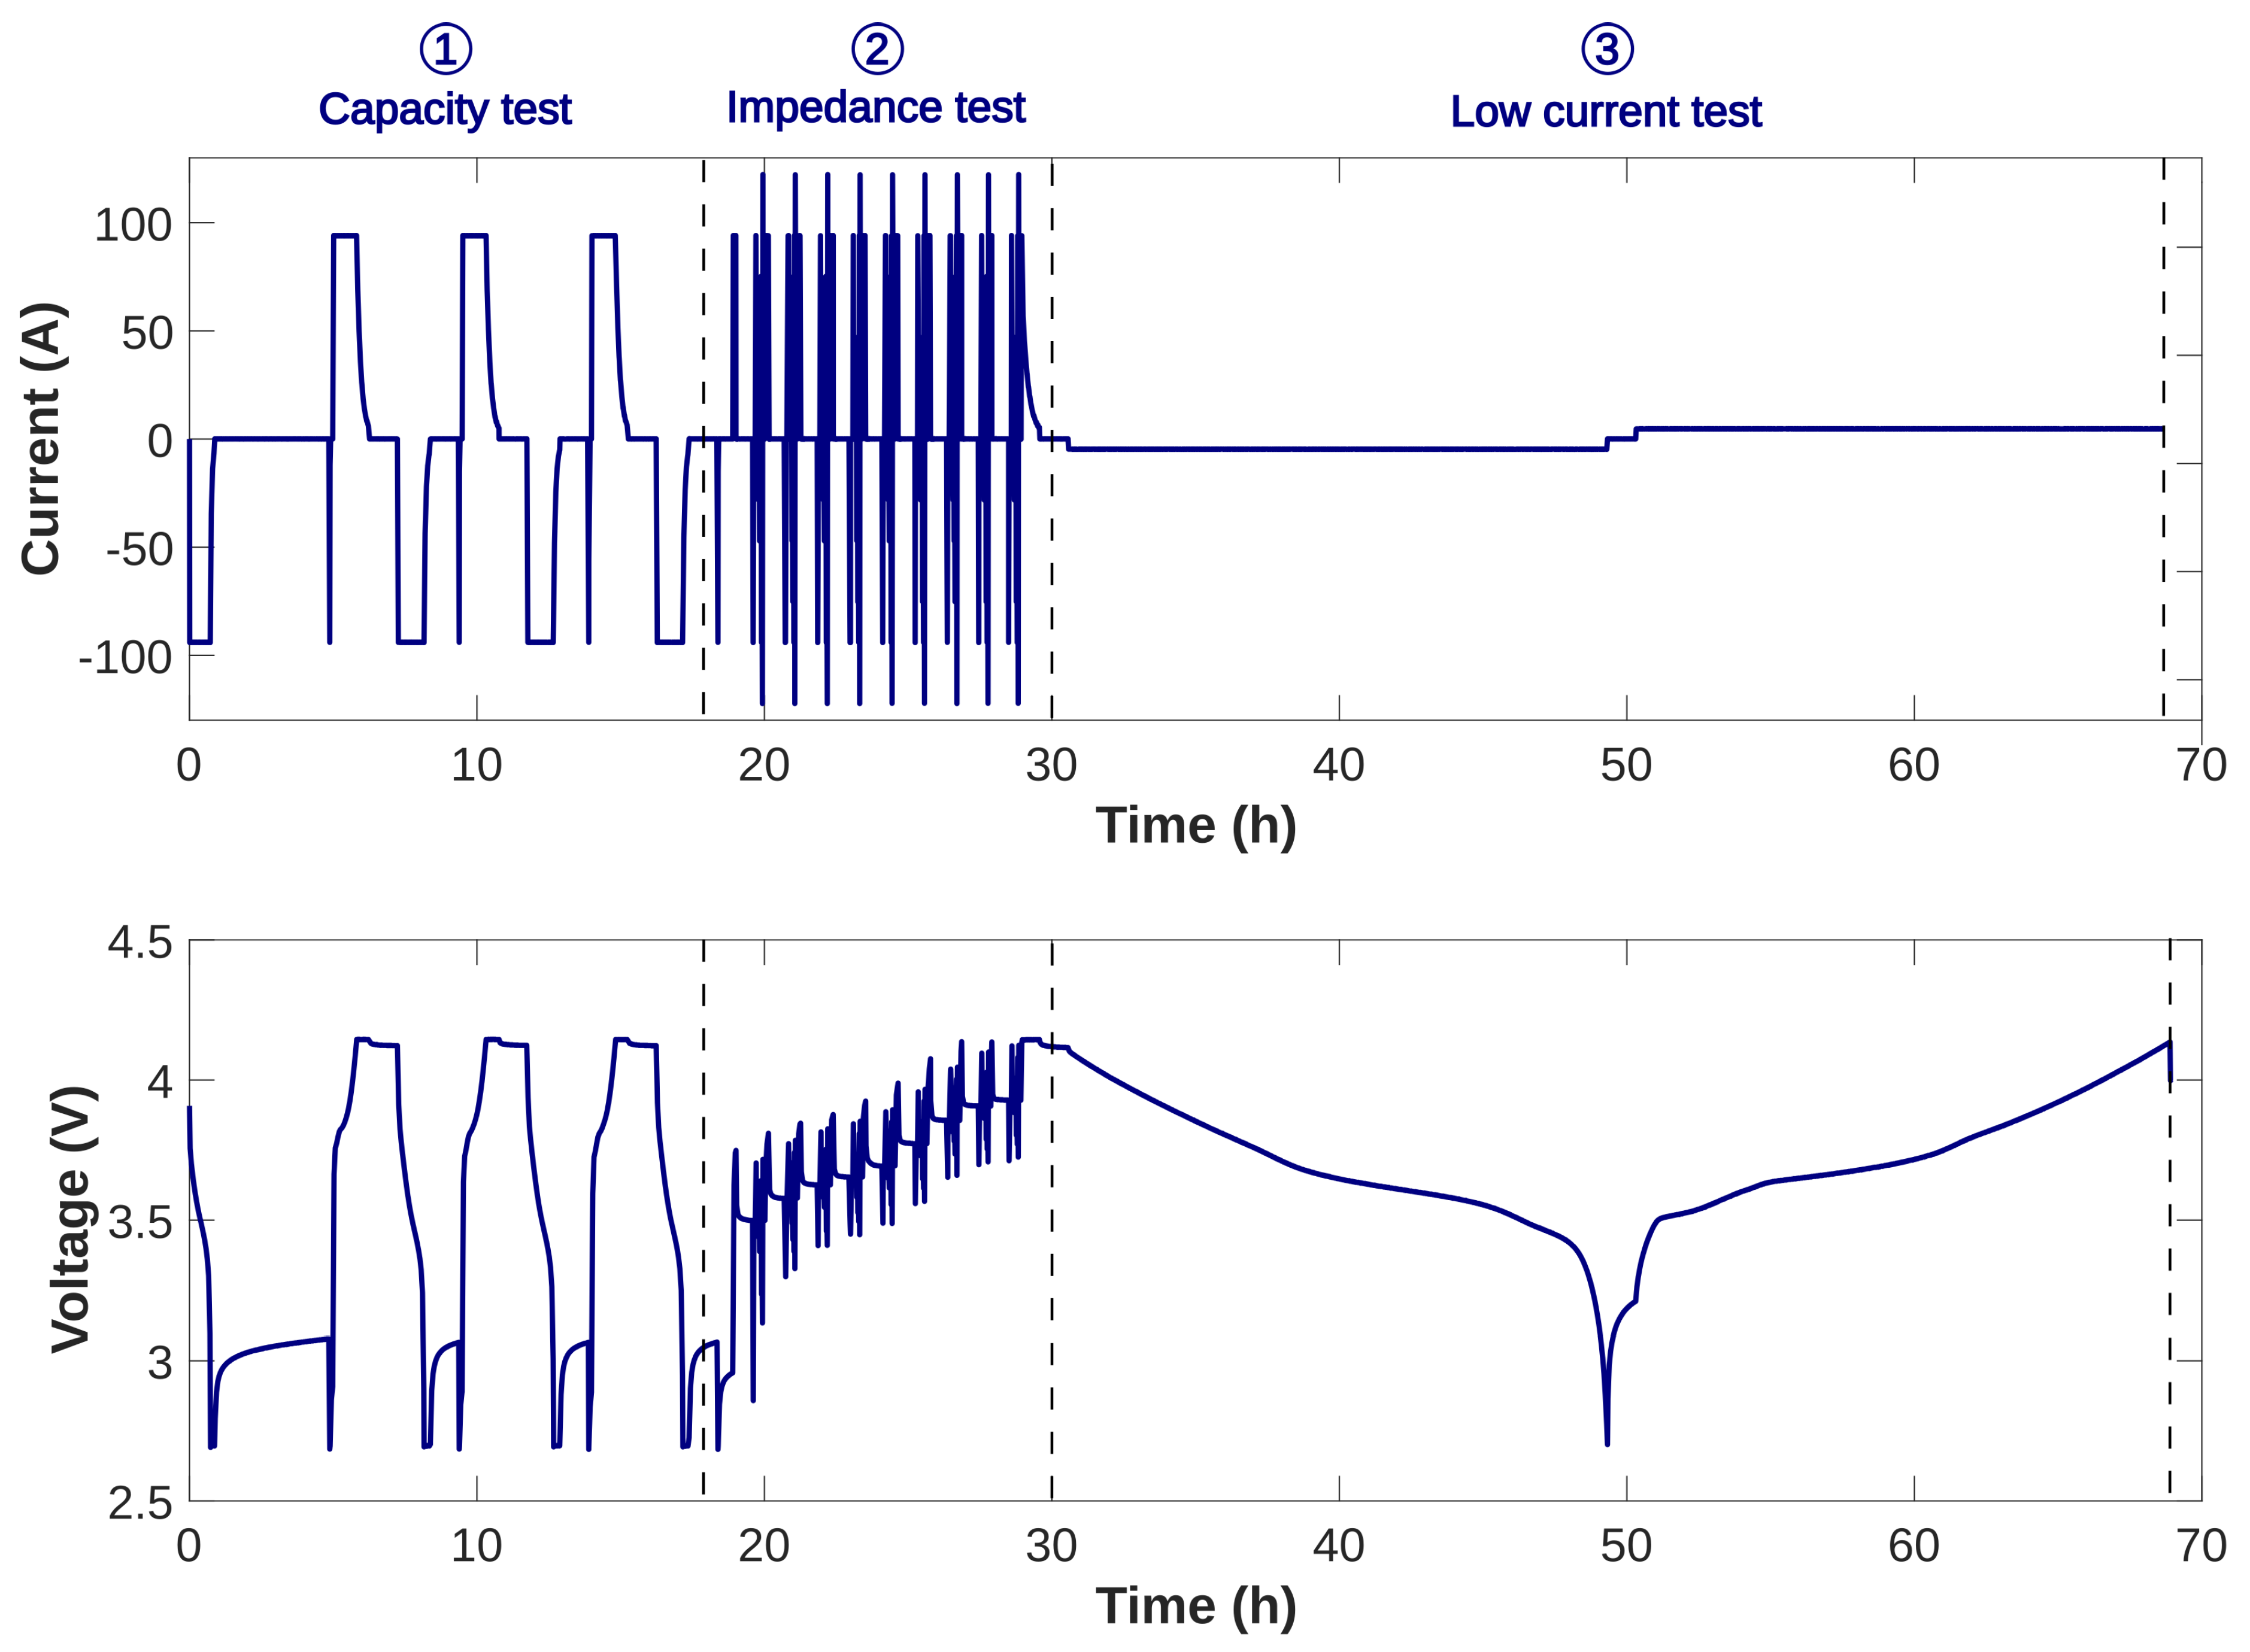
Figure 5.
Capacity dispersion of cells in a second life module.
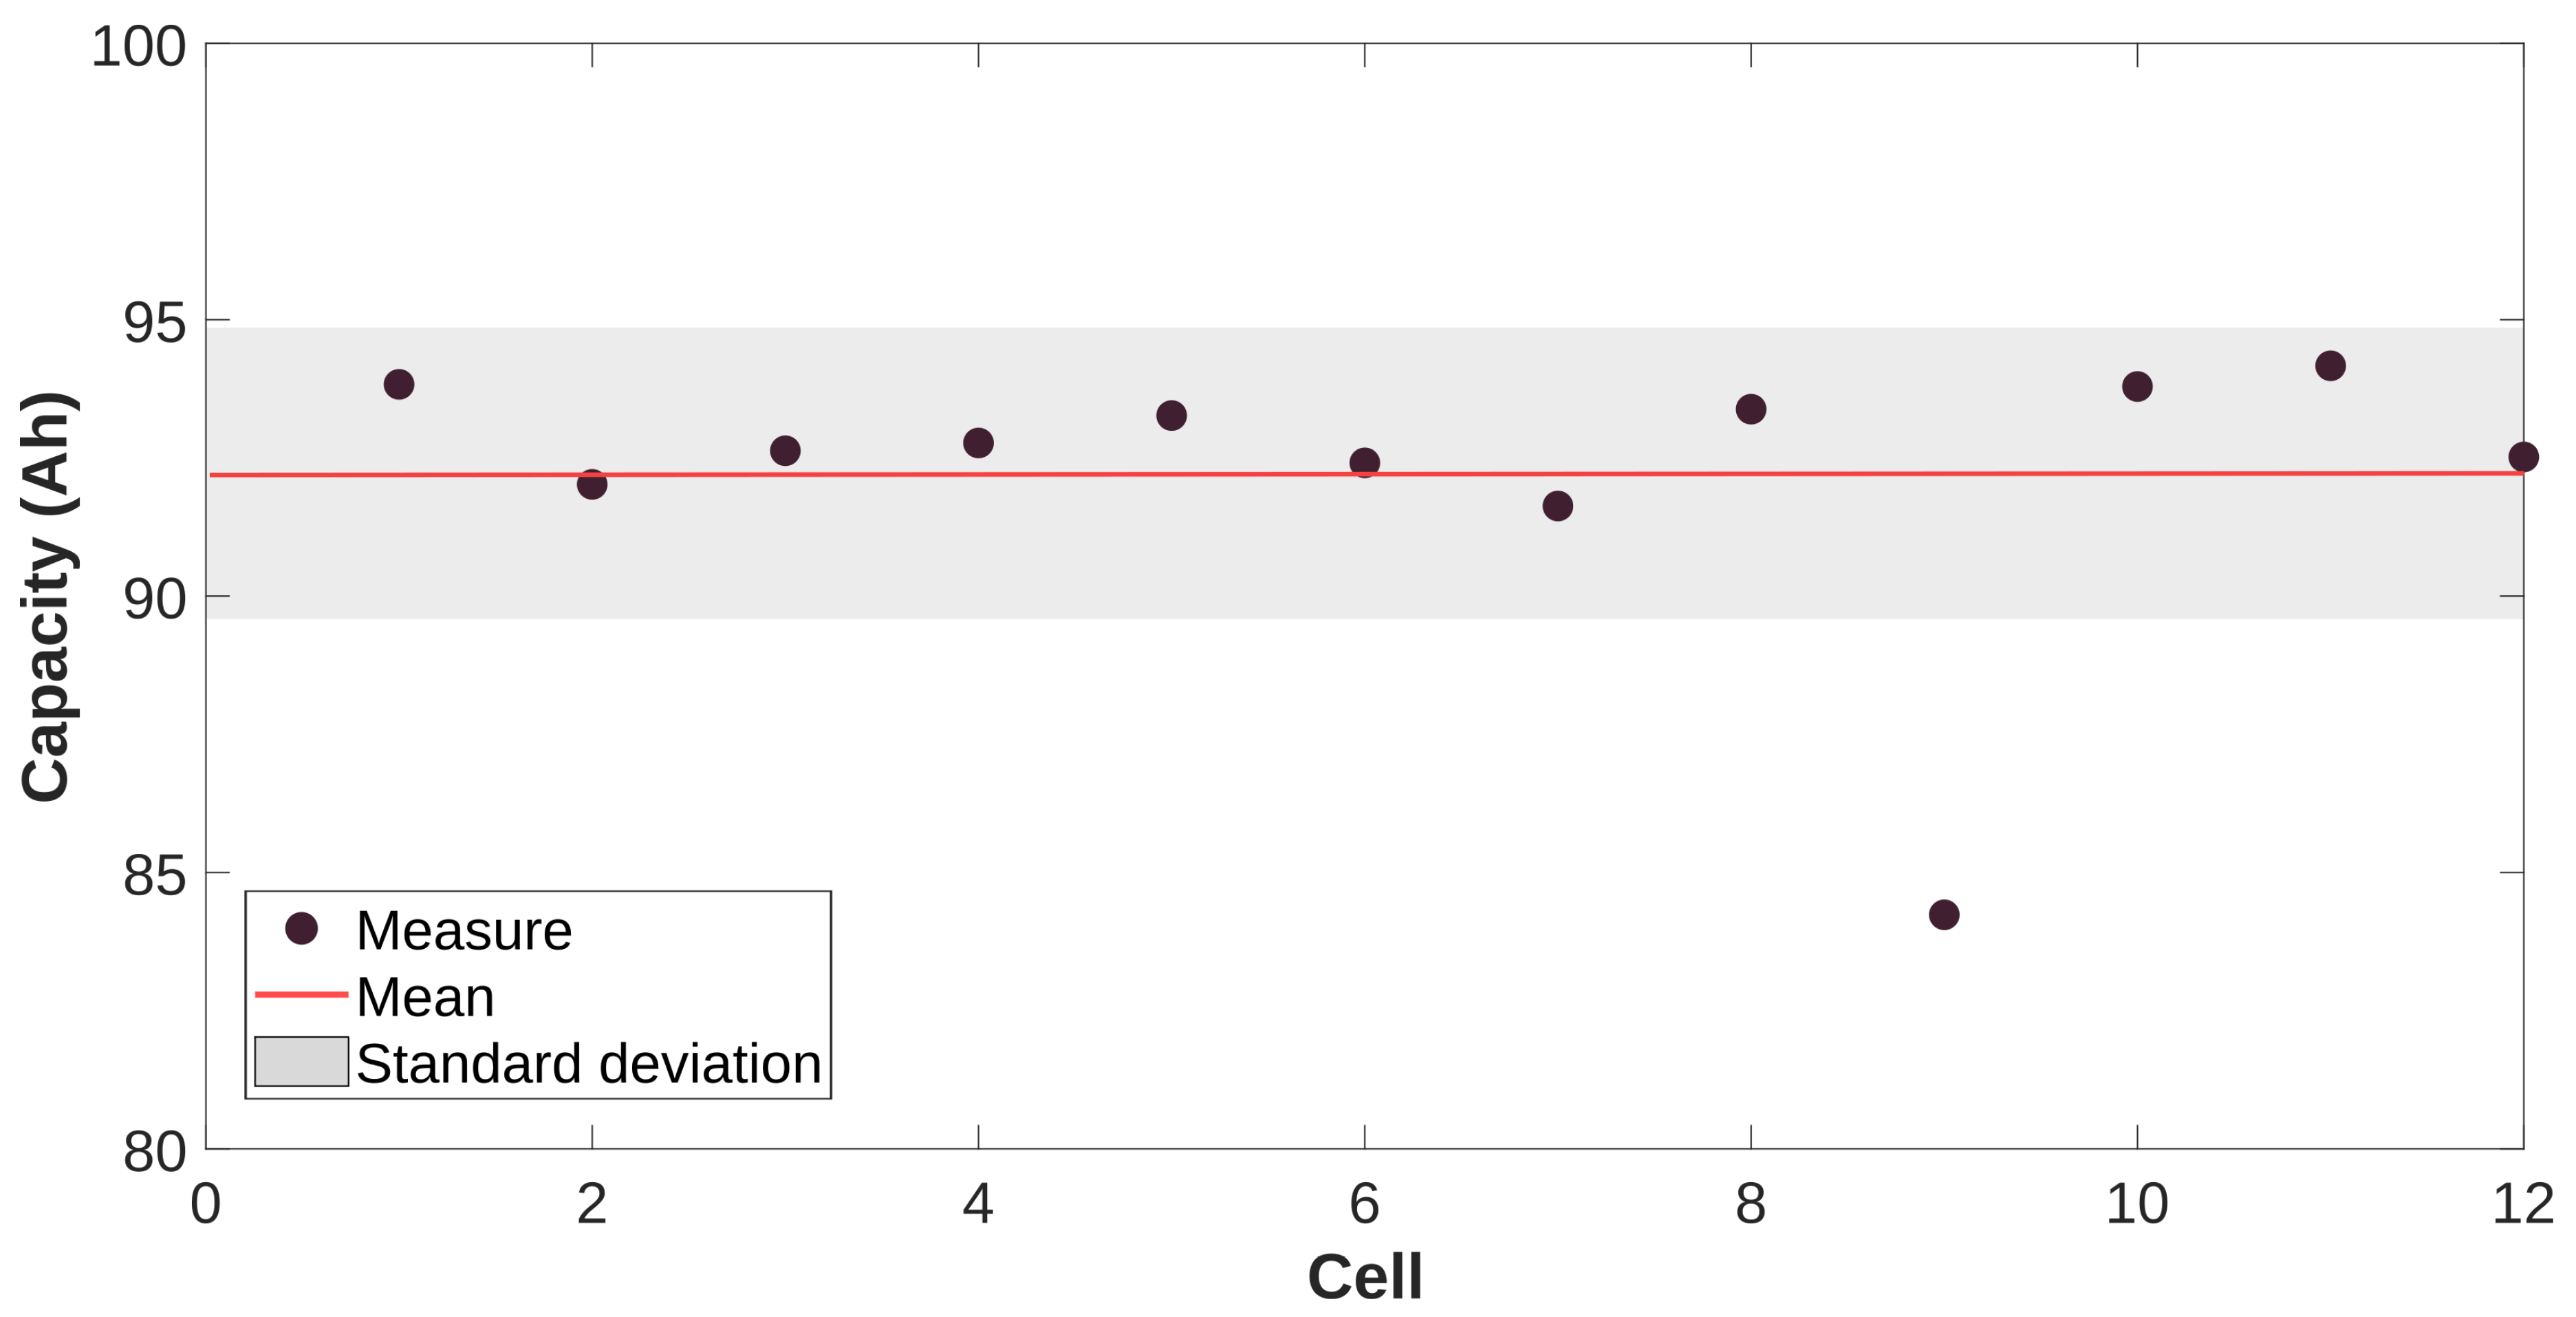
Figure 6.
Energy of the tested cells, blue light area show energy not available due to the performance dispersion. Measurement is made at 25°C, 1C and third measurement from step 1 is considered.
Figure 6.
Energy of the tested cells, blue light area show energy not available due to the performance dispersion. Measurement is made at 25°C, 1C and third measurement from step 1 is considered.
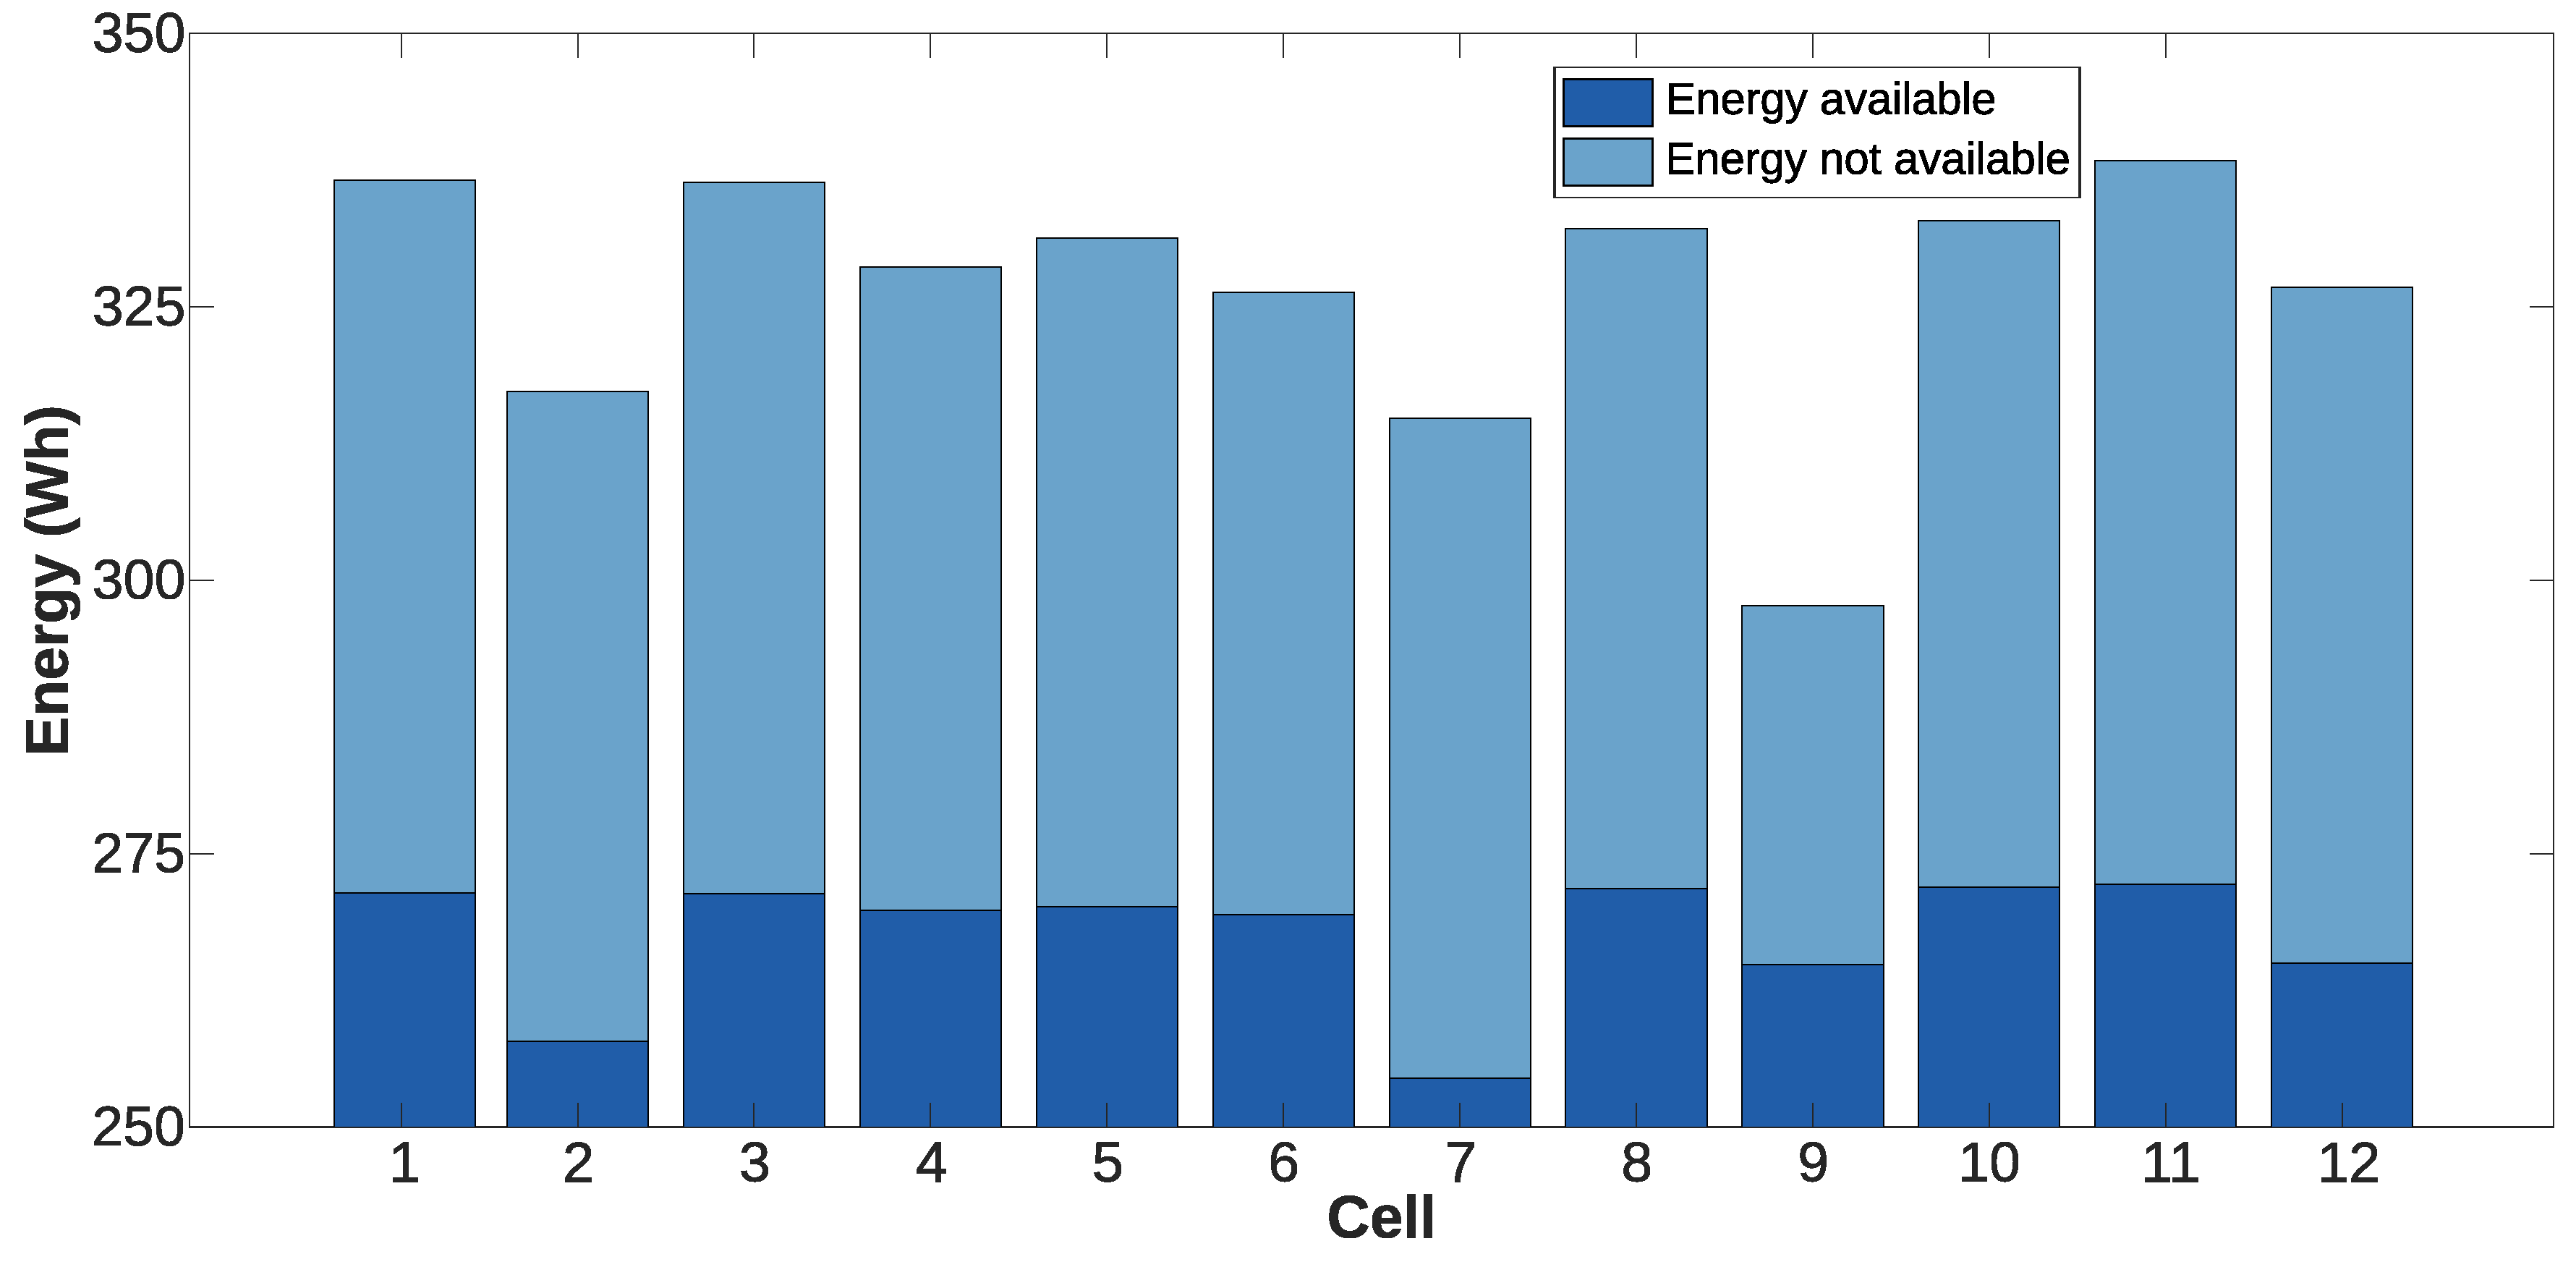
Figure 7.
Discharge resistance (a) and charge resistance (b) as a function of the state of charge for the various cells in the module.
Figure 7.
Discharge resistance (a) and charge resistance (b) as a function of the state of charge for the various cells in the module.
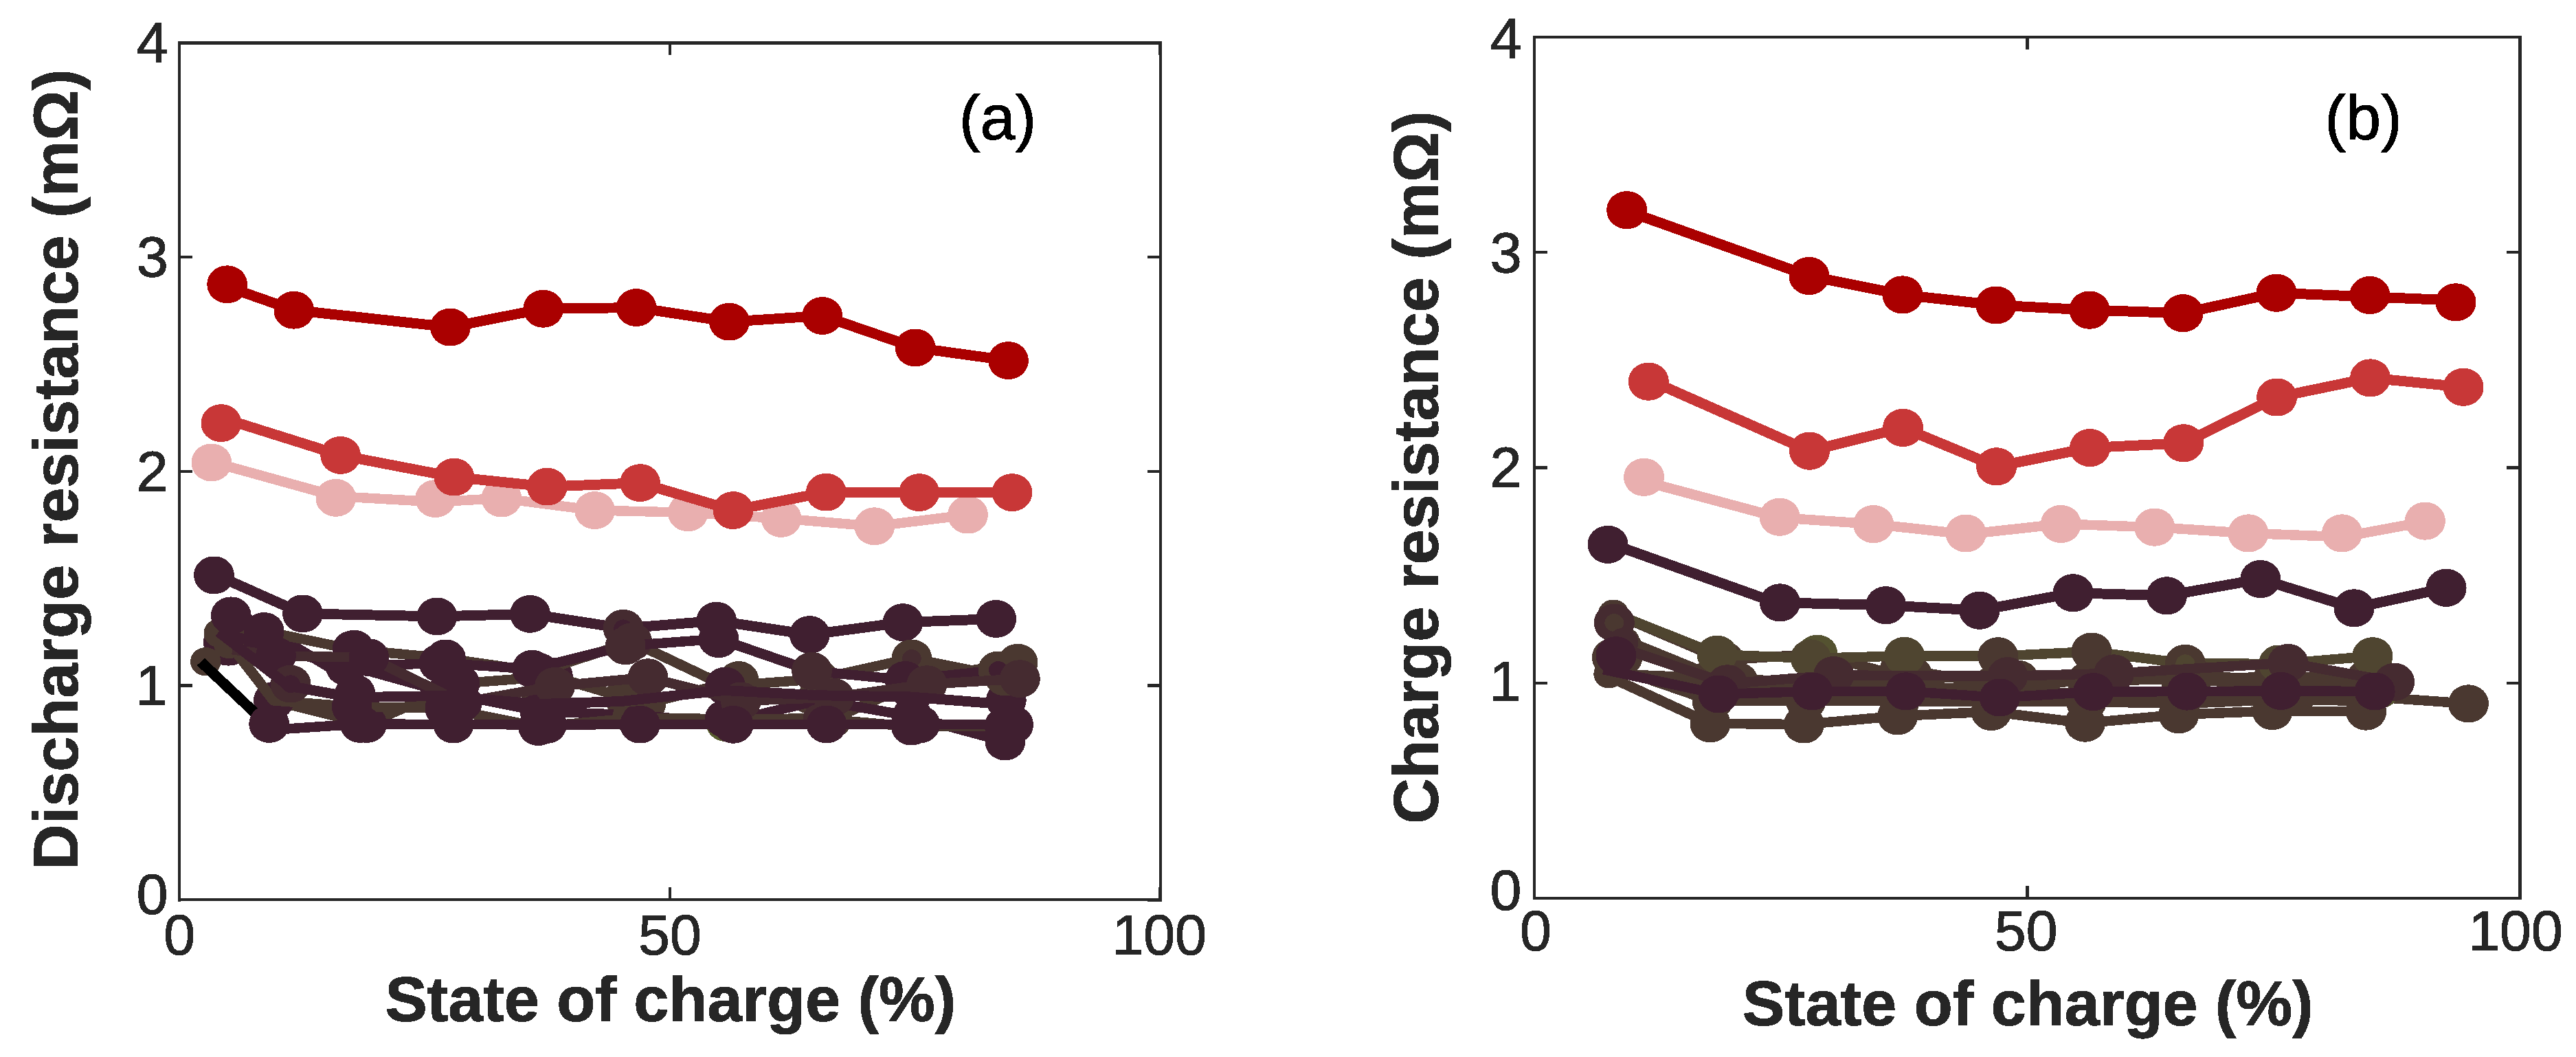
Figure 8.
Resistance dispersion of cells in a second life module. Resistance is measured in discharge with current pulses with a current rate 1C and at a state of charge of 50%.
Figure 8.
Resistance dispersion of cells in a second life module. Resistance is measured in discharge with current pulses with a current rate 1C and at a state of charge of 50%.
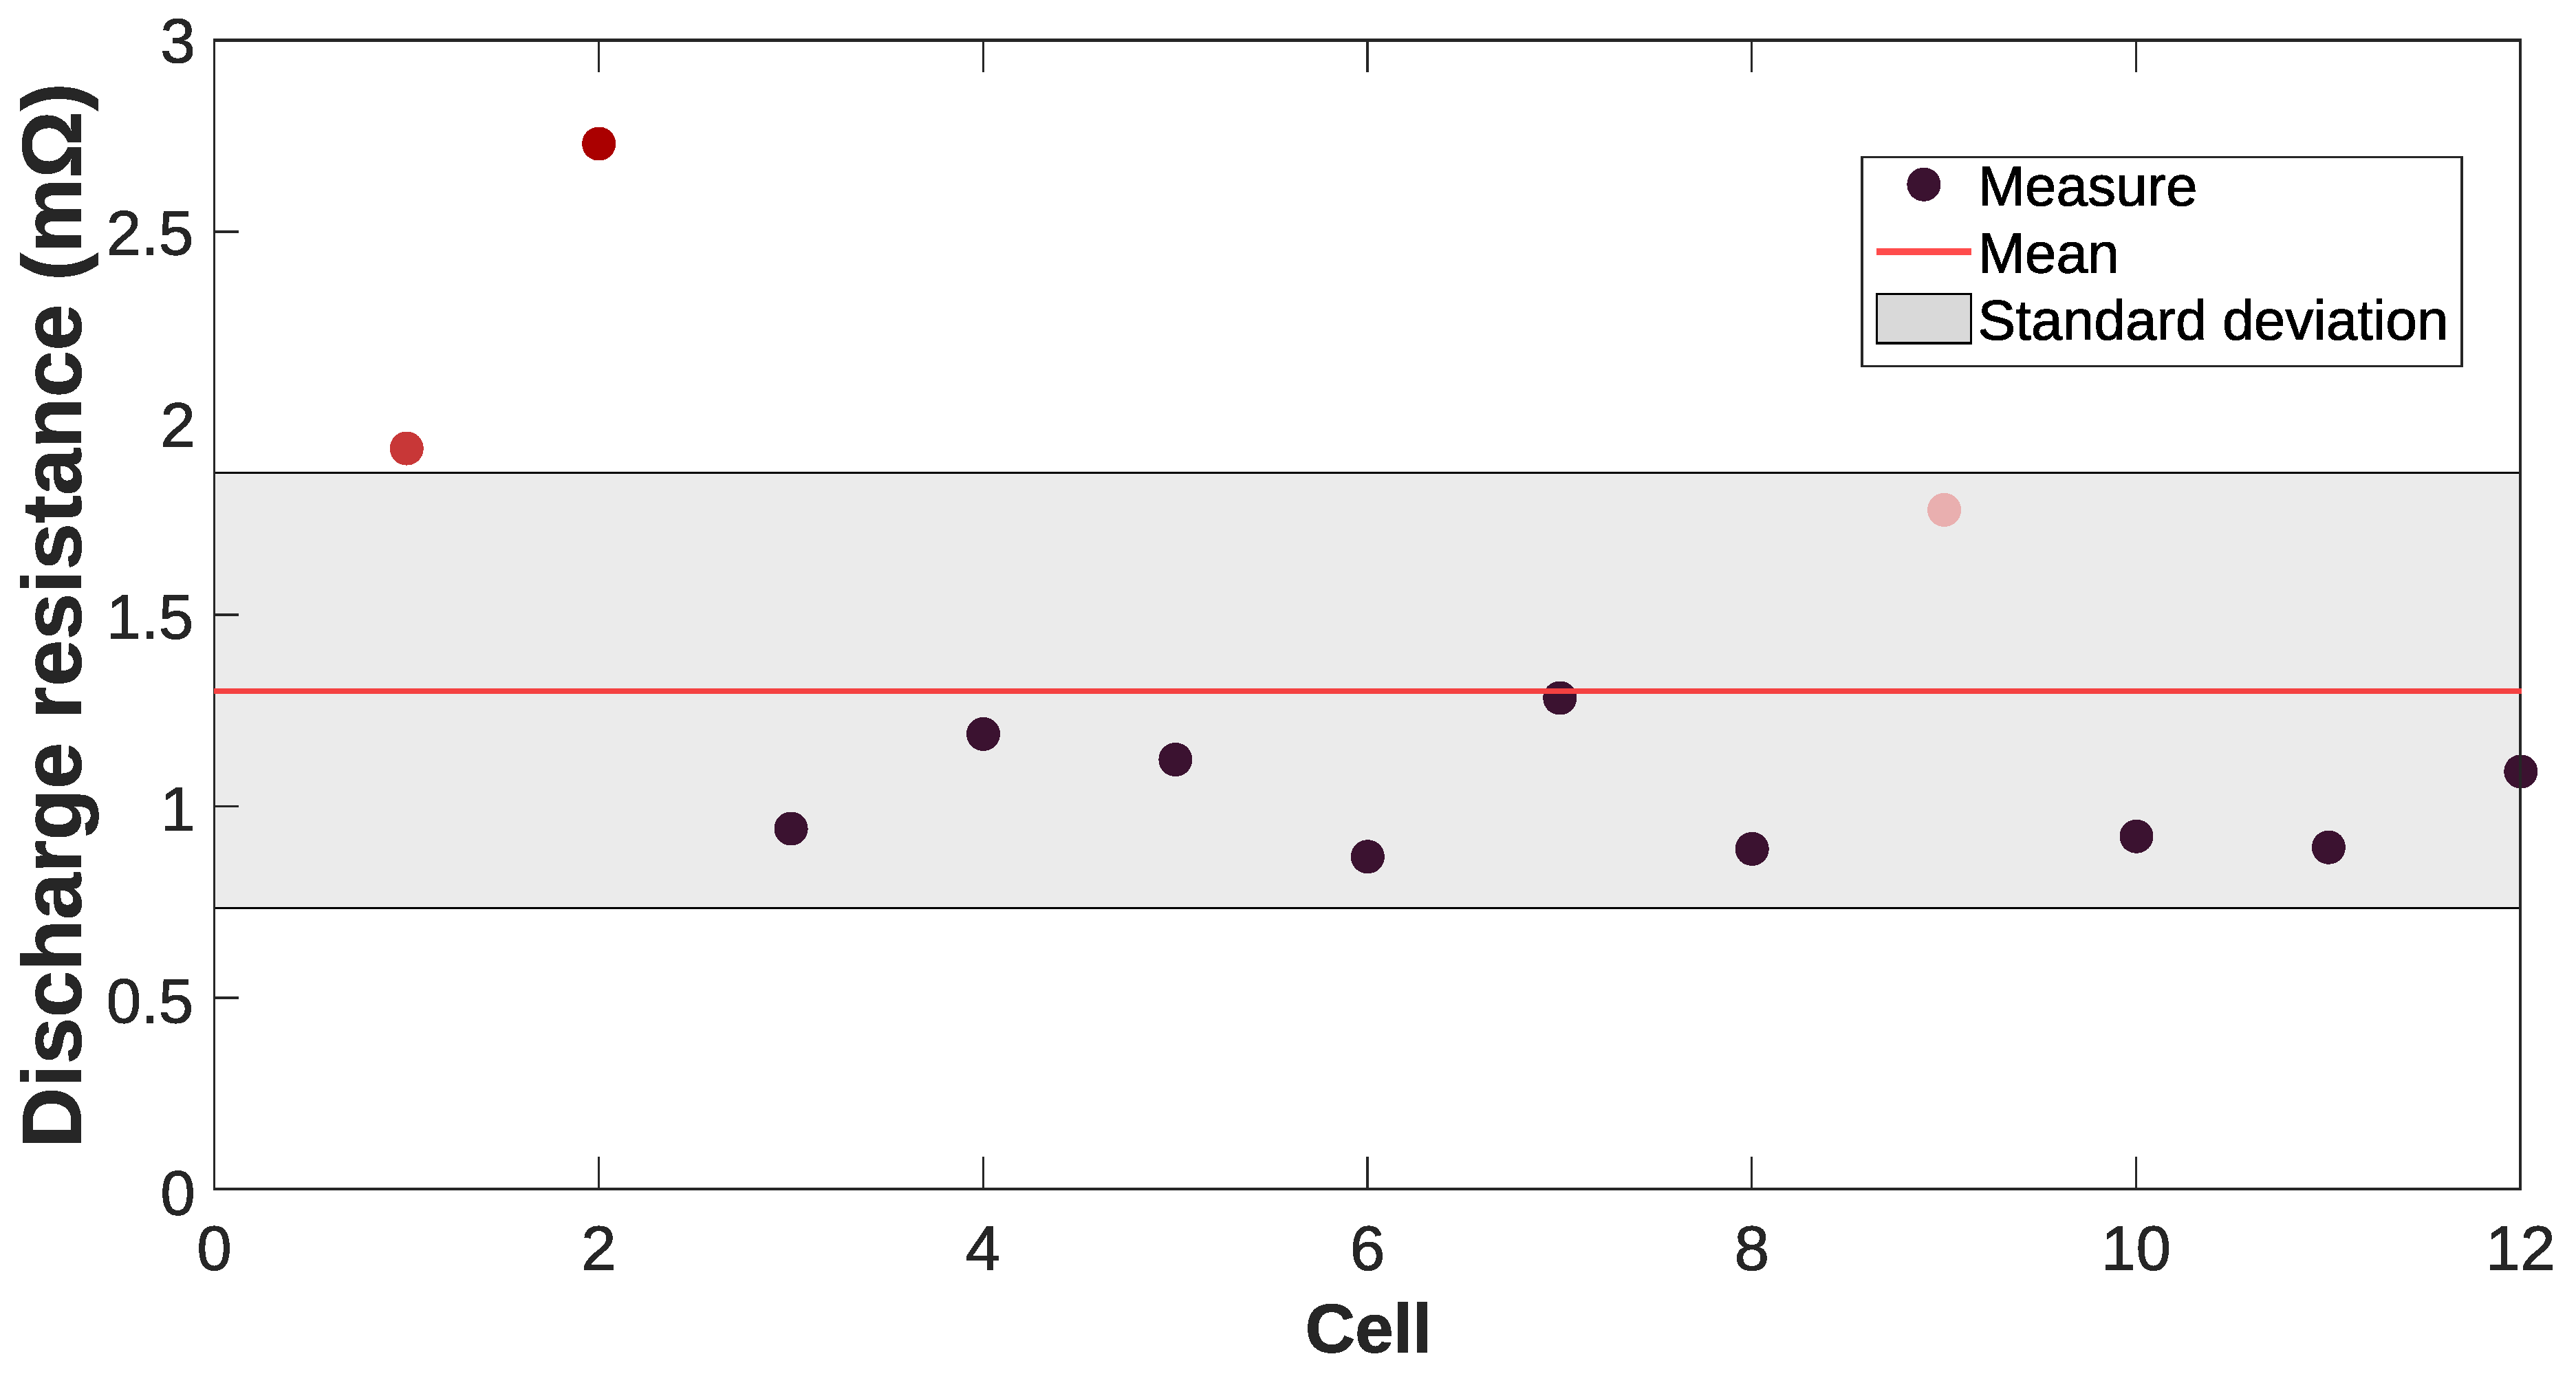
Figure 9.
Open-circuit voltage as a function of the state of charge for the individual cells in the module.
Figure 9.
Open-circuit voltage as a function of the state of charge for the individual cells in the module.
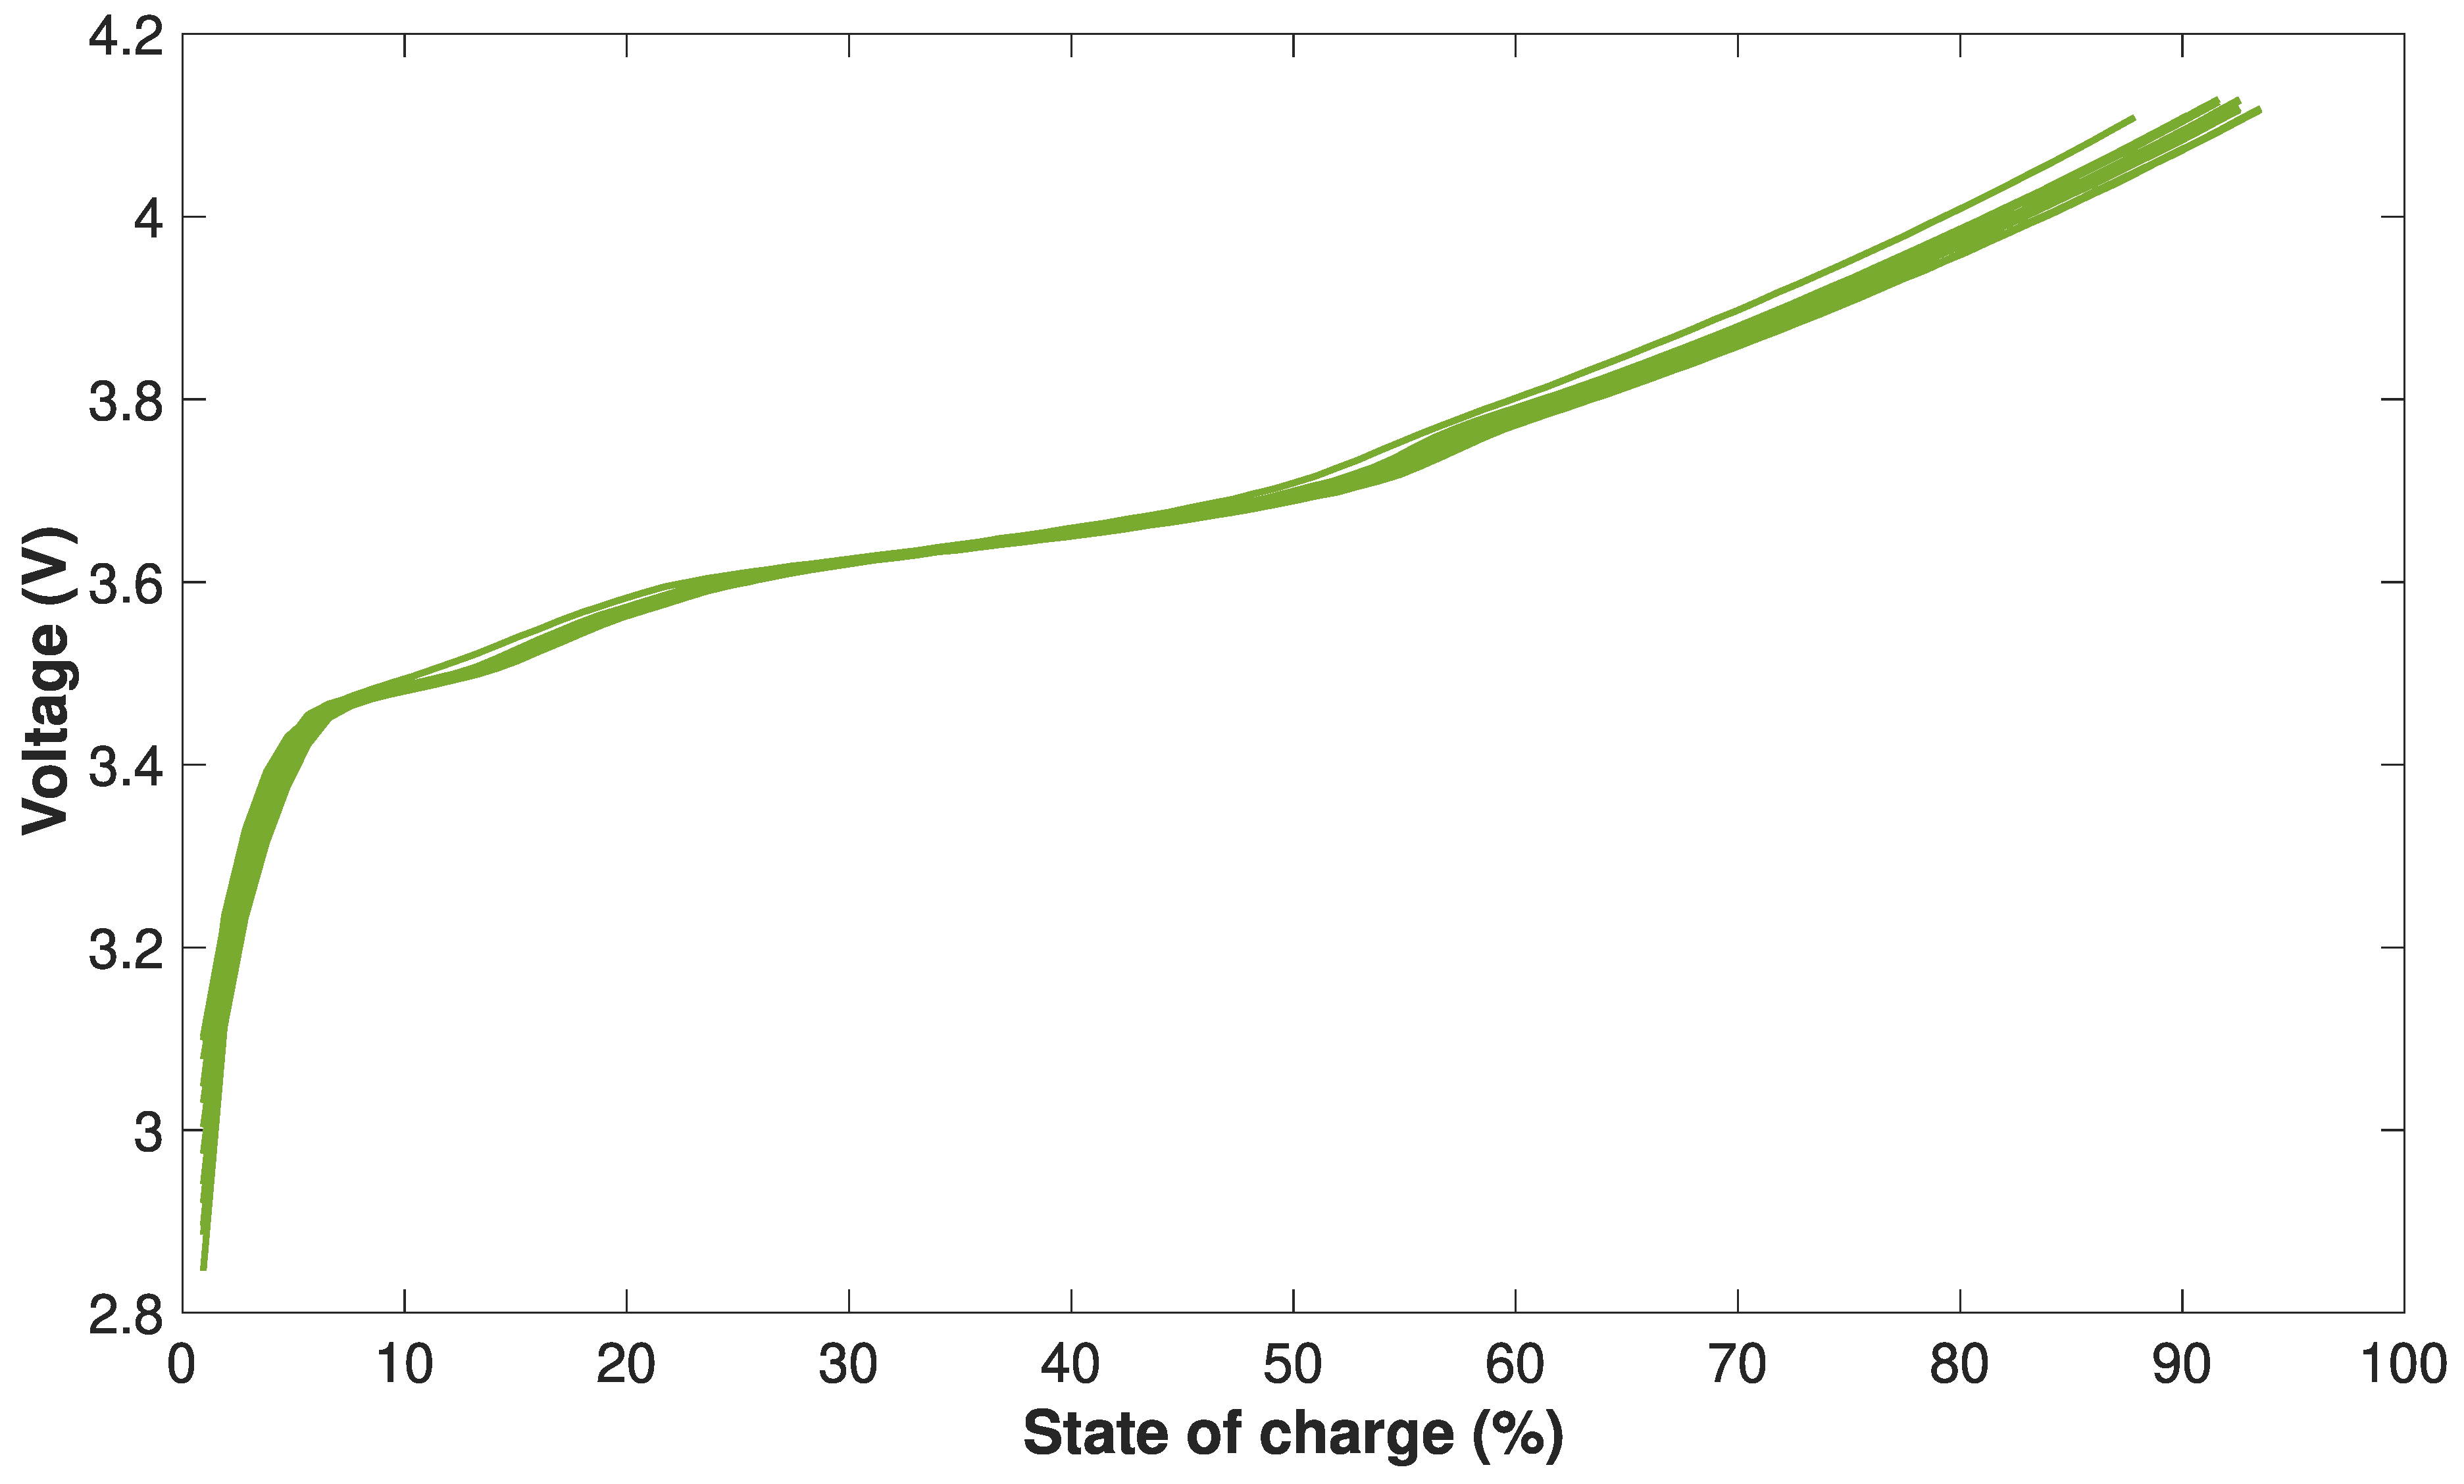
Figure 10.
Power capability versus state of charge estimated for the different cells of the module.
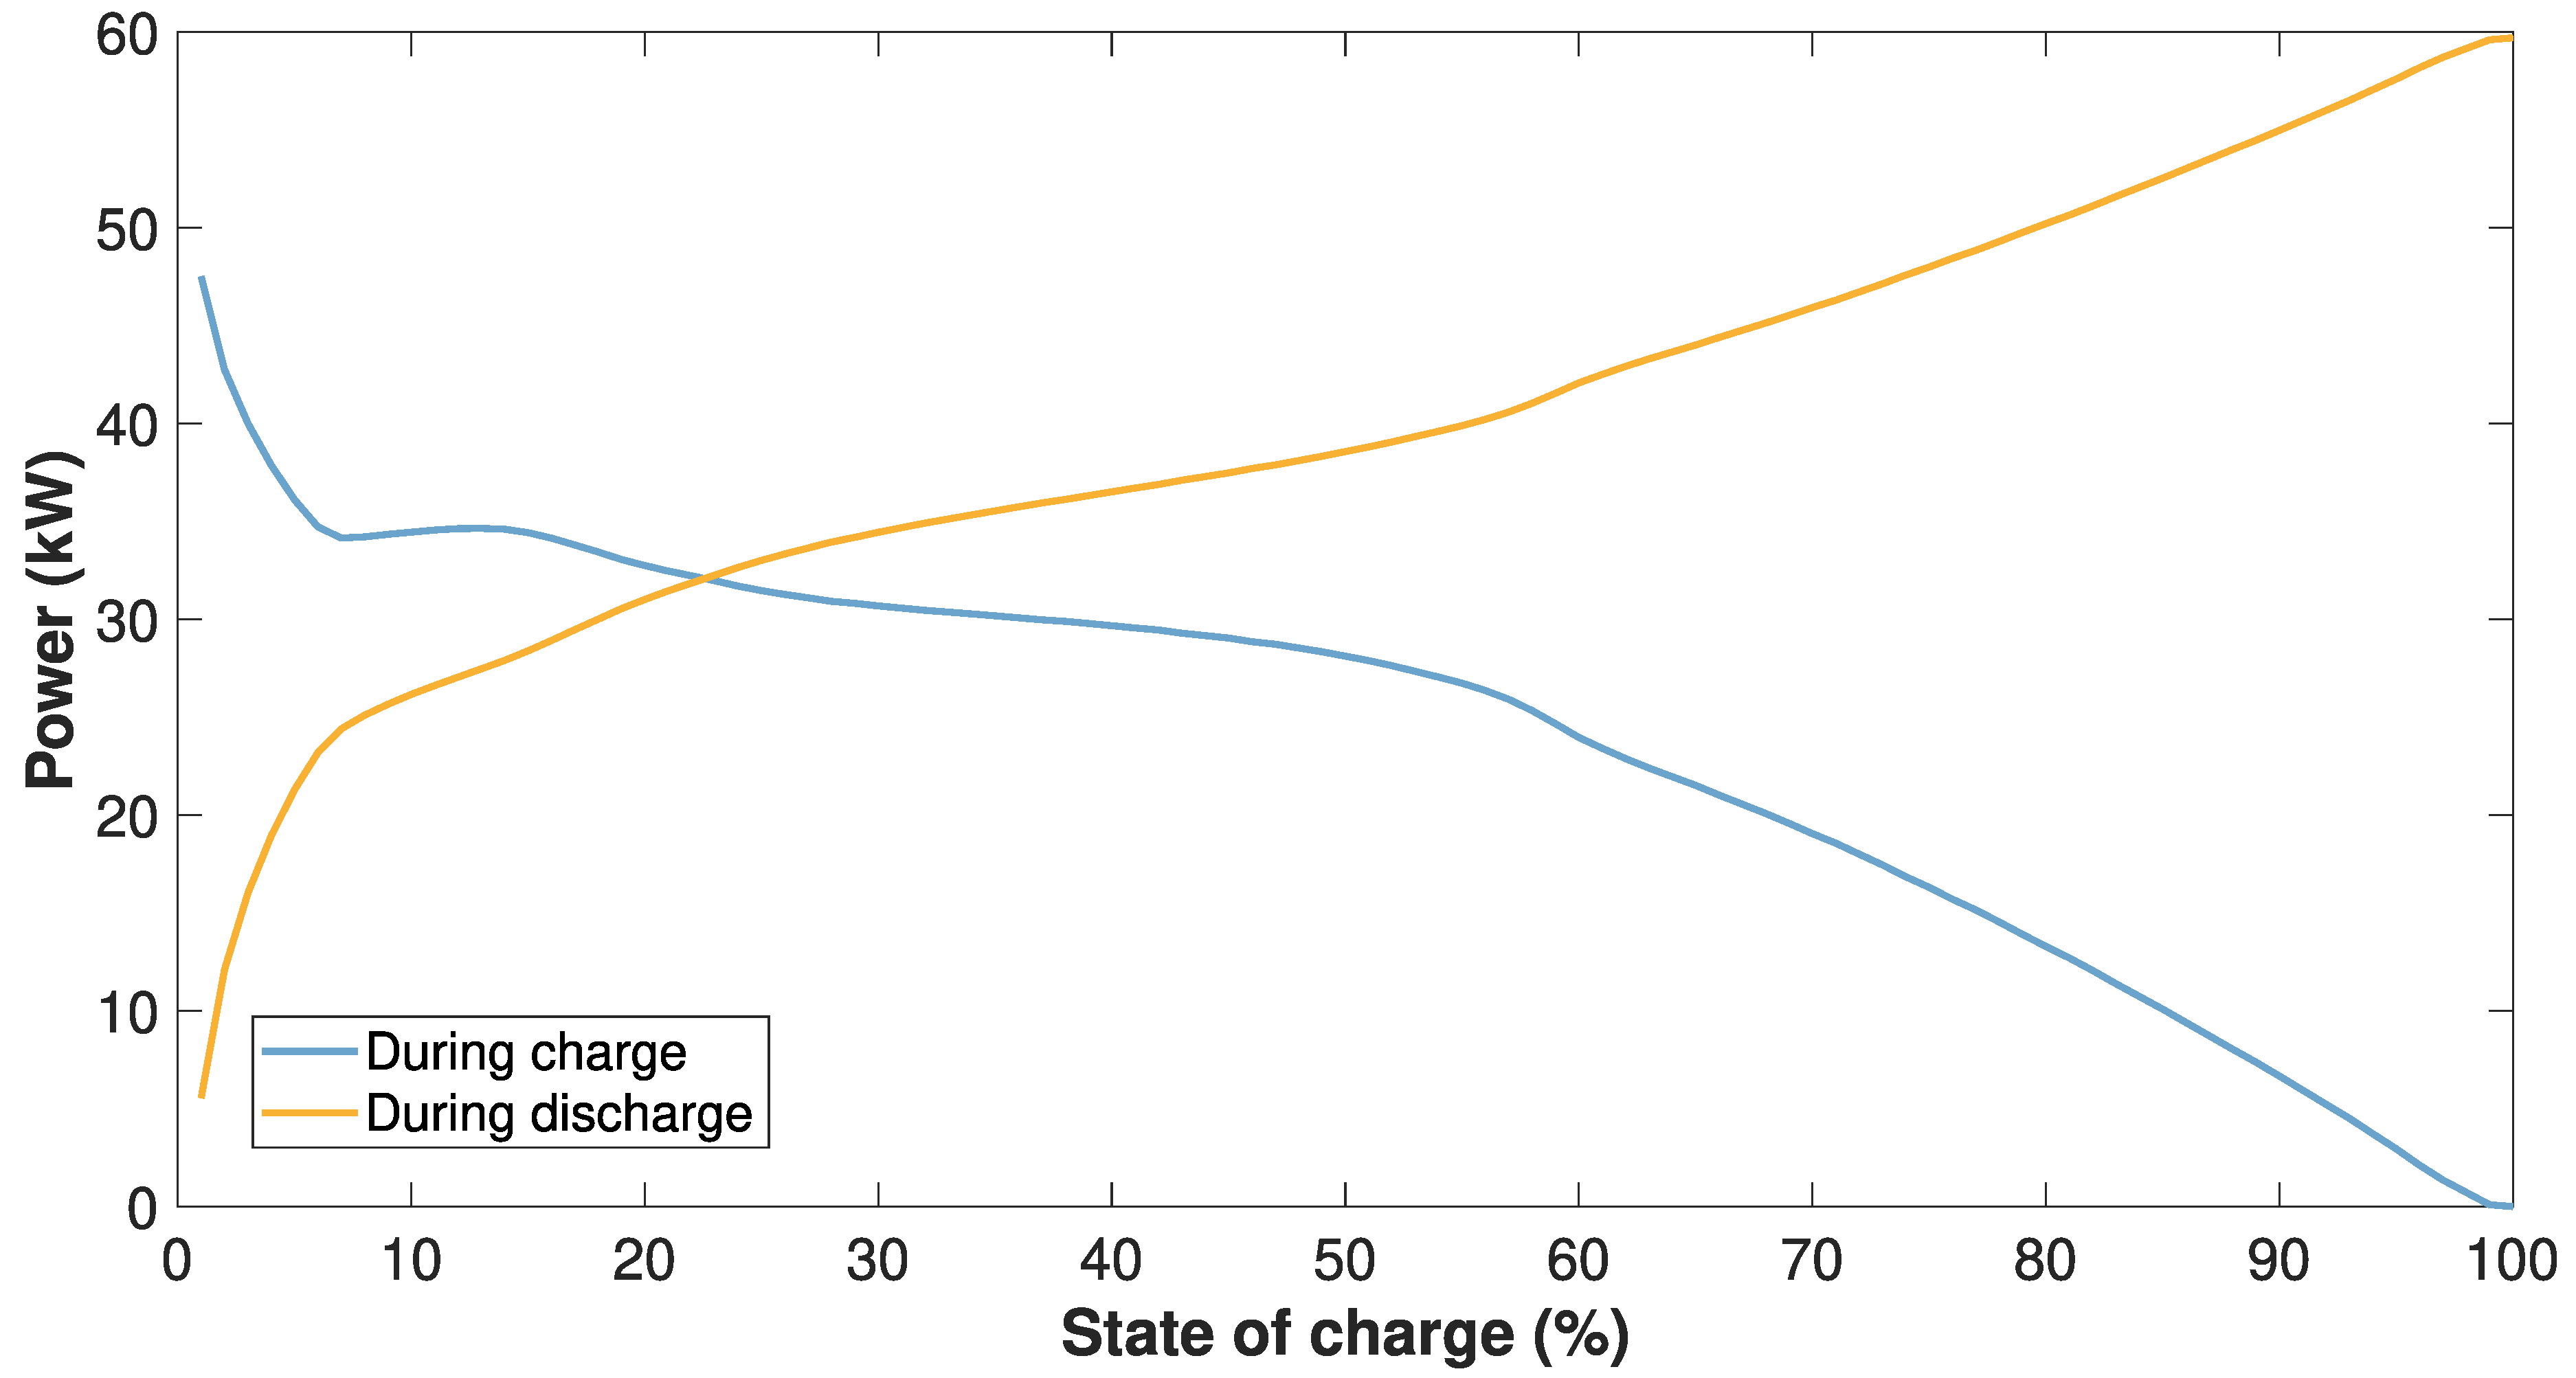
Figure 11.
Cells efficiencies versus state of charge. Measurement is made at 25°C and 1C.
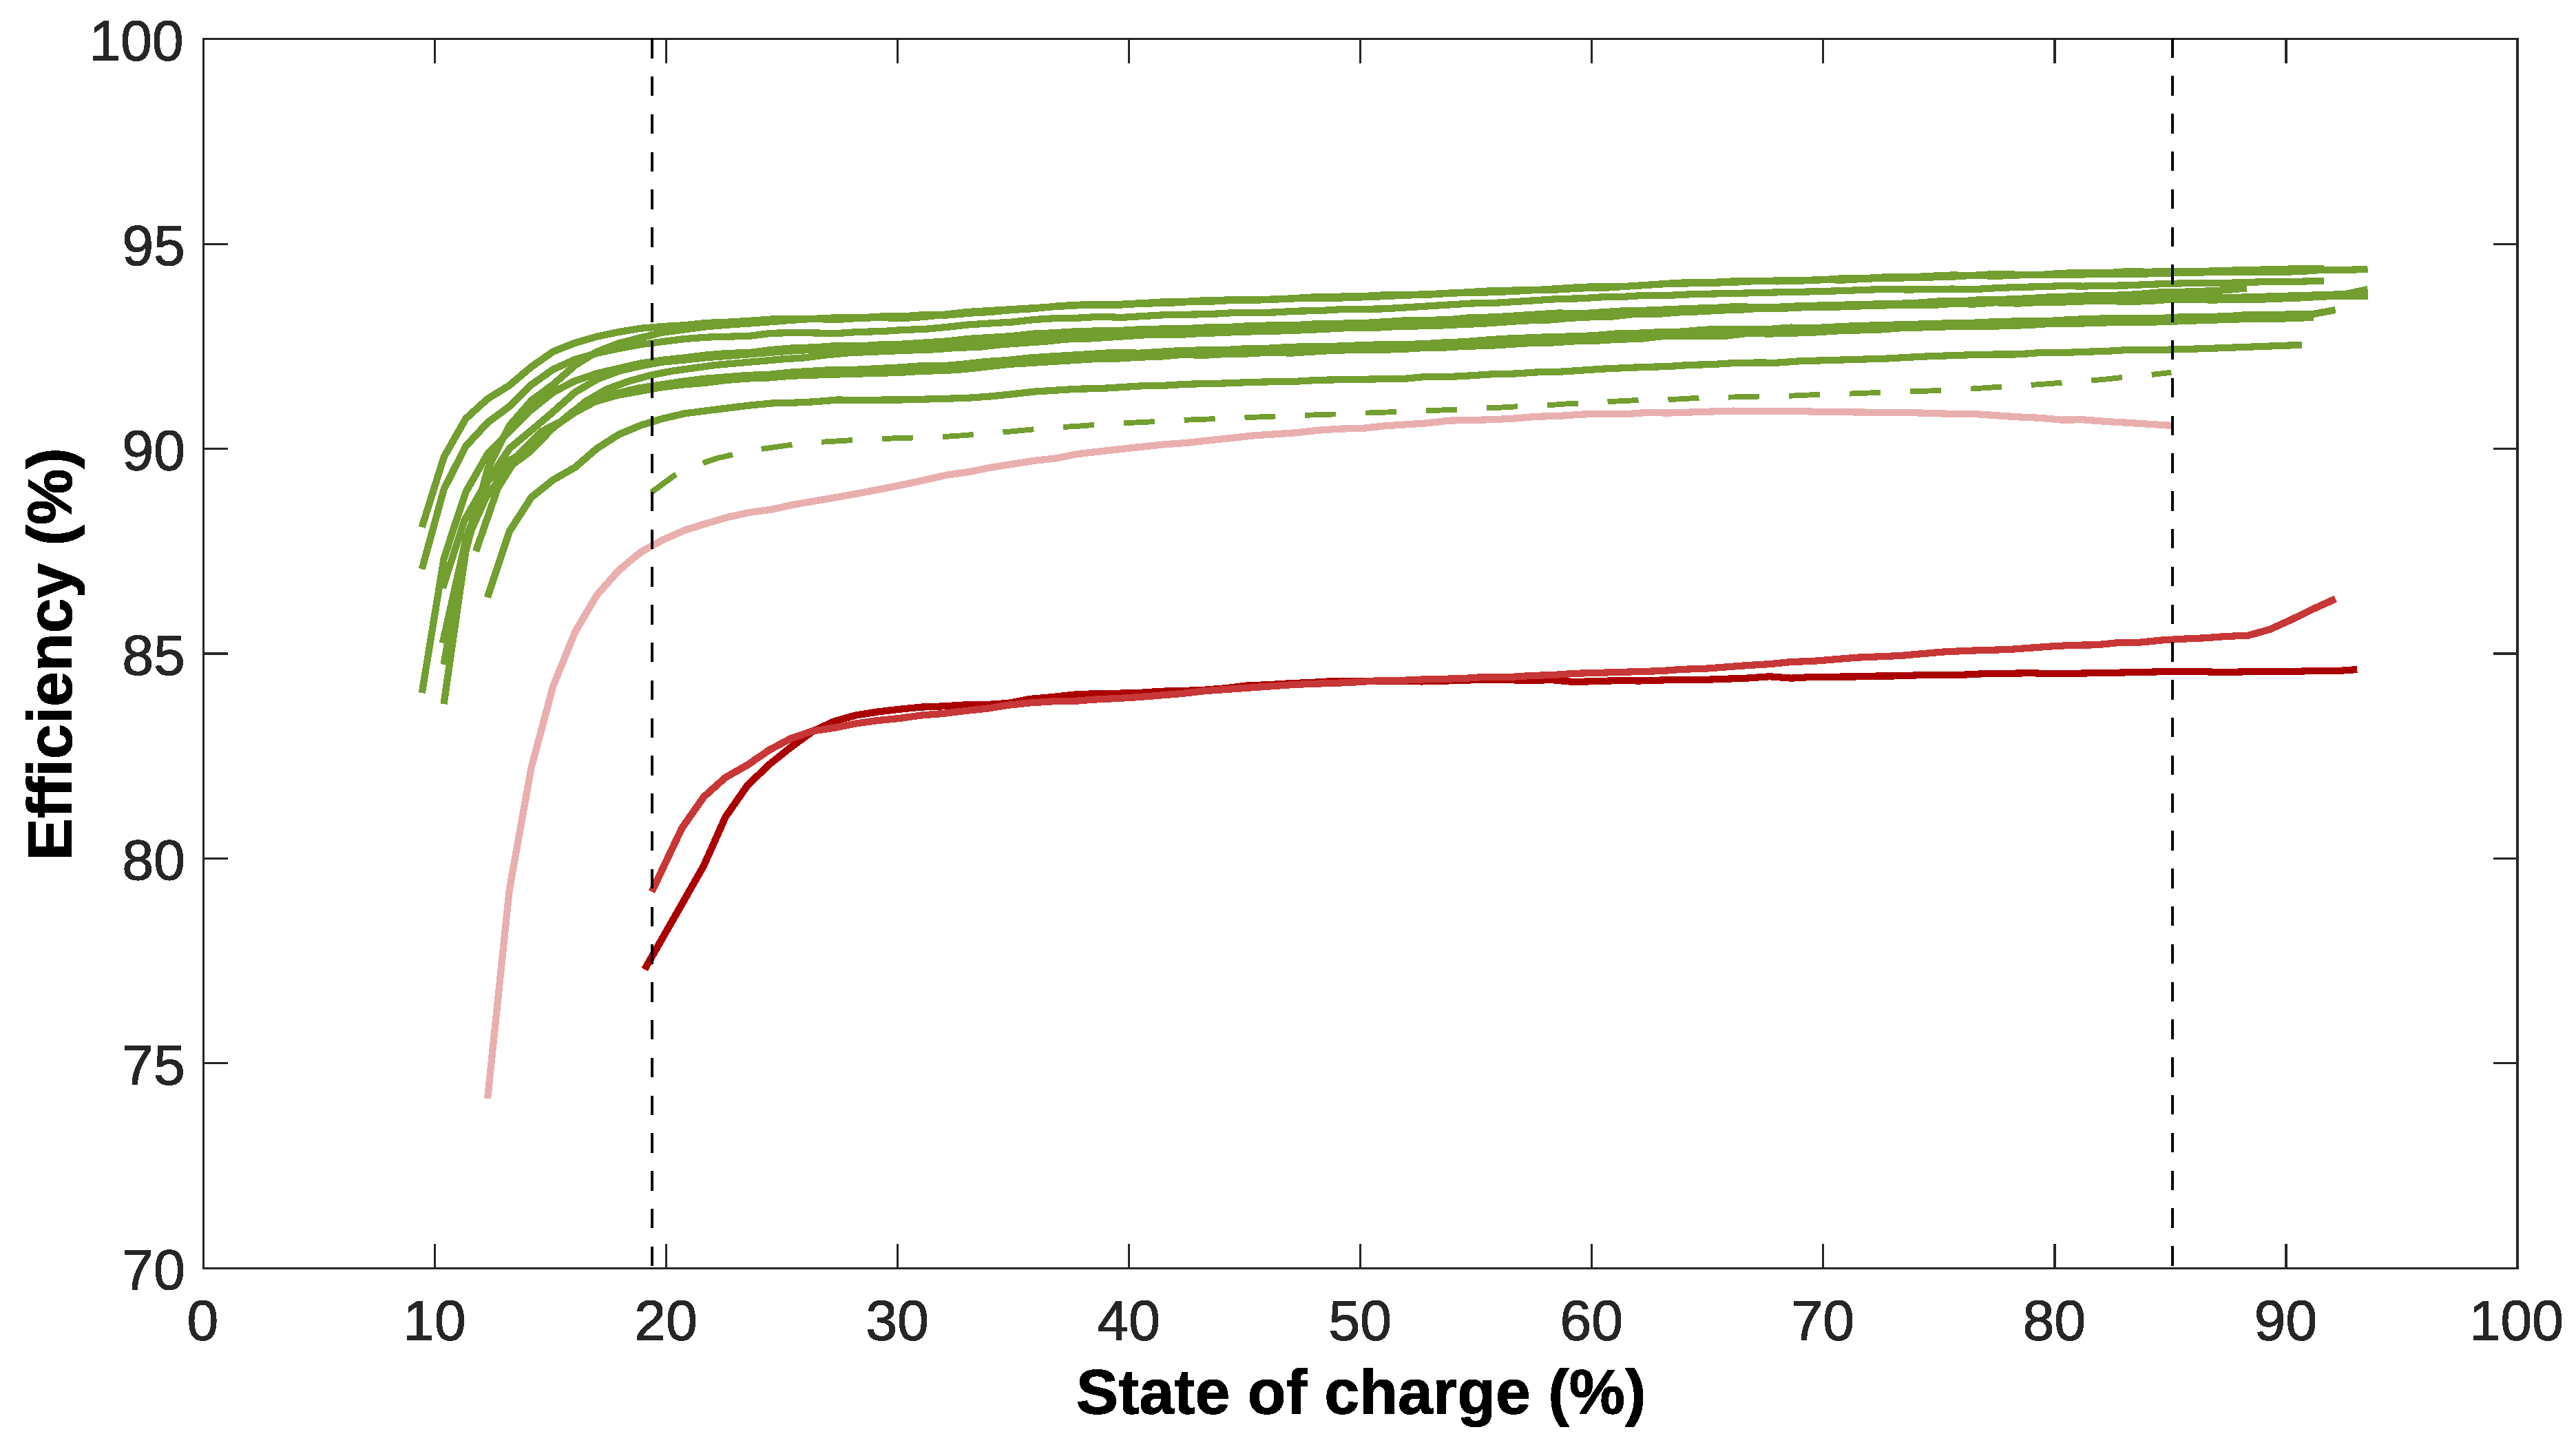
Figure 12.
Mean efficiency dispersion of cells in a second life module.
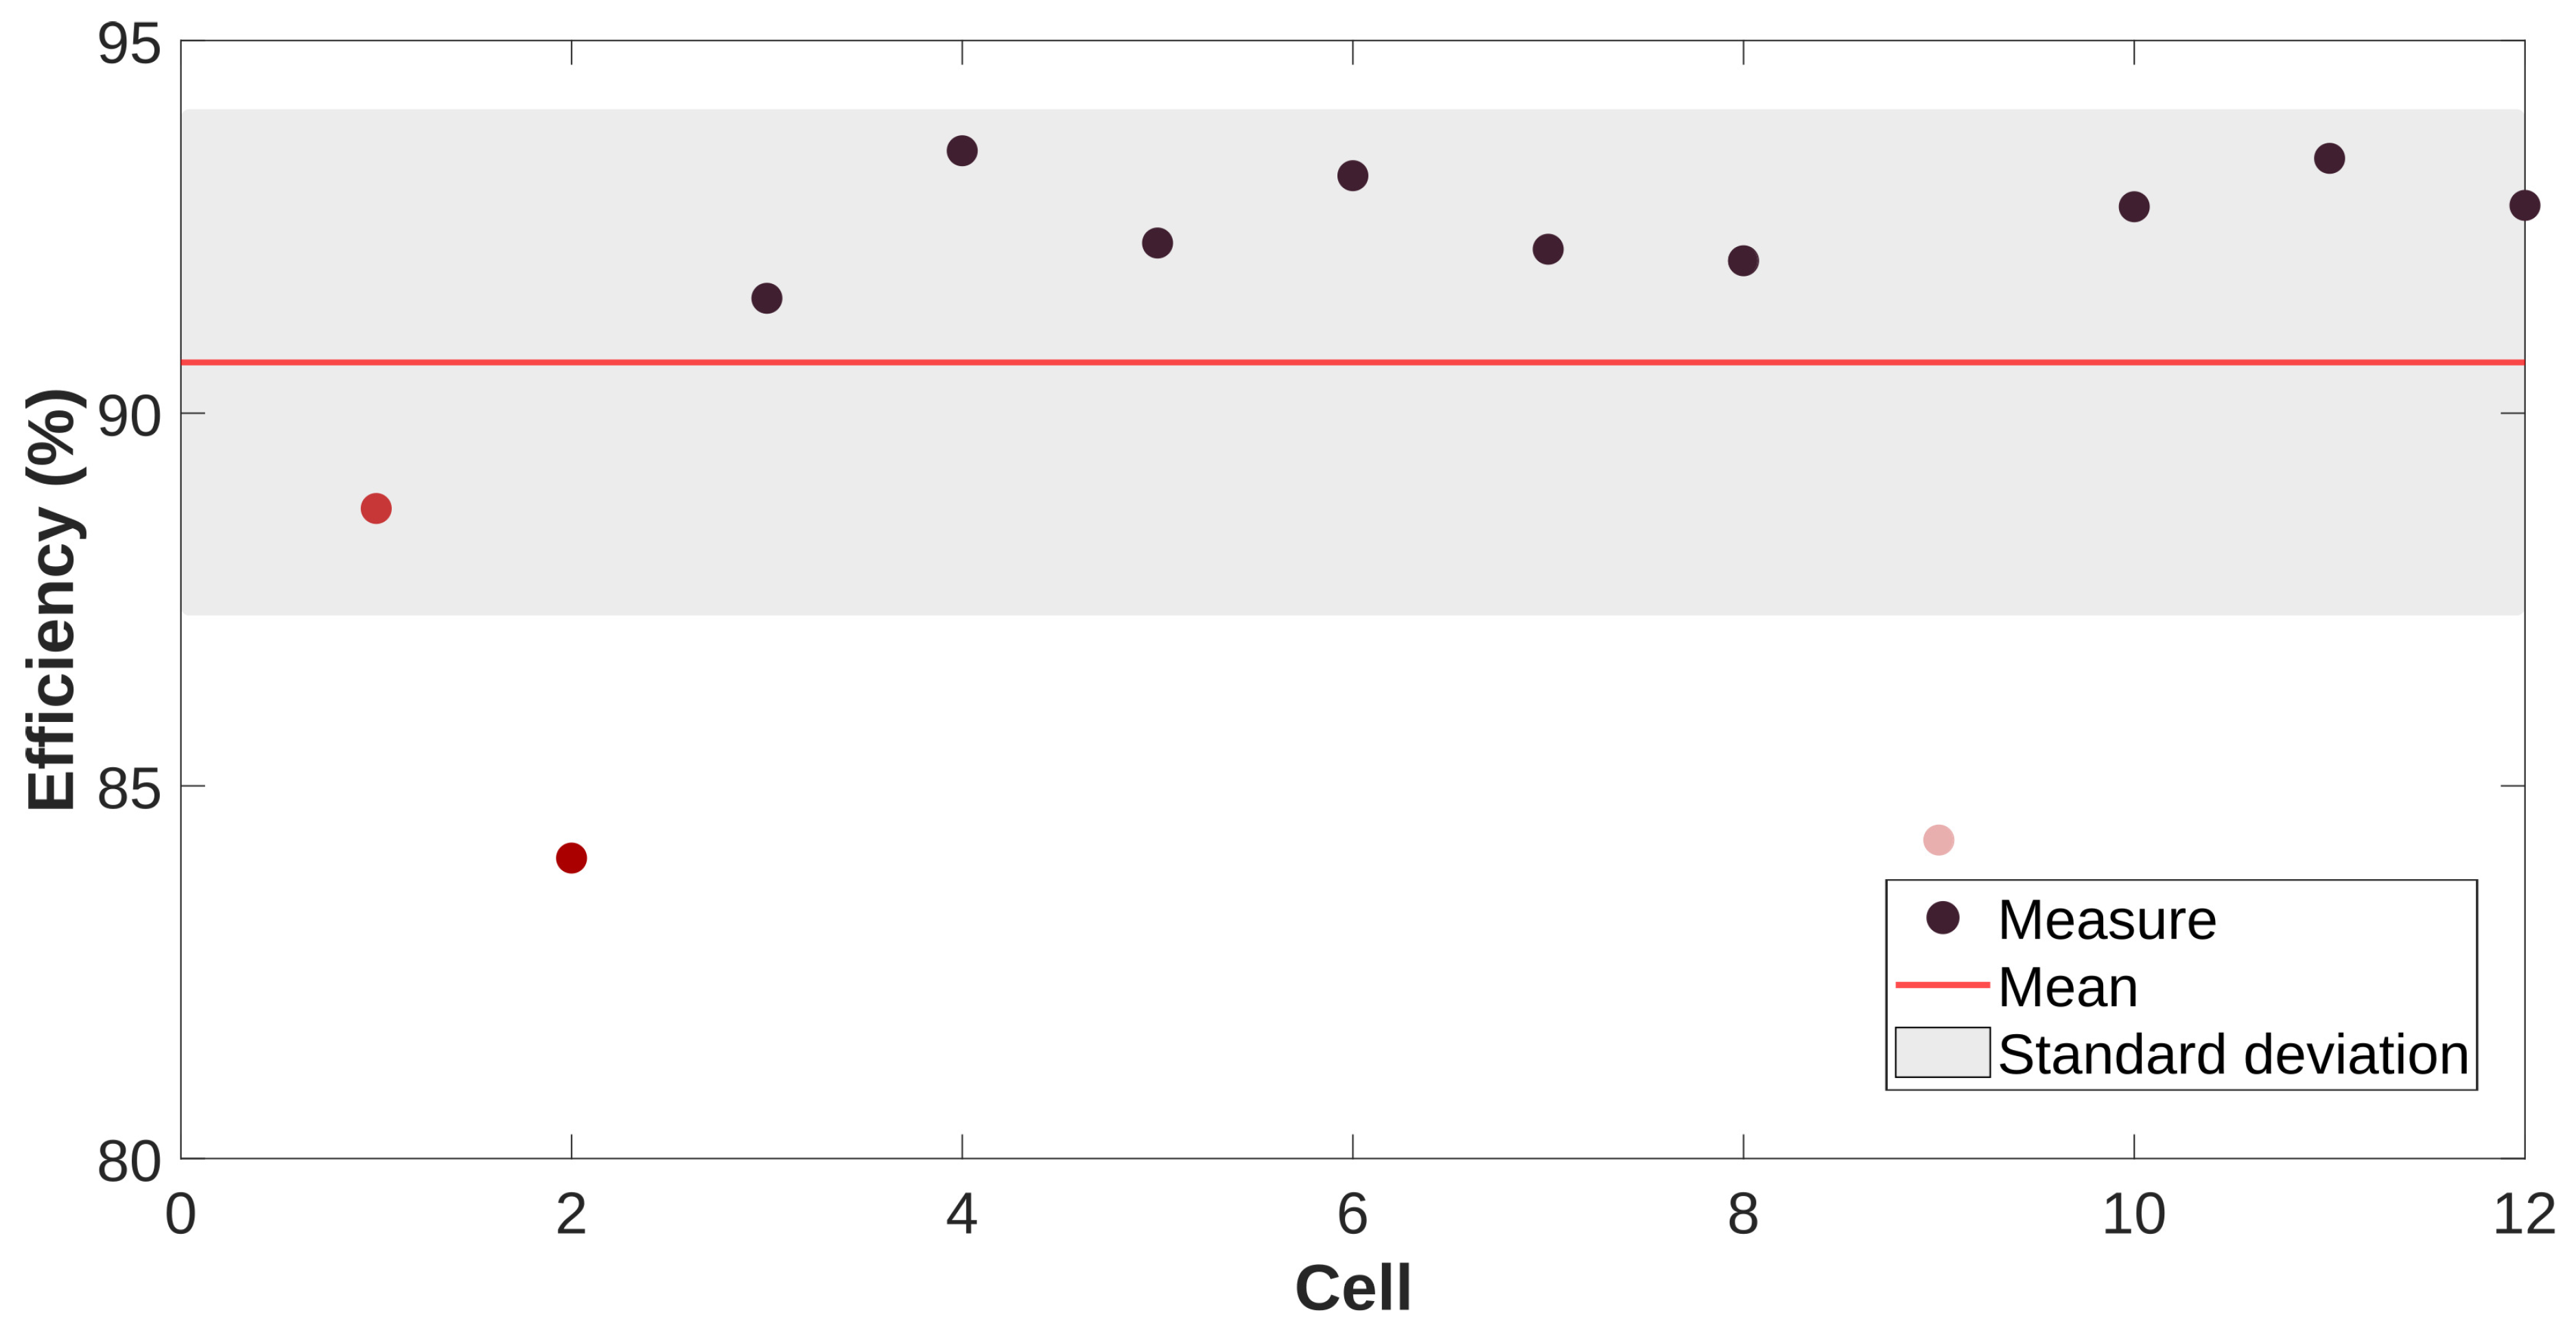
Figure 13.
Conclusions of the matching assessment between the battery passport and several mobile application needs. Data from [48,79,80,81].
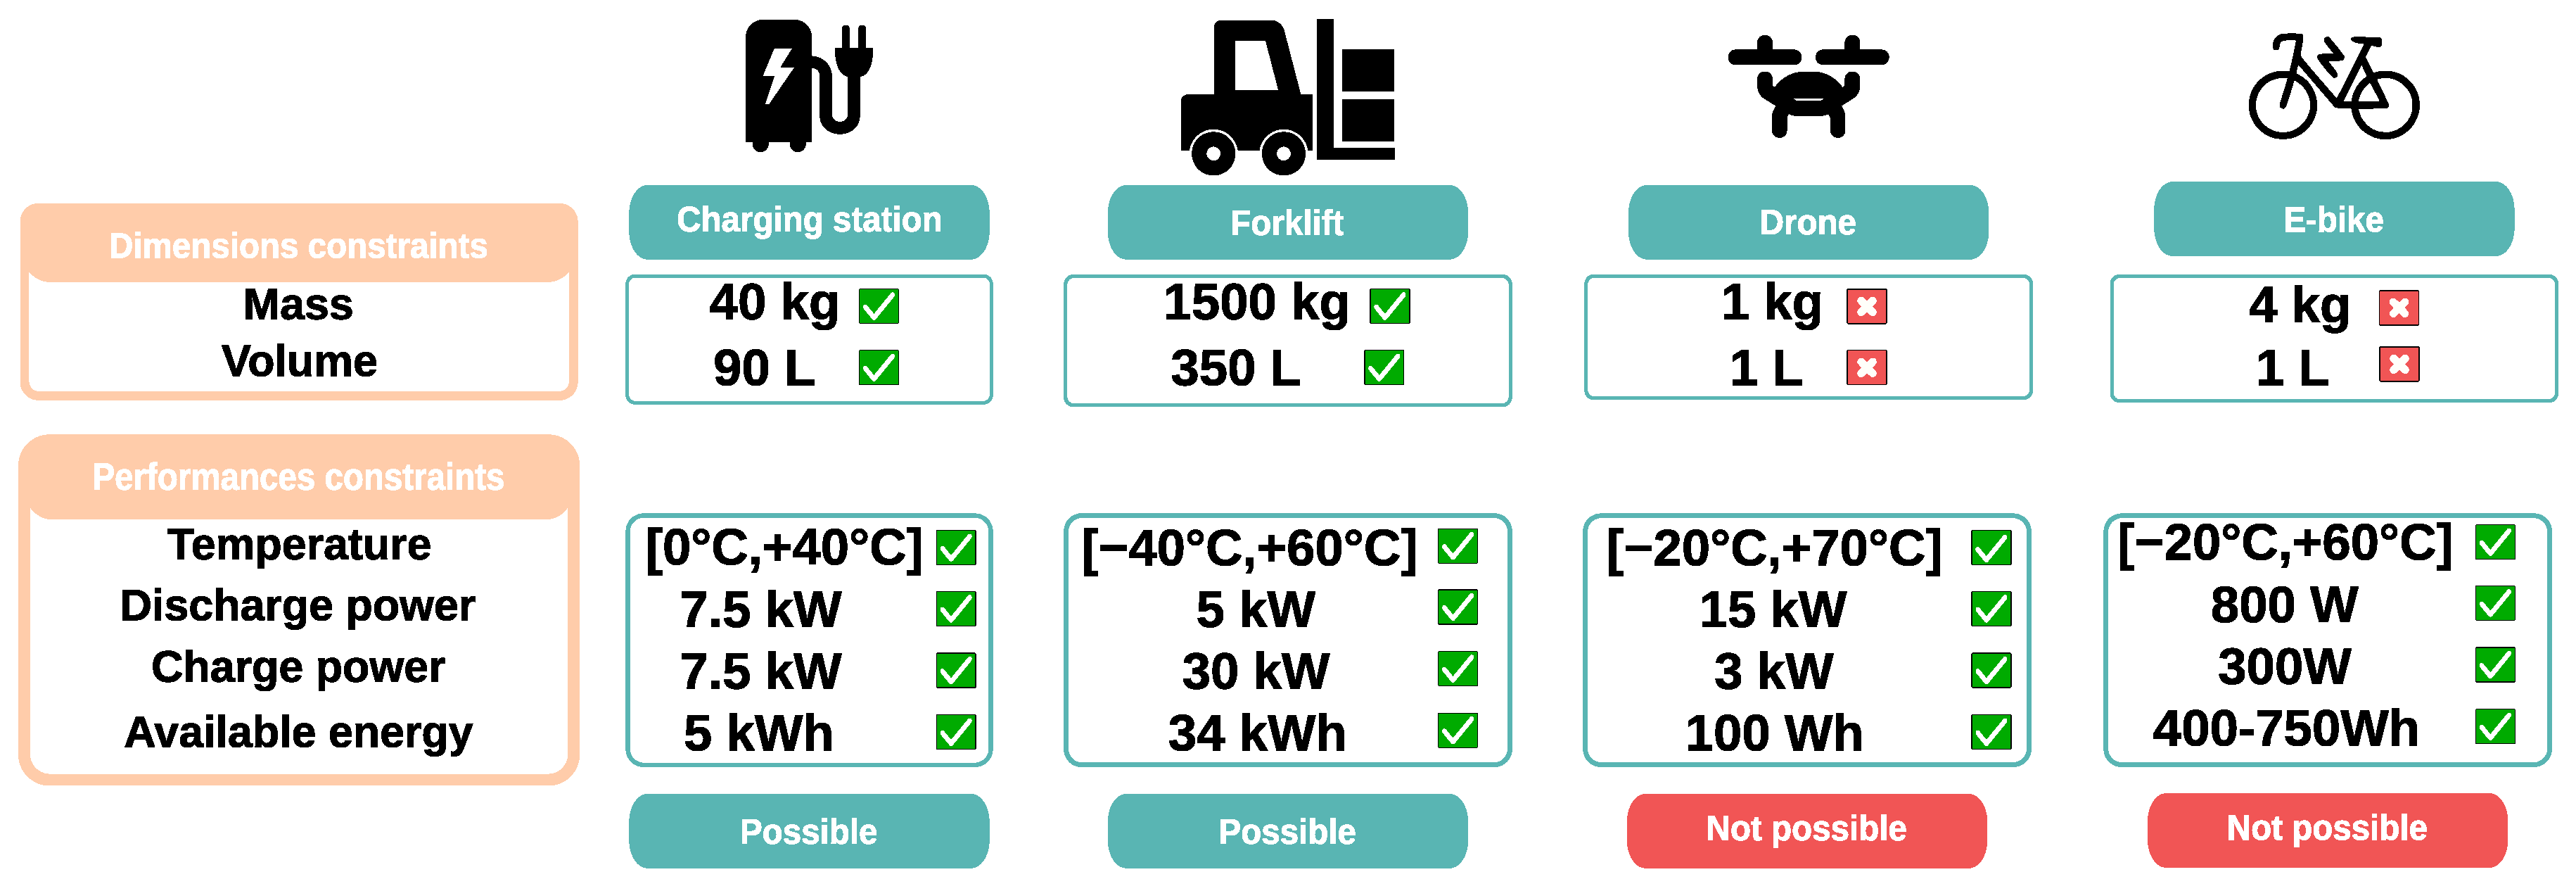
Figure 14.
Energy (a), state of health for energy (b), discharge power (c) and state of health for discharge power (d) evolution curves as a function of the number of cycles at cell level and for temperatures of 25 °C (green lines) and 45 °C (red lines). End-of-life thresholds are shown in black dotted line. Data was collected using the software Webplotdigitizer.
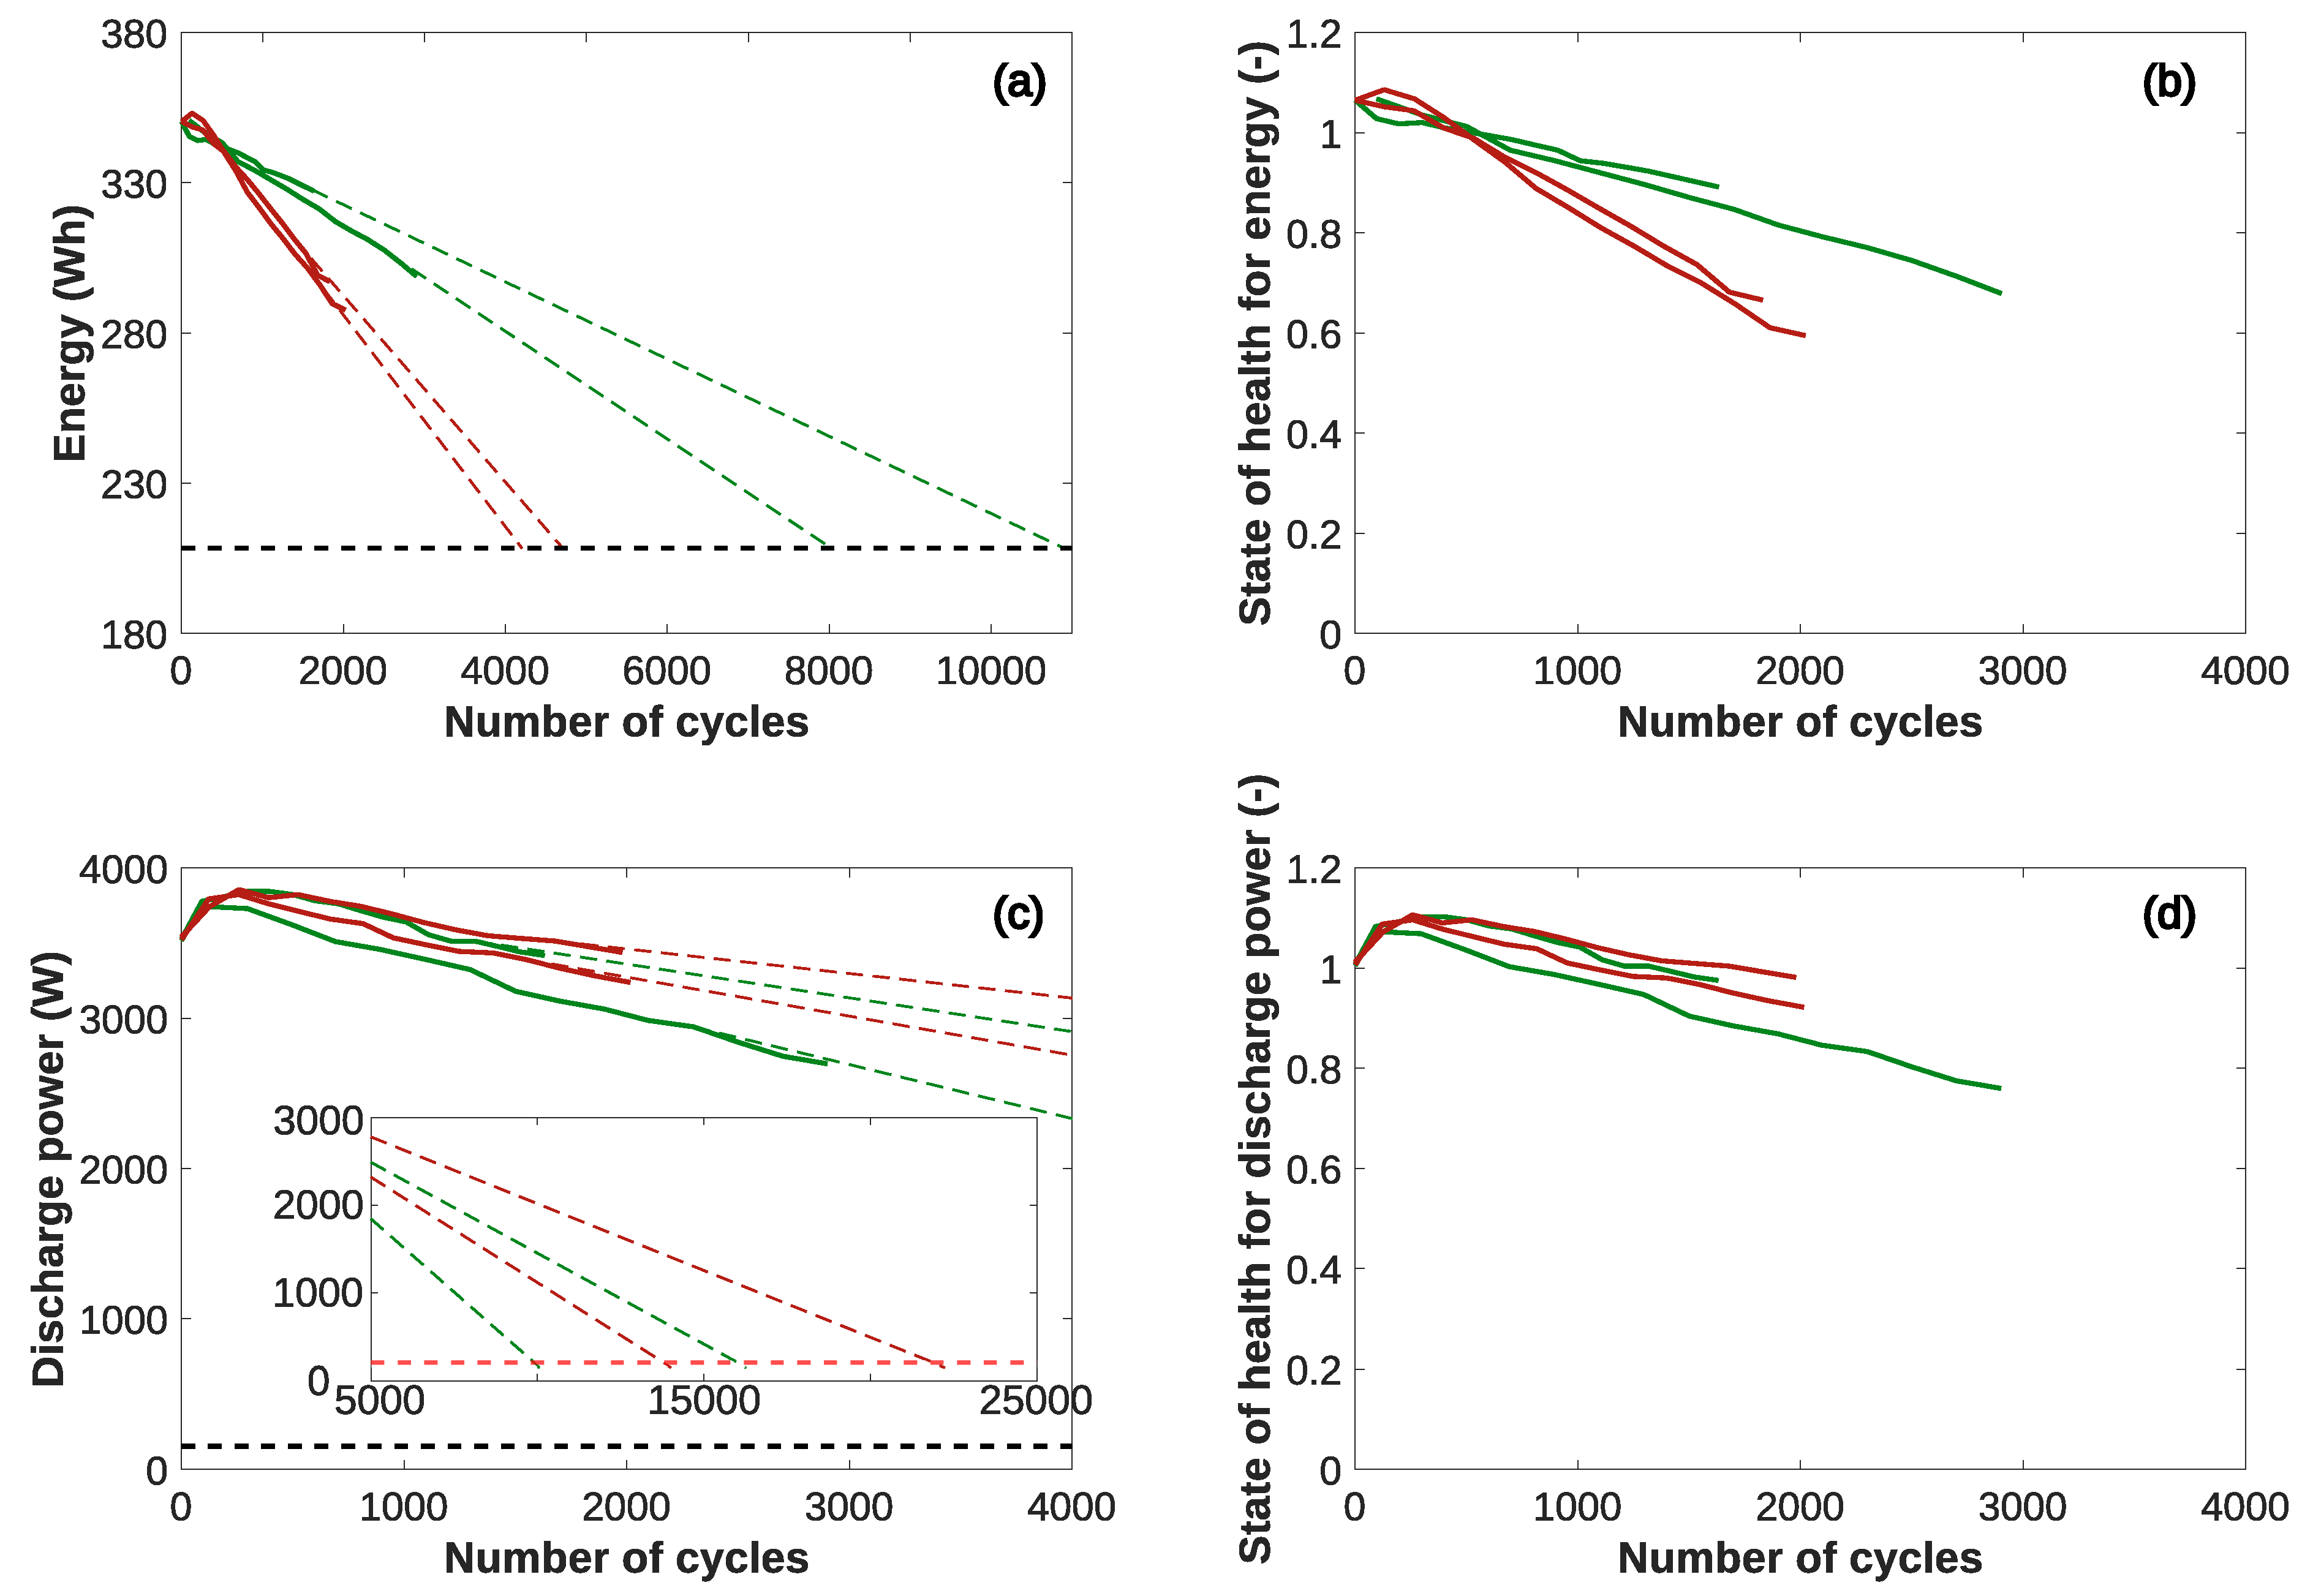
Table 1.
Examples of work on the use of second-life batteries in stationary storage applications.
| Stationary storage application | Reference |
|---|---|
| Fixed charging station | [25,26] |
| Grid frequency regulation | [27,28] |
| Micro grid | [29,30] |
| Residential Storage | [31,32] |
| Utility-scale storage | [33,34] |
Table 2.
Protocol of the characterisation test.
| Step | Test | Estimated Duration (h) |
|---|---|---|
| 1 | Capacity test | 18 |
| 2 | Impedance test | 8 |
| 3 | Low current test | 42 |
Table 3.
Samsung SDI 94Ah main characteristics. Data from [51].
Table 3.
Samsung SDI 94Ah main characteristics. Data from [51].
| Characteristics | Values |
|---|---|
| Format | Prismatic |
| Rated capacity [Ah] | 94 |
| Positive electrode material | NMC111 |
| Negative electrode material | Graphite |
| Rated voltage [V] | 3.68 |
| Maximal voltage [V] | 4.15 |
| Minimal voltage [V] | 2.7 |
| Specific energy [Wh/kg] | 165 |
| Size L×W×H [mm] | 173×125×45 |
| Weight [kg] | 2.1 |
Table 4.
Spread of performance measurements in a second life battery module.
| Mean value |
Median value |
Standard deviation |
Worst cell |
Relative dispersion |
|
|---|---|---|---|---|---|
| Q (Ah) | 91.8 | 92.4 | 2.6 | 84.2 | 2.8 |
| E (Wh) | 267.5 | 269.9 | 5.9 | 254.4 | 2.2 |
| R(t) () | 1.30 | 1.11 | 0.57 | 2.73 | 43.3 |
| (%) | 90.7 | 92.2 | 3.4 | 84.0 | 3.7 |
Table 5.
Battery passport
| General information | |||
|---|---|---|---|
| Information | Value | Source | |
|
Annexe VI |
Name and brand of battery | BMW i3 SAMSUNG 94 Ah | 2.1 Visual inspection |
| Battery identification number | 6127 762506706 | 2.1 Visual inspection | |
| Batch or serial number | 170410 00728 | 2.1 Visual inspection | |
| Place of manufacture | Germany | 2.1 Visual inspection | |
| Date of manufacture | 04/2017 | 2.1 Visual inspection | |
| Weight | 28 kg | 2.1 Visual inspection | |
| Rated capacity | 94 Ah | [51] | |
| Date of manufacture of the battery | 05/2017 | 2.1 Visual inspection | |
| Chemistry | NMC111/C | [73] | |
| Hazardous substances present in the battery | Cobalt, Manganese, Nickel, Carbon, Polyvinylidene fluoride, Aluminium, Copper |
[74] | |
| Usable extinguishing agent | Water | [75] | |
| Critical raw materials present in the battery | Lithium, Cobalt, Copper, Nickel, Manganese, Graphite |
[74] | |
| Other | Size | 410x300x150 mm | 2.1 Visual inspection |
| Volume | 18.4 L | 2.1 Visual inspection | |
| Configuration | 12s1p | 2.1 Visual inspection | |
| Temperature range | [-40; 60 °C] | [51] | |
| Voltage range | [32.4; 49.8 V] | [51] | |
| Rated voltage | 44.2 V | [51] | |
| Date end of first life | 07/2021 | Seller | |
| Energy and capacity related information | |||
|
Annexes IV and VII |
Rated capacity | 94 Ah | [51] |
| Remaining capacity | 91.8 | 2.3 Capacity and energy | |
| Capacity lost | 2.3 % | 2.3 Capacity and energy | |
| Other | Rated energy | 4.1 kWh | [51] |
| Remaining energy | 3.6 kWh | 2.3 Capacity and energy | |
| Rated energy densities | 146 Wh/kg; 222 Wh/L | [51] | |
| Measured energy densities | 114 Wh/kg; 174 Wh/L | 2.3 Capacity and energy | |
| Energy/capacity of the worst cell | 254.4 Wh/84.2 Ah | 2.3 Capacity and energy | |
| Dispersion of energy/capacity | 2.2 %/2.8 % | 2.3 Capacity and energy | |
| Power related information | |||
|
Annexes IV and VII |
Ohmic resistance (SoC 50 %, 10 s, 1C) | 15.69 | 2.4 Resistance and power |
| Rated power (SoC 50 %, 10 s, 1C) | 42 kW | [51] | |
| Measured power output (SoC 50 %, 10 s, 1C) | 38.6 kW | 2.4 Resistance and power | |
| Overall power loss | 8 % | 2.4 Resistance and power | |
| Charging power at SoC 80 % | 50.6 kW | 2.4 Resistance and power | |
| Discharging power at SoC 80 % | 12.7 kW | 2.4 Resistance and power | |
| Charging power at SoC 20 % | 31.5 kW | 2.4 Resistance and power | |
| Discharging power at SoC 20 % | 32.5 W | 2.4 Resistance and power | |
| Other | Power/resistance of the worst cell | 1488 W/2.7 | 2.4 Resistance and power |
| Dispersion of rated power | 24.4 % | 2.4 Resistance and power | |
| Dispersion of rated resistance | 43.3 % | 2.4 Resistance and power | |
| Efficiency related information | |||
|
Annexes IV and VII |
Round trip efficiency | 90.7 % | 2.5 Efficiency and energy losses |
| Energy round trip fade | 9 % | 2.5 Efficiency and energy losses | |
| Cooling need | 144 Wh | 2.5 Efficiency and energy losses | |
| Evolution of self-discharging rate | 3.3 %/200 days | [51] | |
Table 6.
Examples of work on the use of second-life batteries in mobile applications.
| Mobile application | Reference |
|---|---|
| Boat | [76] |
| Electric golf cart and motorcycle | [77] |
| Heavy-duty | [78] |
| Mobile charging station | [79] |
Table 7.
Data used to calculate a module state of health.
| Energy | Discharge power | Charge power | Efficiency | |
|---|---|---|---|---|
| Beginning of life | 4.1 kWh | 42 kW | 42 kW | 95 % |
| Measure | 3.6 kWh | 38.6 kW | 28.1 kW | 91 % |
| End of life | 2.5 kWh | 1.85 kW | 1.85 kW | 50 % |
| State of Health | 44 % | 91 % | 65 % | 84 % |
Table 8.
Lifetimes in number of cycles for the tested cells.
| Energy 25 °C/45 °C | Power 25 °C/45 °C | |
|---|---|---|
| Cell 1 | 8,026/4,710 | 10,062/14,010 |
| Cell 2 | 10,901/4,205 | 16,268/22,235 |
Disclaimer/Publisher’s Note: The statements, opinions and data contained in all publications are solely those of the individual author(s) and contributor(s) and not of MDPI and/or the editor(s). MDPI and/or the editor(s) disclaim responsibility for any injury to people or property resulting from any ideas, methods, instructions or products referred to in the content. |
© 2024 by the authors. Licensee MDPI, Basel, Switzerland. This article is an open access article distributed under the terms and conditions of the Creative Commons Attribution (CC BY) license (http://creativecommons.org/licenses/by/4.0/).
Copyright: This open access article is published under a Creative Commons CC BY 4.0 license, which permit the free download, distribution, and reuse, provided that the author and preprint are cited in any reuse.


