Submitted:
30 January 2024
Posted:
30 January 2024
You are already at the latest version
Abstract
Stress has emerged as a major concern in modern society, significantly impacting human health and well-being. Statistical evidence underscores the extensive social influence of stress, especially in terms of work-related stress and associated healthcare costs. This work addresses the critical need for accurate stress detection, emphasising its far-reaching effects on health and social dynamics. Focusing on remote stress monitoring, this work proposes an efficient deep learning framework to discern stress from facial videos. In contrast to research on wearable devices, this paper investigates the application of *dl for stress detection based on *rppg. The methodology involves selecting suitable *dl models (*lstm, *gru, *1dcnn), optimising hyperparameters, and investigating augmentation techniques. 1D-CNNv1 model achieved the best performance compared to other approaches, particularly with augmentation techniques such as linear interpolation and white noise, achieving a stress classification accuracy of 95.83% while maintaining excellent computational efficiency. The experimental results demonstrate the use of *dl for stress detection based on *rppg, with the potential to make significant contributions to the international standard in the field.
Keywords:
Stress detection
; Physiological signals
; remote photoplethysmography (rPPG)
; Deep Learning (DL)
; Long Short-Term Memory (LSTM)
; Gated Recurrent Units (GRU)
; 1D Convolutional Neural Network (1D-CNN)
1. Introduction
Stress in humans is related to mental health and well-being [1]. It is the biological response to a situation such as a threat, challenge, or physical and psychological barrier [2]. The sympathetic nervous system (SNS) and the parasympathetic nervous system (PNS) are two components of the autonomic nervous system (ANS) that directly affect how the body reacts to stress [3,4]. In highly stressful events, the SNS executes the fight or flight survival response. As a result, the body redirects its efforts toward fighting off threats. Given its subjective nature, identifying and monitoring the onset, duration, and severity of stressful events is challenging. This is especially true in workplace situations [5] where there is often an intelligent choice to ignore stress for professional gain. Recent studies have shown an increase in stress levels in the office environment [6]. Due to the plasticity of the brain, chronic or persistent stress has been shown to increase the volume of the amygdala, a structure within the limbic system that defines and regulates emotions, stores emotional memories, and, most importantly, executes the fight or flight response [7]. Similarly, chronic stress is associated with a reduction in the mass of the prefrontal cortex [8], which is used to intelligently regulate thoughts, actions, and emotions.
Recent research in the field has introduced various sensor-based solutions for stress detection, as evidenced by studies such as [4,9,10]. Although some of these solutions use only a single type of sensor, others employ multimodal sensing. Traditionally, electrocardiography (ECG) has been used to measure heart rate variability (HRV) for stress detection [11]. Biomarkers like galvanic skin response (GSR), electrodermal activity (EDA), respiration, and electromyography (EMG) are increasingly recognized for assessing affective states and stress levels [12,13,14], utilising sensing devices. While these traditional sensor types are considered the gold standard and provide excellent opportunities for the measurement of stress-related biomarkers, the ease of use for these devices in a practical scenario becomes a challenge, as experimentation can only be carried out in a designated equipped setting. The focus of research is shifting to developing simpler and more convenient sensing solutions that are applicable to everyday life to measure physiological parameters. Recent advances in technology have led to significant developments in wearable and personal sensing devices with applications in healthcare, for example, the use of a wearable device to capture physiological data for health monitoring [15,16,17,18,19,20]. These devices include chest bands [15,16,21,22] portable ECG devices [17,23] etc. HRV parameters can be measured using wristbands such as Empatica E4 wristband [18,24], Microsoft Band 2 [19,25], Polar watch [20,26], and Fitbit watch [20,26] among others. Researchers analyse personal data from these devices to provide relevant insights into the individual’s physical and health status. Although these devices show promise and provide a non-intrusive means of acquiring data for stress detection models, a major limitation of these devices relates to the size, making them uncomfortable for practical use cases [27].
On the contrary, rPPG technology measures Blood Volume Pulse (BVP) using a camera, eliminating the need for sensor attachments [28,29]. By extracting skin pixels from facial data captured by the camera, rPPG technology utilises changes in skin colour corresponding to heartbeat to obtain the BVP signal [28,30,31,32]. This method simplifies the measurement, reduces sensor complexity, and avoids attachment-related problems. Furthermore, rPPG can be used to capture HRV measures for analysis, especially in healthcare applications. The widespread availability of cameras in the form of webcams or smartphones makes rPPG technology easily accessible to anyone. Due to its advantages, rPPG finds applications in healthcare, fitness and forensic science. Integration rPPG technology into smart mirrors or smartphones increases its potential as a professional health indicator. Although still in an early stage, rPPG-based non-contact affective computing has become a growing area of research in recent years, which can drastically improve human-computer interaction in real time for stress detection. This paper explores the feasibility of end-to-end methods for recognising stress by proposing a rPPG-based stress detection system to leverage non-contact and physiological techniques, facilitating the continuous monitoring of pervasive long-term biomedical signals. The contributions made in this paper are as follows:
- A novel system leveraging non-contact and physiological techniques is proposed, enabling the continuous monitoring of pervasive biomedical signals for long-term stress detection.
- Hybrid DL networks and models for rPPG signal reconstruction and Heart Rate (HR) estimation to significantly improve accuracy and efficiency in stress detection up to 95.83% with the UBFC-Phys’s dataset.
- Extensive experiments and empirical evaluations of Deep Learning (DL) models for stress detection provide valuable insights and comparisons.
The remainder of this paper is structured as follows. Section 2 presents a comprehensive literature review of the existing approaches, while Section 3 introduces the methodology, collection protocol and preprocessing steps. In Section 4, the experimental results are discussed while the conclusion and future work plan are outlined in Section 5
2. Related Work
The term stress was initially introduced into medical terminology in 1936, defining it as a syndrome produced by diverse nocuous agents that seriously threaten homeostasis [33]. Selye’s experiments demonstrated that prolonged exposure to severe stress could lead to disease and tissue damage [34]. Recently, research on stress, its causes, and implications has gained traction [4,9,10,12,13,14]. It has been defined as a complex interactional phenomenon, arising when a situation is deemed important, carries the possibility of damage, and requires psychological, physiological, and/or behavioural actions [4,9,10]. Understanding stress involves distinguishing between stressors, stress responses, and stress biomarkers. Stressors are stimuli that disrupt normal activity, stress responses are symptoms triggered by stressors, and biomarkers reflect interactions between a biological system and potential hazards [3,4,9,10]. The human body responds to stressors through mechanisms such as the hypothalamic-pituitary-adrenal (HPA) axis, ANS, and the immune system [35]. The HPA axis releases hormones, including cortisol, in response to stressors, initiating the "fight or flight response", leading to physiological reactions from the ANS, increasing SNS activity and decreasing PNS activity [3,4]. Cortisol levels and other physiological measures such as body temperature, respiration rate, pulse rate, HRV, and blood pressure (BP) have been identified as standard stress biomarkers [15,16,17,21,22,23]. Several methods for stress detection include questionnaires, ECG, electroencephalogram (EEG), BP using arm cuff, sampling saliva cortisol and other biomarkers from blood tests [36,37,38]. Self-reporting tools such as the Perceived Stress Scale and Depression Anxiety Stress Scale are widely used to measure perceived stress, but have limitations such as biased responses and subjectivity [39]. ECG measures changes in heart rhythm due to emotional experiences, providing information about HRV usually requires a visit to a medical facility. EEG captures electrical signals in the brain, correlating brain waves (beta and alpha) to stress, but conventional EEG machines are impractical for managing daily stress [40,41]. Biomarkers such as cortisol in salivary and hair samples are associated with chronic stress but are invasive and time-consuming. Blood pressure measured with a sphygmomanometer is accurate, but requires a trained professional [36,37,38]. Ambulatory Blood Pressure Measurement (ABPM) devices offer home monitoring, but lack widespread validation and can be influenced by factors other than stress [42]. While traditional sensor types are acknowledged as the gold standard, offering excellent opportunities for measuring stress-related biomarkers, their practical use in everyday situations poses a significant challenge. Emerging technologies have focused on developing simpler and more convenient sensing solutions applicable to daily life to measure physiological biomarkers. Wearable and personal sensing devices, such as chest bands, wrist bracelets, and portable ECG devices [15,18,21,24], have played a pivotal role in this evolution.
Conventional approaches to stress detection have drawbacks that are not in line with modern lifestyles and real-time monitoring. These methods are invasive, prone to bias, incur substantial costs, and require time-consuming travel to clinical settings. Over the past two decades, there has been a noticeable shift towards technology-driven approaches for more efficient, cost-effective, and less intrusive stress measurement compatible with modern lifestyles. Wearable devices, mobile applications, and Machine Learning (ML) algorithms have revolutionised stress detection and measurement. One approach is measuring HRV using wearable devices such as smartwatches, fitness trackers, and chest straps, allowing continuous and long-term monitoring of stress levels [16,17,20,23,26]. Typically as HRV measures are inherently nonlinear, ML algorithms and other statistical data-driven methods such as Modified Varying Index Coefficient Autoregression Model (MVICAR) [43] can be applied in stress detection systems. ML algorithms have enabled accurate and efficient HRV-based stress detection and classification systems [29,44,45,46,47]. EDA, which measures the electrical activity of sweat glands, is another method that can be monitored with wearable devices, providing continuous and real-time monitoring of stress levels. Mobile applications using EDA-based biofeedback help individuals manage stress by providing real-time feedback and stress reduction techniques [16,25]. However, EDA measurement is sensitive to environmental factors, skin conditions and medications, affecting the precision.
The COVID-19 pandemic has stimulated interest in remote healthcare, leading to research using cameras for the estimation of rPPG signals and real-time monitoring, addressing the need for non-invasive, contactless and accessible methods for stress assessment [48,49]. rPPG offers a non-invasive means of measuring BVP remotely. This approach requires only a camera and an ambient light source. With this, HRV measures, pulse rate and breathing rate can be measured using an everyday camera for facial video analysis to remotely detect and monitor stress[28,30,31,32]. There have been a growing number of research paper, for example Benezeth et al. [46] proposed an rPPG-based algorithm that estimates HRV using a simple camera, showing a strong correlation between the HRV features and different emotional states. Similarly, Sabour et al. [29] proposed an rPPG-based stress estimation system with an accuracy of 85.48%. Some other works on the use of rPPG are encouraging, indicating that noncontact measures of some human physiological parameters (e.g., breathing rate (BR) and Heart Rate (HR)) are promising and have great potential for various applications, such as health monitoring [47,50] and affective computing [51,52,53]. While these contributions are noteworthy, this paper significantly advances the field by introducing Hybrid Deep Learning (DL) networks and models for rPPG signal reconstruction and Heart Rate (HR) estimation. This novel approach presents about a substantial improvement in accuracy and efficiency in stress detection, achieving up to 95.83% accuracy with the UBFC-Phys’s dataset. The integration of Hybrid DL networks represents a contribution, offering enhanced capabilities for signal reconstruction and stress classification. Considering these, rPPG is well-suited for both business and everyday applications and has the significant advantage of measuring ECG and photoplethysmography (PPG).
Wearable and contactless devices offer promising alternatives for stress measurement, providing convenient and non-invasive methods for continuous monitoring. However, the quality and accuracy of the data generated by these devices can vary. A major limitation to adapting rPPG is evident in the decrease in the signal-to-noise ratio, which requires advanced signal processing. Many articles lack peer review and validation in clinical settings, raising concerns about the reliability of data. Although wearable devices can be sensitive to factors such as movement, heat, and transpiration, leading to inaccurate measurements, ease of use, especially during sleep or physical activities, is another huge limitation. Individuals with skin sensitivities, allergies, or specific health conditions may also find wearing these devices intolerable.
3. Method
The proposed methodology consists of three main parts, as shown in Figure 1. The primary objective is to detect social stress using contactless physiological signals extracted from facial videos through DL techniques. In the first part, a pyVHR toolbox (Python framework for Virtual Heart Rate) [54] is used to capture and estimate the beats per minute (BPM) from facial video data. The second part involves the increase of the estimated BPM and is subsequently input into four DL models (Recurrent Neural Network (RNN), LSTM, GRU, and 1D-CNN). The performance of these models is then evaluated and compared on the basis of specific metrics. The proposed methodology is implemented using Python 3 and relevant libraries for data manipulation, leveraging an NVIDIA graphics processing unit (GPU) with Compute Unified Device Architecture (CUDA) version 12.2 and CUDA Deep Neural Network (CuDNN) library. It should be noted that the default parameters of pyVHR include a window size of 8, patch size of 40, and pre/post filter, were used for the estimation of BPM. The selected methods include Regions of Interest (ROI) approaches: holistic and convex hull, as well as CuPy CHROM, Torch CHROM, and CuPy POS. Refer to Table 1 for a brief overview of the methods.
3.1. Dataset and data processing
The UBFC-Phys dataset includes data from 56 healthy subjects, with 12 participants excluded due to technical and consent issues [29]. The participants, aged between 19 and 38 (mean age 21.8, standard deviation 3.11), comprise 46 women and 10 men. In the study, stress levels were induced using a modified version of the Trier Social Stress Test (TSST) [55]. The participants completed three tasks: a 10-minute rest task serving as a baseline, a speech task, and an arithmetic task. Speech and arithmetic tasks aimed to induce stress through a social evaluation threat. In the test scenario, the speech task simulated a job interview, introducing an additional expert via video call to enhance social-evaluative threat. The arithmetic task involved a countdown with variations. For the purposes outlined in this paper, attention is given to ground-truth (GT) BVP signals labelled as T1 and T2 for the stress and non-stress classes, respectively. These signals, obtained using the Empatica 4 wristband at a 64 Hz sampling rate, consist of vectors with 11,520 data points each (64×180 = 11,520). Subsequently, the first 500 data points of the GT BVP signals for subjects s1 to s4 were plotted to visually depict the impact of stress (T1) and non-stress (T2) on signal behaviour. Refer to Figure 2 for these graphs.
Data processing included the application of the Fast Fourier Transform (Fast Fourier Transform (FFT)) to generate frequency domain features from the Blood Volume Pulse (BVP) signals. In addition, the data augmentation was implemented with Linear Interpolation and Gaussian White Noise.
Linear interpolation, as illustrated by Equation 1 augments by estimating values between existing data points creating straight lines connecting these points.
Where and are the first coordinates, and are the second coordinates, x is the point to perform the interpolation and y is the interpolated value.
Alternatively, the Gaussian white noise augmentation method generates series of random values using the Gaussian distribution - see equation 2 below. The resulting sequence exhibits white noise characteristics. Gaussian White Noise serves multiple purposes beyond dataset expansion. It is valuable to simulate uncertainty, randomness, or inherent variability present in real-world data.
where , , , …, are independent and identically distributed random variables following a Gaussian distribution with mean and standard deviation .
3.2. Deep Learning Models
A set of DL models are selected to to detect stress and evaluate the effectiveness and efficiency of the models. Due to intrinsic structural differences between DL models based on RNN, specifically LSTM and GRU, and Convolutional Neural Networks (CNN), three 1D-CNN-Multilayer Perceptron (MLP) models were designed. One of these models closely mirrors the architectures of RNN-based models in terms of the number of neurons, represented as "filters" in CNNs. However, instead of utilising LSTM or GRU layers, Convolutional One Dimensional (Conv1D) layers were used. These models also include Maxpooling1D layers and flatten layers, along with specific parameters and functions such as kernel size and Rectified Linear Unit (ReLU) activation. The other two 1D-CNN models have additional CNN and MLP layers and different "pool size". It is important to note that the limited sample size of estimated BPM signals (only 172 data points per video) from the pyVHR toolbox prevented the evaluation of the performance of 1D-CNN models versions 2 and 3, given their respective architectures. For a detailed architecture, layer descriptions, parameters, and functions of the 1D-CNN-MLP models, please refer to Table 2. The design flow of the 1D-CNN with 3 CNN and 2 MLP layers, labelled "CNNv2", is illustrated in Figure 3.
3.3. Performance Evaluation
The metrics chosen to evaluate the models needed to be suitable for the classification of categorical variables ”stress” and ”no-stress”. For that reason, the metrics Accuracy - Ac, Recall - Re, Precision - Precision (Pr) and F1-Score (F1) were selected. Each of these metrics assess the models’ classification performance from a different perspective. Accuracy - It provides a general sense of how well the model is performing between stress and non-stress classification. The higher the value, the greater is the model’s accuracy.
Recall - This metric is also known as sensitivity metric, or true positive rate. It computes the proportion of true positive predictions out of all actual positive instances. In the context of this research project, a high recall value indicates that the model is sensitive to detecting social stress, which is critical for its practical application.
Precision - Calculates the proportion of true positive predictions out of all positive instances. The higher the value, the more accurate the model is predicting the true positive instances. This helps minimise false positives, which is crucial when dealing with stress assessment.
F1 - This metric provides a balanced view of the model’s performance by considering both precision and recall. In stress classification, achieving a balance between minimising false positives Pr and false negatives Re is vital. A high F1 indicates that the model accurately identifies instances of social stress and minimises false classifications.
where True Positive (TP), True Negative (TN), False Positive (FP) and False Negative (FN).
4. Experimental Results
The visualisations provided in Figure 4 offer a distinct view of the contrasting characteristics between the non-stress task (T1) and the stress-induced task (T2) in both the time and frequency domains. In the time domain analysis, the T1 signal exhibits fluctuations within the range of -250 to 250 units, while in the presence of stress during T2, this range becomes wider, spanning from -500 to 500 units. This change in range suggests a potentially heightened physiological response during the stress task. Likewise, when we delve into the frequency domain, we notice a parallel pattern. In the frequency domain representation, the T1 signal presents values oscillating between 0 and 1, whereas the T2 signal exhibits a wider span of 0 to 5. This expanded variation in the frequency domain further emphasises the distinction between the non-stress and stress-induced states. Moreover, the implications of these observations extend beyond mere visualisation. The frequency domain signal has immense potential as a feature for training and testing deep learning methods aimed at stress classification. While the raw BVP signal encapsulates temporal patterns, the frequency domain offers insight into the underlying frequency components that contribute to those patterns. By extracting features from the frequency domain, deep learning models can potentially capture and leverage distinctive spectral characteristics related to stress. The plots in Figure 4 illustrate the GT BVP signals of subject 1 during the tasks T1 and T2 before and after FFT being applied to the data.
Figure 5 shows the estimated heart rate (BPM) extracted from video T1 of subject 1, using the CuPy CHROM method from the pyVHR toolbox. This visualisation illustrates the state before and after augmentation using linear interpolation, where it is possible to infer that expanding the original dataset of 173 data points to 11,009 data points did not alter the underlying signal, reinforcing the consistency between the original and augmented data. The processed and augmented dataset is then partitioned into training, validation, and test datasets using 10% for validation and 10% for testing.
Likewise, Figure 6 shows the estimated heart rate (BPM) plotted from the T1 and T2 videos of subject 1, using the CuPy CHROM method from the pyVHR toolbox. This visualisation illustrates the state before and after augmentation using white noise, where it is possible to infer that expanding the original dataset of 173 data points to 11,180 data points did not alter the underlying signal.
4.1. Classification Results
Three distinct DL methods (LSTM, GRU, 1D-CNN), each with different architectures (as detailed in Table 2), were implemented to identify the optimal model to effectively classify stress levels. Although this work focuses on building the best DL model to accurately classify stress status by extracting rPPG from face videos, this classification task was conducted using both GT-BVP signals computed from videos of the UBFC-Phys dataset separately in order to compare the performance of the DL models on the GT-BVP and the rPPG.
4.1.1. Performance analysis of the DL methods applied to the GT signal
The results in Table 3 present the top performing results achieved in this article for both the raw GT (TD) data and the processed GT (FD) data. The results are arranged in descending order, highlighting the best performing models and their respective accuracy. Additionally, the computation time for each model is also provided to allow for comparison of the execution times of the different models. There is a noticeable difference in computational efficiency between the CNN models and the LSTM and GRU models. The 1D-CNNv1 model completed 50 epochs in just 4.24 seconds, while the LSTMv2 model required approximately 1 minute and 30 seconds to achieve the same. The accuracy of the models varies between approximately 41.67% and 83.33%, and it is obvious that the best results were obtained using the TD data. However, some models exhibit different performances depending on the domain. For example, the 1D-CNNv2 model achieves significantly better accuracy (83.33%) in the time domain compared to its accuracy (50.00%) in the frequency domain. On the contrary, the GRUv2 model demonstrates a higher accuracy (62.50%) in the FD compared to its accuracy (58.33%) in the TD. Concerning the number of epochs for training and testing the models, it is possible to infer that the majority of the models only needed 50 or fewer epochs. On the other hand, the 1D-CNNv2 model achieved its higher performance around the 60th epoch, as can be seen in Figure 7.
Regarding the precision and recall in Table 3, precision in some cases is balanced with recall, while in others, trade-offs are evident. As previously mentioned, models with both high precision and high recall scores are effective at correctly classifying stress instances (true positives) and minimising both false positives and false negatives. For instance, the 1D-CNNv2 model achieved this balance, with an accuracy of 83.33%, Precision and Recall of 83.33%. On the other hand, models with high Recall, but lower Precision predict more instances as stressed, including those that are uncertain. This is useful when capturing all stress instances is a priority, even if it means more false positives. The GRUv1 model in the FD shows this pattern with Recall of 91.67% but Precision of 61.11%. It is also clear that the 1D-CNNv2 model achieved the highest accuracy (83.33%) among the tested methods. This suggests that it might be the most effective model for classifying stress and non-stress states from the GT-BVP signals. From Table 4, it can be inferred that the results achieved by the traditional machine learning method employed by the dataset’s authors (75%) and the CNN-MLP model utilised in the study by Hasanpoor et al. (82%) [54] were both exceeded in this work (83.33%).
4.1.2. Performance analysis of the DL methods applied to the rPPG signal
Moving forward to the performance of the DL models on the estimated BPM, these were obtained considering the different methods of BPM extraction on the pyVHR toolbox (CuPy-CHROM CuPy-POS, and Torch-CHROM), different epochs (50-100), augmentation techniques (none, linear interpolation and white noise), DL model versions, input domains (TD and FD), evaluation metrics (accuracy, precision, recall, and F1 score) and execution times. The training and testing generated over two hundred lines of results. The best results per DL model version and per pyVHR method are depicted in Table 5. With regard to these results, several conclusions can be drawn from this table. On a wider perspective, the accuracy ranges from 79.17% to 95.83%, indicating the DL models effectiveness in distinguishing between stress and non-stress states, which in the opinion of the authors can be considered a very good performance across the models. Precision and recall values vary across all models, with some achieving 100% and other slightly lower (the lowest being 73.33%), and the F1 score follows the same trend. Considering the time domains and augmentation techniques, it is possible to infer that the majority of the models excelled in the frequency domain, whereas the 1D-CNNv3 demonstrated high scores across all metrics in TD. In terms of augmentation techniques, it is possible to infer that interpolation and no additional augmentation achieved the best performances across all models. Furthermore, both CuPy-CHROM and Torch-CHROM pyVHR methods can be a good choice for estimating BPM from facial videos for stress classification, because all three CNN models achieved higher performances, although with distinctive augmentation techniques and domains. Regarding the train and test times, these range from few seconds to over two minutes, with CNN having the best execution times compared with the LSTM and the GRU models.
In terms of the number of epochs for training and testing, it is possible to infer that, for the great majority of the models, less than 50 epochs were needed to train and test the model, with a few exceptions as in the case of the model that achieved the best overall performance, 1D-CNNv1 with the configuration white noise and FD, whose performance slightly improved from around 91.70% to 95.83%. The validation loss and accuracy curves also reflect that difference, where it can be that the model’s performance slightly improved after around 60 epochs, with an increase of the testing curve and decrease of the loss curve (refer to Figure 8).
Considering the importance of accuracy, precision and recall metrics, along with the focus on real-world deployment utilising edge devices, the following models appear to be the stronger candidates; 1D-CNN models, namely 1D-CNNv1, using the CuPy-CHROM method, white noise augmentation, FD and 100 epochs, with a mere 7.8 seconds of execution time; 1D-CNNv2 also using the CuPy-CHROM method, with linear-interpolation augmentation, FD and 50 epochs, and the 1D-CNNv3 using the Torch-CHROM method, with linear-interpolation augmentation, TD and 50 epochs.
These models as illustrated in the normalised confusion matrix in Figure 9 has consistently achieve high accuracy (95.83%), precision, and other metrics across TD, FD and pyVHR methods. They are well-suited for real-time applications due to their relatively lower training times compared to the LSTM and the GRU models. Furthermore, these models demonstrate that they are efficient in processing sequential data like time series, making them suitable for processing heart rate data extracted from videos. Moreover, the balanced precision and recall they offer make them well-suited for stress and non-stress classification, as avoiding false positives and false negatives is crucial.
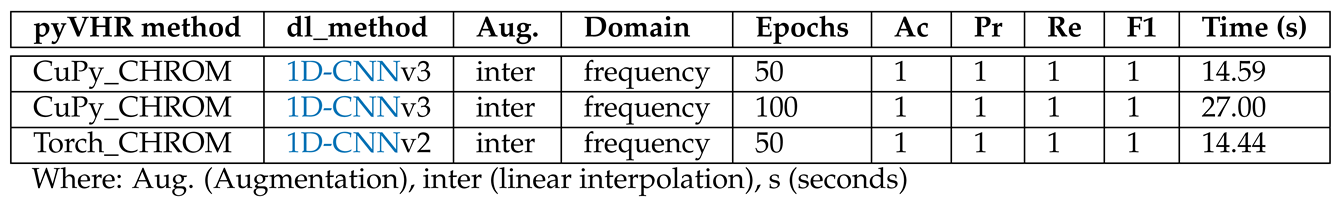
As shown in Table 6, two of the three CNN models (1D-CNNv2 and 1D-CNNv3) achieved perfect scores (100%) in all performance metrics. These results were omitted from the best results in Table 5 and are likely the consequence of overfitting, due to training a heavy model on a small dataset. The authors believe that it is reasonable to assume that the deployment of these models, along with their associated weights, to real-world data scenarios would probably yield performance outcomes that are less impressive.
5. Conclusion and Future Work
This paper has successfully established a robust framework for remote stress detection through the analysis of physiological signals derived from facial videos. The primary goal was to ascertain an advanced DL model for stress classification, surpassing the capabilities of traditional ML techniques. The adoption of three DL methods (LSTM, GRU, and CNN) and their refinement through empirical optimization yielded significant achievements, including an impressive 95.83% accuracy in classifying stress from rPPG signals. The outstanding computational efficiency of the best-performing DL model, 1D-CNNv1, aligns seamlessly with the prospect of deploying the framework on edge devices. The exploration of augmentation techniques, particularly linear interpolation and the absence of augmentation, showcased promising outcomes, highlighting their efficacy in enhancing model performance. The proposed methodology holds significant potential to influence stress-related policies, practices, and management, potentially fostering increased user engagement with stress detection tools. However, it is crucial to acknowledge a major limitation inherent in the rPPG approach, centered around privacy concerns stemming from the utilisation of cameras and the diversity of the participants. The privacy issue emphasises the need for user consent and necessitates a careful balance between the potential advantages of the approach and the preservation of individual privacy rights. It is imperative to underscore that the rich insights provided by this approach should be accompanied by stringent privacy measures, ensuring that user consent is sought and respected throughout the stress detection process. Future work will focus on improving signal extraction through alternative physiological sensing tools and optimising parameters in existing toolboxes. Exploring additional augmentation techniques and advancing DL methods, particularly focusing on 1D-CNN, stands as promising paths for further enhancement. Rigorous validation through cross-validation and testing on diverse datasets is paramount to assess model robustness and ensure generalisation across various scenarios. Furthermore, future investigations could also consider the potential influence of participant ethnicity on model accuracy, recognising the importance of addressing diversity in the dataset and its implications for the broader applicability of the stress detection framework.
Author Contributions
Conceptualisation, L.F., PM and I.K.I; Methodology, LF.; Software, LF; Validation, L.F., PM and I.K.I; Formal analysis, L.F., PM and I.K.I; Investigation, L.F; Resources, L.F. and PM.; Writing—original draft preparation, L.F.; Writing—review and editing, L.F., P.M., D.V., S.Y., J.B, and I.K.I; Visualisation, L.F. and P.M.; Supervision, I.K.I
Conflicts of Interest
The authors declare no conflict of interest.
References
- Siddique, C.; D’Arcy, C. Adolescence, stress, and psychological well-being. Journal of youth and adolescence 1984, 13, 459–473. [Google Scholar] [CrossRef] [PubMed]
- Everly, Jr, G.S.; Lating, J.M.; Everly, G.S.; Lating, J.M. The anatomy and physiology of the human stress response. A clinical guide to the treatment of the human stress response 2019, pp. 19–56.
- Thayer, J.F.; Åhs, F.; Fredrikson, M.; Sollers III, J.J.; Wager, T.D. A meta-analysis of heart rate variability and neuroimaging studies: implications for heart rate variability as a marker of stress and health. Neuroscience & Biobehavioral Reviews 2012, 36, 747–756. [Google Scholar]
- McCarty, R. The fight-or-flight response: A cornerstone of stress research; Elsevier, 2016; pp. 33–37.
- Thorsteinsson, E.B.; Brown, R.F.; Richards, C. The relationship between work-stress, psychological stress and staff health and work outcomes in office workers. Psychology 2014, 2014. [Google Scholar] [CrossRef]
- van Kraaij, A.W.J.; Schiavone, G.; Lutin, E.; Claes, S.; Van Hoof, C. Relationship between chronic stress and heart rate over time modulated by gender in a cohort of office workers: cross-sectional study using wearable technologies. Journal of medical Internet research 2020, 22, e18253. [Google Scholar] [CrossRef] [PubMed]
- McEwen, B.S. Neurobiological and systemic effects of chronic stress. Chronic stress 2017, 1, 2470547017692328. [Google Scholar] [CrossRef] [PubMed]
- McKlveen, J.M.; Morano, R.L.; Fitzgerald, M.; Zoubovsky, S.; Cassella, S.N.; Scheimann, J.R.; Ghosal, S.; Mahbod, P.; Packard, B.A.; Myers, B.; others. Chronic stress increases prefrontal inhibition: a mechanism for stress-induced prefrontal dysfunction. Biological psychiatry 2016, 80, 754–764. [Google Scholar] [CrossRef] [PubMed]
- Samson, C.; Koh, A. Stress monitoring and recent advancements in wearable biosensors. Frontiers in bioengineering and biotechnology 2020, 8, 1037. [Google Scholar] [CrossRef]
- Dalmeida, K.M.; Masala, G.L. HRV features as viable physiological markers for stress detection using wearable devices. Sensors 2021, 21, 2873. [Google Scholar] [CrossRef] [PubMed]
- Shaffer, F.; Ginsberg, J.P. An overview of heart rate variability metrics and norms. Frontiers in public health 2017, p. 258.
- Rodríguez-Arce, J.; Lara-Flores, L.; Portillo-Rodríguez, O.; Martínez-Méndez, R. Towards an anxiety and stress recognition system for academic environments based on physiological features. Computer methods and programs in biomedicine 2020, 190, 105408. [Google Scholar] [CrossRef]
- Greco, A.; Valenza, G.; Lázaro, J.; Garzón-Rey, J.M.; Aguiló, J.; De-la Camara, C.; Bailón, R.; Scilingo, E.P. Acute stress state classification based on electrodermal activity modeling. IEEE Transactions on Affective Computing 2021. [Google Scholar] [CrossRef]
- Pourmohammadi, S.; Maleki, A. Stress detection using ECG and EMG signals: A comprehensive study. Computer methods and programs in biomedicine 2020, 193, 105482. [Google Scholar] [CrossRef]
- Marois, A.; Lafond, D.; Gagnon, J.F.; Vachon, F.; Cloutier, M.S. Predicting stress among pedestrian traffic workers using physiological and situational measures. Proceedings of the Human Factors and Ergonomics Society Annual Meeting. SAGE Publications Sage CA: Los Angeles, CA, 2018, Vol. 62, pp. 1262–1266.
- Sánchez-Reolid, R.; Martínez-Rodrigo, A.; López, M.T.; Fernández-Caballero, A. Deep support vector machines for the identification of stress condition from electrodermal activity. International Journal of Neural Systems 2020, 30, 2050031. [Google Scholar] [CrossRef] [PubMed]
- Tanev, G.; Saadi, D.B.; Hoppe, K.; Sorensen, H.B. Classification of acute stress using linear and non-linear heart rate variability analysis derived from sternal ECG. 2014 36th Annual International Conference of the IEEE Engineering in Medicine and Biology Society. IEEE, 2014, pp. 3386–3389.
- Garbarino, M.; Lai, M.; Bender, D.; Picard, R.W.; Tognetti, S. Empatica E3—A wearable wireless multi-sensor device for real-time computerized biofeedback and data acquisition. 2014 4th International Conference on Wireless Mobile Communication and Healthcare-Transforming Healthcare Through Innovations in Mobile and Wireless Technologies (MOBIHEALTH). IEEE, 2014, pp. 39–42.
- Shcherbina, A.; Mattsson, C.M.; Waggott, D.; Salisbury, H.; Christle, J.W.; Hastie, T.; Wheeler, M.T.; Ashley, E.A. Accuracy in wrist-worn, sensor-based measurements of heart rate and energy expenditure in a diverse cohort. Journal of personalized medicine 2017, 7, 3. [Google Scholar] [CrossRef] [PubMed]
- Caminal, P.; Sola, F.; Gomis, P.; Guasch, E.; Perera, A.; Soriano, N.; Mont, L. Validity of the Polar V800 monitor for measuring heart rate variability in mountain running route conditions. European journal of applied physiology 2018, 118, 669–677. [Google Scholar] [CrossRef] [PubMed]
- Salai, M.; Vassányi, I.; Kósa, I. Stress detection using low cost heart rate sensors. Journal of healthcare engineering 2016, 2016. [Google Scholar] [CrossRef] [PubMed]
- Moridani, M.; Mahabadi, Z.; Javadi, N. Heart rate variability features for different stress classification. Bratislavske Lekarske Listy 2020, 121, 619–627. [Google Scholar] [CrossRef] [PubMed]
- Salahuddin, L.; Cho, J.; Jeong, M.G.; Kim, D. Ultra short term analysis of heart rate variability for monitoring mental stress in mobile settings. 2007 29th annual international conference of the ieee engineering in medicine and biology society. IEEE, 2007, pp. 4656–4659.
- Schmidt, P.; Reiss, A.; Duerichen, R.; Marberger, C.; Van Laerhoven, K. Introducing wesad, a multimodal dataset for wearable stress and affect detection. Proceedings of the 20th ACM international conference on multimodal interaction, 2018, pp. 400–408.
- Chudy, N.S. Testing of wrist-worn-fitness-tracking devices during cognitive stress: A validation study 2017.
- Giles, D.; Draper, N.; Neil, W. Validity of the Polar V800 heart rate monitor to measure RR intervals at rest. European journal of applied physiology 2016, 116, 563–571. [Google Scholar] [CrossRef]
- Heikenfeld, J.; Jajack, A.; Rogers, J.; Gutruf, P.; Tian, L.; Pan, T.; Li, R.; Khine, M.; Kim, J.; Wang, J. Wearable sensors: modalities, challenges, and prospects. Lab on a Chip 2018, 18, 217–248. [Google Scholar] [CrossRef] [PubMed]
- McDuff, D. Camera Measurement of Physiological Vital Signs. ACM Computing Surveys 2023, 55. [Google Scholar] [CrossRef]
- Sabour, R.M.; Benezeth, Y.; De Oliveira, P.; Chappe, J.; Yang, F. Ubfc-phys: A multimodal database for psychophysiological studies of social stress. IEEE Transactions on Affective Computing 2021. [Google Scholar] [CrossRef]
- Cheng, Y.C.; Chou, T.I.; Indikawati, F.I.; Winiarti, S.; Dahlan, A.; Selatan, R.; Yogyakarta, D. Stress Detection from Multimodal Wearable Sensor Data. IOP Conference Series: Materials Science and Engineering 2020, 771, 012028. [Google Scholar] [CrossRef]
- Herranz Olazábal, J.; Wieringa, F.; Hermeling, E.; Van Hoof, C. Camera-Derived Photoplethysmography (rPPG) and Speckle Plethysmography (rSPG): Comparing Reflective and Transmissive Mode at Various Integration Times Using LEDs and Lasers. Sensors 2022, 22, 6059. [Google Scholar] [CrossRef]
- Yang, Z.; Wang, H.; Lu, F. Assessment of Deep Learning-Based Heart Rate Estimation Using Remote Photoplethysmography Under Different Illuminations. IEEE Transactions on Human-Machine Systems 2022, 52, 1236–1246. [Google Scholar] [CrossRef]
- Schneiderman, N.; Ironson, G.; Siegel, S.D. Stress and health: psychological, behavioral, and biological determinants. Annu. Rev. Clin. Psychol. 2005, 1, 607–628. [Google Scholar] [CrossRef] [PubMed]
- Selye, H. Short letter. Nature 1936, 138, 32. [Google Scholar] [CrossRef]
- Dhama, K.; Latheef, S.K.; Dadar, M.; Samad, H.A.; Munjal, A.; Khandia, R.; Karthik, K.; Tiwari, R.; Yatoo, M.I.; Bhatt, P.; Chakraborty, S.; Singh, K.P.; Iqbal, H.M.; Chaicumpa, W.; Joshi, S.K. Biomarkers in stress related diseases/disorders: Diagnostic, prognostic, and therapeutic values. Frontiers in Molecular Biosciences 2019, 6. [Google Scholar] [CrossRef] [PubMed]
- Can, Y.S.; Arnrich, B.; Ersoy, C. Stress detection in daily life scenarios using smart phones and wearable sensors: A survey. Journal of biomedical informatics 2019, 92, 103139. [Google Scholar] [CrossRef]
- Arsalan, A.; Anwar, S.M.; Majid, M. Mental stress detection using data from wearable and non-wearable sensors: a review. arXiv preprint 2022, arXiv:2202.03033. [Google Scholar]
- Nath, R.K.; Thapliyal, H. Smart wristband-based stress detection framework for older adults with cortisol as stress biomarker. IEEE Transactions on Consumer Electronics 2021, 67, 30–39. [Google Scholar] [CrossRef]
- Chan, S.F.; La Greca, A.M. Perceived stress scale (PSS). In Encyclopedia of behavioral medicine; Springer, 2020; pp. 1646–1648.
- Cheng, B.; Fan, C.; Fu, H.; Huang, J.; Chen, H.; Luo, X. Measuring and computing cognitive statuses of construction workers based on electroencephalogram: a critical review. IEEE Transactions on Computational Social Systems 2022, 9, 1644–1659. [Google Scholar] [CrossRef]
- Wang, X.; Li, D.; Menassa, C.C.; Kamat, V.R. Investigating the effect of indoor thermal environment on occupants’ mental workload and task performance using electroencephalogram. Building and Environment 2019, 158, 120–132. [Google Scholar] [CrossRef]
- Abellán-Huerta, J.; Prieto-Valiente, L.; Montoro-García, S.; Abellán-Alemán, J.; Soria-Arcos, F. Correlation of blood pressure variability as measured by clinic, self-measurement at home, and ambulatory blood pressure monitoring. American Journal of Hypertension 2018, 31, 305–312. [Google Scholar] [CrossRef] [PubMed]
- Chen, Y.; Rao, M.; Feng, K.; Niu, G. Modified Varying Index Coefficient Autoregression Model for Representation of the Nonstationary Vibration From a Planetary Gearbox. IEEE Transactions on Instrumentation and Measurement 2023, 72, 1–12. [Google Scholar] [CrossRef]
- Shahid, M.M.; Agada, G.E.; Kayyali, M.; Ihianle, I.K.; Machado, P. Towards Enhanced Well-Being: Monitoring Stress and Health with Smart Sensor Systems. 2023 International Conference Automatics and Informatics (ICAI). IEEE, 2023, pp. 432–437.
- Ihianle, I.K.; Machado, P.; Owa, K.; Adama, D.A.; Otuka, R.; Lotfi, A. Minimising redundancy, maximising relevance: HRV feature selection for stress classification. Expert Systems with Applications 2024, 239, 122490. [Google Scholar] [CrossRef]
- Benezeth, Y.; Bobbia, S.; Nakamura, K.; Gomez, R.; Dubois, J. Probabilistic signal quality metric for reduced complexity unsupervised remote photoplethysmography. 2019 13th International Symposium on Medical Information and Communication Technology (ISMICT). IEEE, 2019, pp. 1–5.
- Hassan, M.; Malik, A.; Fofi, D.; Saad, N.; Meriaudeau, F. Novel health monitoring method using an RGB camera. Biomedical optics express 2017, 8, 4838–4854. [Google Scholar] [CrossRef] [PubMed]
- Selvaraju, V.; Spicher, N.; Wang, J.; Ganapathy, N.; Warnecke, J.M.; Leonhardt, S.; Swaminathan, R.; Deserno, T.M. Continuous monitoring of vital signs using cameras: A systematic review. Sensors 2022, 22, 4097. [Google Scholar] [CrossRef]
- Lee, R.J.; Sivakumar, S.; Lim, K.H. Review on remote heart rate measurements using photoplethysmography. Multimedia Tools and Applications 2023, pp. 1–30.
- Abbas, L.; Samy, S.; Ghazal, R.; Eldeib, A.M.; ElGohary, S.H. Contactless Vital Signs Monitoring for Public Health Welfare. 2021 9th International Japan-Africa Conference on Electronics, Communications, and Computations (JAC-ECC). IEEE, 2021, pp. 183–186.
- Yu, Z.; Li, X.; Zhao, G. Facial-video-based physiological signal measurement: Recent advances and affective applications. IEEE Signal Processing Magazine 2021, 38, 50–58. [Google Scholar] [CrossRef]
- Casado, C.Á.; Cañellas, M.L.; López, M.B. Depression recognition using remote photoplethysmography from facial videos. IEEE Transactions on Affective Computing 2023. [Google Scholar] [CrossRef]
- Lokendra, B.; Puneet, G. AND-rPPG: A novel denoising-rPPG network for improving remote heart rate estimation. Computers in biology and medicine 2022, 141, 105146. [Google Scholar] [CrossRef] [PubMed]
- Hasanpoor, Y.; Motaman, K.; Tarvirdizadeh, B.; Alipour, K.; Ghamari, M. Stress Detection Using PPG Signal and Combined Deep CNN-MLP Network. 2022 29th National and 7th International Iranian Conference on Biomedical Engineering (ICBME). IEEE, 2022, pp. 223–228.
- Kirschbaum, C.; Pirke, K.M.; Hellhammer, D.H. The ‘Trier Social Stress Test’–a tool for investigating psychobiological stress responses in a laboratory setting. Neuropsychobiology 1993, 28, 76–81. [Google Scholar] [CrossRef]
- Boccignone, G.; Conte, D.; Cuculo, V.; D’Amelio, A.; Grossi, G.; Lanzarotti, R.; Mortara, E. pyVHR: a Python framework for remote photoplethysmography. PeerJ Computer Science 2022, 8, e929. [Google Scholar] [CrossRef]
Figure 1.
Stress Detection Framework – The video frames serve as inputs to the pyVHR toolbox enabling the extraction of rPPG signals BPM from facial regions within the frames. The derived BPM signals are subsequently channelled through DL models (LSTM, GRU, and 1D-CNN), culminating in stress classification outcomes.
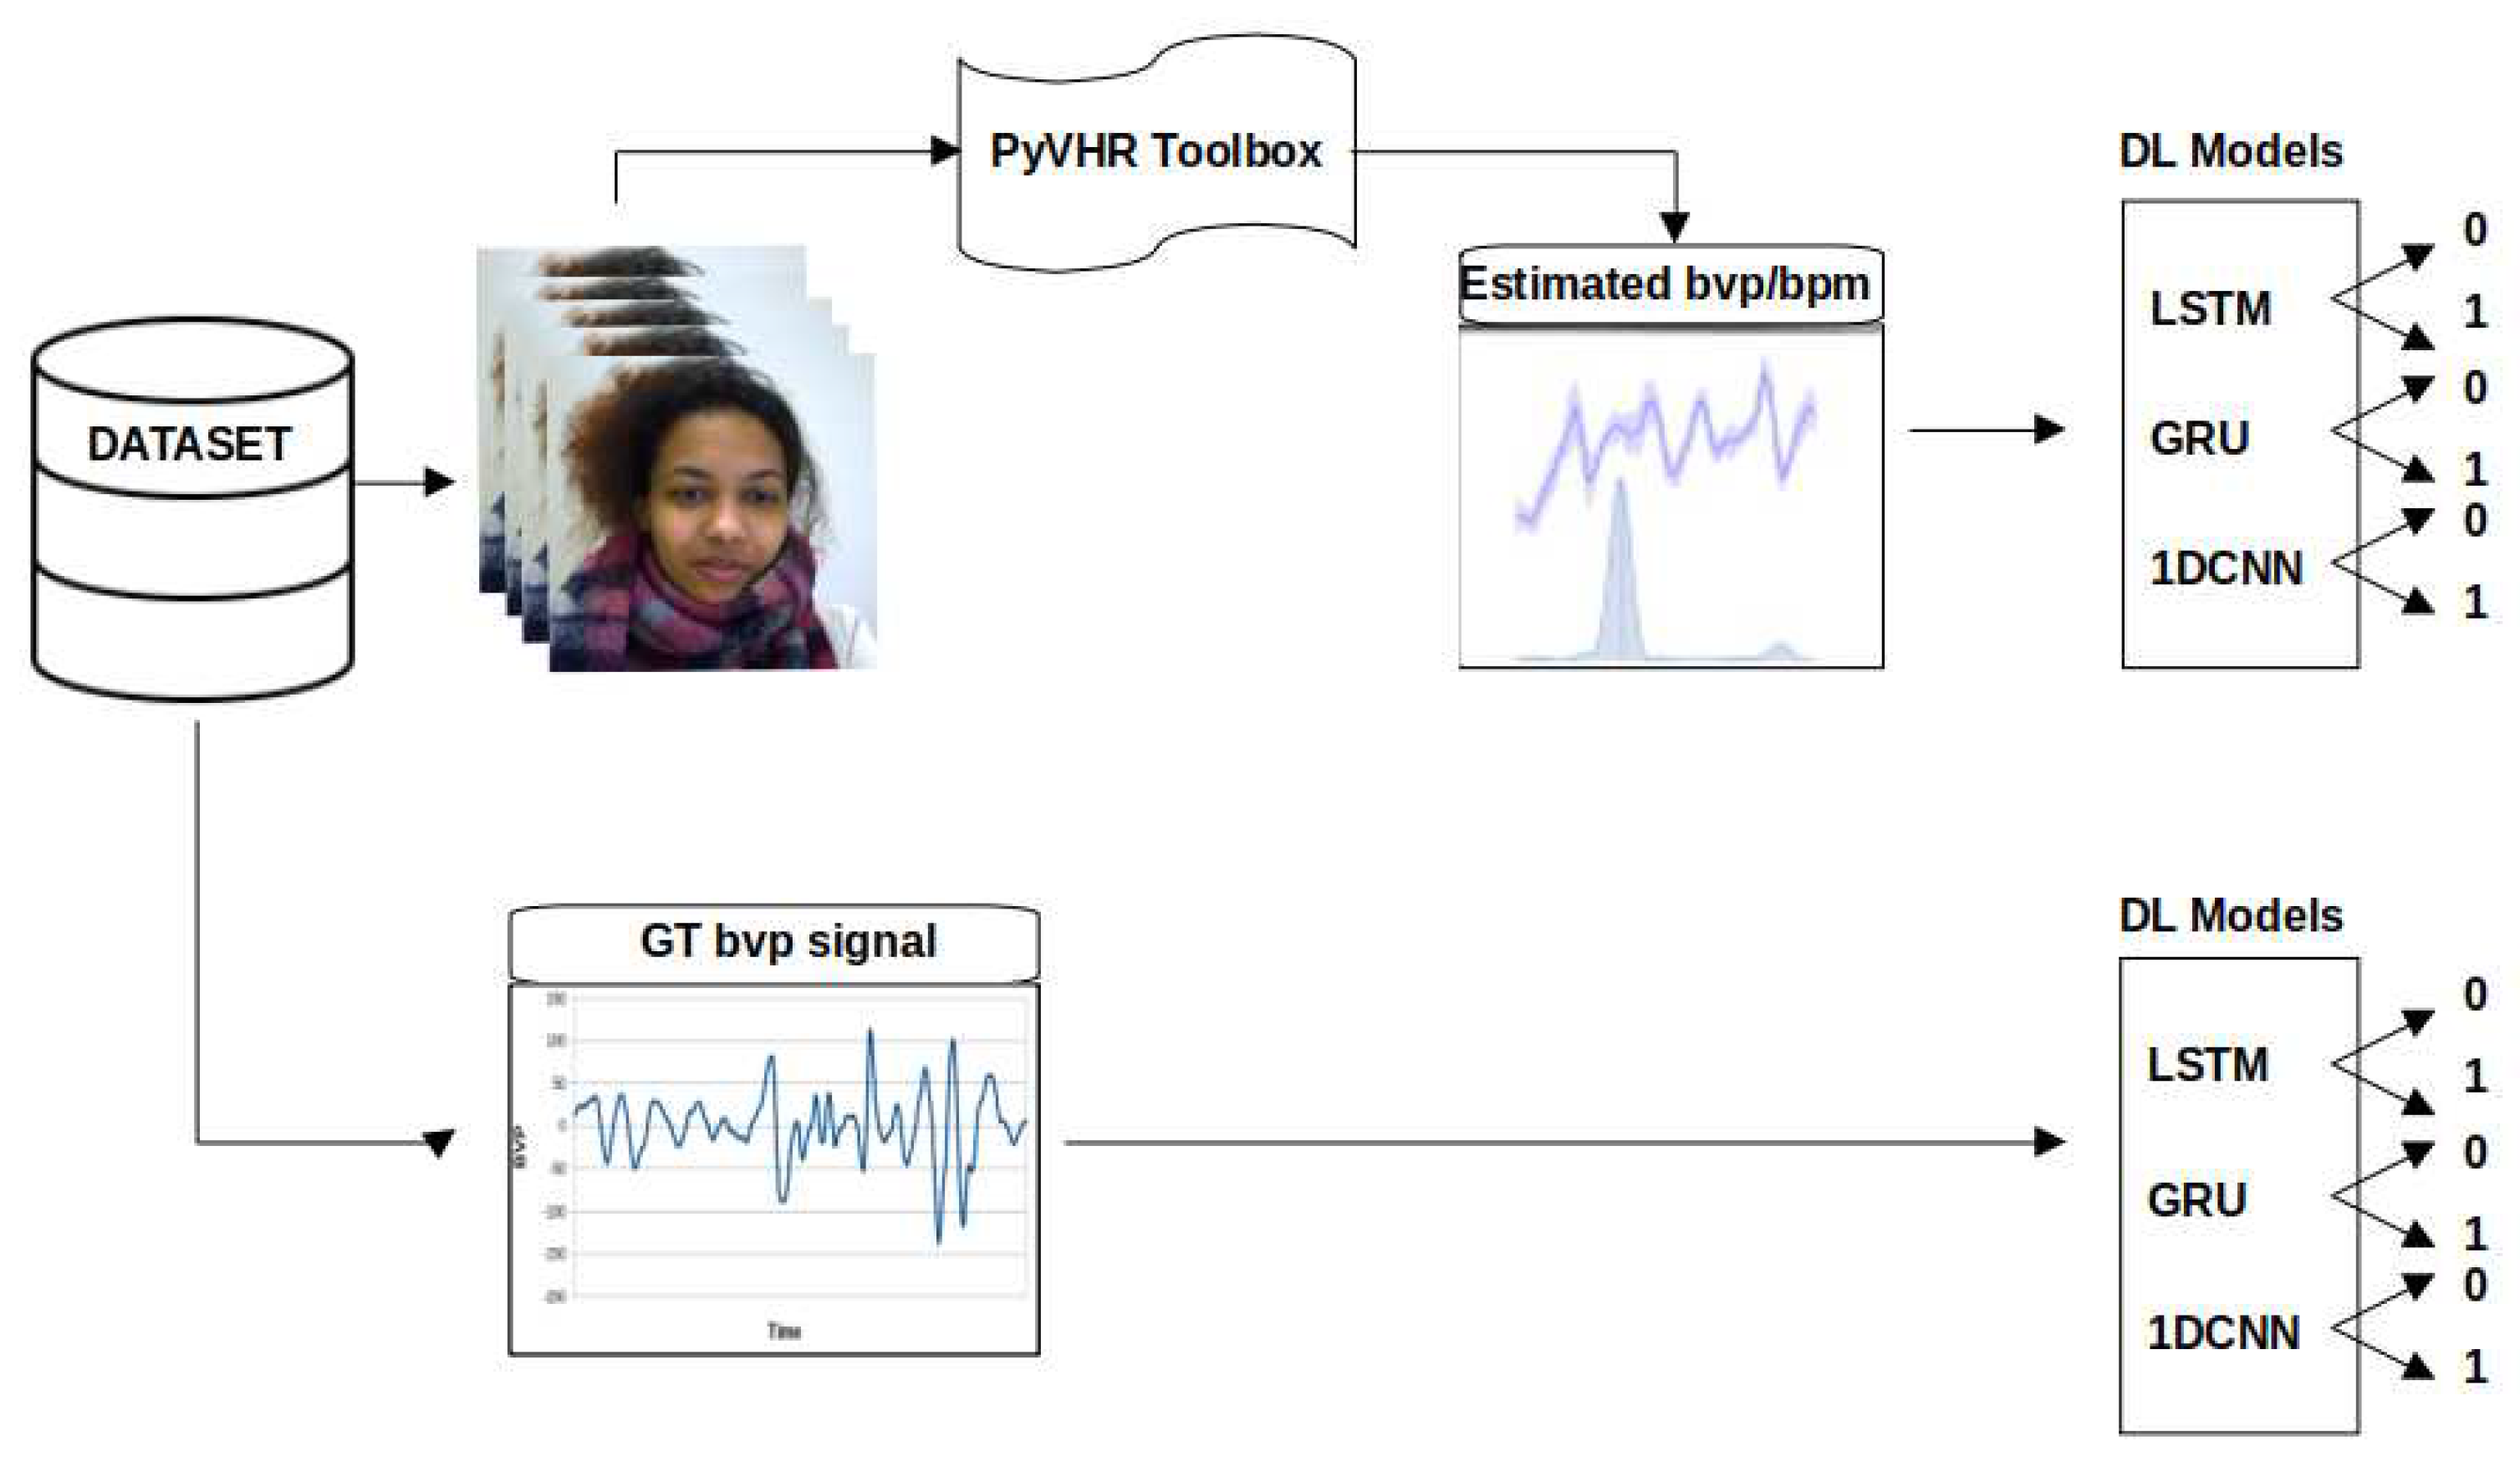
Figure 2.
GT BVP signals behaviour during no stress task (T1) and stress task (T2) of subjects s1 to s4
Figure 2.
GT BVP signals behaviour during no stress task (T1) and stress task (T2) of subjects s1 to s4
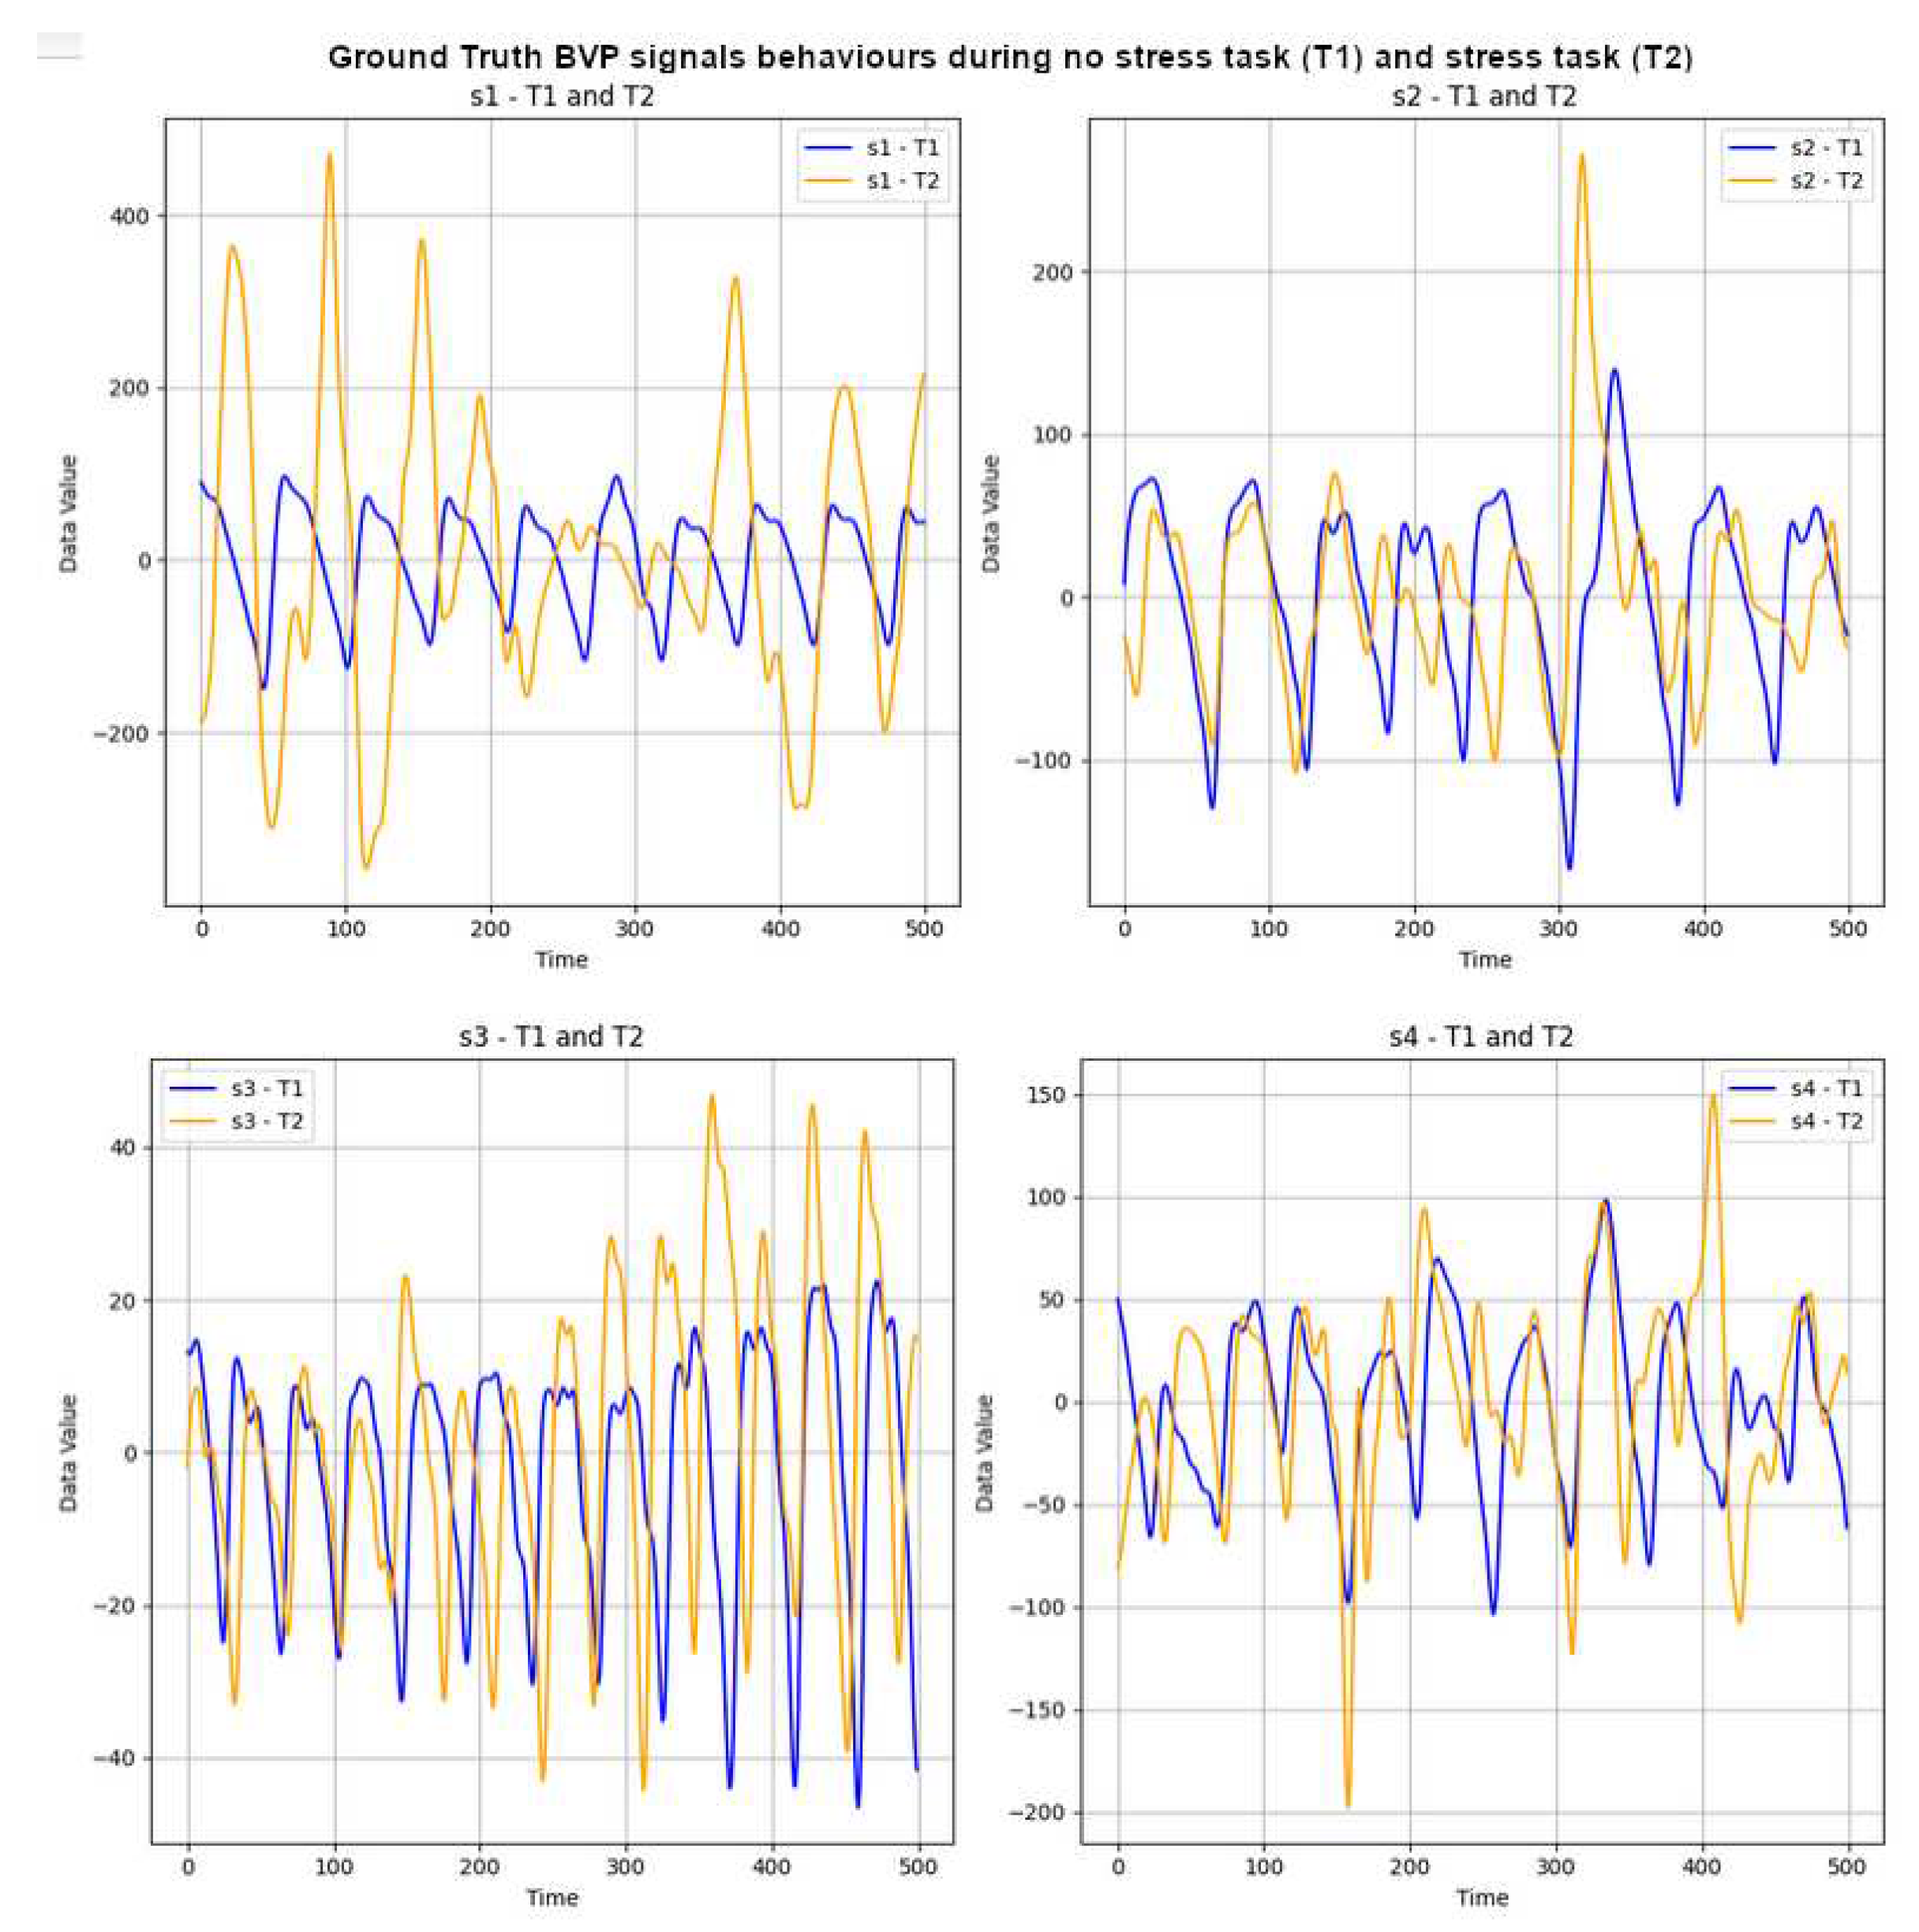
Figure 3.
1D 3x CNN-2x MLP architecture – labelled "1D-CNNv2". Image from the author.
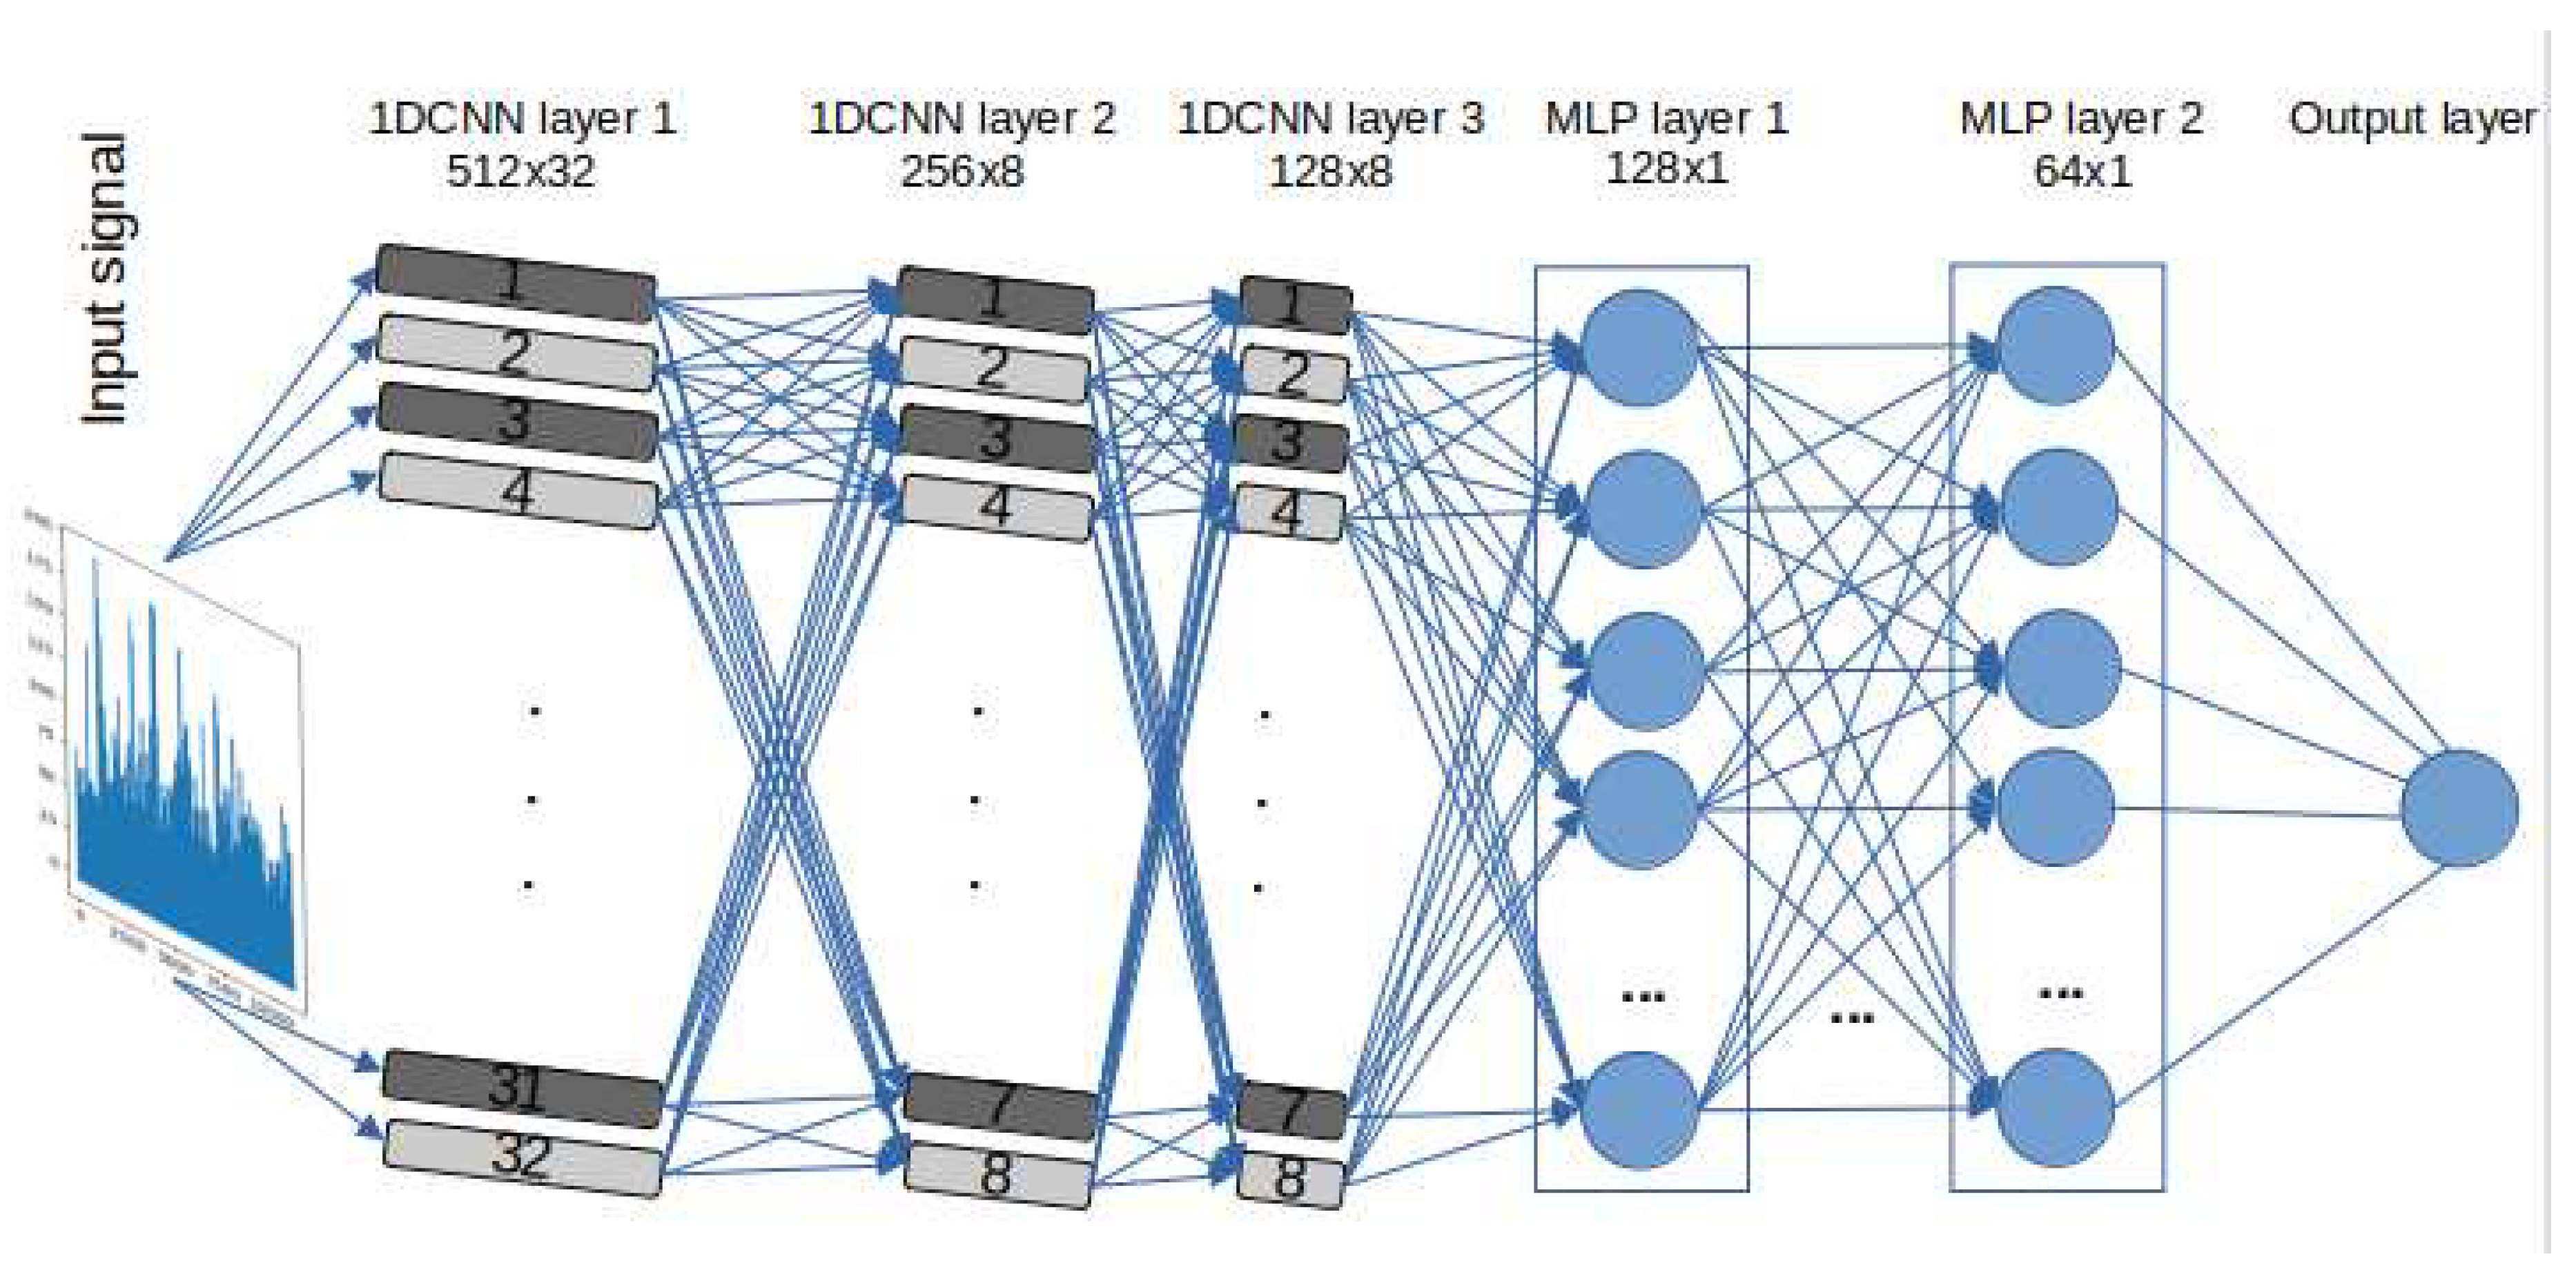
Figure 4.
Graphs depicting the Time Domain (TD) and Frequency Domain (FD) representations of the GT BVP signals for Subject 1 during tasks T1 and T2
Figure 4.
Graphs depicting the Time Domain (TD) and Frequency Domain (FD) representations of the GT BVP signals for Subject 1 during tasks T1 and T2
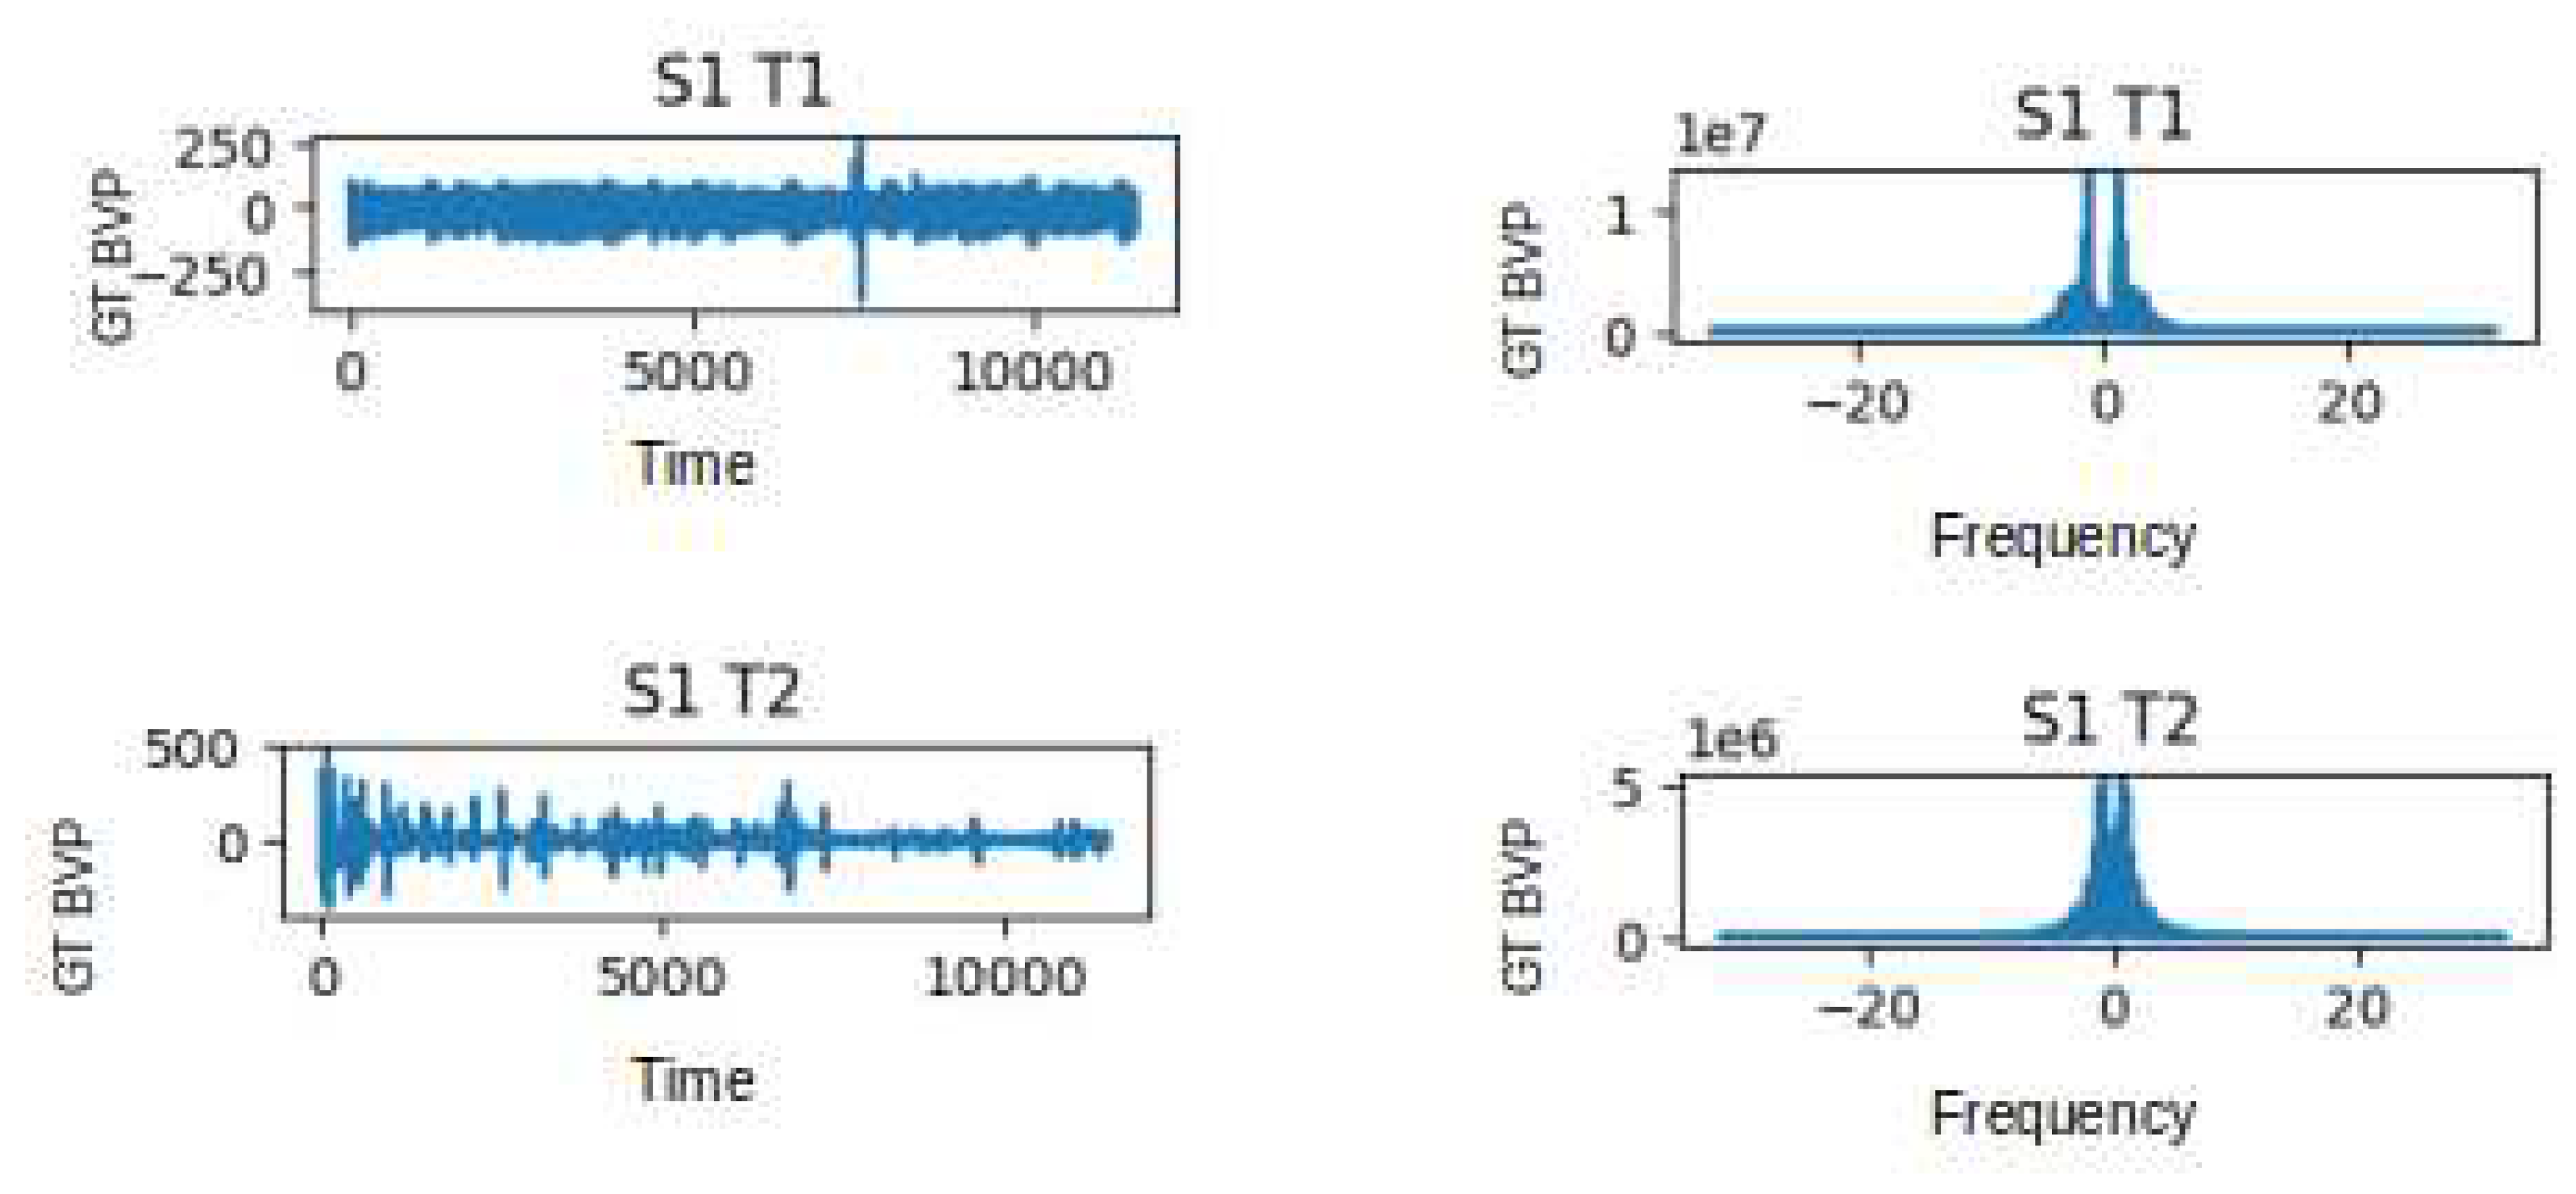
Figure 5.
Plot of Estimated BPM extracted from video T1 of subject 1, using the method CuPy CHROM, before and after augmentation using linear interpolation
Figure 5.
Plot of Estimated BPM extracted from video T1 of subject 1, using the method CuPy CHROM, before and after augmentation using linear interpolation
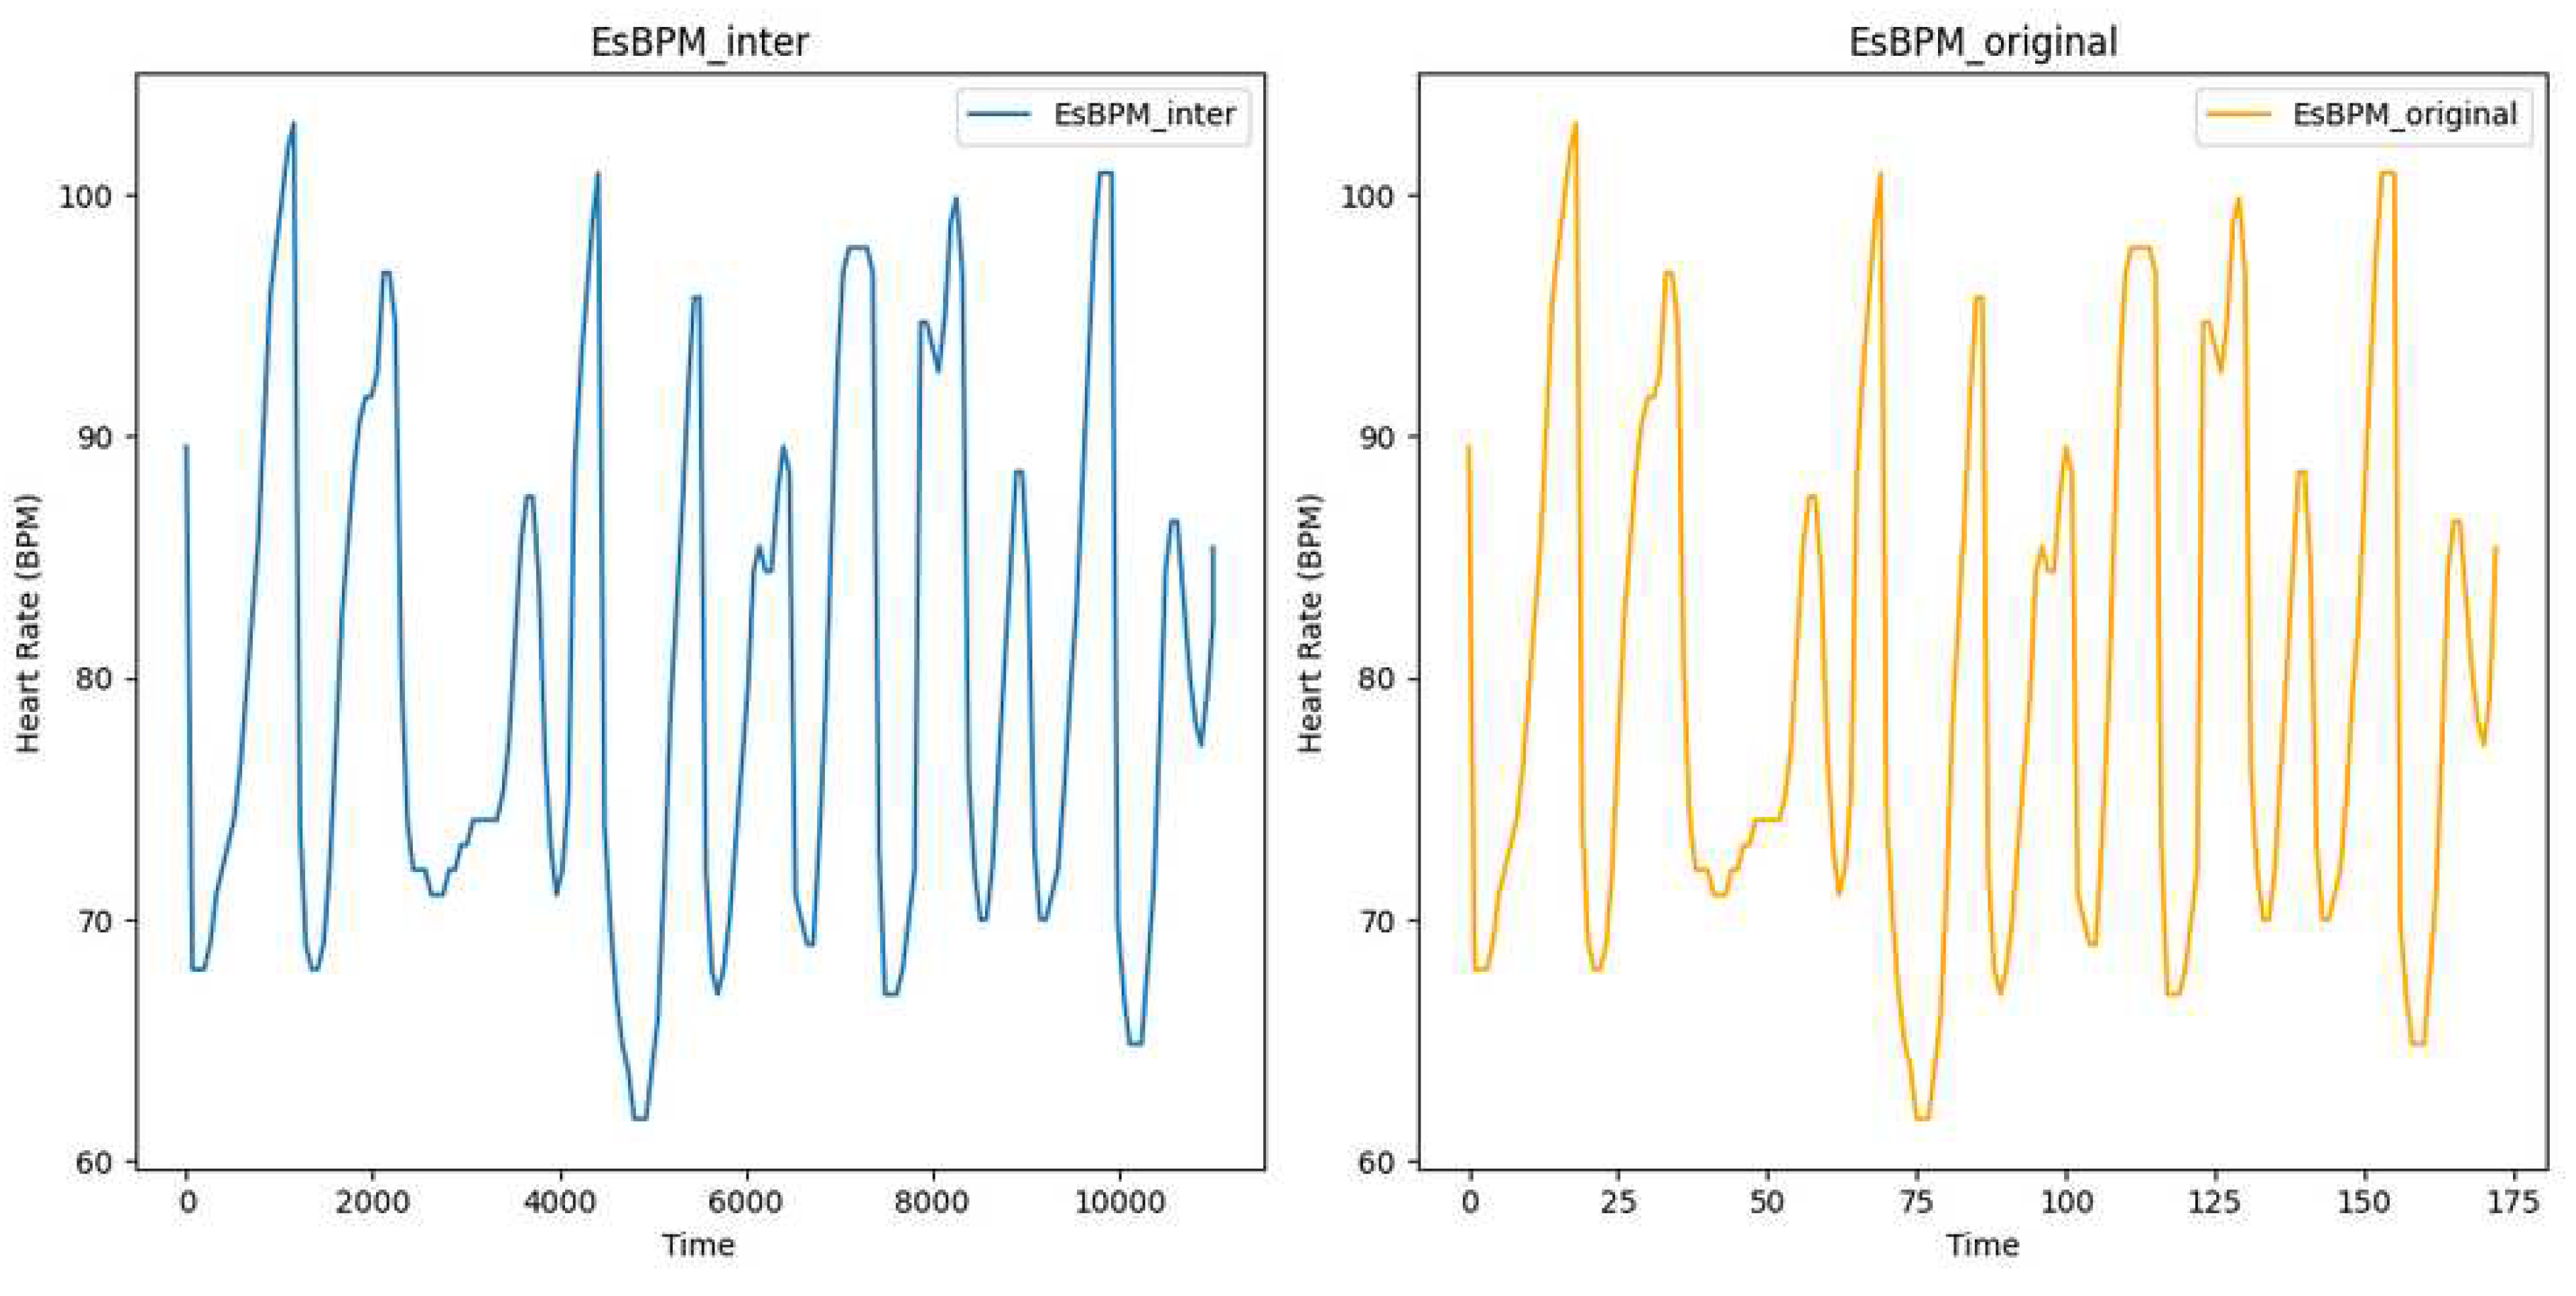
Figure 6.
Plot of Estimated BPM extracted from videos T1 of subject 1, using the method CuPy CHROM, before and after augmentation using white noise
Figure 6.
Plot of Estimated BPM extracted from videos T1 of subject 1, using the method CuPy CHROM, before and after augmentation using white noise
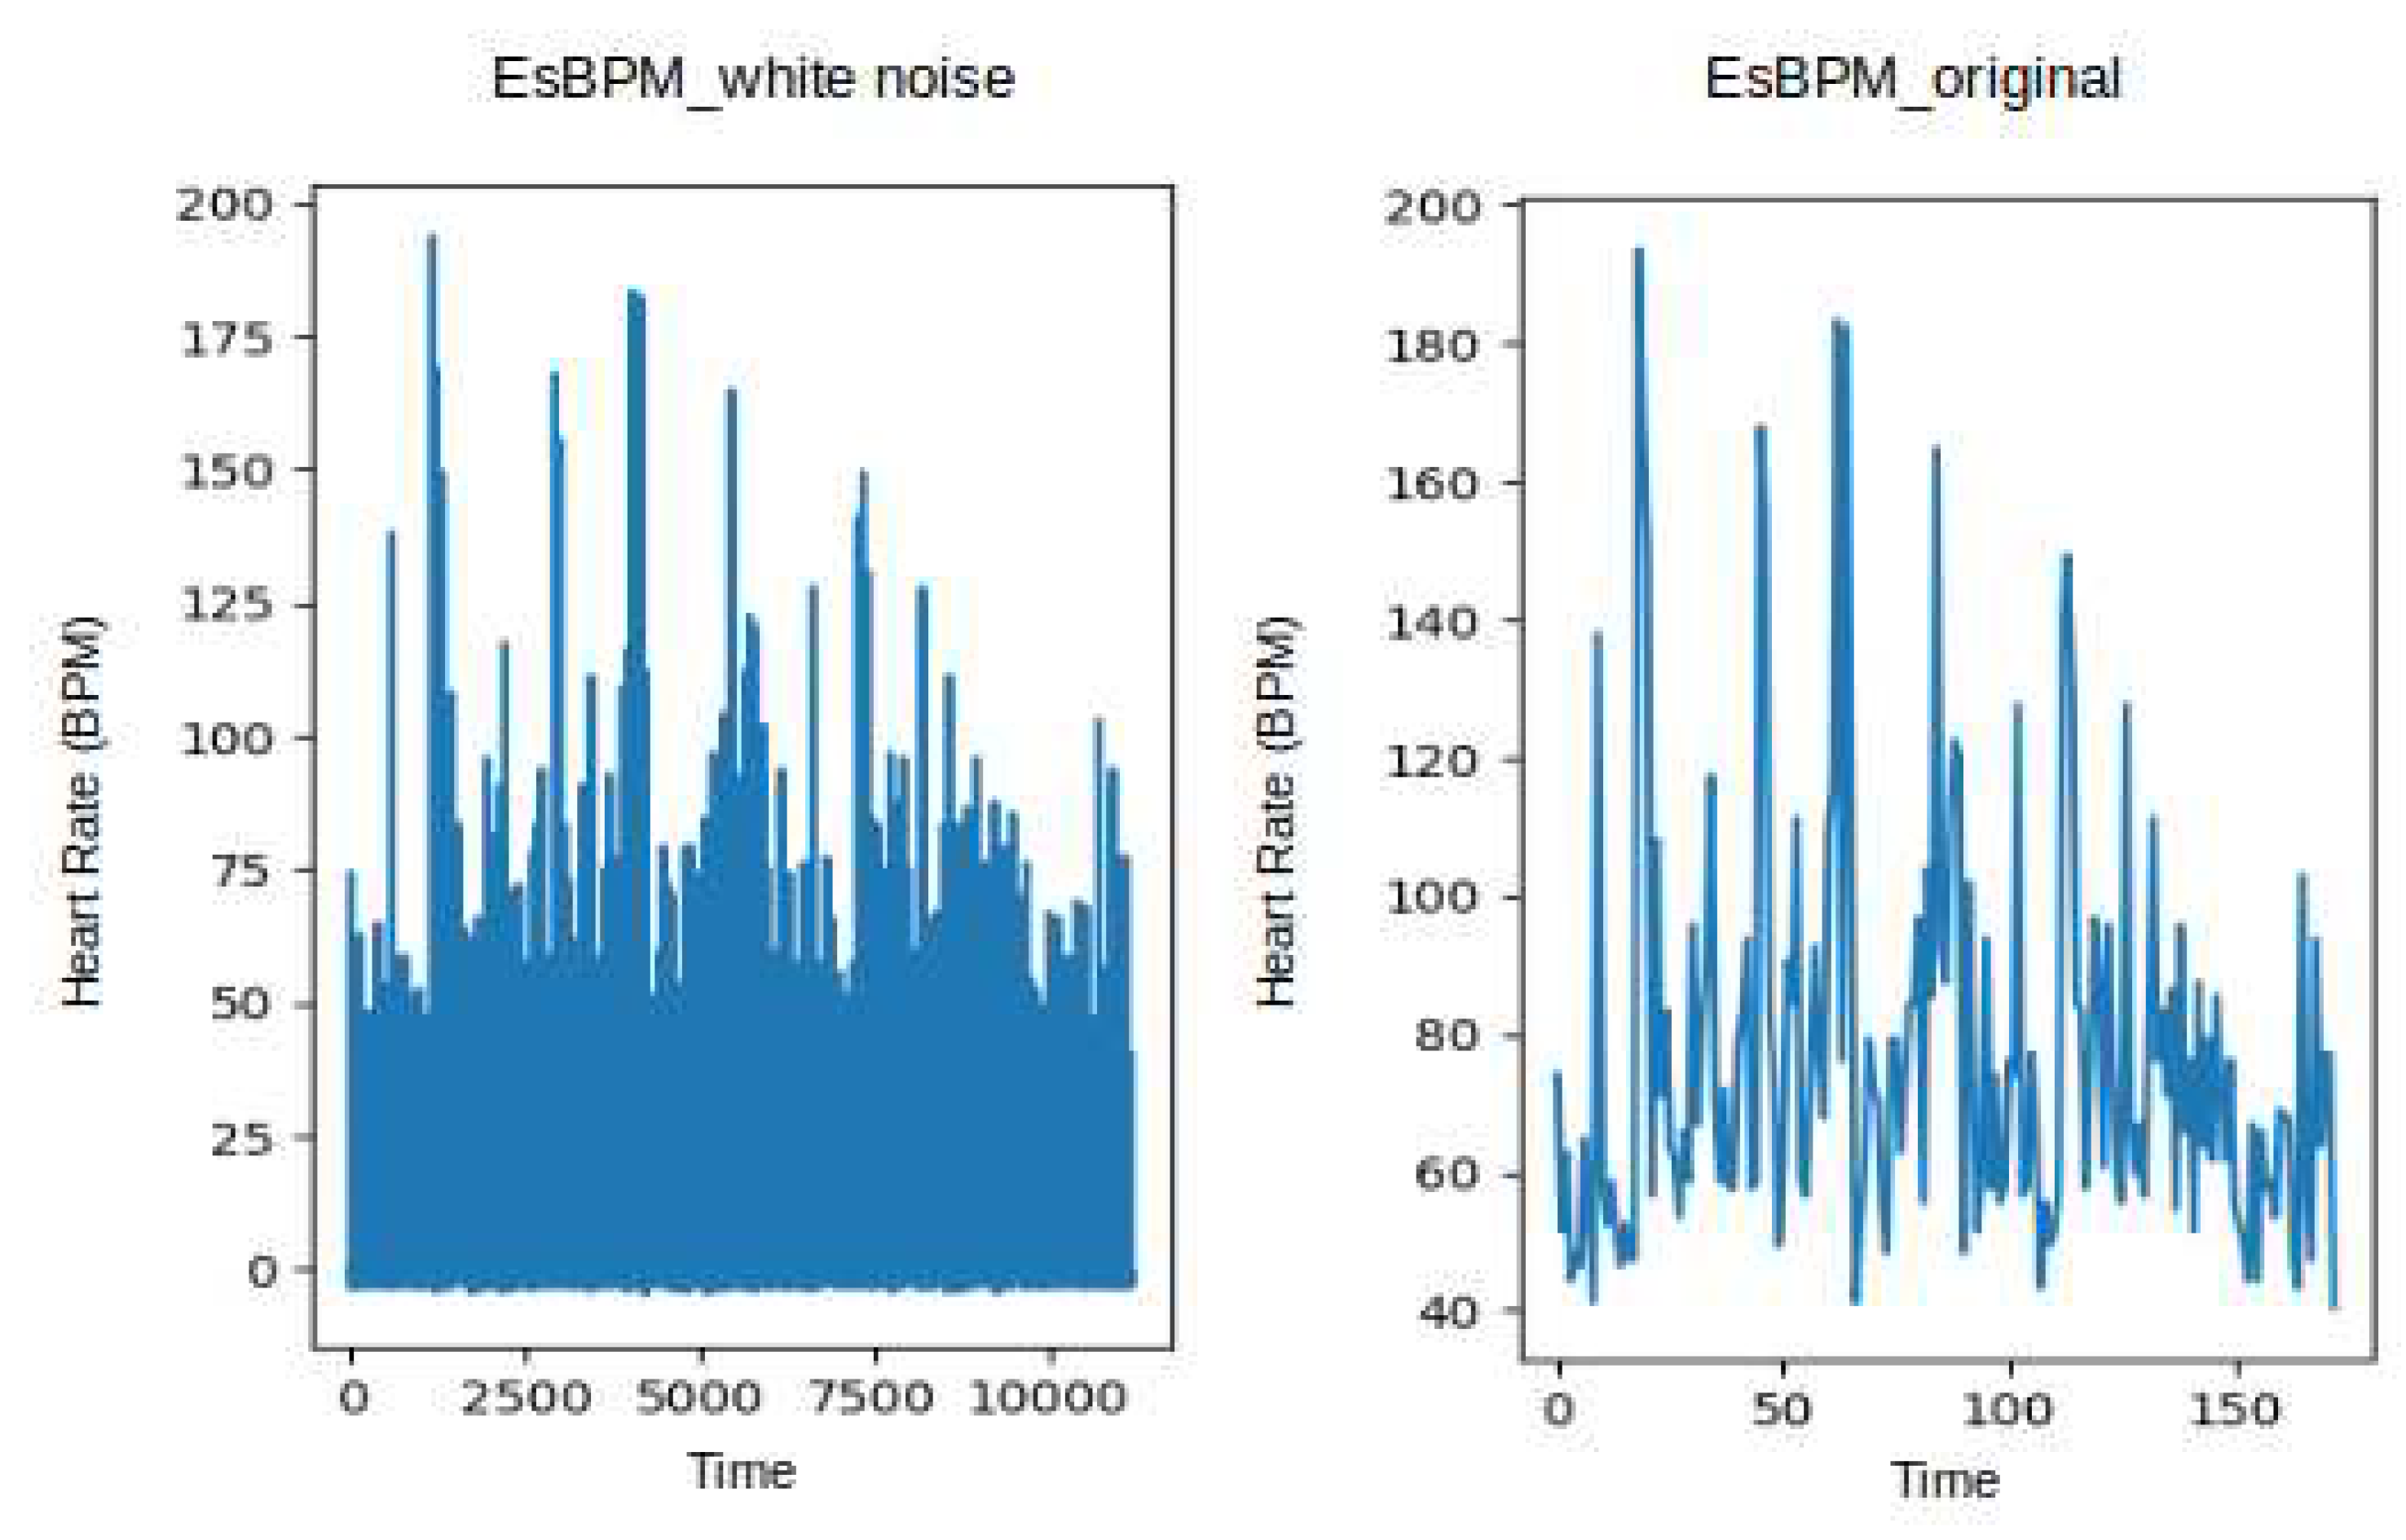
Figure 7.
Validation Loss and Train & Accuracy curves of the GT-1D-CNNv2 model
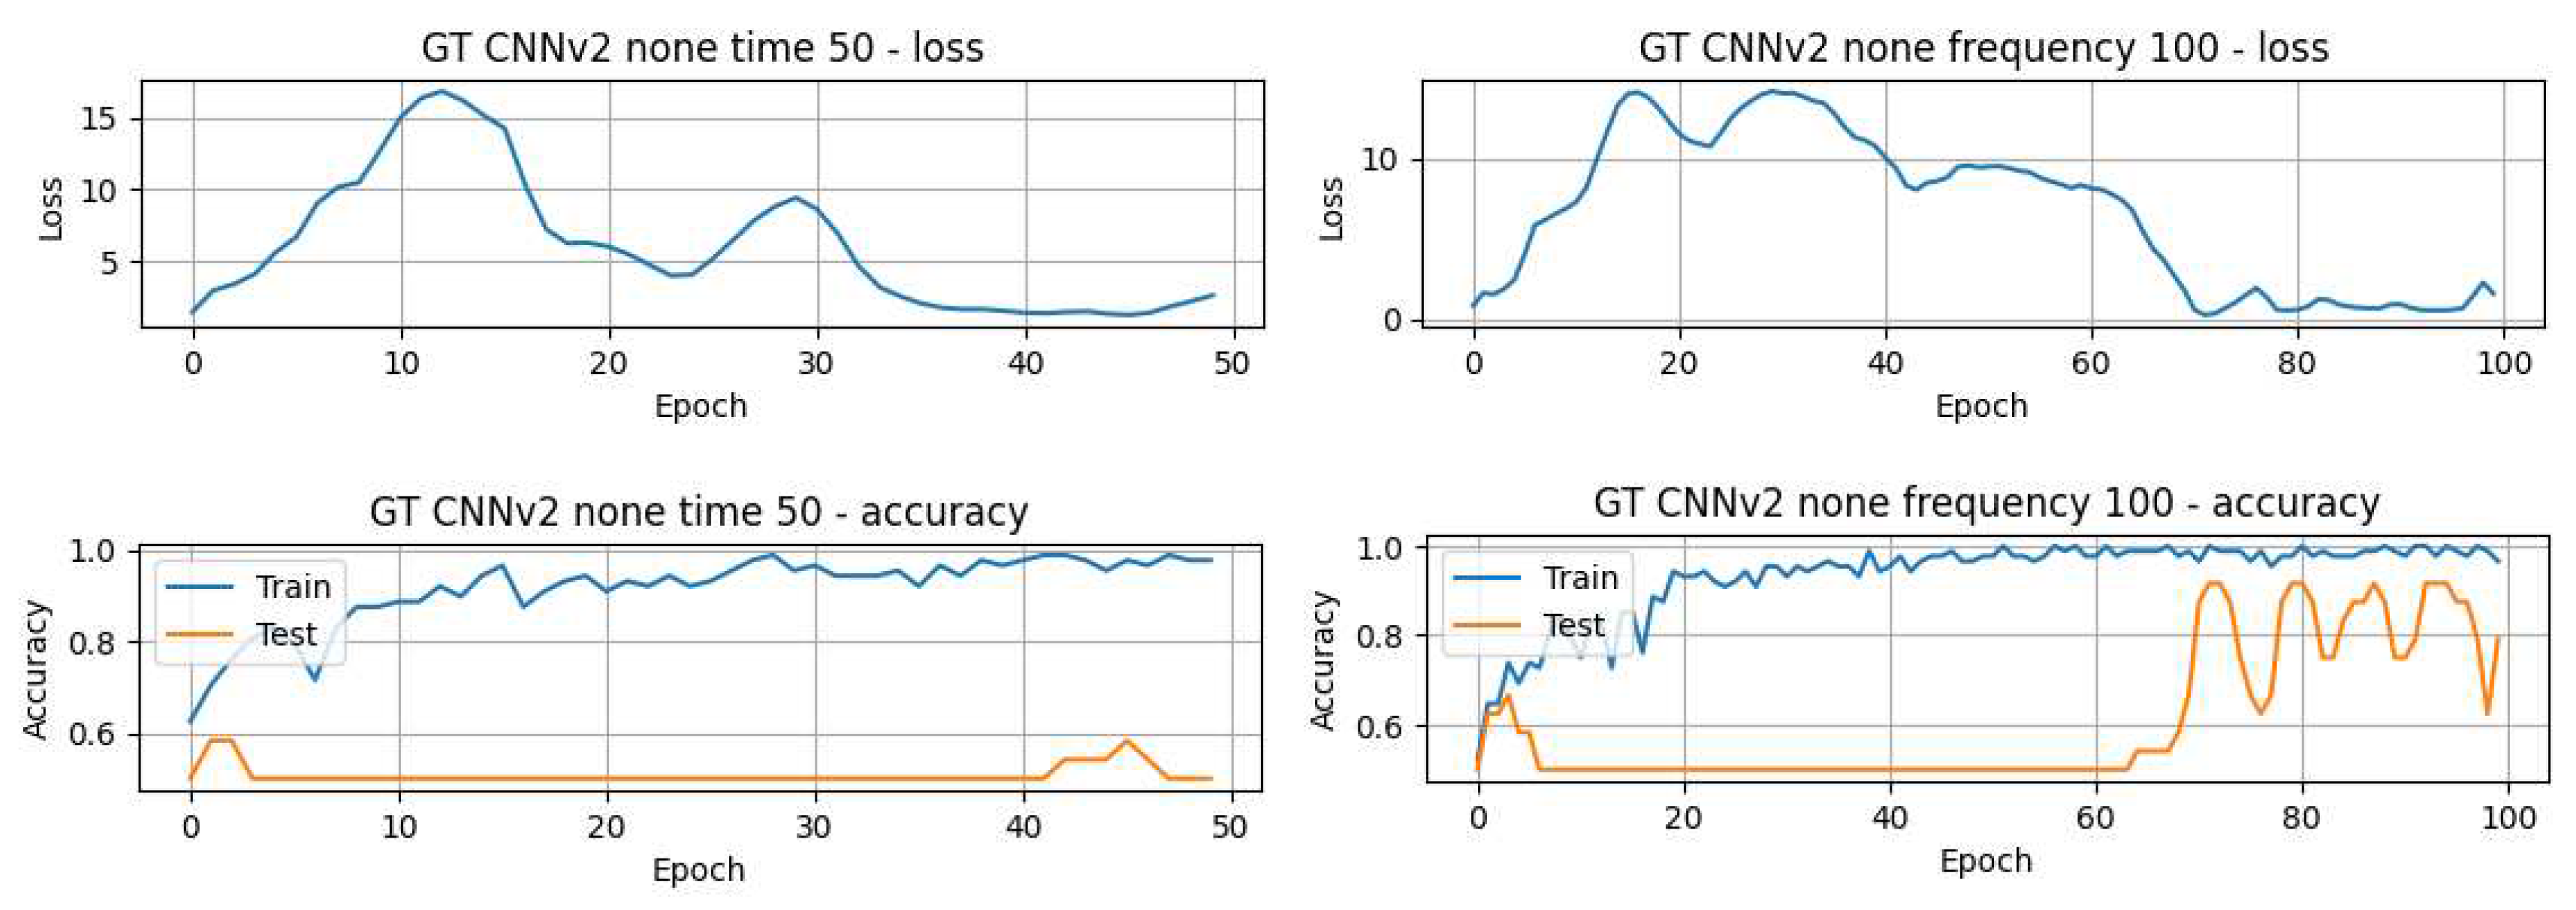
Figure 8.
Plot of Estimated BPM extracted from videos T1 of subject 1, using the method CuPy CHROM, before and after augmentation using white noise
Figure 8.
Plot of Estimated BPM extracted from videos T1 of subject 1, using the method CuPy CHROM, before and after augmentation using white noise
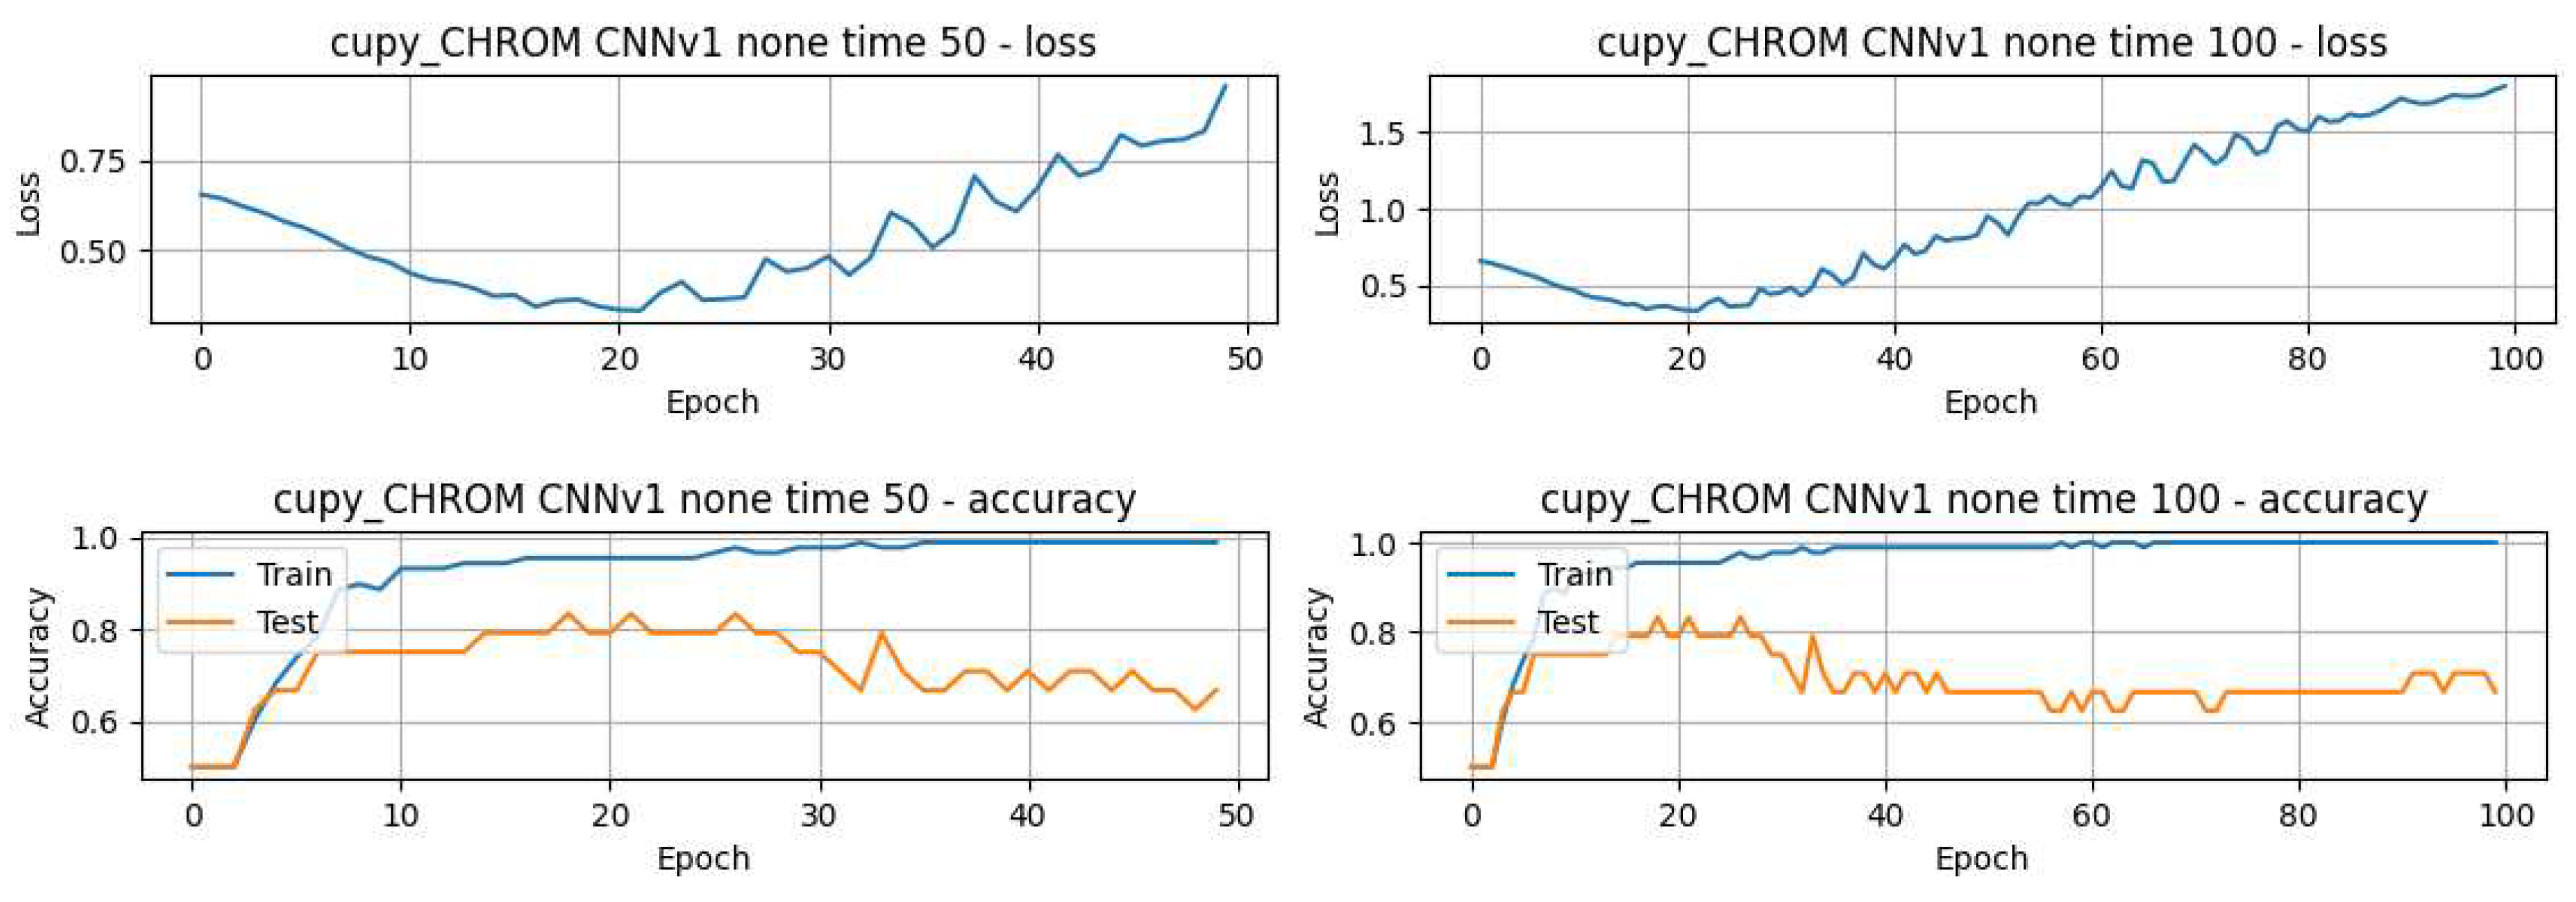
Figure 9.
Confusion matrix showing performance across different models
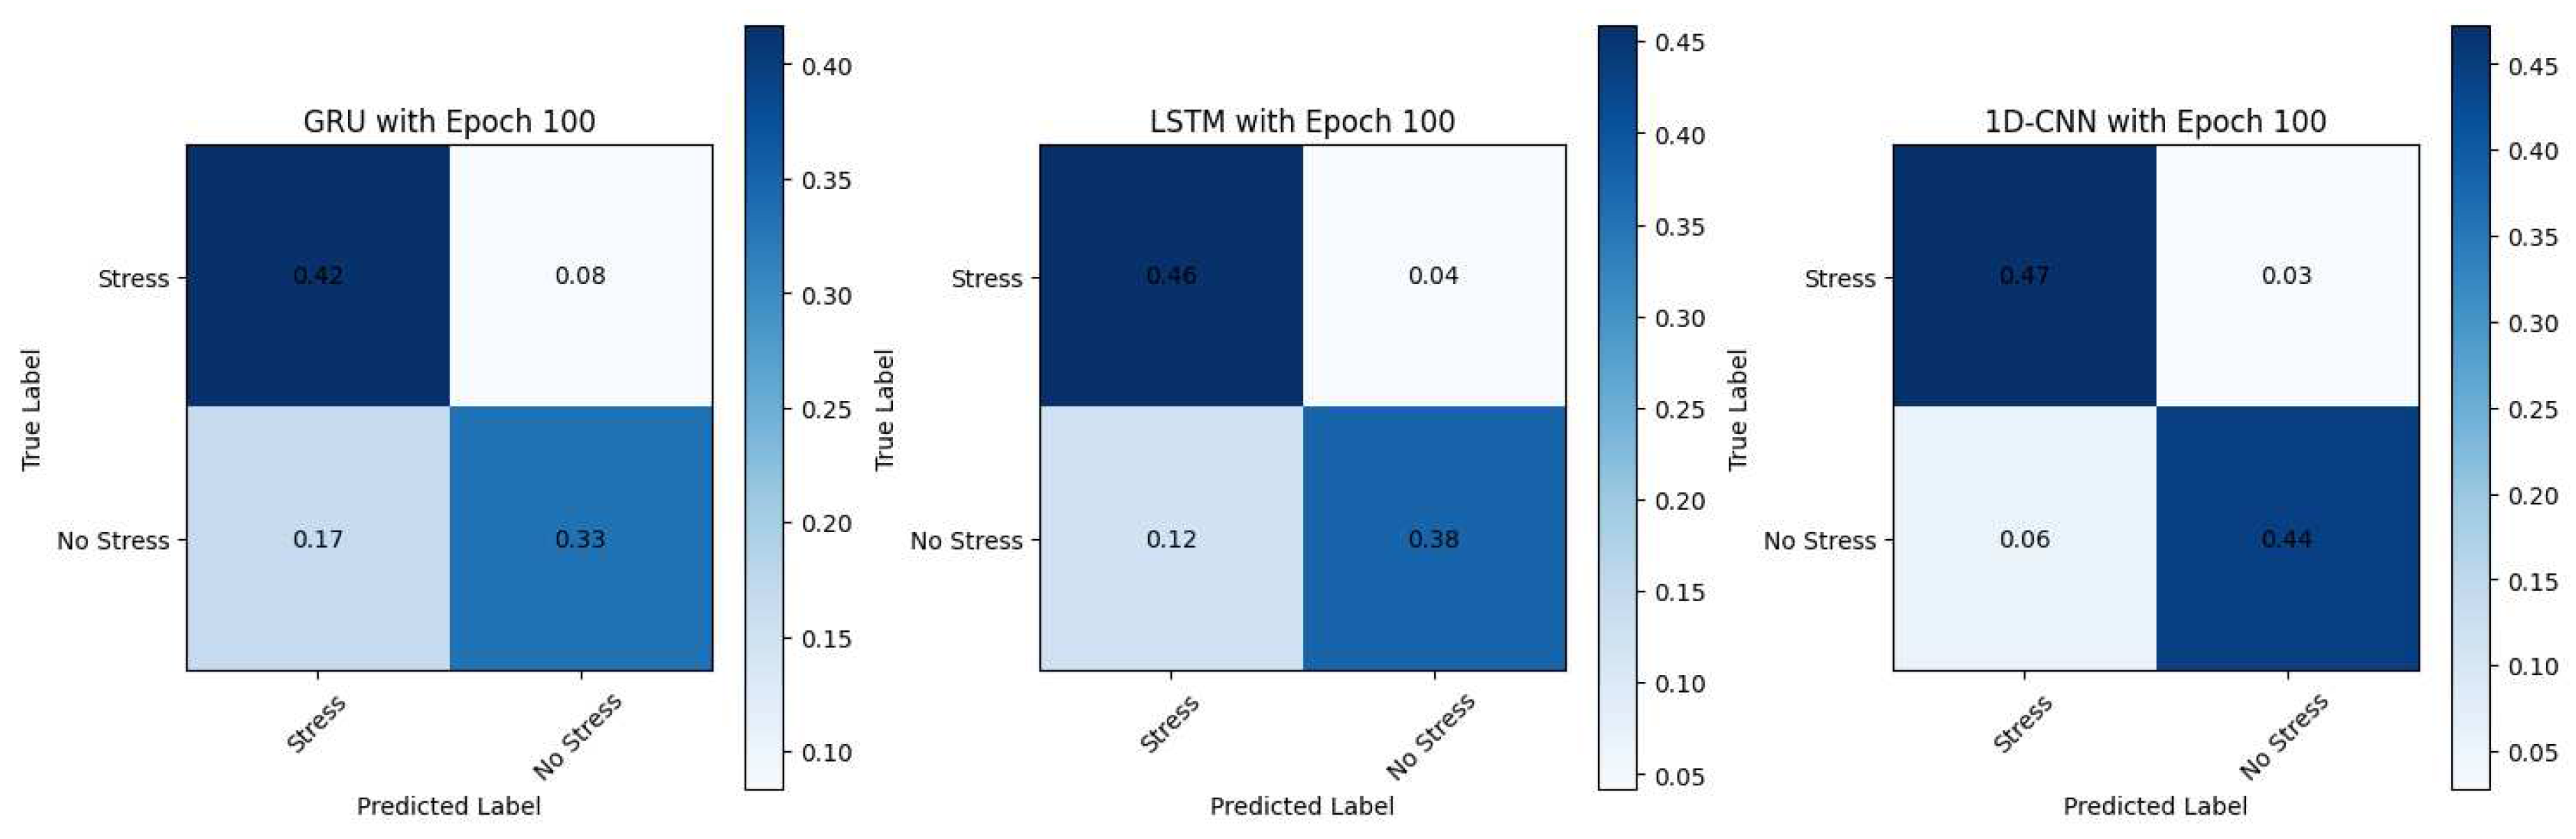

Table 1.
Parameters and methods used for rPPG with pyVHR toolbox
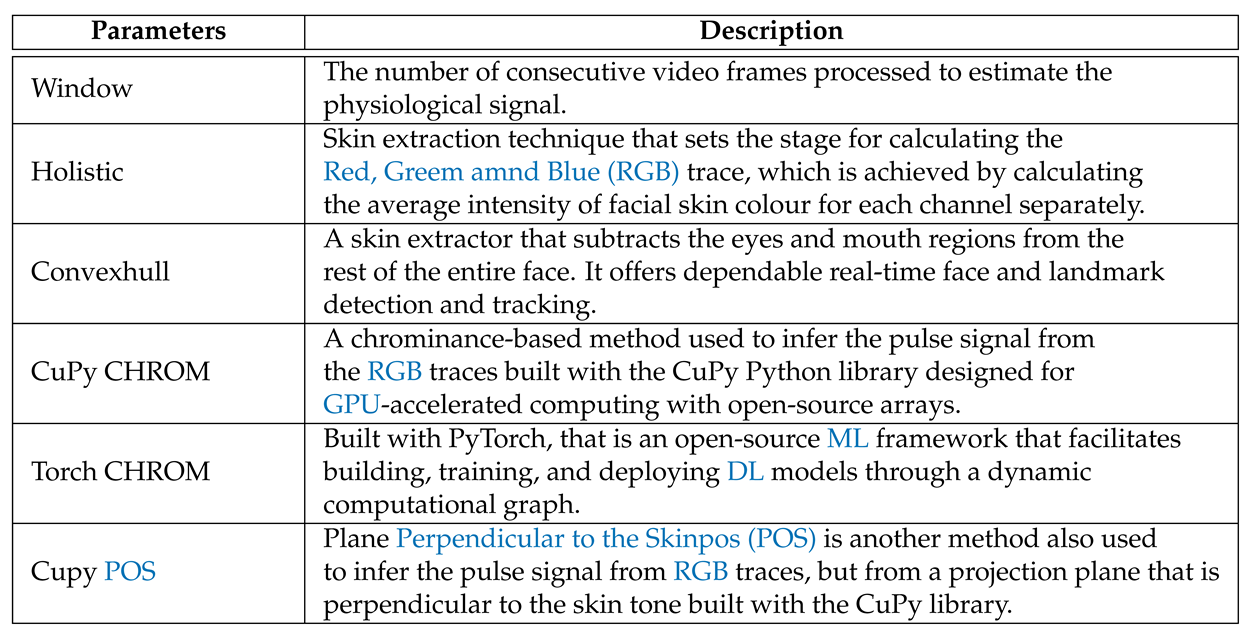 |
Table 2.
DL methods implemented
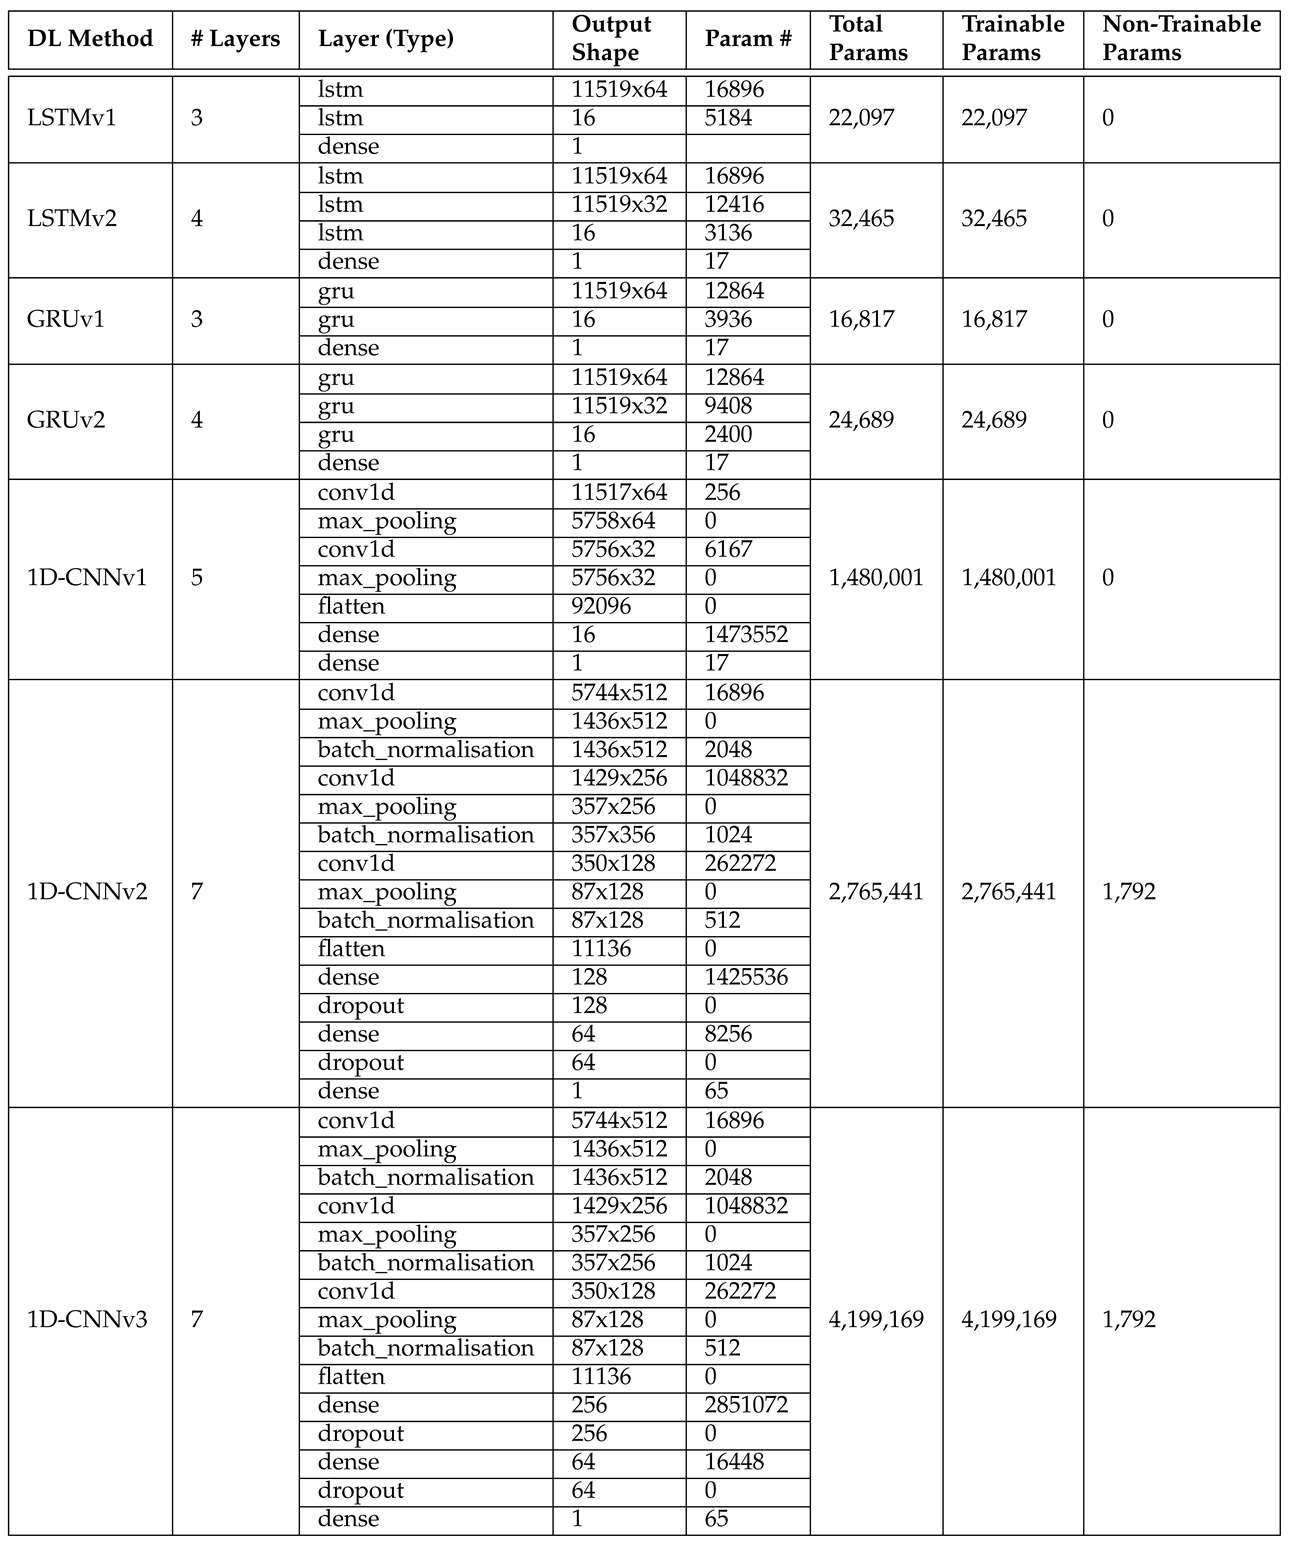 |
Table 3.
GT-PPG DL models’ results
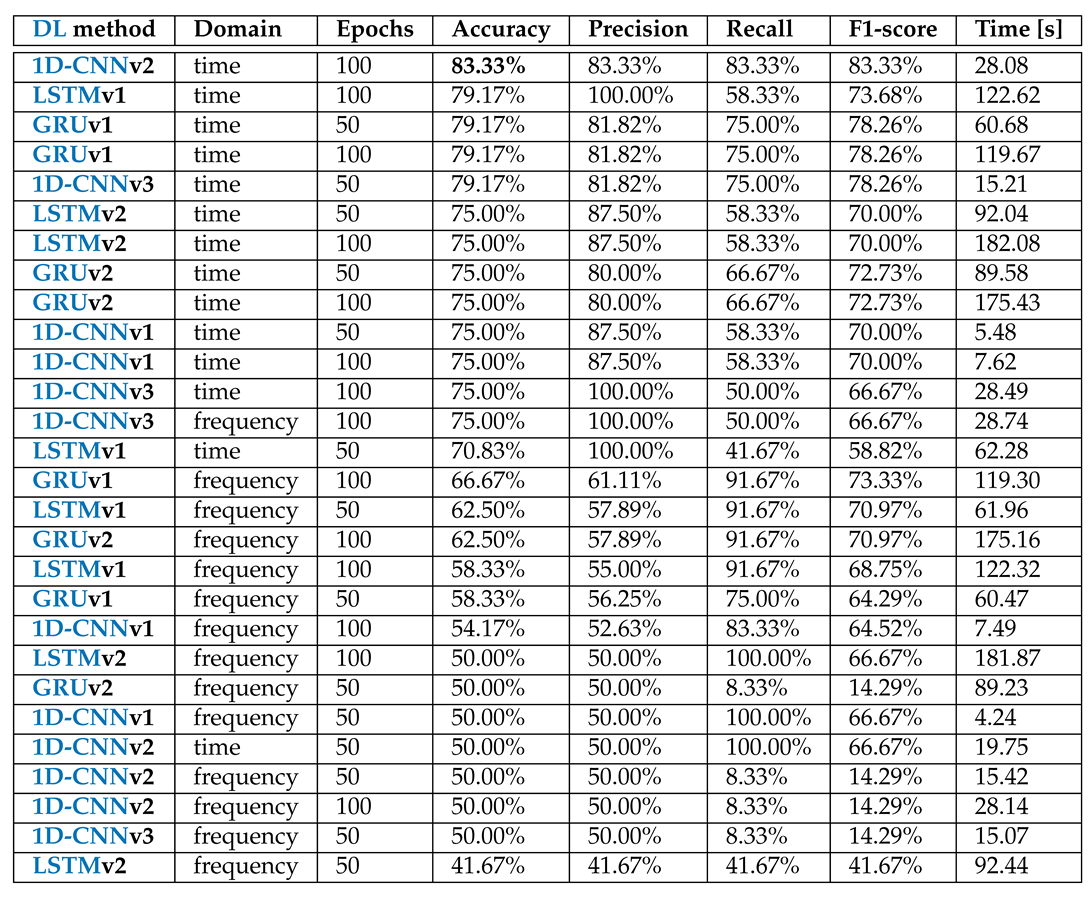 |
Table 4.
Comparison of different papers’ results on the UBFC-Phys’s data
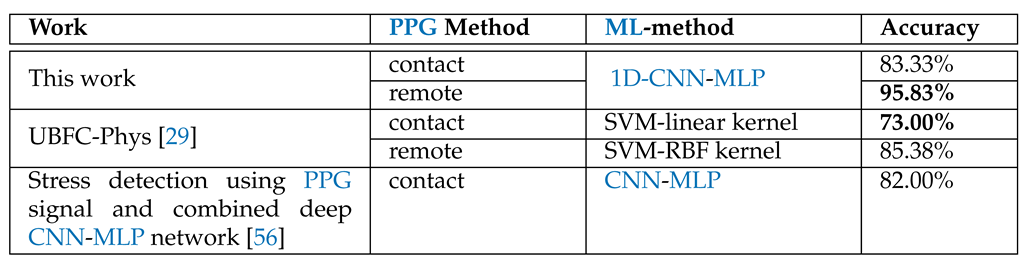 |
Table 5.
Best DL methods results from the rPPG data
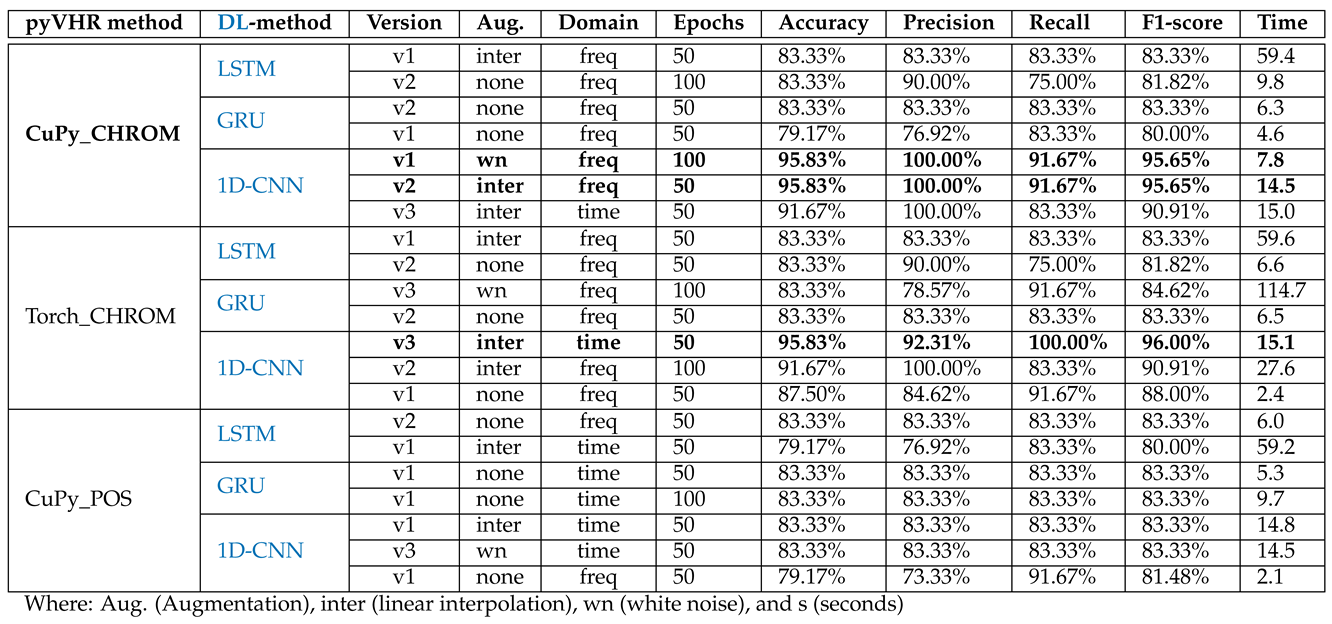 |
Table 6.
Overfitted results of the rPPG data
 |
Disclaimer/Publisher’s Note: The statements, opinions and data contained in all publications are solely those of the individual author(s) and contributor(s) and not of MDPI and/or the editor(s). MDPI and/or the editor(s) disclaim responsibility for any injury to people or property resulting from any ideas, methods, instructions or products referred to in the content. |
© 2024 by the authors. Licensee MDPI, Basel, Switzerland. This article is an open access article distributed under the terms and conditions of the Creative Commons Attribution (CC BY) license (http://creativecommons.org/licenses/by/4.0/).
Copyright: This open access article is published under a Creative Commons CC BY 4.0 license, which permit the free download, distribution, and reuse, provided that the author and preprint are cited in any reuse.


