
Submitted:
28 January 2024
Posted:
29 January 2024
You are already at the latest version
Abstract
The degradation of the persistent compound perfluorooctanoic acid (PFOA) in water by ultraviolet light in the presence and absence of hydrogen peroxide was examined. A laboratory experiment was designed to answer the question: is UV spectrophotometry feasible for PFOA research? Spectrophotometry was able to measure the degradation of PFOA, but a very high concentration was required. The 1 mg/L used is very concentrated when compared to the 70 ng/L suggested level in drinking water. A UV/Visible diode array scanning spectrophotometer was used to measure changes in PFOA concentrations after 15-minute exposures to ultraviolet light and ultraviolet light with hydrogen peroxide. A noticeable drop in concentration was measured for a 1 mg/L sample. The reaction kinetics were calculated and are likely skewed due to the greater concentration of experimental PFOA. These preliminary results will allow for the next phases of PFOA research to commence, including confirmation through liquid chromatography/mass spectrometry of low concentrations and developing bioremediation techniques.
Keywords:
spectrophotometry
; PFOA
; UV
; oxidation
1. Introduction
Perfluorooctanoic acid (PFOA) is a manufactured contaminant that differs in several ways from many other well-studied organics found in drinking water [1]. It is one of several types of chemicals considered perfluoroalkyl and polyfluoroalkyl substances (PFAS). Due to the strong bonding between the carbon and fluorine atoms (565 kJ/mol) [2], PFOA is extremely resistant to environmental degradation processes and persists indefinitely [3,4]. PFOA is water-soluble halogenated organic (Figure 1) that bonds poorly to soils [5]. It has been detected in drinking water sources which have been compromised by industrial loading, wastewater treatment plants, and in bodies of water with no known point sources [6,7,8] and some of its key attributes are presented in Table 1.
The very low concentrations of PFOA in the environment are difficult for smaller research laboratories to mimic the exact mechanisms of its chemical reactions in soil and water sources. This preliminary study is intended to provide some guidance to other smaller research laboratories in methods to study the fate analysis of this persistent chemical. Studies borne from this one will likely take a number of years to complete, so let this serve as a starting point.
2. Literature Review of PFOA Removal Techniques
Studies often combine several PFAS molecules into analysis whereas this one is solely concerned with PFOA. UV treatment of PFAS has shown a 17 percent removal, considered low compared to other treatments [10]. Dai’s experiments used a residence time of 20 minutes, twice as long as this study’s time of contact. The Dai study found a 73% removal of PFAS using a combined UV/ozone treatment. Rather than breaking down the molecule, Dai and colleagues forced PFAS out of solution through air fractioning.
Ion exchange has shown promising effectiveness for PFAS removal in water. Complete removal of the contaminant, along with 60 percent dissolved organic carbon, has been achieved [11]. Dixit used an alkaline resin to uptake PFOA in waters with background organic matter.
Activated carbon has shown to be effective for the removal of PFAS compounds in water. A major drawback to this treatment system is that the carbon filters require such frequent changes or regenerations that it is not feasible [12]. Franke demonstrated the reduction in PFOA removal efficiency from low bed volumes higher ones. In another study, Franke reached a 70% removal efficiency of PFAS from tap water utilizing ozonation [13].
Photocatalytic decomposition of PFOA is able to achieve a 93% efficiency using a titanium oxide/reduced graphene oxide [14]. Gomez-Ruiz and colleagues found this degradation mechanism which provide a significantly higher efficiency than by the use of UV alone (<60%). Their use and results of a medium pressure mercury lamp are aligned with our results.
Degradation of PFOA in wastewater sludge is achievable through microwave exposure and persulfate treatment [15]. Hamid and Li used a 0.1 g persulfate to 1 g sludge dose treatment at 50 and 70 °C and found a decreasing PFOA trend with increasing temperature, with 28 and 42% removal following a 4 hour treatment, respectfully. Lower temperatures resulted in significantly lower PFOA degradation rates. Degradation products included perfluorobutanoic acid (PFBA) and perfluorohexanoic acid (PFHxA) (Figure 2).
Compared to a direct UV exposure, the addition of H2O2 was less effective in PFOA decomposition [16]. The addition of a water-soluble tungstic heteropolyacid photocatalyst, H3PW12O40, resulted in complete PFOA degradation according to Hori. Even after degradation, the photocatalyst remained active and further degraded additional PFOA added to the reaction solution.
PFOA is capable of being removed from water via ex situ treatment, including reverse osmosis, ion exchange, and granular activated carbon [17,18]. Sonic treatment uses an acoustic field to generate chemical reactions in a solution. Sound waves collapse the bubbles in the solution, resulting in high vapor temperatures and pyrolytic decomposition of PFASs at the bubble-water interface [19].
Ultrasonic (20 to 1000 kHz) and megasonic (> 0.5 MHz) treatment of PFAS compounds resulted in the half-life of PFOA to under two hours under an air atmosphere with the concurrent production of shorter-chain PFAS [20].
Ross and colleagues analyzed the various PFAS treatment technologies for water and developed the following based on development stage and practicality (Figure 3). Photolysis and advanced oxidation are considered as experimental technologies with a practicality that is still too early to determine its viability.
3. Methodology
3.1. Equipment
This study tested a small-scale treatment of PFOA through UV and UV/oxidation exposures. Perfluorooctanoic acid (PFOA, 96%, CAS 335-67-1, 5 g, part number 171468-5G) and hydrogen peroxide (H2O2, 30%, CAS 7722-84-1, 500 mL, part number H1009-500ML) were purchased through Sigma Aldrich. A 1 mg/L of PFOA and 30 mg/L of hydrogen peroxide stock solutions were prepared and used when their temperatures were measured at 22 °C.
A Jenway 7205 UV/Visible 7205 Diode Array Scanning Spectrophotometer was used to measure the absorbance of each sample. This unit has a range of 198 to 800 nm with an accuracy of ±2 nm. The sampling range used was from 200 to 400 nm since PFOA absorbs in the ultraviolet region of the light spectrum. The unit was zeroed with Type 1 ultrapure water generated by a Millipore Direct-Q Water Purification System with UV. This water reaches a sensitivity of 18.2 MΩ·cm and a total organic compound concentration below 5 ppb.
A Pelican PUV-8 UV Disinfection System provided the lighting and chamber for sample exposures. The UV lighting is part of an NSF Certified Class B Disinfection System which is designed for supplemental bactericidal treatment of drinking water supplies that have been deemed acceptable for human consumption [22]. The lamp is rated at 16 mJ/cm2 and 40 watts.
3.2. Solutions
The 1 mg/L solution of PFOA was created by dissolving 1 mg of 96% PFOA into 960 milliliters of ultrapure water. This concentration may also be expressed as 2.4 mM. Solutions varied between 5.5 and 5.6 pH levels.
A 30 mg/L solution of hydrogen peroxide was prepared from a 30% stock solution (300,000 mg/L). A two-step dilution was employed to achieve this. One milliliter of the 30% H2O2 was added to ultrapure water until there was a one-liter total volume.
One milliliter of the 300 mg/L H2O2 was then diluted into purified water to make a 10 mL volume to create the 30 mg/L H2O2. When 0.1 mL of hydrogen peroxide was added to the 15 mL PFOA solutions, the peroxide’s concentration was measured at 0.2 mg/L.
3.3. Sample Blanks
The unit was zeroed with Type 1 ultrapure water to reach the operation baseline between 200 and 500 nm. This water had a sensitivity of 18.2 MΩ·cm and a total organic compound concentration below 5 ppb.
3.4. Benchtop Setup
A 15 ml PFOA sample was put in a quartz test tube and then placed within the disinfection system’s chamber for UV exposure analyses (Figure 4). Samples were always submerged withing the water-filled chamber and in full contact with the UV lamp. Each sample remained in the chamber for 15 minutes. Upon removal, they were placed in a test tube rack until the sample temperature reached 22 °C.
Samples were placed in cuvettes and then their absorbances were measured from 200 to 400 nm. Absorbance and wavelength data were exported into a “.txt” file and then imported into Excel.
4. Results
4.1. PFOA
Three solutions of PFOA were prepared from the 1 mg/L stock solution at concentrations of 0.25 mg/L, 1 g/L, and 1 ng/L. The UV-vis spectra for these are presented in Figure 5. EPA has set a health advisory level at 70 parts per trillion (70 ng/L) [23], resulting in these used concentrations to not be practicable for public health interpretations. At the ng/L level, the spectrum loses its focus. The 0.25 mg/L and 1 g/L samples still maintain a defined, yet noisy shape, but as they are magnitudes of order higher than what would be found in bodies of water, spectrophotometry is not appropriate for public health analyses. Some of the noise may be the result of intermediate and final breakdown products [24].
4.2. 1 mg/L PFOA Solution
The 1 mg/L stock solution of PFOA (2.4 mM) was used as the control sample for the exposure experiments. Its spectrum is presented in Figure 6 as the blue line with a peak absorbance (0.332) at 222 nm.
4.3. 1 mg/L PFOA with UV Exposure
A sample from the control solution was placed under a 16 mJ/cm2 UV light for a contact time of 15 minutes. Its spectrum is presented in Figure 6 as the black line with a peak absorbance of 0.213 at 220 nm. The new concentration was calculated using the peak absorbance wavelength from the stock PFOA. This represents a 34% decrease in PFOA concentration after this exposure.
4.4. 1 mg/L PFOA with UV and Hydrogen Peroxide Exposure
A sample of PFOA in the presence of 30 mg/L hydrogen peroxide was placed under the 40 watt, 16 mJ/cm2 UV light for a contact time of 15 minutes. Its spectrum is presented in Figure 6 as the green line with a peak absorbance at 220 nm. There was negligible difference from the exposure solely with UV exposure (0.213 absorbance).
4.5. Rate of Degradation and Half Life
The first-order reaction rate (k) was calculated as 2.78 x . This falls in between Giri and Chen & Zhang’s [25] first order calculations (3.37 x and 0.0016 , respectively).
The half life was calculated as 24.93 minutes which is significantly different from Giri’s 208.43 minutes. One factor for this may be the different type of tube surrounding the UV lamp. This experiment used a quartz sleeve whereas Giri used a fused silica one. The difference is that fused silica is a manufactured non-crystalline silica whereas quartz is made from natural crystalline silica [26,27,28]. Fused silica provides a significantly higher transmission of UV light in comparison to quartz [26,28].
5. Discussion
5.1. Degradation of PFOA
Photolysis and advanced oxidation of perfluoroalkyl and polyfluoroalkyl substances (PFAS) are still considered to be experimental technologies. More developed methods, such as reverse osmosis and activated carbon, are feasible for the removal of PFAS but they do not degrade them. Ultraviolet and advanced oxidation treatments of PFOA present technologies that may be effective in the degradation of this persistent substance.
Our laboratory results provide data for a 34% drop in PFOA concentration after a 15-minute UV exposure, with and without the presence of a 30 mg/L solution of hydrogen peroxide. Measurements did not show any significant difference between samples with and without . This outcome agrees to what was found in literature review. Giri provides a mechanism for the degradation of PFOA, with products and by-products including formic acid, acetic acid, fluoride, and unknown compounds (Figure 7) occurring at different exposure times [24].
5.2. Kinetics
A number of first order reaction kinetics have been conducted in previous research studies [16,24,25]. This study’s k value differs from the other studies; however, all of the studies vary from each other. The first order reaction rate is dependent upon PFOA concentrations and time. These variables were not equal across studies. Ours and Giri’s provided the same starting concentration, but exposure time varied. The time used in this investigation was much shorter than Giri’s which resulted in a skewing of the final k value. The difference in UV lamp sleeve composition may have acted as a confounding factor since material type affects light transmittance.
5.3. Half Life
The half life in this experiment was almost a full order of magnitude lower than other reported half lives. The first order reaction rate calculated is directly responsible for the outcome. Factors affecting this outcome are the ones posed in Kinetics above.
6. Conclusions
UV spectrophotometry is feasible to measure changes in PFOA concentrations in a research laboratory environment under the assumption that the concentration is many magnitudes higher than what presents contaminant levels in drinking water supplies. At the nanogram per liter level, the PFOA spectrum appears as noise but we do get a clearer output at the milligram per liter level. The noise may indicate absorbance peaks for degradation products from the mechanism presented as Figure 6. UV spectrophotometry may be a cost- and time-effective option in researching degradation techniques when compared to others such as HPLC and its usage should be used after careful consideration.
7. Limitations
Concentrations of PFOA were used that would likely not be found in the environment. These findings are based upon 1 mg/L samples whereas drinking water supplies are recommended to not exceed 70 ng/L. Spectrophotometers cannot detect such low concentrations so costly analytical equipment such as HPLC and MS are usually utilized [18,29,30,31,32,33]. Kinetic rates that we calculated are likely skewed with longer times since the concentrations of chemicals are higher than what we would expect in the environment [2].
Sample contact time had no variation, so these results present only what occurred for a 15-minute exposure. Further studies would necessitate several exposure times for a given concentration so that the UV exposure technology can be updated in Ross’ diagram of development and practicality for PFAS treatment options.
Oxidation was tested using a very low concentration of hydrogen peroxide of 0.2 mg/L. Other research states the lack of difference between photolysis and photolysis-oxidation, such as what was found in this study, but concentrations used were not explicit. Further studies should vary the peroxide’s concentration across controlled contact and exposure times in order to see a possible shift between the spectra.
Funding
No external funding was provided for this project.
Conflicts of Interest
The author declares no conflicts of interest.
References
- Teaf, C.M.; Garber, M.M.; Covert, D.J.; Tuovila, B.J. Perfluorooctanoic Acid (PFOA): Environmental Sources, Chemistry, Toxicology, and Potential Risks. Soil and Sediment Contamination: An International Journal 2019, 28, 258–273. [Google Scholar] [CrossRef]
- Brown.; Lemay.; Busten.; Murphy.; Woodward. Chemical Kinetics, 2021.
- Post, G.B.; Cohn, P.D.; Cooper, K.R. Perfluorooctanoic acid (PFOA), an emerging drinking water contaminant: A critical review of recent literature. Environmental Research 2012, 116, 93–117. [Google Scholar] [CrossRef] [PubMed]
- Rashid, F.; Ramakrishnan, A.; Fields, C.; Irudayaraj, J. Acute PFOA exposure promotes epigenomic alterations in mouse kidney tissues. Toxicology Reports 2020, 7, 125–132. [Google Scholar] [CrossRef] [PubMed]
- Knight, E.R.; Bräunig, J.; Janik, L.J.; Navarro, D.A.; Kookana, R.S.; Mueller, J.F.; McLaughlin, M.J. An investigation into the long-term binding and uptake of PFOS, PFOA and PFHxS in soil – plant systems. Journal of Hazardous Materials 2021, 404, 124065. [Google Scholar] [CrossRef]
- Gallen, C.; Eaglesham, G.; Drage, D.; Nguyen, T.H.; Mueller, J. A mass estimate of perfluoroalkyl substance (PFAS) release from Australian wastewater treatment plants. Chemosphere 2018, 208, 975–983. [Google Scholar] [CrossRef]
- Liu, Z.; Lu, Y.; Wang, P.; Wang, T.; Liu, S.; Johnson, A.C.; Sweetman, A.J.; Baninla, Y. Pollution pathways and release estimation of perfluorooctane sulfonate (PFOS) and perfluorooctanoic acid (PFOA) in central and eastern China. Science of The Total Environment 2017, 580, 1247–1256. [Google Scholar] [CrossRef]
- Procopio, N.A.; Karl, R.; Goodrow, S.M.; Maggio, J.; Louis, J.B.; Atherholt, T.B. Occurrence and source identification of perfluoroalkyl acids (PFAAs) in the Metedeconk River Watershed, New Jersey. Environmental Science and Pollution Research 2017, 24, 27125–27135. [Google Scholar] [CrossRef]
- National Center for Biotechnology Information. PubChem Compound Summary for CID 9554, Perfluorooctanoic acid. Technical report, PubChem. 2021.
- Dai, X.; Xie, Z.; Dorian, B.; Gray, S.; Zhang, J. Comparative study of PFAS treatment by UV, UV/ozone, and fractionations with air and ozonated air. Environmental Science: Water Research & Technology 2019, 5, 1897–1907. [Google Scholar] [CrossRef]
- Dixit, F.; Barbeau, B.; Mostafavi, S.G.; Mohseni, M. PFOA and PFOS removal by ion exchange for water reuse and drinking applications: role of organic matter characteristics. Environmental Science: Water Research & Technology 2019, 5, 1782–1795. [Google Scholar] [CrossRef]
- Franke, V.; McCleaf, P.; Lindegren, K.; Ahrens, L. Efficient removal of per- and polyfluoroalkyl substances (PFASs) in drinking water treatment: nanofiltration combined with active carbon or anion exchange. Environmental Science: Water Research & Technology 2019, 5, 1836–1843. [Google Scholar] [CrossRef]
- Franke, V.; Schäfers, M.D.; Joos Lindberg, J.; Ahrens, L. Removal of per- and polyfluoroalkyl substances (PFASs) from tap water using heterogeneously catalyzed ozonation. Environmental Science: Water Research & Technology 2019, 5, 1887–1896. [Google Scholar] [CrossRef]
- Gomez-Ruiz, B.; Ribao, P.; Diban, N.; Rivero, M.J.; Ortiz, I.; Urtiaga, A. Photocatalytic degradation and mineralization of perfluorooctanoic acid (PFOA) using a composite TiO2–rGO catalyst. Journal of Hazardous Materials 2018, 344, 950–957. [Google Scholar] [CrossRef]
- Hamid, H.; Li, L.Y. Fate of perfluorooctanoic acid (PFOA) in sewage sludge during microwave-assisted persulfate oxidation treatment. Environmental Science and Pollution Research 2018, 25, 10126–10134. [Google Scholar] [CrossRef]
- Hori, H.; Hayakawa, E.; Einaga, H.; Kutsuna, S.; Koike, K.; Ibusuki, T.; Kiatagawa, H.; Arakawa, R. Decomposition of Environmentally Persistent Perfluorooctanoic Acid in Water by Photochemical Approaches. Environmental Science & Technology 2004, 38, 6118–6124. [Google Scholar] [CrossRef]
- Appleman, T.D.; Higgins, C.P.; Quiñones, O.; Vanderford, B.J.; Kolstad, C.; Zeigler-Holady, J.C.; Dickenson, E.R. Treatment of poly- and perfluoroalkyl substances in U.S. full-scale water treatment systems. Water Research 2014, 51, 246–255. [Google Scholar] [CrossRef]
- Deng, S.; Nie, Y.; Du, Z.; Huang, Q.; Meng, P.; Wang, B.; Huang, J.; Yu, G. Enhanced adsorption of perfluorooctane sulfonate and perfluorooctanoate by bamboo-derived granular activated carbon. Journal of Hazardous Materials 2015, 282, 150–157. [Google Scholar] [CrossRef]
- Hai, F.; Riley, T.; Shawkat, S.; Magram, S.; Yamamoto, K. Removal of Pathogens by Membrane Bioreactors: A Review of the Mechanisms, Influencing Factors and Reduction in Chemical Disinfectant Dosing. Water 2014, 6, 3603–3630. [Google Scholar] [CrossRef]
- Rayne, S.; Forest, K. Perfluoroalkyl sulfonic and carboxylic acids: A critical review of physicochemical properties, levels and patterns in waters and wastewaters, and treatment methods. Journal of Environmental Science and Health, Part A 2009, 44, 1145–1199. [Google Scholar] [CrossRef]
- Ross, I.; McDonough, J.; Miles, J.; Storch, P.; Thelakkat Kochunarayanan, P.; Kalve, E.; Hurst, J.; S. Dasgupta, S.; Burdick, J. A review of emerging technologies for remediation of PFASs. Remediation Journal 2018, 28, 101–126. [Google Scholar] [CrossRef]
- Vadasarukkai, Y.S.; Guo, X.A.; Tyssen, R.; Hares, J.E.; Feyen, L.; Liss, S.N.; Shubat, J.; Abernethy, R. A multiple-site field study of stabilized hydrogen peroxide for drinking water disinfection. AWWA Water Science 2019, 1. [Google Scholar] [CrossRef]
- Cordner, A.; De La Rosa, V.Y.; Schaider, L.A.; Rudel, R.A.; Richter, L.; Brown, P. Guideline levels for PFOA and PFOS in drinking water: the role of scientific uncertainty, risk assessment decisions, and social factors. Journal of Exposure Science & Environmental Epidemiology 2019, 29, 157–171. [Google Scholar] [CrossRef] [PubMed]
- Giri, R.R.; Ozaki, H.; Morigaki, T.; Taniguchi, S.; Takanami, R. UV photolysis of perfluorooctanoic acid (PFOA) in dilute aqueous solution. Water Science and Technology 2011, 63, 276–282. [Google Scholar] [CrossRef] [PubMed]
- Chen, J.; Zhang, P.y.; Liu, J. Photodegradation of perfluorooctanoic acid by 185 nm vacuum ultraviolet light. Journal of Environmental Sciences 2007, 19, 387–390. [Google Scholar] [CrossRef] [PubMed]
- Siegel, G. Ultraviolet spectra of silicate glasses: A review of some experimental evidence. Journal of Non-Crystalline Solids 1974, 13, 372–398. [Google Scholar] [CrossRef]
- Stebel, E.K.; Pike, K.A.; Nguyen, H.; Hartmann, H.A.; Klonowski, M.J.; Lawrence, M.G.; Collins, R.M.; Hefner, C.E.; Edmiston, P.L. Absorption of short-chain to long-chain perfluoroalkyl substances using swellable organically modified silica. Environmental Science: Water Research & Technology 2019, 5, 1854–1866. [Google Scholar] [CrossRef]
- Wong, J.; Ferriera, J.; Lindsey, E.; Haupt, D.; Hutcheon, I.; Kinney, J. Morphology and microstructure in fused silica induced by high fluence ultraviolet 3w (355nm) laser pulses. Journal of Non-Crystalline Solids 2006, 352, 255–272. [Google Scholar] [CrossRef]
- Janousek, R.M.; Lebertz, S.; Knepper, T.P. Previously unidentified sources of perfluoroalkyl and polyfluoroalkyl substances from building materials and industrial fabrics. Environmental Science: Processes & Impacts 2019, 21, 1936–1945. [Google Scholar] [CrossRef] [PubMed]
- Kucharzyk, K.H.; Darlington, R.; Benotti, M.; Deeb, R.; Hawley, E. Novel treatment technologies for PFAS compounds: A critical review. Journal of Environmental Management 2017, 204, 757–764. [Google Scholar] [CrossRef] [PubMed]
- Liang, S.; Pierce, R.D.; Lin, H.; Chiang, S.Y.D.; Huang, Q.J. Electrochemical oxidation of PFOA and PFOS in concentrated waste streams. Remediation Journal 2018, 28, 127–134. [Google Scholar] [CrossRef]
- Liu, L.; Liu, Y.; Gao, B.; Ji, R.; Li, C.; Wang, S. Removal of perfluorooctanoic acid (PFOA) and perfluorooctane sulfonate (PFOS) from water by carbonaceous nanomaterials: A review. Critical Reviews in Environmental Science and Technology. [CrossRef]
- Phong Vo, H.N.; Ngo, H.H.; Guo, W.; Hong Nguyen, T.M.; Li, J.; Liang, H.; Deng, L.; Chen, Z.; Hang Nguyen, T.A. Poly-and perfluoroalkyl substances in water and wastewater: A comprehensive review from sources to remediation. Journal of Water Process Engineering 2020, 36, 101393. [Google Scholar] [CrossRef]
Figure 1.
Perfluorooctanoic acid (PFOA)
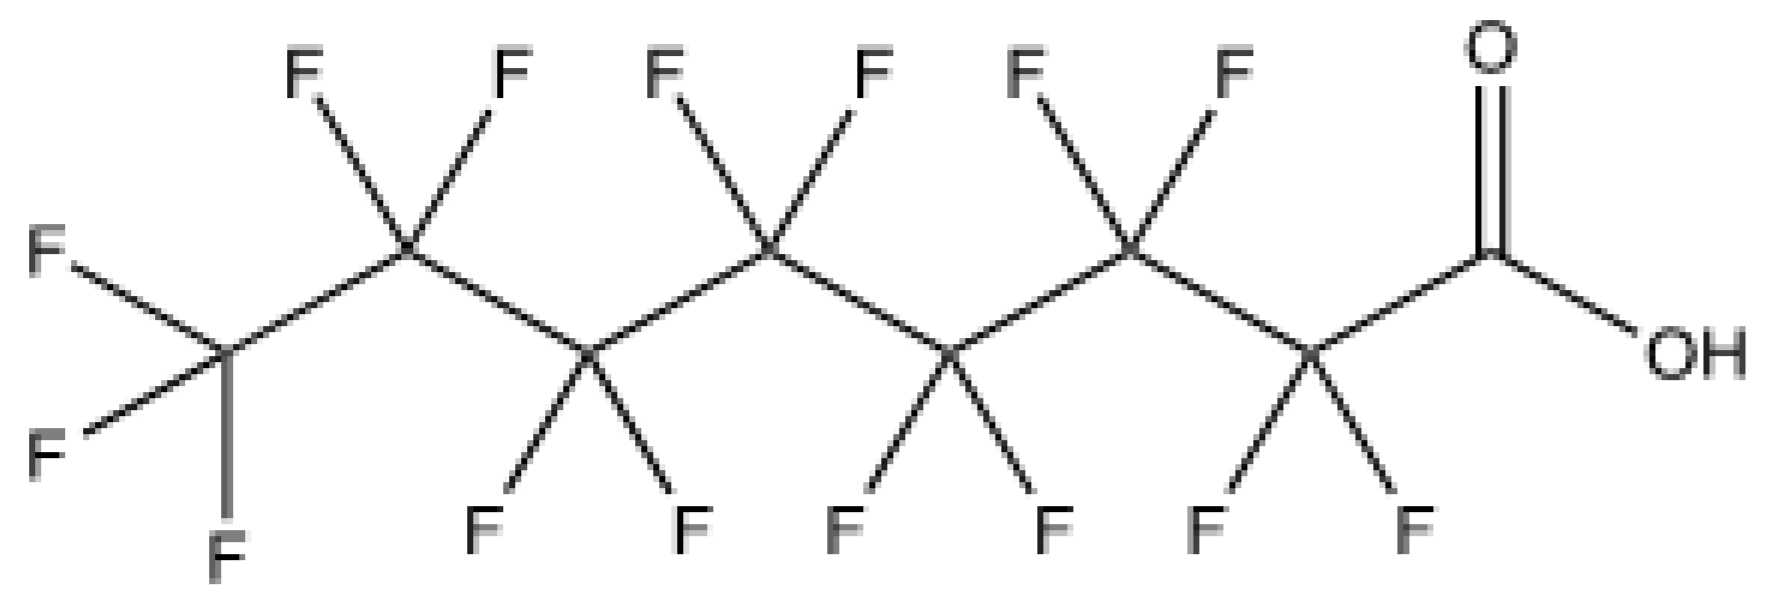
Figure 2.
PFOA degradation compounds, PFBA and PFHxA.
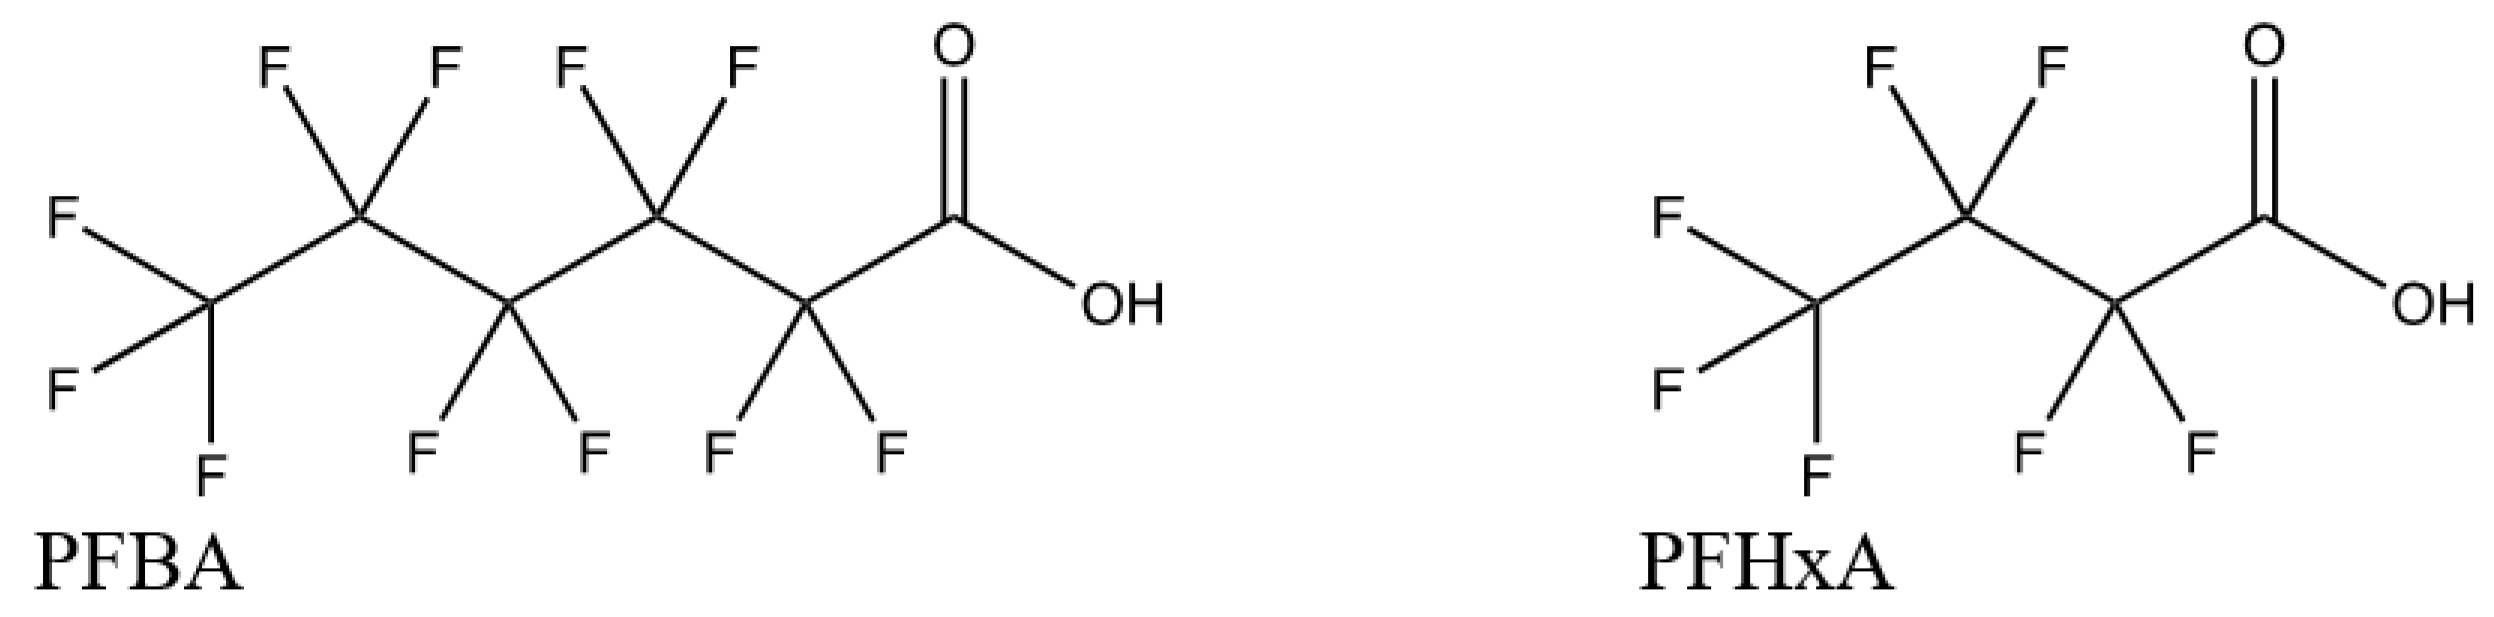
Figure 3.
Ross and colleagues’ PFAS treatment technologies for water [21].
Figure 3.
Ross and colleagues’ PFAS treatment technologies for water [21].
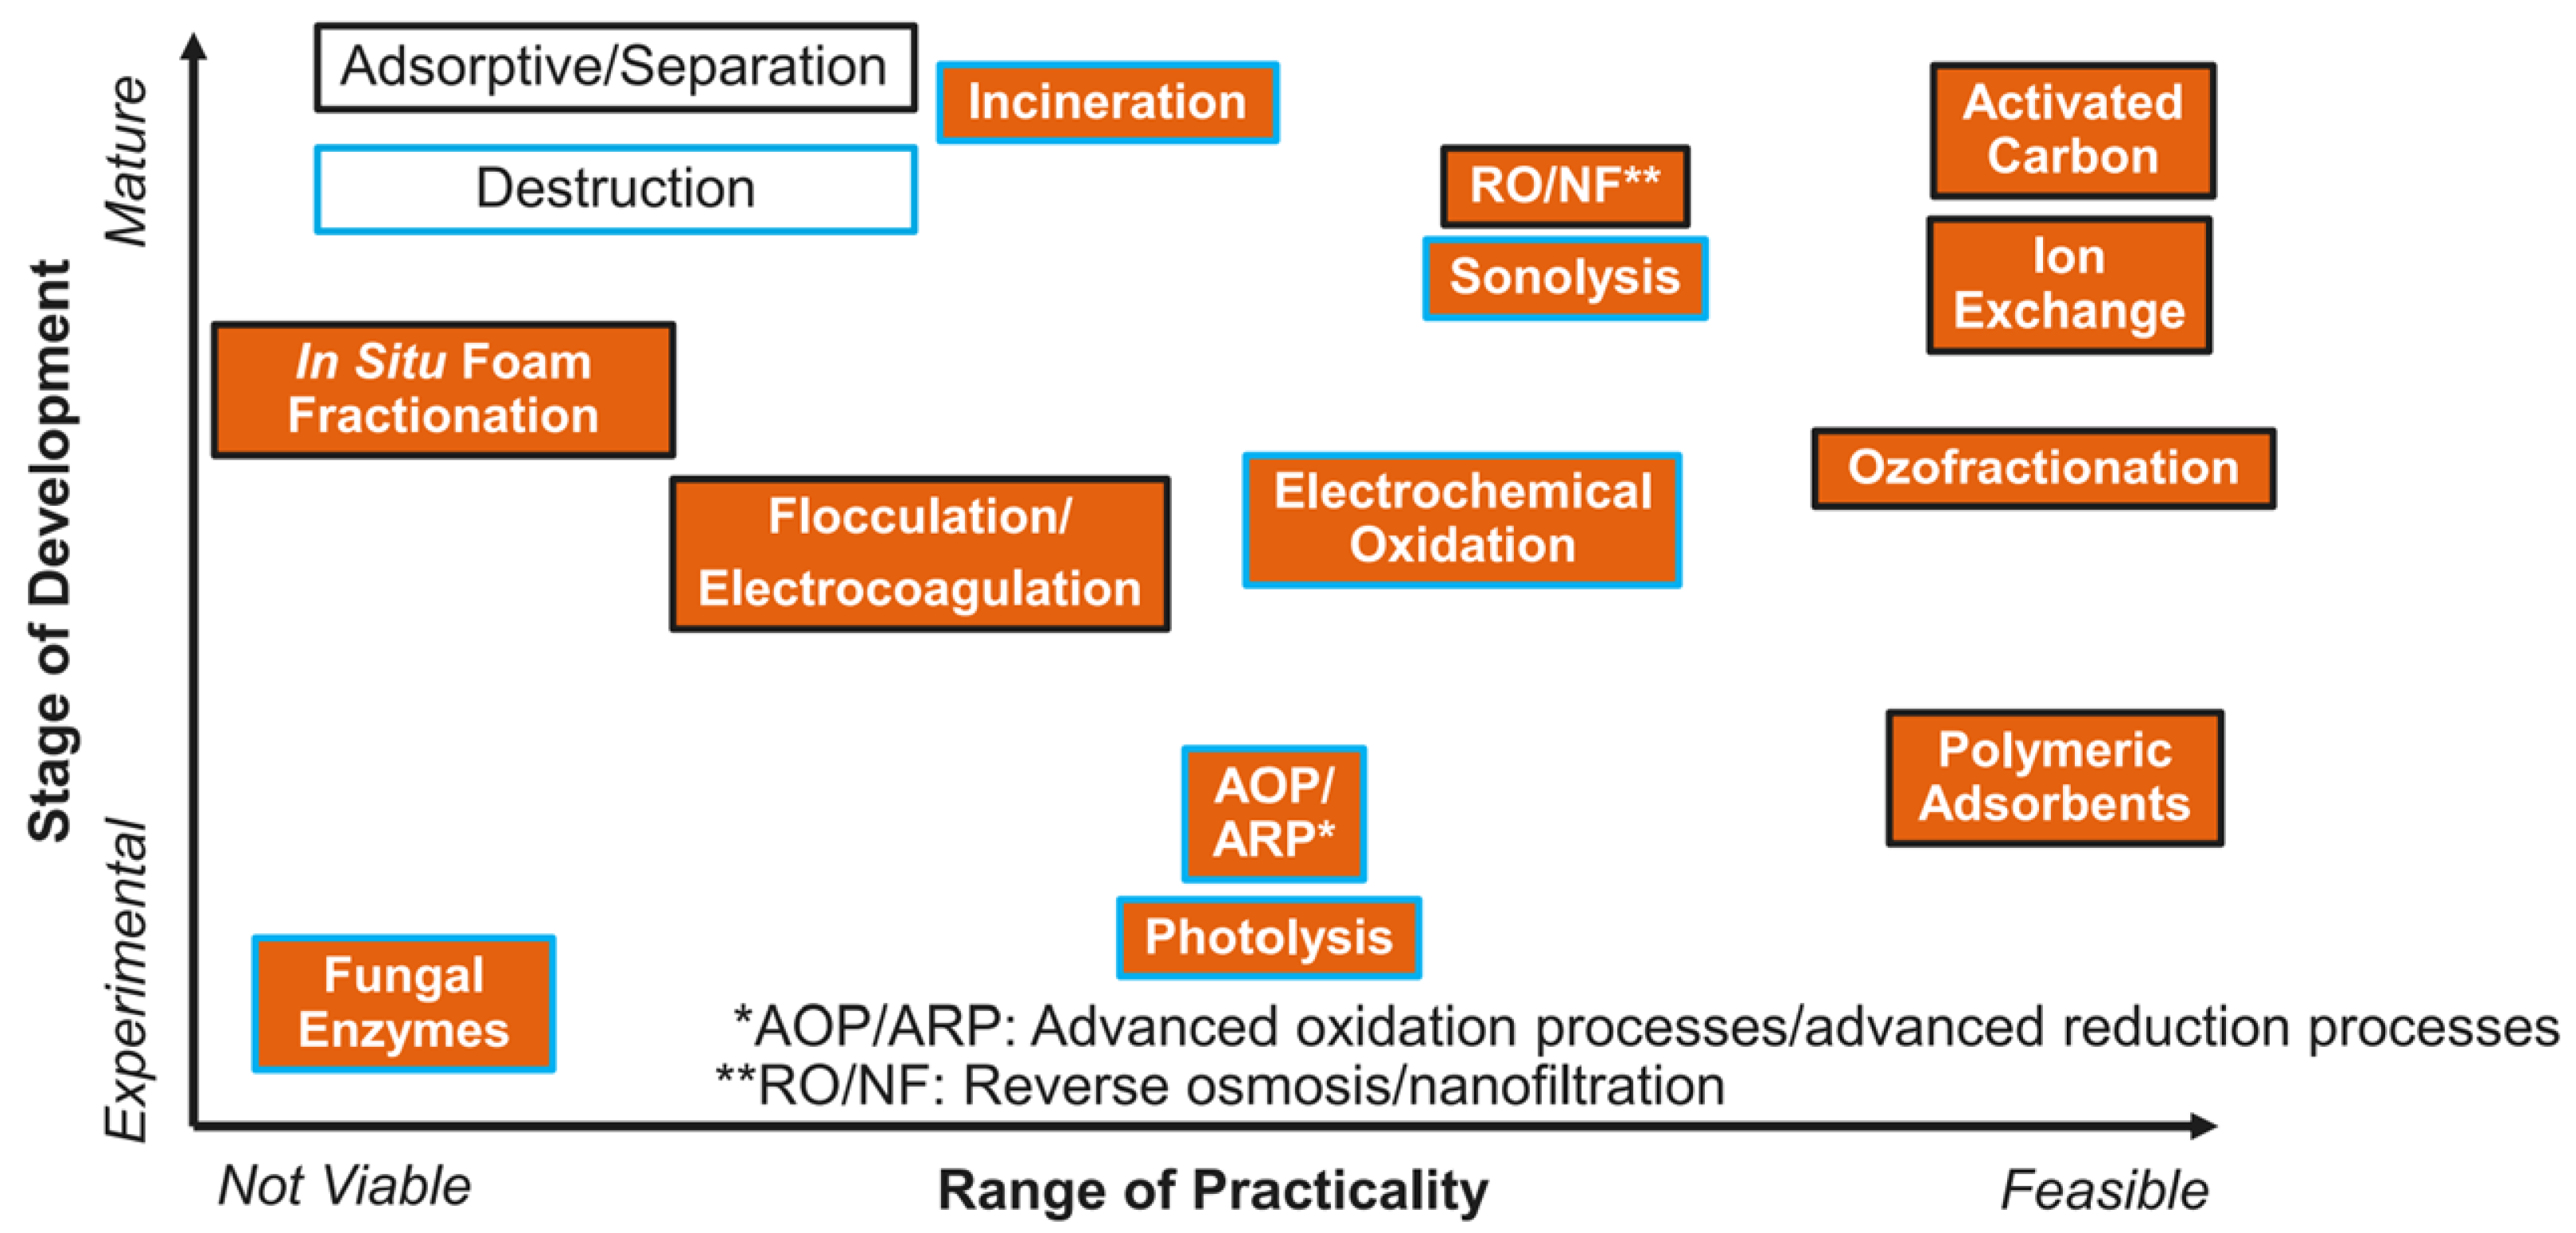
Figure 4.
Schematic of sample setup
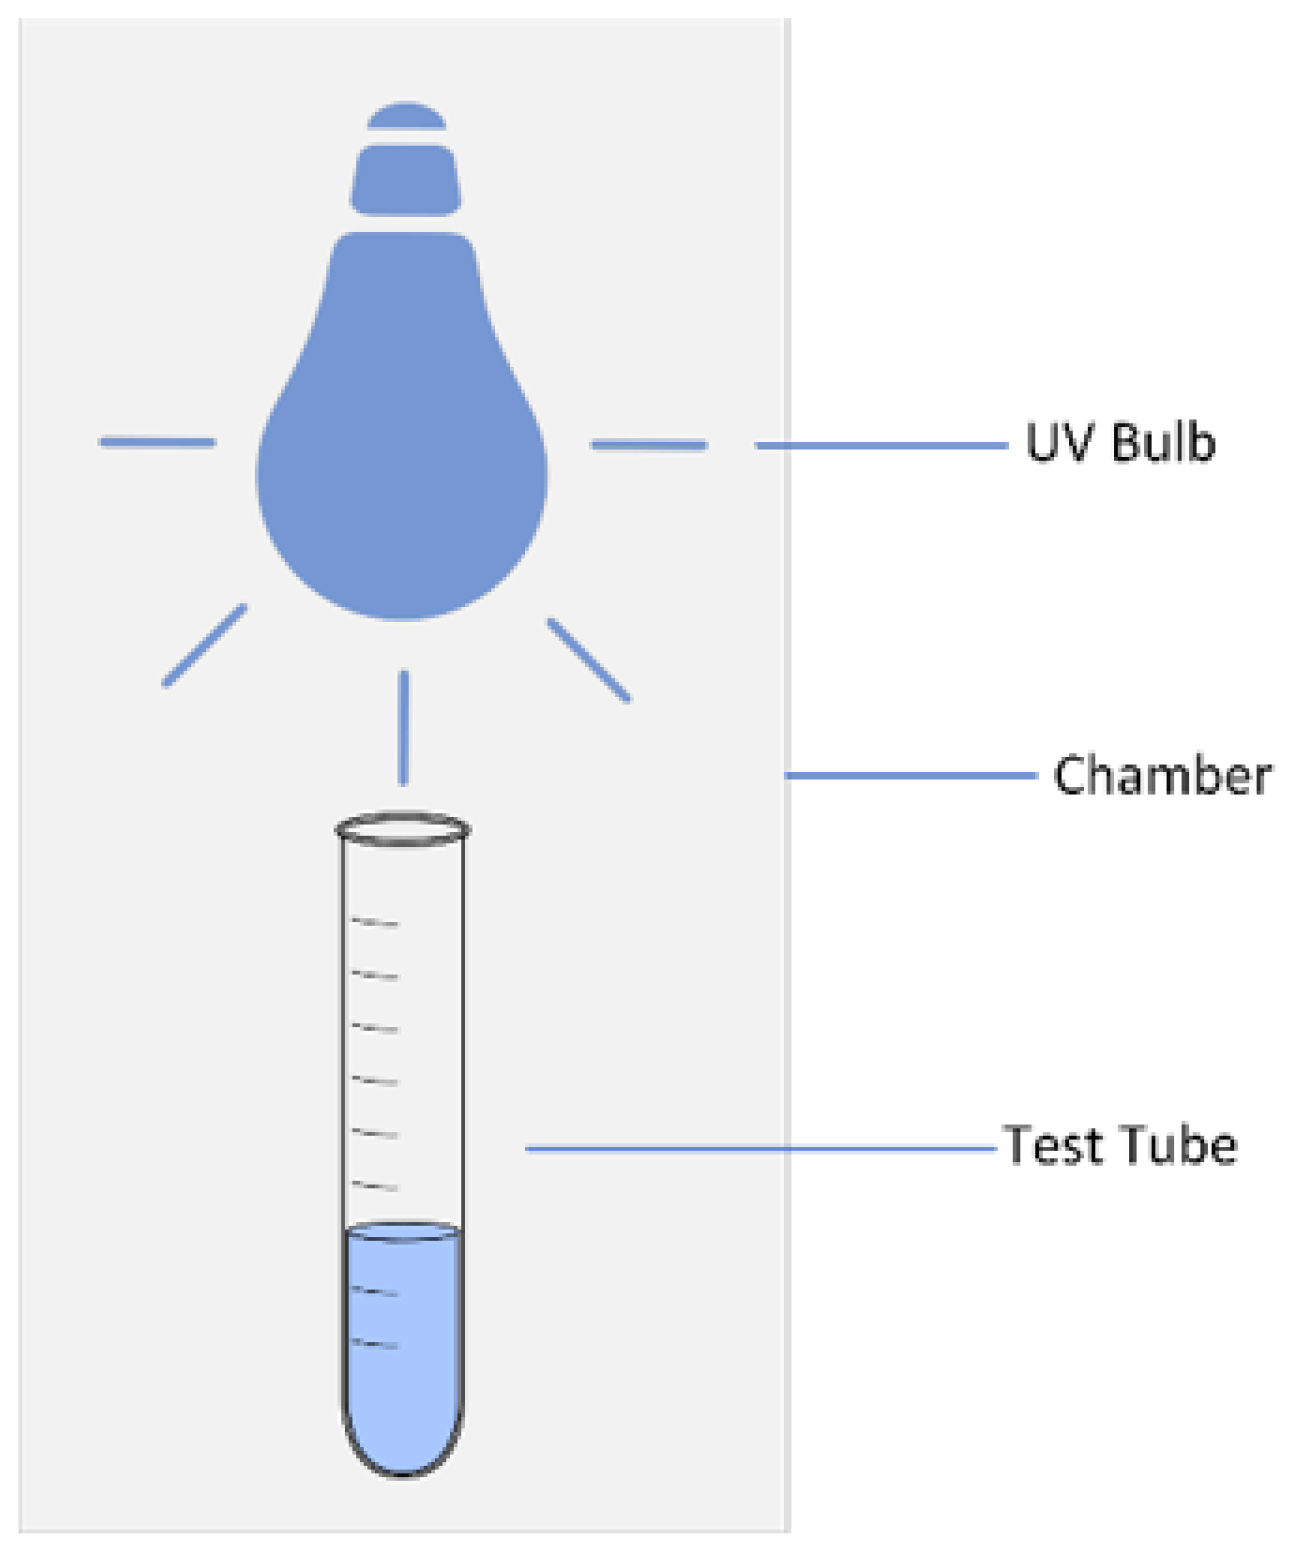
Figure 5.
UV-vis spectra of PFOA.
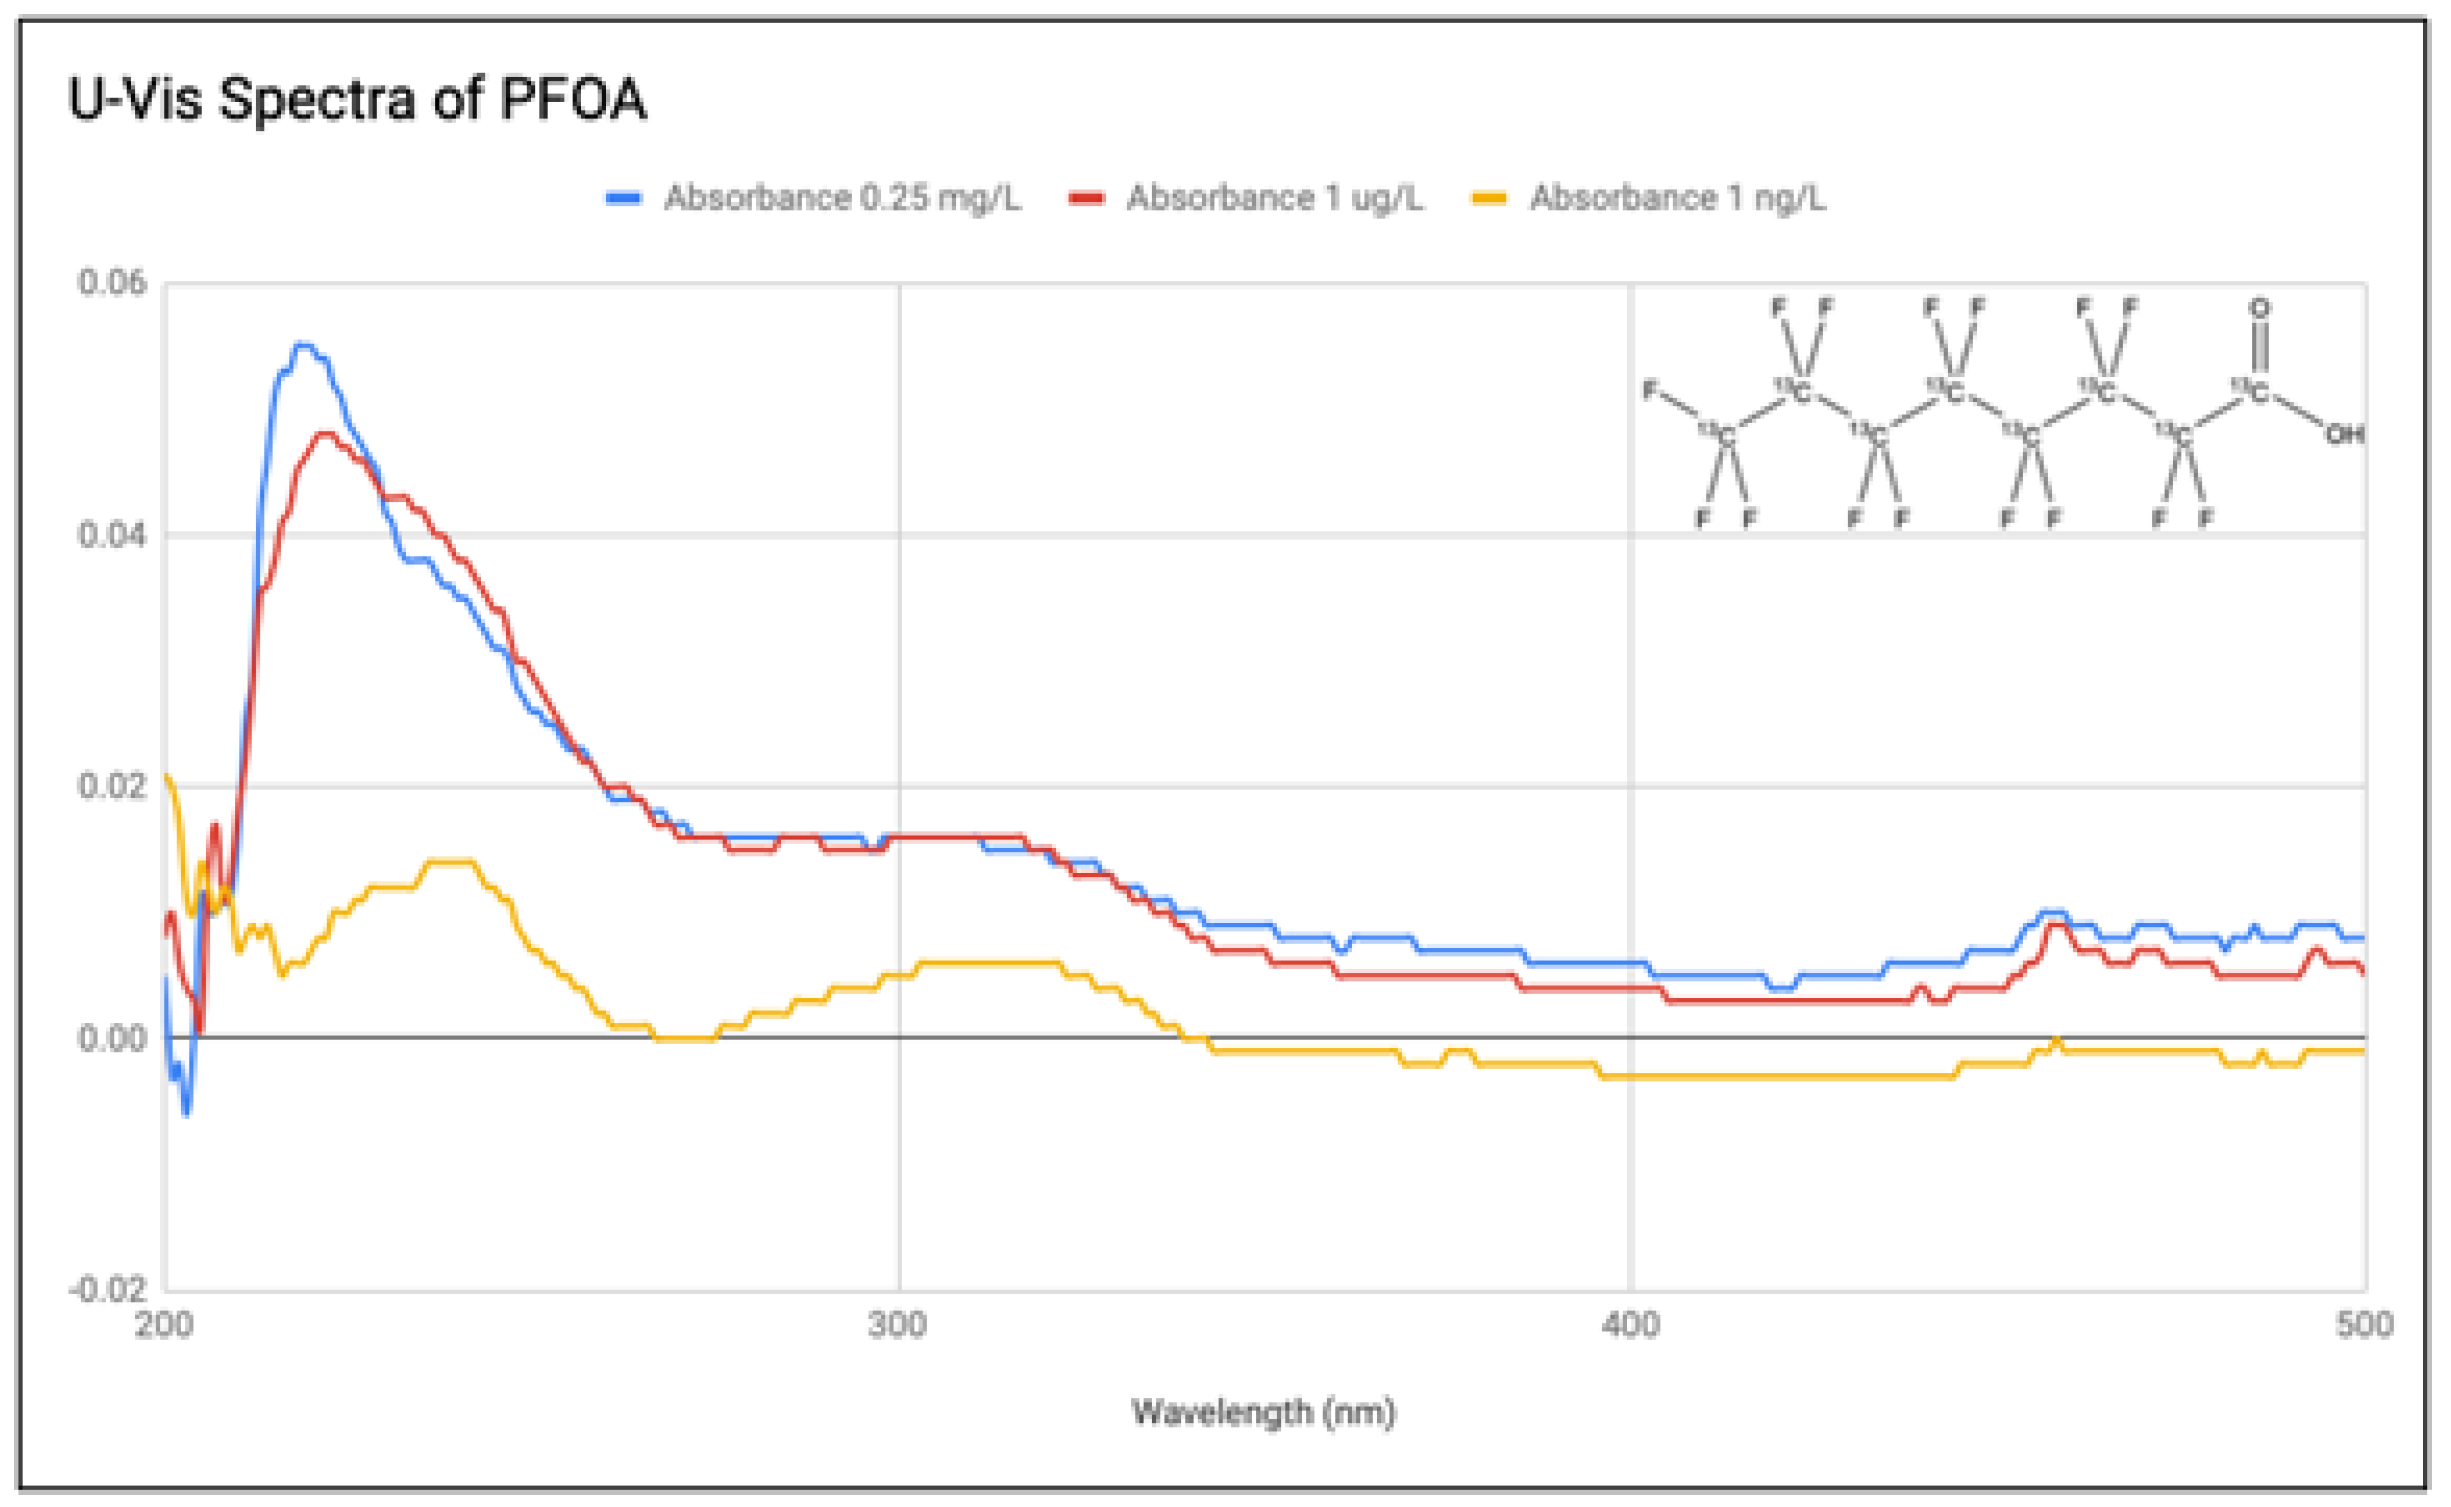
Figure 6.
PFOA spectra under varying conditions.
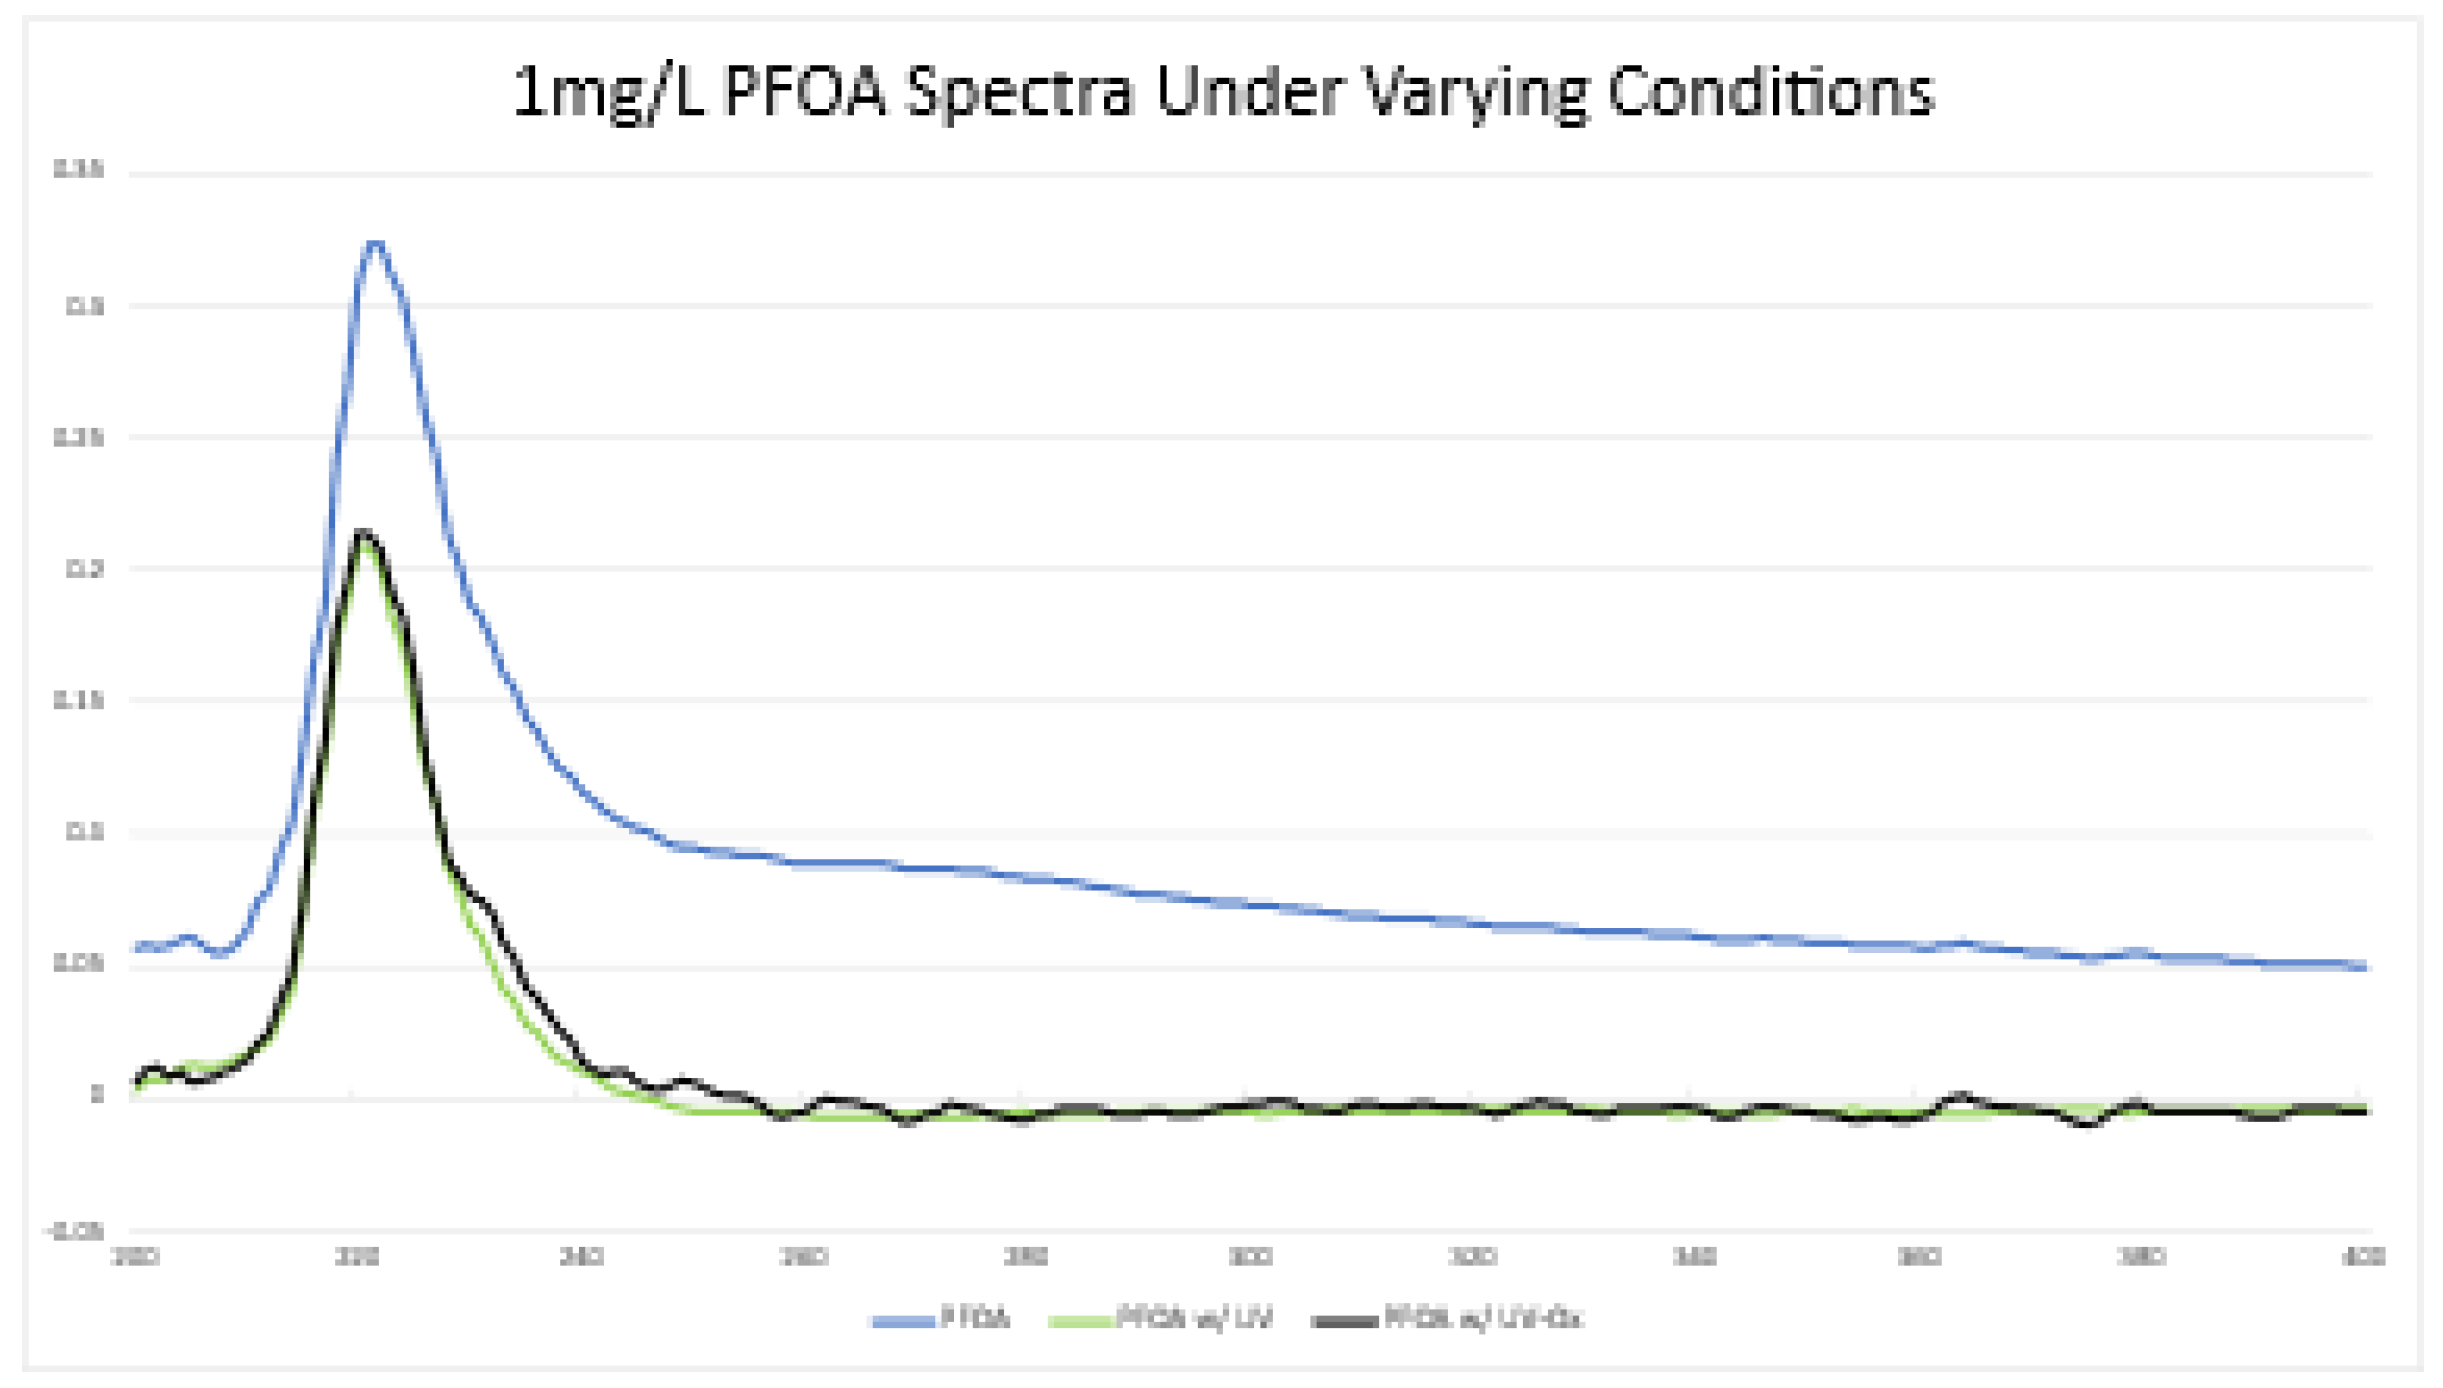
Figure 7.
Mechanism of PFOA degradation, not to time-scale.
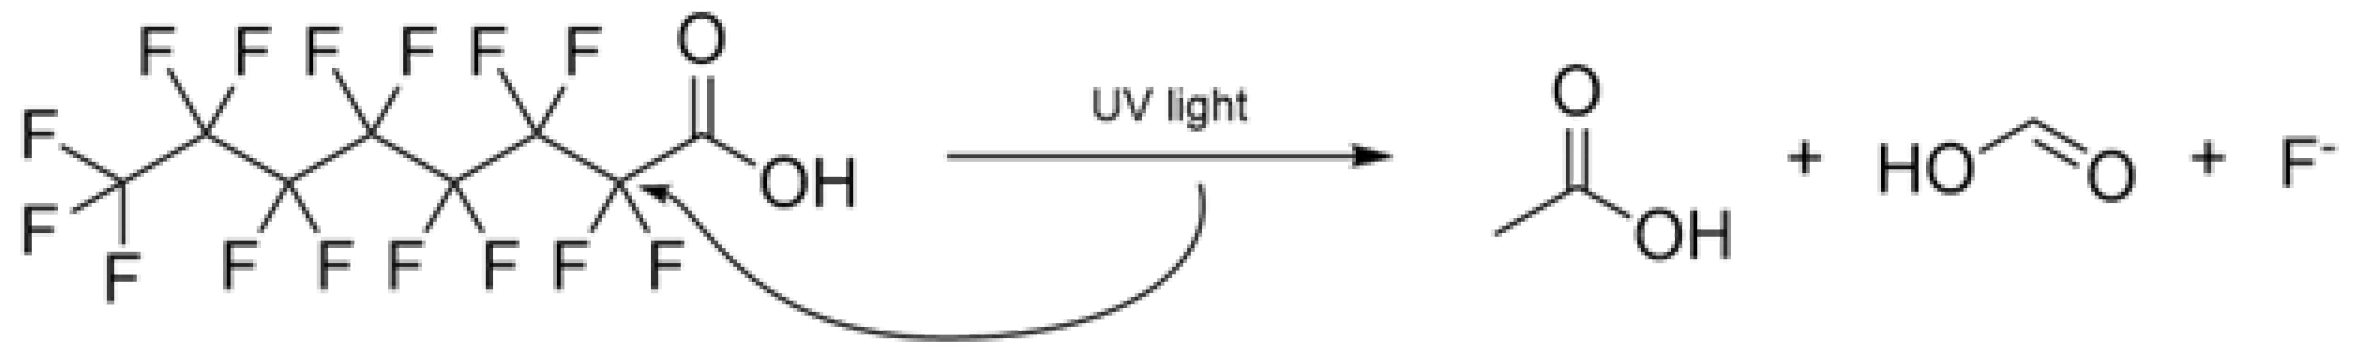

Table 1.
Selected Parameters of PFOA [9].
Table 1.
Selected Parameters of PFOA [9].
| Parameter | Parameter Value |
|---|---|
| Chemical Abstracts Services (CAS) Number | 335-67-1 |
| Molecular Weight | 414.07 g/mol |
| Physical Description | White powder with pungent odor |
| Boiling Point | 192°C |
| Melting Point | 55 °C |
| Solubility in Water | 2290 mg/L at 24 °C |
| pKa | -0.5 to 4.2 |
Disclaimer/Publisher’s Note: The statements, opinions and data contained in all publications are solely those of the individual author(s) and contributor(s) and not of MDPI and/or the editor(s). MDPI and/or the editor(s) disclaim responsibility for any injury to people or property resulting from any ideas, methods, instructions or products referred to in the content. |
© 2024 by the authors. Licensee MDPI, Basel, Switzerland. This article is an open access article distributed under the terms and conditions of the Creative Commons Attribution (CC BY) license (http://creativecommons.org/licenses/by/4.0/).
Copyright: This open access article is published under a Creative Commons CC BY 4.0 license, which permit the free download, distribution, and reuse, provided that the author and preprint are cited in any reuse.


