

Submitted:
26 January 2024
Posted:
29 January 2024
You are already at the latest version
Abstract
Keywords: Adrenergic signaling in cardiomyocytes; cardiac muscle contraction; Chagas disease; diabetic cardiomyopathy; dilated cardiomyopathy; glycerolipid metabolism; glycolisis/glucogenesis; hypertrophic cardiomyopathy; purine metabolism; steroid hormone biosynthesis.
Keywords:
Adrenergic signaling in cardiomyocytes
; cardiac muscle contraction
; Chagas disease
; diabetic car-diomyopathy
; dilated cardiomyopathy
; glycerolipid metabolism
; glycolisis/glucogenesis
; hyper-trophic cardiomyopathy
; purine metabolism
; steroid hormone biosynthesis
1. Introduction
The role of excessive salt intake in hypertension and the health benefits of salt reduction are very well-documented [1,2,3]. Although sodium is essential for almost all physiological functions from nutrient absorption to nervous impulse transmission and muscle contraction [4,5,6], in excess it adversely impacts the metabolism [7], immunity [8], fibrosis [9], and cardiopulmonary work [10,11,12] among many other effects. In a rat model, salt-elevated food with NaCl concentration exceeding 4% (like in the human-used processed meats and soups) was shown to exacerbate the development of various types of cardiomyopathy [13] leading to heart failure.
Careful gene expression studies related high salt consumption to transcriptomic alterations in the cardiac tissue and the occurrence of cardiovascular diseases [14,15]. It was reported that excessive salt specifically enriched the pathways of hypertrophic cardiomyopathy (HCM) in the male mouse and that of dilated cardiomyopathy (DIL) in the female mouse [16]. However, hyponatremia, defined as a serum sodium of < 135mmol/L, is an independent risk factor for higher morbidity and mortality rates [17].
Nevertheless, all previous transcriptomic studies were limited to identifying the up-and down-regulated genes and what functional pathways have been enriched in response to a specific salt diet. As shown in this report, the expression levels of the genes represent a tiny percentage of the information that can be taken from high-throughput gene expression NG RNA-sequencing and microarray platforms.
The (Cardio)Genomic Fabric Paradigm (GFP, [18]) approach makes the most theoretically possible from quantifying expressions of thousands of genes at a time on several biological replicas. In addition to the average expression level, GFP takes also into account the variations of transcript abundances across biological replicas and the degree of expression correlations of all gene pairs.
Here, we analyze how reducing the salt intake affects the left ventricle metabolic pathways and the functional pathways of Cardiac muscle contraction (CMC) and those of Chagas (CHA) [19,20], diabetic (DIA) [21,22], DIL [23], and HCM [24,25] cardiomyopathies. The genes involved in the analyzed pathways were selected using the Kyoto Encyclopedia of Genes and Genomes (KEGG) [26].
2. Materials and Methods
2.1. Experimental Data
We analyzed the gene expression data from our Agilent microarray experiment that profiled the transcriptomes of the left heart ventricle myocardia of 16 weeks old C57Bl/6j male mice subjected for the last 8 weeks of their lives to normal (“N”, 0.4% Na) or low (“L”, 0.05%Na) salt diet. Four male mice from the same litter were used for each of the two conditions to minimize the biological variability. Any microarray spot with corrupted pixels or with the foreground fluorescence less than twice the background fluorescence in one condition was eliminated from the analysis. The experimental protocol and raw and normalized expression data are publicly accessible in the Gene Expression Omnibus (GEO) of the (USA) National Center for Biotechnology Information (NCBI) [27].
2.2. Primary Independent Characteristics of Individual Genes and Functional Pathways
Every quantified gene from normal (N) or law-salt (L) diet-fed animals was characterized by the independent measures: Average Expression level (AVE), Relative Expression Variation (REV), and Expression Correlation (COR) with each other gene in the same condition. These values were deduced from the raw microarray data using the algorithms presented in Appendix A.
One can attach statistical significance to the expression coordination of two genes. Thus, the p < 0.05 statistically significant correlations between genes probed by single microarray spots are when:
a. → genes i and j are synergistically expressed → their expression levels oscillate in phase across biological replicas (i.e., simultaneously going up or down);
b. → genes i and j are antagonistically expressed → their expression levels oscillate in antiphase across biological replicas (i.e., when one goes up the other goes down- and when one goes down- the other goes up);
c. → genes i and j are independently expressed → there is no correlation between their expression oscillations.
When both paired genes were probed by two microarray spots, the cut-off for statistically significant synergistic/antagonistic correlation becomes; for three spots it is and so on, the cut-off for p < 0.05 statistical significance decreasing when the number of probing spots increases. One can get the cut-off values from the available online calculator [28]).
2.3. Derived Characteristics of Individual Genes
The above primary characteristics of individual genes can be reworked as presented in Appendix B to define the useful composite quantifiers: Relative Expression Control (REC), Coordination Degree (COORD), and Gene Commanding Height (GCH). REC is proportional to the strength of the cellular homeostatic mechanisms that control the transcript abundance, limiting the expression fluctuations caused by the stochastic nature of the transcription chemical reactions. COORD indicates how influential that gene is for the expression of all other genes. Finally, GCH is used to establish the gene hierarchy, the top gene (largest GCH) being the Gene Master Regulator of that phenotype [29], the best target for personalized gene therapy [30].
All primary and derived characteristics of individual genes were also averaged over selected KEGG-constructed functional pathways (formulas: A1′, A2′, A3′, B1′, B2′, B3′).
2.3. Quantification of Transcriptomic Changes
2.3.1. Significant Regulation of the Average Expression Value
A gene was considered as significantly regulated by the low-salt diet if its expression ratio x (negative for down-regulation) satisfied an absolute fold-change condition and the p-value p of the heteroscedastic t-test of the equality of the two average expressions was less than 0.05. Any uniform cut-off for the absolute fold-change (such are 1.5x or 2.0x) might be too stringent for stably expressed genes and low technical noise of the probing microarray spots, or too lax for highly variably expressed genes and high technical noise. Therefore, we use it to calculate the absolute fold-change cut-off “CUT” for every single transcript from the corresponding REVs in the compared conditions (Inequalities (C1) in Appendix C).
2.3.2. Weighted Individual (Gene) Regulation (WIR) and Weighted Pathway Regulation (WPR)
Presenting the transcriptomic changes as percentages of statistically significant up-/down-regulated out of quantified genes means implicitly consider that only these genes modified the transcriptome and their contributions were uniform +1/-1. A better indicator would be the expression ratio “x” (negative for down-regulation), the algebraic form of the absolute fold-change “|x|”. Instead, we consider the Weighted Individual (gene) Regulation (WIR) that is applied to any gene regardless of its regulation status and take into account the net fold-change (|x|-1) and the confidence (1-p-value) of the regulation (formula (C2) in Appendix C).
The Weighted Pathway Regulation (WPR) is the square root of the average (WIR)2 over the genes associated with that functional pathway (formula (C2′) in Appendix C).
2.3.3. Regulation of the Expression Control and Expression Coordination
Regulation of the expression control of individual genes and a pathway were computed according to the formulas (C3) and (C3′), while that of the coordination within a functional pathway and between two pathways were computed according to the formulas (C4) and (C4′) from Appendix C from Appendix C.
2.4. Functional Pathways
We analyzed the effects of the low-salt diet on the following KEGG-constructed metabolic functional pathways:
- i)
-
carbohydrate metabolism:
- ii)
-
Energy metabolism
- -
- (OXP) mmu00190 Oxidative phosphorylation [35]
- iii)
-
Lipid metabolism
- iv)
-
Nucleotide metabolism
- v)
-
Amino acid metabolism
- vi)
-
Glycan biosynthesis and metabolism
- -
- (NGL) mmu00510 N-Glycan biosynthesis [47].
- vii)
-
Xenobiotics biodegradation and metabolism
A particular interest was given to the modification of the circulatory system functional pathways: (ASC) mmu04261 Adrenergic signaling in cardiomyocytes [50] and (CMC) mmu04260 Cardiac muscle contraction [51].
We then determined how the reduced salt remodeled the pathways of the cardiac diseases: (CHA) mmu05142 Chagas disease [52], (DIA) mmu05415 Diabetic cardiomyopathy [53], (DIL) mmu05414 Dilated cardiomyopathy [54], and (HCM) mmu05410 Hypertrophic cardiomyopathy [55].
We have also identified the significantly regulated genes in the KEGG-constructed signaling pathways of MAPK (mmu04010 [56]), PIK3-Akt (mmu04151 [57]), Rap1 (mmu04015 [58]), Ras (mmu04014 [59]), Chemokine (mmu04062 [60]), Calcium (mmu04020 [61]), cAMP (mmu04024 [62]), cGMP-PKG (mmu04022 [63]), mTOR (04150 [64]), and Wnt (mmu04150 [65]). Finally, we have also looked for the effects of a low-salt diet on the pathways (CEN) Central carbon metabolism in cancer (mmu05230 [66]) and (CHO) Choline metabolism in cancer (mmu 05231 [67]).
3. Results
3.1. The Global Picture
Expressions of 19,605 unigenes were adequately quantified in all four N-samples and four L-samples, many of them averaged over the several microarray spots probing redundantly their transcripts. In addition to the average expression levels across biological replicas, (AVE), we computed for every single gene the Relative Expression Variation (REV) and the Expression Correlation (COR) with each other gene. Thus, by quantifying the expressions of 19,605 genes, we got 19,605 AVEs, 19,605 REVs, and (19,605*(19,605-1)/2 =) 192,168,210 CORs, making a total of 192,207,420 values to interpret in each condition and compare between conditions. This total amount of data is 9,804 times larger than what would have been used in the traditional analysis limited to AVEs.
As expected, the myofilament genes Myl3 (myosin, light polypeptide 3; AVE-N = 1,134; AVE-L = 1,273) and Actc1 (actin, alpha, cardiac muscle 1; AVE-N = 1,105, AVE-L = 987) had the largest (normalized to the median gene) expressions in both normal and low-salt diet. Both Myl3 and Actc1 were included by KEGG in the circulatory pathways ASC [50] and CMC [51], and also in cardiac disease pathways HCM [55] and DIL [54]. Myl3 is a ventricle-specific gene in both adult human [68] and mouse [69] hearts. Mb (myoglobin; AVE-N = 1,036, AVE-L = 1,103), Slc25a4 (solute carrier family 25 (mitochondrial carrier, adenine nucleotide translocator), member 4; AVE-N = 1,011, AVE-L = 984) and Cox6a2 (cytochrome c oxidase subunit 6A2; AVE-N = 969, AVE-L = 1,012) were also among the top expressed genes in both conditions. Twice than normal levels of Mb were recently associated with early acute myocardial infarction [70], Slc25a4 is included in the DIA pathway [53] and Cox6a2 is included in the pathways CMC [51], OXP [35], and DIA.
Mcph1 (microcephaly, primary autosomal recessive 1; REC-N = 39.05) was the most controlled gene in “N”, while Usp31 (ubiquitin specific peptidase 31, REC-L = 27.93) and Syt11 (synaptotagmin XI, REC-L = 26.25) the most controlled genes in “L”. Mcph1 is one determinant of the mitral valve annulus diameter [71], so its high control in the left ventricle myocardium is justified. However, in a low-salt diet, its control is substantially down-graded to REC-L = 2.10, while those of Usp31 (REC-N = 3.82) and Syt11 (REC-N = 11.08) were substantially elevated. There is no information to date about the role of Usp31 in cardiac pathophysiology but Syt11 was reported to decrease the risk of atrial fibrillation [72].
Among all gene pair correlations, we found that the number of (p < 0.05) significantly synergistically expressed genes with Cacna1c (calcium channel, voltage-dependent, L type, alpha 1C subunit) increased from 260 (/19,604*100% = 1.33%) in normal diet to 685 (3.49%) in low-salt diet. The number of significantly antagonistically expressed with Cacna1c increased from 398 (2.03%) to 467 (2.38%), and that of the independently expressed increased from 450 (2.29%) to 699 (3.56%). Altogether, the coordination degree of Cacna1c with all other ventricular genes increased from 1.07% to 2.31%. Cacna1c is an important gene for several signaling pathways (ASC [51], calcium [61], cAMP [62], cGPM-PKG [63], MAPK [56]), all five types of synapses [73], as well as CMC [51], and the cardiomyopathies (DIL [54] and HCM [55]).
3.2. Independence of the Three Types of Primary Expression Characteristics of Individual Genes
Figure 1 illustrates the independence of the three primary types of characteristics (AVE, REV, COR) for the 55 quantified GLY genes in the two conditions. We selected the sodium/calcium exchanger Slc8a1 (solute carrier family 8 member A1), involved in several KEGG-constructed signaling pathways (ASC [50], calcium [61], cGMP-PKG) [63], as well as in CMC [51] and the cardiomyopathies DIL [54] and HCM [55], to illustrate the expression correlation.
The independence of these measures is visually evident. Note that there are little differences between the AVE values in the two dietary conditions. In this pathway, only one gene, Dlat (dihydrolipoamide S-acetyltransferase (E2 component of pyruvate dehydrogenase complex; x = 1.26, CUT = 1.23) was up-regulated and two genes, Aldh3a2 (aldehyde dehydrogenase family 3, subfamily A2; x = -1.46, CUT = 1.20) and Pck2 (phosphoenolpyruvate carboxykinase 2; x = -2.80, CUT = 2.48) were down-regulated by LSD. However, the differences are moderately larger in the REV values and substantially larger in the COR values. Altogether, these differences indicate that the additional characteristics provide important supplementary descriptors of the transcriptomic changes for which the traditional analysis is blind. For instance, the REV of Aldh3a2 increased from 1.09% in “N” to 13.96% in “L” (i.e., by 12.75x), and that of Minpp1 (multiple inositol polyphosphate histidine phosphatase 1) from 2.48% in “N” to 24.50% in “L” (9.88x). The REV of the mitochondrial gene Pck2 decreased from 101.47% to 26.41% (i.e., -3.84x).
Expression correlation with Slc8a1 of G6pc3 (glucose 6 phosphatase, catalytic, 3) went from -0.83 to +0.82, while that of Alob (aldolase B, fructose-bisphosphate) went from +0.34 to -0.98 (p < 0.05 significant antagonism). There is no information in PubMed about the particular roles of these two genes (G6pc3, Alob) in cardiac pathophysiology, so that our results may stimulate future investigations.
3.3. Important Derived Characteristics of the Individual Genes
Figure 2 presents the Relative Expression Control, the Coordination Degree, and the Gene Commanding Height of 55 GLY [33] genes in the two dietary conditions.
The analyses of the derived characteristics unveiled additional interesting effects of the low-salt diet on the GLY genes. For instance, the down-grade of the expression control of Aldh3a2 (REC-N = 20.64, REC-L = 1.49) and Galm (galactose mutarotase; REC-N = 18.76, REC-L = 2.42) led to a substantial reduction of the average REC for this pathway from 2.05 to 1.27. The overall reduction of the expression control of GLY genes in low-salt allows more flexibility in the carbohydrate metabolism.
The substantial overall reduction of the coordination degree (from Average COORD-N = 8.98% to Average COORD-L = 3.42%), indicating desynchronization of the genes ex-
pressed in this pathway. The most affected genes were: Hk3 (hexokinase 3; COORD-N = 22, COORD-L = -4), Aldh7a1 (aldehyde dehydrogenase family 7, member A1; COORD-N = 20, COORD-L = -1), Pgm1 (phosphoglucomutase 1; COORD-N = 21, COORD-L = -2), Gapdhs (glyceraldehyde-3-phosphate dehydrogenase, spermatogenic; COORD-N = 21, COORD-L = 4).
The GCH analysis points out to the gene hierarchy change when the salt intake is reduced, genes like Galm (GCH-N = 26.61, GCH-L = 1.55) and Cox4i2 (GCH-N = 33.64, GCH-L = 2.67) becoming irrelevant in “L”.
Owing to the physiological importance, Figure S1 from the Supplementary Material presents the GCH scores for several genes involved in the KEGG-constructed Cardiac Muscle Contraction (CMC) pathway [51]. Of note is the substantial down-grade of Cox4i2 (cytochrome c oxidase subunit 4I2; GCH-N = 33.64, GCH-L = 2.67), a gene involved also in the OXP [35] and DIA [53] pathways. Although none of the mitochondrial cytochrome c oxidase complex genes (Cox4i1, Cox4i2, Cox5b, Cox6a1, Cox6a2, Cox6b1, Cox6c, Cox7a1, Cox7a2, Cox7a21, Cox7b, Cox7b2, Cox7c, Cox8a, Cox8b) was significantly regulated, their average importance (measured by the GCH scores) for the cardiac muscle contraction was downgraded from 7.09 to 2.43. We interpret this result as increased energetic efficiency of the cardiac muscle in the low-salt diet.
3.4. Measures of Transcriptomic Regulation
Figure 3 compares the regulation of 50 randomly selected out of the 114 quantified genes included in the KEGG-constructed pathway Purine metabolism [41] from the perspective of the Uniform +1/-1 contributions, Weighted Individual Regulation (WIR), Regulation of Expression Control (ΔREC), and Regulation of the Coordination Degree (ΔCOORD). Nonetheless, the Uniform contribution (the basis of the very popular Percentage of up-/down-regulated genes) is limited to the significantly regulated genes based on either arbitrarily introduced (e.g., 1.5x) or computed for each gene absolute fold-change cut-off.
In contrast, WIR (negative for down-regulation) takes into account all genes. WIR quantifies the total contribution of each gene to the overall transcriptomic alteration that is proportional to the control (here in normal diet) expression level of that gene and its expression ratio (negative for down-regulation) in the experimental condition (low-salt). For instance, while both Adcy4 (adenylate cyclase 4) and Prune1 (prune exopolyphosphatase) are significantly down-regulated, (i.e., -1 equal contributions to the percentage of the significantly (down-) regulated genes), their WIR measures are substantially different: WIRAdcy4 = -3.36 and WIRPrune1 = - 48.18. Likewise, both Adcy5 (adenylate cyclase 5) and Adssl1 (adenylosuccinate synthetase like 1) are significantly up-regulated, but with WIRAdssl1 = 22.20, Adssl1 tops Adcy5 (WIRAdcy5 = 0.13). The differences came from their dissimilar expression ratios (xAdcy4 = -1.66, xAdcy5 = 1.24, xAdssl1 = 1.95, xPrune1 = -10.18) and AVE values (AVEAdcy4 = 5.12, AVEAdcy5 = 0.55, AVEAdssl1 = 23.28, AVEPrune = 6.48). Thus, beyond the sign (up- or down-), WIR discriminates between the contributions of the regulated genes.
Analysis of the Regulation of the Expression Control produced also interesting results for this metabolic pathway, with Nme1 (NME/NM23 nucleoside diphosphate kinase 1, ΔREC = 370%) and Adssl1 (ΔREC = 311%) exhibiting the largest increase. Nme1, a potential target for metastatic cancer gene therapy [74], was also significantly up-regulated (x = 1.30, CUT = 1.26). By contrast, Gmpr2 (guanosine monophosphate reductase 2, ΔREC = -153%) and Entpd5 (ectonucleoside triphosphate diphosphohydrolase 5, ΔREC = -127%) presented the largest decrease. Importantly, ΔREC brings nonredundant information about the transcriptomic alteration. Both Gmpr2 and Entpd5 were significantly down-regulated by LSD (xGmpr2 = -1.37, CUTGmpr2 = 1.24; xEntpd5 = -1.32, CUTEntpd5 = 1.29).
Analysis of the Regulation of the Coordination Degree revealed substantial decoupling of Papss2 (3’-phosphoadenosine 5’-phosphosulfate synthase 2; ΔCOORD = -26) and Ampd2 (adenosine monophosphate deaminase 2; ΔCOORD = -21) and increased coupling of Pde11a (phosphodiesterase 11A; ΔCOORD = 15). While Pde11a was also significantly up-regulated (x = 1.53) by LSD, Ampd2 was significantly down-regulated (x = -1.68) and expression level of Papss2 was practically not affected ( x = -1.15).
3.5. Correcting the False Hits of the Traditional Significant Regulation Analysis
Overall, we found 1,169 (5.96%) unigenes with significant up-regulation and 715 (3.65%) genes with significant down-regulation (the two types satisfying our composite criterion |x| > CUT & p-val < 0.05). The flexible cut-off of the absolute fold-change eliminated the false regulated hits (CUT > |x| > 1.5 & p-val < 0.05) from the traditional analysis and included the falsely neglected regulated genes (1.5 > |x| > CUT & p-val < 0.05). The calculated CUT took values from 1.026 for Syt11 to 3.521 for the purine gene Pde5a (phosphodiesterase 5A, cGMP-specific). Altogether, our algorithm eliminated 148 falsely considered down-regulated genes and 96 falsely considered up-regulated genes, while adding 685 falsely neglected down-regulated and 553 falsely neglected up-regulated genes.
Table 1 presents examples of falsely considered up-regulated, falsely considered down-regulated, and falsely neglected significantly down- and up-regulated genes. For instance, with x = - 2.350, Ifitm5 (interferon-induced transmembrane protein 5) would have been considered as significantly down-regulated while it is not because CUT = 2.427. Likewise, with x = -1.829 the glycerophospholipid metabolism [38] gene Chkb (choline kinase beta) would have been considered as significantly down-regulated while it is not (CUT = 2.633). Similarly, with x = 1.720, the purine/pyrimidine metabolism [41,42] gene Nt5el (5’ nucleotidase, ecto-like) would have been considered as significantly up-regulated while it is not because CUT = 2.153. Another example is Gclc (glutamate-cysteine ligase, catalytic subunit) with x = 2.330 and CUT = 2.456. With WIR = 25.41, Ndufa10 (NADH: ubiquinone oxidoreductase subunit A10), another false up-regulated gene (x = 1.505 < CUT = 1.579) had the largest contribution to the overall gene expression change in the low-salt diet. Nonetheless, although not considered by us as significantly regulated, its WIR was included in the WPR of both OXP and DIA functional pathways.
In contrast, the significant regulation of the Diabetic Cardiomyopathy [50] gene Gsk3b (glycogen synthase kinase 3 beta, x = -1.490, CUT = 1.341) and the Purine Metabolism [41] gene Gucy1b2 (guanylate cyclase 1, soluble, beta 2; x = 1.490, CUT = 1.426) would have been neglected. There are other important genes that would have been disconsidered by the traditional 1.5 absolute fold-change cut-off. For instance, with x = -1.178, the Chagas Disease [52] gene Casp8 (Caspase 8) would have been neglected although it is significantly down-regulated because CUT = 1.159 < |x|. Finally, Tgfb3 (transforming growth factor, beta 3), included in the functional pathways of the Chagas [52], Hypertrophic [55], Diabetic [53] and Dilated [54] cardiomyopathies would have been also neglected although CUT = 1.093 < x = 1.166.
3.5. Overall Regulation of Expression Level and Transcription Control within Selected Metabolic, Circulatory System, and Cardiac Chronic Diseases’ Pathways
Table 2 presents the percentages of down- and up-regulated out of quantified genes, the Weighted Pathway Regulation (WPR), and the changes in the control of transcript abundances within several selected functional pathways. Unfortunately, not all genes assigned to the respective functional pathways were quantified, either because of not being expressed in the left ventricle, missing the probing spots in the microarrays, or probed by spots with corrupted pixels during hybridization. For instance, out of 156 genes assigned to ASC by KEGG, we quantified only 130 (i.e., 83.33%), still enough to have a statistically relevant evaluation of the transcriptomic change of this pathway.
From the WPR perspective, the most affected pathways were CMC (WPR = 45.30) and OXP (WPR = 37.42), indicating the major effects of reduced salt on ventricle contraction and energy metabolism. Control of transcript abundances was substantially diminished for steroid hormone biosynthesis but strengthened for biosyntheses of fatty acids and N-glycan, as well as for oxidative phosphorylation, indicating significant shifts in the cardiomyocyte homeostasis priorities.
3.6. Regulated Genes within Selected Metabolic Pathways
Out of the 1,169 significantly up-regulated genes, 97 were included in KEGG-constructed metabolic pathways, while within the 715 down-regulated genes, 66 were responsible for metabolism pathways.
Table 3 presents the statistically significantly down- and up-regulated genes in the most affected (as a number of regulated genes) KEGG-constructed metabolic pathways. Importantly, the reduced salt increased several metabolic pathways (more up-regulated than down-regulated genes), including those of the Glycerophospholipid, Glutathione, and Glycerolipid, as well as the Oxidative phosphorylation. Notably, we found no significantly down-regulated genes in both the Galactose metabolism and the Tyrosine metabolism.
3.7. Regulation of Selected Signaling Pathways
In total, we found 607 significantly up-regulated and 350 significantly down-regulated genes included in all KEGG-constructed signaling pathways.
Figure 4 presents the localization of the regulated genes in the KEGG-constructed ASC (Adrenergic signaling in cardiomyocytes) [50] pathway. Remarkably, 17 (i.e., 13.08%) from the total of 130 quantified genes in the pathway were up-regulated and 8 (6.15%) were down-regulated.
The large numbers of regulated genes within the ten signaling pathways from Table 4 and Table 5 indicate the high impact of the reduced salt intake diet on heart physiology. Moreover, the 1.73 U/D ratio tells that the diminished sodium increased the overall signaling. Of note is the partial overlap of the pathways, genes such are Akt1 listed in all but Calcium, and Wnt signaling pathways. With 50 (36U + 14D), respective 45 (28I + 17D), MAPK signaling and PIK3-Akt signaling top the list of most regulated signaling pathways.
3.8. Regulated Genes within Pathways of Selected Cardiac Diseases
Figure 5 presents the positions of the 10 (i.e., 12.20%) up-regulated and 6 (7.32%) down-regulated out of the 82 quantified genes included in the KEGG-constructed pathway Dilated Cardiomyopathy [54]. The significantly regulated genes in this pathway were: Adcy1/4/5 (denylate cyclase 1/4/5), Cacnb2 (calcium channel, voltage-dependent, beta 2 subunit), Itga9/b1/b6 (integrin alpha 9/beta 1/beta 6), Myh6/7 (myosin, heavy polypeptide heavy polypeptide 6, cardiac muscle, alpha/7, cardiac muscle, beta), Myl2 (myosin, light polypeptide 2, regulatory, cardiac, slow), Prkaca (protein kinase, cAMP-dependent, catalytic, alpha), Tgfb3 (transforming growth factor, beta 3).
Figure S2 from the Supplementary Material presents the positions of the 7 (8.86%) up-regulated and 6 (7.59%) down-regulated out of the 91 genes included in the KEGG-constructed pathway Hypertrophic Cardiomyopathy [55]. The HCM regulated genes were: Cacnb2 (calcium channel, voltage-dependent, beta 2 subunit), Edn1 (endothelin 1), Itga9/b1/b6 (integrin alpha 9/beta 1/beta 6), Myh6/7 (myosin, heavy polypeptide heavy polypeptide 6, cardiac muscle, alpha/7, cardiac muscle, beta), Myl2 (myosin, light polypeptide 2, regulatory, cardiac, slow), Tgfb3 (transforming growth factor, beta 3), Tpm1 (tropomyosin 1, alpha), and Tpm3 (tropomyosin 3, gamma).
Figure 6 presents the positions of the 10 (11.76%) up-regulated and 3 (3.53%) down-regulated out of the 85 quantified genes included in the KEGG-constructed pathway of the parasitic Chagas disease [52]. Regulated genes: Adcy1 (denylate cyclase 1), Akt1/3 (thymoma viral proto-oncogene 1/3), Casp8 (caspase 8), Fadd (Fas (TNFRSF6)-associated via death domain), Ikbkg (inhibitor of kappaB kinase gamma), Irak1 (interleukin-1 receptor-associated kinase 1), Mapk1/10 (mitogen-activated protein kinase 1/10), Myd88 (myeloid differentiation primary response gene 88), Ppp2r2a (protein phosphatase 2, regulatory subunit B, alpha), Tgfb3 (transforming growth factor, beta 3), Tlr2 (toll-like receptor 2).
Figure 7 presents the positions of the regulated genes in the mitochondrial module of the KEGG-constructed pathway Diabetic Cardiomyopathy [53]. Regulated genes: Atp5j (ATP synthase, H+ transporting, mitochondrial F0 complex, subunit F), Mpc2 (mitochondrial pyruvate carrier 2), Ndufb11 (NADH: ubiquinone oxidoreductase subunit B11), Ndufb4 (NADH: ubiquinone oxidoreductase subunit B4), Ndufc1 (NADH: ubiquinone oxidoreductase subunit C1), Uqcr10 (ubiquinol-cytochrome c reductase, complex III subunit X), Uqcrh (ubiquinol-cytochrome c reductase hinge protein).
3.9. Remodeling of the Gene Networks
We found that the transcriptomic networks correlating the genes within and between functional pathways strongly depend on the amount of salt in the diet. Figure 8 presents the (p < 0.05) significant synergistically/antagonistically/independently expressed genes within the KEGG-constructed pathway Dilated Cardiomyopathy (DIL, [54]) and the (p < 0.05) significant synergistic/antagonistic/independent coexpression of the CMC [51], OXP [35] and DCM [53] shared gene Cox6b2 (cytochrome c oxidase subunit 6B2) with DIL genes in the two dietary conditions. Note that the low-salt diet coupled Cox6b2 with DIL genes through 18 significant synergisms (no antagonism or independence), while in the normal diet it was only one antagonism (with Cacng6) and three significant independences with (Cacnb1, Cacng7, Cacng8), all four turned to significant synergisms by reducing the salt intake. Observe also substantial remodeling within the DIL pathway. For instance, Atp2a2 is antagonistically coupled with four calcium channels (Cacna1d, Cacna2d3, Cacnb3, Cagng2) and two sodium/calcium exchangers (Slc8a1, Slc8a2) in the normal diet but synergistically coupled with only one calcium channel (Cacna1c) in low-salt.
Figure 9 presents the statistically (p < 0.05) significant synergistic/antagonistic/ independent (red/green/yellow square) expression of several genes from the KEGG-constructed pathway Glycolysis/glucogenesis (GLY, [33]) with those from Cardiac Muscle Contraction (CMC, [51]) in the left ventricles of mice subjected to normal and low-salt diets. Of note is the almost compact expression coupling of the two pathways in the normal diet and the substantial decoupling in the low-salt diet. There are 302 (10.17%) synergistically, 246 (8.28%) antagonistically and 54 (1.81%) independently expressed gene pairs among the 1,485 distinct pairs that can be formed with the 55 GLY genes, yielding COORD = 16.63% in the normal diet. These numbers are reduced to: 192 (6.47%) synergistic, 100 (3.67%) antagonistic, and 104 (3.50%) independent expressions in low-salt, making COORD = 6.33%. Among the 2,775 distinct pairs that can be formed with CMC genes, 732 (13.19%) were synergistic, 404 (7.28%) antagonistic, and 138 (2.49%) independent in normal (COORD = 17.98%). The numbers of significant correlations became: 514 (9.26%) synergistic, 68 (1.23%) antagonistic, and 168 (3.03%) independent (COORD = 7.46%) in low-salt. The expression correlations between GLY and CMC genes (4,125 distinct pairs) were also affected. 496 (12.02%) synergisms, 311 (7.54%) antagonisms, and 94 (2.28%) in normal diet (COORD = 17.28%) became 309 (7.49%) synergisms, 110
Figure 10 presents the statistically (p < 0.05) significant synergistic and antagonistic expression of several genes from the KEGG-constructed pathway Adrenergic Signaling in Cardiomyocytes [50] with genes from the pathways Cardiac Muscle Contraction [51] and Hypertrophic Cardiomyopathy [55] in the left ventricle of mice fed with (A) normal diet and (B) law-salt diet. Of note is again the massive decoupling of the three pathways from 13.82% (ASC–CMC) and 10.50% (ASC–HCM) in normal salt to 2.91 (ASC –CMC), respective 2.83% (ASC–HCM) in low-salt indicating major remodeling of the interplay among these functional pathways.
4. Discussion
We have analyzed expression data from a microarray experiment deposited in a publicly accessible database to determine the cardiogenomic effects of reducing the salt intake in the heart left ventricle of adult mice from the perspective of the Genomic Fabric Paradigm (GFP). Through characterizing each profiled gene by three types of independent measures, GFP provides the most theoretically possible comprehensive characterization of the transcriptome. As illustrated in Figure 1 for 55 Glycolisis/Glucogenesis genes, the Relative Expression Variations (REVs) and the Expression Correlations (CORs) with each other gene are independent with respect to the Average Expression Levels (AVEs). Thus, compared to the traditional gene expression analysis, GFP increased by almost four orders of magnitude the transcriptomic information collected from the analyzed microarray experiment, adding very important, yet still neglected transcriptomic measures.
While the everybody-used AVE is good for identifying what gene was significantly up-/down-regulated when comparing an experimental condition with the corresponding control (pending the appropriate cut-off criteria), it is REV that provides a measure of the strength of the homeostatic control of transcript abundance. Thus, the high REV (101.47) of Pck2 indicates a very relaxed control of the expression level of this gene, making it a good vector of adaptation to altered external conditions, including hypoxia [75].
In turn, COR analysis determines the most probable gene networking in functional pathways. It is based on the Principle of Transcriptomic Stoichiometry [76,77] that requires the networked genes to be coordinately expressed to ensure the efficiency of the functional pathway. Among many other interesting information, Figure 1 presents in the premiere the glycolysis/glucogenesis expression coordination partners of Slc8a1, a key gene for calcium homeostasis whose inactivation limits the damages caused by myocardial infarction [78] and the dependence on diet of the partnership.
The primary independent characteristics allowed us to define some important derived characteristics to deepen the understanding of heart genomics. For instance, through the Relative Expression Control (REC) we got insides about the cell priorities in ensuring the right amounts of transcripts. For now, there is no information in PubMed and we also do not have any hypothesis of why Aldh3a2 is by far the most protected member of the aldehyde dehydrogenase family in a normal diet and what caused its substantial fall from the cell interest in low-salt. However, this gene and also the other highly protected GLY gene, Galm, deserve further investigation for their roles in normal heart physiology beyond their direct involvement in carbohydrate metabolism.
The high GCH (33.64) of the CMC gene Cox4i2 in the normal heart looks deserved given how essential the encoded protein is for acute pulmonary oxygen sensing [79]. The reduction of GCH to 2.67 in low salt might be interpreted as better protection of the heart in this diet against life-threatening hypoxemia.
As illustrated in Table 1, our composite criterion with absolute fold-change cut-off calculated for every gene to identify the significantly regulated genes proved efficient in eliminating numerous false positive hits and adding several missed genes caused by the fixed 1.5x cut-off. As well it justified the addition of other genes whose significant regulation would have been neglected by the traditional analysis. There are several important genes for heart physiology whose significant up-regulation was revealed by our algorithm like Myd88 (myeloid differentiation primary response gene 88), an important mediator of the inflammatory signaling carried by the toll-like and Il-1 families of receptors [80]. Other important up-regulated genes were Fxyd2 (FXYD domain-containing ion transport regulator 2), an important regulator of the Na+ transport [81], and Itgb6 (myo-inositol 1-phosphate synthase A1), involved in resynchronization following heart failure [82]. From the identified down-regulated genes, of note are: Gsk3b (glycogen synthase kinase-3β), a critical regulator of cell proliferation and differentiation [83], Chat (choline acetyltransferase) related to the ventricular remodeling in type 1 diabetes [84], and Cmpk2 (cytidine monophosphate) involved in inflammatory diseases [85].
We prefer to use WIR (illustrated in Figure 3b) as a more adequate measure to characterize the expression regulation of individual genes and their contribution to the overall contributions to transcriptomic alteration. From this perspective, the largest positive contributions were delivered by Rrp36 (ribosomal RNA processing 36 homologs) and Uqcrh (ubiquinol-cytochrome c reductase hinge protein, WIR = 203). While Uqcrh is directly involved in the KEGG-constructed pathways CMC [51], OXP [35], and DIA [54], Rrp36 is one of the major cellular activity mobilizing gene [86] and its up-regulation indicates the benefits of reducing the salt intake. The encoded protein of the most up-regulated gene, Prg4 (proteoglycan 4 (megakaryocyte stimulating factor, articular superficial zone protein), x = 196) was associated with the slope of the body mass index [87]. The largest negative contributions were provided by Ccdc157 (coiled-coil domain containing 157, WIR = -1,472, x = 69.85) and Cdca8 (cell division cycle associated 8, WIR = -556, x = -56.33). Ccdc157 was identified as important in the protein and trafficking pathways [88].
The WPR analysis (Table 2) indicated CMC, OXP, and the mitochondrial module of DIA as the most improved among the selected pathways in the experimental diet through the upregulated myosines, tropomyosines, and genes of the Complexes I and III from the respiratory chain. It is interesting to note the large contributions of the respiratory genes from Complex I (Ndufb4, WIR = 95.91; Ndufc1, WIR = 58.83), and those from Complex III (Uqcr10, WIR = 177.85 and Uqcrh, WIR = 202.92), that might have increased the production of ATP. By contrast, the negative contribution of the pyruvate transporter Mcp2 (WIR = -76.16) may finally lead to the reduction of the reactive oxygen species, increasing the viability of the hosting cardiomyocyte (Figure 7).
Analysis of the Regulation of Expression Control (illustrated in Figure 3c for several purine metabolism genes) provides additional, non-redundant information about the LSD transcriptomic effects on the heart’s left ventricle. Of all 19,605 quantified genes, the largest increase of ΔREC in LSD was exhibited by Usp31 (ΔREC = 2,411%), a potential biomarker [89] for clear cell renal cell carcinoma [90], and Syt11 (ΔREC = 1,517%), known for its role in atrial fibrillation [72]. In contrast, Mcph1 (microcephaly, primary autosomal recessive 1, ΔREC = -3,515%), involved in determining the mitral valve diameter [71] and DNA damage signaling and repair [91], and Aldh3a2 (ΔREC = -1,559%) had the largest reduction of the expression control.
LSD resulted in many more up-regulated than down-regulated genes within metabolic (Table 3, up/down ratio = 97/66 = 1.47) and signaling (Table 4, up/down ratio = 607/350 = 1.73) pathways, indicating increased efficiency of metabolism and signaling. Although none of the quantified alpha (Adra1a, Adra1b, Adra1) and beta (Adrb1, Adrb2) adrenergic receptors were regulated (Figure 4), the inward sodium transporters Scn1b and Scn5a were over-expressed presumably to compensate for the low sodium level, that might be relevant in the treatment of the Brugada syndrome [92]. Also up-regulated was the Na+-K+ exchanger Atp1a3 whose mutations are related to several neurological and cardiovascular diseases [93].
We found interesting LSD consequences on the pathways of several cardiomyopathies that should be taken into account when deciding about the treatment options. For instance, the up-regulation of the integrins Itga9, Itgb1, and Itgb6 (Figure 6), important membrane adhesion receptors involved in both inside-out and outside-in signaling of cardiomyocytes, might have direct consequences on the therapeutic efficiency of their inhibitors [94]. The down-regulation of Casp8 (Figure 7) reduced the apoptosis risk [95] in cardiomyocytes elevated by the up-regulation of Fadd [96] in the Chagas disease [97] following infection with Trypanosoma cruzi [98].
While the LSD effects on the gene and protein expression were reported in numerous studies (e.g., [99,100,101], it is for the first time after our knowledge that remodeling of the gene transcriptomic networks is reported. As shown in Figure 8, Figure 9 and Figure 10, the LSD-induced remodeling affects the gene expression intercoordination both within functional pathways and between interacting pathways. Interestingly, LSD reduced significantly the coordination degrees within CMC (from 12.10% to 10.00%, Figure 8) and GLY (from 16.63% to 6.33%) pathways The expression coordination was also significantly reduced between GLY and CMC (from 17.28% to 7.49%, Figure 9), between ASC and CMC (from 13.82% to 2.91%) and between ASC and HCM (from 10.50% to 2.83%, Figure 101). This substantial decoupling within as well as among functional pathways most likely increases the flexibility and adaptability of the heart’s physiology to external stimuli.
5. Conclusions
Using the mathematically advanced GFP algorithms, the study revealed for the first time, that in addition to regulating numerous genes, the reduced salt intake affects the homeostatic control of the transcript abundances and remodels the transcriptomic networks linking genes within and between functional pathways.
Author Contributions
Conceptualization, D.A.I.; methodology, D.A.I. and S.I.; software, D.A.I.; validation, D.A.I. and S.I.; formal analysis, S.I.; investigation, D.A.I.; resources, D.A.I.; data curation, S.I.; writing—original draft preparation, D.A.I.; writing—review and editing, H.A.; visualization, H.A. and D.A.I.; supervision, D.A.I.; project administration, D.A.I.; funding acquisition, D.A.I. All authors have read and agreed to the published version of the manuscript.
Funding
This research received no external funding.
Institutional Review Board Statement
Not applicable, expression data downloaded from a publicly accessible database.
Data Availability Statement
We encourage all authors of articles published in MDPI journals to share their research data. In this section, please provide details regarding where data supporting reported results can be found, including links to publicly archived datasets analyzed or generated during the study. Where no new data were created, or where data is unavailable due to privacy or ethical restrictions, a statement is still required. Suggested Data Availability Statements are available in section “MDPI Research Data Policies” at https://www.mdpi.com/ethics.
Conflicts of Interest
The authors declare no conflicts of interest.
Appendix A: Independent Primary Expression Characteristics of Individual Gene and Functional Pathways
1. (Normalized) Average Expression Level (AVE) of gene i in condition c = N, L, probed redundantly by Ri microarray spots was normalized to the median gene expression in that condition:
Ri = the number of microarray spots probing redundantly transcript i.
AVE of individual genes can be averaged within a particular functional pathway Γ:
2. Relative Expression Variation (REV) is defined as the midinterval chi-square estimate with probability α = 0.05 of the coefficient of variation of gene i in condition c = N, L, probed redundantly by Ri microarray spots in all four biological replicas:
χ2 = chi-square test statistic with 4 Ri degrees of freedom and probability α = 0.05
REV of individual genes can be averaged within a particular functional pathway Γ:
3. Expression correlation (COR) of gene i with gene j in condition c = N, L, probed redundantly by Ri and Rj microarray spots in all four biological replicas:
One may note that COR is actually the pair-wise Pearson’s coefficient of correlation between two sets of data.
COR of individual genes can be averaged within a particular functional pathway Γ:
Appendix B: Derived Characteristics of Individual Genes and Their Averages over Functional Pathways
1. Relative Expression Control:
REC of individual genes can be averaged within a particular functional pathway Γ:
2. Coordination degree of individual genes:
SYN, ANT, and IND are the percentages of genes forming with gene i (p < 0.05) statistically significant synergistic, antagonistic, or independent expressed pairs across the biological replicas. The analysis can cover the entire transcriptome or be restricted to a particular functional pathway.
COORD of individual genes can be averaged within a particular functional pathway Γ:
COORD of individual genes can be averaged between two functional pathways Γ and Θ:
, {Γ},{Θ} ≡ numbers of genes in pathways Γ and Θ (B2”)
3. Gene Commanding Height of individual genes:
GCH of individual genes can be averaged within a particular functional pathway Γ:
Appendix C: Measures of Transcriptomic Regulation
1. Statistically significant regulation of the average expression level:
2. Weighted Individual (gene) Regulation (WIR)
WIR of individual genes can be averaged within a particular functional pathway Γ:
3. Regulation of the expression control of individual genes:
ΔREC of individual genes can be averaged within a particular functional pathway Γ:
4. Regulation of the expression coordination of individual genes:
5. Regulation of the coordination degree within in a functional pathway:
6. Overall regulation of the expression coordination between functional pathways:
References
- Aliasgharzadeh, S.; Tabrizi, J.S.; Nikniaz, L.; Ebrahimi-Mameghani, M.; Lotfi Yagin, N. Effect of salt reduction interventions in lowering blood pressure: A comprehensive systematic review and meta-analysis of controlled clinical trials. PLoS One. 2022, 17(12):e0277929. [CrossRef]
- Ma, H.; Wang, X.; Li, X.; Heianza, Y.; Qi, L. Adding Salt to Foods and Risk of Cardiovascular Disease. J Am Coll Cardiol. 2022; 80(23):2157-2167. [CrossRef]
- Padilla-Moseley, J.; Blanco-Metzler, A.; L’Abbé, M.R.; Arcand, J. A Program Evaluation of a Dietary Sodium Reduction Research Consortium of Five Low- and Middle-Income Countries in Latin America. Nutrients. 2022; 14(20):4311. [CrossRef]
- Shanmugam, R.; Worsley, A. Current levels of salt knowledge: a review of the literature. Nutrients. 2014; 6:5534–59. [CrossRef]
- Kotchen, T.A.; Cowley, A.W. Jr.; Frohlich, E.D. Salt in health and disease-a delicate balance. N Engl J Med. 2013; 368:1229–37. [CrossRef]
- World Health Organization. Guideline: Sodium Intake for Adults and Children. World Health Organization, Geneva. 2012. https://pubmed.ncbi.nlm.nih.gov/23658998.
- Aksentijević, D.; Shattock, M.J. With a grain of salt: Sodium elevation and metabolic remodeling in heart failure. J Mol Cell Cardiol. 2021; 161:106-115. [CrossRef]
- Ertuglu, L.A.; Kirabo, A. Dendritic Cell Epithelial Sodium Channel in Inflammation, Salt-Sensitive Hypertension, and Kidney Damage. Kidney360. 2022; 3(9):1620-1629. [CrossRef]
- Xiao, H.; Lu, H.; Xue, Y.; Jia, Z.; Dai, M.; He, K. et al. Deleterious effect in endothelin receptor-mediated coronary artery smooth muscle contractility in high-salt diet rats. Nutr Metab Cardiovasc Dis. 2022; S0939-4753(22)00422-7. [CrossRef]
- Hunter, R.W.; Dhaun, N.; Bailey, M.A. The impact of excessive salt intake on human health. Nat Rev Nephrol. 2022; 18(5):321-335. [CrossRef]
- Jaques, D.A.; Wuerzner, G.; Ponte, B. Sodium Intake as a Cardiovascular Risk Factor: A Narrative Review. Nutrients. 2021; 13(9):3177. [CrossRef]
- Dumančić, D.; Stupin, A.; Kožul, M.; Šerić, V.; Kibel, A.; Goswami, N. et al. Increased cerebral vascular resistance underlies preserved cerebral blood flow in response to orthostasis in humans on a high-salt diet. Eur J Appl Physiol. 2023. 123(4):923-933. [CrossRef]
- Carll, A.P.; Haykal-Coates, N.; Winsett, D.W.; Hazari, M.S.; Nyska, A.; Richards, J.H. et al. Dietary salt exacerbates isoproterenol-induced cardiomyopathy in rats. Toxicol Pathol. 2011; 39(6):925-37. [CrossRef]
- Xu, H.; Qing, T.; Shen, Y.; Huang, J.; Liu, Y.; Li, J. et al. RNA-seq analyses the effect of a high-salt diet on hypertension. Gene. 2018; 677:245-250. [CrossRef]
- Yim, J.; Cho, H.; Rabkin, S.W. Gene expression and gene associations during the development of heart failure with preserved ejection fraction in the Dahl salt-sensitive model of hypertension. Clin Exp Hypertens. 2018; 40(2):155-166. [CrossRef]
- Chen, X.; Wu, H.; Huang, S. Excessive Sodium Intake Leads to Cardiovascular Disease by Promoting Sex-Specific Dysfunction of Murine Heart. Front Nutr. 2022; 9:830738. [CrossRef]
- Corona, G.; Giuliani, C.; Parenti, G.; Norello, D.; Verbalis, J.G.; Forti, G. et al. Moderate Hyponatremia Is Associated with Increased Risk of Mortality: Evidence from a Meta-Analysis. PLOS ONE. 2013; 8:e80451. [CrossRef]
- Iacobas, D.A.; Xi, L. Theory and Applications of the (Cardio) Genomic Fabric Approach to Post-Ischemic and Hypoxia-Induced Heart Failure. J Pers Med. 2022; 12(8):1246. [CrossRef]
- Adesse, D.; Goldenberg, R.C.; Fortes, F.S.; Jasmin, Iacobas, D.A.; Iacobas, S. et al. Gap junctions and Chagas disease. Adv Parasitol. 2011; 76:63-81. [CrossRef]
- Adesse, D.; Iacobas, D.A.; Iacobas, S.; Garzoni, L.R.; Meirelles Mde, N.; Tanowitz, H.B. et al. Transcriptomic signatures of alterations in a myoblast cell line infected with four distinct strains of Trypanosoma cruzi. Am J Trop Med Hyg. 2010; 82(5):846-54. [CrossRef]
- Boudina, S.; Abel, E.D. Diabetic cardiomyopathy, causes, and effects. Rev Endocr Metab Disord. 2010; 11(1):31-9. [CrossRef]
- Xu, C.; Liu, C.; Xiong, J.; Yu, J. Cardiovascular aspects of the (pro)renin receptor: Function and significance. FASEB J. 2022; 36(4):e22237. [CrossRef]
- Luk, A.; Ahn, E.; Soor, G.S.; Butany, J. Dilated cardiomyopathy: a review. J Clin Pathol 2009; 62:219-25. [CrossRef]
- Fatkin, D.; Graham, R.M. Molecular mechanisms of inherited cardiomyopathies. Physiol Rev 2002; 82:945-80. [CrossRef]
- Akhtar, H.; Al Sudani, H.; Hussein, M.; Farhan, M.U.N.; Elkholy, K. Effects of Renin-Angiotensin-Aldosterone System Inhibition on Left Ventricular Hypertrophy, Diastolic Function, and Functional Status in Patients With Hypertrophic Cardiomyopathy: A Systematic Review. Cureus. 2022; 14(7):e26642. [CrossRef]
- Kyoto Encyclopedia of Genes and Genomes. Wiring diagrams of molecular interactions, reactions and relations. Available on line at: https://www.genome.jp/kegg/pathway.html. Accessed on Jan 7th, 2024.
- Transcriptomic effects of law salt diet on the mouse left ventricle. Available online at: https://www.ncbi.nlm.nih.gov/geo/query/acc.cgi?acc=GSE72561. Accessed 1/27/2023.
- P-Value from Pearson (R) Calculator. Available online at: https://www.socscistatistics.com/pvalues/pearsondistribution.aspx (accessed 12/27/2023).
- Iacobas, S.; Ede, N.; Iacobas, D.A. The Gene Master Regulators (GMR) Approach Provides Legitimate Targets for Personalized, Time-Sensitive Cancer Gene Therapy. Genes (Basel). 2019; 10(8):560. [CrossRef]
- Iacobas, S.; Iacobas, D.A. A Personalized Genomics Approach of the Prostate Cancer. Cells. 2021; 10(7):1644. [CrossRef]
- Fructose and manose metabolism. Available online at: https://www.genome.jp/pathway/mmu00051. Accessed 1/11/2024.
- Galactose metabolism. Available online at: https://www.genome.jp/kegg-bin/show_pathway?mmu00052. Accessed 1/11/2024.
- Glycolysis/Glucogenesis. Available online at: https://www.genome.jp/pathway/mmu00010. Accessed 1/11/2024.
- Inositol phosphate metabolism. Available online at: https://www.genome.jp/kegg-bin/show_pathway?mmu00562. Accessed 1/11/2024.
- Oxidative phosphorylation. Available online at: https://www.genome.jp/kegg-bin/show_pathway?mmu00190. Accessed 1/11/2024.
- Fatty acid biosynthesis. Available online at: https://www.genome.jp/kegg-bin/show_pathway?mmu00061. Accessed 1/11/2024.
- Glycerolipid metabolism. Available online at: https://www.genome.jp/kegg-bin/show_pathway?mmu00561. Accessed 1/11/2024.
- Glycerophospholipid metabolism. Available online at: https://www.genome.jp/kegg-bin/show_pathway?mmu00564. Accessed 1/11/2024.
- Steroid biosynthesis. Available online at: https://www.genome.jp/kegg-bin/show_pathway?mmu00100. Accessed 1/11/2024.
- Steroid hormone biosynthesis. Available online at: https://www.genome.jp/kegg-bin/show_pathway?mmu00140. Accessed 1/11/2024.
- Purine metabolism. Available online at: https://www.genome.jp/kegg-bin/show_pathway?mmu00230. Accessed 1/11/2024.
- Pyrimidine metabolism. Available online at: https://www.genome.jp/kegg-bin/show_pathway?mmu00240. Accessed 1/11/2024.
- Cysteine and methionine metabolism. Available on line at: https://www.genome.jp/kegg-bin/show_pathway?mmu00270. Accessed 1/11/2024.
- Glutathione metabolism. Available on line at: https://www.genome.jp/kegg-bin/show_pathway?mmu00480. Accessed 1/11/2024.
- Thyrosine metabolism. Available on line at: https://www.genome.jp/kegg-bin/show_pathway?mmu00350. Accessed 1/11/2024.
- Valine, leucine and isoleucine degradation. Available on line at: https://www.genome.jp/kegg-bin/show_pathway?mmu00280. Accessed 1/11/2024.
- N-Glycan biosynthesis. Available on line at: https://www.genome.jp/kegg-bin/show_pathway?mmu00510. Accessed 1/11/2024.
- Drug metabolism – cytochrome P450. Available on line at: https://www.genome.jp/kegg-bin/show_pathway?mmu00982. Accessed 1/11/2024.
- Drug metabolism – other enzymes. Available on line at: https://www.genome.jp/kegg-bin/show_pathway?mmu00983. Accessed 1/11/2024.
- Adrenergic signaling in cardiomyocytes. Available on line at: https://www.genome.jp/kegg-bin/show_pathway?mmu04261. Accessed 1/11/2024.
- Cardiac muscle contraction. Available on line at: https://www.genome.jp/kegg-bin/show_pathway?mmu04260. Accessed 1/11/2024.
- Chagas disease. Available on line at: https://www.genome.jp/kegg-bin/show_pathway?mmu05142. Accessed 1/11/2024.
- Diabetic cardiomyopathy. Available on line at: https://www.genome.jp/kegg-bin/show_pathway?mmu05415. Accessed 1/11/2024.
- Dilated cardiomyopathy. Available on line at: https://www.genome.jp/kegg-bin/show_pathway?mmu05414. Accessed 1/11/2024.
- Hypertrophic cardiomyopathy. Available on line at: https://www.genome.jp/kegg-bin/show_pathway?mmu05410. Accessed 1/11/2024.
- MAPK signaling pathway. Available on line at https://www.genome.jp/kegg-bin/show_pathway?hsa04010. Accessed 1/11/2024.
- PIK3-Akt signaling pathway. Available on line at https://www.genome.jp/kegg-bin/show_pathway?hsa04151. Accessed 1/11/2024.
- Rap1 signaling pathway. Available on line at https://www.genome.jp/kegg-bin/show_pathway?hsa04015. Accessed 1/11/2024.
- Ras signaling pathway. Available on line at https://www.genome.jp/kegg-bin/show_pathway?hsa04014. Accessed 1/11/2024.
- Chemokine signaling pathway. Available on line at https://www.genome.jp/kegg-bin/show_pathway?hsa04062. Accessed 1/11/2023.
- Calcium signaling pathway. Available on line at https://www.genome.jp/kegg-bin/show_pathway?hsa04020. Accessed 1/11/2024.
- CAMP signaling pathway. Available on line at https://www.genome.jp/kegg-bin/show_pathway?hsa04024. Accessed 1/11/2024.
- CGMP-PKG signaling pathway. Available on line at https://www.genome.jp/kegg-bin/show_pathway?hsa04022. Accessed 1/11/2024.
- MTOR signaling pathway. Available on line at https://www.genome.jp/kegg-bin/show_pathway?hsa04150. Accessed 1/11/2024.
- Wnt signaling pathway. Available on line at https://www.genome.jp/kegg-bin/show_pathway?hsa04310. Accessed 1/11/2024.
- Central carbon metabolism in cancer. Available on line at: https://www.genome.jp/kegg-bin/show_pathway?mmu05230. Accessed 1/11/2024.
- Choline metabolism in cancer. Available online at: https://www.genome.jp/kegg-bin/show_pathway?mmu05231. Accessed 1/11/2024.
- Bayne, E.F.; Rossler, K.J.; Gregorich, Z.R.; Aballo, T.J.; Roberts, D.S.; Chapman, E.A. et al. Top-down proteomics of myosin light chain isoforms define chamber-specific expression in the human heart. J Mol Cell Cardiol. 2023; 181:89-97. [CrossRef]
- Iacobas, S.; Amuzescu, B.; Iacobas, D.A. Transcriptomic uniqueness and commonality of the ion channels and transporters in the four heart chambers. Sci Rep. 2021; 11(1):2743. [CrossRef]
- Sun, J.H.; Liu, X.K.; Xing, X.W.; Yang, Y.; Xuan, H.H.; Fu, B.B. Value of Cardiac Troponin, Myoglobin Combined with Heart-type Fatty Acid-binding Protein Detection in Diagnosis of Early Acute Myocardial Infarction. Pak J Med Sci. 2023; 39(6):1690-1694. [CrossRef]
- Yu, M.; Tcheandjieu, C.; Georges, A.; Xiao, K.; Tejeda, H.; Dina, C. et al. Computational estimates of annular diameter reveal genetic determinants of mitral valve function and disease. JCI Insight. 2022; 7(3):e146580. [CrossRef]
- Ning, Z.; Huang, Y.; Lu, H.; Zhou, Y, Tu T, Ouyang F et al. Novel Drug Targets for Atrial Fibrillation Identified Through Mendelian Randomization Analysis of the Blood Proteome. Cardiovasc Drugs Ther. 2023. [CrossRef]
- Iacobas, D.A.; Iacobas, S.; Chachua, T.; Goletiani, C.; Sidyelyeva, G.; Velíšková, J. et al. Prenatal corticosteroids modify glutamatergic and GABAergic synapse genomic fabric: insights from a novel animal model of infantile spasms. J Neuroendocrinol. 2013; 25(11):964-79. [CrossRef]
- Zhang, Y.; Zhao, G.; Yu, L.; Wang, X.; Meng, Y.; Mao, J. et al. Heat-shock protein 90α protects NME1 against degradation and suppresses metastasis of breast cancer. Br J Cancer. 2023; 129(10):1679-1691. [CrossRef]
- Jarrar, Y.; Zihlif, M.; Al Bawab, A.Q.; Sharab, A. Effects of Intermittent Hypoxia on Expression of Glucose Metabolism Genes in MCF7 Breast Cancer Cell Line. Curr Cancer Drug Targets. 2020; 20(3):216-222. [CrossRef]
- Iacobas, D.A.; Iacobas, S.; Lee, P.R.; Cohen, J.E.; Fields, R.D. Coordinated Activity of Transcriptional Networks Responding to the Pattern of Action Potential Firing in Neurons. Genes (Basel). 2019; 10(10):754. [CrossRef]
- Iacobas, D.A.; Obiomon, E.A.; Iacobas, S. Genomic Fabrics of the Excretory System’s Functional Pathways Remodeled in Clear Cell Renal Cell Carcinoma. Current Issues in Molecular Biology. 2023; 45(12):9471-9499. [CrossRef]
- Guo, G.L.; Sun, L.Q.; Sun, M.H.; Xu, H.M. LncRNA SLC8A1-AS1 protects against myocardial damage through activation of the cGMP-PKG signaling pathway by inhibiting SLC8A1 in mice models of myocardial infarction. J Cell Physiol. 2019; 234(6):9019-9032. [CrossRef]
- Sommer, N.; Hüttemann, M.; Pak, O.; Scheibe, S.; Knoepp, F.; Sinkler, C.; Malczyk, M. et al. Mitochondrial Complex IV Subunit 4 Isoform 2 Is Essential for Acute Pulmonary Oxygen Sensing. Circ Res. 2017; 121(4):424-438. [CrossRef]
- Bayer, A.L.; Alcaide, P. MyD88: At the heart of inflammatory signaling and cardiovascular disease. J Mol Cell Cardiol. 2021; 161:75-85. [CrossRef]
- Geering, K. Function of FXYD proteins, regulators of Na, K-ATPase. J Bioenerg Biomembr. 2005; 37(6):387-92. [CrossRef]
- Nordin, H.; Nakagawa, R.; Wallin, M.; Pernow, J.; Kass, D.A.; Ståhlberg, M. Regional protein expression changes within the left ventricle in a mouse model of dyssynchronous and resynchronized heart failure. ESC Heart Fail. 2020; 7(6):4438-4442. [CrossRef]
- Yusuf, A.M.; Qaisar, R.; Al-Tamimi, A.O.; Jayakumar, M.N.; Woodgett, J.R.; Koch, W.J. et al. Cardiomyocyte-GSK-3β deficiency induces cardiac progenitor cell proliferation in the ischemic heart through paracrine mechanisms. J Cell Physiol. 2022; 37(3):1804-1817. [CrossRef]
- Munasinghe, P.E.; Saw, E.L.; Reily-Bell, M.; Tonkin, D.; Kakinuma, Y.; Fronius, M. et al. Non-neuronal cholinergic system delays cardiac remodeling in type 1 diabetes. Heliyon. 2023; 9(6):e17434. [CrossRef]
- Zhang, W.; Jiang, H.; Huang, P.; Wu, G.; Wang, Q.; Luan, X. et al. Dracorhodin targeting CMPK2 attenuates inflammation: A novel approach to sepsis therapy. Clin Transl Med. 2023; 13(10):e1449. [CrossRef]
- Gérus, M.; Bonnart, C.; Caizergues-Ferrer, M.; Henry, Y.; Henras, A.K. Evolutionarily conserved function of RRP36 in early cleavages of the pre-rRNA and production of the 40S ribosomal subunit. Mol Cell Biol. 2010; 30(5):1130-44. [CrossRef]
- Drouard, G.; Hagenbeek, F.A.; Whipp, A.; Pool, R. et al., BIOS Consortium; BBMRI-NL Metabolomics Consortium et al.. Longitudinal multi-omics study reveals common etiology underlying association between plasma proteome and BMI trajectories in adolescent and young adult twins. BMC Med. 2023; 21(1):508. [CrossRef]
- Bassaganyas, L.; Popa, S.J.; Horlbeck, M.; Puri, C.; Stewart, S.E.; Campelo, F. et al. New factors for protein transport identified by a genome-wide CRISPRi screen in mammalian cells. J Cell Biol. 2019; 218(11):3861-3879. [CrossRef]
- Yu, Y.; Chen, G.; Jiang, C.; Guo, T.; Tang, H.; Yuan, Z. et al. USP31 serves as a potential biomarker for predicting prognosis and immune responses for clear cell renal cell carcinoma via single-cell and bulk RNA-sequencing. J Gene Med. 2023: e3594. [CrossRef]
- Iacobas, D.A.; Mgbemena, V.E.; Iacobas, S.; Menezes, K.M.; Wang, H.; Saganti, P.B. Genomic Fabric Remodeling in Metastatic Clear Cell Renal Cell Carcinoma (ccRCC): A New Paradigm and Proposal for a Personalized Gene Therapy Approach. Cancers (Basel). 2020; 12(12):3678. [CrossRef]
- Kristofova, M.; Ori, A.; Wang, Z.Q. Multifaceted Microcephaly-Related Gene MCPH1. Cells. 2022; 11(2):275. [CrossRef]
- Martínez-Moreno, R.; Carreras, D.; Sarquella-Brugada, G.; Pérez, G.J.; Selga, E.; Scornik, F.S. et al. Loss of sodium current caused by a Brugada syndrome-associated variant is determined by patient-specific genetic background. Heart Rhythm. 2023: S1547-5271(23)02966-1. [CrossRef]
- Balestrini, S.; Mikati, M.A.; Álvarez-García-Rovés, R.; Carboni, M.; Hunanyan, A.S.; Kherallah, B. et al. Cardiac phenotype in ATP1A3-related syndromes: A multicenter cohort study. Neurology. 2020; 95(21):e2866-e2879. [CrossRef]
- Slack, R.J.; Macdonald, S.J.F.; Roper, J.A.; Jenkins, R.G.; Hatley, R.J.D. Emerging therapeutic opportunities for integrin inhibitors. Nat Rev Drug Discov. 2022; 21(1):60-78. [CrossRef]
- Song, Z.; Tian, X.; Shi, Q. Fas, Caspase-8, and Caspase-9 pathway-mediated bile acid-induced fetal cardiomyocyte apoptosis in intrahepatic cholestasis pregnant rat models. J Obstet Gynaecol Res. 2021; 47(7):2298-2306. [CrossRef]
- Pahlavani, H.A. Exercise-induced signaling pathways to counteracting cardiac apoptotic processes. Front Cell Dev Biol. 2022; 10:950927. [CrossRef]
- Iacobas, D.A.; Iacobas, S.; Tanowitz, H.B.; Campos de Carvalho, A.; Spray, D.C. Functional genomic fabrics are remodeled in a mouse model of Chagasic cardiomyopathy and restored following cell therapy. Microbes Infect. 2018; 20(3):185-195. [CrossRef]
- Nisimura, L.M.; Coelho, L.L.; de Melo, T.G.; Vieira, P.C.; Victorino, P.H.; Garzoni, L.R. et al. Trypanosoma cruzi Promotes Transcriptomic Remodeling of the JAK/STAT Signaling and Cell Cycle Pathways in Myoblasts. Front Cell Infect Microbiol. 2020; 10:255. [CrossRef]
- Kolobarić, N.; Mihalj, M.; Kozina, N.; Matić, A.; Mihaljević, Z.; Jukić, I. et al. Tff3-/- Knock-Out Mice with Altered Lipid Metabolism Exhibit a Lower Level of Inflammation following the Dietary Intake of Sodium Chloride for One Week. Int J Mol Sci. 2023; 24(8):7315. [CrossRef]
- Bochi, A.P.G.; Ferreira, G.D.S.; Del Bianco, V.; Pinto, P.R.; Rodrigues, L.G.; Trevisani, M.D.S. et al. Aerobic Exercise Training Reduces Atherogenesis Induced by Low-Sodium Diet in LDL Receptor Knockout Mice. Antioxidants (Basel). 2022; 11(10):2023. [CrossRef]
- Launonen, H.; Pang, Z.; Linden, J.; Siltari, A.; Korpela, R.; Vapaatalo, H. Evidence for local aldosterone synthesis in the large intestine of the mouse. J Physiol Pharmacol. 2021; 72(5). [CrossRef]
Figure 1.
The independence of: (a). AVEs, (b). REVs, and (c). CORs (with Slc8a1) of the 55 genes quantified within the KEGG-constructed pathway Glycolysis/Glucogenesis (GLY, [33]). Note the independence of the three characteristics and the changes induced in each of them by the low-salt diet.
Figure 1.
The independence of: (a). AVEs, (b). REVs, and (c). CORs (with Slc8a1) of the 55 genes quantified within the KEGG-constructed pathway Glycolysis/Glucogenesis (GLY, [33]). Note the independence of the three characteristics and the changes induced in each of them by the low-salt diet.
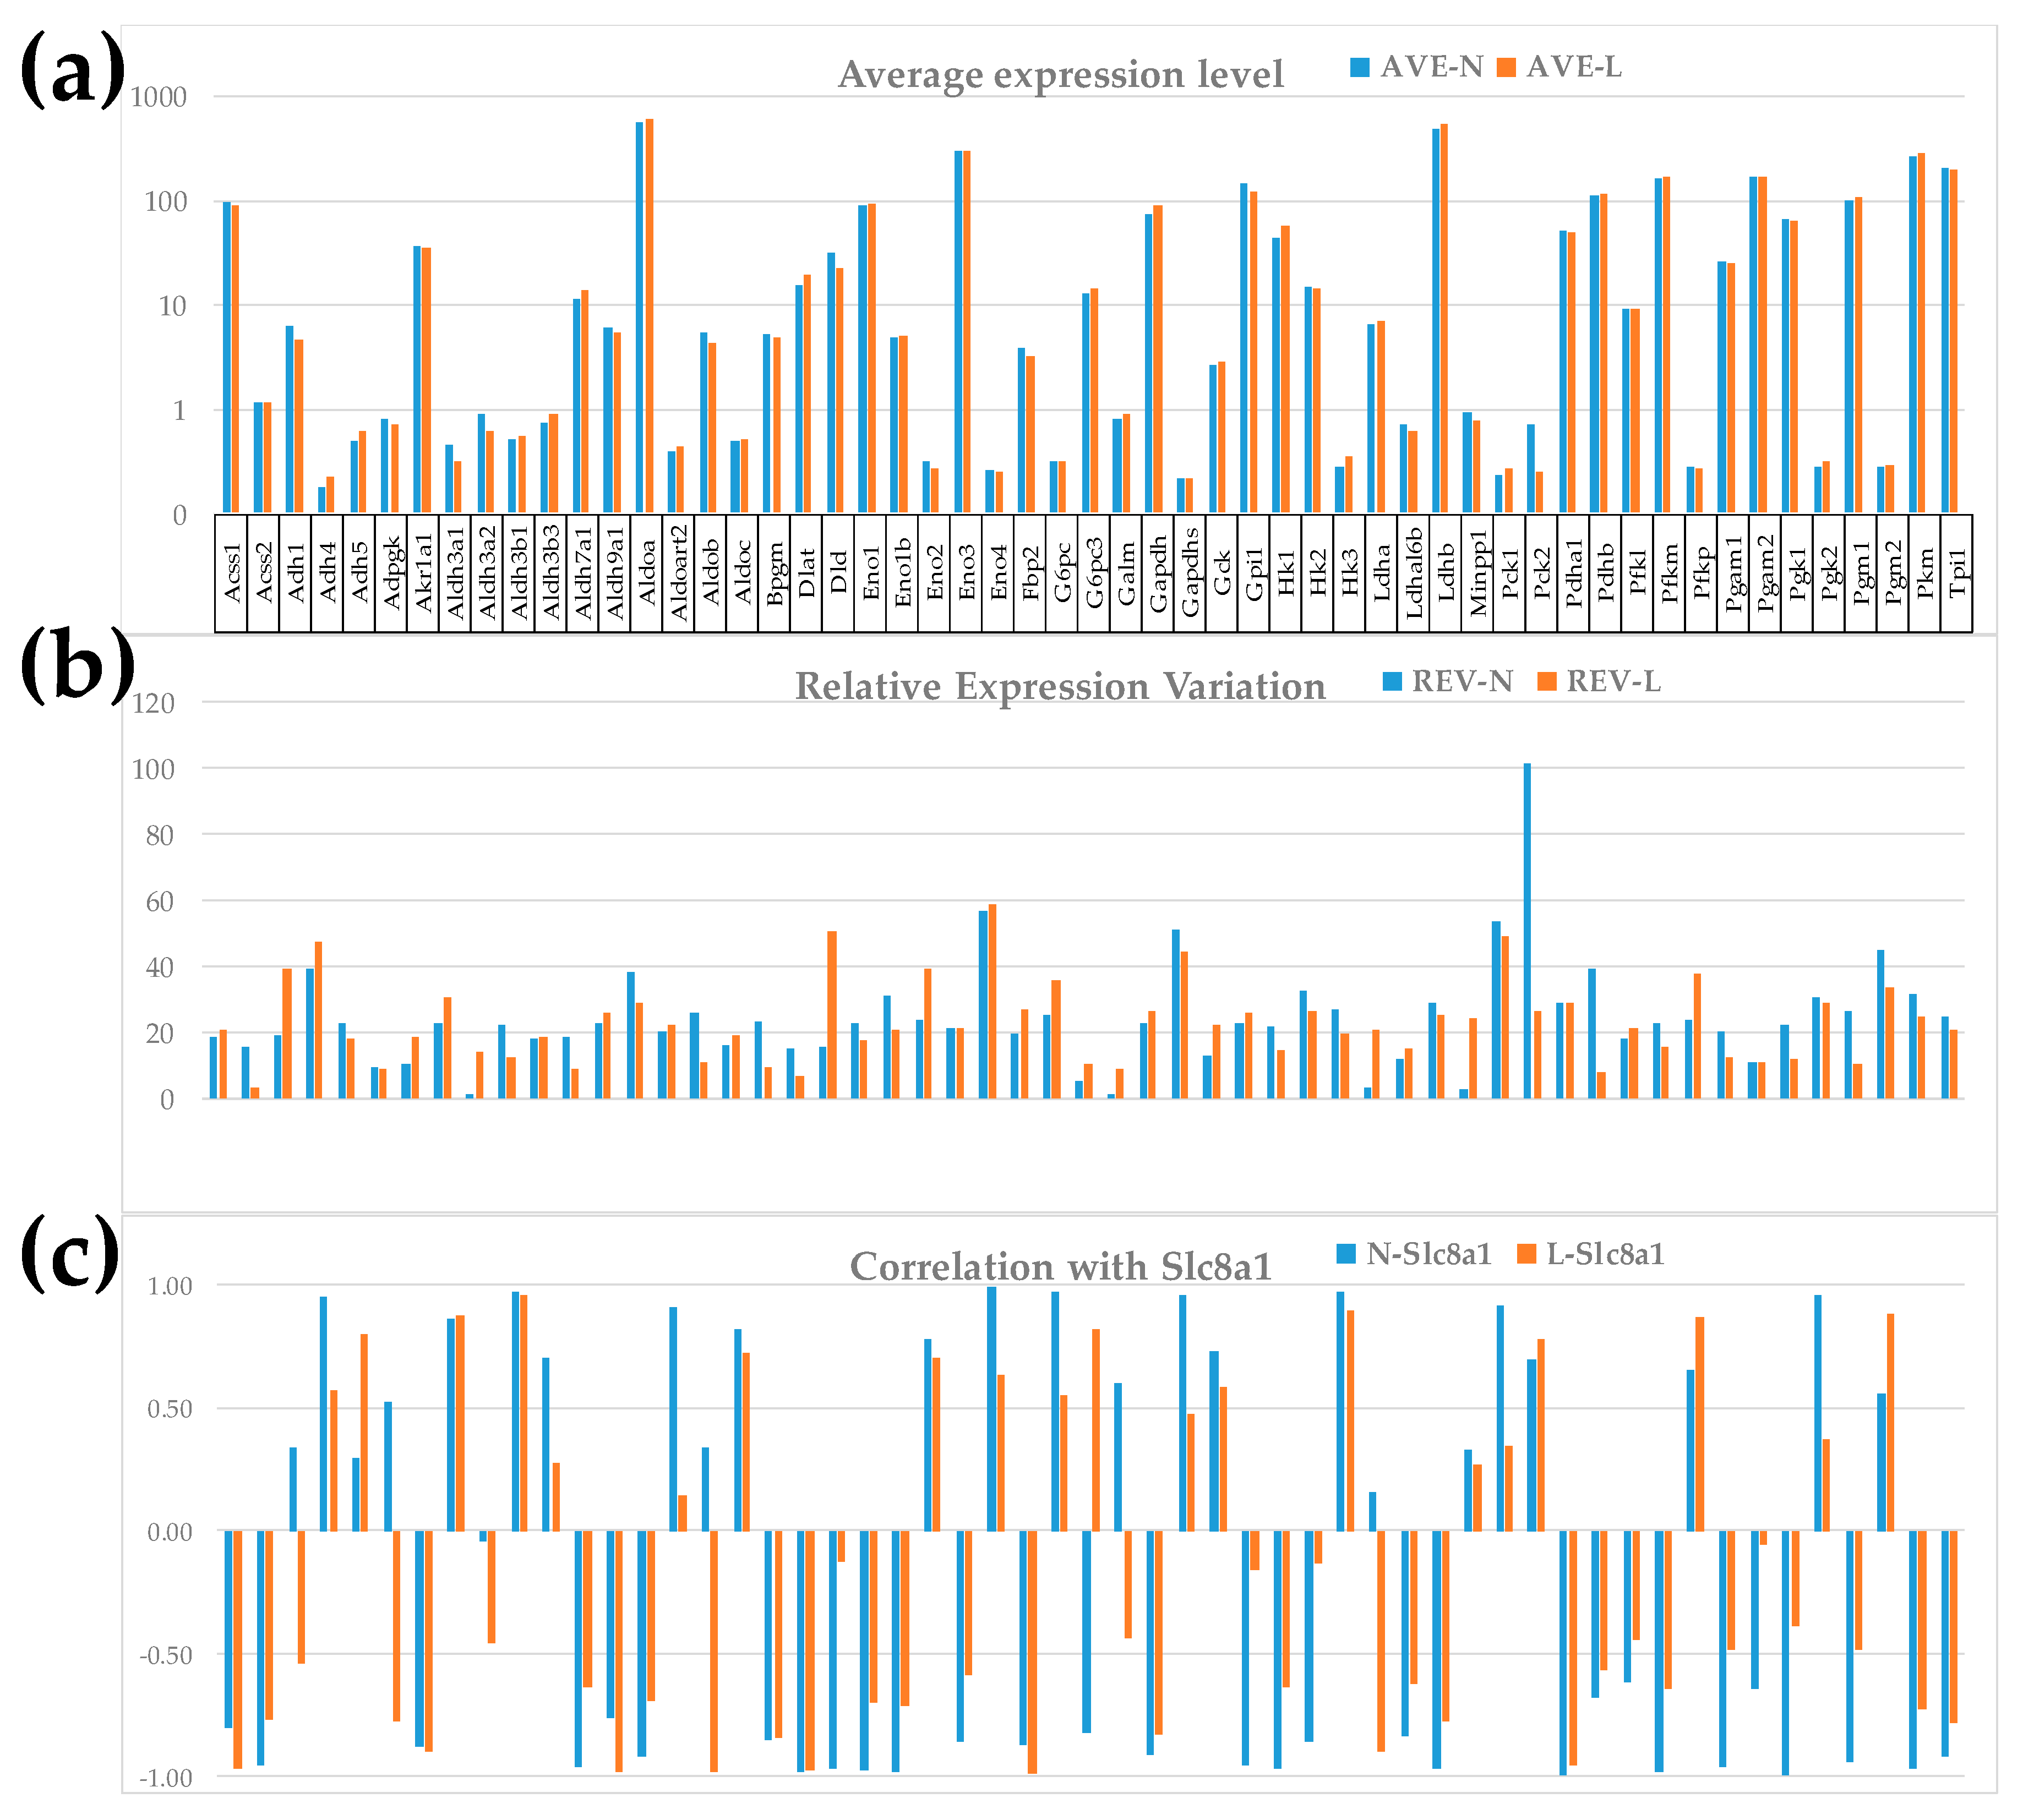
Figure 2.
Derived characteristics of 55 genes involved in the KEGG-constructed pathway Glycolysis/Glucogenesis [33]: (a). Relative Expression Control (REC), (b). Coordination Degree (COORD), (c). Gene Commanding Height (GCH). Note the changes induced by the low-salt diet.
Figure 2.
Derived characteristics of 55 genes involved in the KEGG-constructed pathway Glycolysis/Glucogenesis [33]: (a). Relative Expression Control (REC), (b). Coordination Degree (COORD), (c). Gene Commanding Height (GCH). Note the changes induced by the low-salt diet.
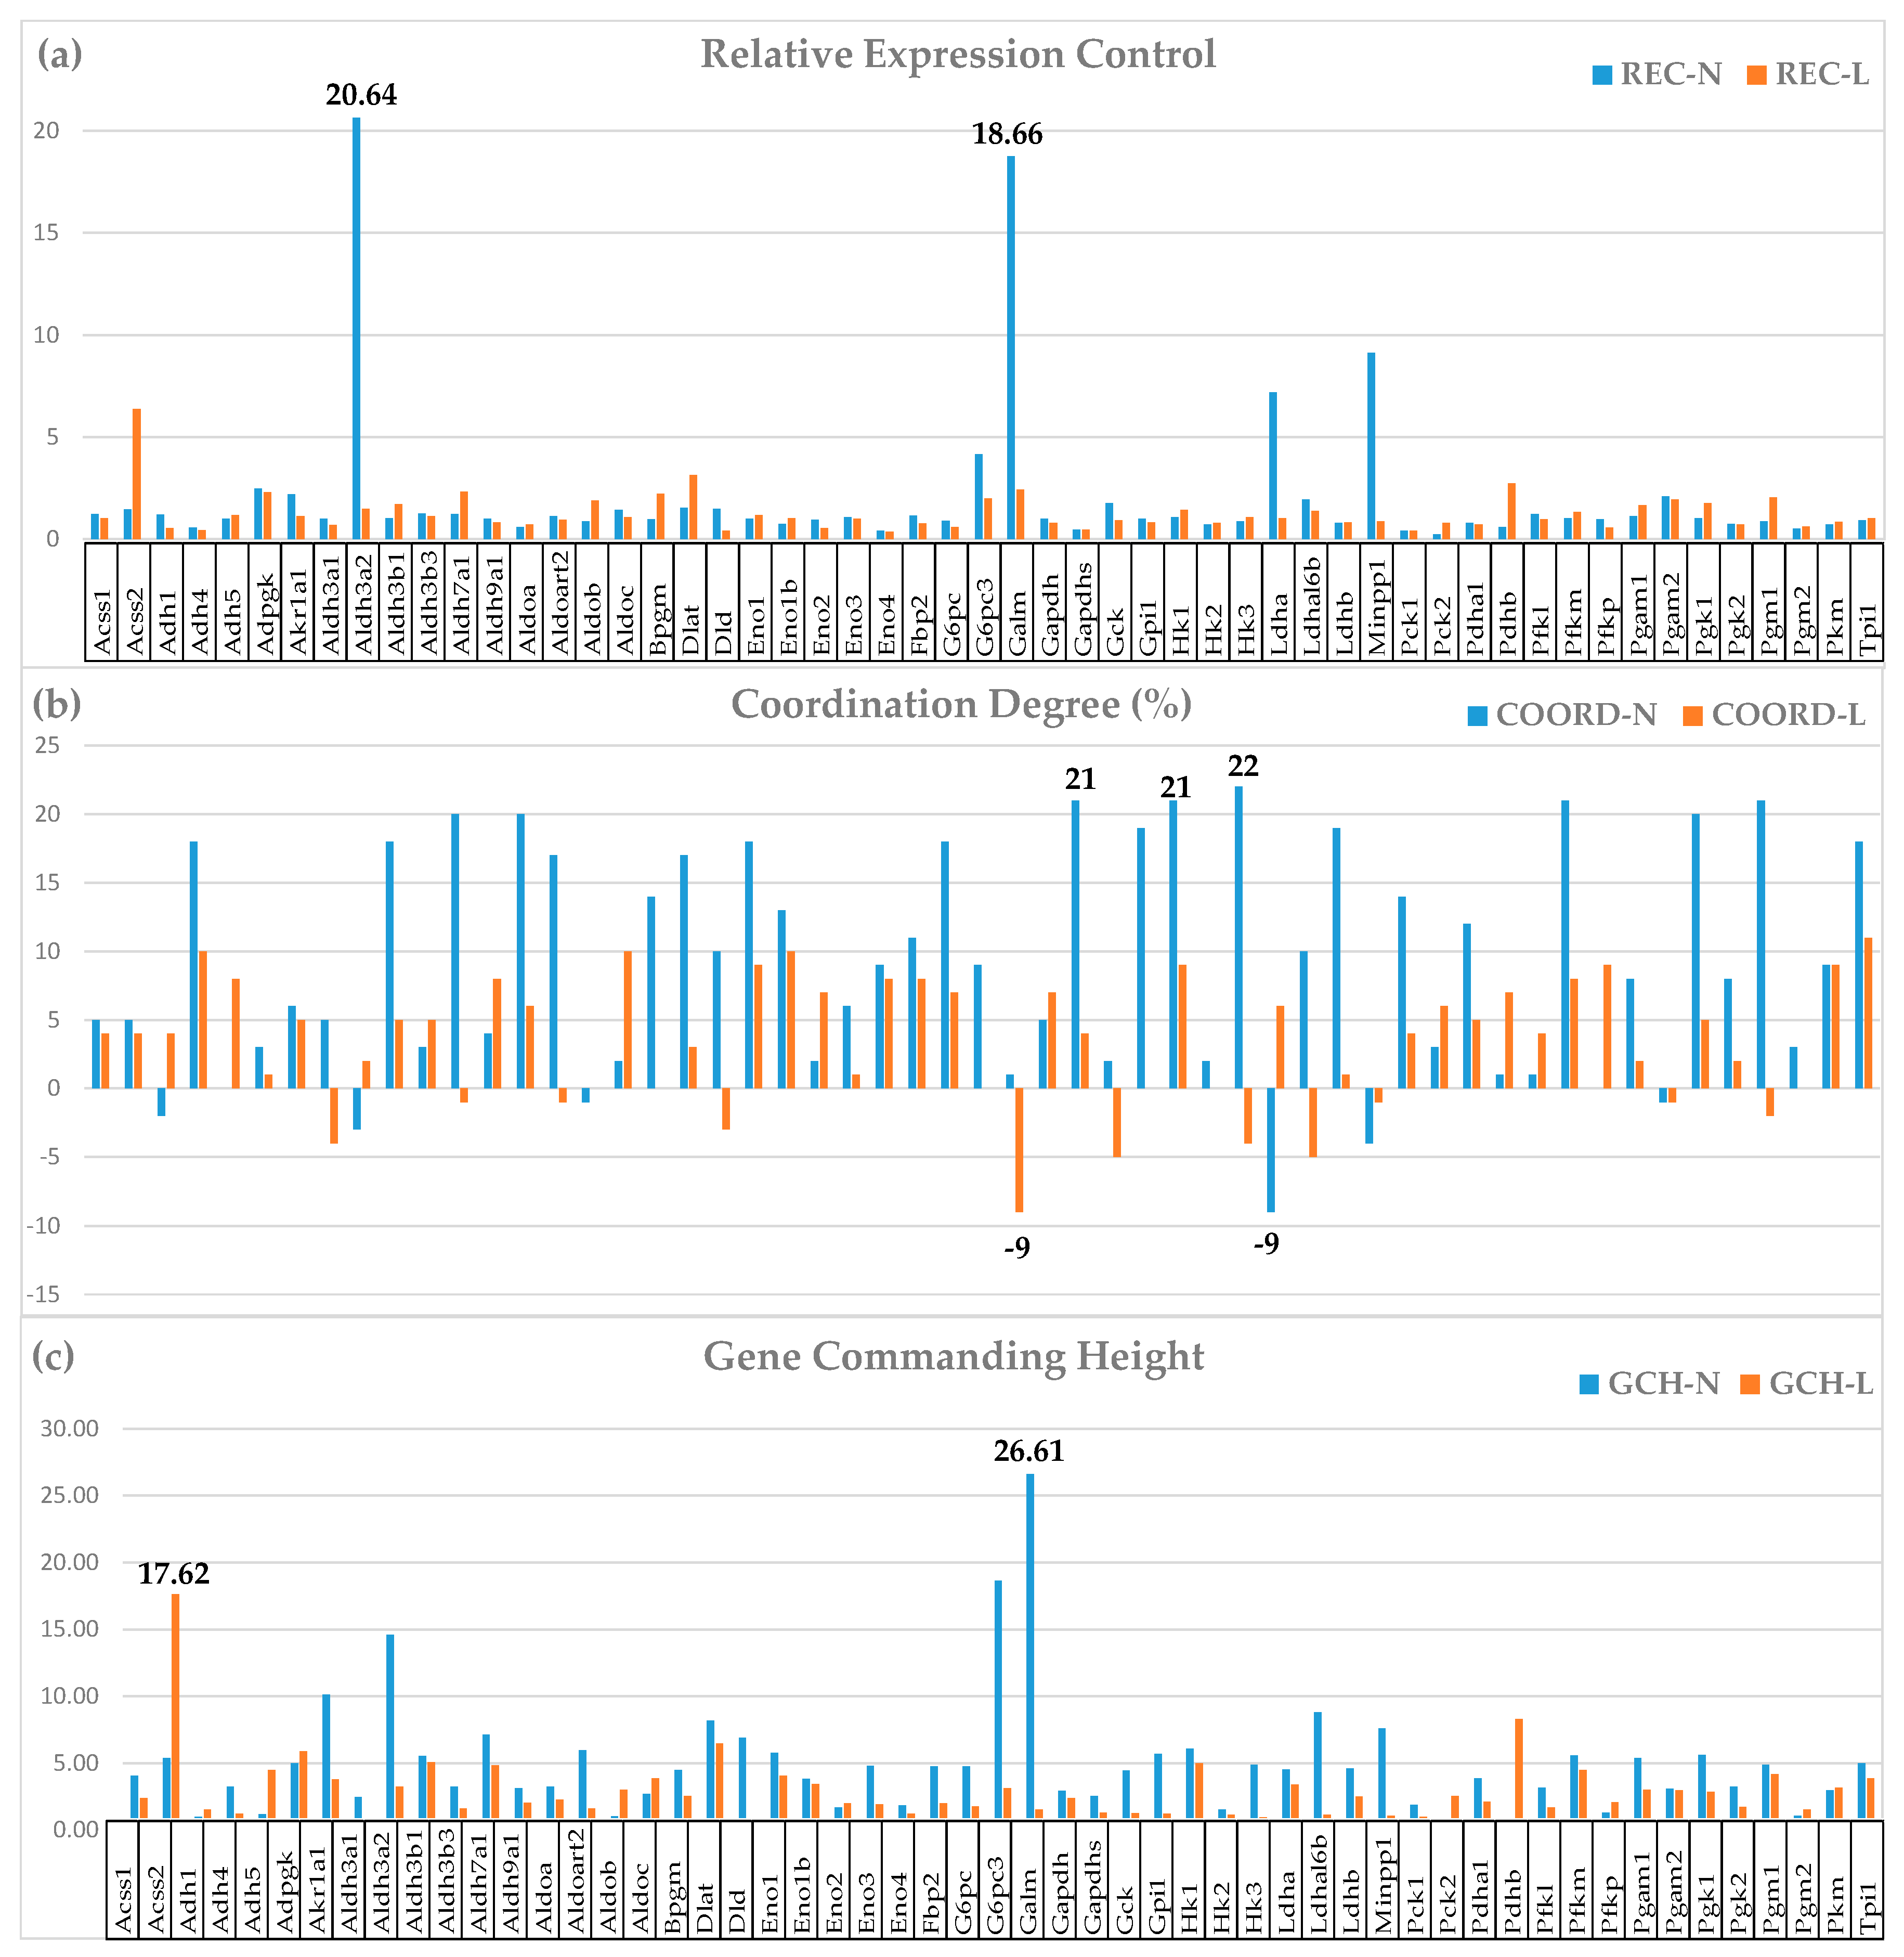
Figure 3.
Four regulation measures of the transcriptomic characteristics of 50 randomly selected purine metabolism (PUM, [41]) genes: (a) Uniform +1/-1 contributions (used to calculate the percentages of up-/down-regulated genes); (b) Weighted Individual Regulation (WIR); (c) Regulation of the Expression Control; (d) Regulation of the Coordination Degree. Note that all measures but Uniform quantify all genes and discriminate their contributions.
Figure 3.
Four regulation measures of the transcriptomic characteristics of 50 randomly selected purine metabolism (PUM, [41]) genes: (a) Uniform +1/-1 contributions (used to calculate the percentages of up-/down-regulated genes); (b) Weighted Individual Regulation (WIR); (c) Regulation of the Expression Control; (d) Regulation of the Coordination Degree. Note that all measures but Uniform quantify all genes and discriminate their contributions.
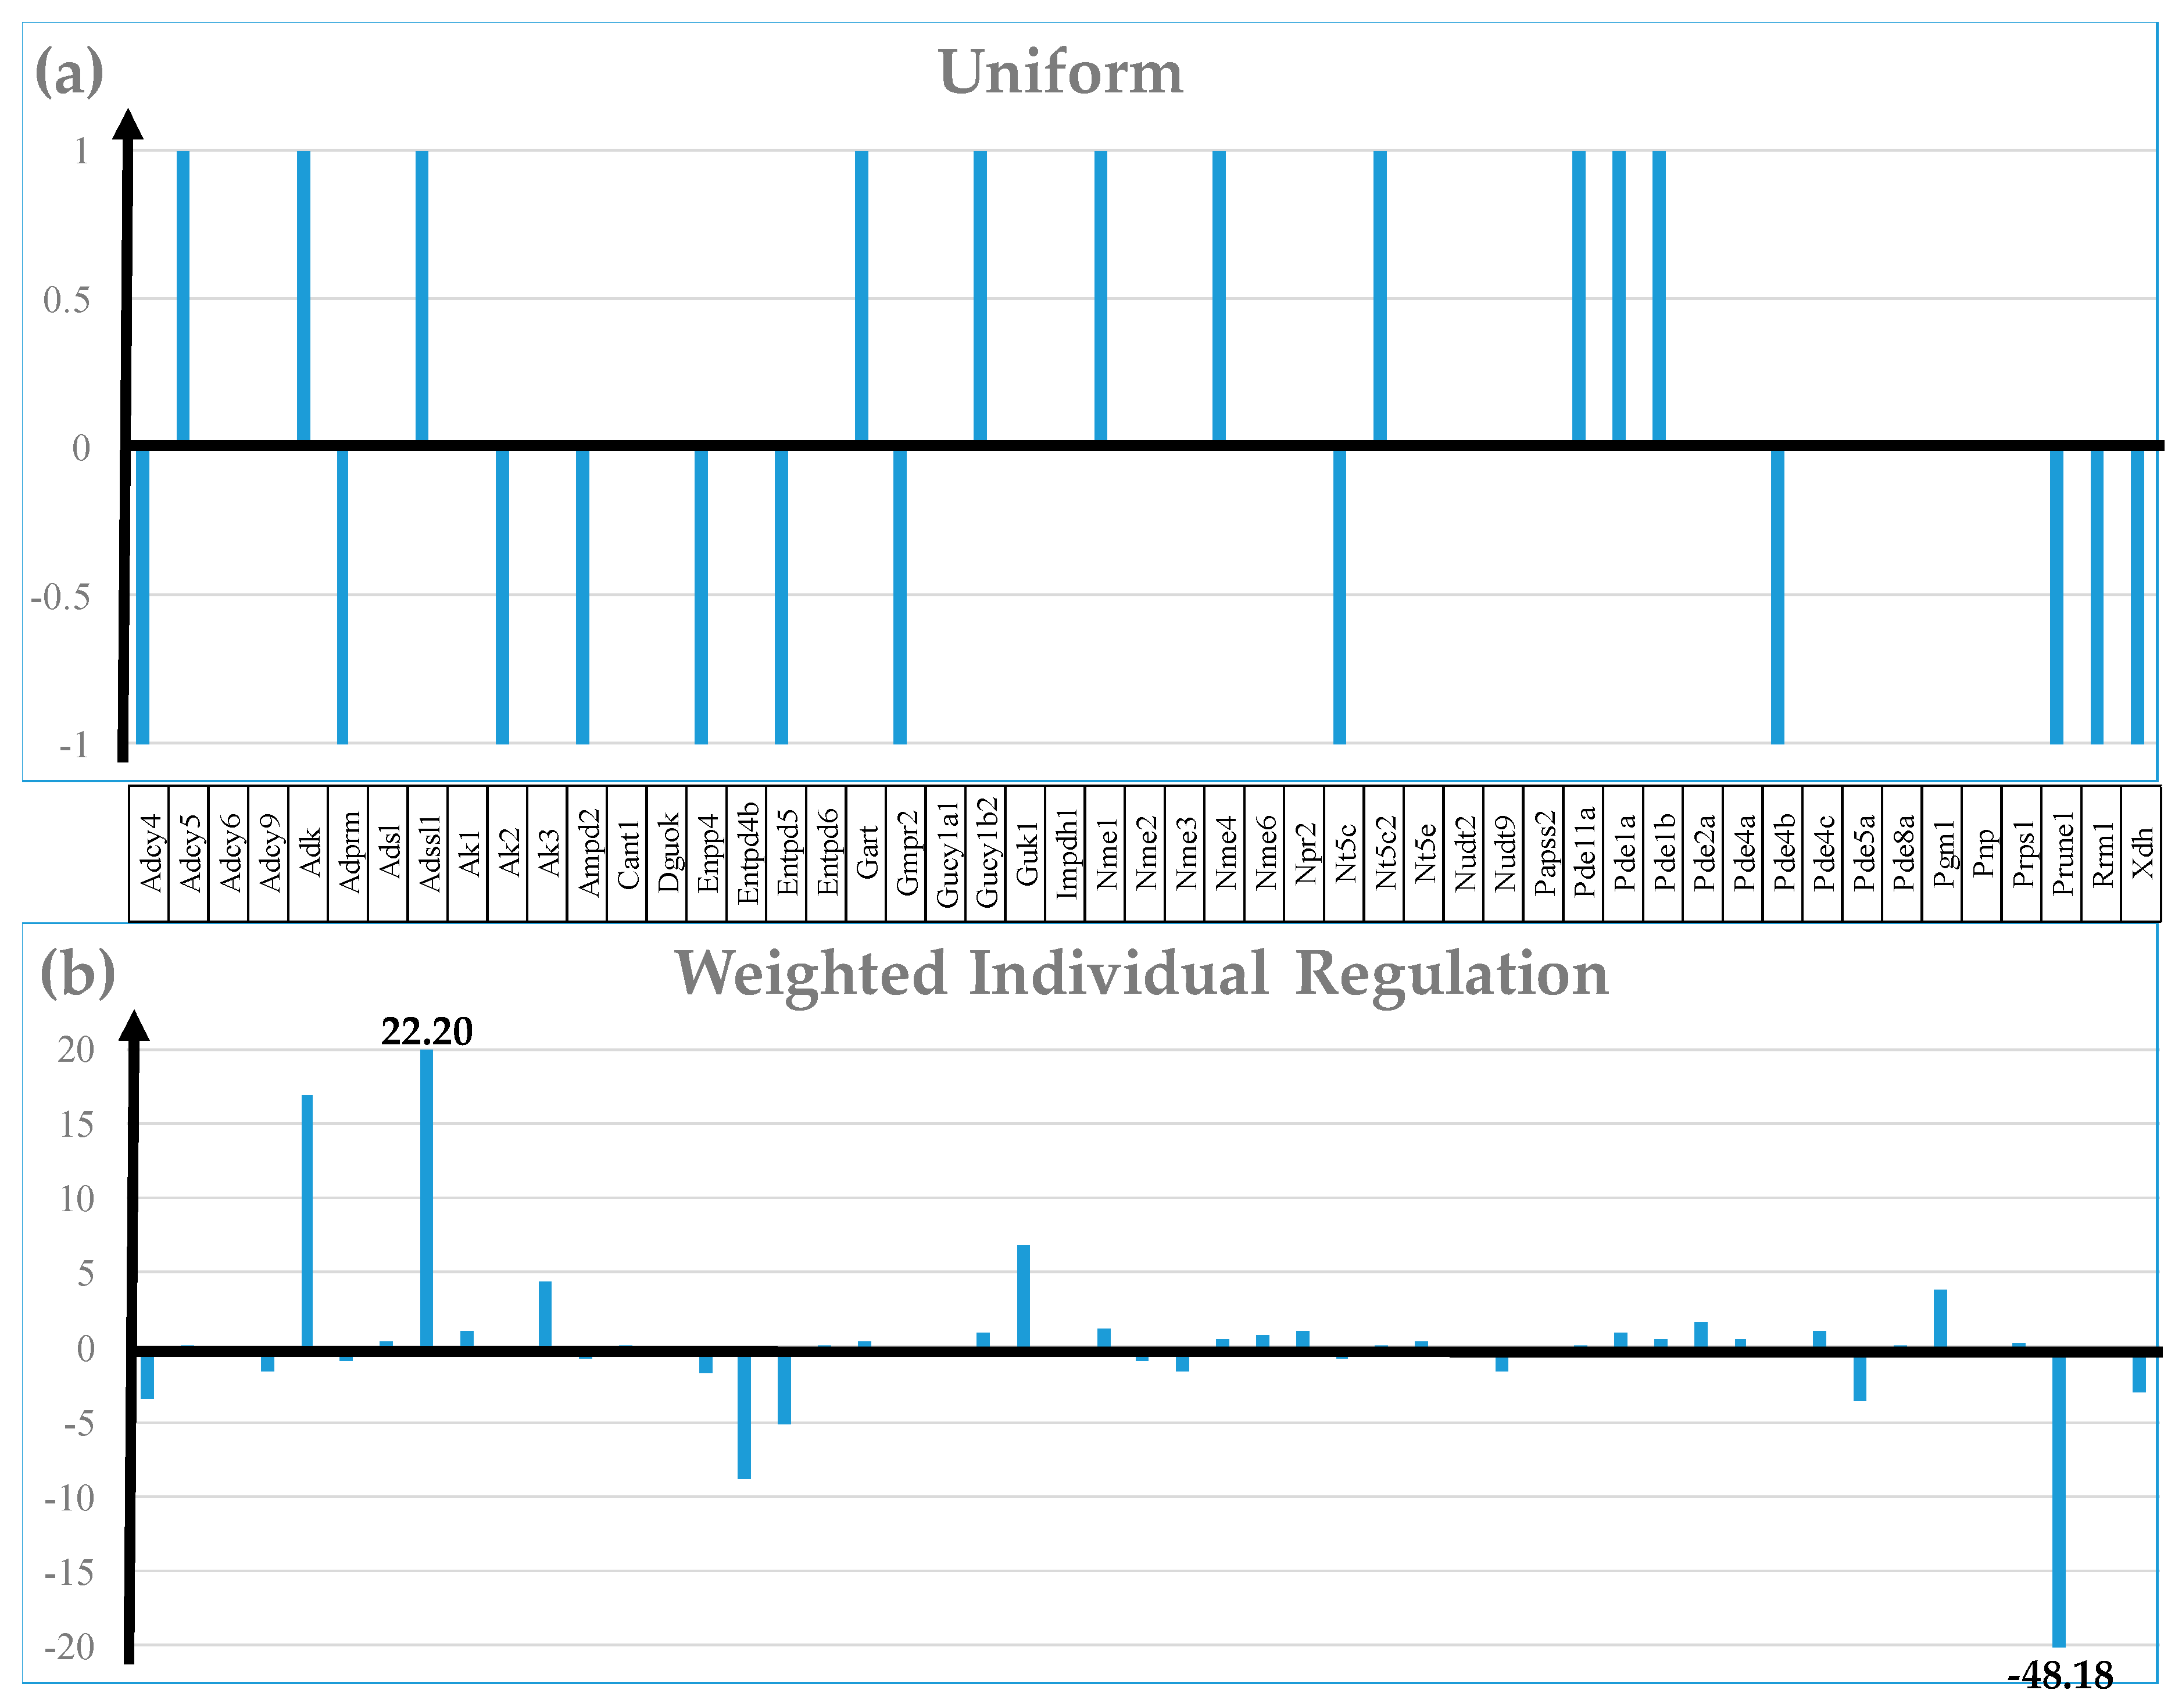
Figure 4.
Regulated genes in the KEGG-constructed pathway Adrenergic signaling in cardiomyocyte [50]. Owing to space constraints, several genes sharing the same position in the pathway were grouped into blocks of genes presented in panels. Regulated genes: Adcy1/4/5 (adenylate cyclase 1/4/5), Akt1/3 (thymoma viral proto-oncogene 1/3), Atf6b (activating transcription factor 6 beta), Atp1a3 (ATPase, Na+/K+ transporting, alpha 3 polypeptides), Bcl2 (B cell leukemia/lymphoma 2), Cacnb2 (calcium channel, voltage-dependent, beta 2 subunit), Calm3 (calmodulin 3), Crem (cAMP responsive element modulator), Fxyd2 (FXYD domain-containing ion transport regulator 2), Mapk1 (mitogen-activated protein kinase 1), Myh6/7 (myosin, heavy polypeptide 6, cardiac muscle, alpha/7, cardiac muscle, beta), Myl2/4 (myosin, light polypeptide 2/4), Ppp2r2a/5a (protein phosphatase 2, regulatory subunit B, alpha/regulatory subunit B’, alpha), Prkaca (protein kinase, cAMP-dependent, catalytic, alpha), Prkca (protein kinase C, alpha), Scn1b (sodium channel, voltage-gated, type I, beta), Scn5a (sodium channel, voltage-gated, type V, alpha), Tpm1/2 (tropomyosin 1 alpha/2 beta).
Figure 4.
Regulated genes in the KEGG-constructed pathway Adrenergic signaling in cardiomyocyte [50]. Owing to space constraints, several genes sharing the same position in the pathway were grouped into blocks of genes presented in panels. Regulated genes: Adcy1/4/5 (adenylate cyclase 1/4/5), Akt1/3 (thymoma viral proto-oncogene 1/3), Atf6b (activating transcription factor 6 beta), Atp1a3 (ATPase, Na+/K+ transporting, alpha 3 polypeptides), Bcl2 (B cell leukemia/lymphoma 2), Cacnb2 (calcium channel, voltage-dependent, beta 2 subunit), Calm3 (calmodulin 3), Crem (cAMP responsive element modulator), Fxyd2 (FXYD domain-containing ion transport regulator 2), Mapk1 (mitogen-activated protein kinase 1), Myh6/7 (myosin, heavy polypeptide 6, cardiac muscle, alpha/7, cardiac muscle, beta), Myl2/4 (myosin, light polypeptide 2/4), Ppp2r2a/5a (protein phosphatase 2, regulatory subunit B, alpha/regulatory subunit B’, alpha), Prkaca (protein kinase, cAMP-dependent, catalytic, alpha), Prkca (protein kinase C, alpha), Scn1b (sodium channel, voltage-gated, type I, beta), Scn5a (sodium channel, voltage-gated, type V, alpha), Tpm1/2 (tropomyosin 1 alpha/2 beta).
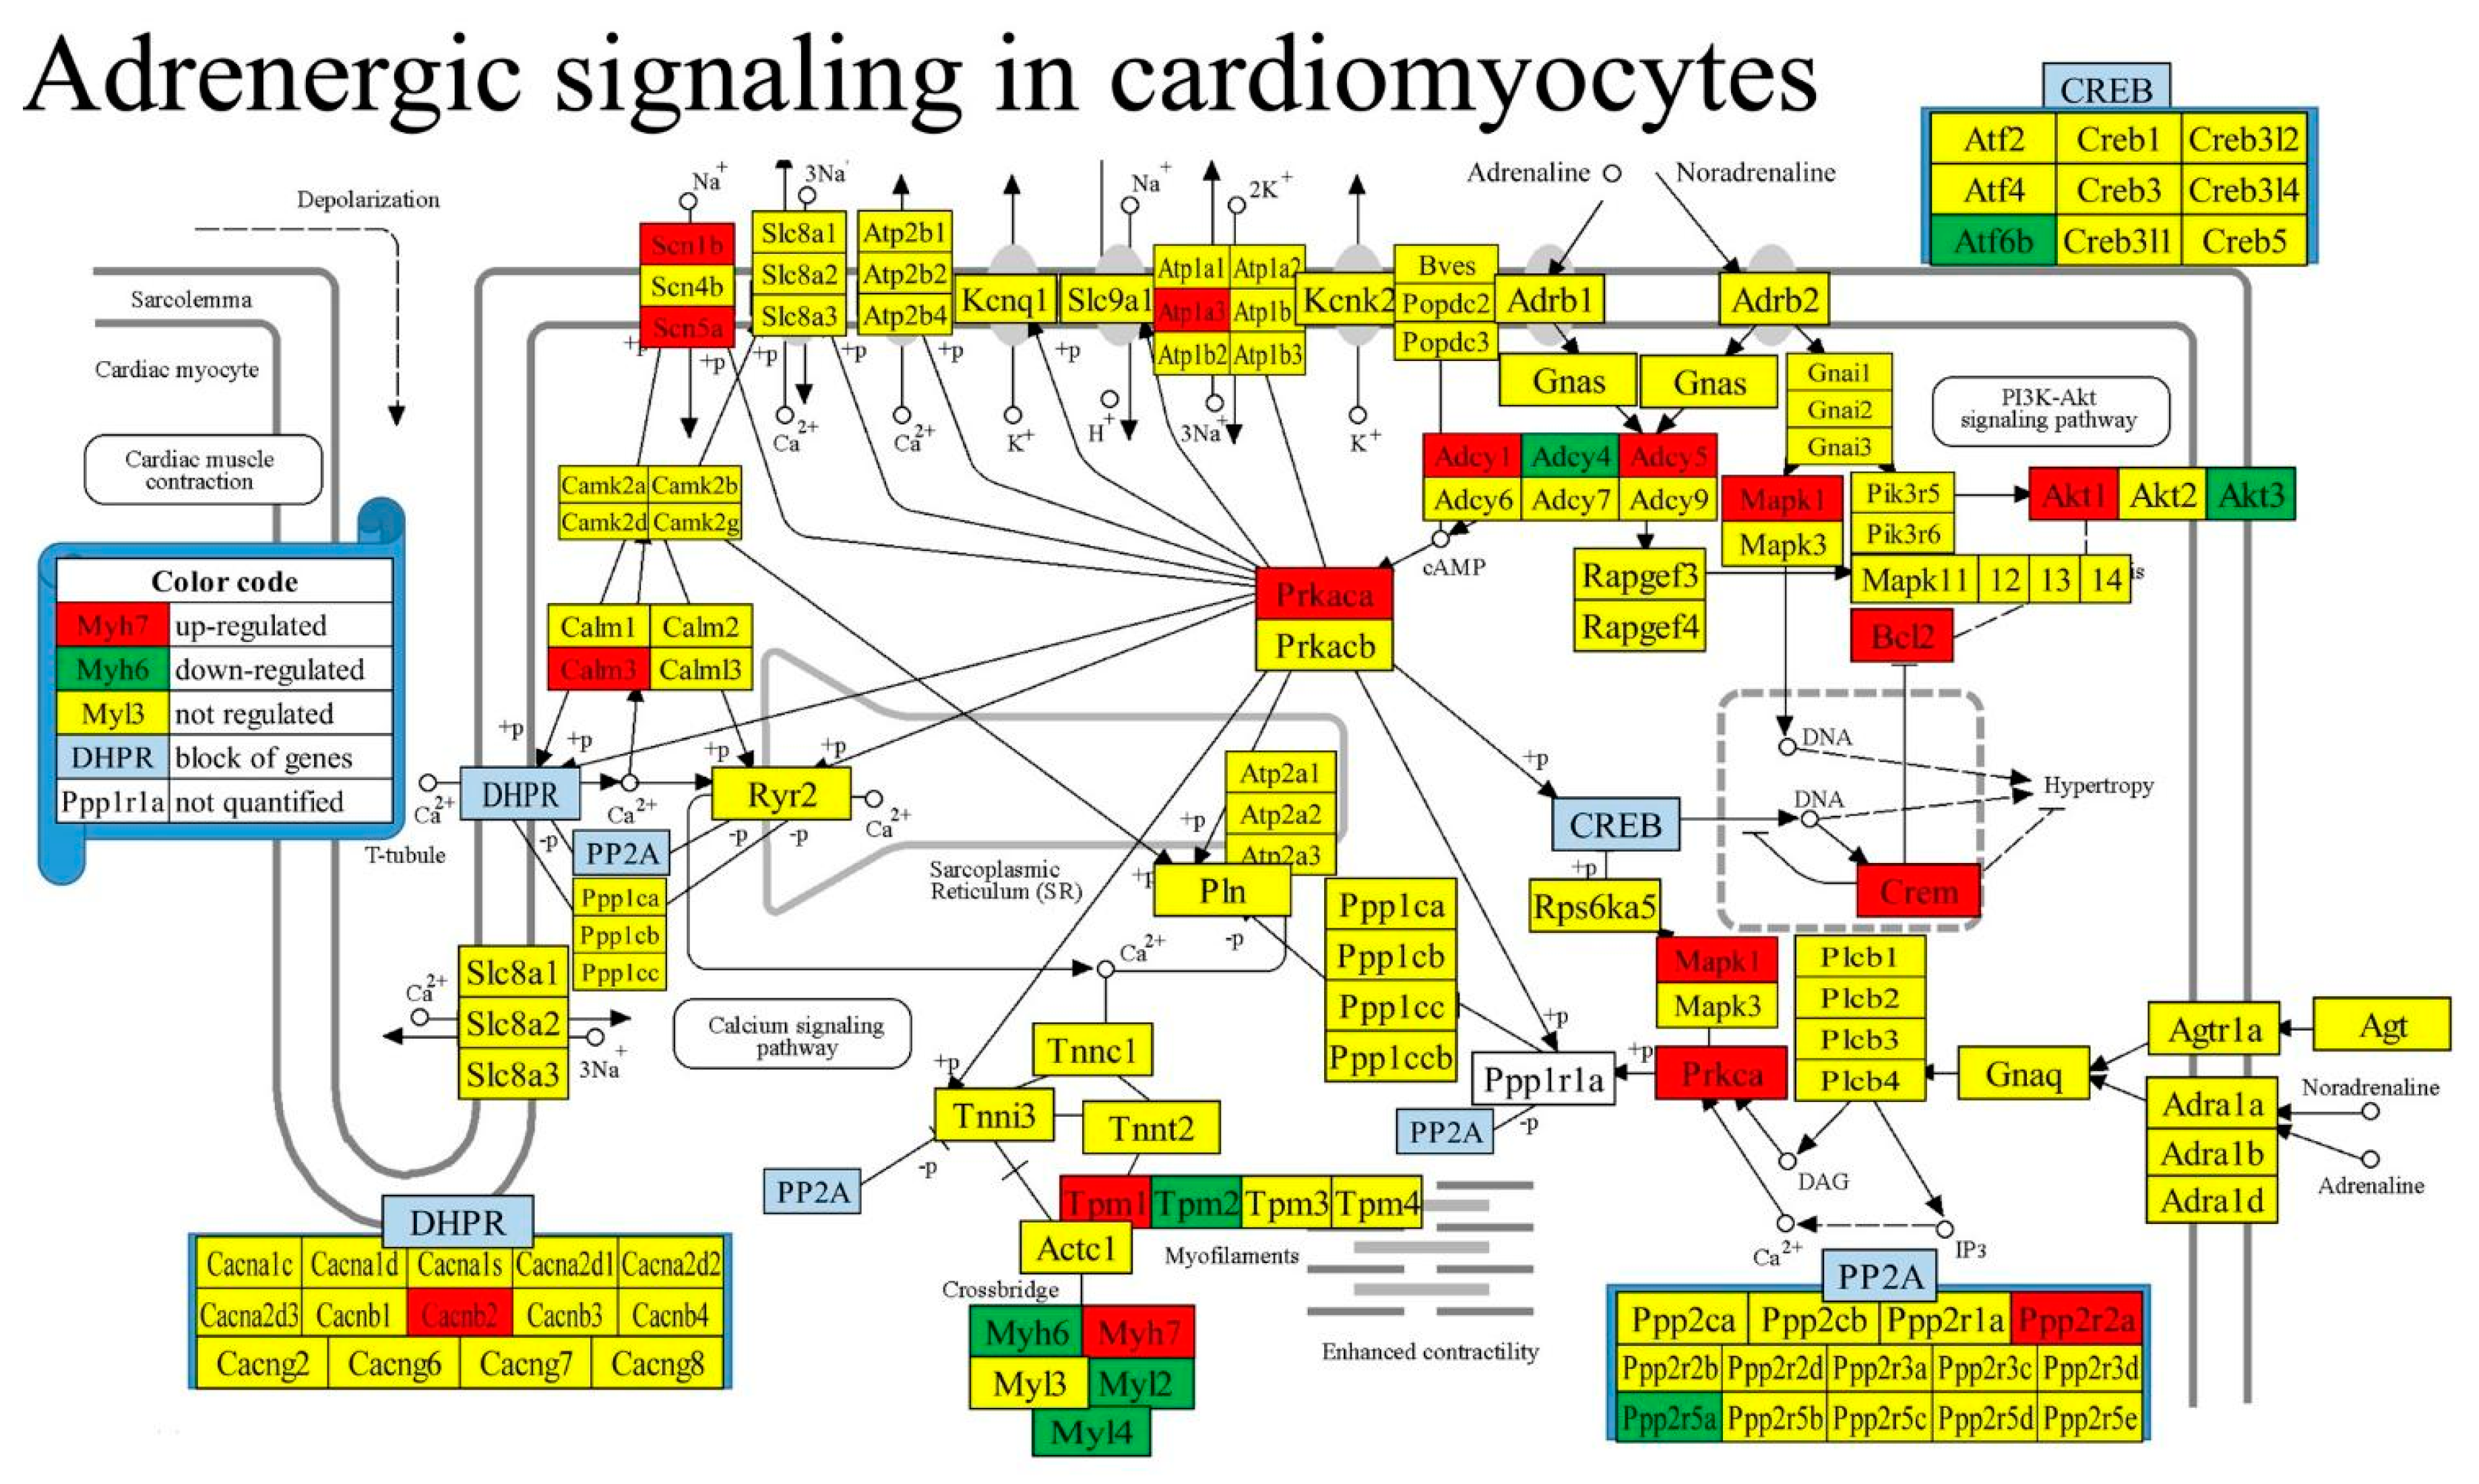
Figure 5.
Regulated genes within the KEGG-constructed pathway Dilated Cardiomyopathy.
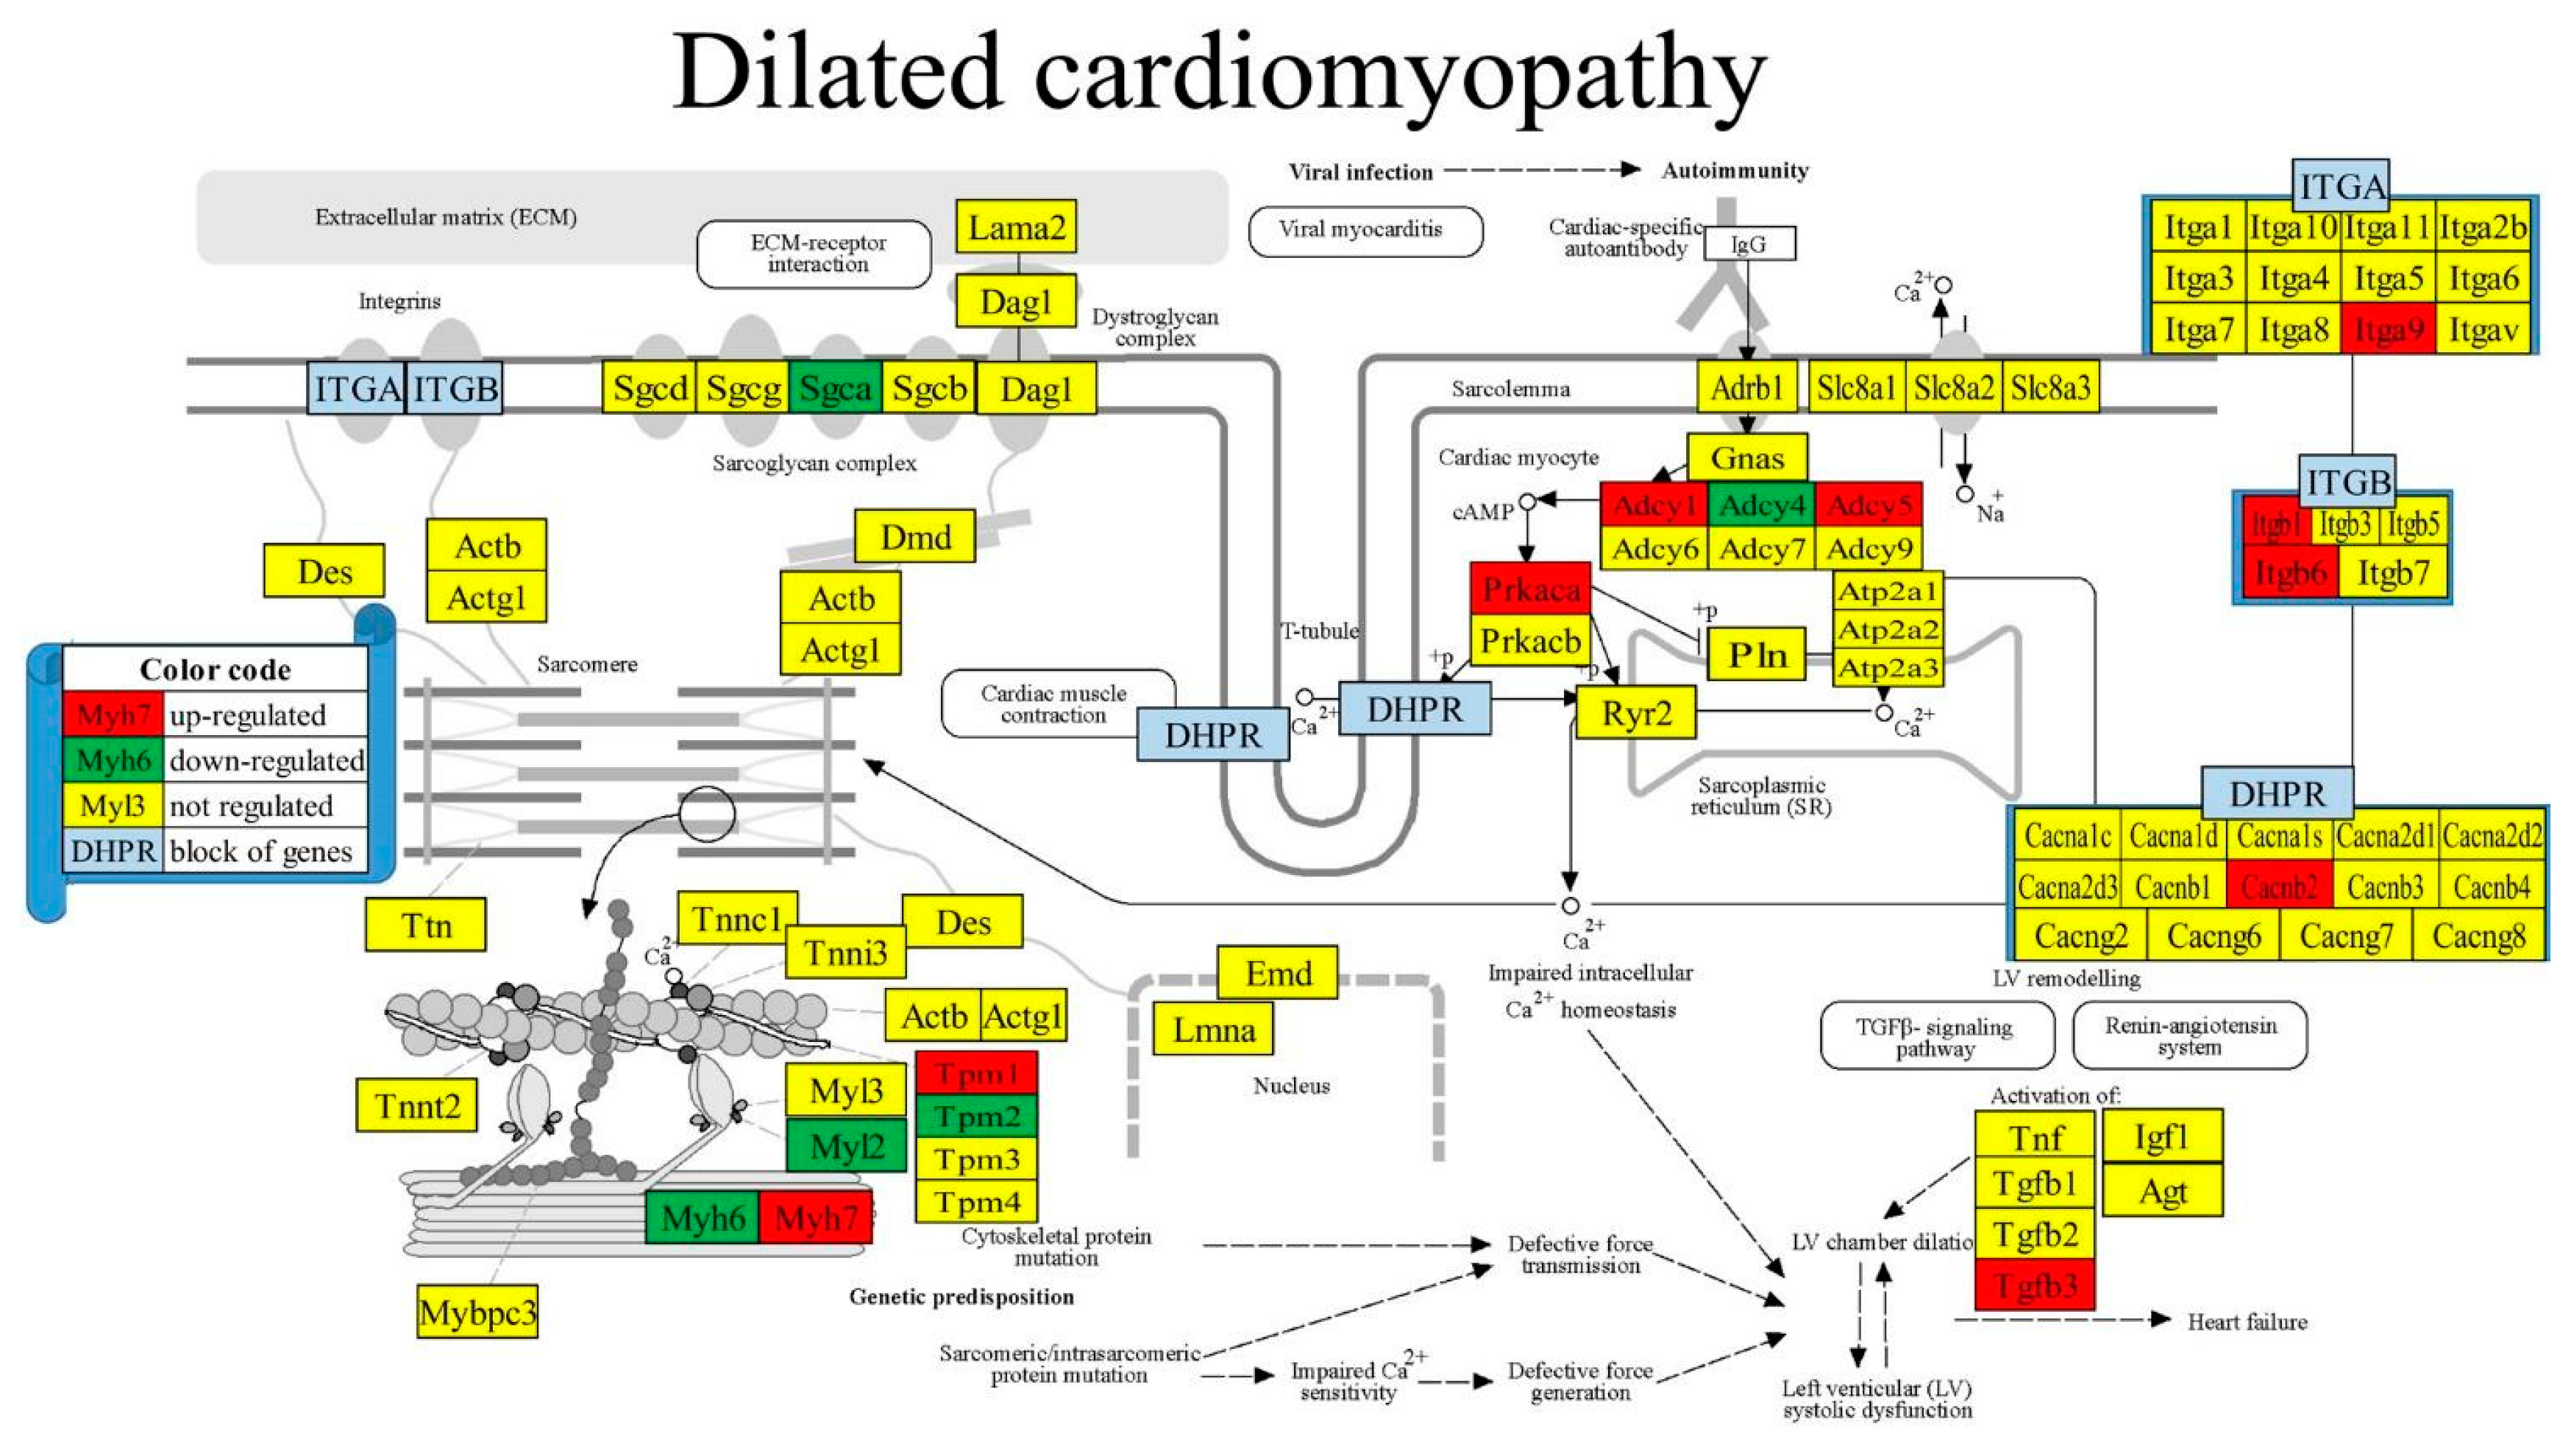
Figure 6.
Regulated genes within the KEGG-constructed pathway Chagas disease [52].
Figure 6.
Regulated genes within the KEGG-constructed pathway Chagas disease [52].
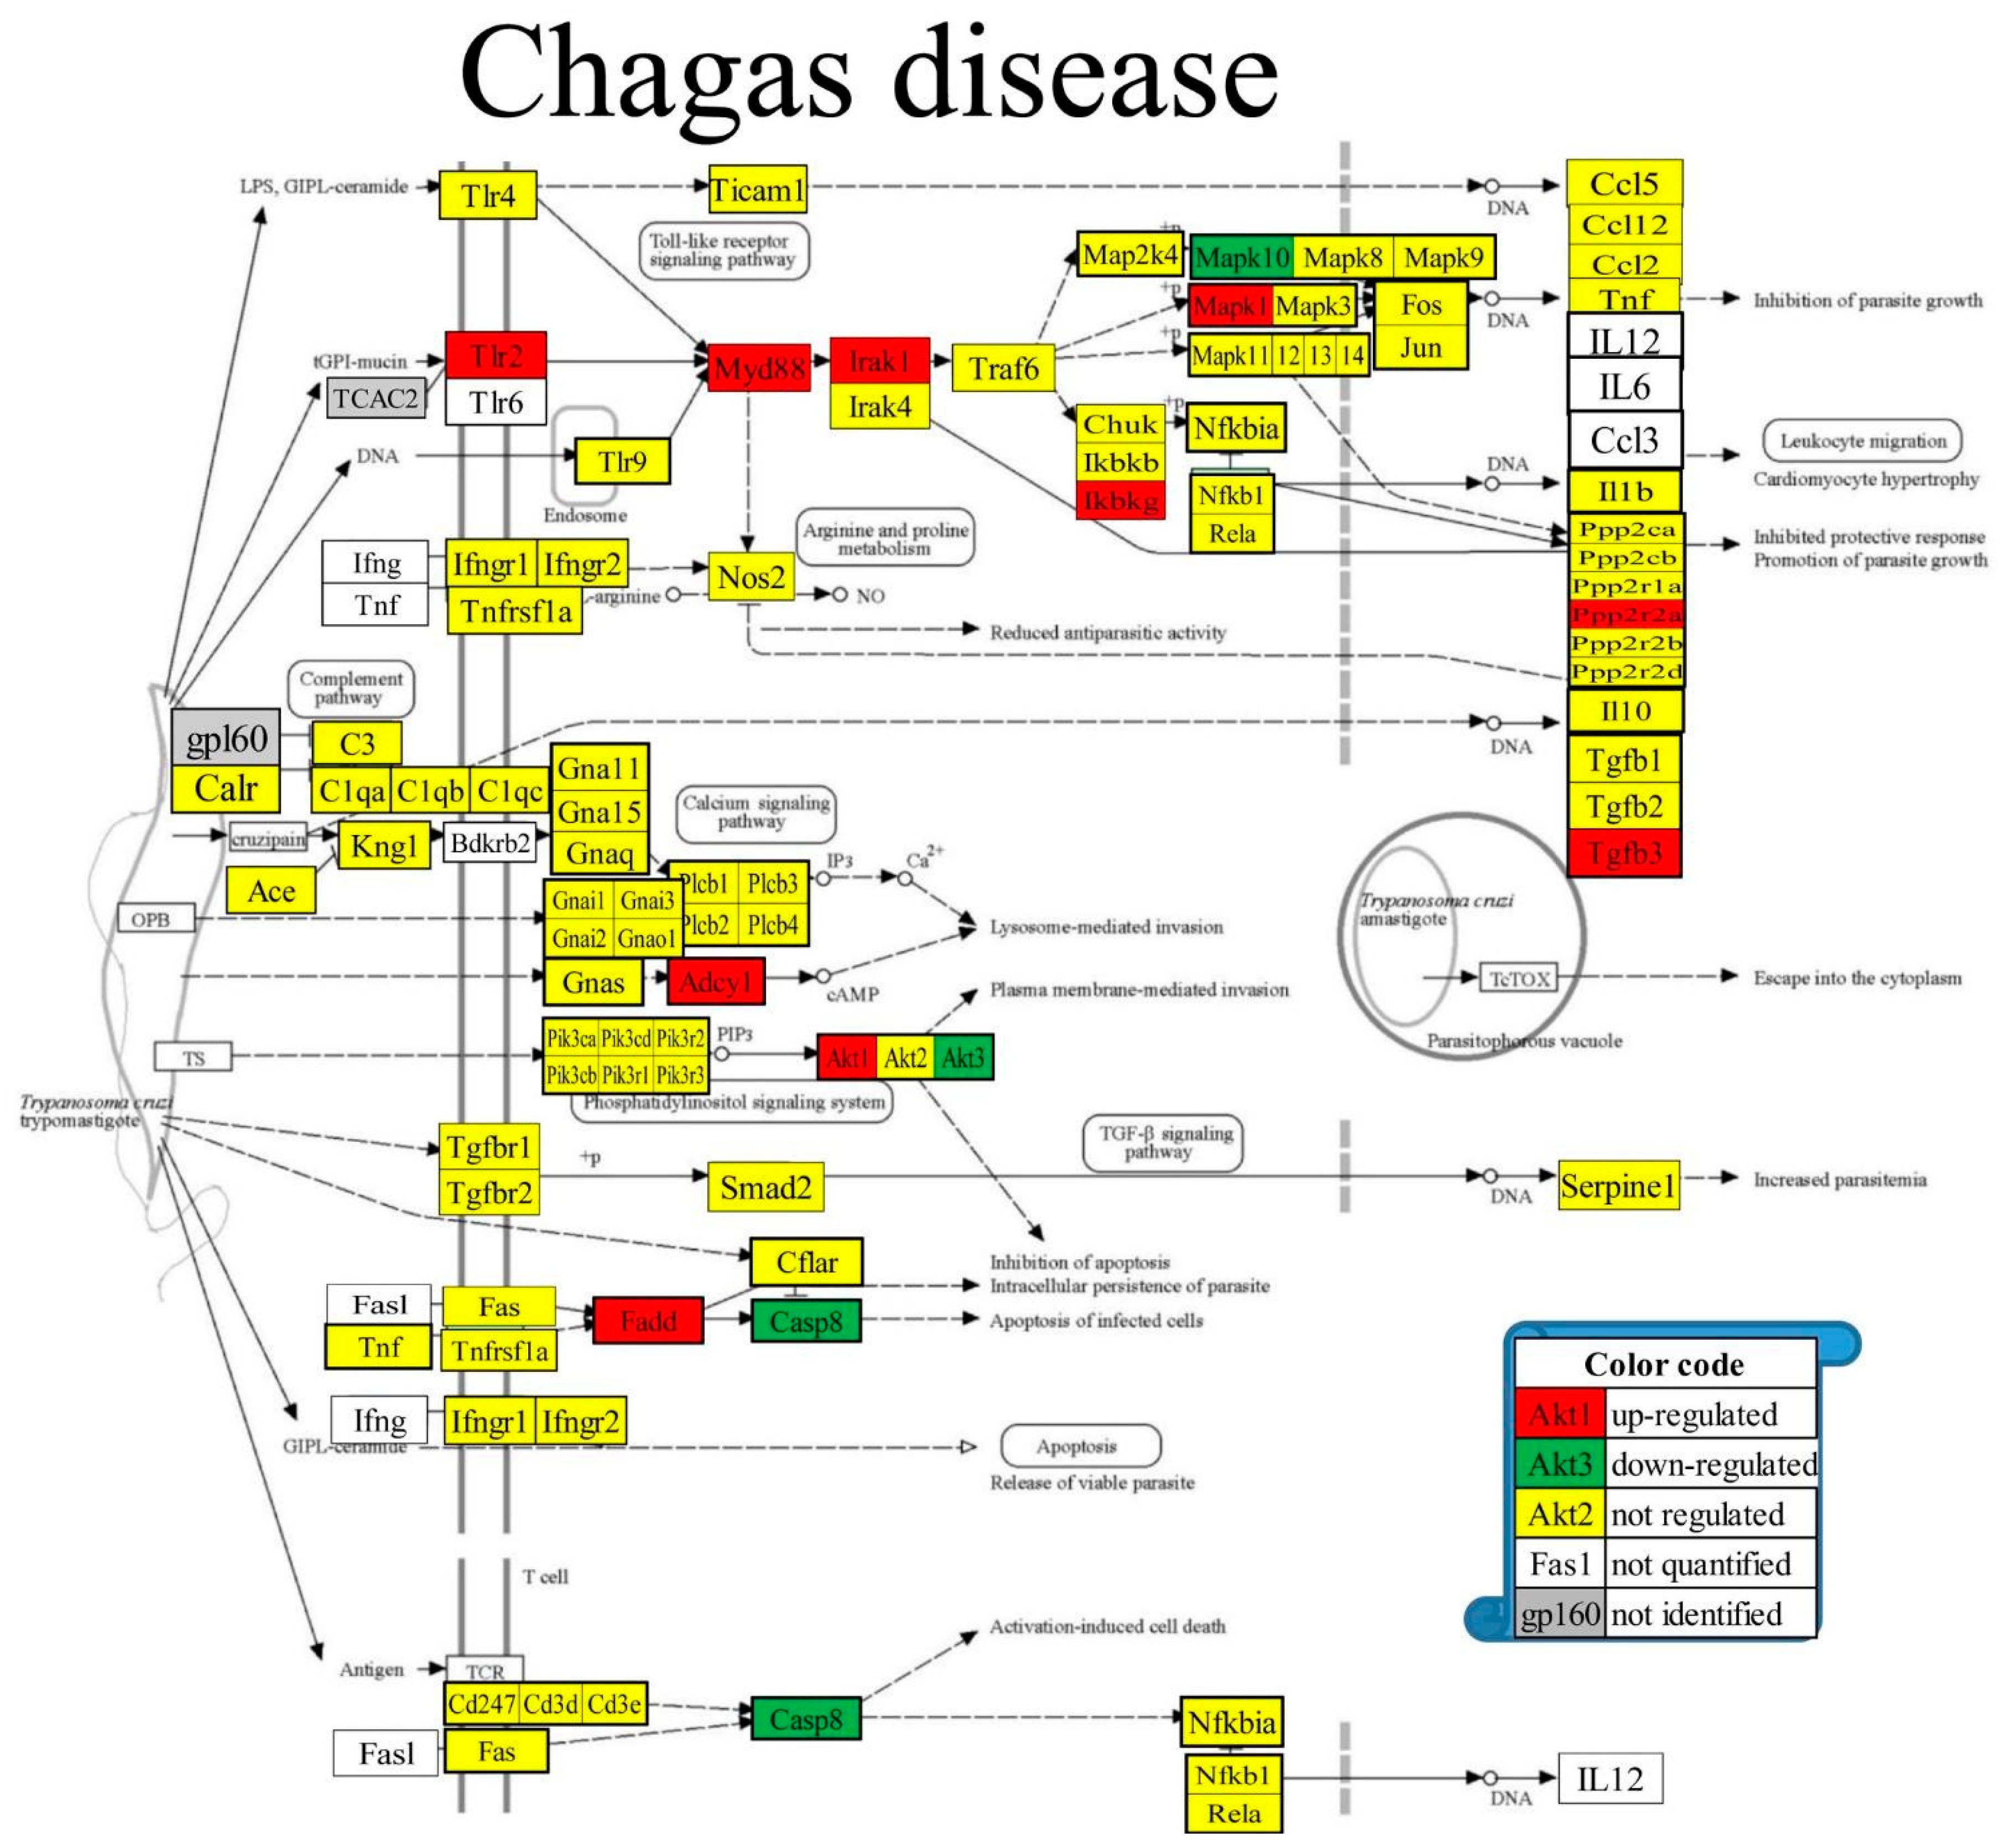
Figure 7.
Regulated mitochondrial genes included in the KEGG-constructed pathway Diabetic cardiomyopathy [53].
Figure 7.
Regulated mitochondrial genes included in the KEGG-constructed pathway Diabetic cardiomyopathy [53].
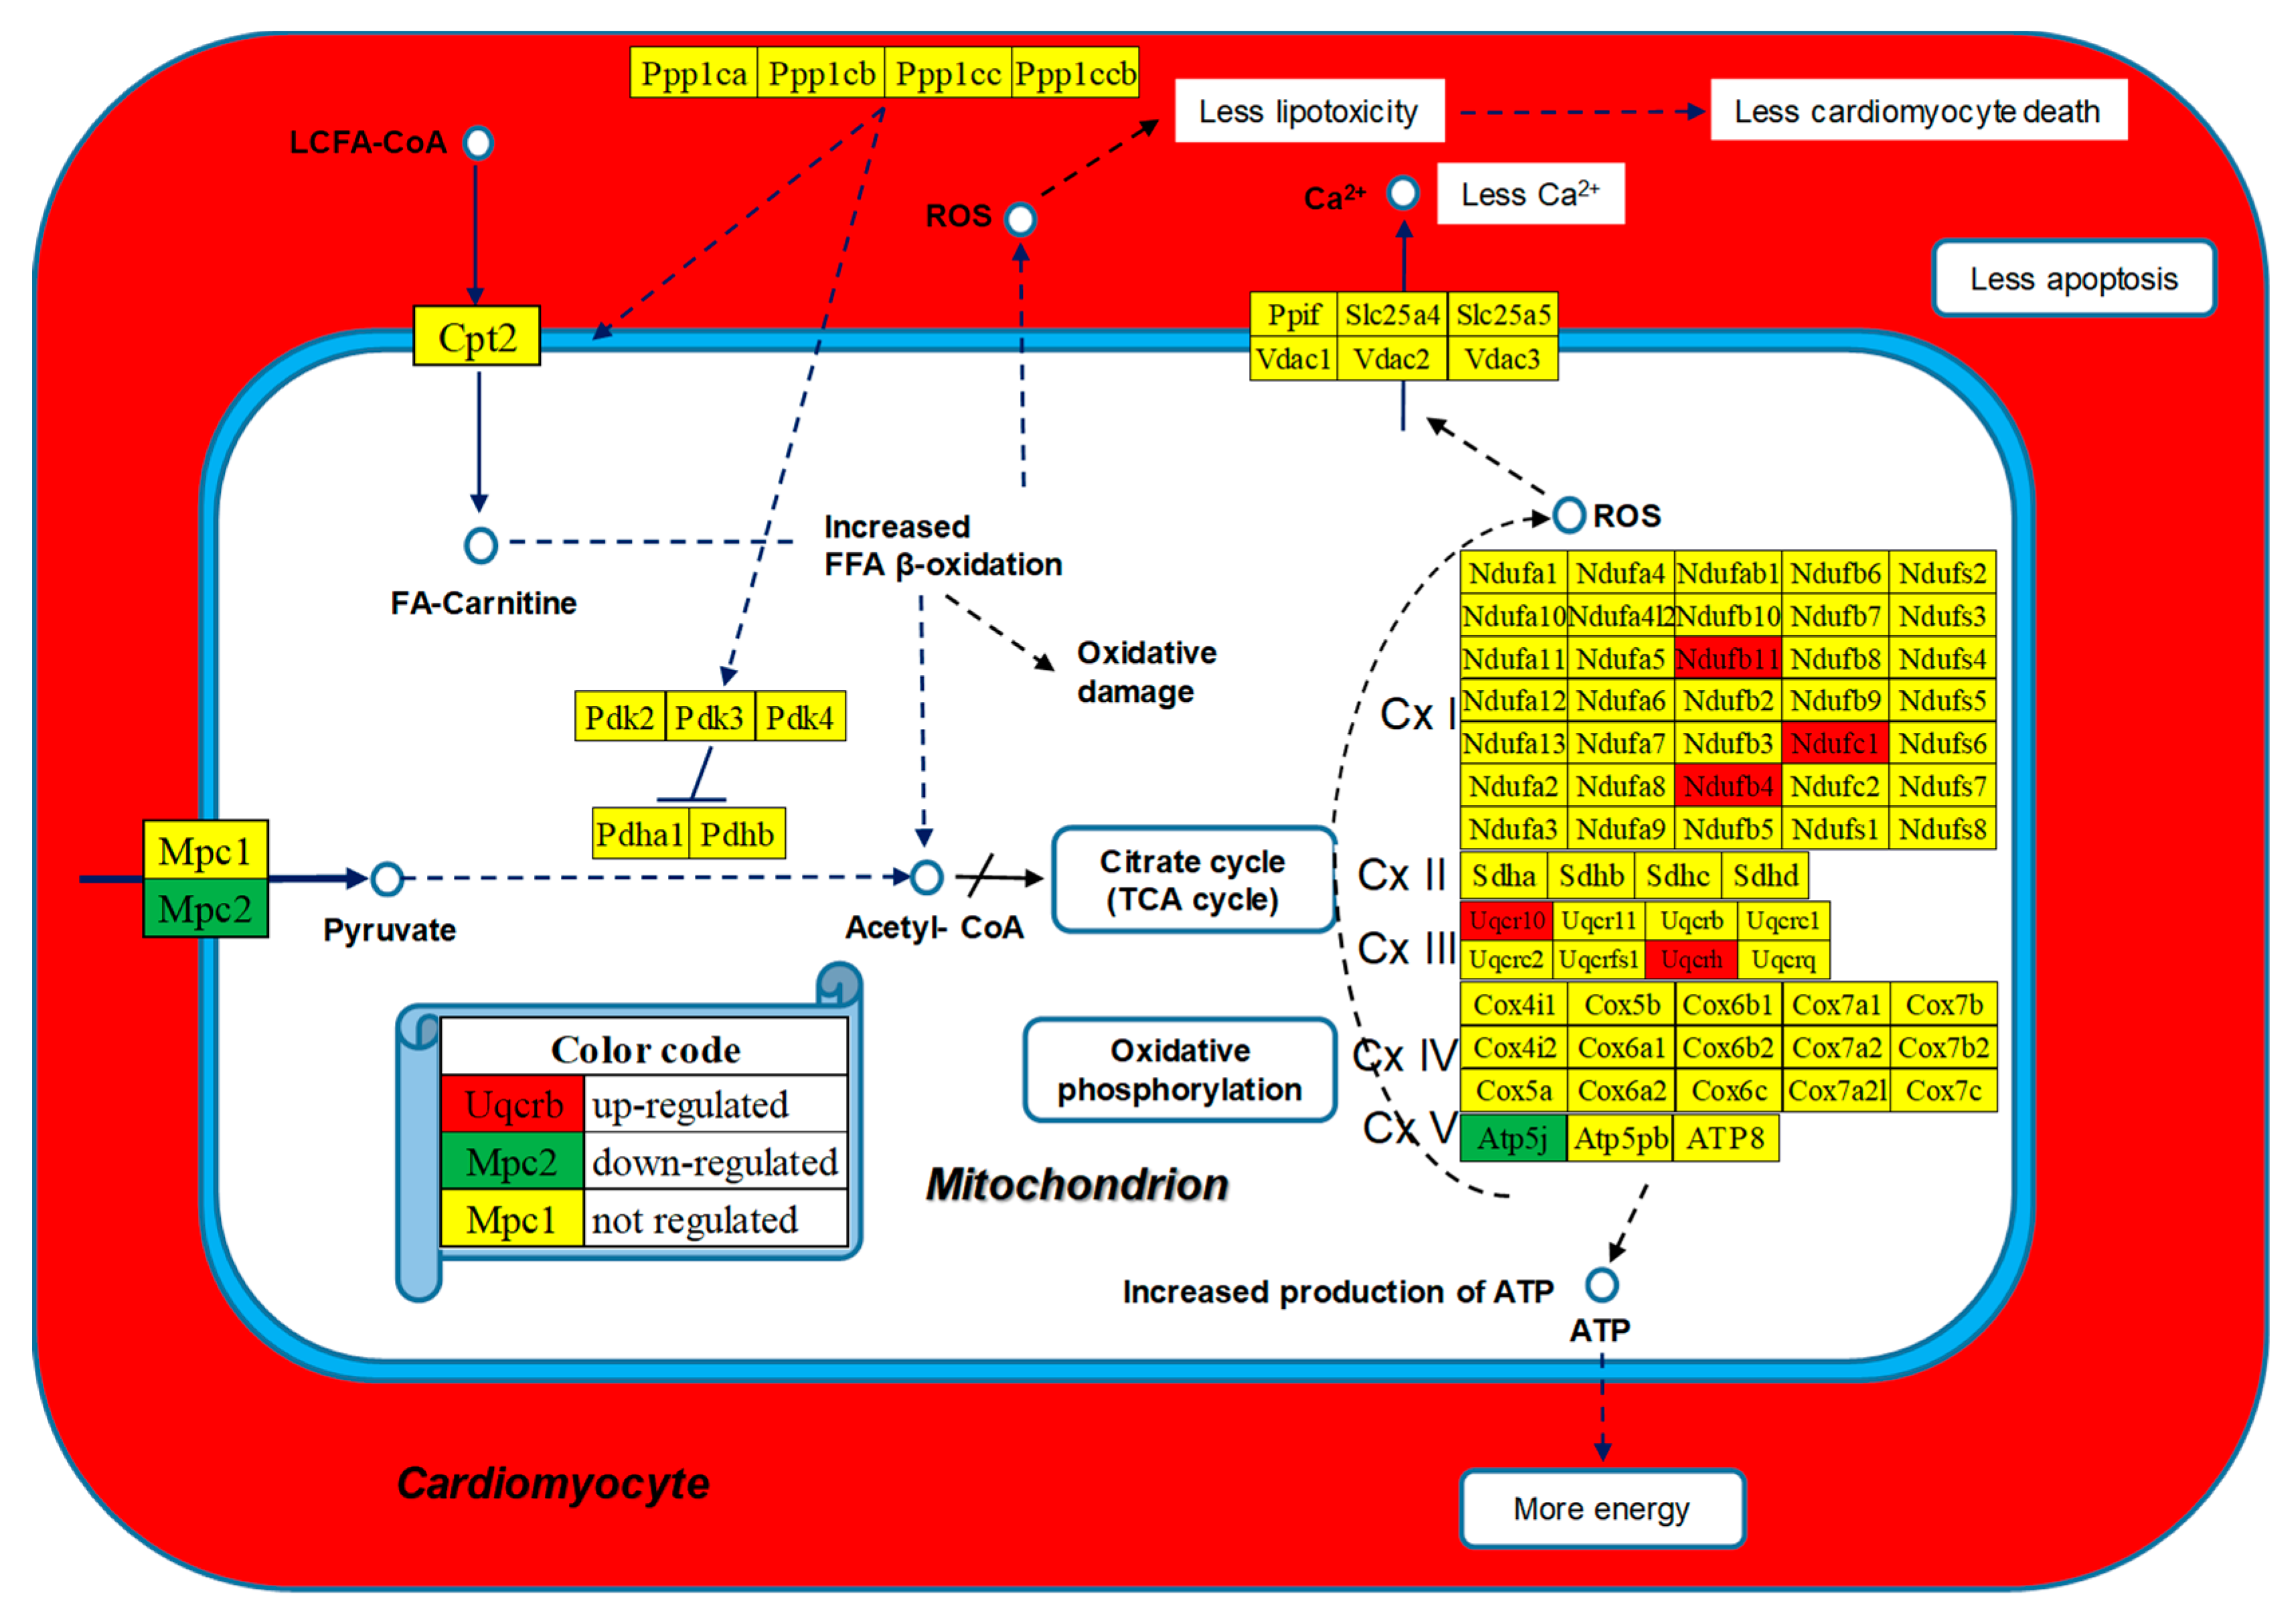
Figure 8.
Statistically (p < 0.05) significant synergistically/antagonistically/independently expressed genes within the KEGG-constructed pathway Dilated Cardiomyopathy (red/green/yellow squares) and the (p < 0.05) significant synergistic (continuous red line), antagonistic (continuous blue line) and independent (dashed black line) expression of Cox6b2 (cytochrome c oxidase subunit 6B2) with genes involved in the Dilated cardiomyopathy pathway in the left ventricles of mice fed with normal/law-salt diet. The red background of the Cacnab2 gene symbol indicates significant up-regulation in low-salt with respect to the normal diet while the yellow background of the other gene symbols indicates no significant regulation.
Figure 8.
Statistically (p < 0.05) significant synergistically/antagonistically/independently expressed genes within the KEGG-constructed pathway Dilated Cardiomyopathy (red/green/yellow squares) and the (p < 0.05) significant synergistic (continuous red line), antagonistic (continuous blue line) and independent (dashed black line) expression of Cox6b2 (cytochrome c oxidase subunit 6B2) with genes involved in the Dilated cardiomyopathy pathway in the left ventricles of mice fed with normal/law-salt diet. The red background of the Cacnab2 gene symbol indicates significant up-regulation in low-salt with respect to the normal diet while the yellow background of the other gene symbols indicates no significant regulation.
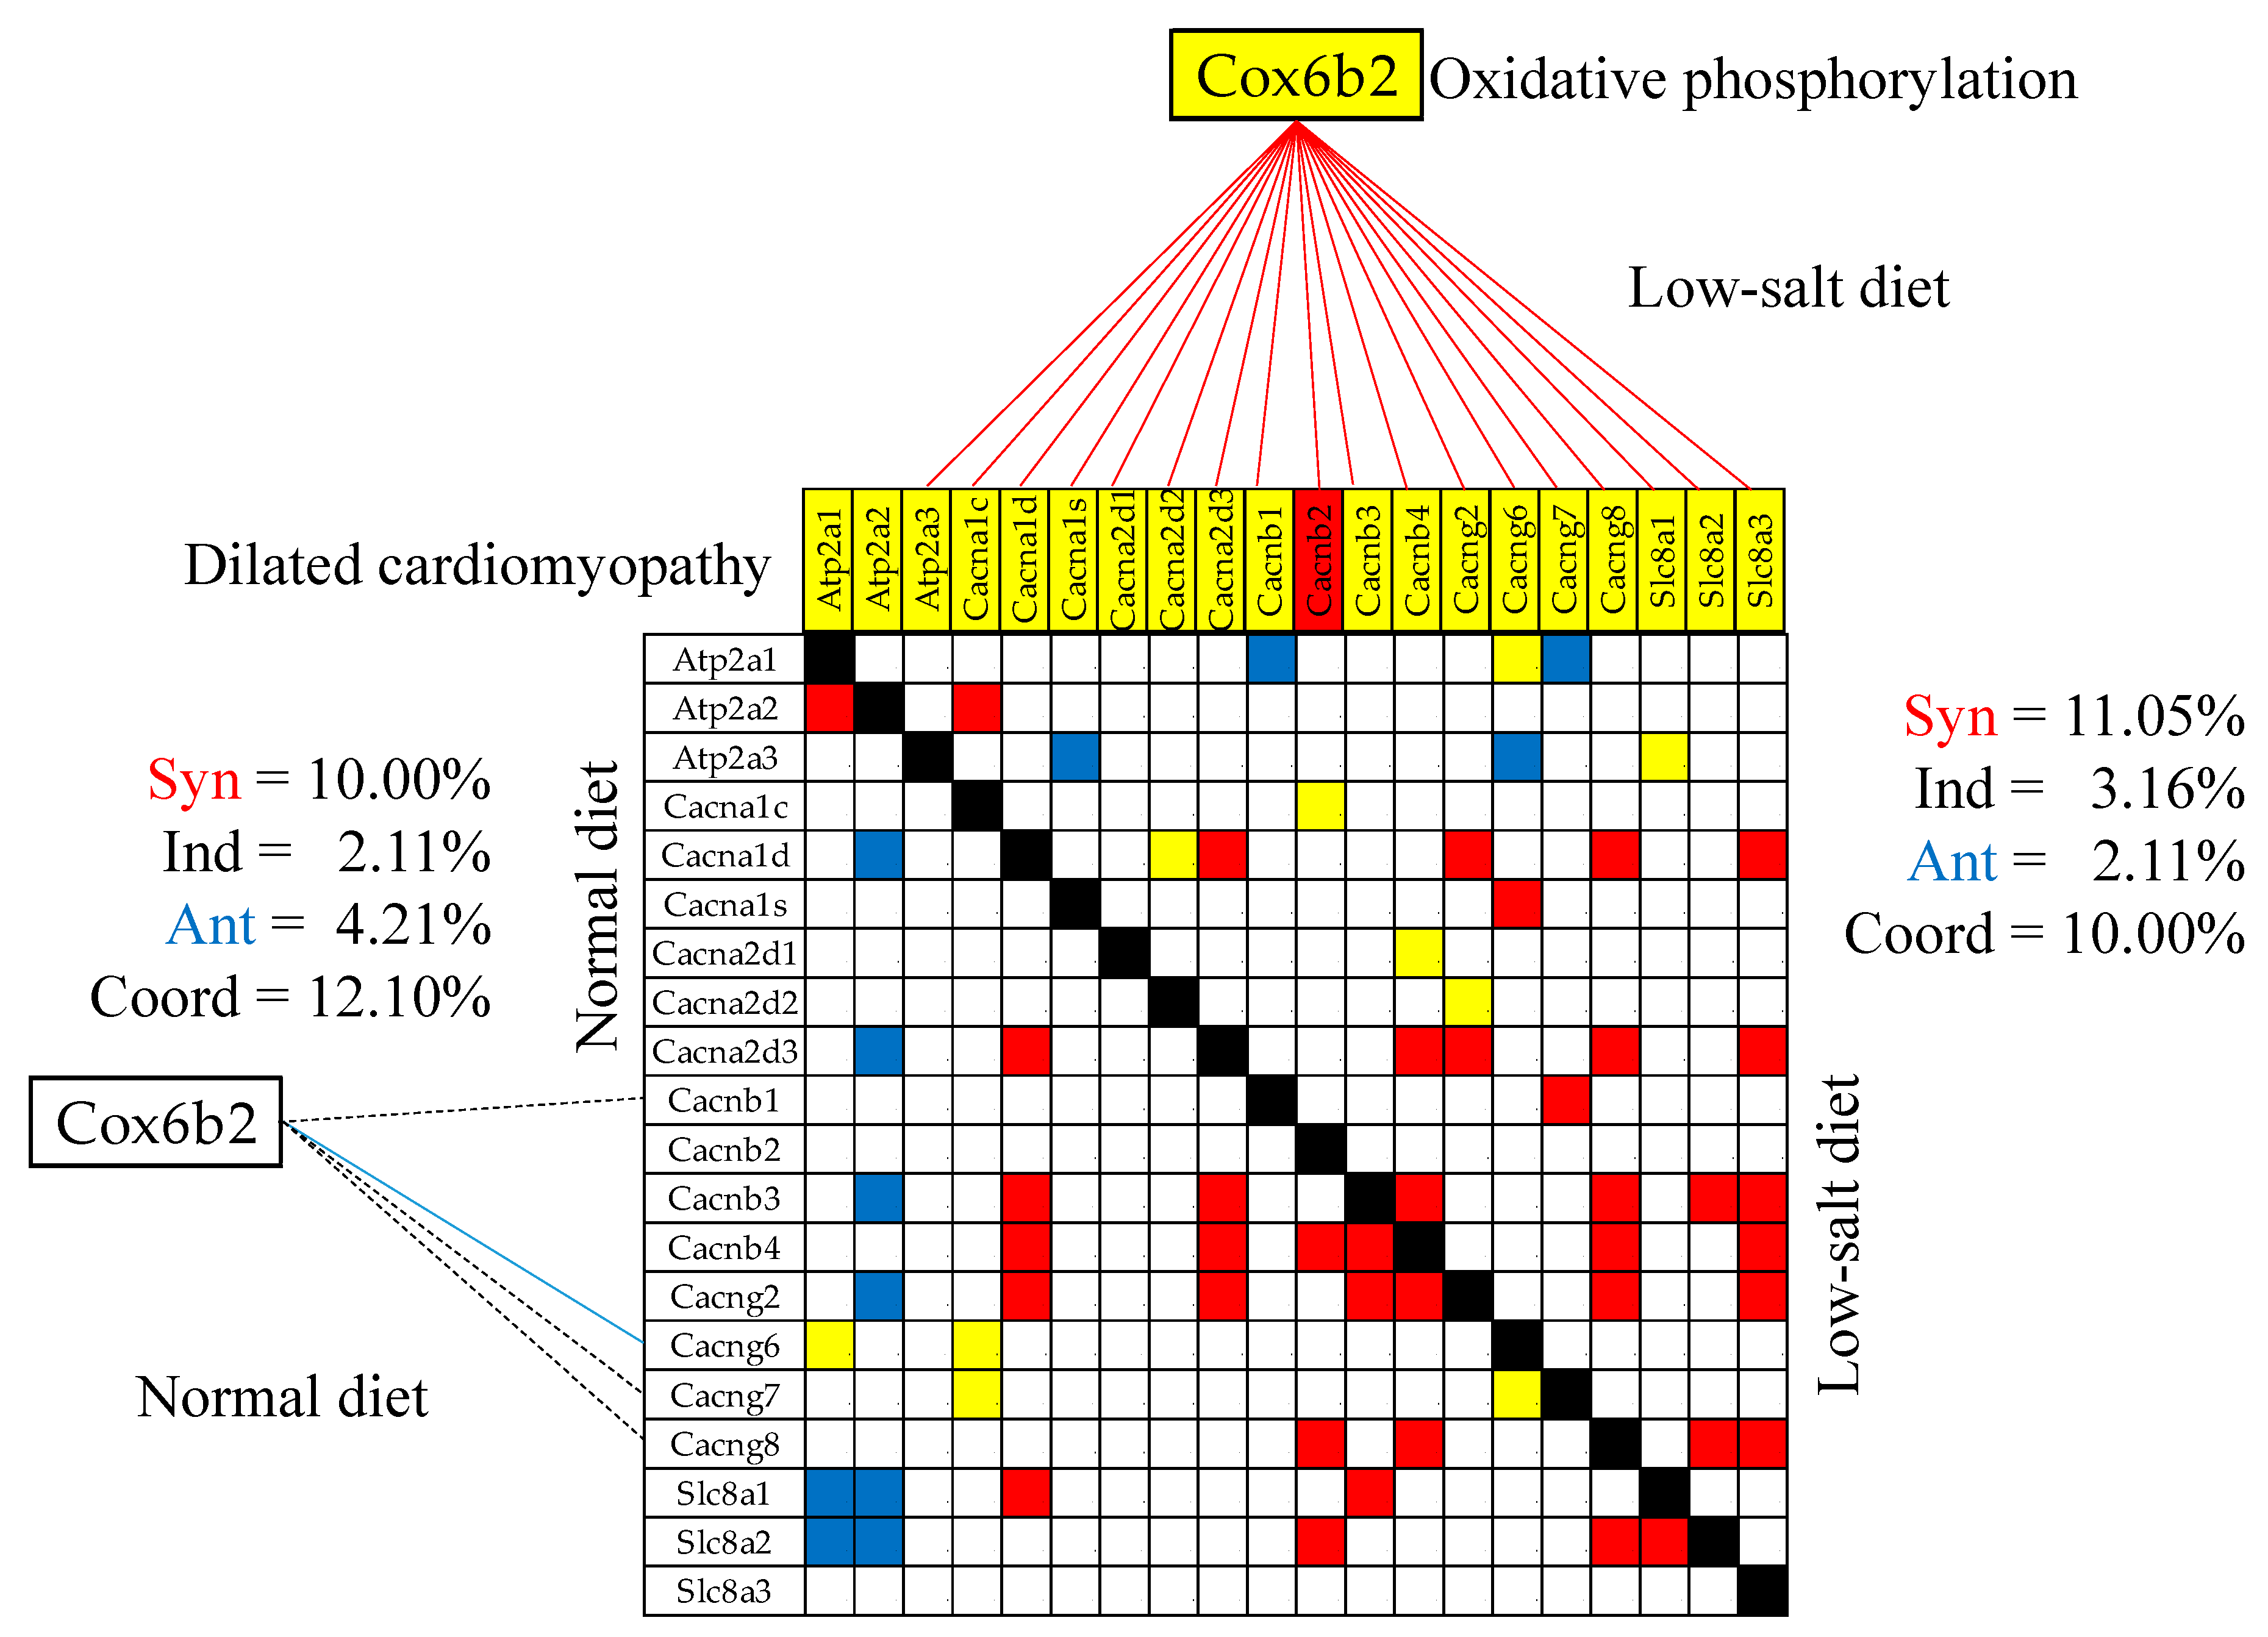
Figure 9.
Statistically (p < 0.05) significant synergistic (red square), antagonistic (blue square), and independent (yellow square) expression of genes from the KEGG-constructed pathways Glycolysis/glucogenesis and Cardiac Muscle Contraction in the normal and low-salt diets. Only the gene pairs with statistically significant synergistic, antagonistic, or independent expressions were represented. Of note is the almost compact expression coupling of the two pathways in the normal diet and the substantial decoupling in the low-salt diet.
Figure 9.
Statistically (p < 0.05) significant synergistic (red square), antagonistic (blue square), and independent (yellow square) expression of genes from the KEGG-constructed pathways Glycolysis/glucogenesis and Cardiac Muscle Contraction in the normal and low-salt diets. Only the gene pairs with statistically significant synergistic, antagonistic, or independent expressions were represented. Of note is the almost compact expression coupling of the two pathways in the normal diet and the substantial decoupling in the low-salt diet.
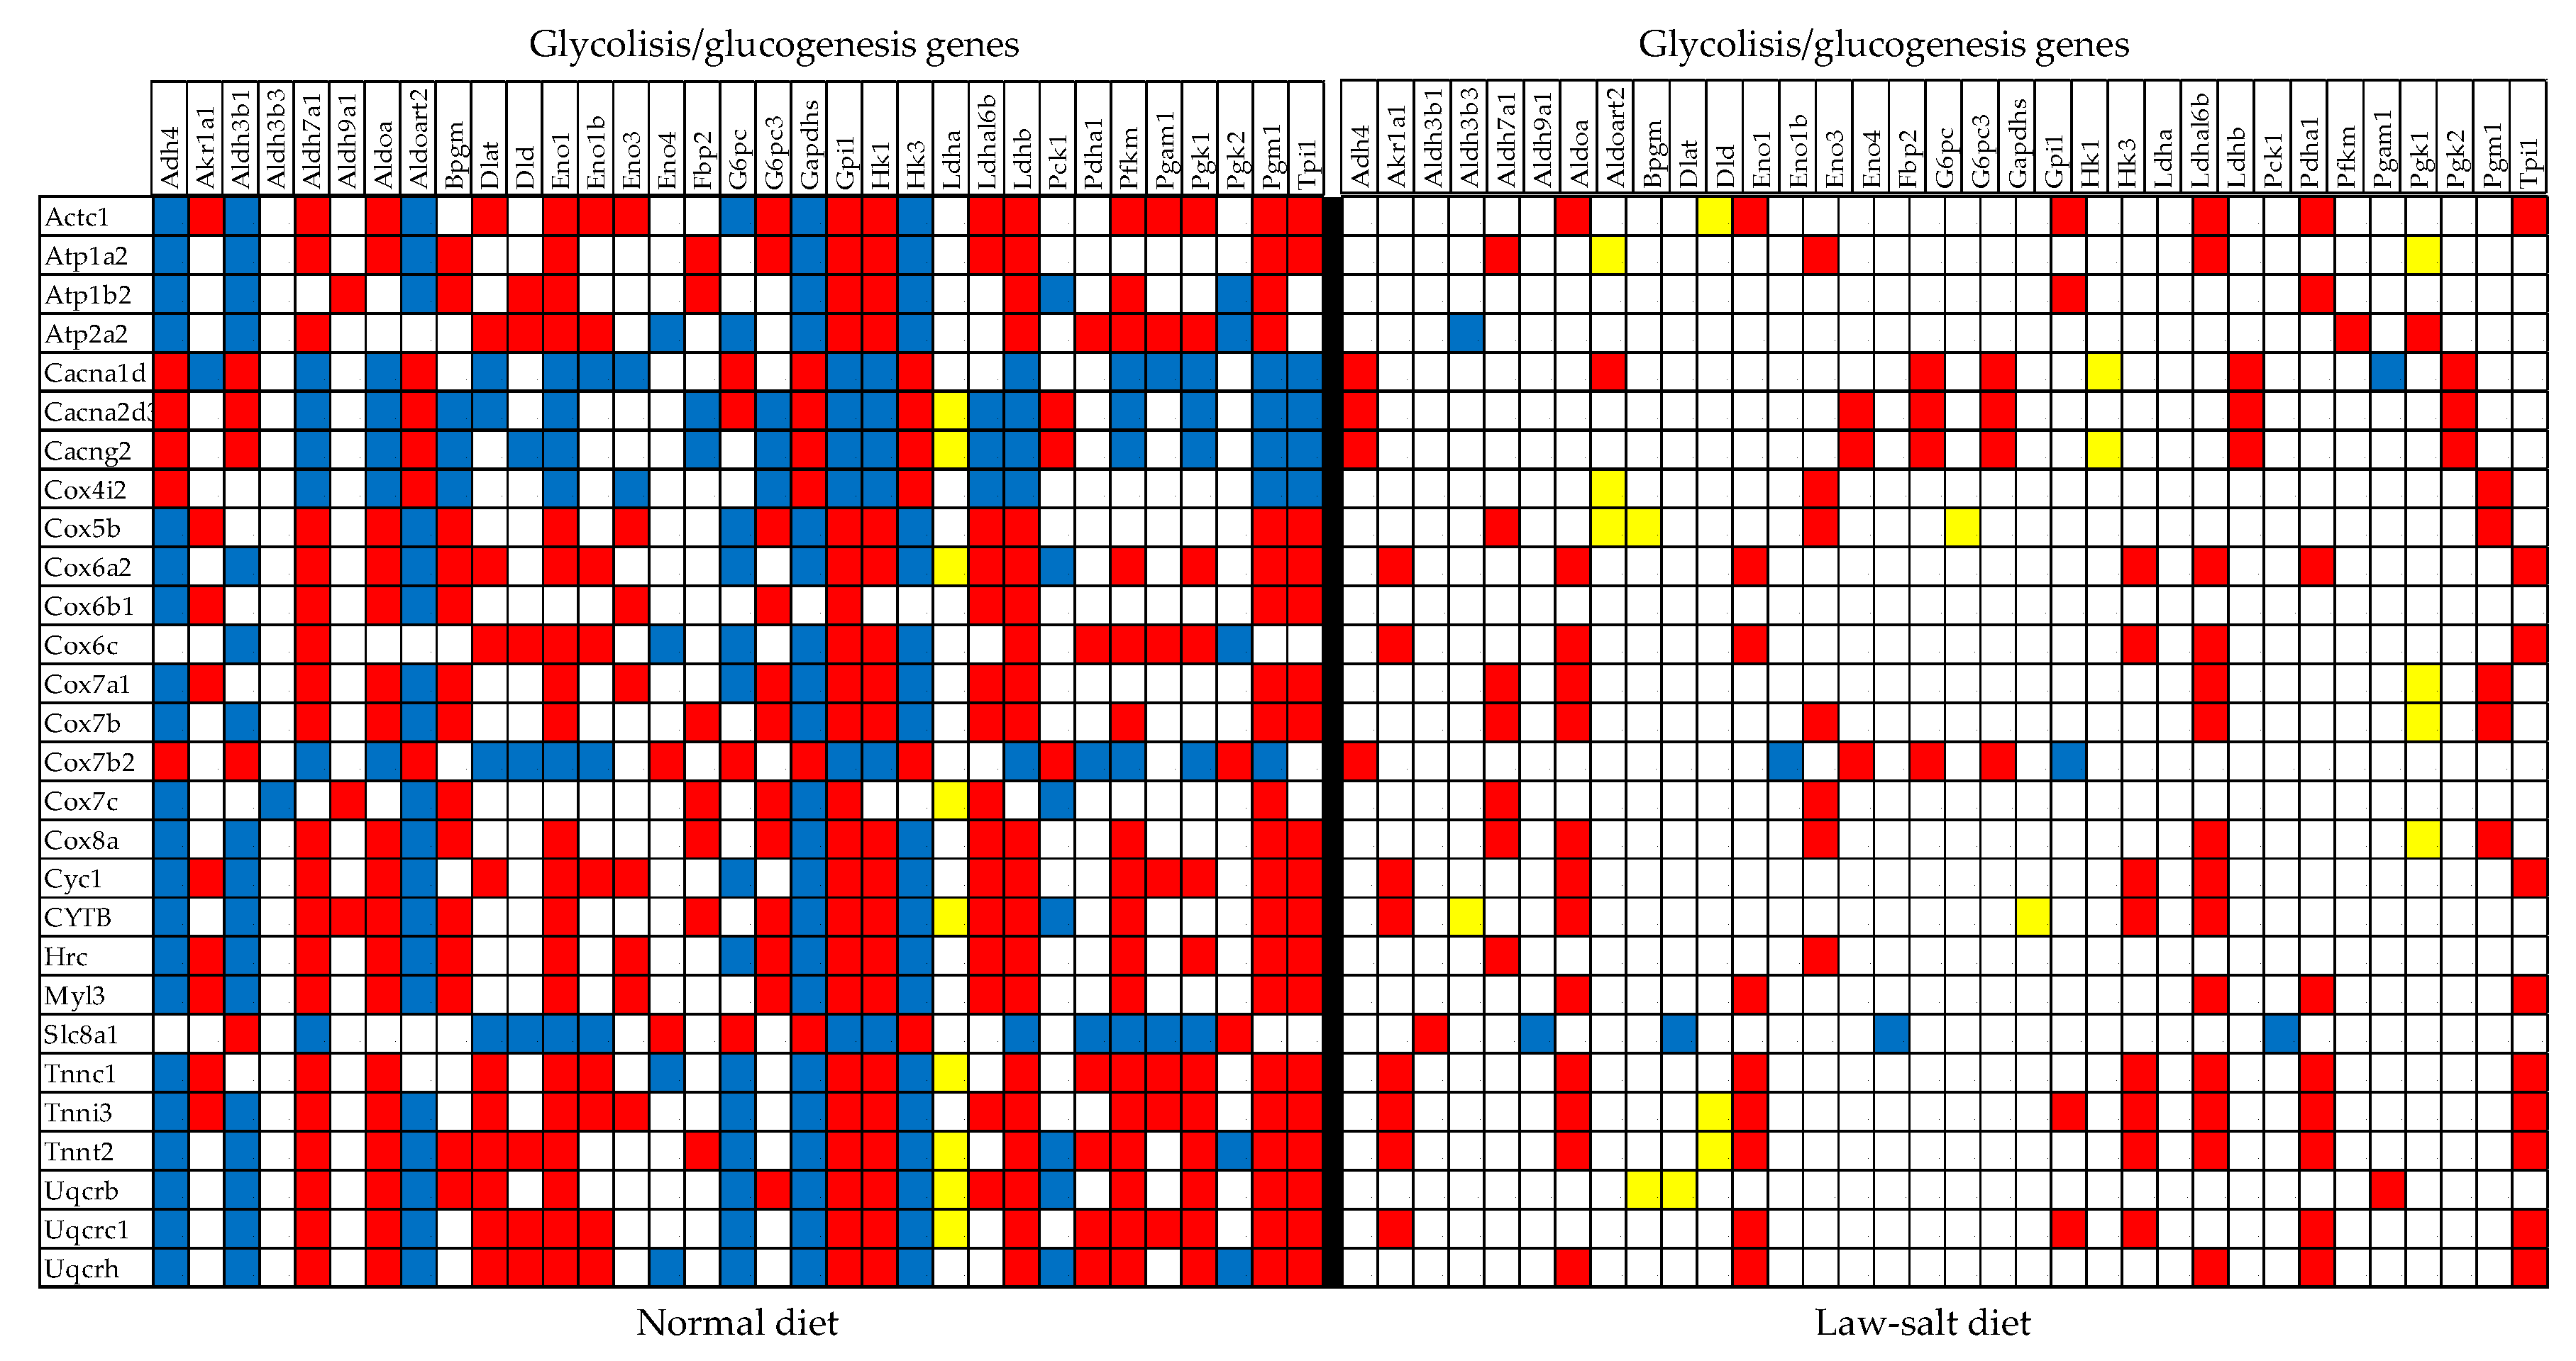
Figure 10.
Statistically (p < 0.05) significant synergistic and antagonistic expression of several genes from the KEGG-constructed pathway Adrenergic signaling in cardiomyocytes with genes from the pathways Cardiac Muscle Contraction and Hypertrophic Cardiomyopathy in the left ventricle of mice fed with (a) normal diet and (b) law-salt diet. Red/blue lines indicate synergistic/antagonistic expressions of the linked genes. The red/green gene symbol background in (b) indicates significant up-/down regulation, while the yellow background indicates that the gene’s expression was not significantly altered.
Figure 10.
Statistically (p < 0.05) significant synergistic and antagonistic expression of several genes from the KEGG-constructed pathway Adrenergic signaling in cardiomyocytes with genes from the pathways Cardiac Muscle Contraction and Hypertrophic Cardiomyopathy in the left ventricle of mice fed with (a) normal diet and (b) law-salt diet. Red/blue lines indicate synergistic/antagonistic expressions of the linked genes. The red/green gene symbol background in (b) indicates significant up-/down regulation, while the yellow background indicates that the gene’s expression was not significantly altered.
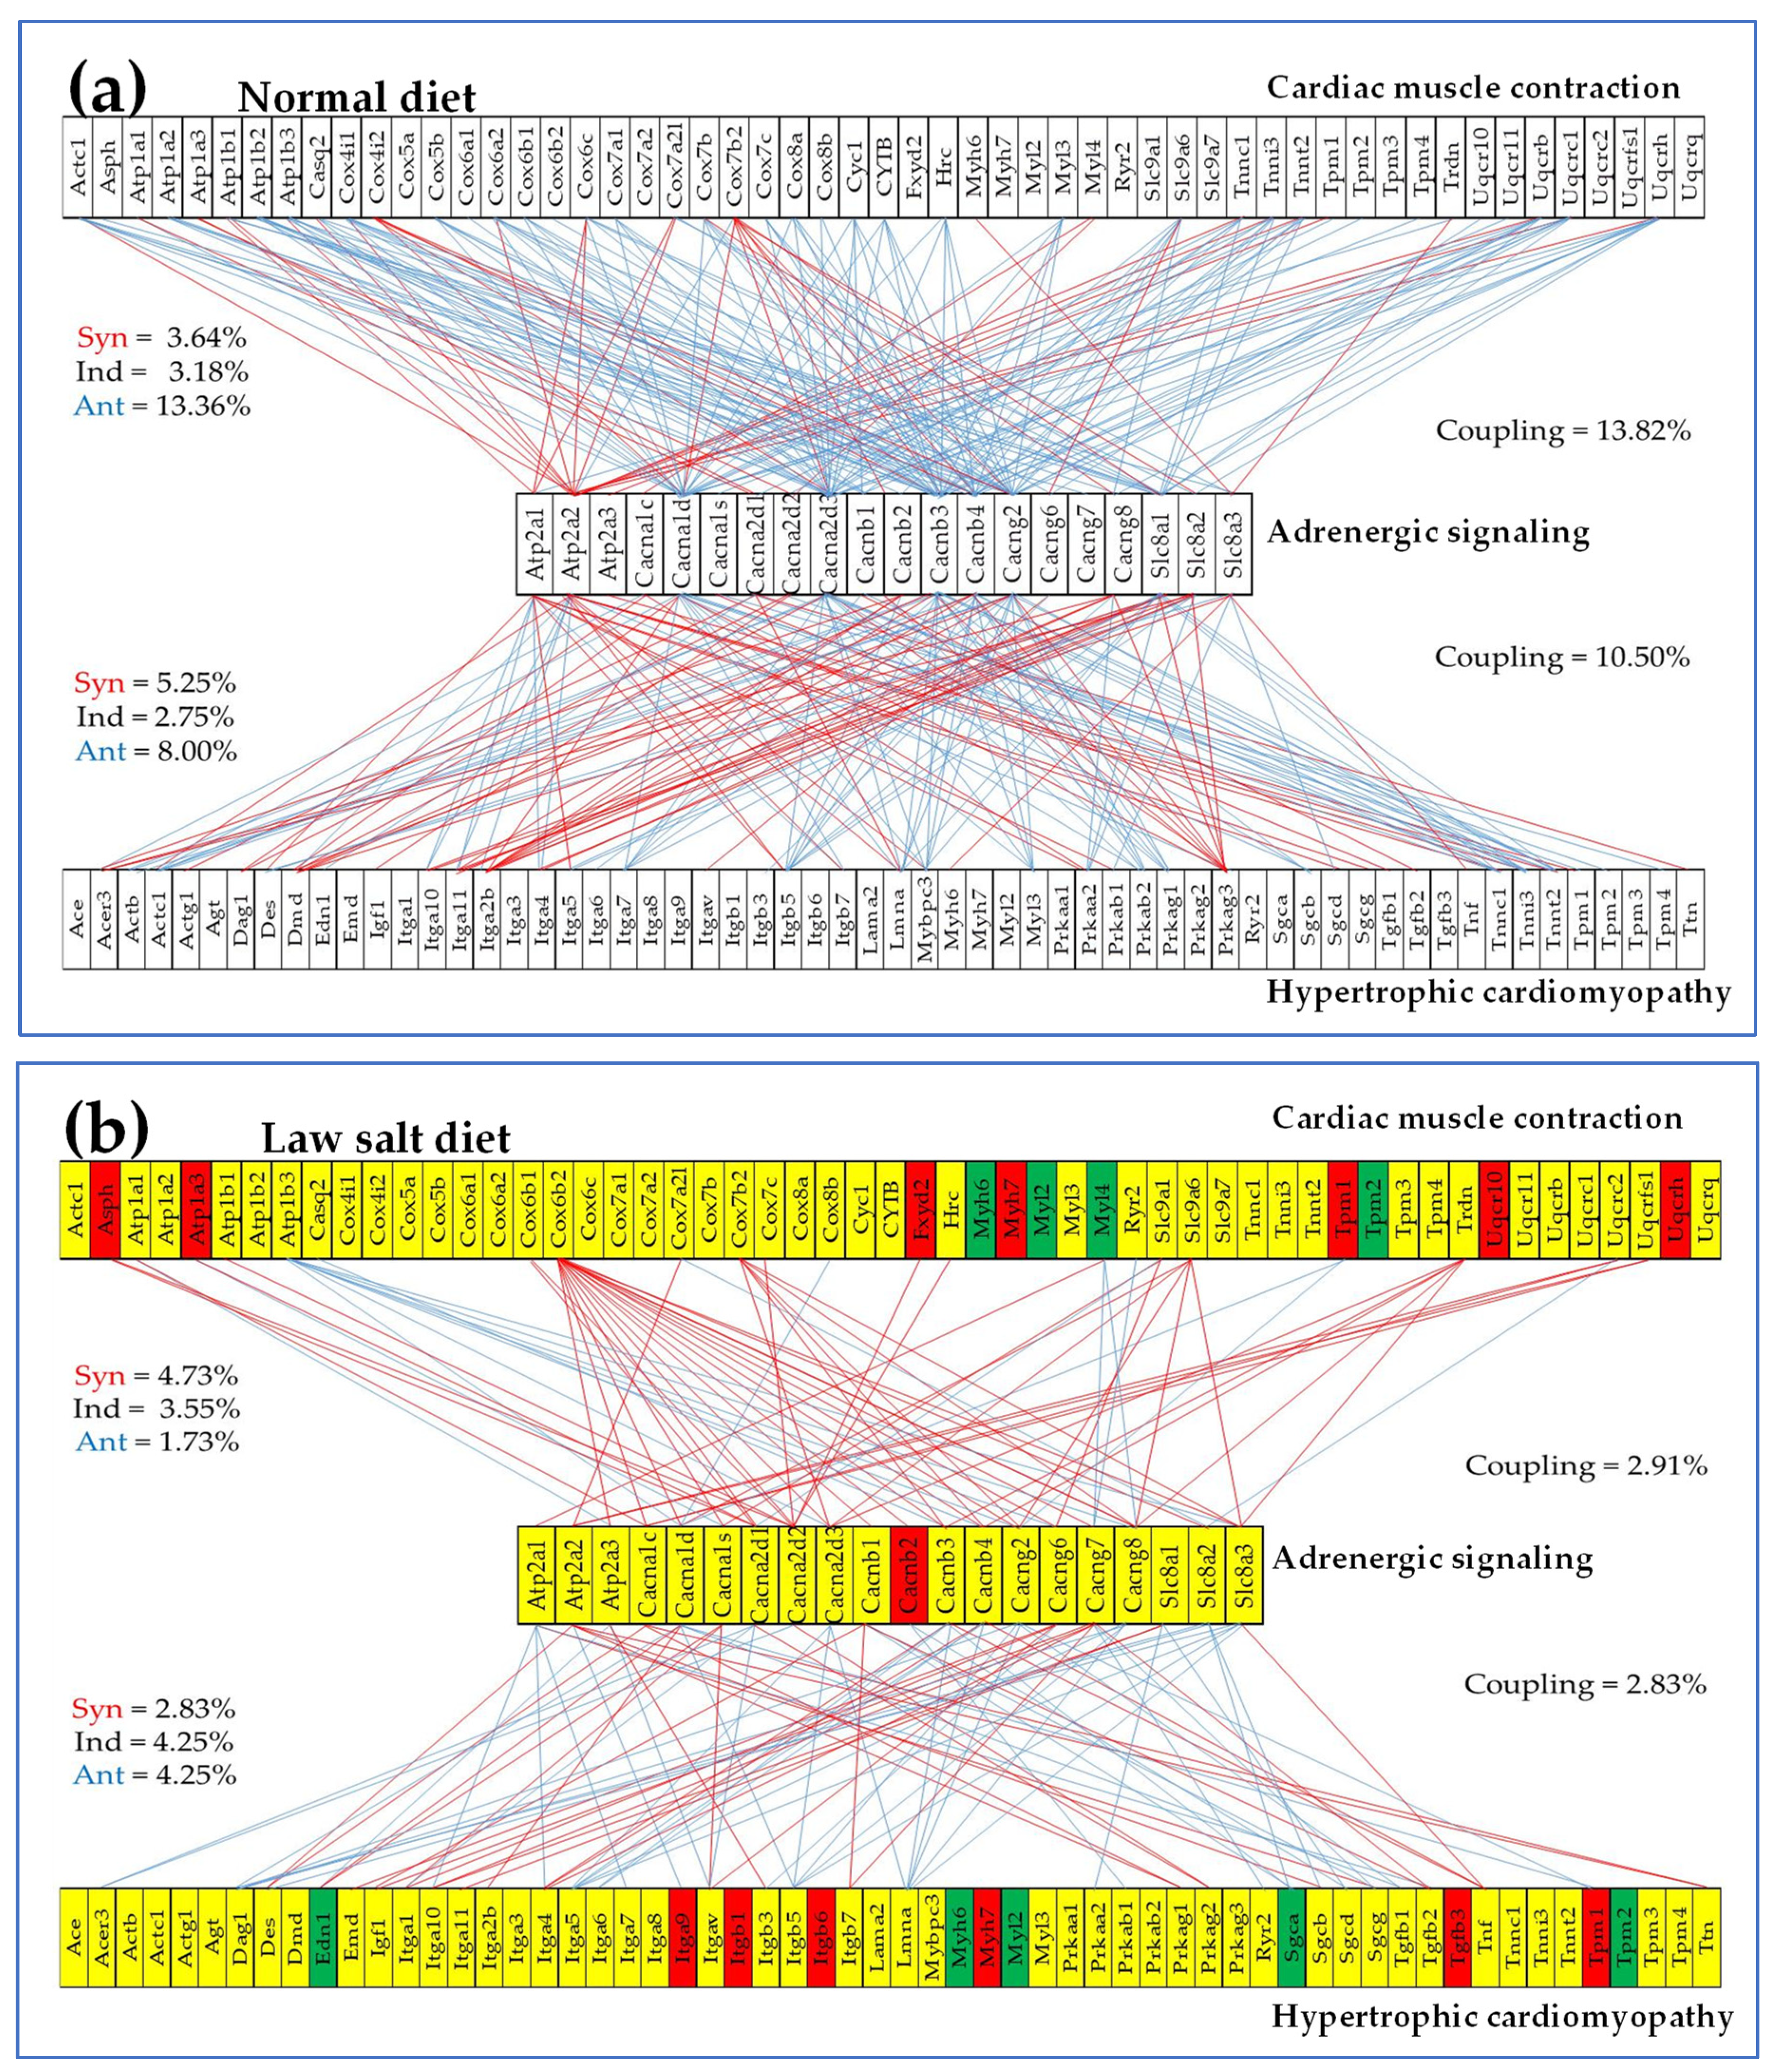

Table 1.
Examples of regulated genes according to the uniform fold-change cut-off = 1.5 that did not pass our |x| > CUT criterion and missed regulated genes in the traditional analysis that satisfied our CUT criterion. All exemplified genes satisfied the p-val < 0.05 criterion. X = expression ratio (fold-change, negative for down-regulation), p = p-value of the heteroscedastic t-test of means equality, CUT = absolute fold-change cut-off computed for each gene, WIR = Weighted Individual (gene) Regulation.
Table 1.
Examples of regulated genes according to the uniform fold-change cut-off = 1.5 that did not pass our |x| > CUT criterion and missed regulated genes in the traditional analysis that satisfied our CUT criterion. All exemplified genes satisfied the p-val < 0.05 criterion. X = expression ratio (fold-change, negative for down-regulation), p = p-value of the heteroscedastic t-test of means equality, CUT = absolute fold-change cut-off computed for each gene, WIR = Weighted Individual (gene) Regulation.
| GENE | DESCRIPTION | X | P | CUT | WIR |
|---|---|---|---|---|---|
| False down-regulated genes | |||||
| Ifitm5 | interferon induced transmembrane protein 5 | -2.350 | 0.030 | 2.427 | -0.428 |
| Hinfp | histone H4 transcription factor | -2.164 | 0.039 | 2.639 | -0.263 |
| Prdm11 | PR domain containing 11 | -2.000 | 0.026 | 2.170 | -0.376 |
| Myl7 | myosin, light polypeptide 7, regulatory | -1.887 | 0.022 | 2.468 | -4.566 |
| Trim71 | tripartite motif-containing 71 | -1.852 | 0.036 | 2.285 | 0.173 |
| Usf1 | upstream transcription factor 1 | -1.837 | 0.023 | 1.928 | -0.341 |
| Chkb | choline kinase beta | -1.829 | 0.025 | 2.633 | -5.056 |
| Cntnap5c | contactin associated protein-like 5C | -1.824 | 0.025 | 1.922 | -5.270 |
| Dnajb1 | DnaJ heat shock protein family | -1.812 | 0.034 | 2.129 | -9.529 |
| Csrnp2 | cysteine-serine-rich nuclear protein 2 | -1.797 | 0.032 | 2.176 | -0.228 |
| Missed down-regulated genes | |||||
| Gsk3b | glycogen synthase kinase 3 beta | -1.490 | 0.017 | 1.341 | -4.025 |
| Aldh3a2 | aldehyde dehydrogenase family 3, subfamily A2 | -1.462 | 0.007 | 1.198 | -0.422 |
| Mapk10 | mitogen-activated protein kinase 10 | -1.455 | 0.028 | 1.306 | -2.712 |
| Myl2 | myosin, light polypeptide 2, regulatory, cardiac, slow | -1.431 | 0.007 | 1.329 | -0.868 |
| Tpm2 | tropomyosin 2, beta | -1.421 | 0.027 | 1.359 | -1.751 |
| Atp5j | ATP synthase H+ transporting mitochondrial F0 complex subunit F | -1.401 | 0.013 | 1.272 | -0.171 |
| Gmpr2 | guanosine monophosphate reductase 2 | -1.371 | 0.009 | 1.238 | -0.350 |
| Enpp4 | ectonucleotide pyrophosphatase/phosphodiesterase 4 | -1.362 | 0.028 | 1.316 | -1.748 |
| Chat | choline acetyltransferase | -1.353 | 0.024 | 1.292 | -0.253 |
| Dbt | dihydrolipoamide branched chain transacylase E2 | -1.323 | 0.024 | 1.274 | -1.046 |
| Missed up-regulated genes | |||||
| Lpin3 | lipin 3 | 1.372 | 0.004 | 1.146 | 0.366 |
| Pde1a | phosphodiesterase 1A, calmodulin-dependent | 1.374 | 0.008 | 1.219 | 0.974 |
| Gpam | glycerol-3-phosphate acyltransferase, mitochondrial | 1.374 | 0.019 | 1.214 | 0.427 |
| B4galt1 | UDP-Gal:betaGlcNAc beta 1,4- galactosyltransferase, polypeptide 1 | 1.391 | 0.005 | 1.334 | 3.184 |
| Ncf4 | neutrophil cytosolic factor 4 | 1.397 | 0.046 | 1.320 | 0.273 |
| Bcl2 | B cell leukemia/lymphoma 2 | 1.401 | 0.005 | 1.164 | 0.392 |
| Ndufc1 | NADH: ubiquinone oxidoreductase subunit C1 | 1.410 | 0.018 | 1.303 | 58.827 |
| Ikbkg | inhibitor of kappaB kinase gamma | 1.424 | 0.005 | 1.233 | 0.260 |
| Atp6v1b2 | ATPase, H+ transporting, lysosomal V1 subunit B2 | 1.438 | 0.045 | 1.381 | 0.265 |
| Gucy1b2 | guanylate cyclase 1, soluble, beta 2 | 1.490 | 0.034 | 1.426 | 0.943 |
| False up-regulated genes | |||||
| Kif3c | kinesin family member 3C | 1.706 | 0.009 | 1.832 | 3.179 |
| Nt5el | 5’ nucleotidase, ecto-like | 1.720 | 0.028 | 2.153 | 0.097 |
| Zfp362 | zinc finger protein 362 | 1.758 | 0.024 | 1.852 | 0.637 |
| Ctsg | cathepsin G | 1.887 | 0.018 | 1.890 | 0.192 |
| Tmem231 | transmembrane protein 231 | 1.912 | 0.027 | 2.196 | 0.128 |
| Adam12 | a disintegrin and metallopeptidase domain 12 | 1.966 | 0.036 | 2.313 | 0.423 |
| Ftcd | formiminotransferase cyclodeaminase | 1.979 | 0.033 | 2.214 | 0.163 |
| Ap1m1 | adaptor-related protein complex AP-1, mu subunit 1 | 2.063 | 0.006 | 2.079 | 11.060 |
| Lrrc71 | leucine rich repeat containing 71 | 2.153 | 0.034 | 2.559 | 0.138 |
| Gclc | glutamate-cysteine ligase, catalytic subunit | 2.330 | 0.028 | 2.456 | 1.332 |
Table 2.
Transcriptomic changes in the studied KEGG-constructed functional pathways. GENES (e.g.,:130/156) genes quantified/genes in the pathway, D% = percent down-regulated out of quantified genes, U% = percent up-regulated out of quantified genes, WPR = weighted pathway regulation, ΔREC (%) percent change in the overall control of transcript abundance in the pathway (negative for reduced control, i.e., increased expression variation).
Table 2.
Transcriptomic changes in the studied KEGG-constructed functional pathways. GENES (e.g.,:130/156) genes quantified/genes in the pathway, D% = percent down-regulated out of quantified genes, U% = percent up-regulated out of quantified genes, WPR = weighted pathway regulation, ΔREC (%) percent change in the overall control of transcript abundance in the pathway (negative for reduced control, i.e., increased expression variation).
| mmu | PATH | Description | GENES | D% | U% | WPR | ΔREC (%) |
|---|---|---|---|---|---|---|---|
| 04261 | ASC | Adrenergic signaling in cardiomyocytes | 130/156 | 6.15 | 13.08 | 19.97 | -3.71 |
| 04260 | CMC | Cardiac muscle contraction | 75/87 | 5.33 | 10.67 | 45.30 | -1.38 |
| 05142 | CHA | Chagas disease | 85/103 | 3.61 | 12.05 | 3.31 | -6.71 |
| 05415 | DIA | Diabetic cardiomyopathy | 184/211 | 3.80 | 7.07 | 29.55 | 0.40 |
| 05414 | DIL | Dilated cardiomyopathy | 81/94 | 6.17 | 12.35 | 7.05 | -0.45 |
| 00061 | FAB | Fatty acids biosynthesis | 18/19 | 0.00 | 5.56 | 2.49 | 17.10 |
| 00561 | GLM | Glycerolipid metabolism | 52/63 | 3.85 | 15.38 | 4.63 | -5.88 |
| 00564 | GPL | Glycerophospholipid metabolism | 83/98 | 4.82 | 9.64 | 1.54 | 2.27 |
| 00010 | GLY | Glycolisis/glucogenesis | 55/64 | 3.64 | 1.82 | 5.51 | 6.18 |
| 05410 | HCM | Hypertrophic cardiomyopathy | 78/91 | 6.41 | 8.97 | 6.73 | 2.23 |
| 00510 | NGL | N-Glycan biosynthesis | 50/53 | 4.00 | 4.00 | 14.18 | 14.63 |
| 00190 | OXP | Oxidative phosphorylation | 110/135 | 1.82 | 6.36 | 37.42 | 12.39 |
| 00230 | PUM | Purine metabolism | 114/134 | 10.53 | 11.40 | 5.42 | 4.19 |
| 00240 | PYR | Pyrimidine metabolism | 47/56 | 8.51 | 10.64 | 1.64 | -5.83 |
| 00100 | STB | Steroid biosynthesis | 17/20 | 0.00 | 5.88 | 0.69 | -11.37 |
| 00140 | SHB | Steroid hormone biosynthesis | 42/93 | 7.14 | 9.52 | 8.27 | -18.74 |
| 00280 | VLI | Valine, leucine and isoleucine degradation | 48/57 | 6.25 | 2.08 | 9.28 | 5.72 |
| ALL | All quantified genes | 19,605 | 3.65 | 5.96 | 15.67 | 0.30 |
Table 3.
Significantly down (D) and up (U, bold symbols)-regulated genes identified with our CUT-based algorithm from the most affected KEGG-constructed metabolic pathways. Note that the pathways are not mutually exclusive but partially overlapping. For instance, “Choline metabolism in cancer” and “Central carbon metabolism in cancer” share the genes Akt1, Akt3, Egfr, Hif1a, Kras, Mapk1, Pdgfra, and Pdgfrb.
Table 3.
Significantly down (D) and up (U, bold symbols)-regulated genes identified with our CUT-based algorithm from the most affected KEGG-constructed metabolic pathways. Note that the pathways are not mutually exclusive but partially overlapping. For instance, “Choline metabolism in cancer” and “Central carbon metabolism in cancer” share the genes Akt1, Akt3, Egfr, Hif1a, Kras, Mapk1, Pdgfra, and Pdgfrb.
| PATHWAY | R | GENES |
|---|---|---|
| Purine metabolism | D | Adcy4; Adprm; Ak2; Ampd2; Enpp4; Entpd5; Gmpr2; Nt5c; Pde4b; Prune1; Rrm1; Xdh |
| U | Adcy1; Adcy5; Adk; Adssl1; Gart; Gucy1b2; Nme1; Nme4; Nt5c2; Pde11a; Pde1a; Pde1b; Prps2 | |
| Choline metabolism in cancer | D | Akt3; Gpcpd1; Mapk10; Pdgfd; Pdgfra; Pdgfrb; Rac2 |
| U | Akt1; Egfr; Hif1a; Kras; Mapk1; Pdpk1; Pip5k1a; Plpp1; Plpp2; Plpp3; Prkca; Prkcb; Rac1; Slc44a1 | |
| Drug metabolism - other enzymes | D | Ces1d; Gsta3; Gstt1; Gstt2; Rrm1; Xdh |
| U | Cmpk1; Gsta4; Gstm1; Gstm6; Gstm7; Gstp1; Gusb; Nat2; Nme1; Nme4; Upp1 | |
| Glycerophospholipid metabolism | D | Adprm; Chat; Gpcpd1; Selenoi |
| U | Etnk2; Gpam; Lpin3; Mboat1; Pla1a; Plpp1; Plpp2; Plpp3 | |
| Glutathione metabolism | D | Gsta3; Gstt1; Gstt2; Rrm1 |
| U | Chac1; Gsta4; Gstm1; Gstm6; Gstm7; Gstp1; Odc1; Srm | |
| Central carbon metabolism in cancer | D | Akt3; Fgfr3; Pdgfra; Pdgfrb; Slc1a5 |
| U | Akt1; Egfr; Hif1a; Kras; Mapk1; Sco2 | |
| Drug metabolism - cytochrome P450 | D | Fmo1; Gsta3; Gstt1; Gstt2 |
| U | Fmo5; Gsta4; Gstm1; Gstm6; Gstm7; Gstp1 | |
| Glycerolipid metabolism | D | Aldh3a2; Mgll |
| U | Akr1b8; Aldh1b1; Gpam; Lpin3; Mboat1; Plpp1; Plpp2; Plpp3 | |
| Pyrimidine metabolism | D | Cmpk2; Entpd5; Nt5c; Rrm1 |
| U | Cmpk1; Nme1; Nme4; Nt5c2; Upp1 | |
| Cysteine & methionine metabolism | D | Agxt2; Amd2; Mpst |
| U | Adi1; Apip; Mtap; Srm; Tst | |
| Inositol phosphate metabolism | D | Inpp1; Isyna1 |
| U | Pi4k2a; Pik3c2b; Pip5k1a; Plcd3; Synj2 | |
| Fructose and mannose metabolism | D | Pfkfb1 |
| U | Akr1b8; Gmds; Khk; Pfkfb3; Pfkfb4 | |
| Galactose metabolism | U | Akr1b8; B4galt1; Gaa; Ugp2 |
| Tyrosine metabolism | U | Comt; Dct; Mif; Th |
Table 4.
Up (U) and down (D) regulated genes from top five altered KEGG-constructed signaling pathways. Numbers before “U” and “D” indicate how many up-and-down-regulated genes were quantified in the respective signaling pathway.
Table 4.
Up (U) and down (D) regulated genes from top five altered KEGG-constructed signaling pathways. Numbers before “U” and “D” indicate how many up-and-down-regulated genes were quantified in the respective signaling pathway.
| MAPK | PI3K-Akt | Rap1 | Ras | Chemokine | |||||
|---|---|---|---|---|---|---|---|---|---|
| 36U | 14D | 28U | 17D | 28U | 13D | 27U | 11D | 21U | 10D |
| Akt1 | Akt3 | Akt1 | Akt3 | Adcy1 | Adcy4 | Abl2 | Akt3 | Adcy1 | Adcy4 |
| Cacnb2 | Cacna1g | Bcl2 | Atf6b | Adcy5 | Adora2a | Akt1 | Fgfr3 | Adcy5 | Akt3 |
| Crk | Fgfr3 | Cdkn1a | Ddit4 | Adora2b | Akt3 | Calm3 | Igf2 | Akt1 | Cxcl11 |
| Csf1 | Hspa1a | Col4a1 | Epor | Akt1 | Fgfr3 | Csf1 | Mapk10 | Ccl21b | Cxcl14 |
| Dusp6 | Igf2 | Col4a2 | Fgfr3 | Calm3 | Map2k6 | Efna3 | Pdgfd | Ccl6 | Dock2 |
| Dusp8 | Map2k6 | Col4a5 | Foxo3 | Crk | P2ry1 | Egfr | Pdgfra | Ccr7 | Foxo3 |
| Efna3 | Map3k11 | Csf1 | Gsk3b | Csf1 | Pdgfd | Ets1 | Pdgfrb | Crk | Gsk3b |
| Egfr | Map3k2 | Efna3 | Igf2 | Efna3 | Pdgfra | Exoc2 | Rac2 | Cx3cr1 | Rac2 |
| Fgf18 | Mapk10 | Egfr | Mlst8 | Egfr | Pdgfrb | Fgf18 | Rapgef5 | Gnb3 | Rhoa |
| Gadd45b | Max | Eif4e | Pck2 | Enah | Prkd2 | Gnb3 | Rgl1 | Gng7 | Stat2 |
| Gna12 | Pdgfd | Fgf18 | Pdgfd | Fgf18 | Rac2 | Gng7 | Rhoa | Grk3 | |
| Ikbkg | Pdgfra | Gnb3 | Pdgfra | Itgal | Rapgef5 | Ikbkg | Ikbkg | ||
| Irak1 | Pdgfrb | Gng7 | Pdgfrb | Itgb1 | Rhoa | Kras | Kras | ||
| Kras | Rac2 | Ikbkg | Ppp2r5a | Itgb2 | Mapk1 | Mapk1 | |||
| Lamtor3 | Il4ra | Sgk1 | Kras | Mras | Prkaca | ||||
| Map3k3 | Itga9 | Thbs2 | Krit1 | Nf1 | Prkcb | ||||
| Map3k7 | Itgb1 | Tnxb | Mapk1 | Ngf | Prkcd | ||||
| Mapk1 | Itgb6 | Mras | Pla1a | Ptk2b | |||||
| Mapt | Kras | Ngf | Prkaca | Rac1 | |||||
| Mknk2 | Mapk1 | Pard6a | Prkca | Stat5b | |||||
| Mras | Ngf | Pfn1 | Prkcb | Tiam1 | |||||
| Myd88 | Pdpk1 | Prkca | Rab5a | ||||||
| Nf1 | Ppp2r2a | Prkcb | Rab5b | ||||||
| Ngf | Prkca | Rac1 | Rac1 | ||||||
| Ppp3ca | Rac1 | Rap1gap | Ralgapa2 | ||||||
| Prkaca | Thbs1 | Sipa1l2 | Stk4 | ||||||
| Prkca | Thbs4 | Thbs1 | Tiam1 | ||||||
| Prkcb | Tlr2 | Tiam1 | |||||||
| Ptpn5 | |||||||||
| Rac1 | |||||||||
| Relb | |||||||||
| Srf | |||||||||
| Stk3 | |||||||||
| Stk4 | |||||||||
| Tgfb3 | |||||||||
| Traf2 | |||||||||
Table 5.
Up (U) and down (D) regulated genes from the KEGG-constructed signaling pathways of: calcium, cAMP, cGMP-PKG, mTOR (mammalian (mechanistic) target of rapamycin) and Wnt (wingless-type MMTV integration site family). Numbers before symbols “U” and “D” indicate how many up-and-down-regulated genes were quantified in the respective signaling pathway.
Table 5.
Up (U) and down (D) regulated genes from the KEGG-constructed signaling pathways of: calcium, cAMP, cGMP-PKG, mTOR (mammalian (mechanistic) target of rapamycin) and Wnt (wingless-type MMTV integration site family). Numbers before symbols “U” and “D” indicate how many up-and-down-regulated genes were quantified in the respective signaling pathway.
| Calcium | cAMP | cGMP-PKG | mTOR | Wnt | |||||
|---|---|---|---|---|---|---|---|---|---|
| 15U | 14D | 14U | 11D | 15U | 10D | 16U | 9D | 13U | 12D |
| Adcy1 | Adcy4 | Adcy1 | Adcy4 | Adcy1 | Adcy4 | Akt1 | Akt3 | Crebbp | Fzd4 |
| Adora2b | Adora2a | Adcy5 | Adora2a | Adcy5 | Akt3 | Atp6v1b2 | Castor2 | Csnk2a1 | Gpc4 |
| Asph | Cacna1g | Akt1 | Akt3 | Adra2b | Atf6b | Clip1 | Ddit4 | Dvl1 | Gsk3b |
| Calm3 | Fgfr3 | Atp1a3 | Edn1 | Akt1 | Itpr2 | Dvl1 | Fzd4 | Map3k7 | Mapk10 |
| Egfr | Grm1 | Calm3 | Mapk10 | Atp1a3 | Itpr3 | Eif4e | Gsk3b | Notum | Porcn |
| Fgf18 | Itpr2 | Crebbp | Myl9 | Calm3 | Myh6 | Kras | Mlst8 | Ppp3ca | Prickle1 |
| Ngf | Itpr3 | Fxyd2 | Pde4b | Fxyd2 | Myl9 | Lamtor3 | Rhoa | Prkaca | Rac2 |
| Pde1a | Mst1r | Hcn2 | Ppp1r12a | Gna12 | Mylk4 | Lpin3 | Rictor | Prkca | Rhoa |
| Pde1b | Mylk4 | Mapk1 | Ppp1r1b | Gtf2ird1 | Ppp1r12a | Mapk1 | Sgk1 | Prkcb | Sfrp5 |
| Plcd3 | P2rx1 | Prkaca | Rac2 | Gucy1b2 | Rhoa | Pdpk1 | Rac1 | Sox17 | |
| Ppp3ca | Pdgfd | Rac1 | Rhoa | Mapk1 | Prkca | Smad3 | Tle2 | ||
| Prkaca | Pdgfra | Sst | Myh7 | Prkcb | Wnt1 | Tle3 | |||
| Prkca | Pdgfrb | Sstr5 | Nppb | Stradb | Wnt5b | ||||
| Prkcb | Phkg1 | Tiam1 | Ppp3ca | Wdr59 | |||||
| Ptk2b | Srf | Wnt1 | |||||||
| Wnt5b | |||||||||
Disclaimer/Publisher’s Note: The statements, opinions and data contained in all publications are solely those of the individual author(s) and contributor(s) and not of MDPI and/or the editor(s). MDPI and/or the editor(s) disclaim responsibility for any injury to people or property resulting from any ideas, methods, instructions or products referred to in the content. |
© 2024 by the authors. Licensee MDPI, Basel, Switzerland. This article is an open access article distributed under the terms and conditions of the Creative Commons Attribution (CC BY) license (http://creativecommons.org/licenses/by/4.0/).
Copyright: This open access article is published under a Creative Commons CC BY 4.0 license, which permit the free download, distribution, and reuse, provided that the author and preprint are cited in any reuse.