Submitted:
26 January 2024
Posted:
28 January 2024
You are already at the latest version
Abstract
Amidst the recent energy crisis, the pivotal role of resource efficiency and renewable energy sources (RES) for sustainable development has become apparent. Transition to sustainability involves decentralized energy solutions empowering local communities to generate, store, and utilize their energy, diminishing reliance on centralized systems and potentially transforming them into power flexibility resources. This is particularly crucial in non-interconnected island systems that primarily rely on imported oil for electricity generation. Such reliance not only implies high production costs but also threatens energy security and adds to the environmental footprint of local economic activities. Addressing the above necessitates, amongst other elements, the adoption of advanced energy management with sophisticated forecasting and demand-side management (DSM) strategies. In response, we introduce a versatile algorithm investigating the impact of DSM at the community scale, designed to maximize the utilization of renewable energy produced from local installations. Integrated as an ancillary module in an advanced energy management platform, the algorithm undergoes testing using datasets collected from end-consumers and a small-scale RES installation on the island of Tilos, Greece. This study not only offers insights for energy stakeholders but also establishes theoretical parameters that can inform subsequent decision-making processes.
Keywords:
demand side management
; load shifting
; island community
; energy management platform
; renewable energy sources
1. Introduction
The recent energy crisis underscores the pivotal role of energy and resource efficiency alongside further exploitation of renewable sources towards sustainable development. At the same time, non-interconnected island electricity systems primarily rely on imported oil for electricity generation, which not only implies high production costs but also threatens energy security and adds to the environmental footprint of local economic activities [1,2].
Shifting towards a sustainable future involves decentralized energy solutions and local communities generating, storing, and using their own energy, diminishing reliance on centralized systems [3] or even positioning them as flexibility resources [4]. This transition necessitates the adoption of advanced energy management featuring sophisticated forecasting techniques [5] and demand-side management (DSM) strategies [6].
Acknowledging the above, we have developed a versatile algorithm to investigate the impact of DSM at the community scale. The algorithm is designed to tap a predetermined, hypotehtical flexibility potential inherent in electricity demand, with the objective of maximizing the direct utilization of energy generated from local RES installations. At the same time, it stands as an ancillary software module, deployable in expandable energy management platforms such as in [7], which, as part of a decentralized energy data-driven ecosystem aims also in improving energy stakeholders’ operational performance [8].
The proposed module queries day-ahead forecasts from a given platform [7] and feeds them into an optimization algorithm, which is tasked with identifying hour-long load demand adjustments that ultimately maximize the daily energy consumption covered by local RES installations. The adjustments maintain the daily energy demand unchanged, meaning that the proposed DSM strategy falls under the category of “Load Shifting”. The module iteratively executes this process, relating various adjustment levels with the direct consumption of RES, as detailed in the subsequent section. Such relations not only provide insights for energy stakeholders, but also function as theoretical thresholds to be taken into account in posterior optimization processes and decision-making modules.
2. Materials and Methods
The Materials and Methods section details the use case and the proposed framework.
2.1. The Use Case
In the present use case, a DSM strategy is employed to make the most of the electricity produced from a local RES installation. This involves tapping the flexibility of consumers’ electricity demand. The above is accomplished using an optimization algorithm. This algorithm utilizes a time series of load demand and of RES power generation to determine the most efficient load demand reallocation. In the present study, these time series extend over a 24-hour period.
The load demand of a six-consumers group can be met by the grid and/or by a local solar photovoltaic (PV) installation. Both consumers and the RES installation are located on the island of Tilos. The optimization algorithm adjusts the initial load demand profile within specified margins to maximize alignment with solar PV power generation. These adjustments maintain the total energy demand unchanged, meaning that the proposed DSM strategy falls under the category “Load Shifting”. Importantly, the solar PV power generation is upscaled. The actual nominal power of the installation is 3.36 kWp, and the upscaled is 10 kWp.
The DSM strategy is applied in a day-ahead fashion, with hour-long timesteps. To do so, in this paper, we adopted the perfect forecast approach, hence, using unaltered measurements registered to a particular time period.
A day's worth of random load demand data is merged with the scaled measurements of the solar PV installation's power output. This combined dataset acts as input for the optimization algorithm, accompanied by a set of hyperparameters defining the maximum allowable adjustments in load demand. The algorithm mainly generates two 24-hour time series, indicating whether and at what degree should the load demand increase or decrease.
This process is iterated for various combinations of hyperparameters, using the same datasets. In each iteration, the consumption directly met by the solar PV installation is calculated, mapping the relationship between load shifting and the utilization of the local RES installation.
2.2. The Framework
The proposed framework evaluates the impact of DSM on RES utilization, under different levels of adjustments in load demand, in a repetitive fashion. To streamline this process, the framework steps are integrated into a pipeline, automating its execution.
Initially, the optimization horizon and the combinations of the maximum allowed power adjustments—towards both greater and lower values at each time step of the optimization horizon—are defined. Subsequently, the pipeline is executed repeatedly, according to the combinations number, for a particular time period. The pipeline comprises the following six steps:
- Data acquisition & cleansing. The pipeline commences with the retrieval of two datasets for the desired period of time. Following the retrieval phase, a rigorous cleansing process is applied to eliminate impurities within the datasets;
- Power upscale. The cleansed datasets are upscaled, matching a hypothetical upscale in the nominal power of the local RES installation;
- Forecasting. The processed datasets are tailored to meet the specific requirements of an external module, which generates predictions of the RES production and of the aggregated load demand. The prediction horizon is also provided to that module, as it should match the optimization horizon;
- Decision-making. The obtained predictions are fed to an optimization algorithm, which computes the power adjustments for each time step within the optimization horizon;
- Performance evaluation. The values of a set of Key Performance Indicators (KPIs) are computed;
- Storage of computations. The raw, processed and forecasted data are stored, along with the given scenario characteristics, in a database. The database contents are visualized using an open-source monitoring platform, i.e. Grafana;
After completing the sixth step, the process returns to Step 4 and uses the next combination of the maximum allowed power adjustments as input. Once all the combinations are tested, the process is terminated.
2.3 The Integration with the Existing Energy Management Platform
The -customized for the use case- pipeline is integrated into the energy management platform as illustrated in Figure 1. The process begins by sourcing data from two repositories; one on Tilos Island and the other at the University of West Attica. These repositories provide data related to a 3.36 kWp solar PV installation and to the load demand for a pool of local consumers. Among these consumers, data related to the load demand for a subset of six consumers is maintained. Both connections are facilitated through the energy management platform.
The retrieved datasets undergo thorough cleansing to remove impurities. The power-related intermediate dataset is upscaled to match the output of a 10 kWp installation, which constitutes a potential upgrade of the current installation. Subsequently, the datasets are tailored to meet the specific requirements of the forecasting module, i.e. currently set to perfect forecasting mode (outputs equal to inputs).
Following this, data is directed to the optimization algorithm, computing operational signals for each time step within the optimization horizon. This involves typical actions for building an optimization model. Next, designated KPIs are computed. In this paper, only the RES utilization and the RES share in load demand are computed.
In the context of this paper, the pipeline is executed multiple times for each of two fixed reference time-periods, enabling a comprehensive assessment of the DSM impact on RES shares.
2.4. Data Acquisition & Cleansing
The measurements are stored in an energy management platform operated by the University of West Attica and the Municipality of Tilos. The platform currently manages data related to load demand, from public buildings, households and commercial stores, hotels, electric vehicle chargers, and water pumping stations. Additionally, it manages data related to power generation, from two solar photovoltaic installations. The platform enables the development of various services tailored for different end-users, with the proposed pipeline embedded as one of these services.
2.4.1. Load Demand
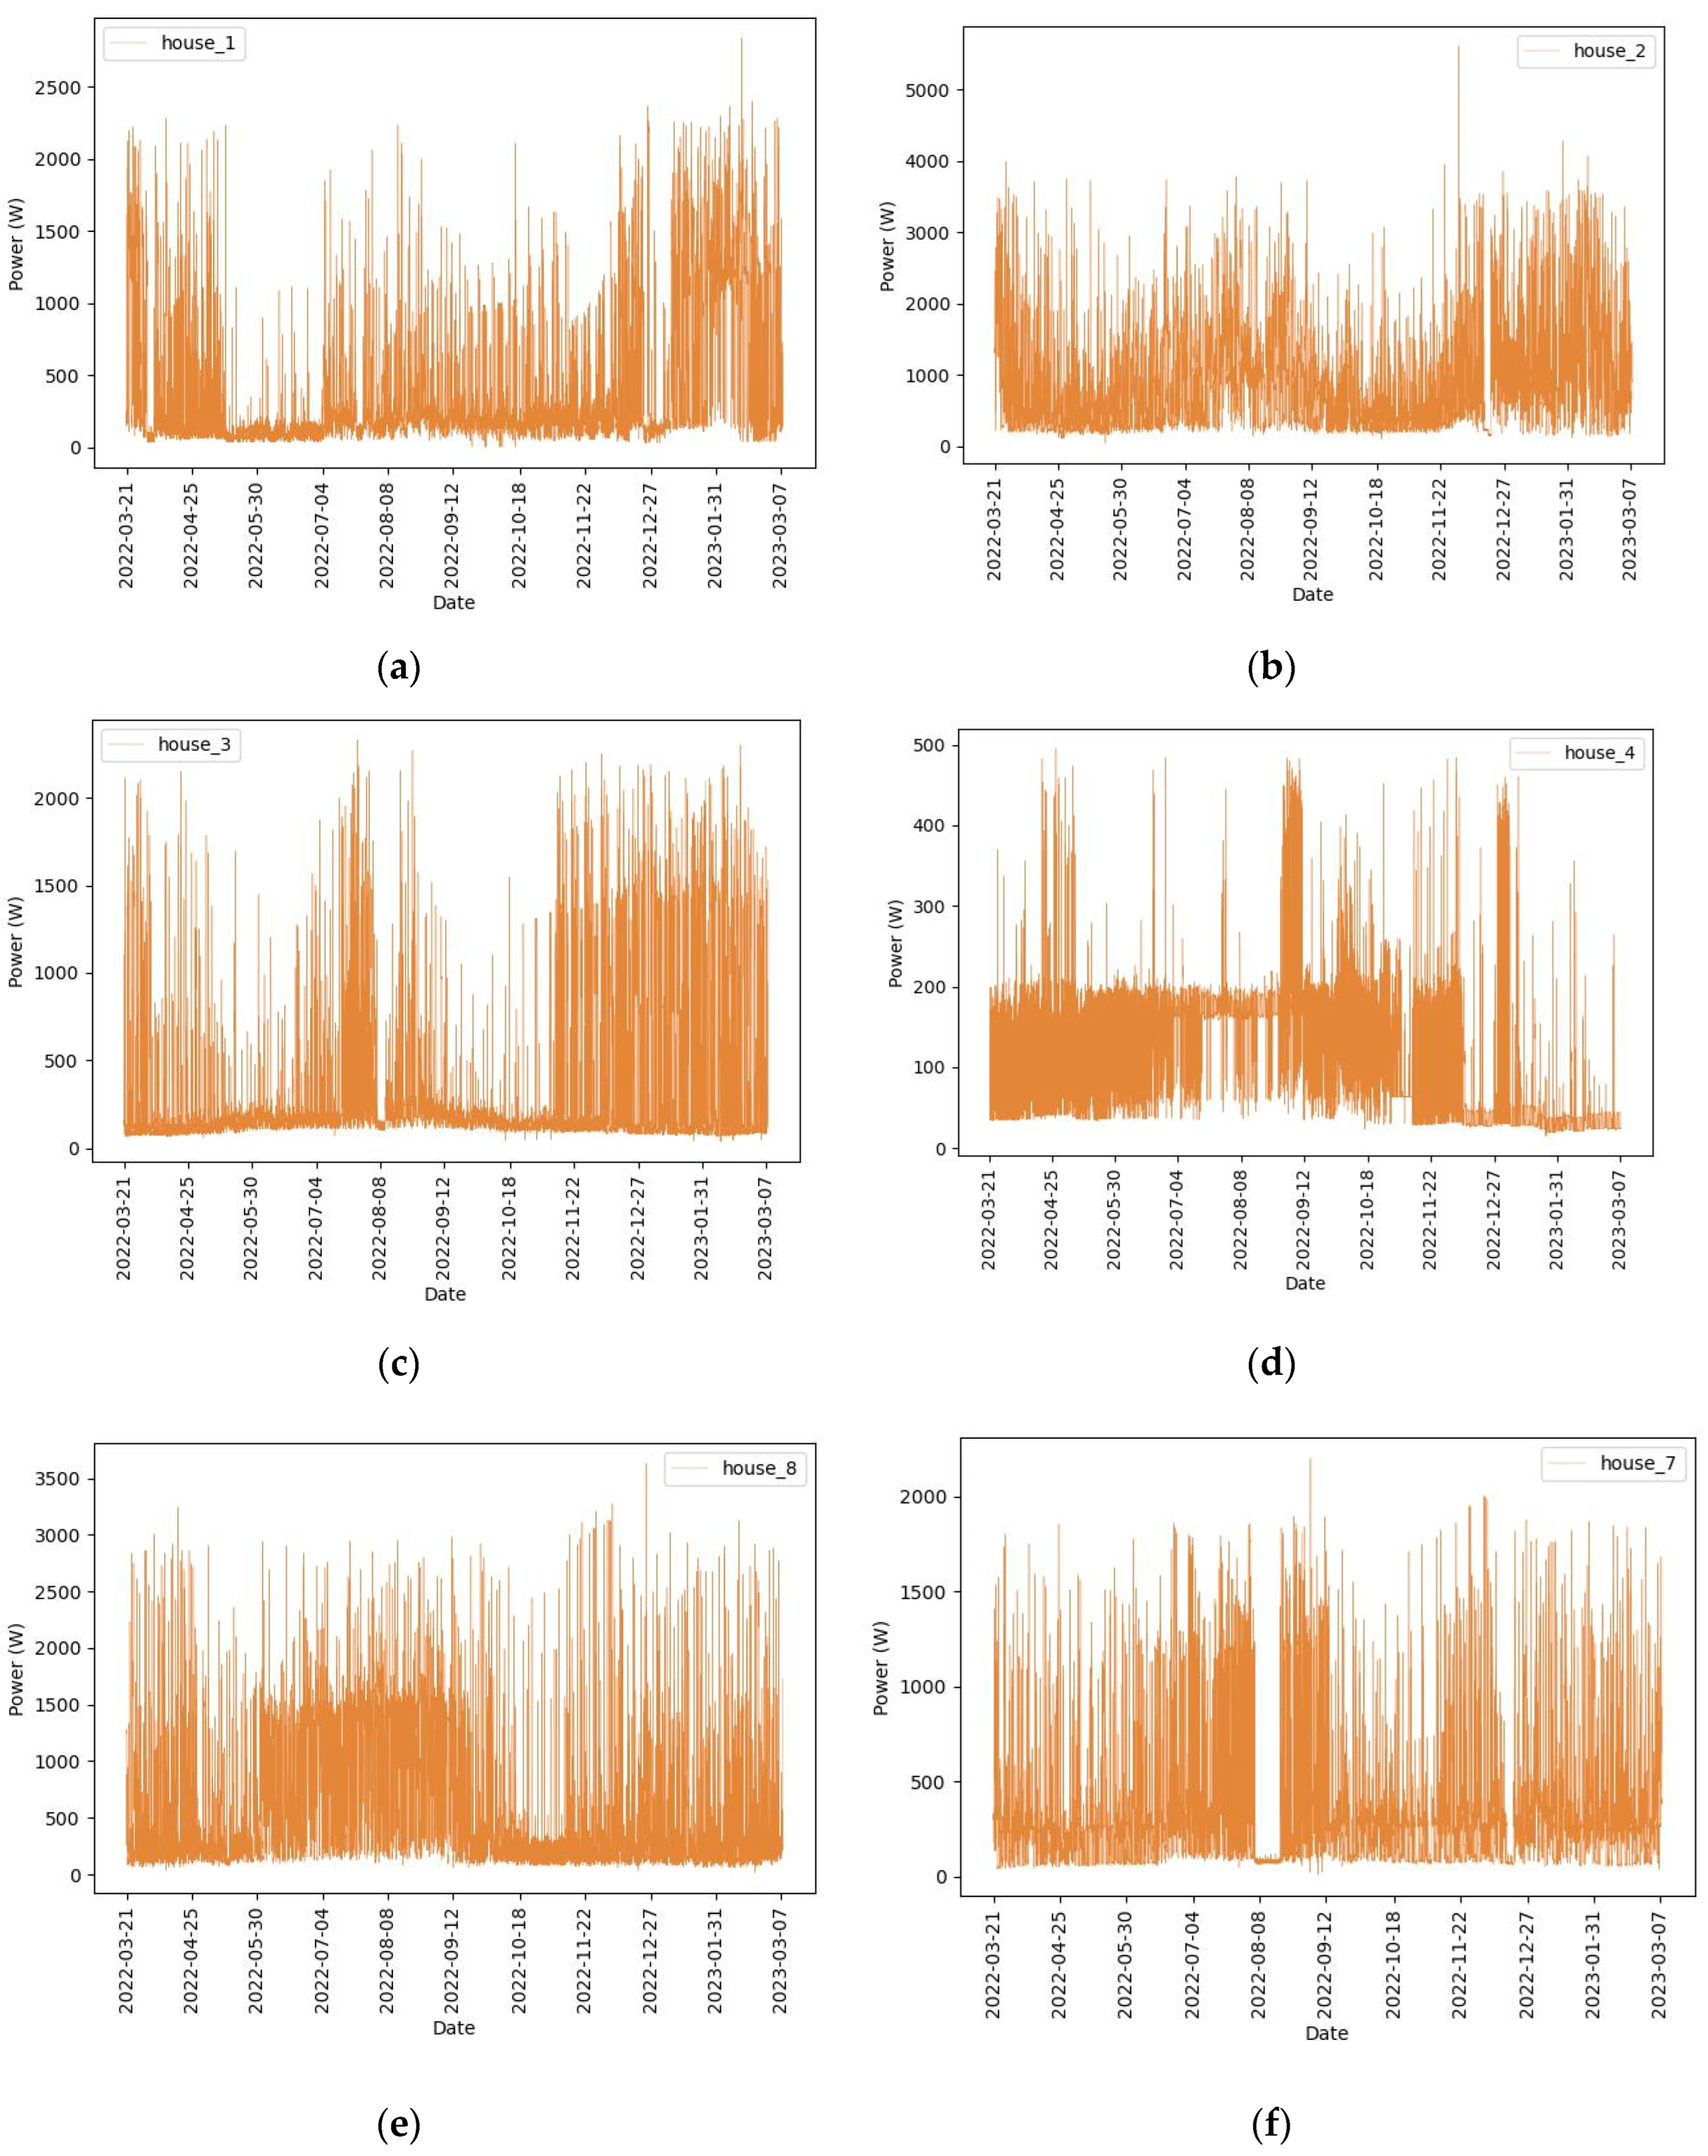
The utilized mean power measurements, or load demand, refers to 6 end-users and it has a variable frequency, which for the most part of the dataset is 4 min. The raw data have 91906 rows (timesteps) and 6 columns. The measurements start from 2022-03-01 00:04:00 and end in 2023-03-07 16:54:00, meaning the time-length is 371 days and 16.8 hours.
In the data validation stage the processing steps are as follows:
- Data time-index confinement. Data registered to the testing period of the installations that log the information are removed. This is in the period between 2022-03-01 00:04:00 and 2022-03-20 23:00:00. The new dataset’s first timestamp is 2022-03-21 00:00:00;
- Removal of false measurements. The frozen values indicate a false measurement. To remove such measurements, the similarity of 3 consecutive values is checked;
- Outliers’ replacement. For each end-user, the outliers are detected and replaced with NaNs, using the Z-score method;
- Time series resample. The 6-time series, one for each end-user, are resampled with a 1h frequency. The missing values are filled with NaNs;
- Data imputation or removal. Missing data is imputed using linear interpolation. If there's a substantial time gap in the missing data, values from the same time step on the previous day are employed as a substitute, if they are available;
- Aggregations. The aggregated load demand is computed by summing the mean hourly power consumption of the six end-users.
The intermediate data have a shape of 8441 rows (hourly timesteps) and 7 columns. Their frequency is constant and do not contain any NaNs. In Appendix’s Figure A1, the timeseries per end-user is illustrated. The aggregated load demand is shown in Figure 2. Two distinct days being part of this dataset are exploited in the present study.
2.4.2. Solar PV Power Generation
The data regarding solar PV power generation are registered to an installation of 3.36 kWp. The installation is located on the island of Tilos. The retrieved data have nine columns, corresponding to the observables recorded by the installation’s inverter, and 1440 rows (timesteps), as it corresponds to one day's worth of data at a one-minute frequency.
The measurements start at 2023-10-15 00:00:00+03:00 and end at 2023-10-15 23:59:59+03:00. It should be noted that data during the very morning and afternoon, when solar PV generation is zero, are not logged, thus, one has to impute missing data accordingly. More specifically, the following steps are carried out in order to validate the data:
- Data time-index confinement and resample. Data are resampled, using the same frequency, in order to reindex them, so as to contain exactly 1440 timesteps, which correspond to one day. The missing values are filled with NaNs;
- Data imputation or removal. Missing data are imputed using linear interpolation. If there is a substantial time gap in the missing data, values from the same time step of the previous day are employed as a substitute, if available;
- Data resample. The data are resampled into an hourly frequency. The employed aggregation function is the mean. Various aggregation functions yield distinct strategies for managing uncertainty in the power generation side. For instance, choosing the first quartile (q1) is a safer alternative than opting for the third quartile (q3).
The resampled data are illustrated in Figure 3. The total energy production is ~17kWh. These data are upscaled, as explained in the following section and subsequently consumed by the proposed DSM algorithm.
2.5. Power Upscale
The power generation of the local solar PV installation is upscaled, matching a hypothetical upscale in the nominal power capacity. To do so, the capacity factor of the installation is initially computed for each timestep. Subsequently the capacity factor is applied to the desired power capacity, yielding the scaled-up power generation curve.
2.5. Forecasting
In this paper, we opted for the perfect forecasting approach, as the influence of uncertainty is beyond the scope of our study. As a result, both the inputs and outputs of the forecasting module represent the processed measurements. Subsequently, those measurements are directed to the optimization module.
2.6. Decision Making
The decision making is carried out by an optimization model, which is based on linear programming. Its objective function minimizes the sum of the amplified violations vAMPL, over the optimization horizon T, which, in our case is set to 24 timesteps t, as shown in Equation 1.
The computation of vAMPL is based on the violation vNRM, of the balance between the power pRES that is generated by the solar PV plant, and the proposed load demand lDSM. The magnified value of vNRM gives more weight to violations that occur when the RES power is increased, based on Equation 2.
The balance between pRES and lDSM is monitored through the constraint of Equation 3. Any imbalances are stored in the variable vNRM.
The lDSM is linked to the original load demand (Baseline), lBL via Equation 4. In particular, the lDSM is determined as the lBL altered towards higher values by the variables pADD and towards lower values by the variable pRED.
The power addition is limited to a fraction of the original load demand by the factor FADD, at each timestep of the optimization horizon, as shown in Equation 5. Similarly, the power reduction is limited using the factor FRED, as shown in Equation 6.
Also, any power additions are meaningful only during timesteps where pRES exceeds lBI. The latter is introduced to the optimization model through Equation 7. Given that both pRES and lBI are known at the start of the optimization process, there is no requirement to model the if statement exclusively using binaries. Instead, this condition is integrated as a parameter, i.e. a list comprising zeros and ones.
The opposite also stands for any power reductions. Those are meaningful only during timesteps where pRES is available, thus pRES being greater than zero. Given that pRES is known at the start of the optimization process, the if condition is integrated as a parameter through Equation 8.
where FSEN is a sensitivity factor that mitigates the influence of measurements near zero. In the present study that parameter is set to 100W.
In the final step, Equation 9 is incorporated into the optimization algorithm, guiding the allocation of energy reductions across the two halves of the optimization horizon.
where Ffh plus Ffh equals unity. Currently, these parameters are set to 0.5, evenly distributing the energy reductions across the two halves of the optimization horizon.
2.7. Performance Evaluation
The impact of DSM on RES Utilization is evaluated for each set of operational conditions. This involves computing RES Utilization for both the baseline scenario, S=BL and the scenario incorporating DSM, S=DSM, as explained hereunder.
The amount of energy u that is produced by the RES installation and is directly consumed by the consumers is computed using Equation 10, over each time step t of the optimization horizon T, for each scenario S. The equation specifies that u equals the load demand, l, when the latter is less than the power generated from the local RES installation, p, and vice versa.
The load demand can be satisfied either by the grid or by the local RES installation. The RES share, s, is calculated for each day, d, as shown in Equation 10. The improvement, i, of RES share between the baseline scenario and the DSM scenario is computed using Equation 11.
3. Results
The intraday behaviour for different scenarios of load demand flexibility, i.e. defined by the level of permitted power adjustments, is next presented. Following this, the balance between load shifting and direct exploitation of RES is elucidated.
3.1. Intraday Behaviour of the DSM Algorithm
The DSM algorithm is designed to adjust loads according to the available solar PV power generation, with the goal of minimizing reliance on grid-supplied electricity. This section evaluates the intraday behaviour of the algorithm across two distinct occasions and under four different load demand flexibility scenarios, which are the following:
- Mild adjustments scenario. In this scenario, the hyperparameters limiting upward (FADD) and downward load demand adjustments (FRED), in relation to load demand at a given timestep, are set to 10%;
- Moderate adjustments scenario. Both hyperparameters are set to 20%;
- Ample adjustments scenario. Both hyperparameters are set to 30%;
- Unrestricted additions scenario. The hyperparameter FADD is set to 100%, while allowing moderate reductions in load demand (FRED is set to 20%).
Each occasion involves a random day's worth of load demand data and solar PV power generation. In particular, the first intraday behaviour analysis involves load demand data recorded on 17th of May 2022 and solar PV power generation data on 15th of October 2023. The aggregated energy demand is 44.3kWh and the solar PV energy yield is 50.9kWh. The second analysis involves load demand data registered to 26th of April 2022, with a corresponding energy demand of 105.9kWh, while maintaining the same data regarding the RES power generation.
In terms of the algorithm's load demand reallocation priorities, it is directed to slightly prioritize increasing load demand during time periods when RES power is elevated. Additionally, the algorithm is guided to evenly distribute decreases in load demand between the first and second halves of the day.
The intraday behaviour for the scenario with mild adjustments is shown in Figure 4a. Starting at the beginning of the day and continuing until the solar PV installation starts generating power, the optimization algorithm chooses to reduce load demand. Subsequently, the algorithm chooses to increase load demand until the afternoon (16th timestep), when solar PV power generation decreases significantly. The increase is directly proportional to the initial load demand curve, resulting in greater load demand values receiving greater load demand increases, and vice versa. Also, with the daily energy demand remaining constant, these additions are enabled by the choice to reduce load demand again during the afternoon (after 18th timestep).
Increasing the adjustment limits, FADD and FRED, makes the load demand significantly more flexible, resulting in further reduction of grid-supplied energy. That is illustrated in Figure 4b and Figure 4c, where the limits increase to 20% and 30%, respectively, shifting more loads beneath the solar PV power curve. The adjustment pattern remains consistent with that of the scenario with mild adjustments. However, both reductions and additions in load demand are proportionally larger.
In Figure 4d, where load demand additions are unrestricted, a different adjustment pattern is observed. The optimization algorithm concentrates the load demand near the 12th timestep, where solar PV power maximizes. This behaviour is a direct result of Equation 2 constraint. Thus, for an exceedingly high setting of FADD, the load demand pattern becomes less uniformly distributed in time.
Using the load demand data registered on 26th of April 2022, where the energy demand is more than double compared to the first analysis, load shifting is primarily driven by the hyperparameter FADD. On the given day, load demand is high during the early and late timesteps when solar PV power generation is zero, while during time periods with significant solar PV power generation, load demand is low. This load demand pattern, with identical settings for FRED and FADD, results in significantly larger power reduction limits compared to power addition limits. Consequently, increasing the setting of FADD is more crucial for overall load demand flexibility compared to FRED. These observations are prominent in Figure 5a–d.
3.2. Analysis of the Load Demand Flexibility Impacts on the RES Shares
The load demand can be satisfied either by the grid or by the local RES installation. The RES share for load demand dataset and each flexibility scenario (combination of FADD and FRED) discussed in the previous section, is reported in Table 1.
Setting both parameters, FADD and FRED to 30%, i.e. an increased limit, the RES share can reach up to approx. 52%. This represents a substantial improvement of 25% compared to the baseline scenario, where load shifting is prohibited. If the higher energy demand (i.e. 105.9kWh) is the case, the improvement tops at 19.3%, which is considerably lower than the achieved improvement for the lower energy demand case (i.e. 44.3kWh).
Examining the flexibility scenario wherein FADD and FRED are set to 100% and 10%, respectively, results in further enhancements in RES shares, reaching 38.5% for the higher energy demand dataset and 30.3% for the lower energy demand dataset. While the improvement is substantial in both cases, it follows a different path (pairs of FADD and FRED) for each scenario, indicating that different combinations of FADD and FRED prove to be more suitable for distinct load demand curves that present different intraday behavior. This becomes evident in Figure 6a,b, where the RES Share is depicted in relation to the FADD and FRED parameters. Both figures illustrate that increasing the value of FADD exerts a more significant impact on RES shares compared to increasing FRED, up to a specific point, beyond which further enhancements are constrained. That point is approx. (15%, 27%) and (10%, 27%) for the lower and higher energy demand datasets, respectively.
Comparing Figure 6a,b also indicates that for the particular load demand patterns, when the daily energy demand grows, for a given FADD, a smaller FRED is necessary for improving the RES share by the same amount. Thus, smaller adjustments in load demand are necessary, in terms of percentages.
4. Discussion
The examination of the intraday behavior of the DSM algorithm reveals its responsiveness to different load demand flexibility scenarios, under different daily energy demand datasets. The algorithm demonstrates that increased flexibility, as indicated by higher load demand adjustment limits (FADD and FRED), results in a more pronounced reduction in grid-supplied energy. The algorithm prioritizes load adjustments during periods of increased RES power generation, distributing load decreases evenly throughout the day. Also, under scenarios with unrestricted additions, the algorithm concentrates load demand near peak solar PV power generation, leading to a less uniform distribution over time.
The analysis of the load demand flexibility impacts on the RES shares showcase the algorithm's ability to optimize load shifts for exploiting RES. The algorithm's ability to shift load demand according to FADD and FRED settings significantly influences RES utilization, ranging from 6% to 25% for smaller to larger interventions in load demand curve.
Also, the analysis exhibits the significance of tailoring distinct combinations of FADD and FRED to specific load demand and power generation patterns, with the optimal choice contingent upon the desired intraday behavior. The impact of increasing the adjustment limits on RES shares is more pronounced up to a certain threshold, beyond which further enhancements are constrained. This insight underscores the critical consideration of load demand patterns and associated parameters in optimizing DSM algorithms for enhanced RES integration.
In prospective research endeavors, attention could be directed towards the practical application of the cascading optimization approach. This involves the sequential stacking of two models, where the output of the initial model becomes the input for the second. Within this framework, there is a specific focus on leveraging the outputs generated by the presented DSM algorithm, using a second optimization model, for the optimal allocation of the load demand adjustments to distinct energy-intensive appliances. The investigation will center on exploring the practicality and effectiveness of this approach, as well as evaluating the scalability and efficiency of this cascading optimization framework, especially as the optimization timestep duration decreases from hourly to minute intervals.
5. Conclusions
In summary, this study extensively explored the day-to-day behavior and impact of a versatile DSM algorithm, focusing on adjusting aggregated load demands and their effects on RES shares. The algorithm applied using data from consumers and a solar PV power plant situated on Tilos Island in Greece, aims to maximize renewable energy utilization, providing crucial insights for DSM applications.
The study underscores the effectiveness of load shifting in reducing grid dependency, highlighting also that increased load demand flexibility markedly reduces grid-supplied energy. In the baseline scenario, a solar PV power installation with a 10kWp nominal capacity covers approximately 42% and 28% of the daily energy demand in low and high demand scenarios, respectively. Implementation of DSM resulted in enhancements to RES shares, ranging from 6% to 25%, contingent on load demand adjustment limits that varied up to 30% of the hourly load demand. Thus, the pivotal role of enhanced load demand flexibility, indicative of the ability to shift loads, is underscored in achieving substantial reductions in grid dependency.
The study also emphasizes the critical importance of considering the load demand patterns and associated parameters in optimizing DSM algorithms to strategically prioritize load additions during period of high-RES power, hence enhancing RES integration, with minimum intervention in consumers behaviour, or else, load demand curve.
Nomenclatures
| The optimization horizon | |
| The timestep of the optimization | |
| The amplified violation of the balance between load demand and power generation | |
| The violation of the balance between load demand and power generation | |
| The power generated from the local RES installation | |
| The proposed load demand | |
| The actual load demand | |
| The suggested increase in load compared to the current load demand | |
| The suggested decrease in load compared to the current load demand | |
| The parameter to limit the suggested increase in load demand | |
| The parameter to limit the suggested decrease in load demand | |
| The parameter to mitigate influence of power measurements near zero | |
| The weigh factor for prioritizing reduction in the first half of T | |
| The weigh factor for prioritizing reduction in the second half of T |
Author Contributions
Conceptualization, G.T., D.Z. and J.K.; methodology, G.T., D.Z. and J.K.; software, G.T.; validation, J.K; data curation, D.Z.; writing—original draft preparation, G.T. and D.Z.; writing—review and editing, J.K.; visualization, G.T.; supervision, J.K. All authors have read and agreed to the published version of the manuscript.
Funding
The work presented is based on research conducted within the framework of the H2020 European Commission project BD4NRG (Grant Agreement No. 872613).
Data Availability Statement
The data presented in this study are available on request from the corresponding author. The data are not publicly available due to privacy and ethical restrictions.
Acknowledgments
The authors would like to thank the Municipality of Tilos island for its support in maintaining the operation of the local smart metering and demand side management platform.
Conflicts of Interest
The authors declare no conflict of interest.
Nomenclatures
Appendix A
The Appendix A contains the load demand data of six consumers, located on the island of Tilos, Greece. The data are registered to the time period between 2022-03-01 00:04:00 and 2023-03-07 16:54:00 and are shown in Figure A1.
Figure A1.
(a), (b), (c), (d), (e), (f) The mean hourly load demand data of the six consumers examined after the cleansing process.
Figure A1.
(a), (b), (c), (d), (e), (f) The mean hourly load demand data of the six consumers examined after the cleansing process.
References
- Tzanes, G.; Zafirakis, D.; Makropoulos, C.; Kaldellis, J. K.; Stamou, A. I. Energy vulnerability and the exercise of a data-driven analysis protocol: A comparative assessment on power generation aspects for the non-interconnected islands of Greece. Energy Policy 2023, 177, 113515. [Google Scholar] [CrossRef]
- Ioannidis, A.; Chalvatzis, K. J.; Li, X.; Notton, G.; Stephanides, P. The case for islands’ energy vulnerability: Electricity supply diversity in 44 global islands. Renew Energy 2019, 143, 440–452. [Google Scholar] [CrossRef]
- Lund, H. Renewable energy systems: a smart energy systems approach to the choice and modeling of 100% renewable solutions. Academic Press, 2014.
- Akrami, A.; Doostizadeh, M.; Aminifar, F. Power system flexibility: an overview of emergence to evolution. J. Mod. Power Syst. Clean Energy 2019, 7, 987–1007. [Google Scholar] [CrossRef]
- Alamo, D. H., et al., An Advanced Forecasting System for the Optimum Energy Management of Island Microgrids. Energy Procedia 2019, 159, 111–116. [CrossRef]
- Javor, D.; Janjic, A. Application of Demand Side Management Techniques in Successive Optimization Procedures. Commun. Dependability Qual. Manag. Int. J. 2016, 19, 40–51. [Google Scholar]
- Kaldellis, J. K.; Zafirakis, D. Prospects and challenges for clean energy in European Islands. The TILOS paradigm. Renew Energy 2020, 145, 2489–2502. [Google Scholar] [CrossRef]
- BD4NRG Project. Big Data for Next Generation Energy. Accessed: Dec. 18, 2023. [Online]. Available: https://www.bd4nrg.
Figure 1.
The flow chart of the pipeline.
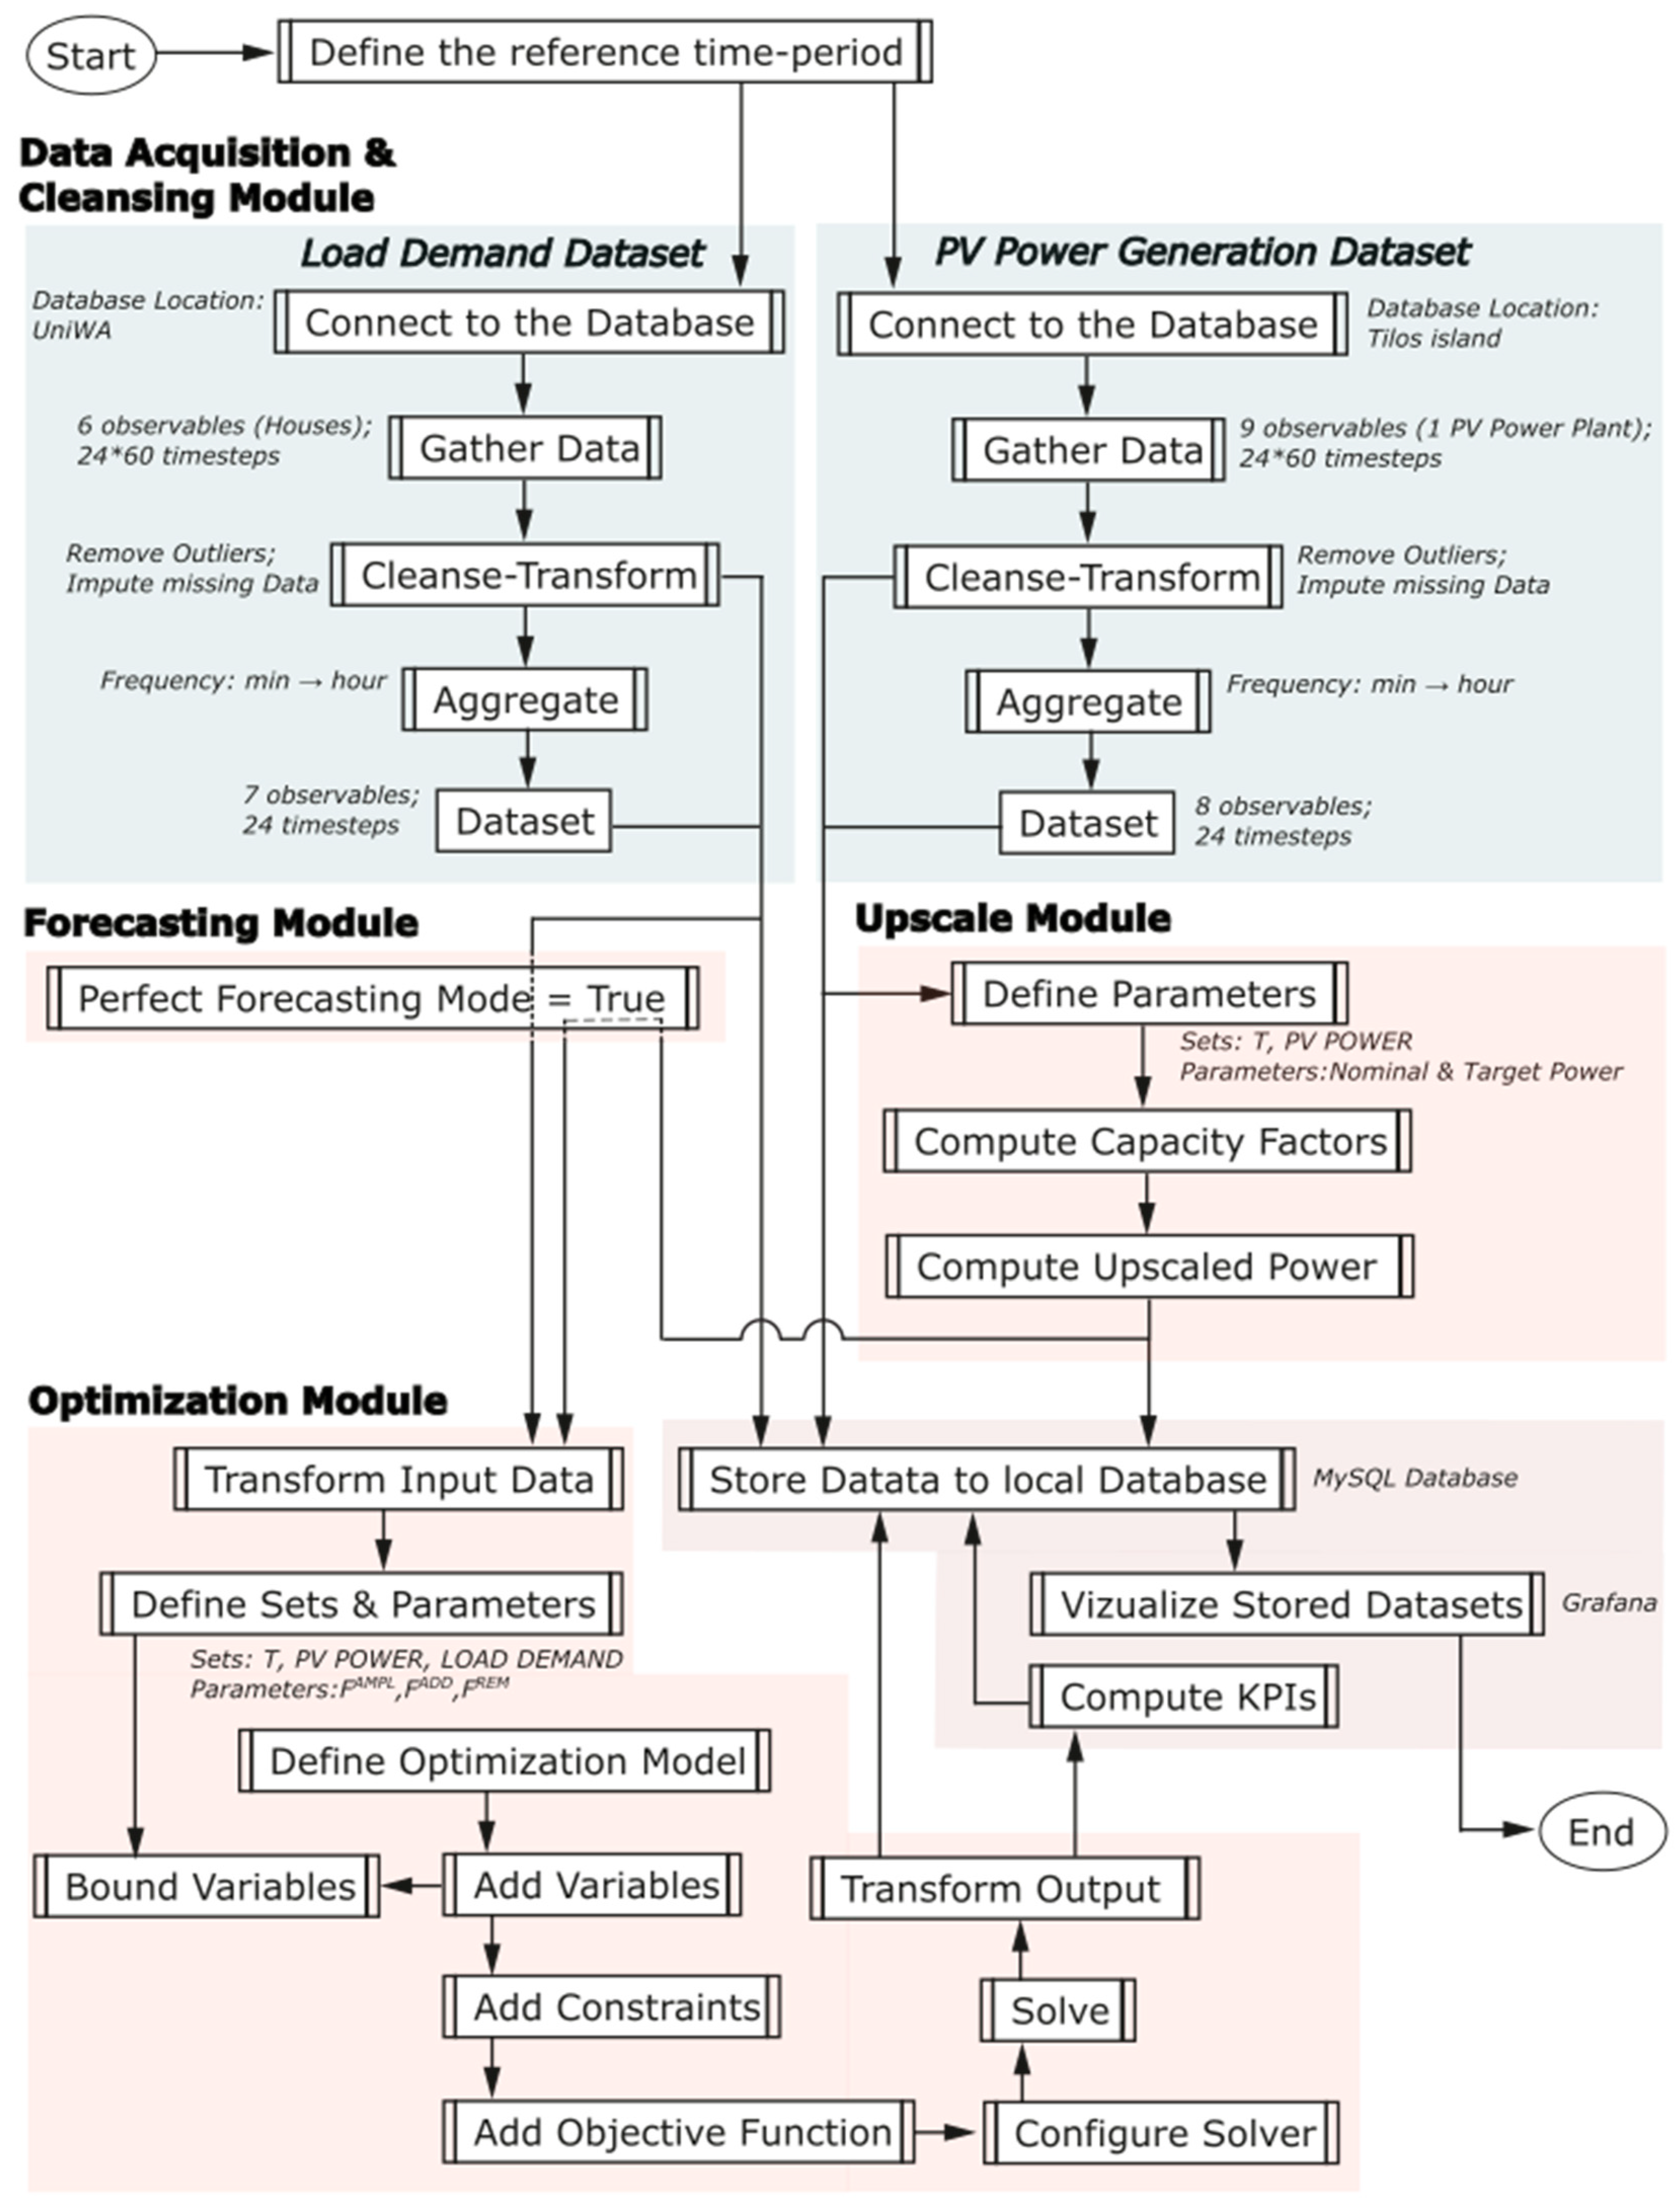
Figure 2.
The aggregated load demand data, after the cleansing process.
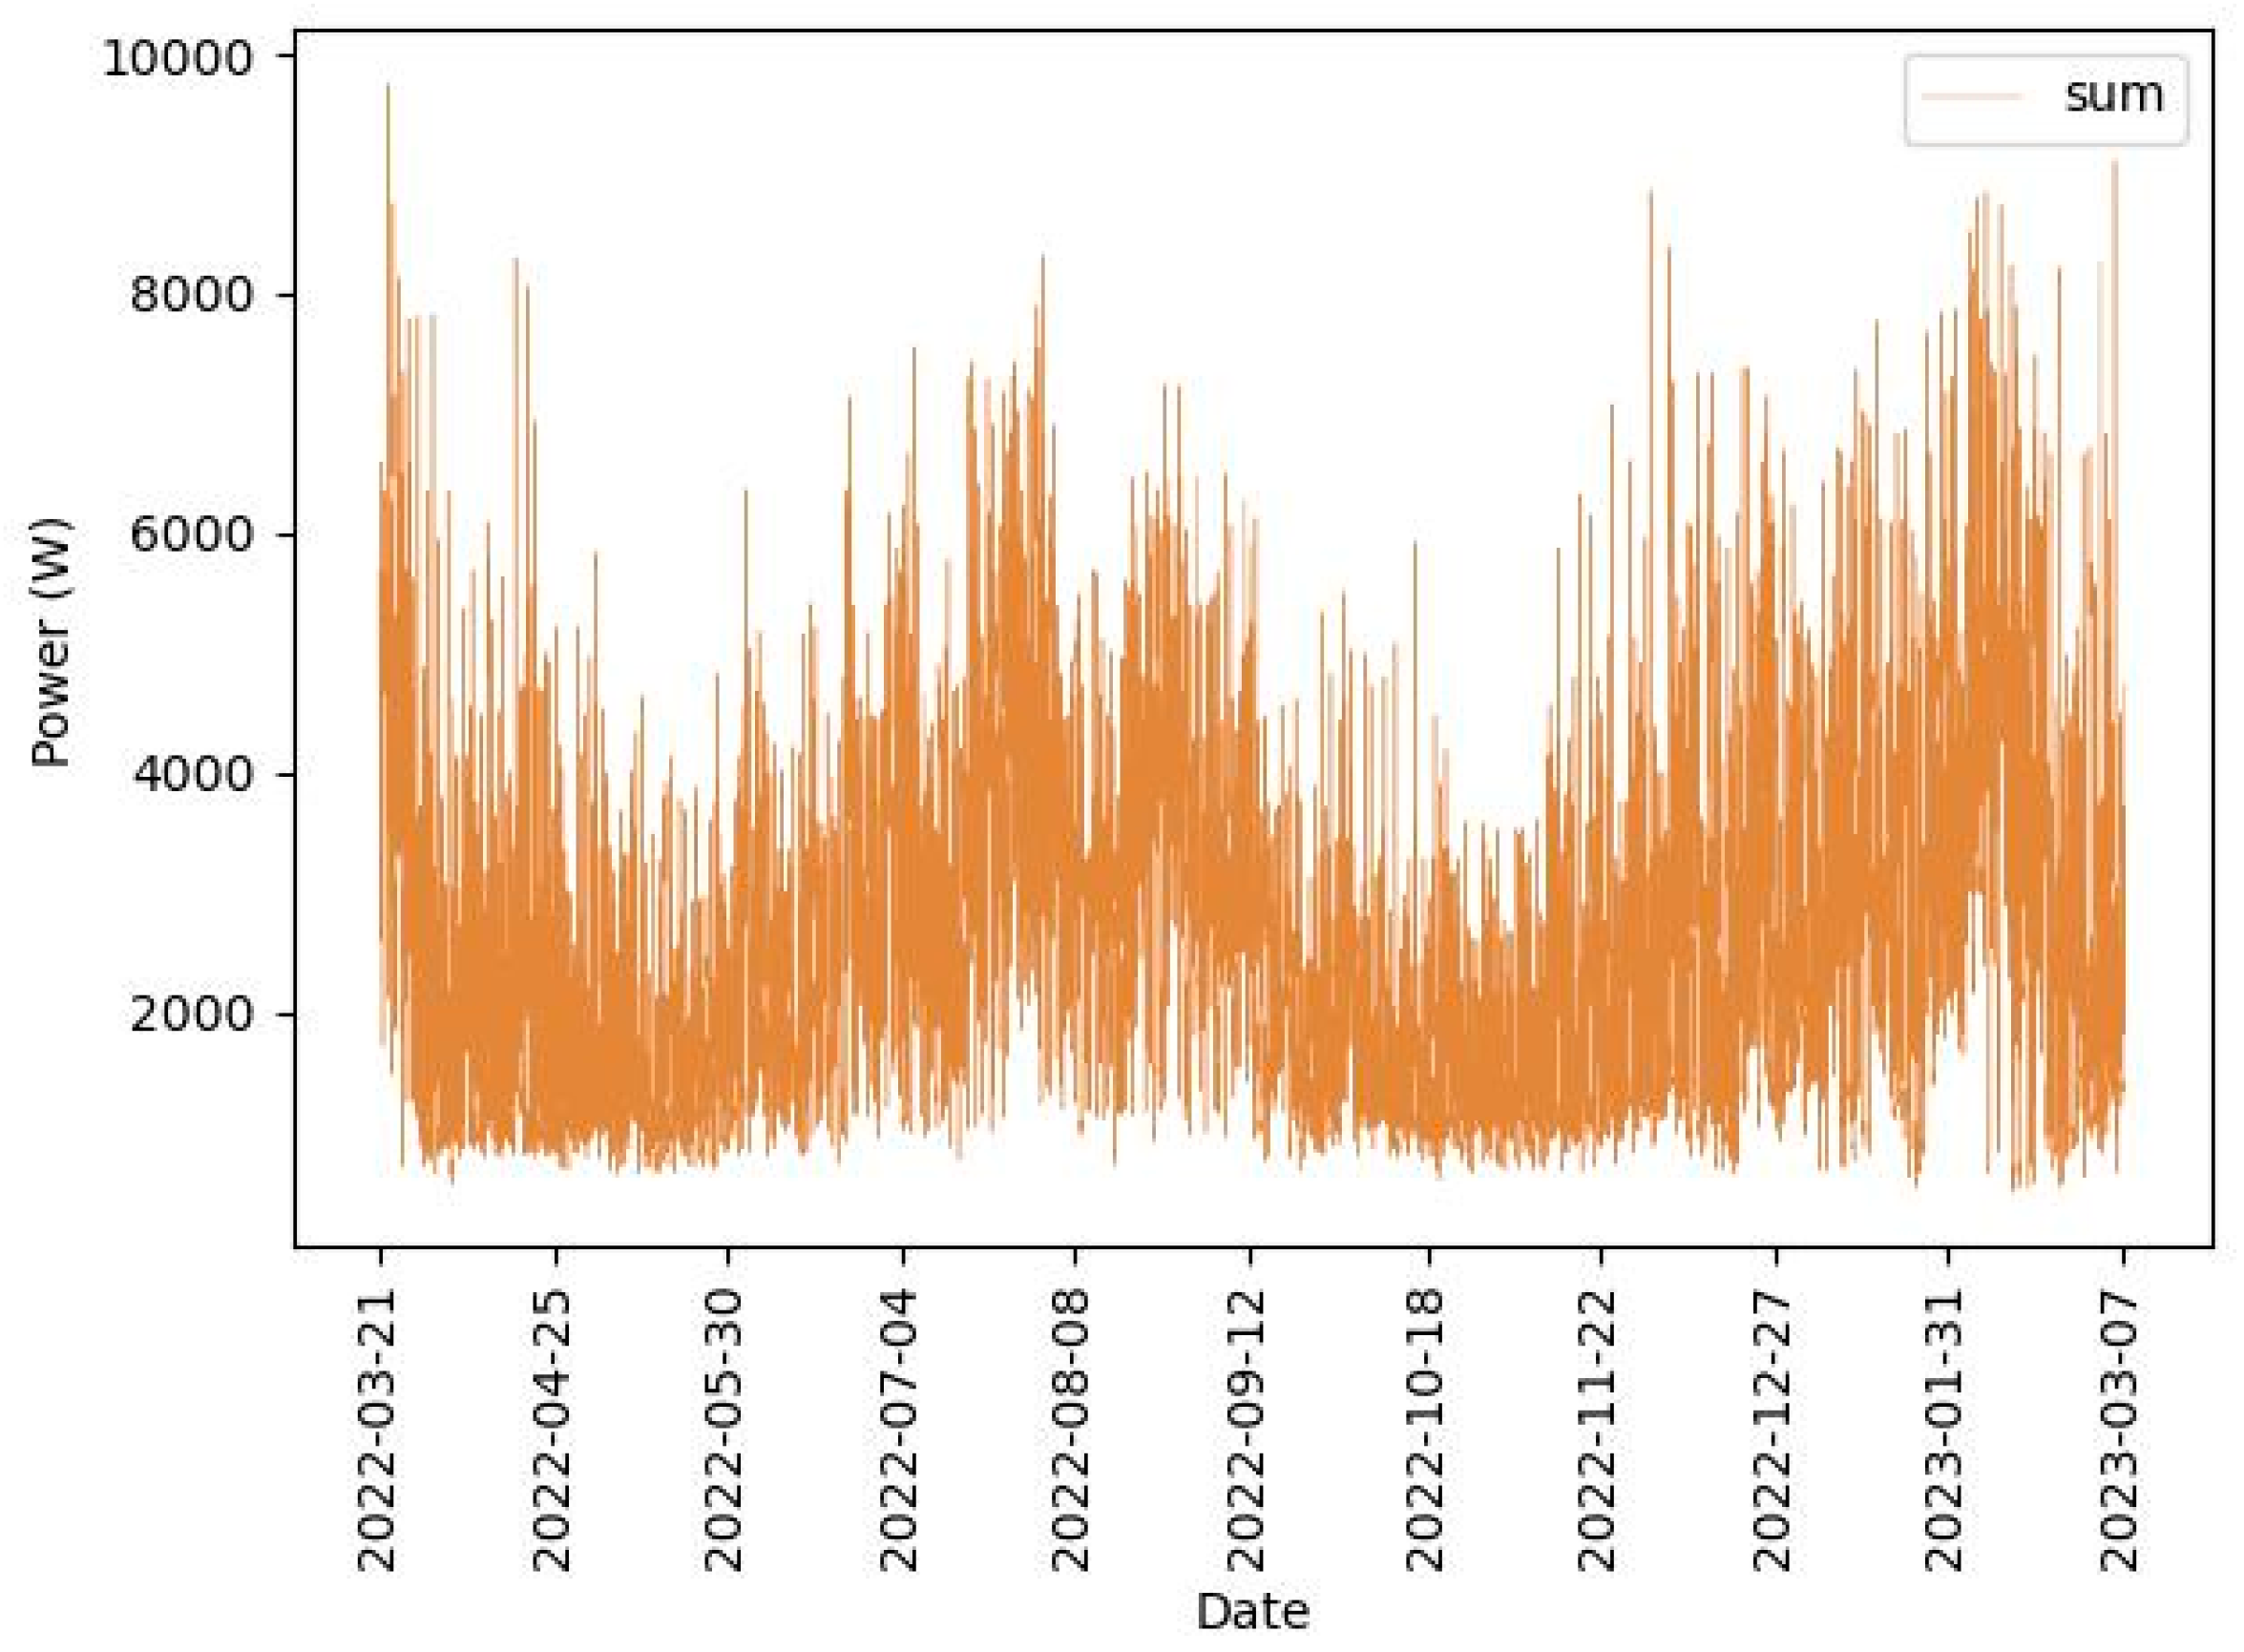
Figure 3.
The power generation of the local solar PV installation, after the cleansing process.

Figure 4.
The intraday behaviour for 44.3kWh of energy demand with: (a) Mild; (b) Moderate; (c) Ample; and (d) Unrestricted increase and moderate decrease limits.
Figure 4.
The intraday behaviour for 44.3kWh of energy demand with: (a) Mild; (b) Moderate; (c) Ample; and (d) Unrestricted increase and moderate decrease limits.
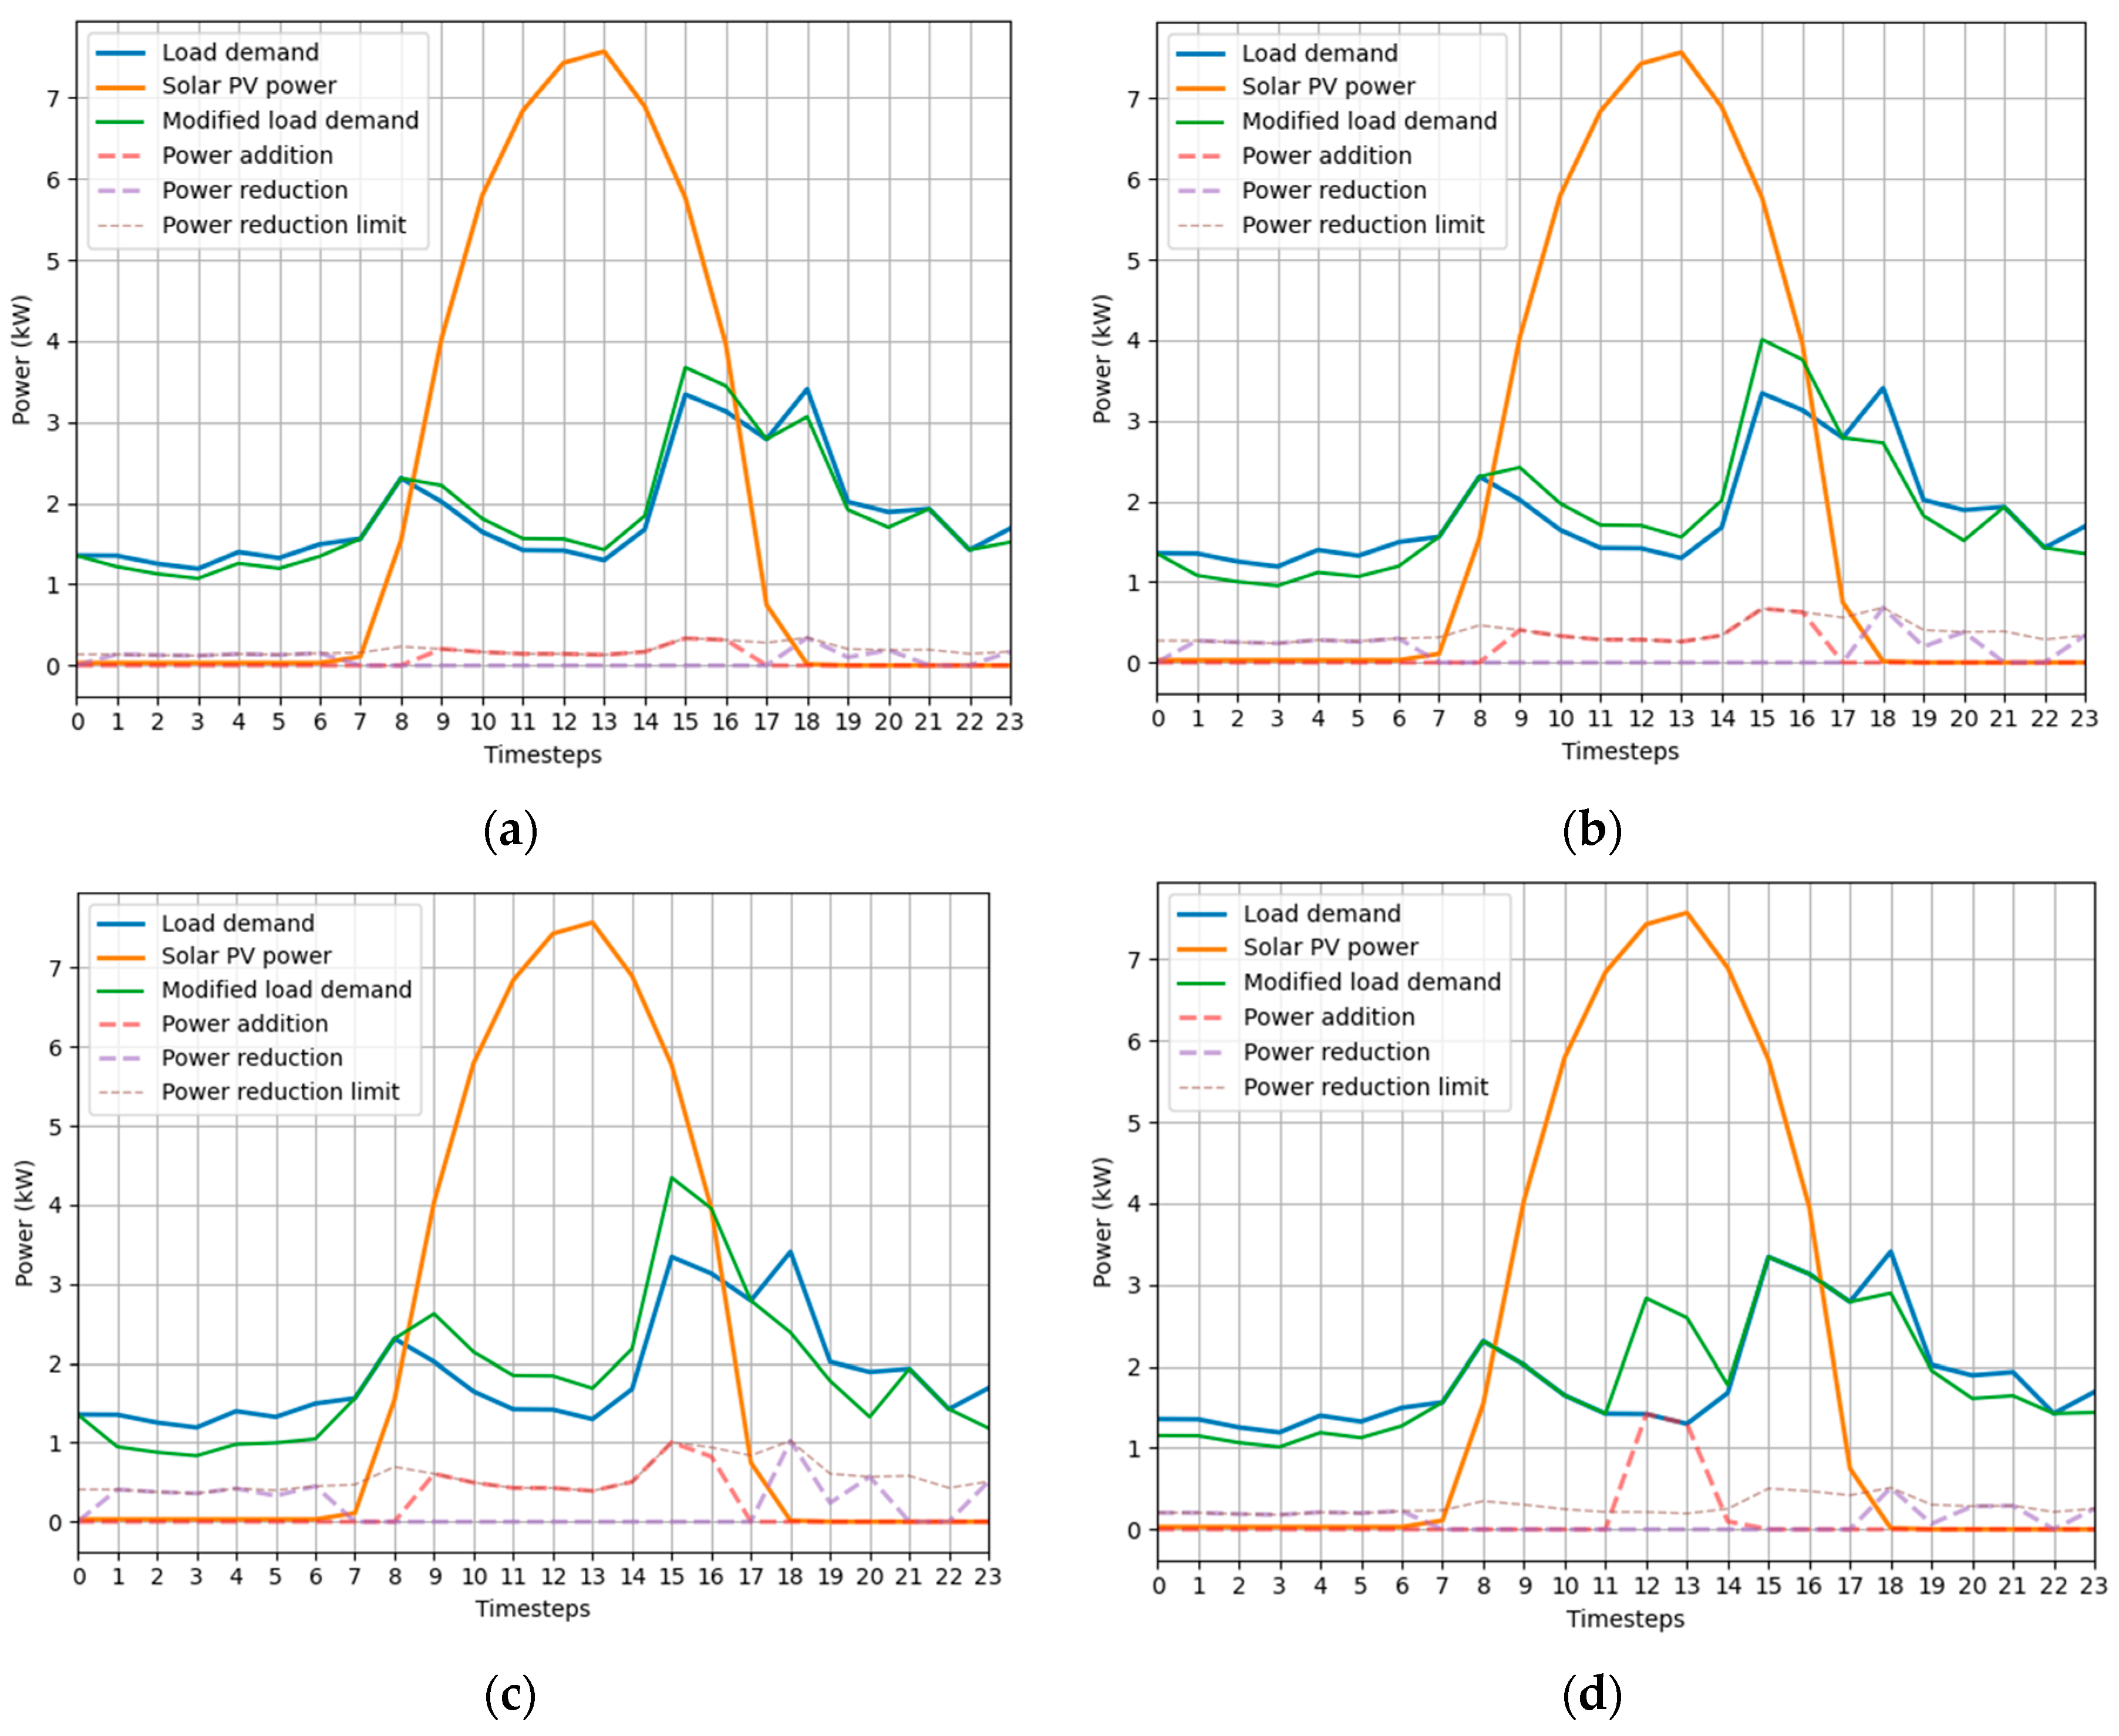
Figure 5.
The intraday behaviour for 105.9kWh of energy demand with: (a) Mild; (b) Moderate; (c) Ample; and (d) Unrestricted increase and moderate decrease limits.
Figure 5.
The intraday behaviour for 105.9kWh of energy demand with: (a) Mild; (b) Moderate; (c) Ample; and (d) Unrestricted increase and moderate decrease limits.
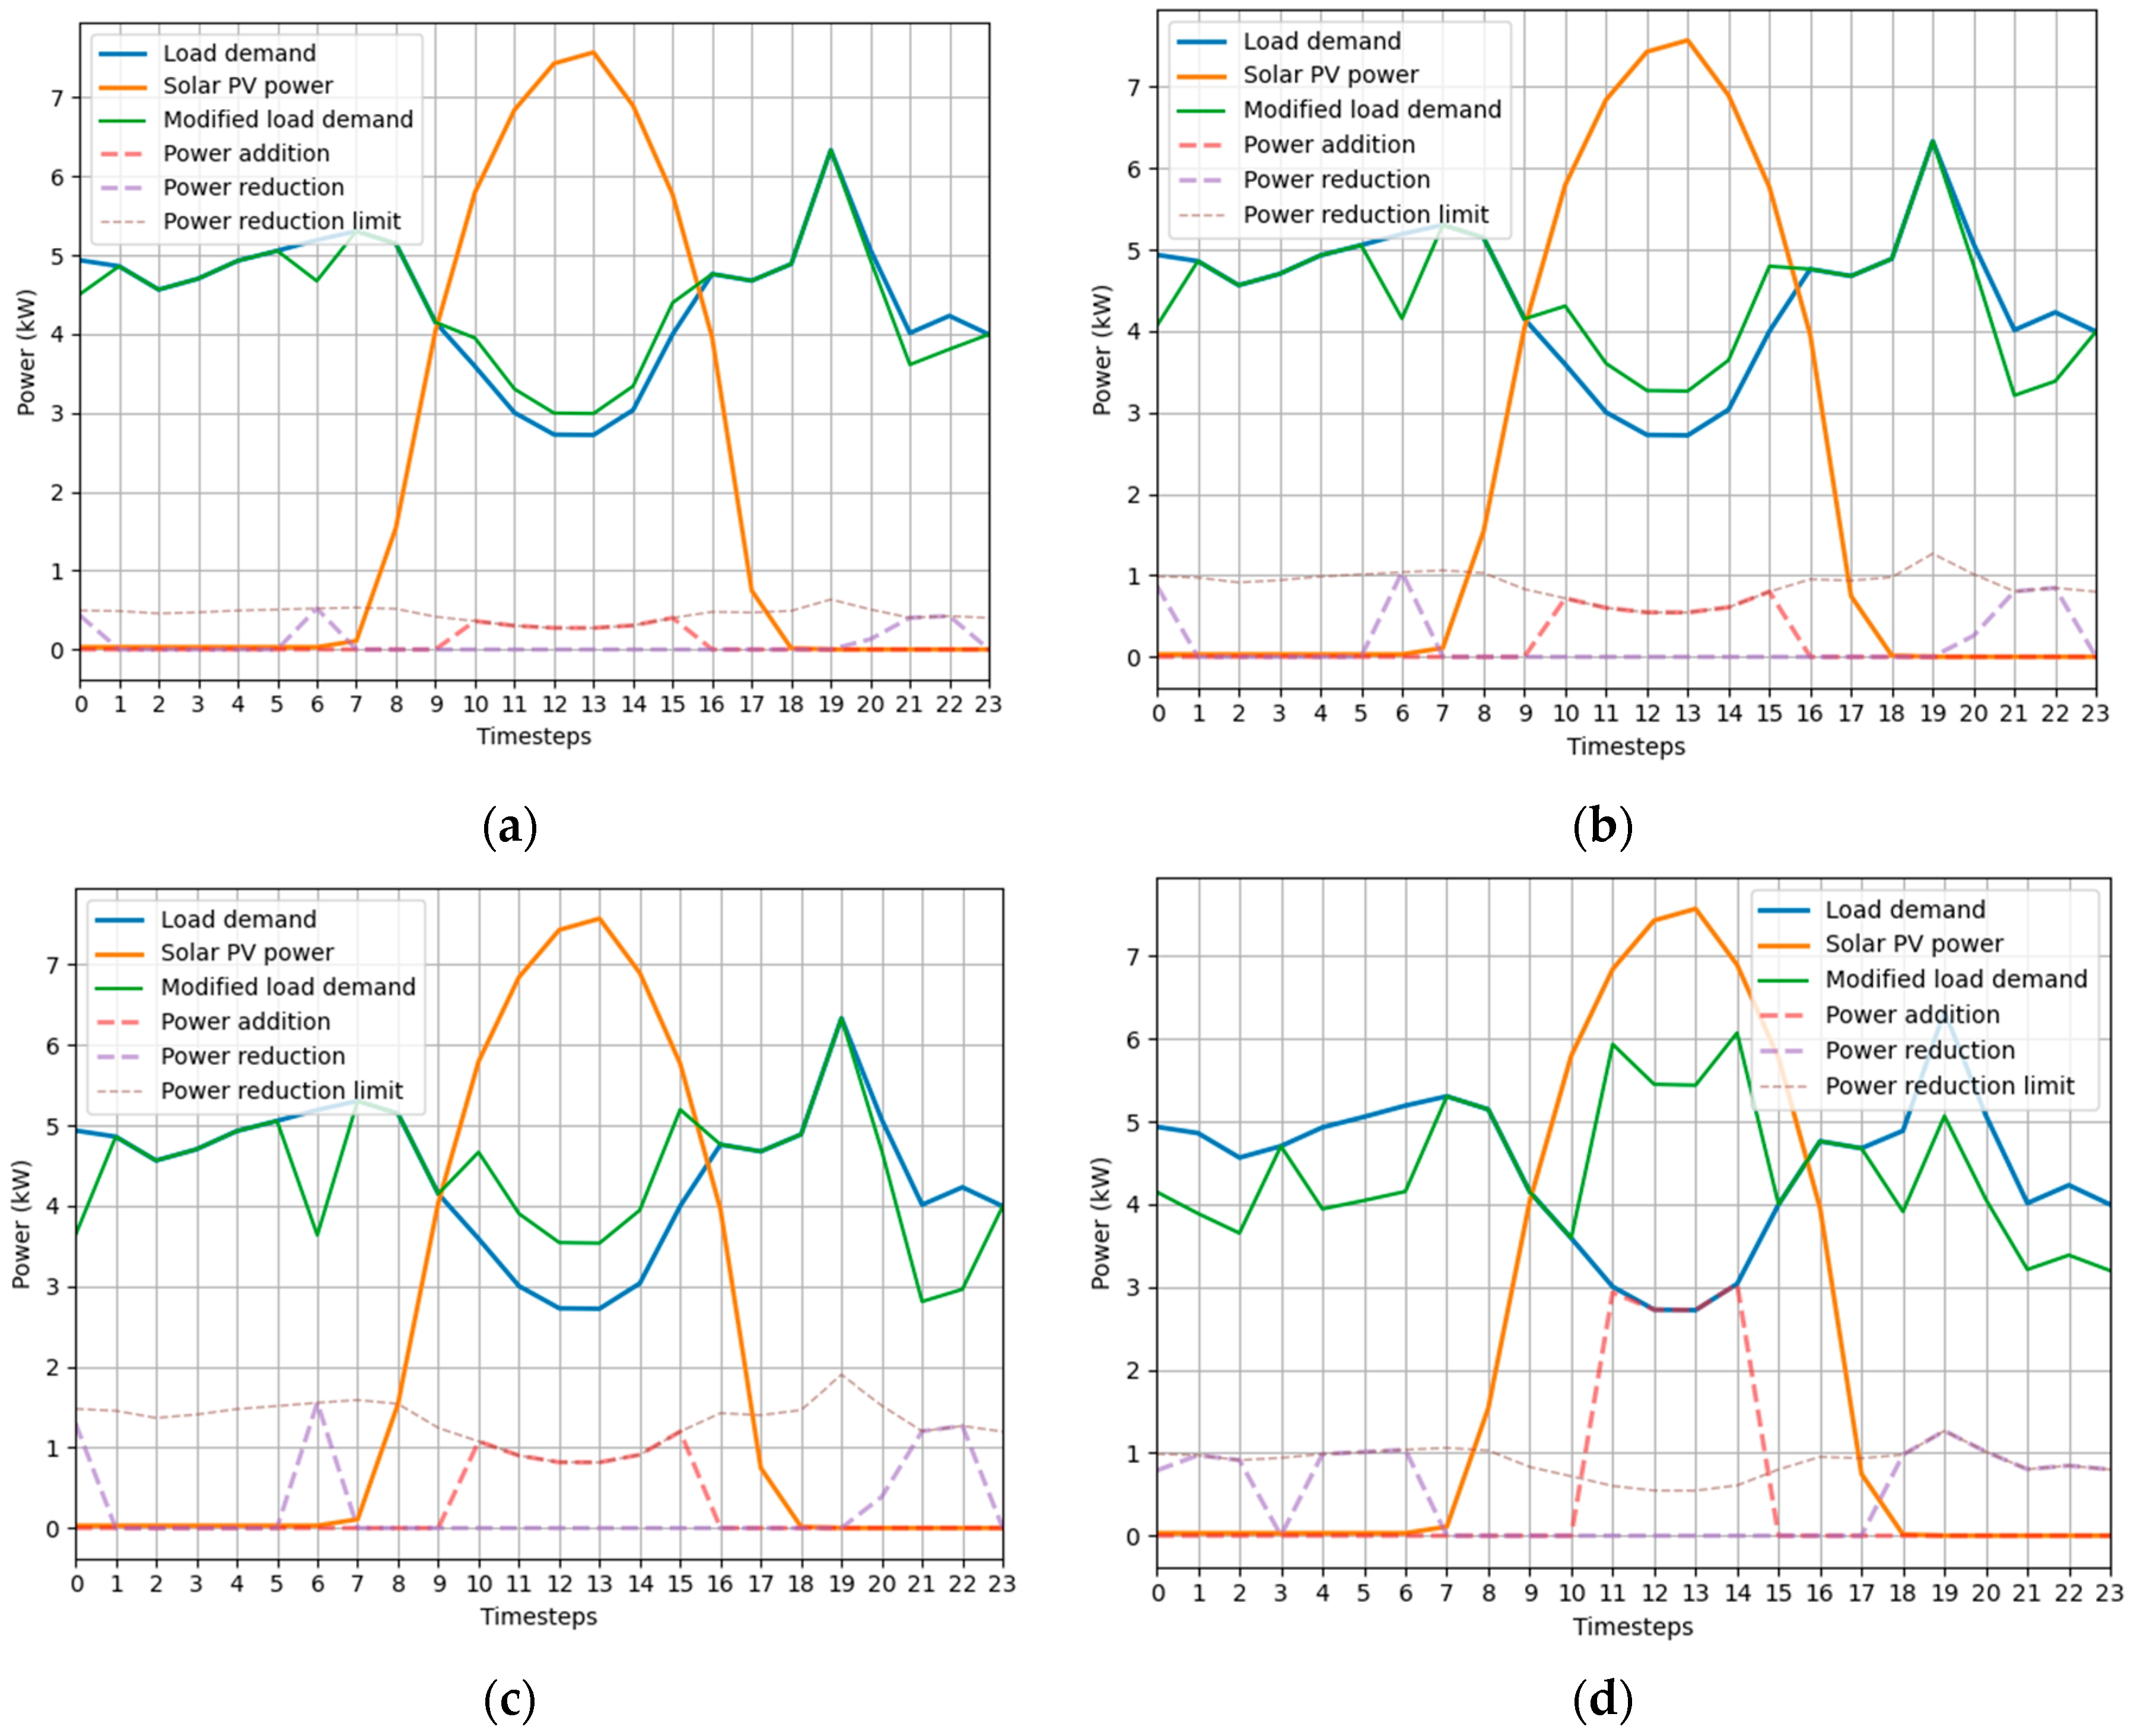
Figure 6.
The influence of the load demand flexibility in RES shares for a daily energy demand of (a) 44.3kWh and (b) 105.9kWh.
Figure 6.
The influence of the load demand flexibility in RES shares for a daily energy demand of (a) 44.3kWh and (b) 105.9kWh.
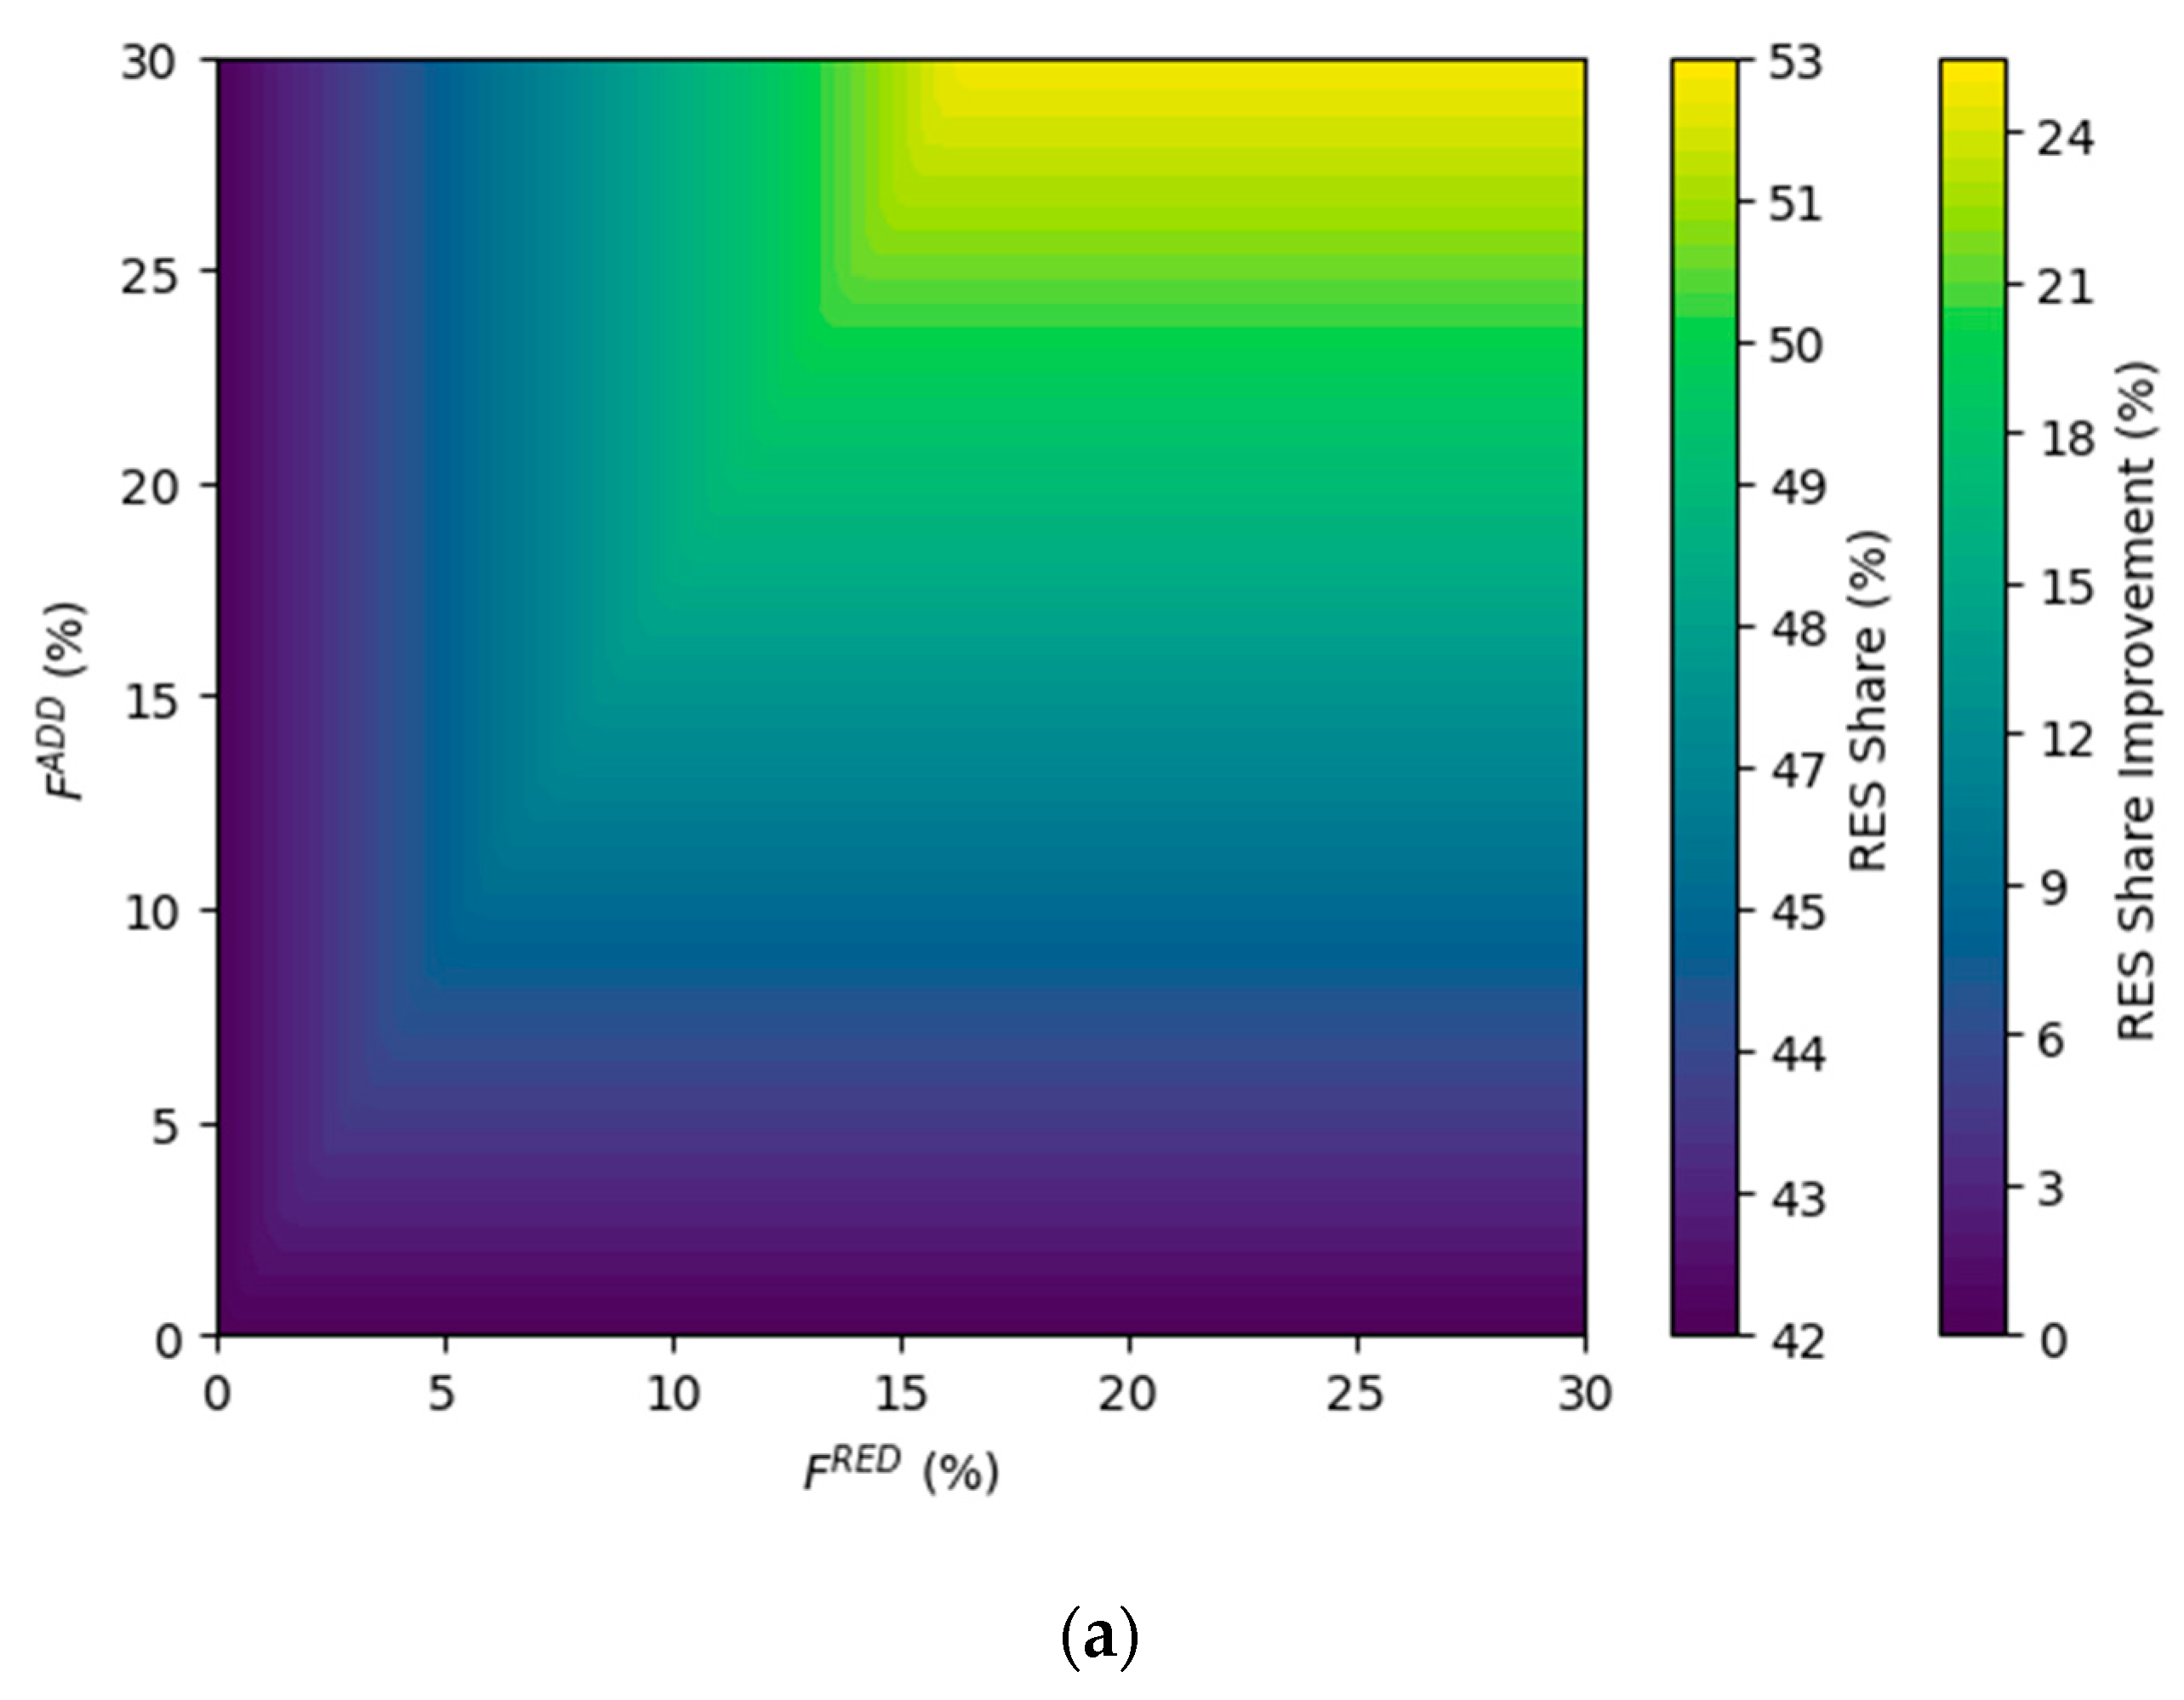
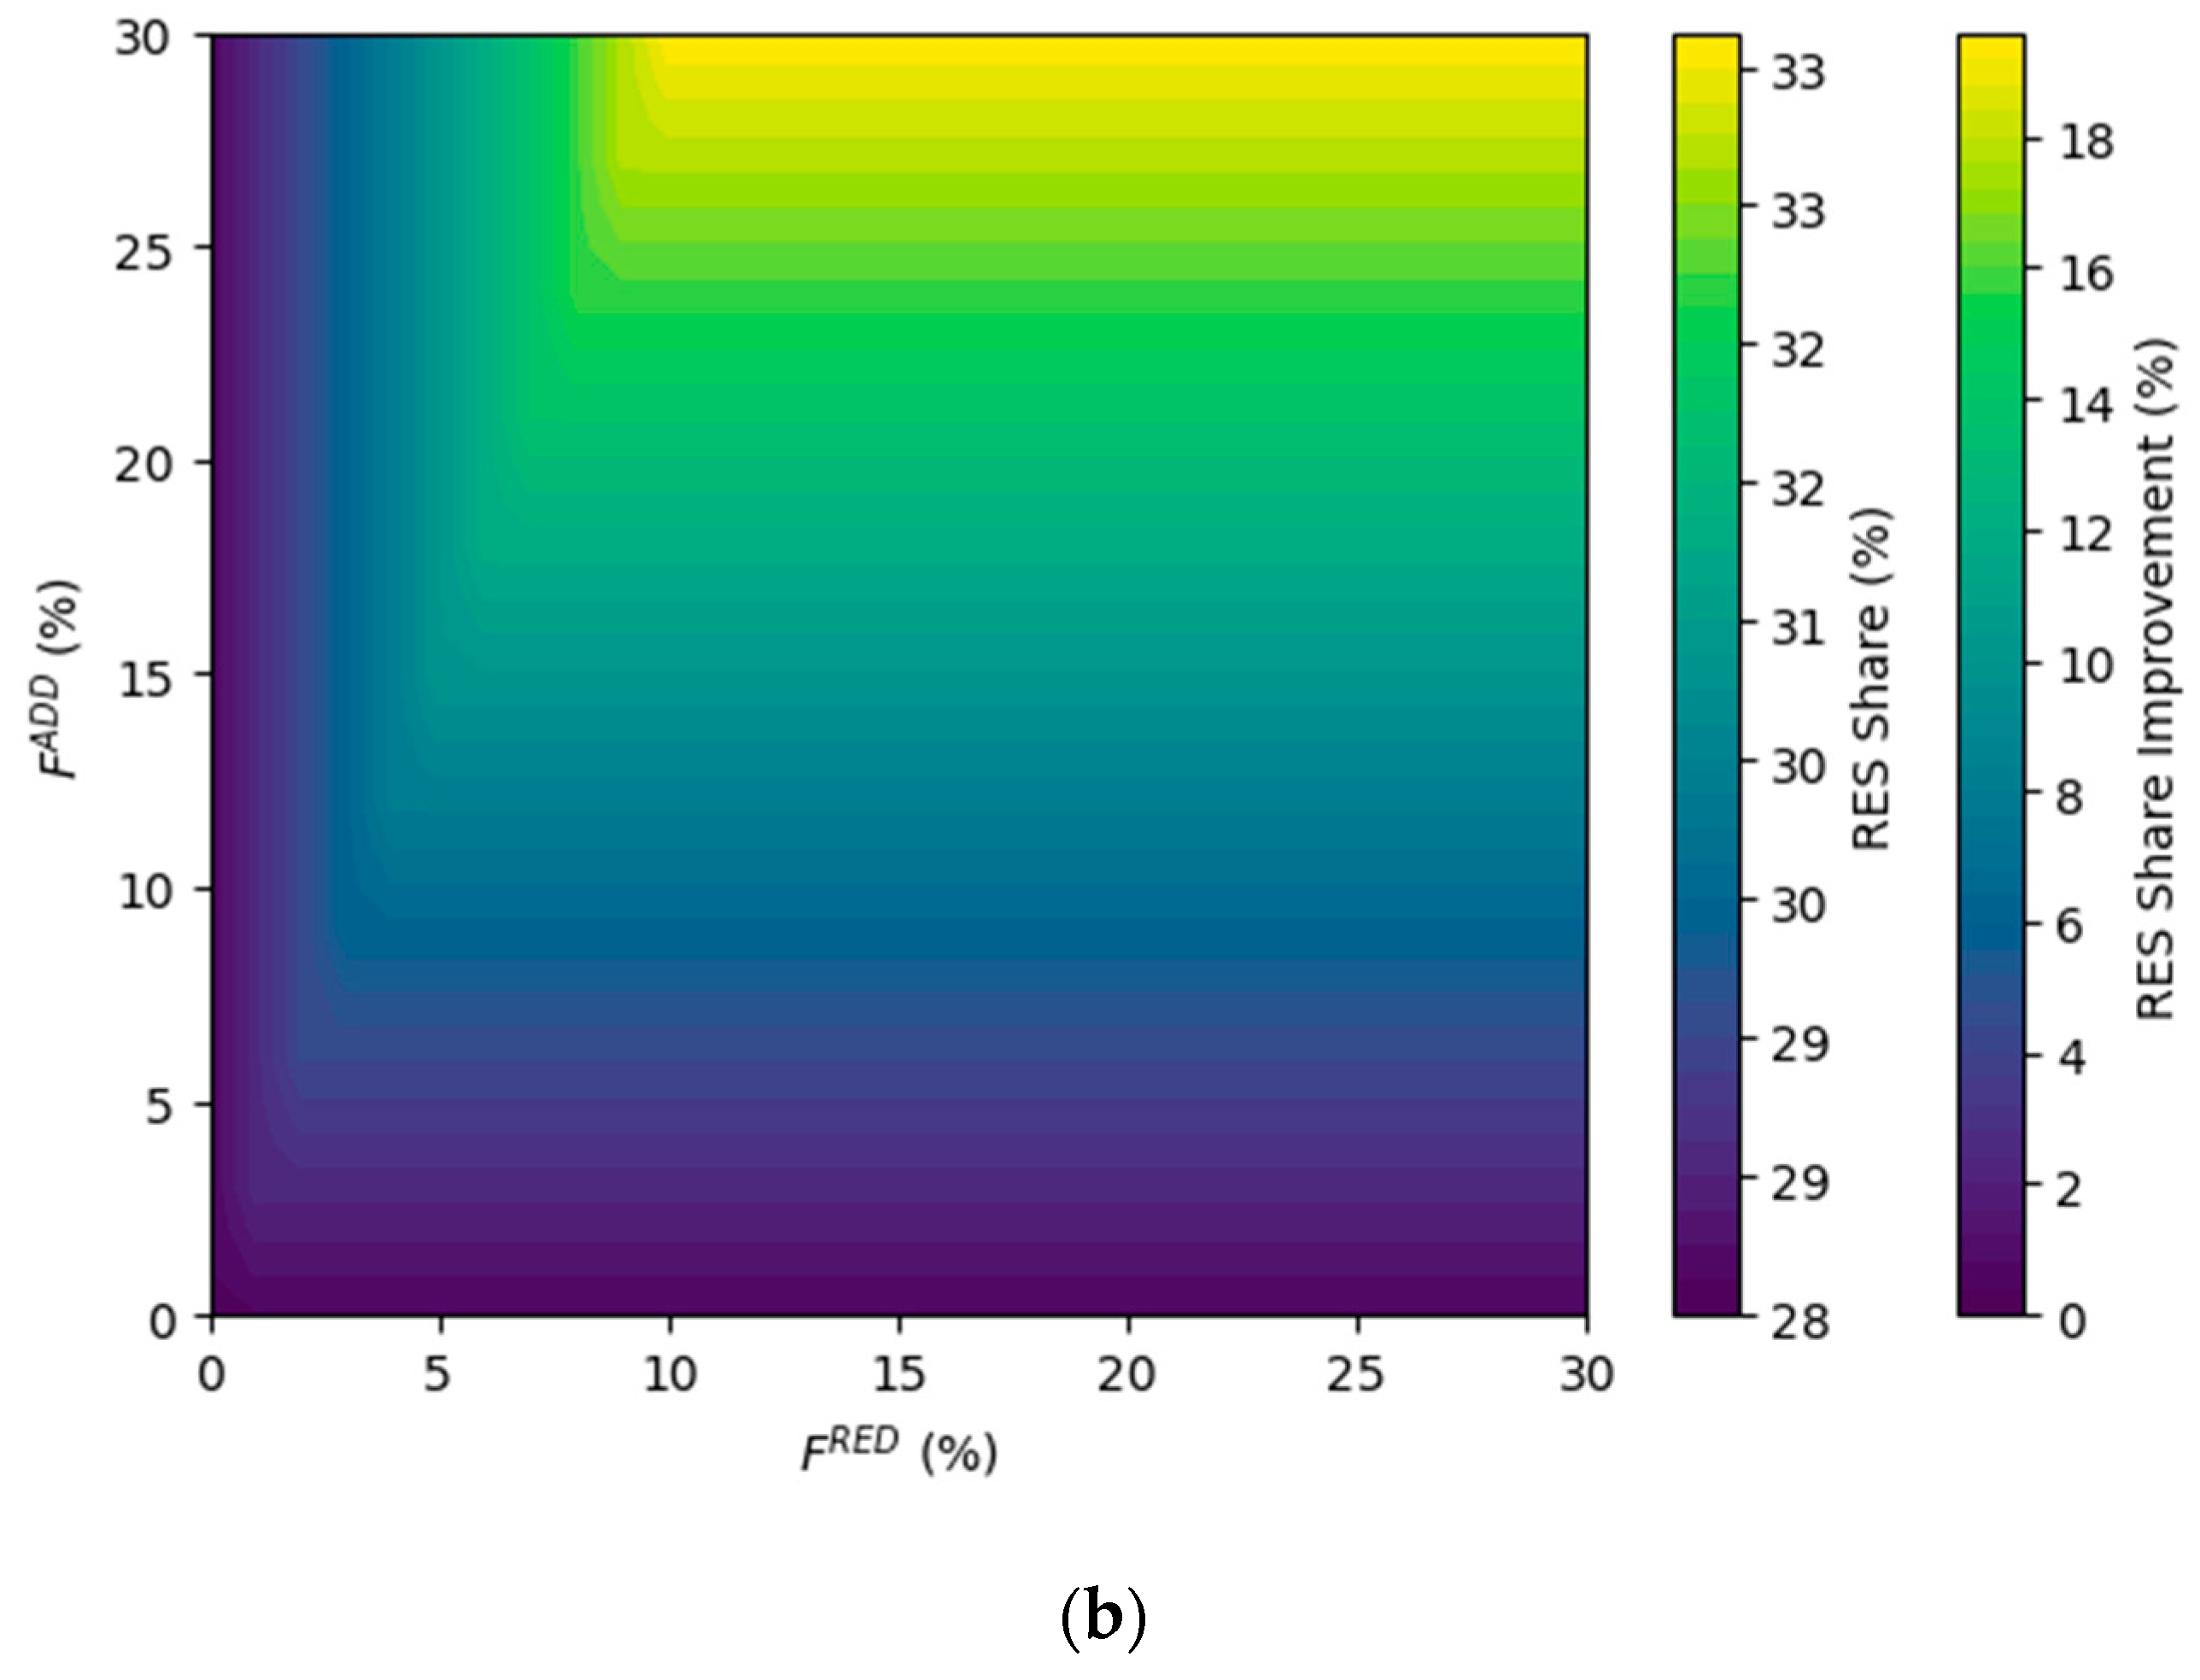

Table 1.
The RES utilization for different load demand flexibility occasions.
| Energy Demand (kWh) | Flexibility Scenario | RES Consumption (kWh) | RES Share (%) | Improvement (%) |
|---|---|---|---|---|
| 44.3 | Baseline | 18.6 | 41.9% | - |
| Mild | 20.2 | 45.5% | 8.6% | |
| Moderate | 21.8 | 49.1% | 17.2% | |
| Ample | 23.2 | 52.4% | 25.1% | |
| Unrestricted Additions | 24.2 | 54.6% | 30.3% | |
| 105.9 | Baseline | 29.7 | 28.0% | - |
| Mild | 31.6 | 29.8% | 6.4% | |
| Moderate | 33.5 | 31.6% | 12.9% | |
| Ample | 35.4 | 33.4% | 19.3% | |
| Unrestricted Additions | 41.1 | 38.8% | 38.5% |
Disclaimer/Publisher’s Note: The statements, opinions and data contained in all publications are solely those of the individual author(s) and contributor(s) and not of MDPI and/or the editor(s). MDPI and/or the editor(s) disclaim responsibility for any injury to people or property resulting from any ideas, methods, instructions or products referred to in the content. |
© 2024 by the authors. Licensee MDPI, Basel, Switzerland. This article is an open access article distributed under the terms and conditions of the Creative Commons Attribution (CC BY) license (http://creativecommons.org/licenses/by/4.0/).
Copyright: This open access article is published under a Creative Commons CC BY 4.0 license, which permit the free download, distribution, and reuse, provided that the author and preprint are cited in any reuse.


