Submitted:
25 January 2024
Posted:
26 January 2024
You are already at the latest version
Abstract
The Ca Mau Peninsula situated in the Mekong Delta of Vietnam, features a low-lying terrain. Over recent years, the region has encountered the adverse impacts of climate change, leading to both land subsidence and rising sea levels. In this study, we assessed the land subsidence susceptibility in the Ca Mau peninsula utilizing three Boosting machine learning models: AdaBoost, Gradient Boosting, and Extremely Gradient Boosting (XGB). Eight key factors were identified as the most influential in land subsidence within Ca Mau: land cover (LULC), Groundwater levels, distance to roads, Digital Terrain Model (DTM), normalized vegetation index (NDVI), geology, soil composition, and proximity to rivers and streams.
A dataset comprising 1950 subsidence sample points was employed for the model, with 1910 points obtained from the PSInSAR Radar method, and the remaining points derived from leveling measurements. The sample points were split, with 70% allocated to the training set and 30% to the testing set. Following computation and execution, the three models underwent evaluation for accuracy using statistical metrics such as the ROC curve, Area under the curve (AUC), Specificity, Sensitivity, and Overall Accuracy. The research findings revealed that the XGB model exhibited the highest accuracy, achieving an AUC above 0.9 for both the training and test sets. Consequently, XGB was chosen to construct a land subsidence susceptibility map for the Ca Mau peninsula.
Keywords:
AdaBoost
; Gradient Boosting
; XGBoost
; Ca Mau
; Subsidence susceptibility
1. Introduction
Land subsidence is a common phenomenon in many regions around the world, often resulting from factors such as groundwater extraction, mineral exploitation, oil and gas extraction, and more. As land subsidence can lead to geological, hydrogeological, environmental, and/or economic impacts, it garners significant attention from governments, communities, and scientists. While it may not be entirely avoidable in industries like mining, sustainable control of land subsidence can be achieved through government regulations, industrial exploitation monitoring, and rational planning with the aid of predictive subsidence hazard maps [1]. Hence, the role of subsidence hazard maps is immensely crucial, enabling managers to develop mineral extraction, groundwater usage, urban development planning, and land-use conversion efficiently.
In recent times, paralleling the advancements of Industry 4.0, the utilization of artificial intelligence and machine learning has become increasingly ingrained in the field of cartography. Many applications involving machine learning has emerged for constructing predictive models aimed at assessing land subsidence susceptibility.
The first study we would like to present is a research conducted by Rahmati, which utilized two machine learning algorithms, namely MaxEnt (maximum entropy) and GARP (genetic algorithm rule-set production), to construct a subsidence assessment model in Kashmar, Iran [2]. The model incorporated data related to land use, geology, distances to groundwater extraction sites, distances to reforestation projects, distances to fault lines, and groundwater level reduction. The research results indicated that the GARP algorithm outperformed the MaxEnt algorithm in terms of performance and accuracy. Both algorithms yielded reliable subsidence prediction outcomes.
Another study by Abdollahi published the results of utilizing a support vector machine (SVM) model to create a subsidence susceptibility map for the Kerman province, Iran [3]. Data including slope, aspect, elevation, cross-sectional curvature, plan curvature, topographic wetness index (TWI), distance to rivers, groundwater level, geology, pressure variation, land use, and normalized difference vegetation index (NDVI) were incorporated into the model construction. The model yielded results with good accuracy, exhibiting (Area Under the Curve -AUC) values ranging from 0.894 to 0.857.
In the study [4], the authors established a subsidence susceptibility map in Jakarta Indonesia, the accuracy of subsidence prediction in Jakarta was assessed using machine learning models, including logistic regression, multilayer perceptron, meta-ensemble AdaBoost, and LogitBoost. They utilized Sentinel-1 (SAR) data from 2017 to 2020 to generate a subsidence-sensitive map. ROC analysis results demonstrated that the AdaBoost algorithm exhibited higher predictive accuracy (81.1%) compared to Multilayer Perceptron (80%), Logistic regression (79.4%), and LogitBoost (79.1%).
The XGBoost machine learning method was employed by Liyuan Shi and colleagues to develop a subsidence predicting model for the North China Plain region [5]. Factors incorporated into the model included groundwater level variations, the thickness of the Quaternary sediments, and an index-based accumulation index (IBI), in combination with Sentinel-1 image-derived subsidence and Persistent Scatterer Interferometry (PSI) measurements. The research results highlighted the excellent accuracy of this method (0.9431).
A study conducted by Elham Rafiei Sardooi which was published, compared four machine learning and statistical models: the evidential belief function (EBF), Index of Entropy (IoE), Support Vector Machine (SVM), and random forest (RF) for subsidence prediction in the Rafsanjan plain region of Iran [6]. The model training data included 11 factors such as slope percent, aspect, topographic wetness index (TWI), plan and profile curvatures, normalized difference vegetation index (NDVI), land use, lithology, distance to rivers, groundwater drawdown, and elevation. The study utilized the Boruta algorithm to determine the significance of the causal factors. The research findings revealed that the SVM model achieved the highest predictive accuracy (AUC = 0.967, TSS = 0.91), followed by RF (AUC = 0.936, (True Skill Statistic -TSS = 0.87), EBF (AUC = 0.907, TSS = 0.83), and IoE (AUC = 0.88, TSS = 0.8). A comprehensive study conducted by Bui involved the comparison of machine learning techniques, including Bayesian Logistic Regression, Support Vector Machine (SVM), Logistic Model Tree, and alternative decision tree models, to construct a land subsidence risk prediction model in South Korea [7]. Nevertheless, as far as our understanding goes, the study might be subject to significant bias due to a limited number of sample points used for training and validation.
Wang and colleagues have published a study on the application of land subsidence prediction using the Artificial Neural Network BPNN and the Random Forest (RF) method in the Shandong region of China [8]. The data used for subsidence prediction consisted of groundwater level variations and subsidence data from the period 2017 to 2020, identified through SBAS-InSAR technique. The research results indicated that the BPNN model exhibited higher accuracy than the RF model.
Mohammadifar applied Stacking- and voting-based ensemble deep learning models (SEDL and VEDL) along with active learning (AL) to establish subsidence susceptibility maps in the Minab and Shamil-Nian plains of Hormozgan province, southern Iran [9]. According to the study, groundwater level decline had a significant impact on the models' output results. Based on Taylor diagrams and R2 values, the predictive outcomes of the SEDL-AL model (R2 > 95%) demonstrated higher performance and accuracy compared to the SEDL model.
With a diverse range of machine learning algorithms mentioned above applied in many different countries, each region has distinct geographical and geological features. Models are not completely effective for every area, they need to be tailored to the specific geographical features of the study area. In this paper, we aim to explore several Boosting machine learning algorithms—Adaboost, Gradient Boosting and XGBoost to predict land subsidence susceptibility in Ca Mau Peninsula, Vietnam. Located in the southernmost part of Vietnam, Ca Mau is facing the risks of land subsidence, sea level rise, flooding and saline intrusion. Research by Erban demonstrated subsidence in the Ca Mau Peninsula and across the entire Mekong Delta in excess of several centimeters per year, surpassing the present absolute sea level rise [10].
The reason for choosing the Boosting method is due to the flat terrain and low topography in this delta where the main cause of land subsidence is still unknown. Therefore, Boosting models, based on decision trees, merge weak models to form a strong model; The weights of the next layers are updated from the previous weights, which can help improve the accuracy of the prediction. The sample data input includes land subsidence points determined by the PSInSAR method and levelling survey. Moreover, the Ca Mau area lacks any prior study utilizing Boosting models for land subsidence prediction. Hence, our experiment can be considered pioneering, aiding in effective and sustainable land use planning in this region.
2. Study area
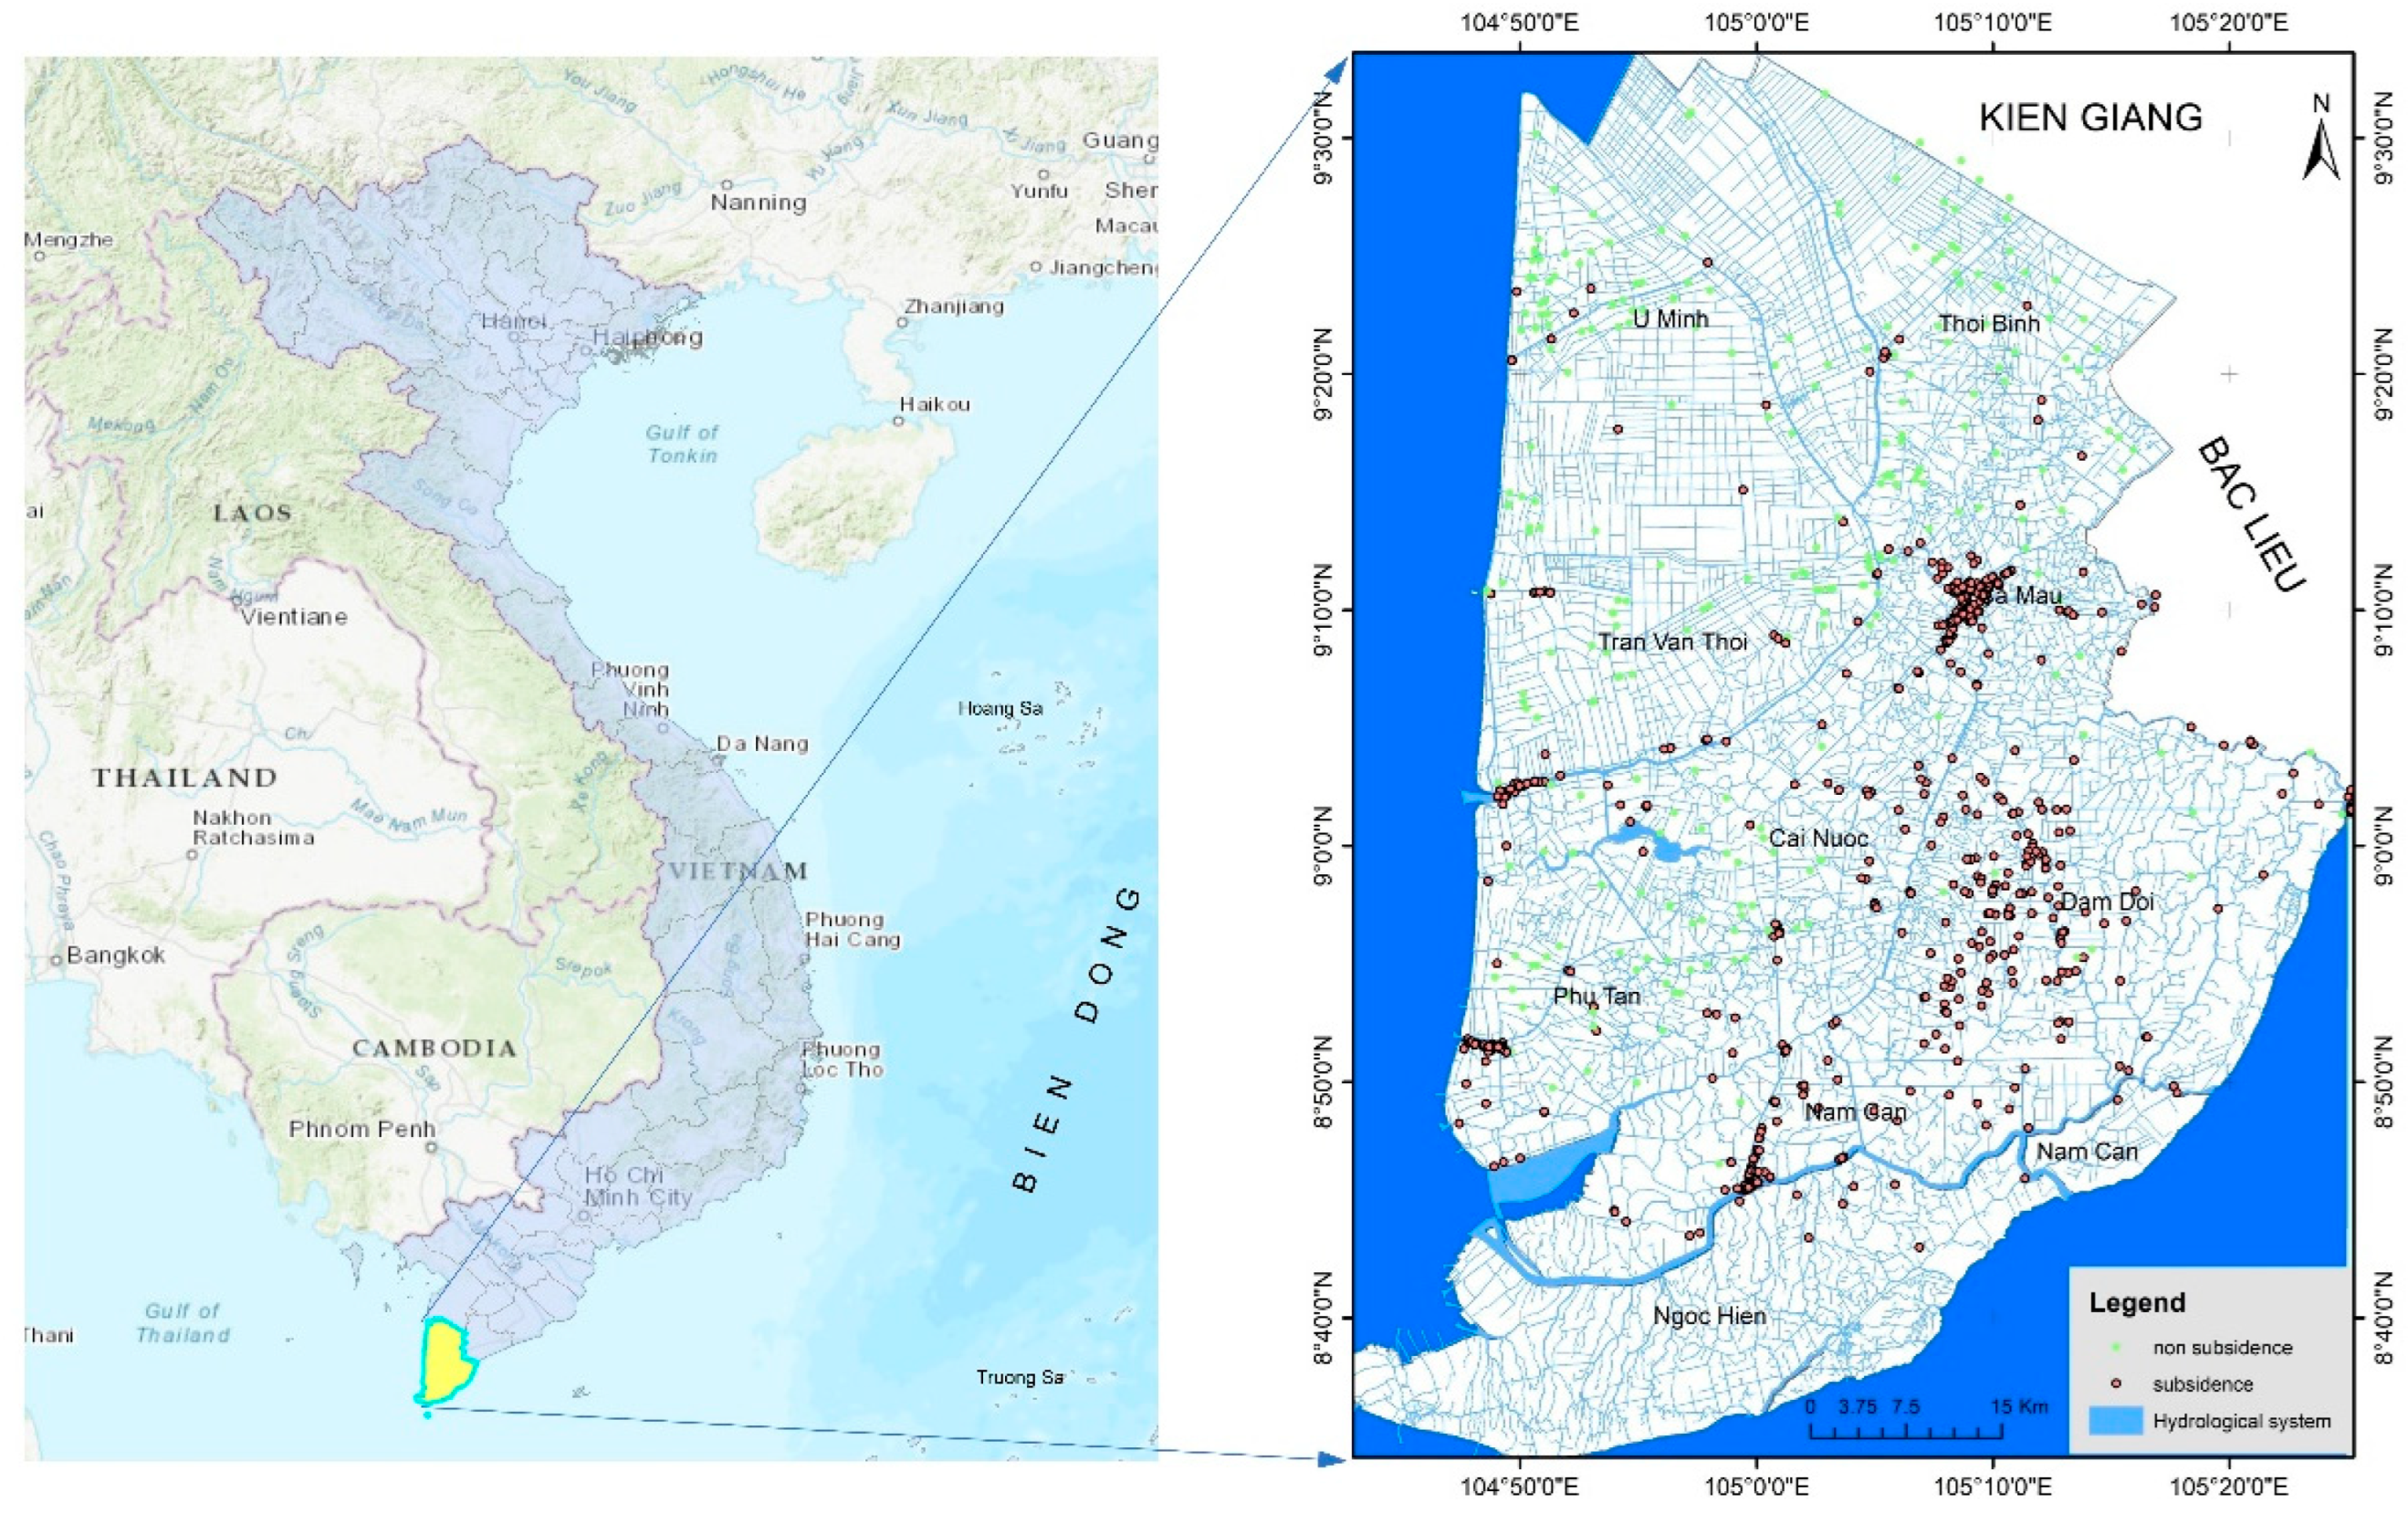
Ca Mau Province is located in the southernmost part of the Mekong Delta, Vietnam encompassing both mainland and several islands, with a total area of 5,329 square kilometers, equivalent to about 13.10% of the Mekong Delta's area and 1.57% of the country's total area. It shares its northern border with Kiên Giang Province, its eastern border with Bac Lieu Province, its western border with the West Sea (Gulf of Thailand), and its southern and eastern borders with the East Sea.
Figure 1.
Ca Mau research area on the map of Vietnam.
2.1. Topographical and soil characteristics
Ca Mau is situated in a region bordering both the East Sea and the West Sea (Gulf of Thailand), with land that originates from sedimentary processes, featuring relatively low and fairly flat terrain. The average ground elevation is approximately 0.6 meters. Low-lying areas have elevations around 0.2 meters, while higher ground reaches elevations of about 0.8 - 1.5 meters. Most of the land lies below the high tide water level, making it susceptible to flooding, particularly during high tides.
Ca Mau is a newly formed land area created by sedimentation, comprising marine sediments, river sediments. These types of land generally have a detrimental impact on both surface water quality and the province's groundwater source.
2.2. Hydrological Characteristics
The rivers, streams, and channels in Ca Mau Province form an intricate network, covering nearly 3% of the natural area. There are 8 main rivers and 3 primary canals with river mouths ranging in width from 45m (Cai Tau River) to 1800m (Cua Lon River) and depths varying from 3m (Bai Hap estuary) to 19m (Bo De estuary of Cua Lon River).
2.3. Current Water Usage Situation
At present, the primary source of water for both domestic and industrial purposes in Ca Mau Province is groundwater. Groundwater resources meet the current water demands of the province, extracted from various types of wells and boreholes with different depths, diameters, and layers. Among these, the boreholes catering to industrial and semi-industrial needs, networked boreholes, and small UNICEF-style boreholes predominantly draw water from the Pleistocene-intermediate to upper (qp2-3) and intermediate Pliocene (n22) layers, constituting around 75% of the total number of boreholes for water extraction.
In addition to centralized water supply systems provided by water treatment plants and distribution stations, various institutions, enterprises, and individuals also independently drill wells for their own water needs in both domestic and production contexts.
3. Research Methodology
Boosting is a machine learning technique utilized to enhance the predictive ability of a machine learning algorithm by focusing on learning from more challenging cases. It operates by generating iterations of the original machine learning model and concentrating on addressing misclassified instances from the previous model, until a desired level of accuracy is achieved. Common boosting algorithms employed with decision trees include AdaBoost, Gradient Boosting, and Extreme Gradient Boosting (XGBoost). Below, we sequentially investigate these three algorithms with the aim of constructing three models for the research area and selecting the optimal model.
3.1. AdaBoost
AdaBoost (Adaptive Boosting) is a popular machine learning ensemble technique used for classification and regression tasks and was invented by Freund and Schapire [11]. It aims to improve the performance of weak learners (often referred to as "base classifiers" or "base models") by combining their predictions into a strong overall prediction. The core idea behind AdaBoost is to give more weight to instances that are misclassified by the previous base models, thereby focusing on the difficult cases.
Let's assume a binary classification problem with a target variable consisting of two labels: y ∈ {−1, 1}. Following the boosting method, the predictive function for an input variable xi is denoted as and the target variable y takes one of two values: {−1, 1}. In this case, the training error can be defined as:
Where:
N is the number of training samples.
α_i represents the weight associated with the i-th training samples.
y_i is the actual target value for the i-th samples.
Figure 2.
Diagram of the AdaBoosting model. Each individual sub-model is trained on a dataset weighted according to calculations from the pre-model.
Figure 2.
Diagram of the AdaBoosting model. Each individual sub-model is trained on a dataset weighted according to calculations from the pre-model.
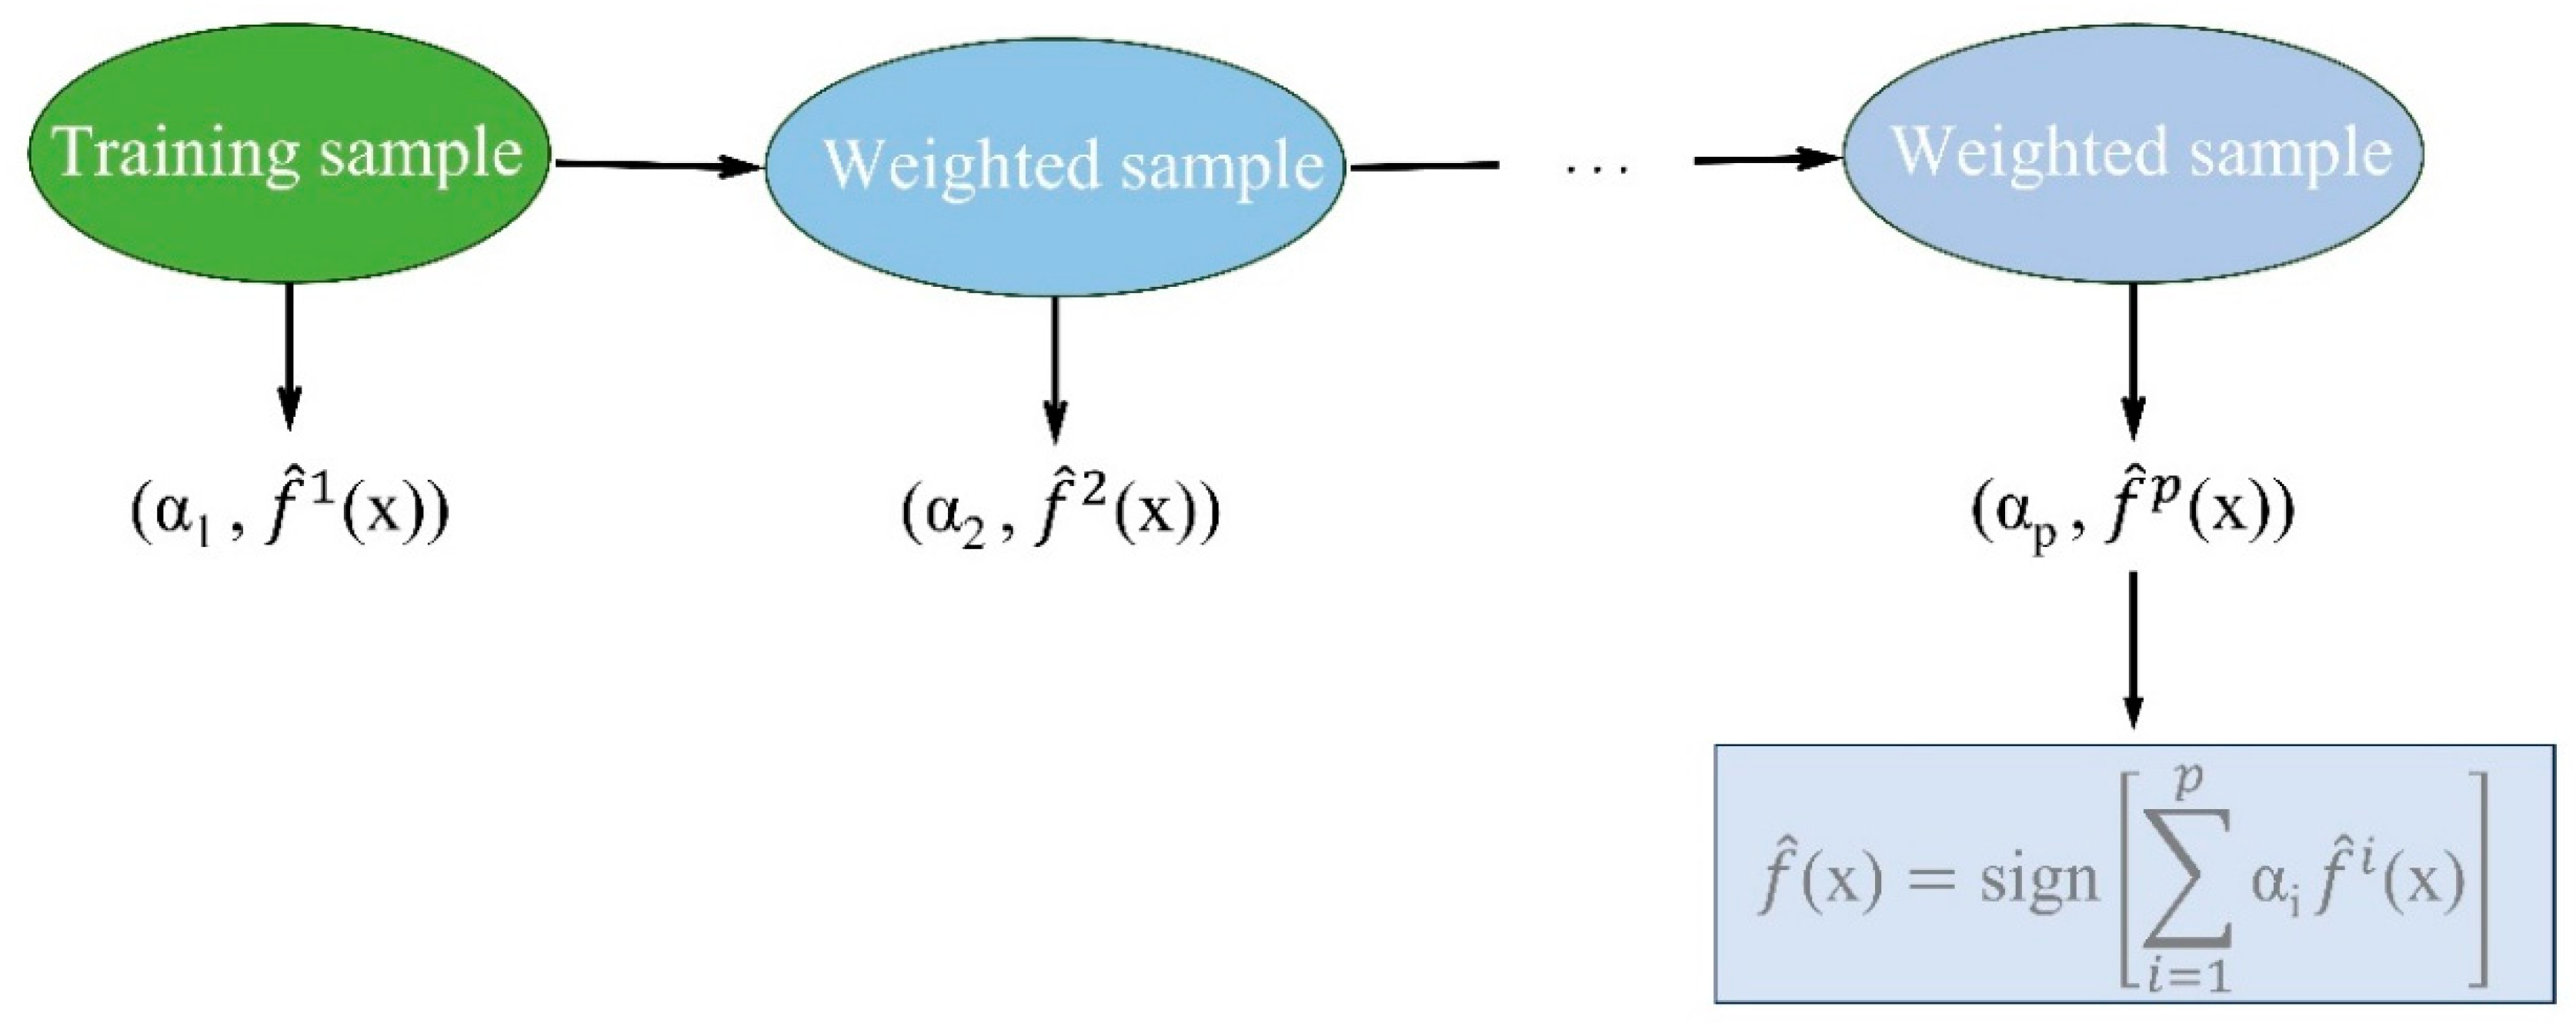
According to figure 1, the weak models are combined by assigning weights to each based on their performance. Stronger models are given higher weights in making the final predictions .
In the equation above, the sign(x) function is a function that takes the value 1 if the sign of x is positive and takes the value -1 if otherwise.
3.2. Gradient Boosting
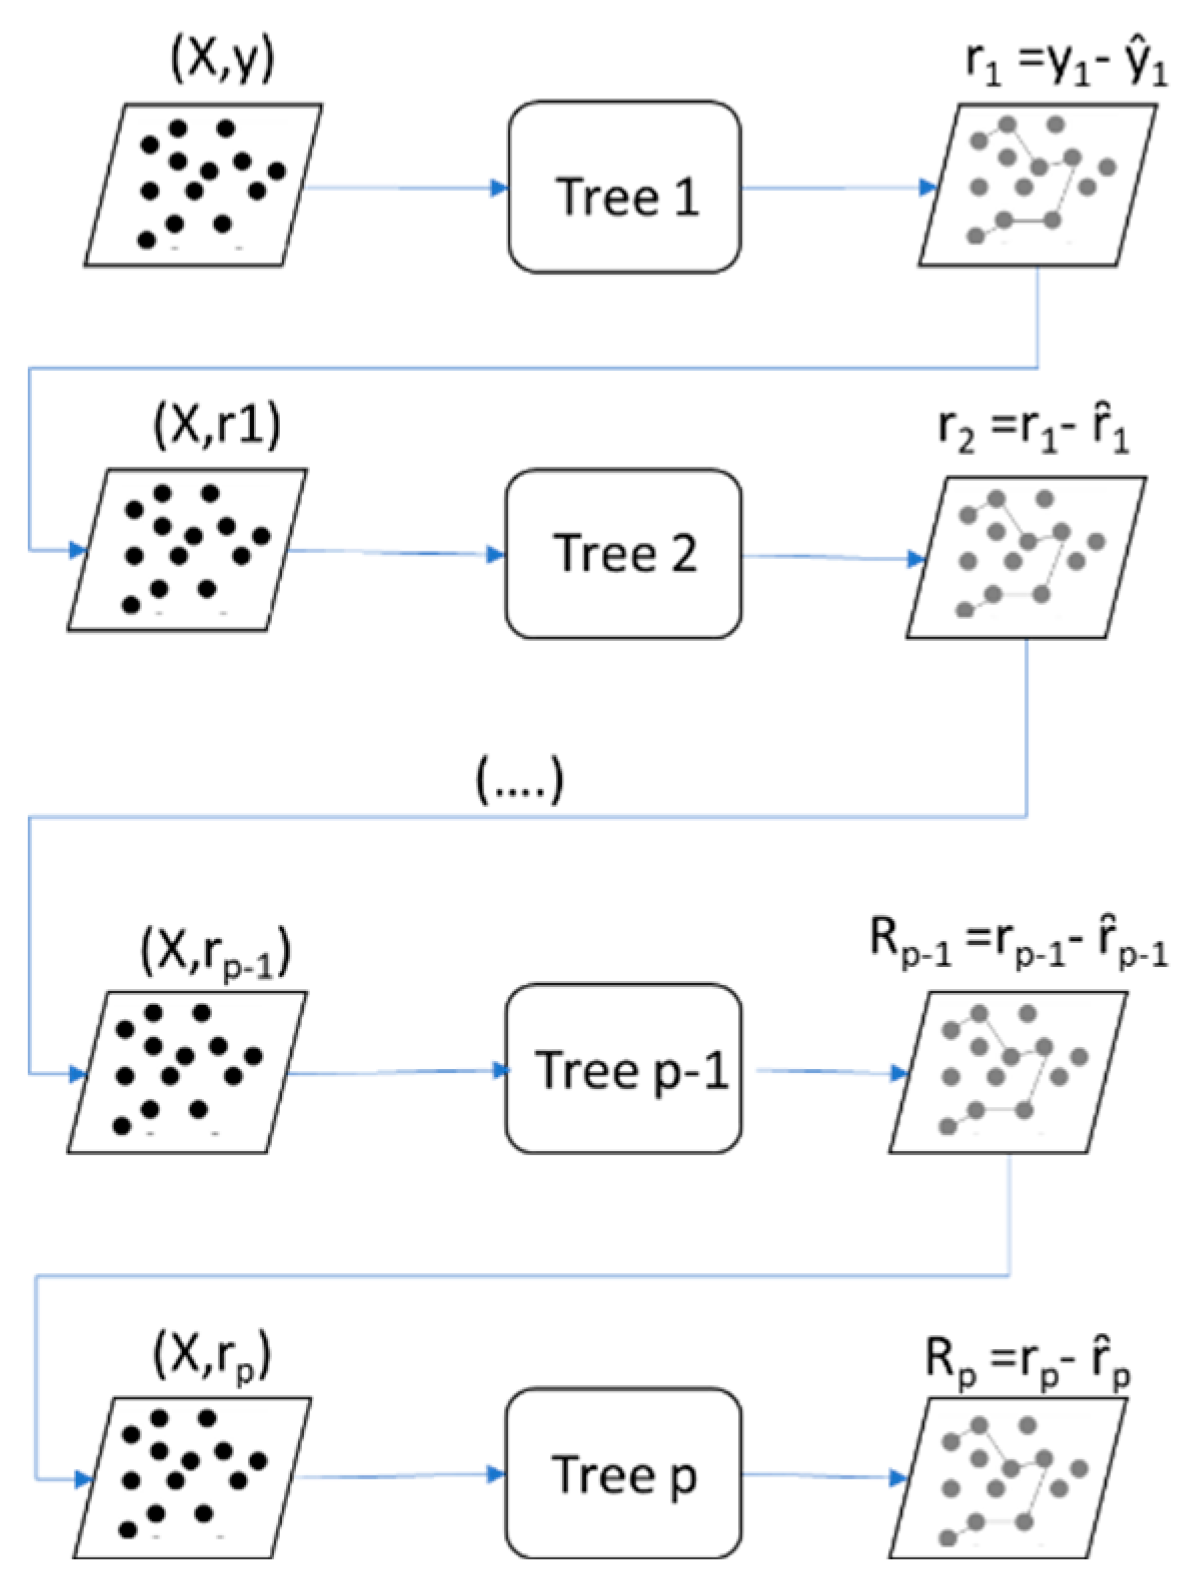
The Gradient Boosting algorithm (GB) was invented and introduced by Jerome H. Friedman in 2001, which involves training weak models sequentially. However, instead of using the model error to weight the training data like ADaboost, residuals are used [12]
Starting from the current model, GB tries to build a decision tree to match the residuals from the previous model. The special feature of this model is that instead of it trying to match the target variable value of y, it will try to match the error value of the previous model. It then adds the training model to the prediction function to gradually update the residuals. Each decision tree in the model chain is very small in size with only a few decision nodes determined by the depth parameter d in the model. The figure below illustrates this process in more detail:
Figure 3.
Training method using GB. Decision tree models are arranged in a sequence. Each decision tree is constructed based on the predictions of the preceding decision tree. At each decision tree, the model will attempt to fit the residuals from the previous decision tree.
Figure 3.
Training method using GB. Decision tree models are arranged in a sequence. Each decision tree is constructed based on the predictions of the preceding decision tree. At each decision tree, the model will attempt to fit the residuals from the previous decision tree.
3.3. XGBoost (Extreme Gradient Boosting)
XGBoost is an extremely powerful and popular machine learning model in both the machine learning and data science communities. XGBoost, mainly developed by Tianqi Chen and first announced in 2015. It falls under the category of Gradient Boosting algorithms, designed to optimize the performance of prediction models, especially in regression and classification tasks.
XGBoost uses Gradient Descent [13] to optimize the model by continuously improving the decision trees. XGBoost is efficiently implemented and supports parallel computation, which speeds up training on multi-core computers. The steps in building the XGBoost model are:
- −
- XGBoost starts by constructing a weak decision tree, possibly a very small one.
- −
- Computing the Gradient of the Loss Function: After having a weak tree, XGBoost calculates the gradient of the loss function (typically mean squared error in regression or log loss in classification) with respect to the data points. This gradient reflects the discrepancy between the current predictions and the actual values.
- −
- Building the Next Tree to Reduce Gradient: XGBoost proceeds to construct another decision tree with the aim of optimizing the reduction in gradient (the difference between predictions and actual values). This yields a new model with improved predictive performance compared to the previous one.
- −
- Combining the New Tree with Previous Trees: XGBoost integrates this new tree into the overall model in addition to the previously built trees, creating a stronger model.
- −
- Iterating the Process: This process is repeated until a predefined number of trees (or tree layers) is reached or when the loss function no longer decreases significantly.
- −
- The outstanding capabilities of XGBoost
XGBoost has the advantage of avoiding overfitting by using techniques such as sub-sampling rows, columns, column per split levels, and applying regularized L1 and L2.
Resource Utilization Capability: Parallel computation on CPU/GPU, distributed computation across multiple servers, computation under resource constraints, cache optimization to speed up training.
And finally, the ability to handle missing data values, continue training using a previously built model to save time.
4. Data
4.1. The inventory points of land subsidence
The land subsidence inventory plays a crucial role in constructing land subsidence susceptibility models, providing essential information about the status and extent of land subsidence in specific areas. This data, along with several influencing factors, forms the basis for training supervised subsidence susceptibility models. As previously mentioned, the Ca Mau Peninsula is a vast and relatively flat region, leading to infrequent data collection points and limited coverage of subsidence points. The total subsidence points collected by the Department of Survey and Mapping of Vietnam amount to 40 points. However, the subsidence observation times are uneven, with the closest measurement taken in 2020. For this reason, we chose to collect additional land subsidence points using the multi-temporal radar image processing method.
The measuring ground deformations from stacks of archive Sentinel-1 SAR imagery acquired in reference period November 2014 – January 2019 was utilized to detect displacements caused by ground subsidence and to estimate the subsidence average velocity over the reference period [14,15]. Land subsidence points made using the PSI method have been proven to have satisfactory accuracy [16]. After selecting prominent subsidence points, 1910 subsidence points were selected to be included in the inventory set. The distribution of land subsidence points is shown in Figure 1
4.2. Influence Factors on the subsidence susceptibility Model
When constructing a machine learning model for predicting land subsidence, several influential factors need to be considered to ensure the accuracy and effectiveness of the model.
Topography: The topography has a significant impact on land subsidence and related phenomena. It can affect subsidence in various ways, such as influencing water flow and the accumulation of organic and mineral waste in the soil. Sloping terrain can lead to inclined subsidence, making the top layer of soil prone to sliding. However, as mentioned in the research area section, Ca Mau has low topography with an average elevation of less than 1 meter, so there are almost no slopes. Therefore, in this study, we only consider an elevation layer as a representative of the topography. The terrain layer is taken from the SRTM 30m digital terrain model.
Geology: The geological structure can affect the strength of the soil and its load-bearing capacity. Soil with layered structures, cracks, or weaknesses may be more susceptible to subsidence. Thus, geological data is an important input layer influencing land subsidence. The geological map of Ca Mau is a 1:100,000 scale map provided by the Vietnam Institute of Geology and Mineral Resources.
Soil Type: The type of soil can influence subsidence through its physical and chemical properties, including permeability, water retention, swelling and shrinking, hardness, and flexibility, as well as its interaction with groundwater. The permeability of the soil affects the rate of water infiltration through the soil. Soil with good permeability can lead to rapid water loss, contributing to the subsidence process. The properties of soil particles, such as clay, sand, and gravel, can affect changes in soil volume. Clay can absorb water and swell when water permeates, while sand is often impermeable and may compress more under high pressure. In addition, the stiffness, flexibility, and thickness of the soil layer are factors that contribute to subsidence effects. The Soil map of Ca Mau is a 1:100,000 scale map provided by the Vietnam Institute of Geology and Mineral Resources.
LULC (Land Use and Land Cover): This refers to how humans use the land, such as planting crops, building houses, constructing roads, urbanization, agricultural production, afforestation, etc. Land use can change over time due to human activities. Changes in surface cover can impact the water balance in the soil. Constructing urban areas, roads, or impermeable surfaces can cause changes in underground water flow, affecting water balance and causing land subsidence. The LULC map of Ca Mau is a 1:50,000 scale map provided by the Vietnam Department Of Survey, Mapping and Geographic Information.
NDVI (Normalized Difference Vegetation Index): NDVI is a commonly used index for measuring and analyzing the vegetation status on the ground based on satellite imagery. NDVI is widely used in areas such as land resource management, agriculture, environmental monitoring, and climate change observation. The NDVI index is calculated from two wavelengths of light reflected from the ground that is Near Infrared (NIR) and Red. The formula for calculating the NDVI index is shown in (3)
The NDVI (Normalized Difference Vegetation Index) typically ranges from -1 to +1. Negative values (often close to -1) usually appear over areas of water, rocks, snow, urban areas, or regions devoid of vegetation. Values close to 0 indicate areas with sparse or no vegetation, while positive values (often close to +1) signify the presence of abundant and well-developed vegetation.
The NDVI index helps monitor changes in vegetation and soil conditions. When vegetation is dense, such as in dense forests or areas with full tree coverage, various interacting factors can contribute to stabilizing the soil and reducing subsidence. This is because plants with strong and dense root systems can create a useful network to firmly hold the soil. Roots help establish cohesion between soil particles, making the soil stronger and less susceptible to being eroded by water flow. NDVI map of Ca Mau area is made from Sentinel-2 satellite images in 2019.
Distance to Roads:
Subsidence often occurs near roads due to changes in the natural drainage system of the area during road construction. The construction of drainage ditches or alterations in the landscape can reduce the natural drainage ability of the environment, leading to flooding and an increased risk of subsidence. Additionally, traffic activities on the road can exert additional load on the ground. Vehicles moving on the road generate impacts and pressure on the soil surface, making the soil more compressible and prone to subsidence. The road map is taken from the 1:50,000 scale topographic map provided by the Vietnam Department Of Survey, Mapping and Geographic Information. Roads will be buffered according to distance at different levels: 50m, 100m, 200m and 500m.
Distance to the river:
The presence of water bodies can increase moisture in the surrounding environment. Moist soil is more susceptible to compression and may lead to subsidence. Human activities creating infrastructure around water bodies, such as building drainage systems, bridges, or urban areas, can also affect soil characteristics and contribute to the subsidence process. The river map is also derived from the 1:50,000 scale topographic map issued by the Vietnam Department of Survey, Mapping, and Geographic Information. Rivers will be buffered at various distances, including 50m, 100m, 200m, and 500m.
Groundwater Depth:
Groundwater is a factor that can be considered one of the most crucial in influencing land subsidence. Numerous studies, such as the research conducted by [10,17,18] have demonstrated the relationship between groundwater and land subsidence. Therefore, the groundwater depth dataset is a significant layer included in this research. We collected this data from groundwater extraction wells in the years 2020, 2021, and 2022. This data was provided by the National Center for Water Resources Planning and Investigation-Vietnam [19].
4.3. Data standardization
When constructing a model for predicting land subsidence, it is essential to standardize the input data by converting it to a consistent parameter system (referred to as data standardization). Variations in measurement units or a wide range of values in the data can potentially impact the model. Data standardization mitigates this effect by bringing all features to a uniform scale. In this study, the data normalization is achieved through the utilization of the Frequency Ratio method that relies on the spatial correlation between previous instances of land subsidence and the factors contributing to the formation of land subsidence. A higher FR value signifies a more robust correlation between subsidence occurrences and the influencing factors. The FR value is computed using the formula [20]. Using ArcGIS 10.8 software, the data for the 1950 selected subsidence points mentioned above were calculated and standardized according to Table 1.
Where: N pix (1) is the number of land subsidence pixels of the factor class; N pix (2) is the total number of pixels of the sub-class over the entire study area; N pix (3) is the total number of land subsidence pixels of the study area; N pix (4) is the total number of pixels of the study area.
5. Results and Discussion
5.1. Evaluate the importance of the model's input variables
Determining the importance of variables helps gain insights into the contribution of each variable to the predicted outcome. This provides an overall understanding of the influence of these factors. Besides, assessing variable importance aids in model optimization. If certain variables have minimal impact on the prediction, consideration can be given to removing them, simplifying the model while retaining accuracy. Additionally, this work avoiding excessive use of correlated variables helps mitigate collinearity issues, where multiple explanatory variables are highly correlated.
Figure 6 presents a plot that summarizes the importance values of the input variables elucidating their relationships with the predicted outcomes. The vertical axis in the chart represents the intensity of the impact of each input factor, while the horizontal axis denotes the respective factors. Higher values on the vertical axis indicate higher efficiency. From Figure 6, it can be understood that LULC and groundwater depth exhibit a significant level of influence on the prediction results compared to other results. In which the XGBoost model has a quite high influence while the two models GB and ADABoost have the lower value. The next influencing factor is the distance to roads and Soil. The reason can be understood as vehicle traffic and loads from road traffic can create pressure on the soil layer, especially when the soil is already weakened due to other reasons.
Other factors that affect the model, although not much, cannot be ignored, such as geology, distance to rivers and streams, and altitude have very little influence, this is easy to explain because Ca Mau has a quite low topography, many places have altitudes lower than sea level.
5.2. Evaluate model performance
To evaluate model performance we use Receiver Operating Characteristic curve (ROC), Area Under the Curve (AUC), Sensitivity, Specificity and accuracy (Acc).
ROC Curve is a graph that illustrates the relationship between the True Positive Rate (TPR) and False Positive Rate (FPR) of a classification model at different decision thresholds. TPR is the ratio of correctly predicted positive cases (true positives) to the total number of actual positive cases. FPR is the ratio of incorrectly predicted positive cases to the total number of actual negative cases.
AUC is the area under the ROC curve. AUC measures the ability of a classification model to correctly classify positive versus negative instances. AUC typically ranges from 0 to 1, with a higher AUC indicating a better model performance. The relationship between model performance and AUC can be quantified as follows: excellent (0.9-1), very good (0.8-0.9), good (0.7-0.8), fair (0.6-0.7), and poor (0.5-0.6) [21].
The accuracy assessment method using ROC curve and AUC is a valuable tool for validating land subsidence prediction models. The utilization of ROC curve and AUC aids in evaluating result reliability, comparing performance among different models, and identifying the best model for land subsidence prediction purposes.
In evaluating the performance of a predictive model, combining the ROC curve and AUC with other metrics such as accuracy, sensitivity, and specificity will provide a more comprehensive overview of the model's performance [22]. The formula for calculating sensitivity is as follows:
Sensitivity = TP / (TP + FN)
Where TP (True Positive) is the number of true positive instances correctly identified, and FN (False Negative) is the number of false negative instances incorrectly identified.
The formula for calculating specificity is as follows:
Specificity = TN/ (TN + FP)
TN (True Negative) is the number of true negative instances correctly identified, and FP (False Positive) is the number of false positive instances incorrectly identified.
Accuracy is calculated according to the formula:
Acc = (TP + TN) / (TP + TN + FN + FP)
For the Ca Mau research area, with three selected models ADB, GB, XGB, the values are calculated based on the training set in Table 3 and the validating set in Table 4 below, along with the ROC curves on the training and testing datasets.
Figure 7.
ROC curves and AUC values of models on training and testing data sets.
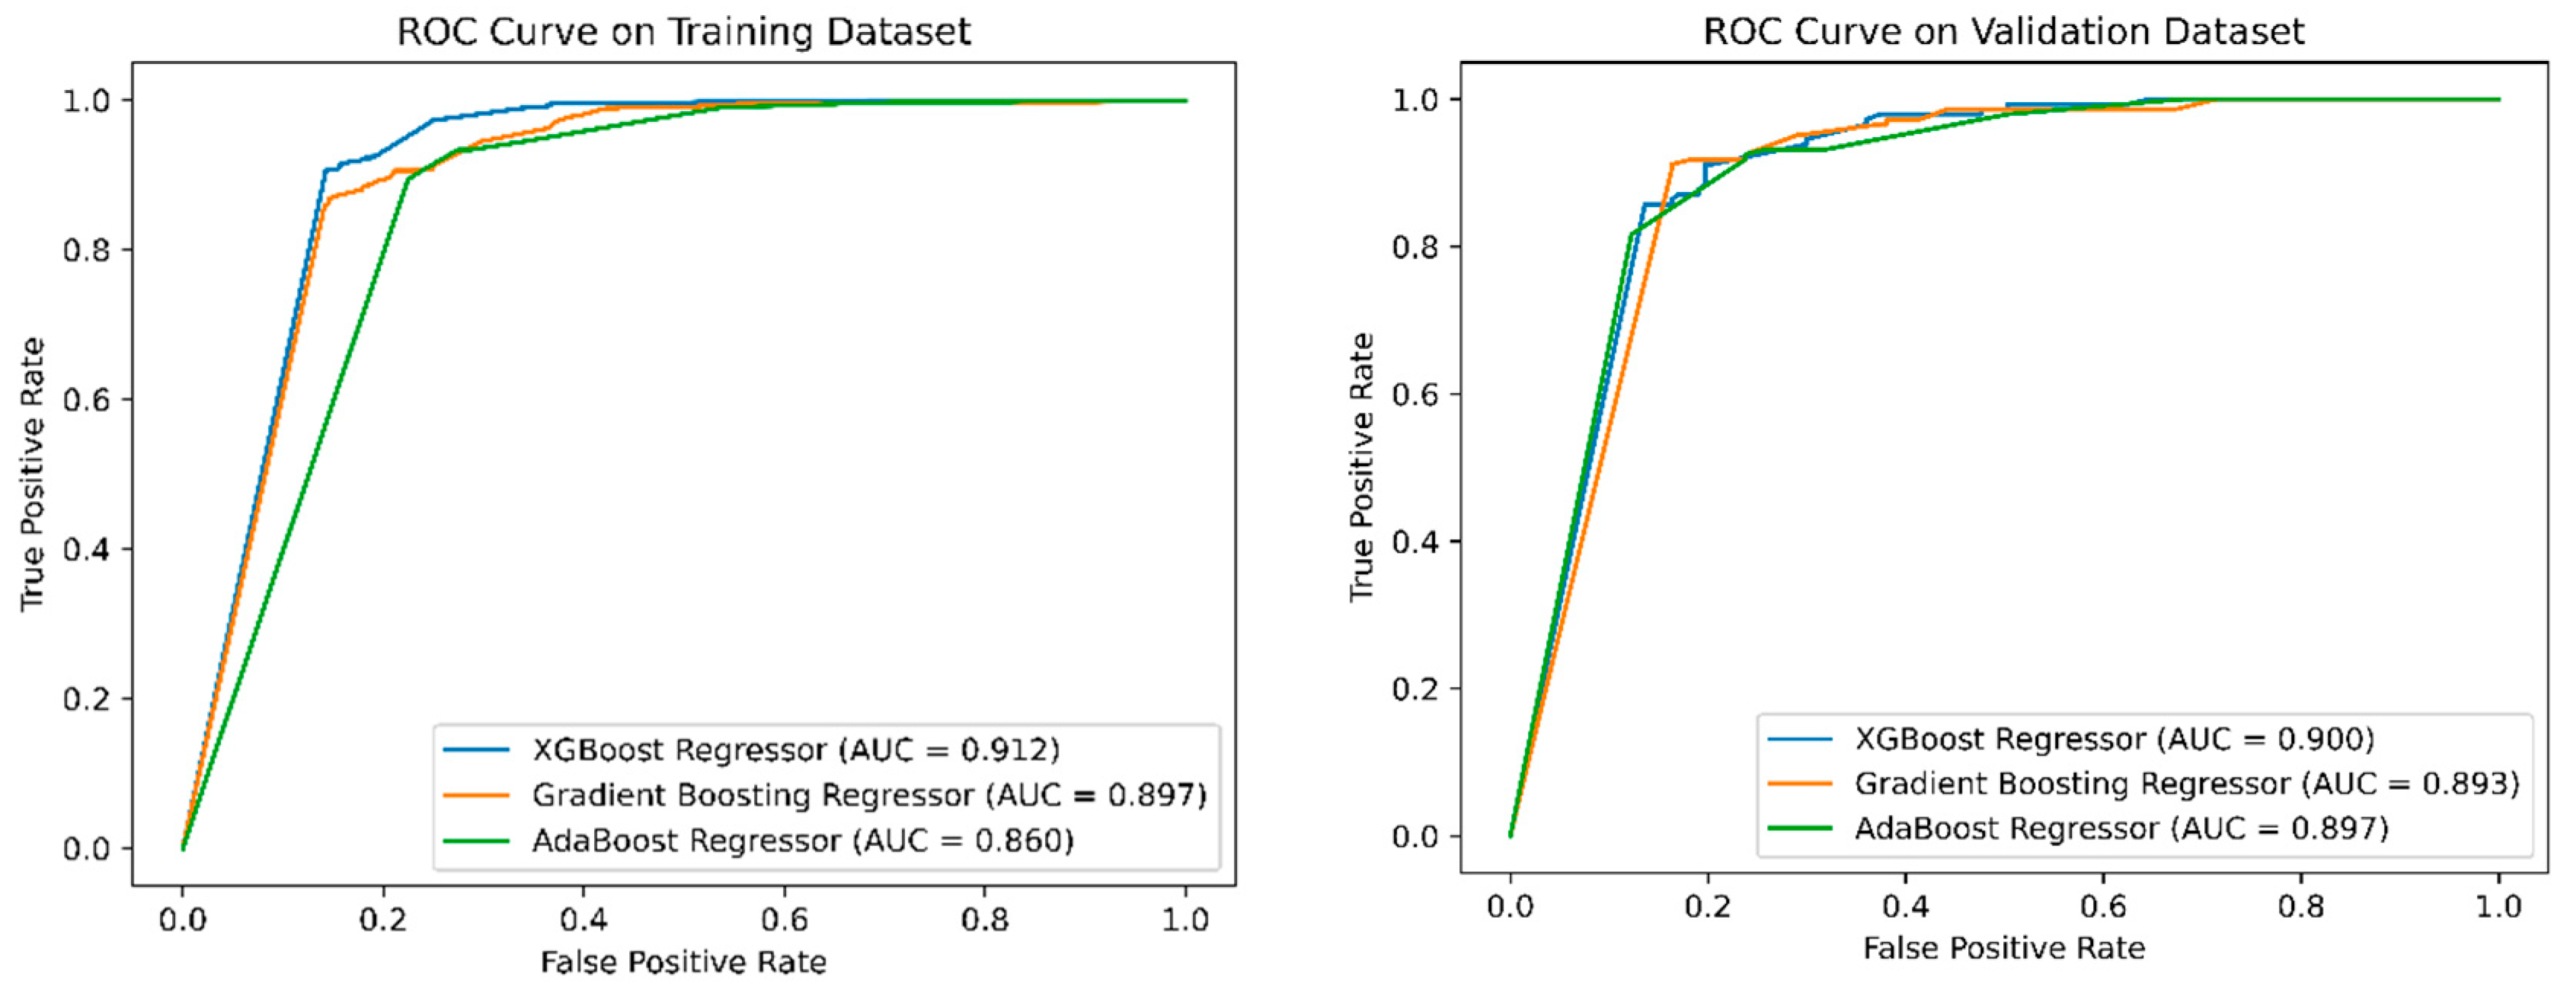
With three predicting models, the accuracy of all three models is very high when the Area Under the Curve (AUC) is greater than 0.8. Among them, XGB achieves the highest accuracy when AUC > 0.9 for both the training and testing datasets. When considering sensitivity which measures the model's ability to accurately identify cases of subsidence within the total number of actual subsidence cases. Therefore, high sensitivity also implies accurately predicting subsidence points distributed in the research area. According to Table 3 and Table 4, sensitivity is greater than 0.8, indicating that accurately predicting subsidence points is very high for the three models.
Regarding specificity, it is a metric that measures the ability of a model to accurately identify non-subsidence cases within the total number of actual non-subsidence cases in the research area. Also, according to Table 3 and Table 4, we can easily observe that on the training set, the accuracy of predicting non-subsidence points is consistently greater than 0.8. However, on the testing set in Table 4, the specificity value of the ADB model is significantly lower, reaching only 0.633. This indicates a considerable number of false predictions of non-subsidence positions. Due to the instability of the ADB model, it is not selected for assessing the land subsidence susceptibility in the Ca Mau peninsular.
Both the GB and XGB models exhibit high overall accuracy (Acc) for both the training and testing datasets, exceeding 0.8, with XGB having slightly higher accuracy. Examining the values under the curve AUC, XGB achieves the highest values for both the training and testing datasets. This may indicate that the performance of the XGB model is superior and could be chosen for creating maps predicting land subsidence susceptibility.
Using the XGB model to create a map predicting the susceptibility to land subsidence, the results were processed using ArcGIS 10.8 software. Employing a classification method to categorize data classes manually in ArcGIS 10.8, the subsidence susceptibility map was divided into five levels such as "Very Low," "Low," "Moderate," "High," and "Very High," corresponding to values "<0.2," "0.2-0.4," "0.4-0.6," "0.6-0.8," and "0.8-1," respectively. The distribution of subsidence susceptibilities from the XGB model is illustrated in Figure 8.
5.3. Discussion
For the selected XGB model, the very high land subsidence susceptibility concentration covers 4% of the total provincial area and is distributed around the city of Ca Mau and the surrounding areas to the south of the Ca Mau Peninsula. This is also explained by the significant influence of Land Use and Land Cover (LULC) on the predictive model (Figure 6). High land subsidence susceptibility is concentrated in the southeast of the Ca Mau Peninsula, adjacent to Bac Lieu province. In this area, the land is relatively low and primarily used for aquaculture. High subsidence points also concentrate along transportation routes, which is more easily explained as training points are often measured along these routes. On the other hand, the subsidence sample points derived from satellite images using the PSInSAR method, as mentioned in the data collection section, mainly take points with high persistent scattering, which are more concentrated around artificial structures such as roads, bridges, and buildings rather than other locations.
The moderate land subsidence susceptibility accounts for only 5% of the scattered distribution, not concentrated. Meanwhile, low land subsidence susceptibility covers 30%, mainly located in the western part of the Ca Mau Peninsula in Tran Van Thoi district. The very low land subsidence susceptibility is concentrated in the north of Ca Mau and covers the largest area at 32%. This northern area includes U Minh district and part of Tran Van Thoi district, where the majority of the U Minh Ha forest is located. The U Minh Ha forest is a unique ecosystem with alternating saline and freshwater, creating a distinctive environment for various plant species. In this area, only a few points have high land subsidence susceptibility, mainly near the groundwater extraction wells.
The soil types have little influence on the land subsidence susceptibility because the predominant soil types in the Ca Mau region are Orthi-Thionic fluvial soil and Histosols soil. The Ca Mau City area is a typical example of Orthi-Thionic fluvial, while the southern part of the Ca Mau Peninsula has Histosols. Both of these soil types have a high to very high risk of land subsidence.
The profile (black line) is taken for the groundwater depth map (Figure 9), revealing that the groundwater depth has significantly decreased in the Ca Mau city area compared to the U Minh area. The decline in groundwater levels is a major contributing factor to land subsidence. Therefore, the possibility of land subsidence in the Ca Mau city area is very high and it has been shown very clearly on the subsidence susceptibility map made from XGB.
6. Conclusion
The study applied Boosting machine learning models, including AdaBoost (ADB), Gradient Boosting (GB), and XGBoost (XGB), to construct a subsidence risk prediction map for the Ca Mau region. Eight influencing factors were considered, including the Digital Terrain Model (DTM), Land Use/Land Cover (LULC), Groundwater Depth, Normalized Difference Vegetation Index (NDVI), geology, Soil, Distance to roads, and Distance to rivers/streams. Among these input layers, LULC had the highest impact on the subsidence susceptibility prediction model, followed by groundwater depth and distance to roads. Other factors had relatively low influence, such as DTM because the Ca Mau Peninsula has low terrain dominated by alluvial soil, making their impact less pronounced.
In the three selected models, ADB exhibited overfitting as evidenced by a relatively low specificity value for the test set compared to the training set. Both GB and XGB showed good accuracy, with AUC, sensitivity, specificity, and accuracy values all exceeding 0.8, where XGB outperformed GB with AUC values greater than 0.9 for both training and test sets. Additionally, the accuracy of the XGB model was higher than that of GB. Therefore, XGB was chosen as the model for constructing the subsidence susceptibility prediction map in the Ca Mau Peninsula.
The subsidence susceptibility distribution map indicated that the highest subsidence is in urban areas, specifically in Ca Mau City and along roads leading to the southern districts of the peninsula. High-risk areas were also concentrated in peat soil contaminated with sulfide and mudflat soil.
Groundwater depth was identified as a significant factor in building the subsidence susceptibility map. The highest subsidence occurred in areas with a groundwater depth of -18m at Ca Mau city, while areas with lower subsidence risk had a groundwater depth of only -6m at U Minh district.
In conclusion, proper land use planning and groundwater management could help address issues related to land subsidence in the Ca Mau Peninsula, contributing to sustainable economic development. Future research could explore new models and algorithms for more accurate subsidence susceptibility prediction.
Author Contributions
Conceptualization, Van Anh Tran and Maria Brovelli; methodology, Thanh Dong Khuc; code, Van Anh Tran and Nhat Duong Tran; validation, Maria Brovelli, Hong Hanh Tran and Thanh Nghi Le; formal analysis, Trung Khien Ha; investigation, Trung Khien Ha; resources, Van Anh Tran; data curation, Thanh Dong Khuc; writing—original draft preparation, Van Anh Tran; writing—review & editing, Maria Brovelli; visualization, Hong Hanh Tran; supervision, Maria Brovelli.
Funding
This research received funding from the Scientific Research Project of the Ministry of Education and Training of Vietnam under code B2022-MDA-13.
Conflicts of Interest
The authors declare no conflicts of interest.
References
- Zhang, Y.; Xue, Y.-Q.; Wu, J.-C.; Yu, J.; Wei, Z.-X.; Li, Q.-F. Land subsidence and earth fissures due to groundwater withdrawal in the Southern Yangtse Delta, China. Environmental Geology. 2008, 55, 751–762. [Google Scholar] [CrossRef]
- Rahmati, O.; Golkarian, A.; Biggs, T.; Keesstra, S.; Mohammadi, F.; Daliakopoulos, I.N. Land subsidence hazard modeling: Machine learning to identify predictors and the role of human activities. Journal of Environmental Management. 2019, 236, 466–480. [Google Scholar] [CrossRef] [PubMed]
- Abdollahi, S.; Pourghasemi, H.; Ghanbarian, G.; Safaeian, R. Prioritization of effective factors in the occurrence of land subsidence and its susceptibility mapping using an SVM model and their different kernel functions. Bulletin of Engineering Geology and the Environment. 2019, 78, 4017–4034. [Google Scholar] [CrossRef]
- Hakim, W.; Fadhillah, M.; Park, S.; Pradhan, B.; Won, J.; Lee, C. InSAR time-series analysis and susceptibility mapping for land subsidence in Semarang, Indonesia using convolutional neural network and support vector regression. Remote Sensing of Environment. 2023, 287, 113453. [Google Scholar] [CrossRef]
- Shi, L.; Gong, H.; Chen, B.; Zhou, C. Land subsidence prediction induced by multiple factors using machine learning method. Remote Sensing. 2020, 12, 4044. [Google Scholar] [CrossRef]
- Rafiei Sardooi, E.; Pourghasemi, H.R.; Azareh, A.; Soleimani Sardoo, F.; Clague, J.J. Comparison of statistical and machine learning approaches in land subsidence modelling. Geocarto international. 2022, 37, 6165–85. [Google Scholar] [CrossRef]
- Bui, D.T.; Shahabi, H.; Shirzadi, A.; Chapi, K.; Pradhan, B.; Pourghasemi, H.R.; Khosravi, K.; Panahi, M.; Bin Ahmad, B.; Lee, S. Land subsidence susceptibility mapping in south korea using machine learning algorithms. Sensors. 2018, 18, 2464. [Google Scholar]
- Wang, H.; Jia, C.; Ding, P.; Feng, K.; Yang, X.; Zhu, X. Analysis and prediction of regional land subsidence with InSAR technology and machine learning algorithm. KSCE Journal of Civil Engineering. 2023, 27, 782–793. [Google Scholar] [CrossRef]
- Mohammadifar, A.; Gholami, H.; Golzari, S. Stacking-and voting-based ensemble deep learning models (SEDL and VEDL) and active learning (AL) for mapping land subsidence. Environmental Science and Pollution Research. 2023, 30, 26580–2695. [Google Scholar] [CrossRef] [PubMed]
- Erban, L.E.; Gorelick, S.M.; Zebker, H.A. Groundwater extraction, land subsidence, and sea-level rise in the Mekong Delta, Vietnam. Environmental Research Letters. 2014, 9, 084010. [Google Scholar] [CrossRef]
- Freund, Y.; Schapire, R.E. Experiments with a New Boosting Algorithm. In Proceedings of the Thirteenth International Conference on International Conference on Machine Learning, Bari, Italy, 3–6 July 1996; Morgan Kaufmann Publishers Inc.: San Francisco, CA, USA, 1996; pp. 148–156. [Google Scholar]
- Friedman, J.H. Greedy function approximation: a gradient boosting machine. Annals of statistics. 2001, 29, 1189–1232. [Google Scholar] [CrossRef]
- Bubeck, S. Convex optimization: Algorithms and complexity. Foundations and Trends® in Machine Learning. 2015, 8, 231–357. [Google Scholar] [CrossRef]
- (BGR), Federal Office of Civil Protection and Disaster Assistance (BBK) on behalf of the German Corporation for International Cooperation GmbH (GIZ) and Federal Institute for Geosciences and Natural Resources. 2019. 'EMSN062: Assessing changes in ground subsidence rates, Mekong Delta, Vietnam', Emergency Management Service - Mapping, Copenicus.
- Minderhoud, PSJ. Modelling Mekong Delta Subsidence, Challenges and How to Improve Quantifications. In Conference proceedings of the 4th Asia Pacific Meeting on Near Surface Geoscience & Engineering, Ho Chi Minh, Vietnam, 30 November – 2 December 2021.
- de Wit, K.; Lexmond, B.R.; Stouthamer, E.; Neussner, O.; Dörr, N.; Schenk, A.; Minderhoud, P.S.J. Identifying causes of urban differential subsidence in the Vietnamese Mekong Delta by combining InSAR and field observations. Remote Sensing. 2021, 13, 189. [Google Scholar] [CrossRef]
- Zamanirad, M.; Sarraf, A.; Sedghi, H.; Saremi, A.; Rezaee, P. Modeling the influence of groundwater exploitation on land subsidence susceptibility using machine learning algorithms. Natural Resources Research. 2020, 29, 1127–1141. [Google Scholar] [CrossRef]
- Li, H.; Zhu, L.; Dai, Z.; Gong, H.; Guo, T.; Guo, G.; Wang, J.; Teatini, P. Spatiotemporal modeling of land subsidence using a geographically weighted deep learning method based on PS-InSAR. Science of The Total Environment. 2021, 799, 149244. [Google Scholar] [CrossRef] [PubMed]
- NAWAPI. Water resources yearbook for the South Central region in 2021 (Department of Statistics of Ca Mau), Vietnam, 2022.
- Khan, H.; Shafique, M.; Khan, M.A.; Bacha, M.A.; Shah, S.U.; Calligaris, C. Landslide susceptibility assessment using Frequency Ratio, a case study of northern Pakistan. The Egyptian Journal of Remote Sensing and Space Science. 2019, 22, 11–24. [Google Scholar] [CrossRef]
- Khuc, T.D.; Truong, X.Q.; Tran, V.A.; Bui, D.Q.; Bui, D.P.; Ha, H.; Tran, T.H.M.; Pham, T.T.T.; Yordanov, V. Comparison of Multi-Criteria Decision Making, Statistics, and Machine Learning Models for Landslide Susceptibility Mapping in Van Yen District, Yen Bai Province, Vietnam. International Journal of Geoinformatics. 2023, 19. [Google Scholar]
- Truong, X.Q.; Nguyen, H.D.D; Do, T.H.; Tran, N.D.; Do, T.T.N.; Tran, V.A.; Yordanov, V.; Maria A., B.; Khuc, T.D. Random forest analysis of land use and land cover change using sentinel-2 data in van yen, yen bai province, Vietnam. In Advances in Geospatial Technology in Mining and Earth Sciences, Proceedings of the 2nd International Conference on Geo-spatial Technologies and Earth Resources, Hanoi, Vietnam, October 2022; Springer, Cham.: Springer Nature Switzerland AG, 2023; pp. 429–445. [Google Scholar]
Figure 4.
Input factor layers for the subsidence prediction model in Ca Mau area.
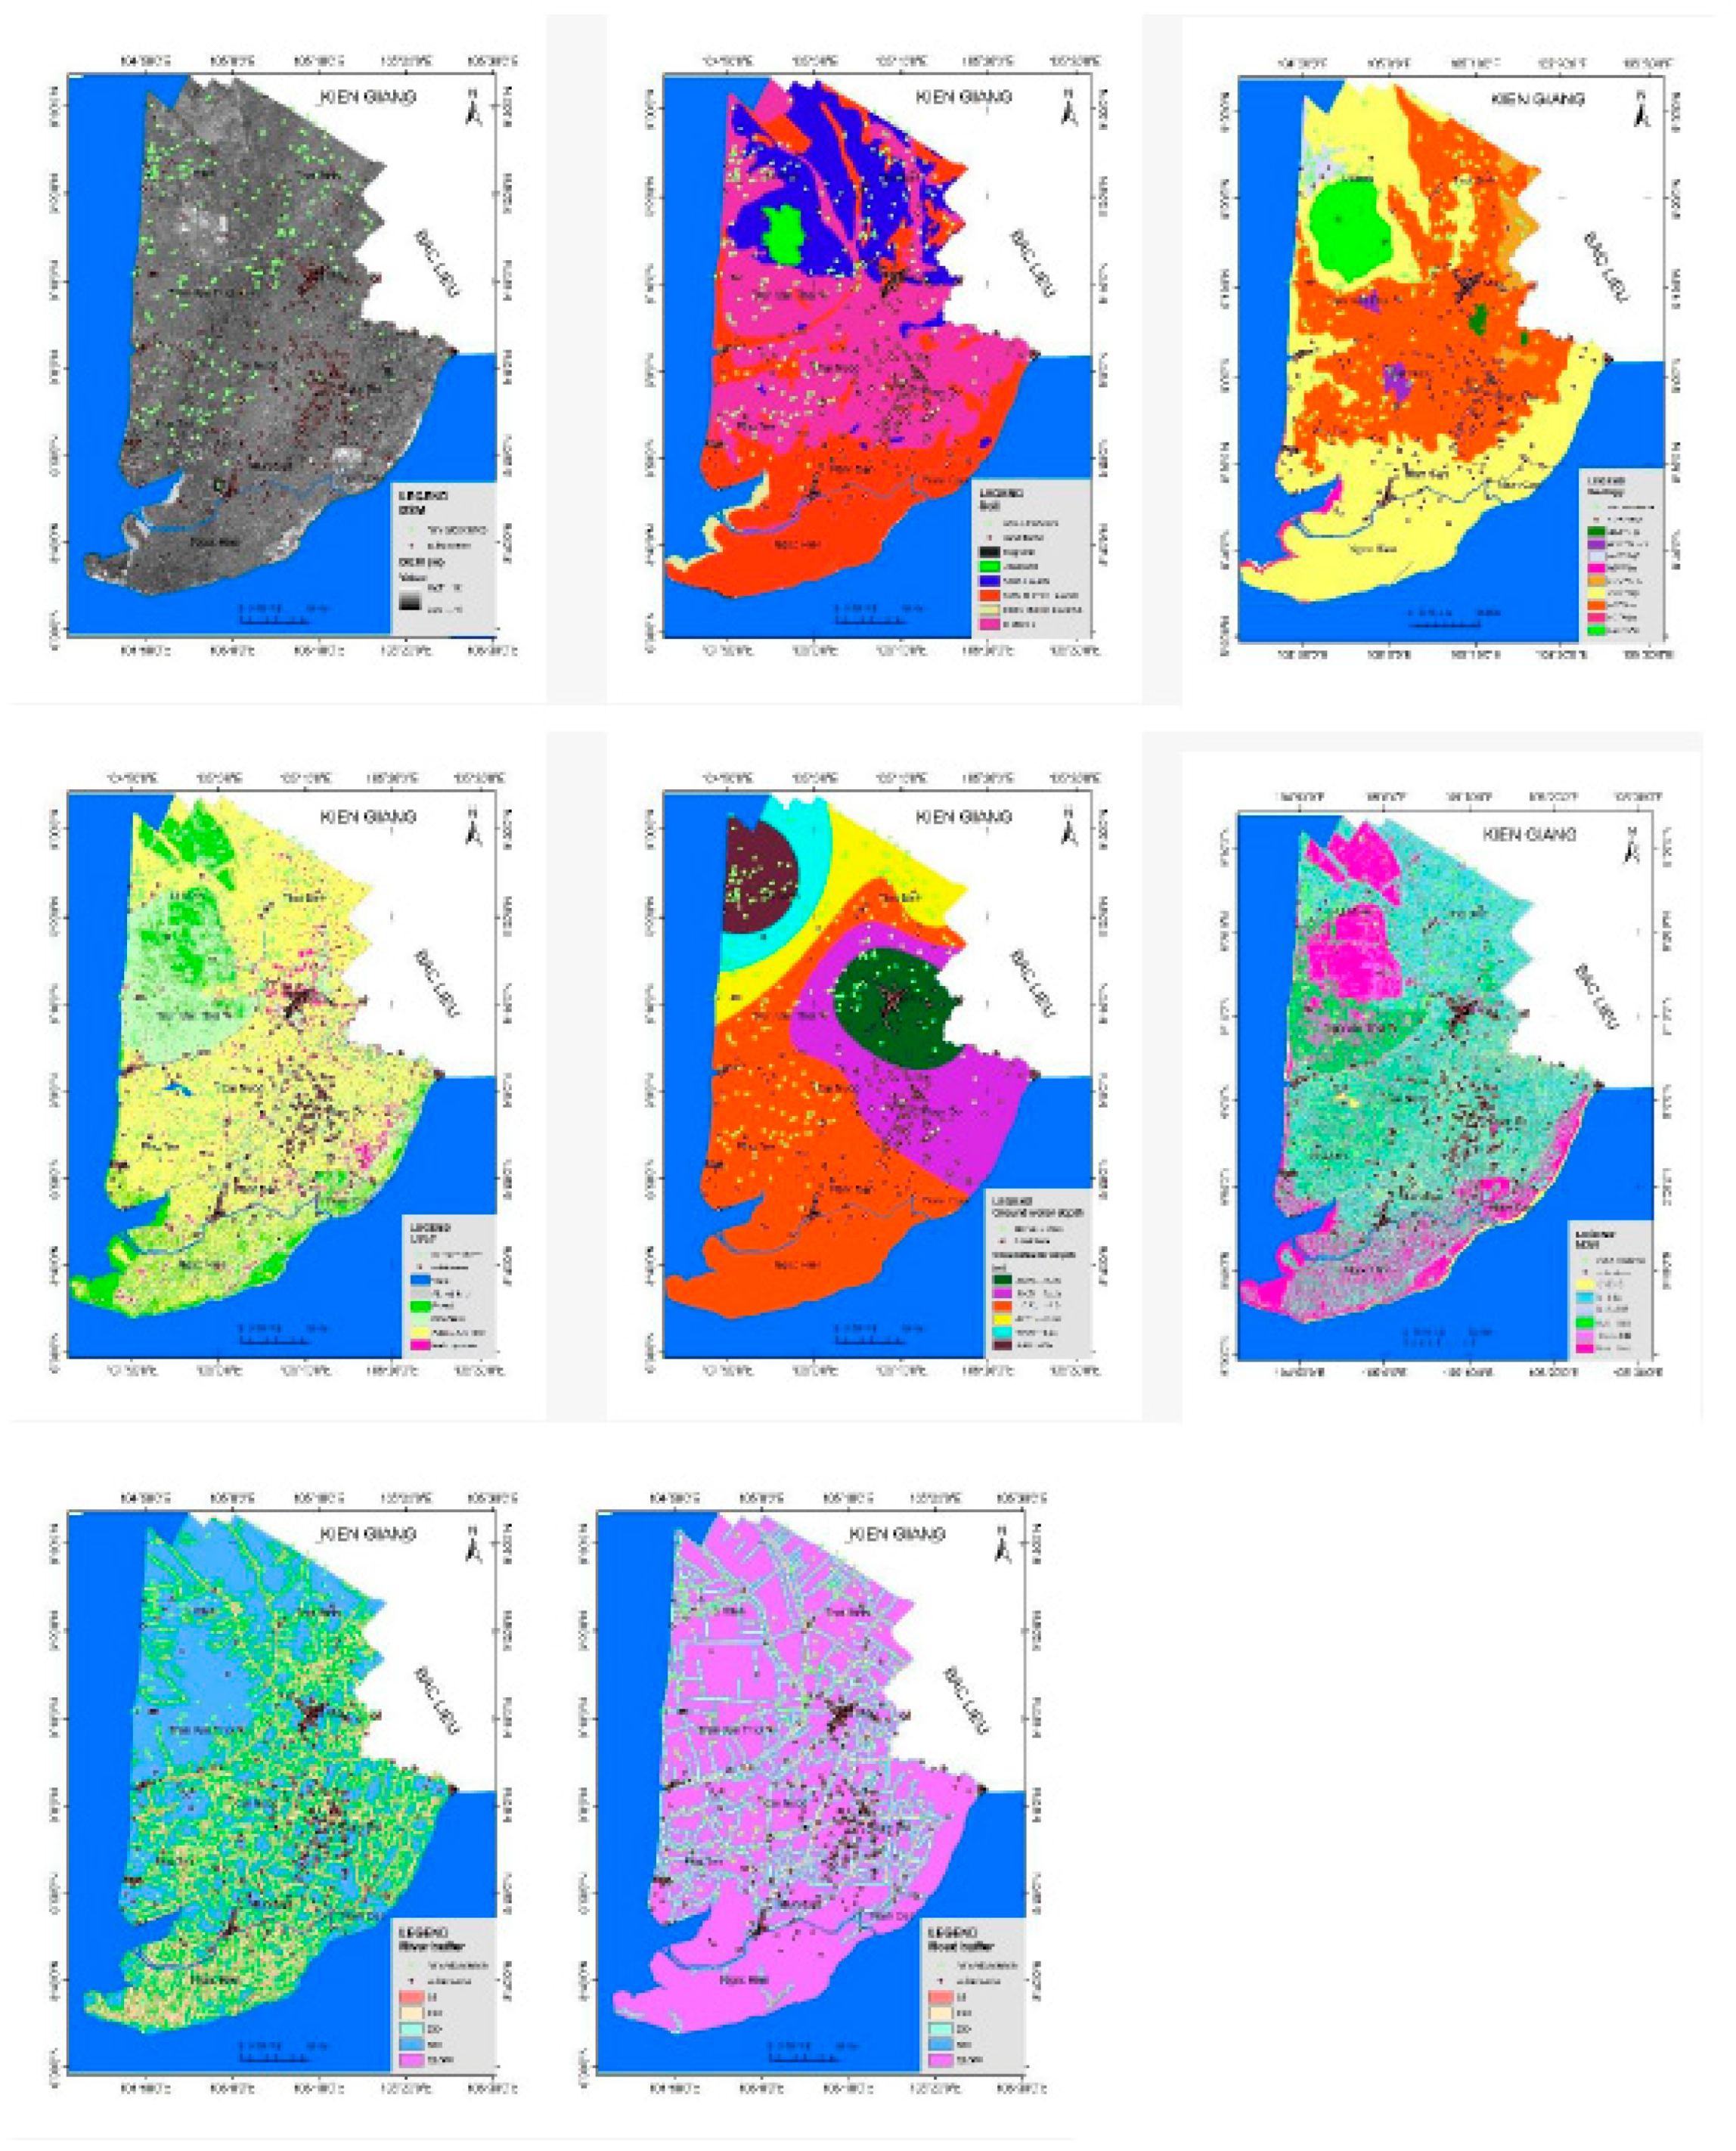
Figure 5.
Processing flow chart for land subsidence susceptibility mapping.
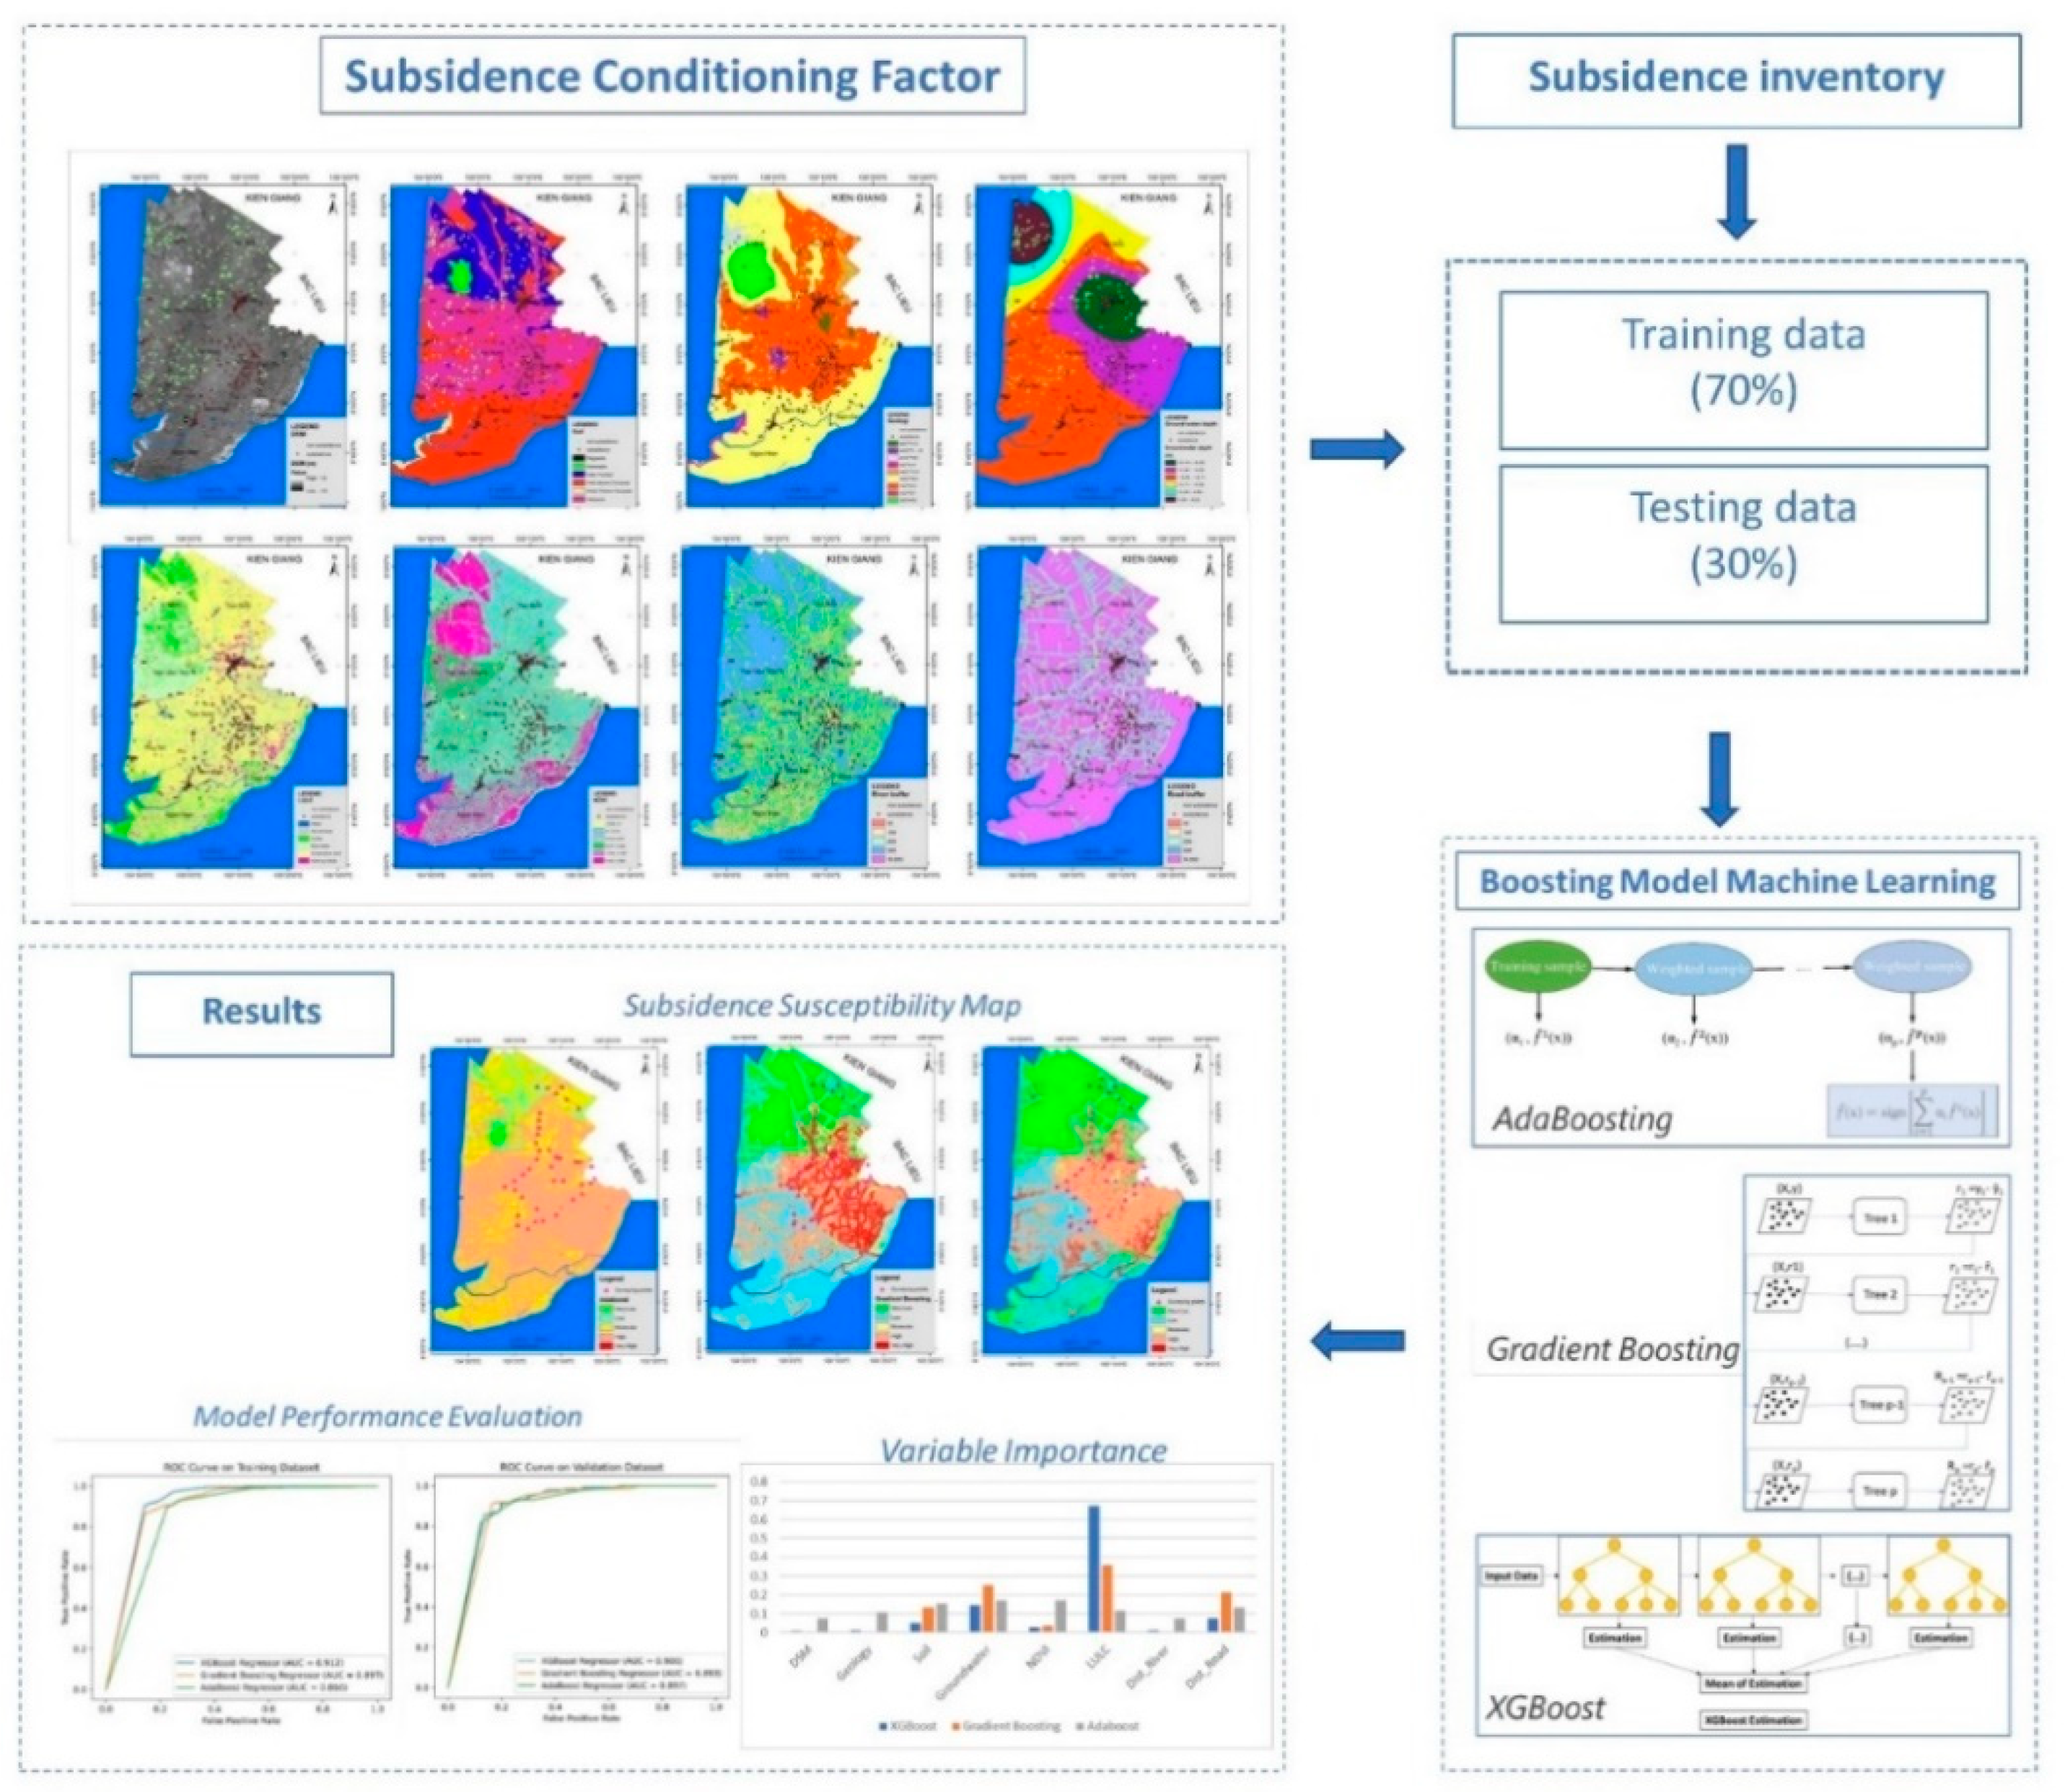
Figure 6.
Evaluation of the importance of 8 input variables in three models.
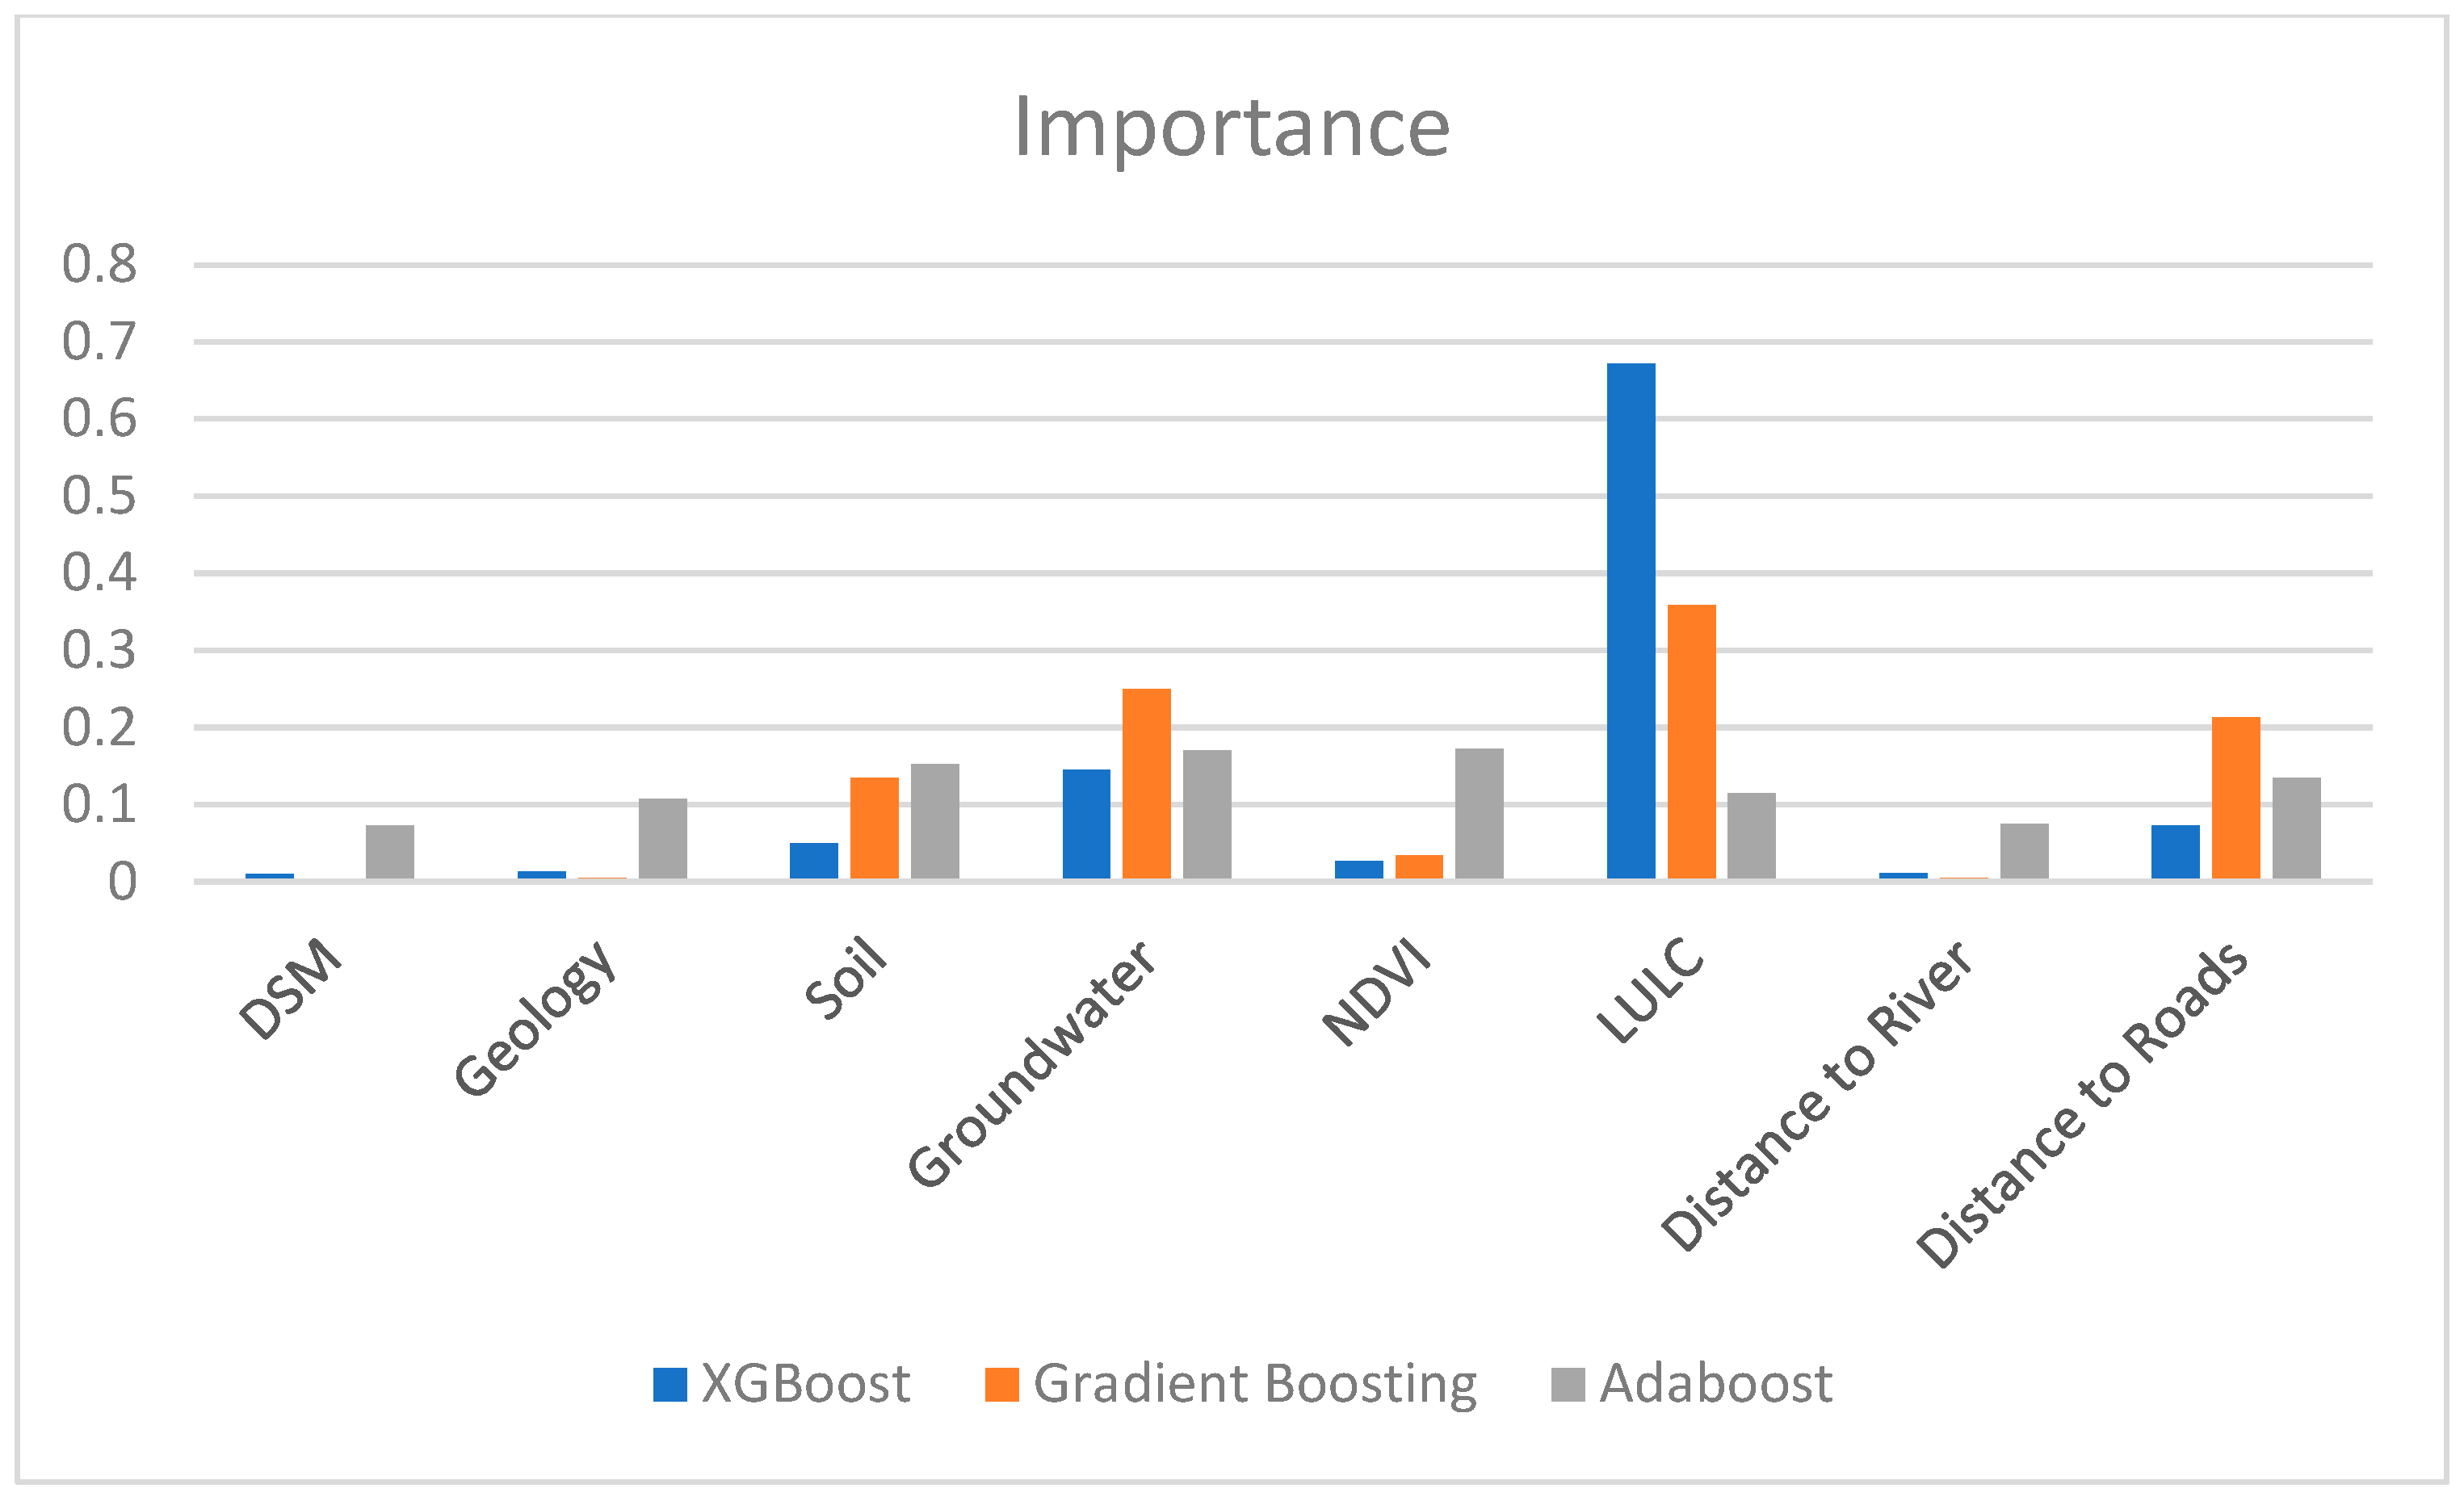
Figure 8.
(a) Land subsidence susceptibility distribution map using the XGB model; (b) Distribution of land subsidence susceptibility areas by the number of pixels; (c) Distribution of land subsidence susceptibility areas by percentage.
Figure 8.
(a) Land subsidence susceptibility distribution map using the XGB model; (b) Distribution of land subsidence susceptibility areas by the number of pixels; (c) Distribution of land subsidence susceptibility areas by percentage.
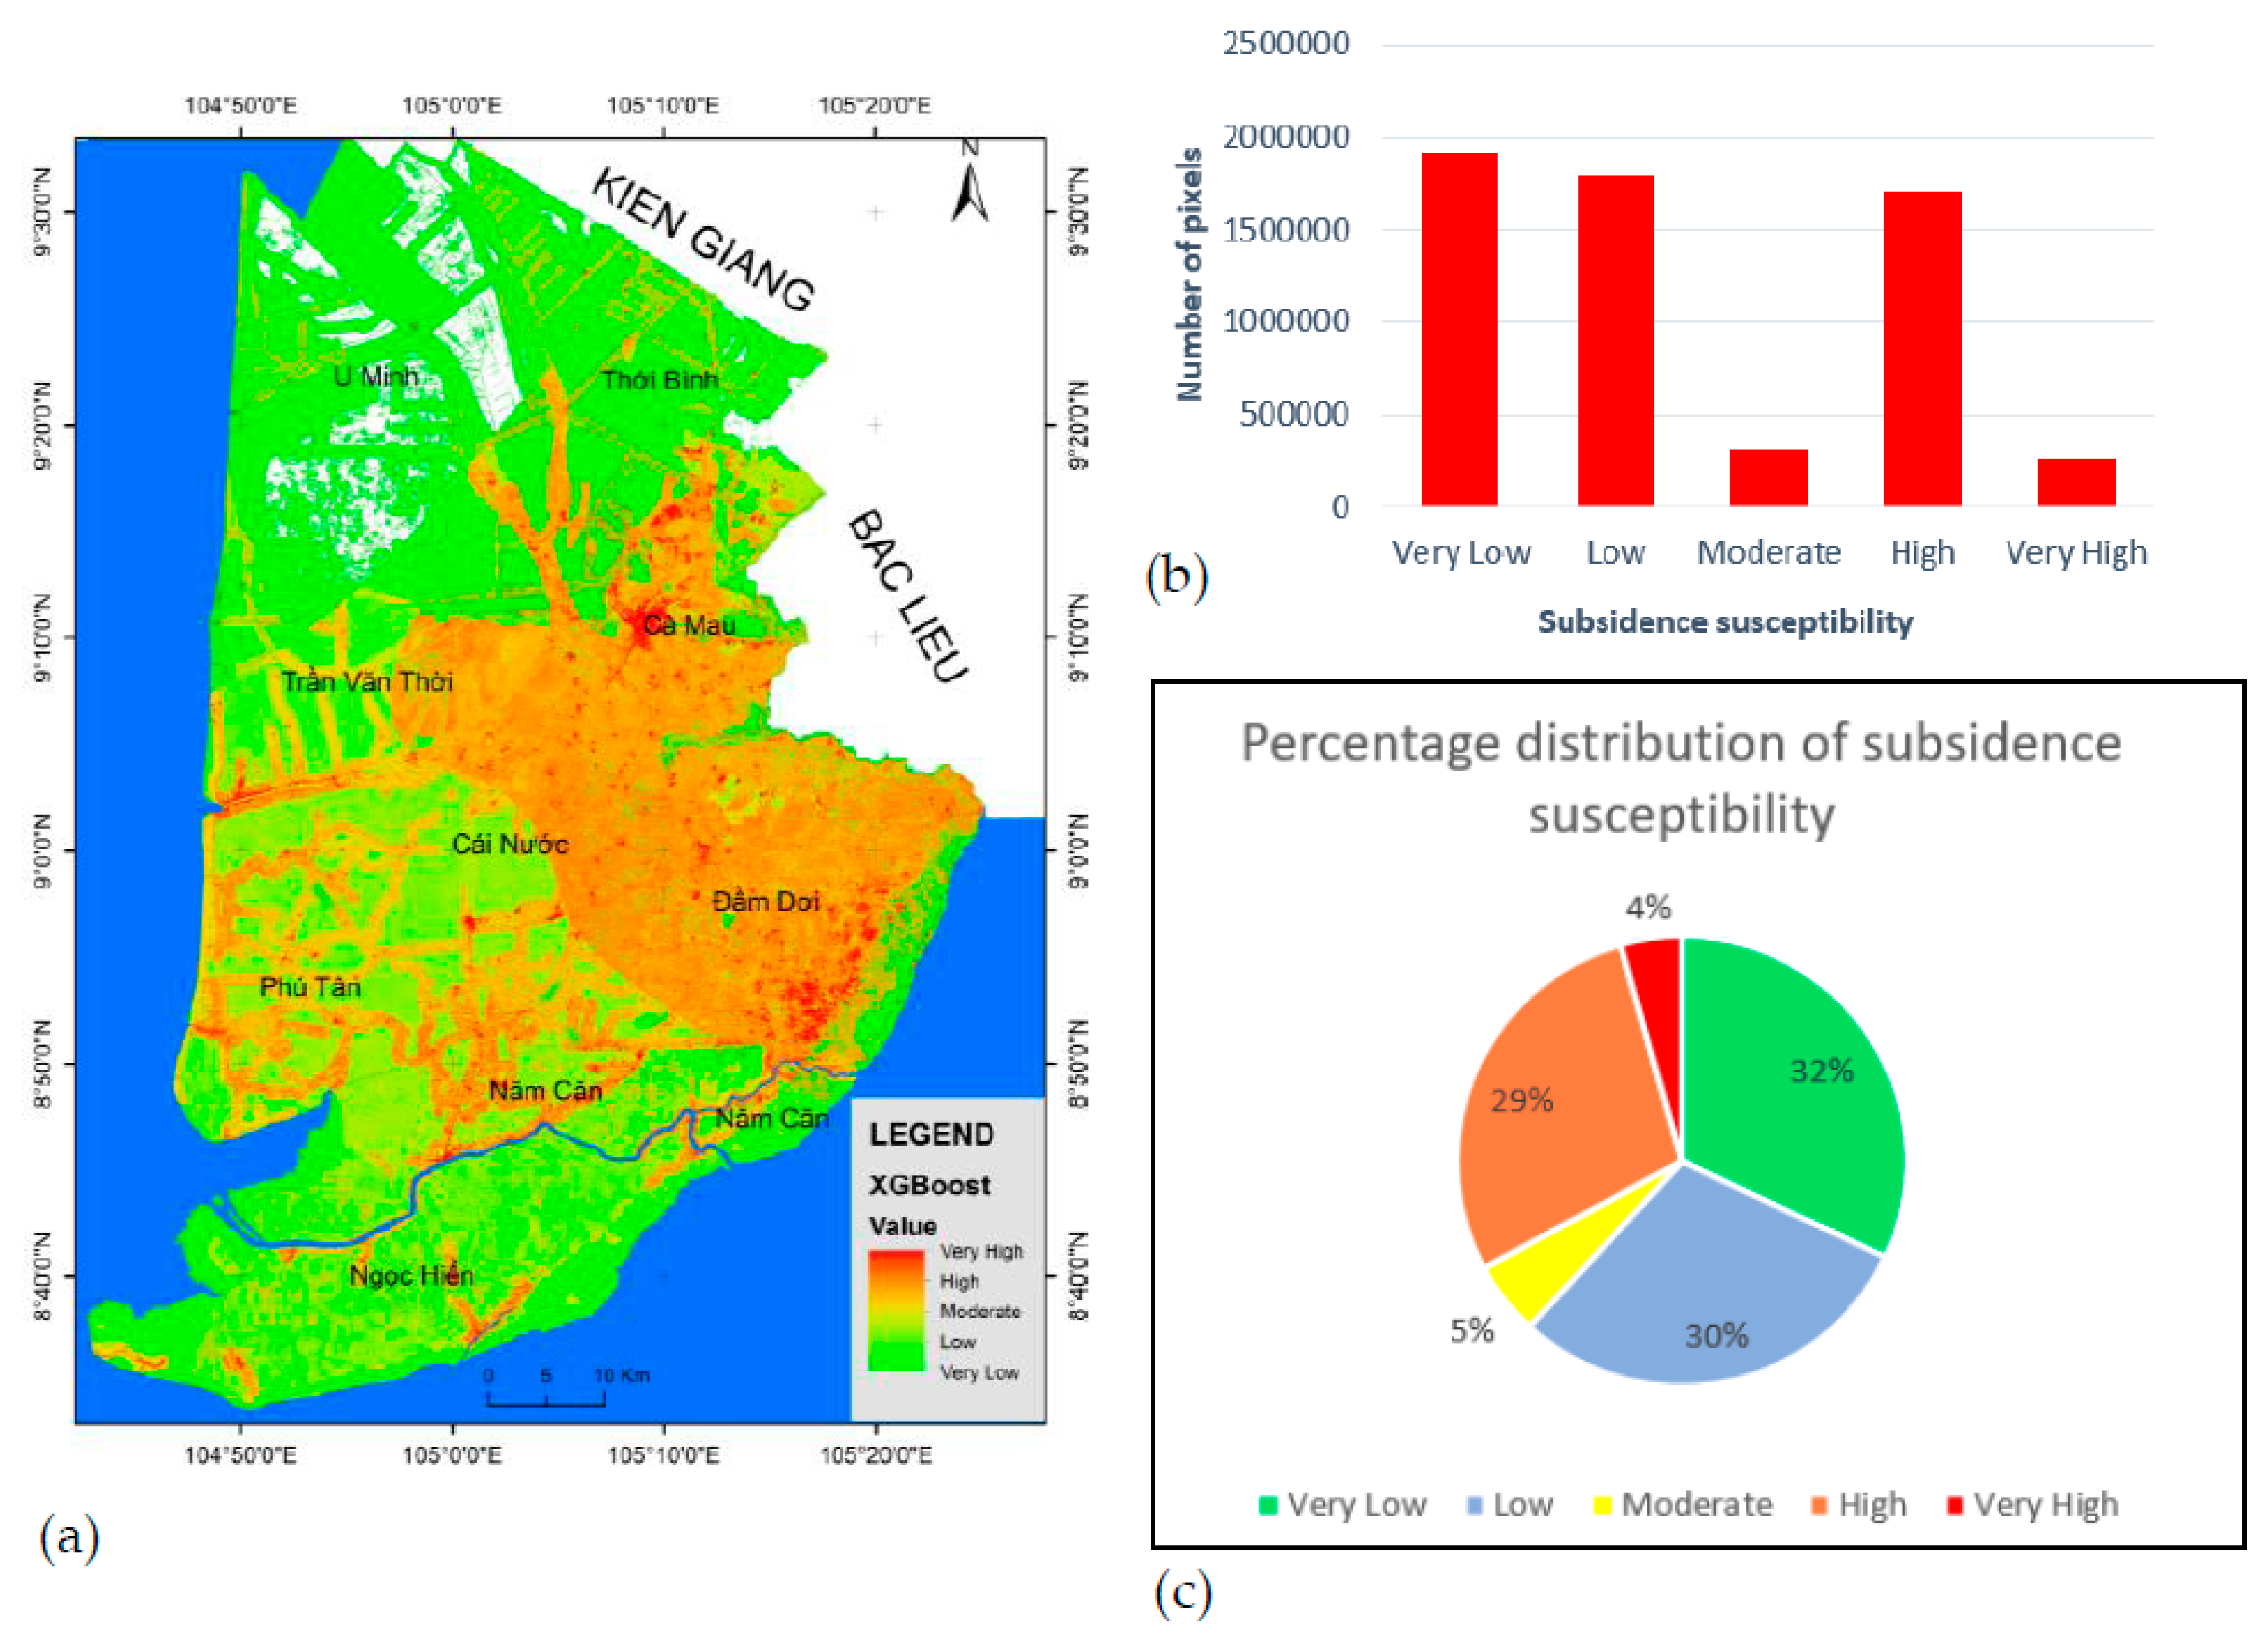
Figure 9.
(a) Map of average groundwater levels over the years and a cross-section depicting the depth of the groundwater; (b) Location of the land subsidence susceptibility map zoomed in at position A; (c) Location of the land subsidence susceptibility map zoomed in at position B.
Figure 9.
(a) Map of average groundwater levels over the years and a cross-section depicting the depth of the groundwater; (b) Location of the land subsidence susceptibility map zoomed in at position A; (c) Location of the land subsidence susceptibility map zoomed in at position B.
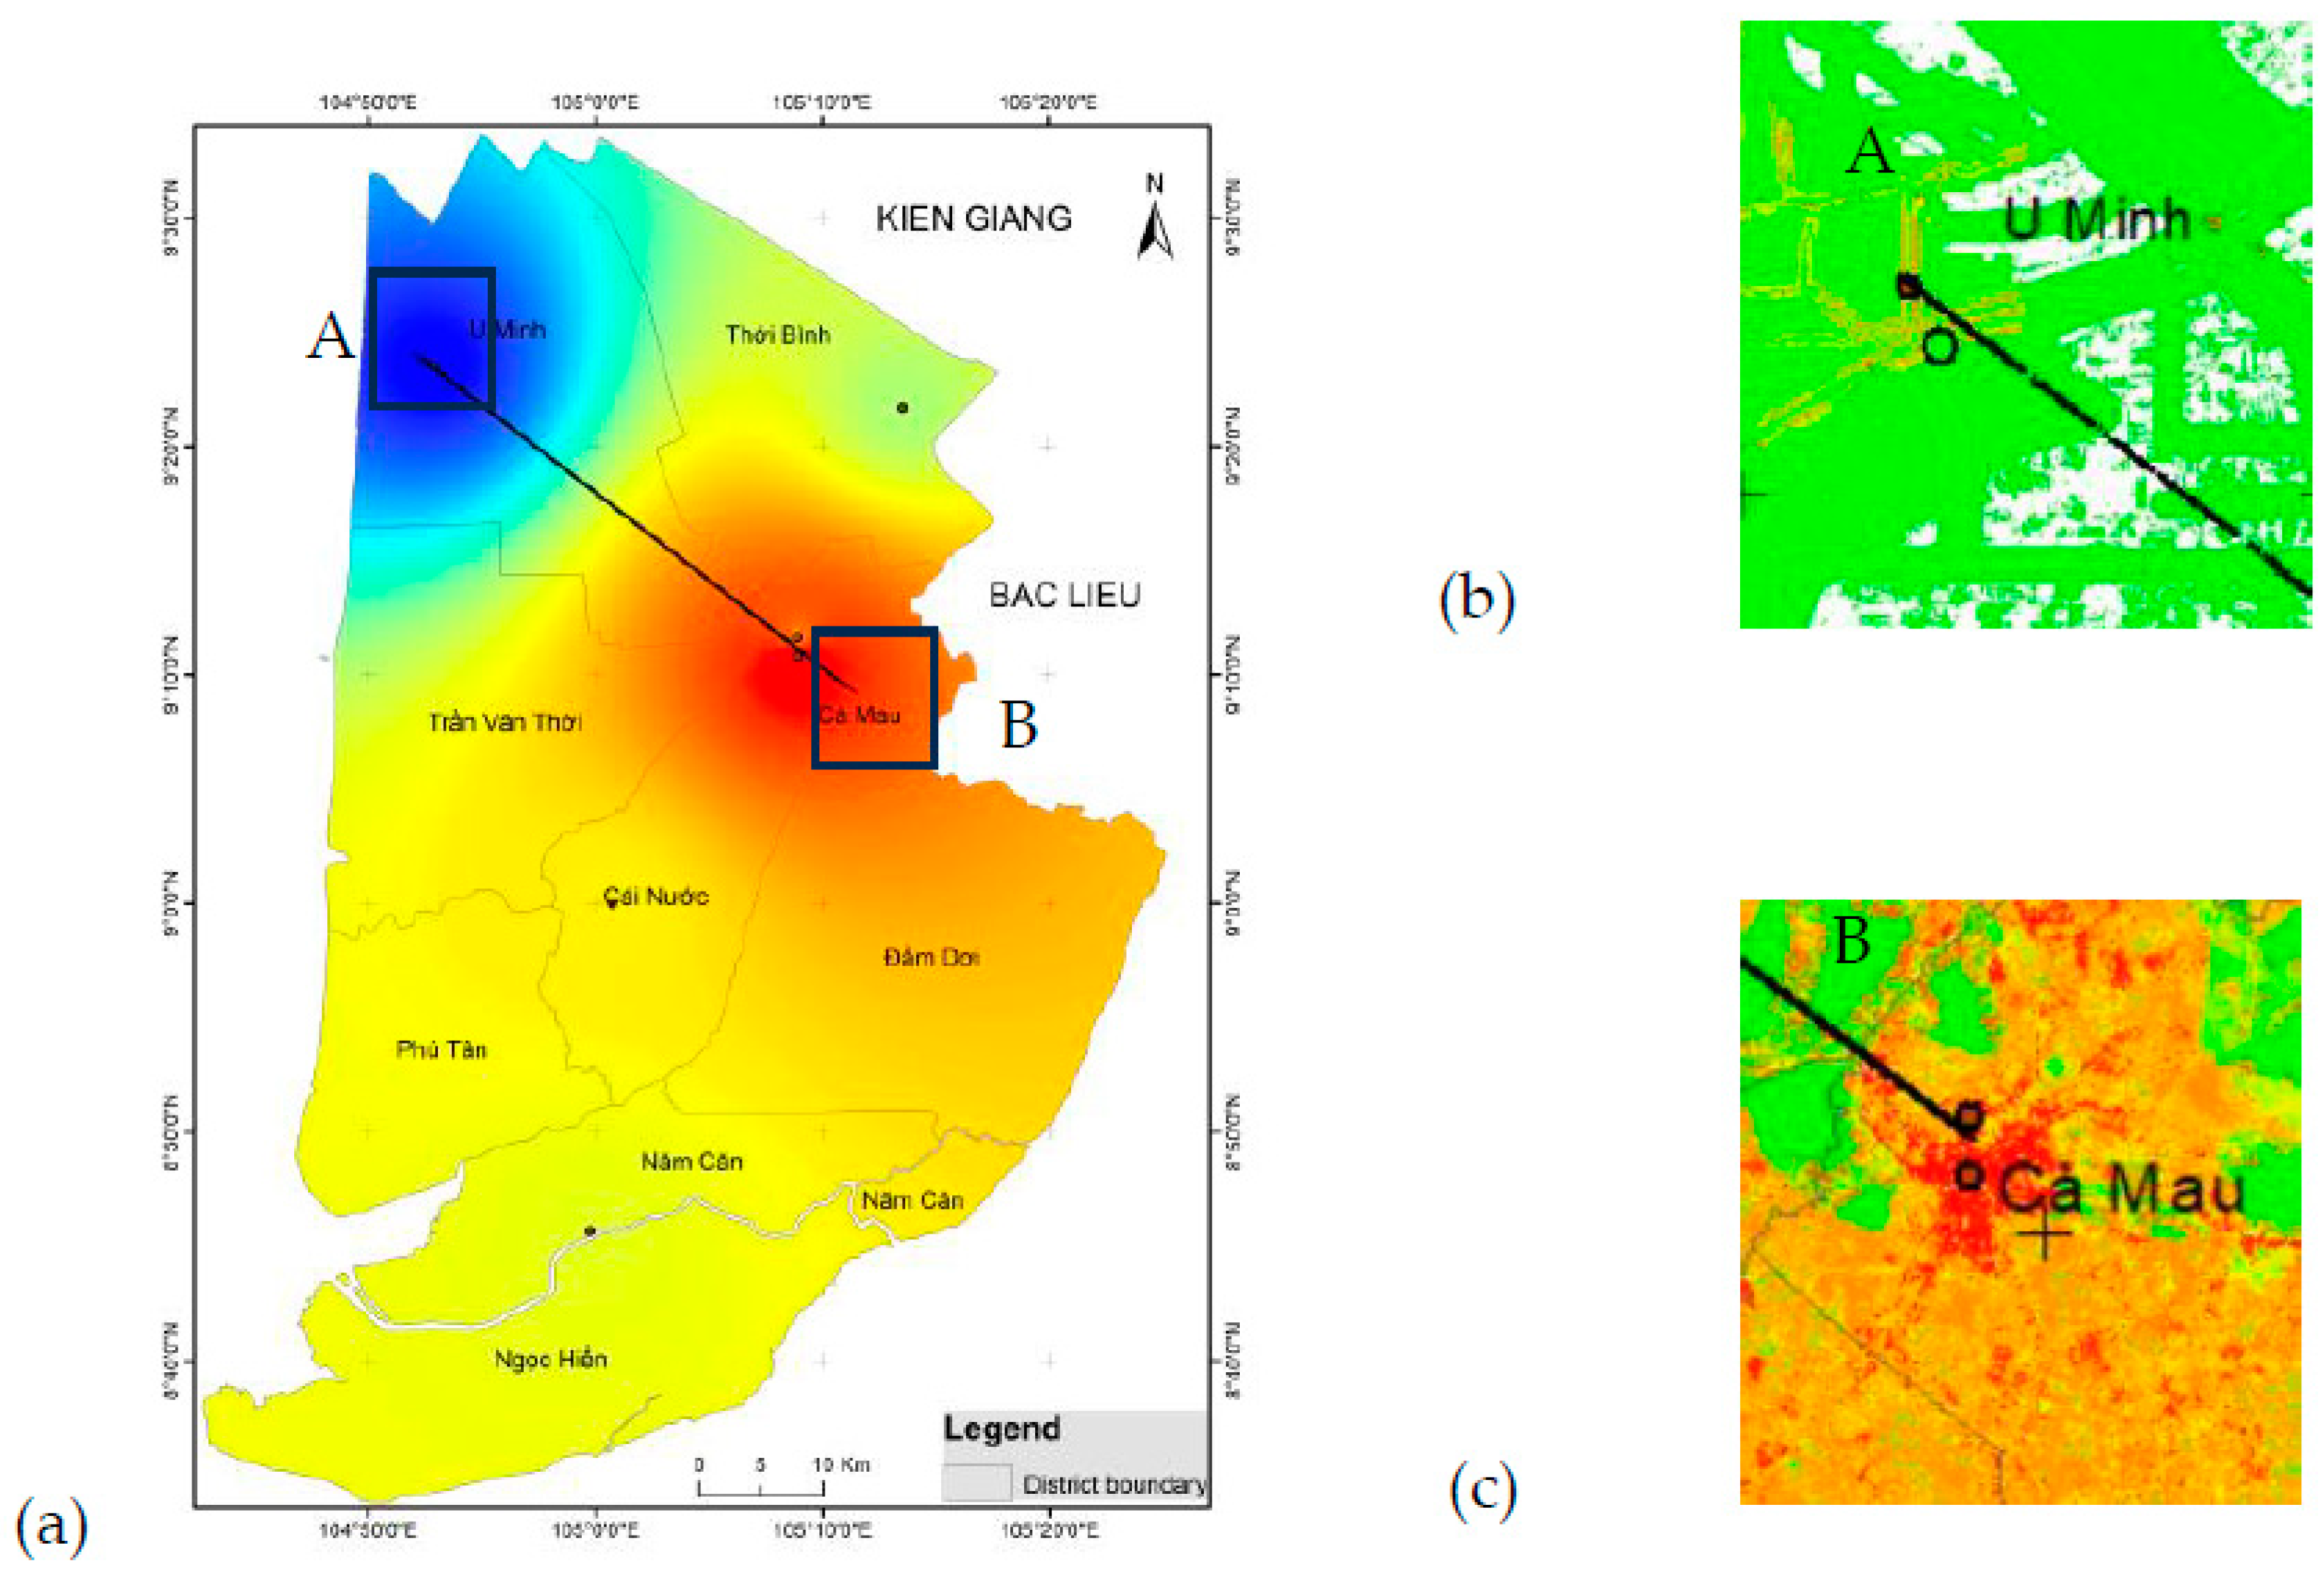

Table 1.
Land subsidence conditioning factors and their classification.
| Factor | Sub-factor | LS points | %Land subsidence | Class pixels | % Class pixel | FR |
| (1)<[-7.431] | 3 | 0.29 | 28948 | 0.496 | 0.586 | |
| Elevation (m) | (2) [-7.431m-(-0.568)m] | 23 | 2.23 | 532631 | 9.135 | 0.244 |
| (3) [-0.568m- 1.490m] | 152 | 14.73 | 1908970 | 32.739 | 0.450 | |
| (4) [1.490m-5.608m] | 738 | 71.51 | 2946996 | 50.541 | 1.415 | |
| (5) [5.608m-14.529m] | 115 | 11.14 | 387369 | 6.643 | 1.677 | |
| (6) [>14.529m] | 1 | 0.10 | 25941 | 0.445 | 0.218 | |
| (1) Regosols | 0 | 0.00 | 4800 | 0.080 | 0.000 | |
| Soil | (2) Arenosols | 0 | 0.00 | 94229 | 1.579 | 0.000 |
| (3) Salic Fluvisols | 30 | 2.92 | 1098253 | 18.407 | 0.159 | |
| (4) Orthi- Thionic fl | 508 | 49.51 | 2098530 | 35.171 | 1.408 | |
| (5) Proto- Thionic fl | 0 | 0.00 | 145226 | 2.434 | 0.000 | |
| (6) > Histosols | 488 | 47.56 | 2525584 | 42.329 | 1.124 | |
| (1) (abQe ) | 2 | 0.20 | 266 | 0.498 | 0.393 | |
| Geology | (2) (abQer Ho) | 1 | 0.10 | 531 | 0.994 | 0.098 |
| (3) (abTerţ) | 0 | 0.00 | 1 | 0.002 | 0.000 | |
| (4) (amQe) | 13 | 1.27 | 767 | 1.436 | 0.885 | |
| (5) (amQerţ) | 0 | 0.00 | 168 | 0.315 | 0.000 | |
| (6) (bQQe) | 7 | 0.68 | 1399 | 2.619 | 0.261 | |
| (7) (mQQe) | 395 | 38.61 | 24504 | 45.873 | 0.842 | |
| (8) (mQQe ţ) | 593 | 57.97 | 22656 | 42.413 | 1.367 | |
| (9) (mbQe) | 8 | 0.78 | 344 | 0.644 | 1.214 | |
| (10) (mbQer Ho) | 4 | 0.39 | 2781 | 5.206 | 0.075 | |
| (1) [(-18.191m)–(-15.288m)] | 255 | 24.71 | 561100 | 9.831 | 2.513 | |
| Ground water | (2) [(-15.288m)–(-13.930m)] | 262 | 25.39 | 1202946 | 21.077 | 1.205 |
| (3) [(-13.930m)–(-12.713m)] | 478 | 46.32 | 2672539 | 46.826 | 0.989 | |
| (4) [(-12.713m)–(-10.933m)] | 16 | 1.55 | 579125 | 10.147 | 0.153 | |
| (5) [(-10.933m)–(-8.591m)] | 2 | 0.19 | 344049 | 6.028 | 0.032 | |
| (6) [(-8.591m)–(-6.251m)] | 19 | 1.84 | 347630 | 6.091 | 0.302 | |
| (1) [(-0.445)–(-0.055)] | 14 | 1.36 | 444115 | 7.617 | 0.178 | |
| NDVI | (2) [(-0.055)–0.116] | 465 | 45.06 | 1025564 | 17.589 | 2.562 |
| (3) [0.116-0.271] | 282 | 27.33 | 1205154 | 20.669 | 1.322 | |
| (4) [0.271-0.437] | 196 | 18.99 | 1304528 | 22.373 | 0.849 | |
| (5) [0.437-0.619] | 66 | 6.40 | 922437 | 15.820 | 0.404 | |
| (6) [0.619-0.918] | 9 | 0.87 | 929057 | 15.933 | 0.055 | |
| (1) Water | 22 | 2.09 | 9092376 | 41.576 | 0.050 | |
| LULC | (2) Alluvial land | 3 | 0.29 | 120858 | 0.553 | 0.517 |
| (3) Forest | 18 | 1.71 | 1652162 | 7.555 | 0.227 | |
| (4) Rice fields | 325 | 30.92 | 3656870 | 16.722 | 1.849 | |
| (5) Aquaculture land | 116 | 11.04 | 6774991 | 30.980 | 0.356 | |
| (6) Build up areas | 567 | 53.95 | 571849 | 2.615 | 20.631 | |
| Distance to Road | (1) 0-50m | 203 | 19.67 | 539964 | 9.291 | 2.117 |
| (2) 50-100m | 197 | 19.09 | 418632 | 7.203 | 2.650 | |
| (3) 100-200m | 264 | 25.58 | 758709 | 13.055 | 1.959 | |
| (4) 200-500m | 188 | 18.22 | 1604568 | 27.610 | 0.660 | |
| (5) >500m | 180 | 17.44 | 2489723 | 42.841 | 0.407 | |
| Distance to River | (1) 0-50m | 208 | 20.16 | 325502 | 5.601 | 3.599 |
| (2) 50-100m | 116 | 11.24 | 283743 | 4.882 | 2.302 | |
| (3) 100-200m | 182 | 17.64 | 500150 | 8.606 | 2.049 | |
| (4) 200-500m | 220 | 21.32 | 1218897 | 20.974 | 1.016 | |
| (5) >500m | 306 | 29.65 | 3483304 | 59.937 | 0.495 |
Table 3.
Performance evaluation table of models on the training dataset.
| TP | TN | FP | FN | Sensitivity | specificity | AUC | ACC | ||
| Adaboost model (ADB) | 736 | 663 | 92 | 165 | 0.817 | 0.878 | 0.903 | 0.845 | |
| Gradient Boosting (GB) | 711 | 711 | 117 | 117 | 0.858 | 0.858 | 0.897 | 0.858 | |
| XGBoost (XGB) | 750 | 710 | 118 | 78 | 0.906 | 0.857 | 0.912 | 0.881 | |
| TP | TN | FP | FN | Sensitivity | specificity | AUC | ACC | ||
| Adaboost model (ADB) | 137 | 93 | 54 | 10 | 0.932 | 0.633 | 0.897 | 0.78 | |
| Gradient Boosting (GB) | 133 | 123 | 24 | 14 | 0.905 | 0.837 | 0.893 | 0.870 | |
| XGBoost (XGB) | 126 | 127 | 20 | 21 | 0.857 | 0.864 | 0.9 | 0.860 | |
Disclaimer/Publisher’s Note: The statements, opinions and data contained in all publications are solely those of the individual author(s) and contributor(s) and not of MDPI and/or the editor(s). MDPI and/or the editor(s) disclaim responsibility for any injury to people or property resulting from any ideas, methods, instructions or products referred to in the content. |
© 2024 by the authors. Licensee MDPI, Basel, Switzerland. This article is an open access article distributed under the terms and conditions of the Creative Commons Attribution (CC BY) license (http://creativecommons.org/licenses/by/4.0/).
Copyright: This open access article is published under a Creative Commons CC BY 4.0 license, which permit the free download, distribution, and reuse, provided that the author and preprint are cited in any reuse.


