

Submitted:
24 January 2024
Posted:
25 January 2024
You are already at the latest version
Abstract
In the discussion on environmental policies, the notion of eco-efficiency is often used. Eco-efficiency is defined as the delivery of products and services with competitive values, while reducing the ecological impacts and satisfying human needs. In an environment of great competitiveness in which the companies operate, the improvements in the productive process is one of the differentiating factors for guaranteeing a strong competition. Also it is essential rationalizing energy consumption and natural resources. For this it is necessary to understand the main operations and dynamics of the company. This work presents an empirical study of a Portuguese company in the industrial sector. The problematic here presented is based on the company’s growing concern to reduce the amount of scrap produced. From the literature research that was performed, a strong dependence relation between the different variables in the extrusion process was found. The main objective of this work is to model the aluminium extrusion process, with the aim of minimizing the production of scrap. For this several variables involved in the process are taking into account. Using statistical techniques, in particular multiple linear regressions, it was possible to identify the importance of the variables under study for the scrap production.
Keywords:
Aluminium
; Extrusion
; Scrap
; Sustainability
; Multiple Linear Regression
1. Introduction
The complexity and heterogeneity of industries make their analysis essential. The correct management of organizations is crucial for their survival. In the area of Environmental Policies, the Sustainability and the Eco-efficiency issues are becoming increasingly important, both for safeguarding the environment, through the awareness of power and society, as for the competitiveness of the companies ([1,2]).
In the discussion on environmental policies, the notion of Eco-efficiency is often used. Eco-efficiency is defined by [2] as delivering products and services at competitive values, but also reducing the ecological impacts and meeting human needs.
Competitiveness is a reality for companies and the improvements in the productive process is one of the differentiating factors. Optimized processes guarantee a strong competition capability. Therefore, it is essential minimize energy and natural resources consumption, but also minimize the coasts of production. These objectives are only reach if the main operations and dynamics of the company are well known and controlled, but also if the company decision makers have Social Responsibility.
Rapid economic growth and the industrialization process inevitably led to resource depletion and environmental degradation ([3]). In order to prevent this, different approaches are currently adopted in several countries ([4]). Environmental sustainability in production processes is an urgent and remarkable issue and the main concerns are related to a more efficient use of materials and energy ([1,5,6,7]). In the aluminum industry, business units want to produce innovative profiles, either by size or increased energy efficiency capacity, with complex industrial processes. For that, complex an innovative industrial processes are used and optimized every day. The demand for an efficient and sustainable use of energy and resources has led to new design criteria for technical products ([5]). This focus is evidenced by the multiplicity of applications that aluminum profiles can have in sustainable construction, particularly in the area of home automation and renewable energy.
An increasingly demanding industry promotes the dynamic between high quality and low prices, without losing product specifications, leading to new industrial challenges. Besides that, manufacturing industries are focused on controlling negative environmental impacts, reducing costs, conserving energy and natural resources. In this context, the industry is an intensive consumer of natural resources ([8]), and has a substantial role in the surrounding environment changes, that sometimes has a negative impact in the environment. Consequently they have a great social responsibility and a big relevance in the sustainability. Reducing emissions is an urgent objective to pursue ([9,10]). In modern society some environmental issues linked to the industry are part of the most significant threats to sustainable development ([8]).
The incessant pursuit of success is the core objective of any company, only possible if it is integrated into a supported strategic management system. Management throughout its evolution has become more complex and has been presented in organizations and businesses as a challenge ([11]). Planning consists in defining in advance a set of actions or intentions to perform in the future. It is based on this set of programmed activities that companies design and sustain their management strategy.
In the metallurgical industry, extrusion is a first-line technique ([12]), which is very popular and a multi-faceted manufacturing process ([13]). For the most demanding applications on the market it is important to predict/control the properties of aluminum in extrusion process, if possible, before, during and after extrusion. Hence, it is necessary to gain information about the influence of technological parameters ([14]). Extrusion offers unique construction and design possibilities, with different functional characteristics ([12,15,16,17]). Also, it is an extremely complex process associated with several variables, from numerous sources and in the various phases of the process, and must be controlled to ensure product and customer’s specificity’s, as well as the minimum scrap production ([18,19]).
The main objective of this article is to present a model that minimizes the amount of scrap generated in the production sector of an extrusion Portuguese company. It is intended to improve the process, and draw attention to environment protection, improving behaviours, attitudes and practices, with the potential to contribute to the development and competitiveness of the company in this important industrial sector, but also to their Social Responsibility and Sustainability image.
In order to minimize the scrap created in the aluminum extrusion process, nonlinear and linear programming is considered. The process is modelled and six months industrial real data for the company is considered. After, using optimization and statistical techniques, it was possible to solve the problem and to identify the importance of the variables under study, including temperature, time, speed, pressure and geometry variables.
The real database provided by the company includes information concerning the three phases of the production process under analysis, i.e. pre-extrusion, extrusion and post-extrusion. It is expected that these variables contribute to explain the scrap variability in the process.
The paper is organized as follows: in Section 1, the subject is contextualized; Section 2, presents a brief literature review on the aluminum extrusion process, describing the importance of sustainable production, combating the wastefulness of waste, that can be recycled at high cost. The methods that are most commonly used to simulate the extrusion process are presented and finally it is presented an optimization model. In Section 3, it is presented the empirical study and the proposed multiple regression models, as well as the validation and discussion of the industrial process problem model. This paper concludes with a discussion of the main findings and suggestions for future work, in Section 4.
2. Literature Review
The extrusion industry is over 150 years old. Aluminum is one of the most abundant metals in the earth’s crust. Although there is a great abundance of this metal in nature, it does not appear as an isolated element but in combination with other metals. The Bayer process allows aluminum to be extracted from these materials, which is a major step forward in the use of this metal at industrial level ([20]).
Furthermore, aluminum extrusion technology in industry, continues to be a subject of discussion and evaluation, concerning its application to the working environment in the most diverse industrial areas and markets, such as construction, transport, motor sports, industry and structures, a large number of different applications of extruded aluminum profiles can be found ([12,13,21]).
Extrusion is a plastic deformation process very versatile in which a billet is forced to flow by compression through the die opening of a smaller cross-sectional area than that of the original billet ([12]). Long straight metal parts can be produced. Mostly hot direct extrusion is applied to produce solid and hollow profiles of light alloys ([14]). In Figure 1, an extrusion process similar to the company under study is presented.
Extrusion can be cold or hot, according to [12]. Cold extrusion is the process done at room temperature or slightly elevated temperatures. Nevertheless, hot extrusion is done at fairly higher temperatures at the melting point of the metal. The melting point depends on the alloy and the method used. Nevertheless, between the two main types of extrusion: direct and indirect, the most common for the production of aluminum profiles is direct extrusion ([20]).
The extrusion technology allows manufacturing a width variety of geometry components ([23]). In this industrial process, several parameters, such as, temperature, time, velocity, pressure and geometry, must be well adjusted for each alloy type.
Speed and temperature parameters are considered the key variables to maximize productivity. However, the acceleration time also helps to reduce the total extrusion cycle time and increase productivity ([12]). [12,19] presented different ways to reduce the cycle time of each alloy and billet size.
Furthermore, temperature is one of the most important parameters in the extrusion process ([21]). The billet temperature, for [24], is recommended to operate at 420–430 °C. Temperatures above these temperatures would cause profile defects, leading to scrap production. According to [21], the higher the die or billet temperature, the lower the load to perform the process. In addition, optimum mold and billet temperatures allow for greater efficiency of the hot extrusion process and result in better quality products.
In the study by [25], using sequential casting of two aluminum alloys, two important variables are considered to optimize the process: the order of leakage and the waiting time between alloy leaks. These are parameters related to casting temperature, die geometry and alloy compositions.
The extrusion pressure, for [26], is influenced by the geometries of the billet and of the die, and also by extrusion variables, such as, ram speed. For [12], the required pressure for extrusion could vary with the alloy and its condition, length and billet temperature, extrusion speed, the extrusion ratio, and circumscribed circle diameter.
The critical variables that influence the force required for extrusion and the quality of material, according to [12] are: Extrusion Ratio (); Working Temperature (); Speed of Deformation (); and Alloy Flow Stress (). In line to this vision [27] verified that the metal flow is influenced by several factors, such as: temperature of the billet and the container, extrusion pressure, extrusion speed, billet size and also extrusion ratio ().
For [28] die and tooling defects are one of the major sources of product defects, so detection and mitigation of product defects are very important in maintaining the productivity and profitability.
[29] investigated the influence of processing conditions on relative density and strength. Correct adjustment of extrusion parameters is necessary to obtain the appropriate and desired mechanical properties ([27,30,31,32]). Thus, with a proper flow control, better mechanical properties can be obtained by preserving the material orientation ([33]). Across reduction of friction, allowing extrusion of larger billets, enhanced speed, and an increased ability to extrude smaller cross-sections; less tendency for extrusions to crack as no heat formation takes place from friction; container liner lasts longer, due to less wear; more uniform use of billet ensures that extrusion defects and coarse grained peripherals zones are less likely.
The extrusion process makes the most of aluminum’s unique combination of physical characteristics, according with [18]. No other metal can match the sustainability advantage of aluminum or its combination of useful physical properties such as: strength, durability, flexibility, impermeability, devaluation, corrosion resistance and recyclability ([4,12,22,29]). An increasingly demanding industry promotes the dynamic between high quality and low price, without loss of product specifications, leading to new industrial challenges. Besides that, manufacturing industries are focusing on controlling the negative environmental impacts, reducing cost, conserving energy and natural resources, while producing new products through various methods and tools of sustainable manufacturing assessment ([1,7]).
Studies indicate that 60% of the earth’s land area is managed by man, however 100% of planet earth is affected by Human actions ([34]). In fact, as economies grow, they tend to use more resources. Driven by industrial and technological development and changing consumption patterns, resource extraction has increased 10 fold since 1900 and may double by 2030 ([35]). This shows that in order to achieve sustainability, there is the need of holistic optimization of the entire environment ([18]). This is a challenge that everyone shares and is responsible for solving ([35]). For Thiede, quoted by [6], the environmental issues, as well as, energy consumption and new sources of energy are increasingly seen as crucial concerns in industrial production.
2.1. Sustainability
Sustainability has become a buzzword both in today’s business world and on the broader faces of society. Environmental sustainability in manufacturing industry is a pressing and urgent issue. The main concerns relate to the efficient use of materials and energy ([1,6,7]). The notion of sustainability became known worldwide in 1987, through the Report Designated as Our Common Future (known as the Brundtland Report – [36]). The Triple Bottom Line framework is rooted in stakeholder theory, organizational management theory, and business ethics ([37]). A sustainable company is one that contributes to sustainable development by offering economic (profit), environmental (planet) and social (people) benefits.
In 1992, the “Agenda 21” document appeared as global program to which 118 countries joined and whose main objective was the promotion of environmental regeneration and social development. With a global action plan but local actions, since even small actions make a difference ([38]).
Twenty years later, at the Rio + 20 conference, a new document entitled “The Future We Want” was endorsed. Following the negative balance of the world leaders from the previous period, the document aims to reinforce the importance of meeting the predefined commitments of the established sustainability goals and strengthening financing for developing countries ([39]).
The credibility of European Aluminum Industry depends on its efforts to continuously improve its economic, environmental and social performance. The industry’s Sustainability Roadmap 2025, launched in 2015, defines a clear and structured sustainability agenda for the aluminum sector in Europe ([4]).
To measure industry progress towards its objectives in the Sustainability Roadmap 2025, European Aluminum has adapted and enriched its Sustainable Development Indicators (SDIs) already collected and reported regularly since the 1990s ([4]). These indicators includes: i) Economic indicators, such as Production, Revenues, Capital investments, Value added and R&D expenditure; ii) Environmental indicators, such as Plant certification (IOS 14 000), Electricity consumption, other types of energy consumption; and iii) Social indicators, such as Plant certification – Occupational Safety and Health Administration (OSHA), safety – Total Recordable Incident Rate (TRI), Lost Time Incident rate (LTI), and Fatality rate – and number of employees, etc.
The European Aluminum Industry, through its member organisation the European Aluminum Association (EAA), initiated a program on sustainable development for the aluminum industry in 2001. The first step involved the development of an industry SDIs suite developed in 2001 and 2002 with internal and external stakeholder groups ([40]).
[41] discuss the state of the practice, the strength, and weakness of life cycle assessments to achieve sustainability goals in the aluminum industry. Figure 2 shows the life cycle of aluminum.
The paper of [1] focuses on the technology strategies that lead to radical innovations in aluminum production systems which are important for achieving sustainability goals. [7] propose science-based guidelines for modelling and evaluating of Key Performance Indicators (KPIs) in an aluminum extrusion process.
Thereby, sustainability is not only about resources, but also about using them efficiently in order to positively improve the effectiveness of the results achieved. Due to constantly increasing green concerns and better performance, lightweight construction is a key factor for success ([33]).
Corporate sustainable development implies that companies, instead of weighing only their financial results, also seriously consider the environmental and social impacts of their products and services ([42,43]).
In a circular economy where “extracting, transforming, using and disposing” gives rise to “reducing, reusing and recycling”, only environmental challenges awareness will lead to the adoption of behaviours that will promote a low carbon society. According to [35], this is the biggest challenge, i.e.: “change mind-sets to change behaviours”.
Environmental concerns in industrial companies are increasingly imperative ([40,44]), not only because of national and international norms, but also because of companies’ image in current demanding markets. Aluminum industry is no exception. The aluminum industry alone is accountable for approximately 1% of global greenhouse gas emissions ([45]).
Aluminum is 100% recyclable and is the only material that is infinitely recyclable. Figure 3 shows the evolution of different manufacturing concepts and their contributions to stakeholder value, and the [18] proposed closed-loop system involving 6Rs.
Recyclability have spurred new process developments with the goal to obtain materials with a good relation between properties and costs ([29]). In particularly, in the case of aluminum, recycling can save a large amount greenhouse gas emissions ([45]). During the aluminum scrap melting process, irreversible lost occur. Also, about 12% of the metal is burned and 10% is lost because the aluminum mixes with the slag removed from the surface of the molten metal ([46]).
High temperature thermal treatment of turnings results in a significant increase of scrap surface oxide films. This is supported by [44] on a study on solid state recycling of aluminum scrap and dross characterization. The authors also found that energy requirement estimations for solid state recycling revealed that the pre-compaction process uses less than 7% of the energy required for the world’s best practice conventional remelting, and resulted in a 93% reduction in carbon dioxide equivalent emissions.
[6] consider that the main problem that these processes is that they have a recycling efficiency of less than 55%.
The amount of scrap generated depends on several processing conditions related to the pre-extrusion, extrusion and post-extrusion processes, as archived by [32] and as mentioned before. Although aluminum is a recyclable material, minimizing scrap production is the best way to avoid excessive costs and preserve the environment. In fact, recycling process is characterized by environmental pollution and high energy consumption, going against [6].
2.2. Methods
From the literature research, we find that there is a strong relation between the different parameters in the extrusion process and the amount of waste obtained. Thus, the problem under study is a nonlinear optimization problem, because the majority of the relations between parameters and amount of scrap is non linear.
According to [47] three numerical methods are widely used to simulate the extrusion process in the literature:
- Finite Element Method (FEM) based on the Lagrangian formulation – in which the variables of material particles depend on the coordinates and time of the particles.
- Finite Volume Method (FVM) based on the Eulerian formulation – focuses on the time variable function of particle flow velocity, acceleration and other variables.
- Arbitrary Lagrangian-Eulerian method (ALE) – which combines the FEM with the FVM and uses two different reference systems to define material flow and mesh movement.
However modeling several nonlinear relations, when the initial objective was to identify the relative importance of data collected in the real process is unnecessary. Furthermore, it is time consuming and requires sophisticate computational modelling methodologies and software tools, usually not available in small companies.
During the various steps of aluminum production, a large amount of scrap is generated due to machining operations. Scrap length due to back-end defect depends on different process parameters such as friction, the initial temperature of the billet or tool geometry ([28]).
[17] defined design rules for improvements in geometry and functionality of flat and porthole dies. The authors found that porthole dies results in greater die stability and significant scrap reduction.
Considering die geometry and extrusion speed, [48] were investigated various extrusion parameters to determine their effects on the quality of extruded products. The empirical equations show that the non-dimensionalized values of the specific coring pressures and maximum extrusion pressures, depend primarily on the die angle, the load rate and the total reduction in the cross-section area of the complex-shaped section.
Furthermore, aluminum alloy extrusion is recommended to operate at billet temperatures of 420-430°C by [24]. Operating above these temperatures would cause profile defects, resulting in scrap metal. [49] evaluated the temperature evolution in the extrusion process, by means of a computer simulation of 3D FEM he found that extrusion is limited by two factors: temperature and pressure.
[50], based on the results of simulations using 3D FEM, stated that extrusion speed has a strong effect on extrusion temperature and the latter largely determines the surface quality of the extruded profile. The authors also observed that the effects of die bearing length and extrusion speed on extrusion pressure are negligible. Thus, the extrusion yield is mainly limited by the extrudate temperature rather, not the extrusion pressure.
Compared to the classical discontinuous shear simple model of channel angular extrusion, the new approach allowed to predict effective strain more closely. The flow patterns, extrusion pressure, curvature, and effective strain predicted by the analytical solutions agreed well with the modelling results ([51]).
Besides that, new modifications and advanced design strategies of alloys and microstructures to improve material properties are considered by [15]. The elementary mechanisms of plastic deformation and re-crystallization comprising nucleation and growth and their orientation dependence, within the homogeneously formed micro-structure or due to in-homogeneous deformation, are described along with their impact on texture formation, and the resulting behaviour of formation.
During the extrusion process, it is necessary to ensure that temperature and also the extrusion time are suitable for the extrusion of the material, once both are necessary for complete solubilization ([20]).
For [28] many defects in extruded products occur because of the conditions of the dies and tooling. To achieve higher productivity and reduce rework and rejection, it is important to identify more frequent die-related problems and reduce and eliminate their occurrence.
[32] studied the possible causes of the high amounts of scrap generation in the production of the aluminum profiles during the extrusion process, by estimating multivariate linear regression models, adjusted to a set of pre-collected data of a Portuguese company in the aluminum extrusion sector. The results show that variables concerning with extrusion temperature, time, ram speed, pressure and die geometry are crucial for improving and controlling scrap production.
Optimization can be very relevant in process improvement. [50] described an optimisation based method that was used for analysing and improving the yield of aluminum extrusion operations at a local extrusion plant of a company. By this very significant savings were obtained, especially when the shape of the extrudate is complex.
Table 1 summarizes the variables found in literature, as influencing the scrap generation in aluminum extrusion processes.
2.3. Model
Traditional approaches that simulate the whole extrusion process, as presented by [47] (FEM, FVM and ALE) and brief referred in Section 2.2, despite being widely used to simulate the extrusion process in the literature, according with the same authors, are often costly and time-consuming.
In fact, if we consider the dimensions or factors in Table 1 easily we have hundreds of variables with different relationships (linear and nonlinear) and weights to the amount of waste and a very difficult nonlinear optimization problem to solve.
Table 2 presents a summary of the the designations used for factors pointed in literature (Table 1) as important for scrap generation in the aluminum extrusion process. In this table, , and are defined as:
- k is the number of temperatures measured in the process;
- p is the number of times registered in the process;
- m is the number of speeds monitored in the process;
- n is the number of measures of pressure along the process;
- r is the number of geometric values in consideration.
while
- represents the temperatures measured, for ;
- are the times registered in the process, for ;
- are speeds monitored in the process, for ;
- represents the measures of pressure along the process, for ;
- are geometric values in consideration, for .
The bounds are the lower bounds for the variables and are their upper bounds.
The amount of scrap (S), according with literature, depends on all these variables in Table 2, thus the amount of waste/scrap (S) from the aluminum extrusion process can be defined as:
i.e.,
with , and , with , represents all the variables considered. Also is the constant (the scrap amount if all variables are null) and are the weights of each variable in the model. These weights representing the importance of each one of the variables in the scrap amount.
While are functions which model the association between each variable and the amount of scrap S. Furthermore, all variables are bounded, and and are the non-negative lower and upper bounds of each variable .
Therefore, since the goal is the reduction of the amount of scrap, the optimization problem to be solved, can be formulated as:
The optimization problem defined in equation 3, may be linear, if the functions are linear functions, or nonlinear problem, otherwise. In both cases it is an optimization problem with simple bounds.
According with literature there is a strong relation between the different parameters in the extrusion process and the amount of waste obtained and most of the relations between them are non linear. Thus the problem under study is a nonlinear optimization problem.
There are several optimization algorithms to solve this kind of problems, depending on the functions defining the modelling problem considered, i.e.: linear, nonlinear, with a global optimum or with several local optimums, with different sizes, depending on the number of variables considered.
Nonlinear Programming Problems, as the problem addressed in this work, are usually solved using simulation tools, for the entire extrusion process. Nevertheless, there are many companies, namely small companies, that do not have trained employees, nor time, neither money for this type of modeling, which is usually very specialized and time consuming. Also the cost of the sophisticate computational modelling methodologies and simulation tools is high and usually not available in companies.
However modeling several nonlinear relations, when the initial objective was to identify the relative importance of data collected in the real process is unnecessary.
In this way the model was simplified for a linear optimization model with simple bounds, and Using statistical techniques, in particular multiple linear regressions models and the open source software R, in order to study the significance and relative relevance of the variables available in the data for the waste generation.
The simplification of the problem, for their linear form, has limitations, is not the perfect model, but answers the main goal of the company: identifying more influential variables for amount of scrap production; so the model is an useful model.
If it is assumed that all the functions , , are linear functions. i.e. if it is considered the existence of a linear relation between the variables and the waste generation ( are linear functions), is a linear model. This model has the amount of scrap as dependent variable and the variables concerned to factors for scrap production (temperature, time, speed, pressure and geometry) as independent, i.e, we can consider a multiple regression model.
In the next section, this will be considered. Therefore minimizing S will be possible and easy since the maximum and minimum values (the bounds) of the variables are known. Thus, for obtaining minimum scrap, modeled by a multiple linear regression model, it is only necessary to minimize the variables with positive effect on S and maximize the value of the variables with opposite effect.
3. Empirical Study
[32] used the data on continuous aluminum production of the various profiles for the six months of production which were provided by the company. The stepwise method was used to estimate the linear scrap model, considering the extrusion variables. This method considered all significant variables for a significance level of 5%. This model has an adjusted R square of approximately 46%, therefore this is the expected percentage of total variability in scrap production explained by the independent variables included in the linear regression model.
For the accomplishment of the present empirical study, it was used the same database used in the previous work ([32]), however, all phases of the aluminum extrusion process are now addressed (i.e. pre-extrusion, extrusion and post-extrusion).
Data for comparative analysis was standardized. The database includes 42 821 observations, corresponding each observation to an extruded billet. The database contains 65 variables, of which 62 are quantitative (some discrete and other continuous) and three qualitative (nominal). Depending on the phase of the process, the variables considered in this study can be divided into three categories/phases: Pre-extrusion (), Extrusion (E) and Post-extrusion () (see Table 3).
Similar to [32], the variables , Weight Billet (kg), and , Bars Weight (kg), are used to define the variable , the scrap (kg), i.e:
Optimizing the overall extrusion process, as well as predicting the behaviour of aluminum at all stages (before, during and after extrusion), allows to anticipate some key variable control issues and consequently improve the extrusion process, being possible to make decisions adjusted to the reality of the company.
The aim is to determine the most appropriate extrusion variables values in order to minimize scrap production, and consequently avoid excessive costs and promote environmental sustainability. If a linear model to approximate S is considered, Problem (3) is classified as simple bounds linear minimization problem.
From the large database on the company’s six-month production, it was possible to extract the limits for the variables which are presented in Table 4.
However, if any of the the functions involved in Problem (3) is not a linear function, this is a nonlinear problem and thus other methods, appropriate to the type of problem, are required.
To estimate the model of S using the stepwise method, the software R was used. The results showed that, for a 5% significance level, all variables are significant. The obtained model has an adjusted R square of approximately 53%. Therefore, 53% of total variability in scrap production is explained by the independent variables included in the linear regression model.
The model can be written as:
The analysis of the coefficients of the model (5), which are depicted in Table 5, allowed to conclude that all variables are significant to explain the scrap production of each billet. However, although all variables are significant, some are more important to the model than others.
The analysis of the standard regression coefficients shows that variables : Number of Holes, : Extrusion Speed (mm/s), : Specific Weight, : Sealing Pressure (bar), : Puller Speed (m/min), : Dead Time (s), : DX Puller Traction and : Post Container Temp (°C), are those that have the greatest relative contribution to explain the dependent variable.
In fact, the variables with positive coefficients, and therefore the ones that most influence scrap production, are , , and . The results indicate lower scrap production in the process to lower values.
On the other hand, the variables , , and are those that negatively influence scrap production, because the higher values show lower scrap production.
The model expressed in equation 5 is in agreement with the results previously found by the authors presented in Table 1, since the variables that tend to contribute more to the scrap production during the aluminum extrusion process are the same.
The linear regression approach also assumes that the residuals are independent and identical distributed, with a zero mean, normal distribution and constant variance. These assumptions are generally verified.
For large samples, the Kolmorogov-Smirnov (K-S) or Shapiro-Wilk (SW) normality tests implies the rejection of the normal distribution. In this case, the sample size is large, so therefore, the central limit theorem can be used ([52]). The large the sample, the closer to a normal distribution the distribution of the means will be. Consequently the residuals of the model can be considered approximately normally distributed.
For the assumption of the independence of residuals, the Durbin-Watson (DW) Statistics can be considered. Since this test yield the value 0.91 (approximate to 1), it is expectable that the residuals are correlated. This is a limitation of the model and it can be explained by the existence of a sequence of billets being extruded in the process, which are easily welded together at the extrusion temperature and pressure ([49]).
The values of tolerance are closer to 0 and Variance Inflation Factor (VIF) are smaller than 15, for each independent variable (see Table 5), therefore that there is statistical evidence to support the inexistence of multicollinearity.
In this way, it is possible to obtain an optimal linear model. Using the descriptive analysis of the variables Table 4 and by identifying the maximum and minimum values of each variable, the amount of scrap generated is minimized. The maximum value of the variables with positive coefficients and the minimum value of the variables with negative coefficients should considered, so that aluminum production achieves the lowest scrap production, which in turns will avoid aluminum recycling.
For further analysis, recognizing the company’s interest in sustainable production, the data was standardized and linear regressions were used to model the nine most frequent profiles observed in in total production dataset and also for the nine profiles with an average of more than 20 kg of scrap and frequencies exceeding 100 (see Table 6 and Table 7).
These linear regressions indicate that, as expected, the most frequently produced profiles lead to the lowest amount of billet-generated scrap and the less frequently produced profiles have more billet-generated scrap. This is an indicator of the stability throughout the production process.
The results presented in Table 6 and in Table 7 show the scrap quantity models (: Scrap (kg), dependent variable) of the 18 selected profiles (9 most frequent profiles and 9 profiles with more than 20 kg of scrap). From these tables results, the die and the number of holes in the die (Number of Holes: ) are similar, i.e., these are variables without relevant variability. However, it is well known from literature that die geometry, as well as the components used, are causes of the amount of scrap generated in a profile ([13,17,23,28]). [23] concluded that geometry is a parameter that should be well adjusted for each alloy type. [28] points out that die geometry is the main cause of defects in profiles. In this sense, the work developed by [17] presents rules for the development of matrices, considering matrices design extremely important in the production of the quality profile. The work developed by [13] considers that defects in dies and tools are the main source of profile defects and, consequently, scrap generation. The company has developed several quality control systems ([53,54]). In this area in particular, three-dimensional analysis of aluminum profiles.
The coefficients of the linear models, presented in Table 6 and in Table 7, are able to identify the variables that most contribute to scrap production. The missing coefficients correspond to non-significant variables for the model.
The analysis of the most frequently produced profiles, whose results are presented in Table 6, linear models were obtained for which the geometric variables present significant coefficients, regardless of the matrices. These results reinforce the effect of geometric factors on the amount of scrap generated. It may be concluded that in addition to the die geometry and tools mentioned ([13,17,23,28]), there are other geometric factors that can contribute significantly to scrap production.
In particular, it can be seen that Length Bars () negatively contribute to scrap production, for all most frequent dies. Therefore whenever this length is reduced, scrap production increases. Similar behavior can be observed for the Number of Bars () and the Number of Billets (). The opposite behavior is observed for the Billet Length variable (). Billet Length contributes for scrap positively, meaning that its increase implies an increase in scrap amount.
In some profiles, the geometric variables Butt Length () and Specific Weight (), contribute positively to the increase in scrap (since which has a corresponding positive coefficient), while in others have the opposite contribution.
The lack of studies in literature on billet length do not allow a critical analysis. However, further analysis is required. This unexpected result may come from alloy type ([23]) or from previous billet size calculations due to customer specifications.
Regarding temperature, for the four variables considered: Post Container Temp (°C) (), Max End Temperature (°C) (), Set Temperature Z1 () and Billet Conical Temperature (), almost no effect on scrap production was observed. Similar behavior was obtained for the variables time, speed and pressure. Despite these results, it cannot be concluded that temperature, speed and pressure do not influence the amount of scrap generated. Although data show no evidence that these parameters influenced scrap production for the studied profiles. These effects are well documented in literature, as presented in Table 1. In general, increasing temperature and pressure increases the amount of scrap, while time and speed are directly related to previous variables. On the other hand, all dependent variables depend on the alloy type used to produce a specific profile ([23]). The company’s empirical knowledge of the influence of temperature, pressure, time and speed on the amount of scrap generated by the experience led to the company’s growing concern and greater employee control over these parameters during the production process.
In the Table 7, are presented models for profiles with the largest amount of scrap generated in the company. For each significant linear models were obtained. The geometric variables Butt Length () and Specific Weight () again show a significant contribution to the scrap, which reinforce the results presented in Table 6. For example, the Length Bars ()) contribute negatively to scrap production. Generically, similar behavior can be observed for Specific Weight () and Number of Bars (). As mentioned in the previous analysis, the variables related to the geometric factors have significant coefficients for all matrices, which means a great influence on scrap production.
Regarding the other variables, it is also verified that the main variables associated with the extrusion process do not influence the amount of scrap generated, during the extrusion process for the analyzed profiles, namely extrusion time, velocity and pressure.
In summary, according to this study, to improve production by minimizing scrap production in the company, better control of geometry variables is necessary. However, these variables are not easy to control because they are very dependent on customer orders. Perhaps the company can exercise greater control in the production, inspection and correction of the matrices.
Thus, the identified gaps can serve as an important basis for improving the company’s aluminum extrusion process, as the geometric factors identified have been little explored in literature.
4. Conclusions
The literature review performed in this work allowed to gather some consensus opinions on the role of sustainability in the manufacturing industry ([1,7]). However, corporate social responsibility practices with view the sustainability are still voluntary initiative of individual companies in this industry, and also in the other sectors in Portugal. [55] identified several benefits of eco-innovation: operational advantages resulting from the most effective use of resources, improvement of the company’s image, improvement of relations with stakeholders and of the general capacity for innovation. Nonetheless, many companies are still more interested in easy profit than in environmental sustainability and innovative activities with ecological benefits.
Because of that is so important to study Corporate social responsibility and sustainable development of economy, in particular starting with good practices from companies that already take these concerns into account monitoring and management their processes based on data collected by them.
Considering the real data from a Portuguese company in the aluminum extrusion sector, the results show the strong relationship of dependence between the different extrusion variables and the scrap creation. The variables concerning with extrusion temperature, time, speed, pressure and die geometry are crucial to improve and control the waste. It is concluded, after analyzing the linear regression models, that the most prominent factors for waste in this company are the geometric ones.
However, the results may vary from company to company depending on their size and the amount of profiles produced and sold, and also on the knowledge of the process and variables control capacity.
The indicators obtained in this analysis allow the evaluation of the main variables that contribute to the creation of large quantities of scrap. According to this study, to improve the company’s production, i.e. minimizing scrap, it is necessary to control all independent variables. The analysis of the coefficients of the developed model, allow to conclude that, all variables, except , are significant to explain scrap production in the extrusion process of each billet. In the initial model the variables , , and present a positive influence in scrap production, meaning that these decrease implies a smaller production of scrap. In opposite, the increase of the variables , , and implies the reduction of the amount of scrap generated. This systematization of evidence helps the company under study to produce more quantities of profiles with less waste, protecting the environment through minimizing the environmental impacts of its activity.
Achieving sustainable competitive advantages depends on the strategic planning formulated and implemented by the company. In this particular case, this plan in production is evident, because the extrusion variables, point in literature as crucial, in our model were not found to be the most important. To the extent that the results indicate that extrusion variables appear to be well controlled by the company throughout the process.
Thus, according with our study to improve production, minimizing the scrap production in the company, a better control of the geometry variables is necessary, when possible, because these are differentiating, when we considered the scrap production effect. However, these variables are not easy to control, because are very dependent of the clients orders. Perhaps the company can exert greater control in the production, and on inspection and correction of the dies. That way, the identified gaps serve as an important basis for improving the company’s aluminum extrusion process. Geometric factors, often associated with dies and repair operations, which generate unwanted product defects have not been reported in detail in the published literature.
It is desirable that this company, as well as all companies in the industrial sector, aim to be competitive, modern but simultaneously responsible and guaranteeing the future of future generations, reducing the need for primary material inputs. A sign of this is that many companies are embracing the environmental challenge by implementing incremental changes in their production systems ([1]). There are many technological parameters that influence it ([21]), technology and innovation are important factors in achieving sustainability goals ([1]).
One possible future work is to study the use of some nonlinear functions for modeling some relationships between variables. Another hypothesis is to study in deep the geometry of the matrices, since, from the analysis of the models, the most important factors are the geometrical ones.
This work has the limitation of considering a very simplified modeling of the real problem, but several innovative points stand out.
The modeling considered is simple, but easy to be adapted to any similar process or company, or even from other sectors. It is easy to replicate the methodology with data from other companies, since the main factors associated with the generation of scrap in the extrusion process were considered. The application of the suggested methodology does not increase company costs, since an open source tool can be used easily, similarly to what was done in this work, even contributing to the reduction of costs with raw materials, energy and time.
Thus, this work is also an incentive to concern with the sustainability and social responsibility of companies, since it allowed the optimization of the production process, identifying the variables that need to improve their performance, and leading to greater profit, but also better image and environmental reputation of the company.
Funding
This work has been supported by national funds through FCT - Fundação para a Ciência e Tecnologia through project UIDB/04728/2020.
Conflicts of Interest
The authors declare no conflicts of interest.
References
- Moors, E.H. Technology strategies for sustainable metals production systems: a case study of primary aluminium production in The Netherlands and Norway. Journal of Cleaner Production 2006, 14, 1121–1138. [Google Scholar] [CrossRef]
- Schmidheiny, S.; Timberlake, L. Changing course: A global business perspective on development and the environment; Vol. 1, MIT press, 1992.
- Wang, H.; Yang, J. Total-factor industrial eco-efficiency and its influencing factors in China: A spatial panel data approach. Journal of Cleaner Production 2019, 227, 263–271. [Google Scholar] [CrossRef]
- EAA. Sustainable Development Indicators 2015, Full data set. Technical report, European Aluminium Association, Brussels, Belgium, 2017.
- Groche, P.; Wohletz, S.; Brenneis, M.; Pabst, C.; Resch, F. Joining by forming – a review on joint mechanisms, applications and future trends. Journal of Materials Processing Technology 2014, 214, 1972–1994. [Google Scholar] [CrossRef]
- Ingarao, G.; Di Lorenzo, R.; Micari, F. Sustainability issues in sheet metal forming processes: an overview. Journal of Cleaner Production 2011, 19, 337–347. [Google Scholar] [CrossRef]
- Singh, K.; Sultan, I.A. Modelling and Evaluation of KPIs for the Assessment of Sustainable Manufacturing: An Extrusion process case study. Materials Today: Proceedings 2018, 5, 3825–3834. [Google Scholar] [CrossRef]
- Maceno, M.M.C.; Pawlowsky, U.; Machado, K.S.; Seleme, R. Environmental performance evaluation–a proposed analytical tool for an industrial process application. Journal of cleaner production 2018, 172, 1452–1464. [Google Scholar] [CrossRef]
- Baffari, D.; Reynolds, A.P.; Masnata, A.; Fratini, L.; Ingarao, G. Friction stir extrusion to recycle aluminum alloys scraps: Energy efficiency characterization. Journal of Manufacturing Processes 2019, 43, 63–69. [Google Scholar] [CrossRef]
- Ingarao, G.; Priarone, P.C.; Gagliardi, F.; Di Lorenzo, R.; Settineri, L. Subtractive versus mass conserving metal shaping technologies: an environmental impact comparison. Journal of Cleaner Production 2015, 87, 862–873. [Google Scholar] [CrossRef]
- López-Robles, J.R.; Otegi-Olaso, J.R.; Gómez, I.P.; Cobo, M.J. 30 years of intelligence models in management and business: A bibliometric review. International Journal of Information Management 2019, 48, 22–38. [Google Scholar] [CrossRef]
- Saha, P.K. Aluminum extrusion technology; Asm International, 2000.
- Qamar, S.Z.; Pervez, T.; Chekotu, J.C. Die defects and die corrections in metal extrusion. Metals 2018, 8, 380. [Google Scholar] [CrossRef]
- Golovko, O.; Bieliaiev, S.; Nürnberger, F.; Danchenko, V. Extrusion of the bimetallic aluminum-magnesium rods and tubes. Forschung im Ingenieurwesen 2015, 79, 17–27. [Google Scholar] [CrossRef]
- Hirsch, J.; Al-Samman, T. Superior light metals by texture engineering: Optimized aluminum and magnesium alloys for automotive applications. Acta Materialia 2013, 61, 818–843. [Google Scholar] [CrossRef]
- Shahri, M.M.; Sandström, R. Influence of fabrication stresses on fatigue life of friction stir welded aluminium profiles. Journal of Materials Processing Technology 2012, 212, 1488–1494. [Google Scholar] [CrossRef]
- Vaneker, T.H.; van Ouwerkerk, G.; Nilsen, K.; Koenis, P.; van Houten, F. Integrated bottom up and top down approach to optimization of the extrusion process. CIRP annals 2008, 57, 183–186. [Google Scholar] [CrossRef]
- Ab Rahim, S.; Lajis, M.; Ariffin, S. A review on recycling aluminum chips by hot extrusion process. Procedia CIRP 2015, 26, 761–766. [Google Scholar] [CrossRef]
- Paraskevas, D.; Kellens, K.; Dewulf, W.; Duflou, J.R. Environmental modelling of aluminium recycling: a Life Cycle Assessment tool for sustainable metal management. Journal of Cleaner Production 2015, 105, 357–370. [Google Scholar] [CrossRef]
- Soares, M.R. Effects of aging cycles on the behavior of aluminum alloys. Master’s thesis, Universidade de Aveiro, 2009.
- Marín, M.; Camacho, A.; Pérez, J. Influence of the temperature on AA6061 aluminum alloy in a hot extrusion process. Procedia Manufacturing 2017, 13, 327–334. [Google Scholar] [CrossRef]
- APAL. Portuguese Aluminium Association – APAL.
- Arif, A.; Sheikh, A.; Qamar, S.; Raza, M.; Al-Fuhaid, K. Product defects in aluminum extrusion and its impact on operational cost. In Proceedings of the The 6th Saudi Engineering Conference, KFUPM, Dhahran, Saudi Arabia, 2002, Vol. 5, pp. 14–17.
- Laue, K.; Stenger, H. Extrusion: processes, machinery, tooling. American Society for Metals 1981, p. 457.
- Lombardo, S.; Peter, I.; Rosso, M. Gravity casting of variable composition Al alloys: Innovation and new potentialities. Materials Today: Proceedings 2019, 10, 271–276. [Google Scholar] [CrossRef]
- Ikumapayi, O.M.; Oyinbo, S.T.; Bodunde, O.P.; Afolalu, S.A.; Okokpujie, I.P.; Akinlabi, E.T. The effects of lubricants on temperature distribution of 6063 aluminium alloy during backward cup extrusion process. Journal of Materials Research and Technology 2019, 8, 1175–1187. [Google Scholar] [CrossRef]
- Bajimaya, S.M.; Park, S.; Wang, G.N. Predicting extrusion process parameters using neural networks. International Journal of Mechanical Systems Science and Engineering 2007, 1. [Google Scholar]
- Hatzenbichler, T.; Buchmayr, B.; Umgeher, A. A numerical sensitivity study to determine the main influence parameters on the back-end defect. Journal of Materials Processing Technology 2007, 182, 73–78. [Google Scholar] [CrossRef]
- Surace, R.; De Filippis, L.; Ludovico, A.; Boghetich, G. Influence of processing parameters on aluminium foam produced by space holder technique. Materials & Design 2009, 30, 1878–1885. [Google Scholar]
- Carvalho, N.M.A. Scrap Optimization in an aluminium extrusion industry. Master’s thesis, Instituto Politécnico do Porto. Escola Superior de Tecnologia e Gestão, 2017.
- De Almeida, M.; Correia, A.; Carvalho, N. Scrap Optimization in an Aluminium Extrusion Industry. In Proceedings of the CMMSE 2017: Proceedings of the 17th International Conference on Mathematical Methods in Science and Engineering, 2017, Vol. VI, pp. 2082–2090.
- Ferrás, A.; De Almeida, F.; e Silva, E.C.; Correia, A.; Silva, F. Scrap production of extruded aluminum alloys by direct extrusion. Procedia Manufacturing 2019, 38, 1731–1740. [Google Scholar] [CrossRef]
- Kleiner, M.; Geiger, M.; Klaus, A. Manufacturing of lightweight components by metal forming. Magnesium 2003, 530, 26–66. [Google Scholar] [CrossRef]
- Russ, T.H. Site planning and design handbook; McGraw-Hill, 2009.
- Guerra, M.D.; Ribeiro, R.; Rodrigues, S. State of Environment Report 2019. Technical report, Portuguese Environment Agency, 2019.
- Brundtland, G.H.; Comum, N.F. Relatório Brundtland. Our Common Future: United Nations 1987.
- Hart, S.L.; Milstein, M.B. Creating sustainable value. Academy of Management Perspectives 2003, 17, 56–67. [Google Scholar] [CrossRef]
- Silva, A.A. Sustainability in urban rehabilitation. Master’s thesis, Instituto Politécnico do Porto. ISEP – Instituto Superior de Engenharia do Porto, 2013.
- Midões, E.N.G.F. Sustainability and the Life Cycle of Buildings. Master’s thesis, Instituto Politécnico do Porto. ISEP – Instituto Superior de Engenharia do Porto, 2012.
- Nordheim, E.; Barrasso, G. Sustainable development indicators of the European aluminium industry. Journal of Cleaner Production 2007, 15, 275–279. [Google Scholar] [CrossRef]
- Liu, G.; Müller, D.B. Addressing sustainability in the aluminum industry: a critical review of life cycle assessments. Journal of Cleaner Production 2012, 35, 108–117. [Google Scholar] [CrossRef]
- Elkington, J. Towards the sustainable corporation: Win-win-win business strategies for sustainable development. California Management Review 1994, 36, 90–100. [Google Scholar] [CrossRef]
- Robinson, J. Navigating social and institutional barriers to markets: How social entrepreneurs identify and evaluate opportunities. In Social Entrepreneurship; Springer, 2006; pp. 95–120. [Google Scholar]
- Cui, J. Solid state recycling of aluminium scrap and dross characterization. PhD thesis, Norwegian University of Science and Technology, 2011.
- Yusuf, N.K.; Lajis, M.A.; Ahmad, A. Multiresponse Optimization and Environmental Analysis in Direct Recycling Hot Press Forging of Aluminum AA6061. Materials 2019, 12, 1918. [Google Scholar] [CrossRef]
- Samuel, M. A new technique for recycling aluminium scrap. Journal of Materials Processing Technology 2003, 135, 117–124. [Google Scholar] [CrossRef]
- Jian-Yi, P.; Zhao-Yao, Z.; Yao, W.; Liang, L.; Ke-Jing, H. Numerical simulation applications of aluminum extrusion engineering based on rigid-plastic finite element method. In Proceedings of the 2010 International Conference on Mechanic Automation and Control Engineering. IEEE, 2010, pp. 334–338. [CrossRef]
- Onuh, S.; Ekoja, M.; Adeyemi, M. Effects of die geometry and extrusion speed on the cold extrusion of aluminium and lead alloys. Journal of materials processing technology 2003, 132, 274–285. [Google Scholar] [CrossRef]
- Li, L.x.; Zhou, J.; Duszczyk, J. Prediction of temperature evolution during the extrusion of 7075 aluminium alloy at various ram speeds by means of 3D FEM simulation. Journal of Materials Processing Technology 2004, 145, 360–370. [Google Scholar] [CrossRef]
- Fang, G.; Zhou, J.; Duszczyk, J. Extrusion of 7075 aluminium alloy through double-pocket dies to manufacture a complex profile. Journal of Materials Processing Technology 2009, 209, 3050–3059. [Google Scholar] [CrossRef]
- Zhou, W.; Shi, Z.; Lin, J. Upper bound analysis of differential velocity sideways extrusion process for curved profiles using a fan-shaped flow line model. International Journal of Lightweight Materials and Manufacture 2018, 1, 21–32. [Google Scholar] [CrossRef]
- Derriennic, Y.; Lin, M. The central limit theorem for Markov chains started at a point. Probability Theory and Related Fields 2003, 125, 73–76. [Google Scholar] [CrossRef]
- Carvalho, N.; Correia, A.; De Almeida, F. The Evaluation of Defects in the Aluminium Extrusion Process Through Quality Tools.
- De Almeida, M.; Correia, A.; Carvalho, N. Control of Nonconformities Using Quality Tools in an Aluminum Extrusion Industry. International Journal of Geology 2018, 12, 6–12. [Google Scholar]
- Sarkar, A. Promoting eco-innovations to leverage sustainable development of eco-industry and green growth. European Journal of Sustainable Development 2013, 2, 171–171. [Google Scholar]
Figure 1.
The extrusion process (Source: [22]).
Figure 1.
The extrusion process (Source: [22]).
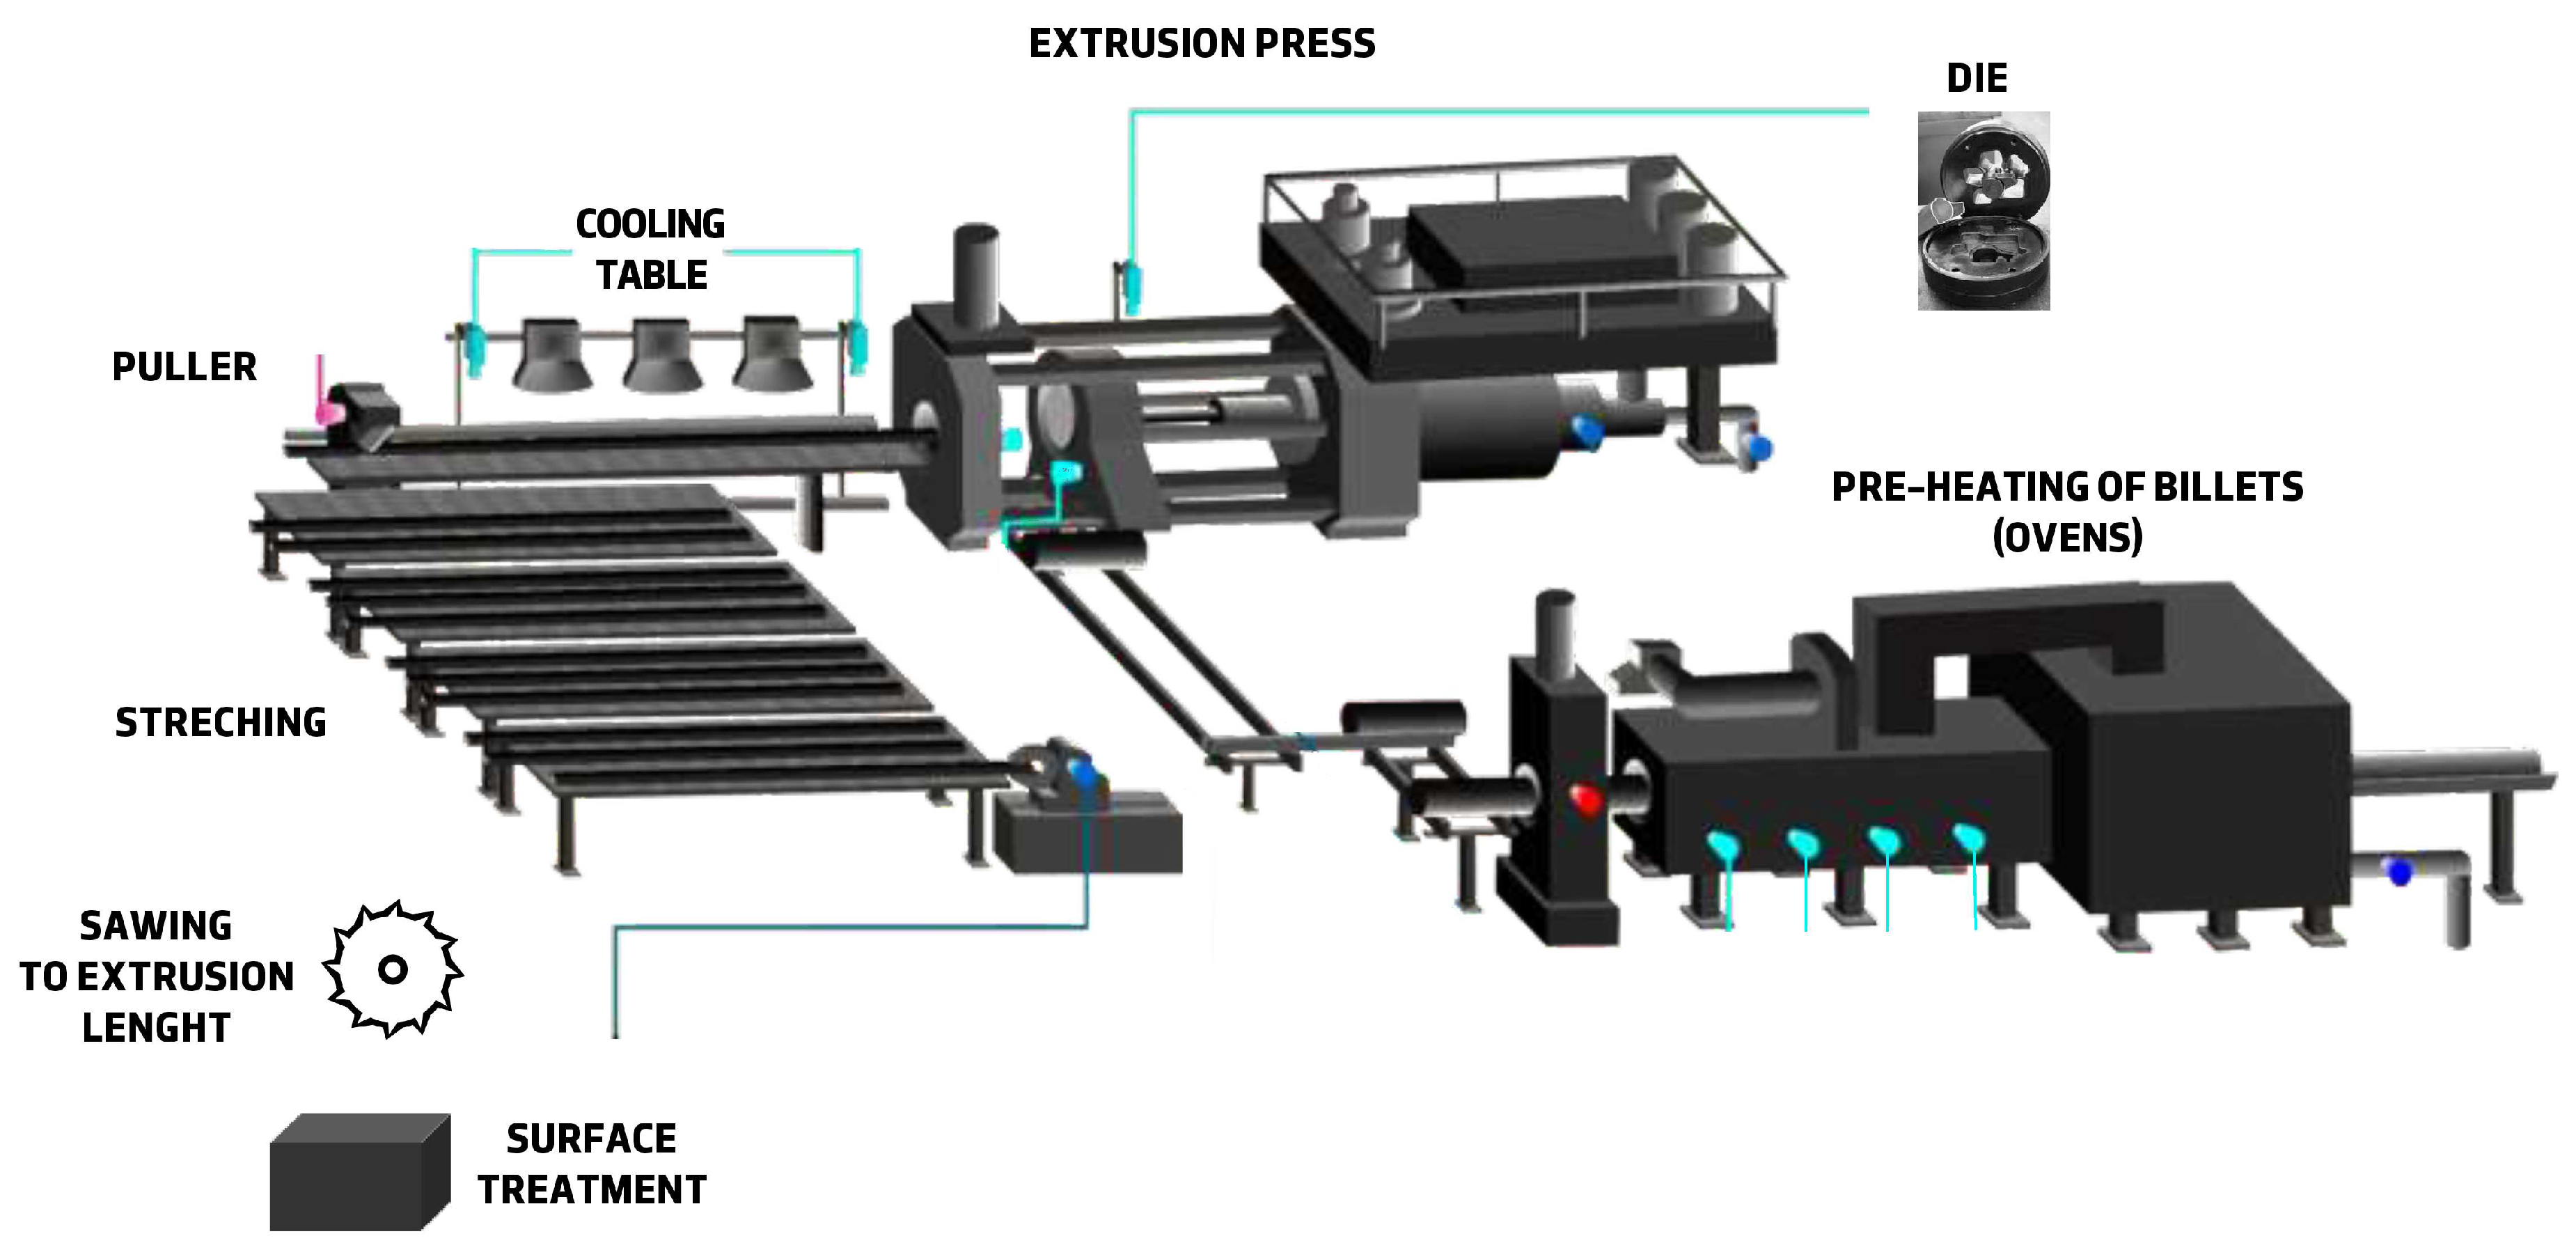
Figure 2.
Aluminum Life Cycle (Source: [22]).
Figure 2.
Aluminum Life Cycle (Source: [22]).
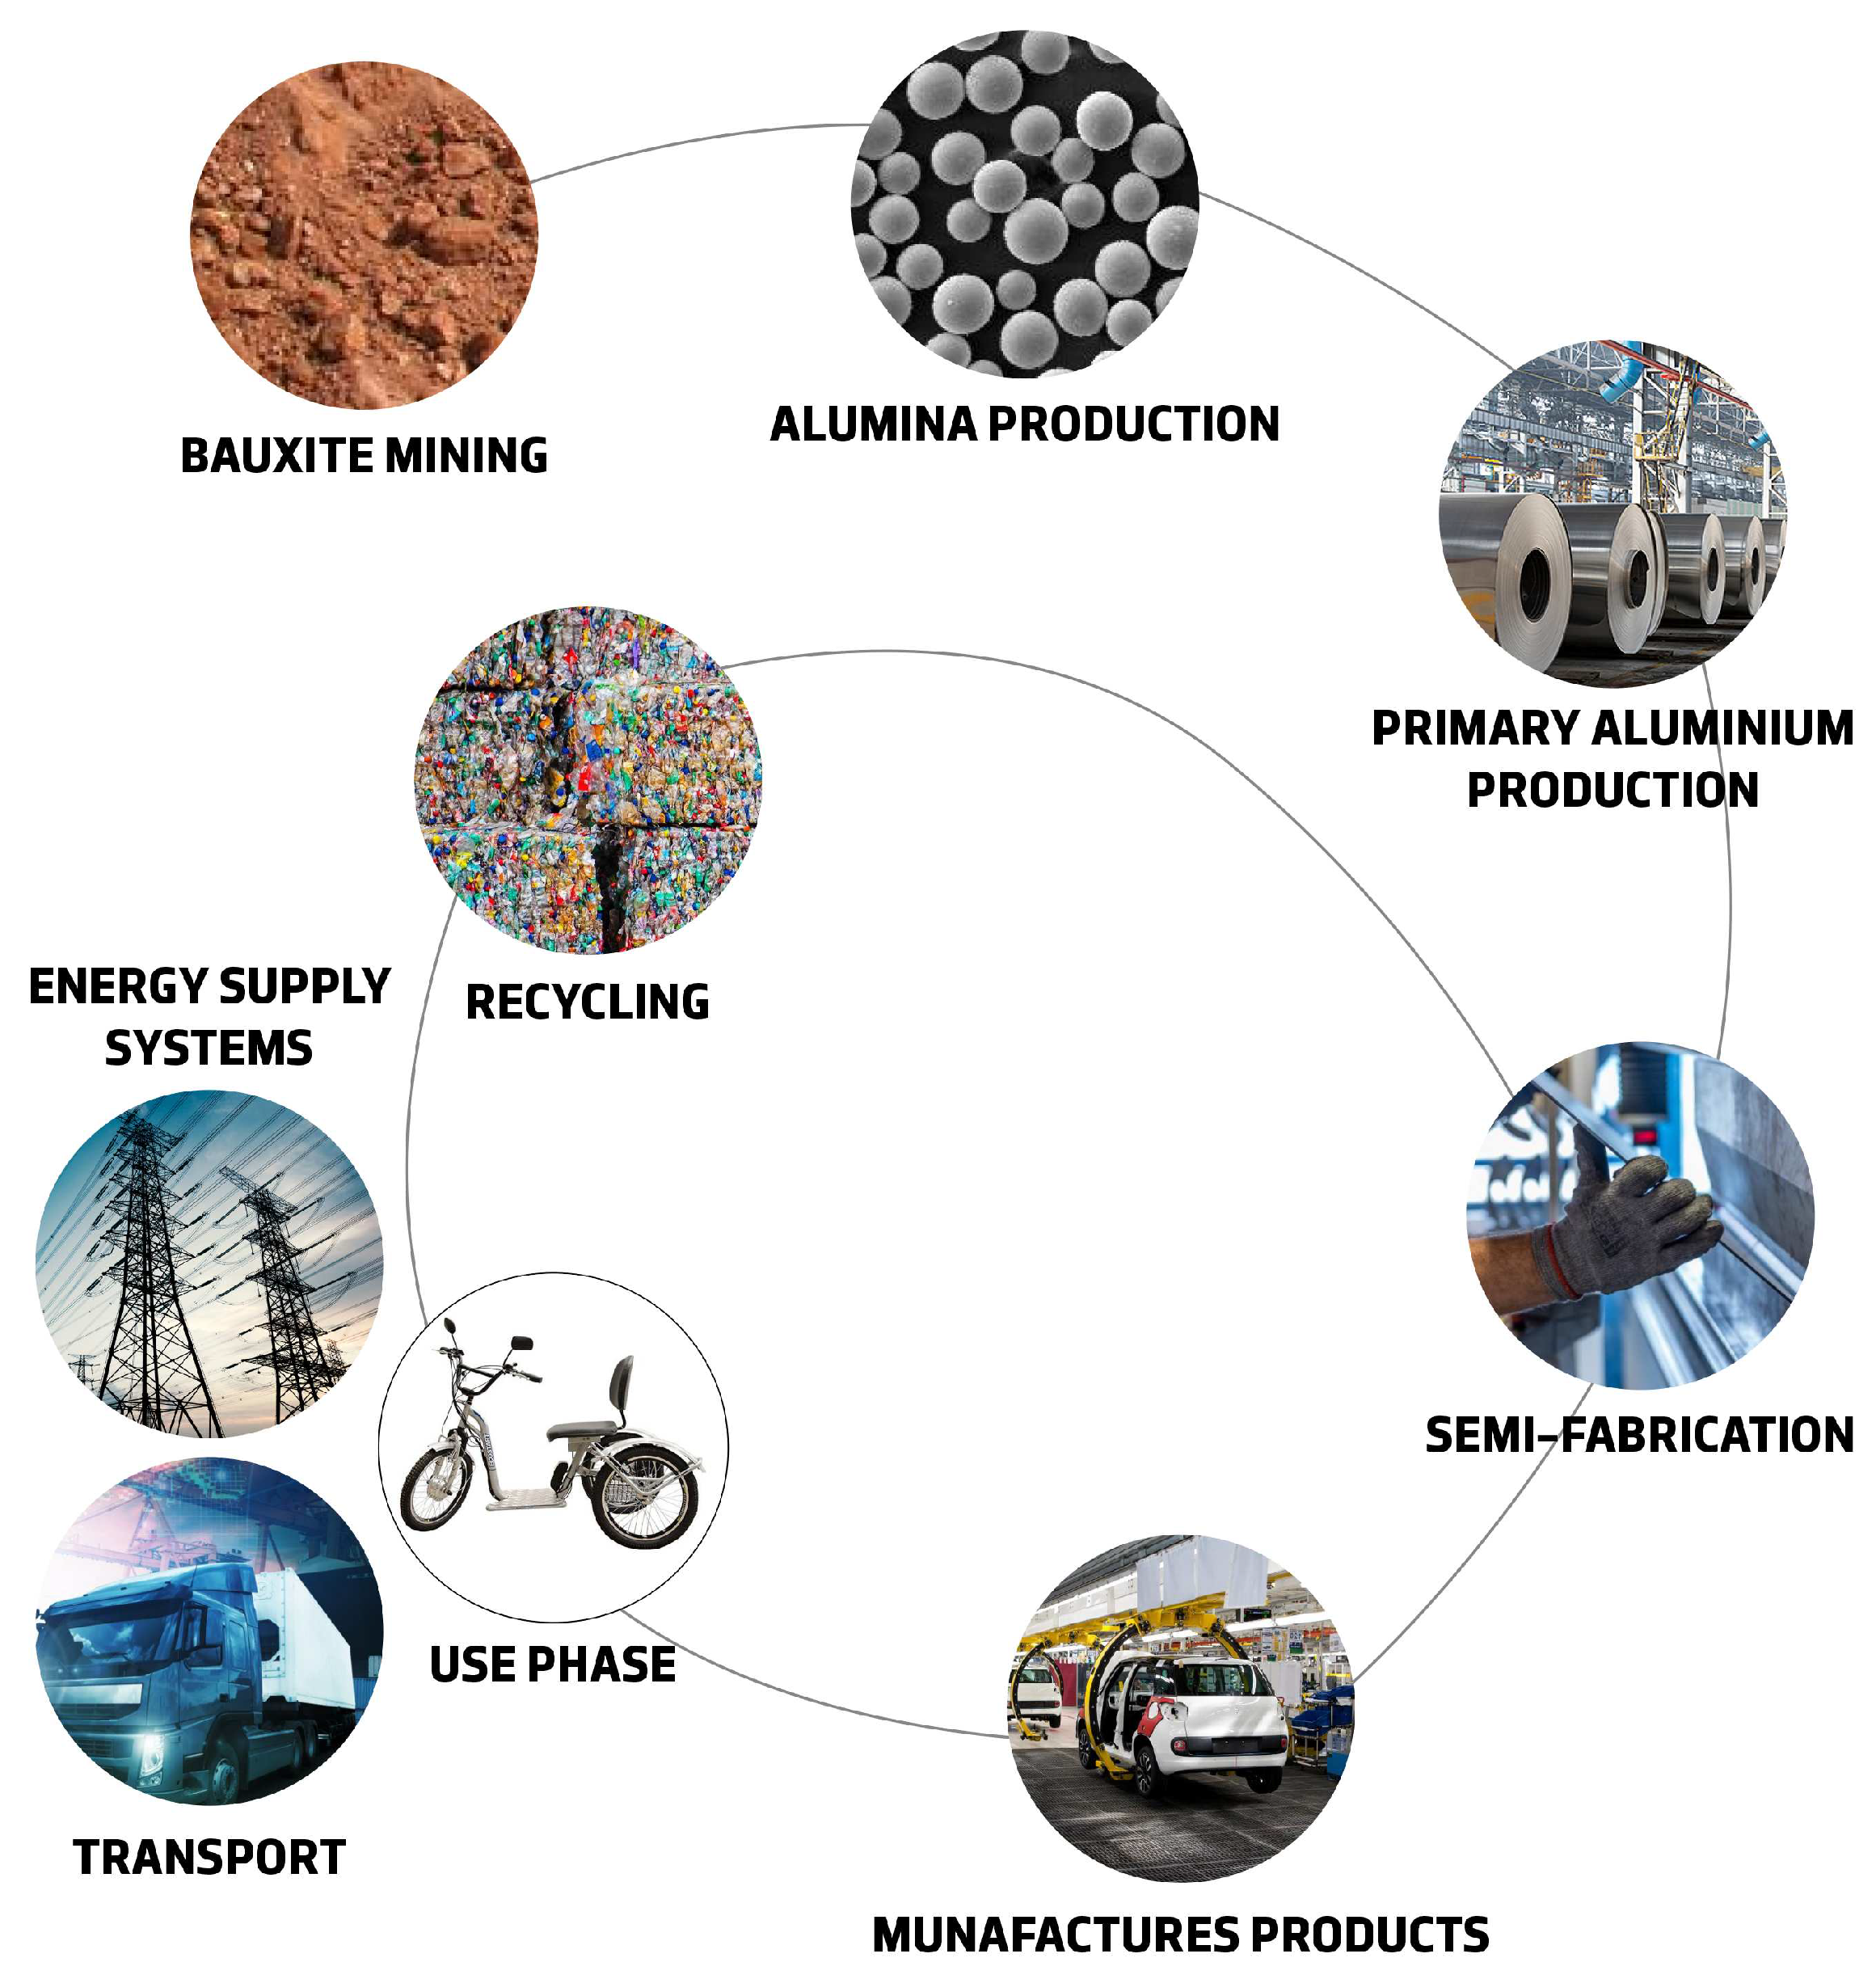
Figure 3.
Closed-loop Product Life-cycle System in 6R Approach (Source: [18]).
Figure 3.
Closed-loop Product Life-cycle System in 6R Approach (Source: [18]).
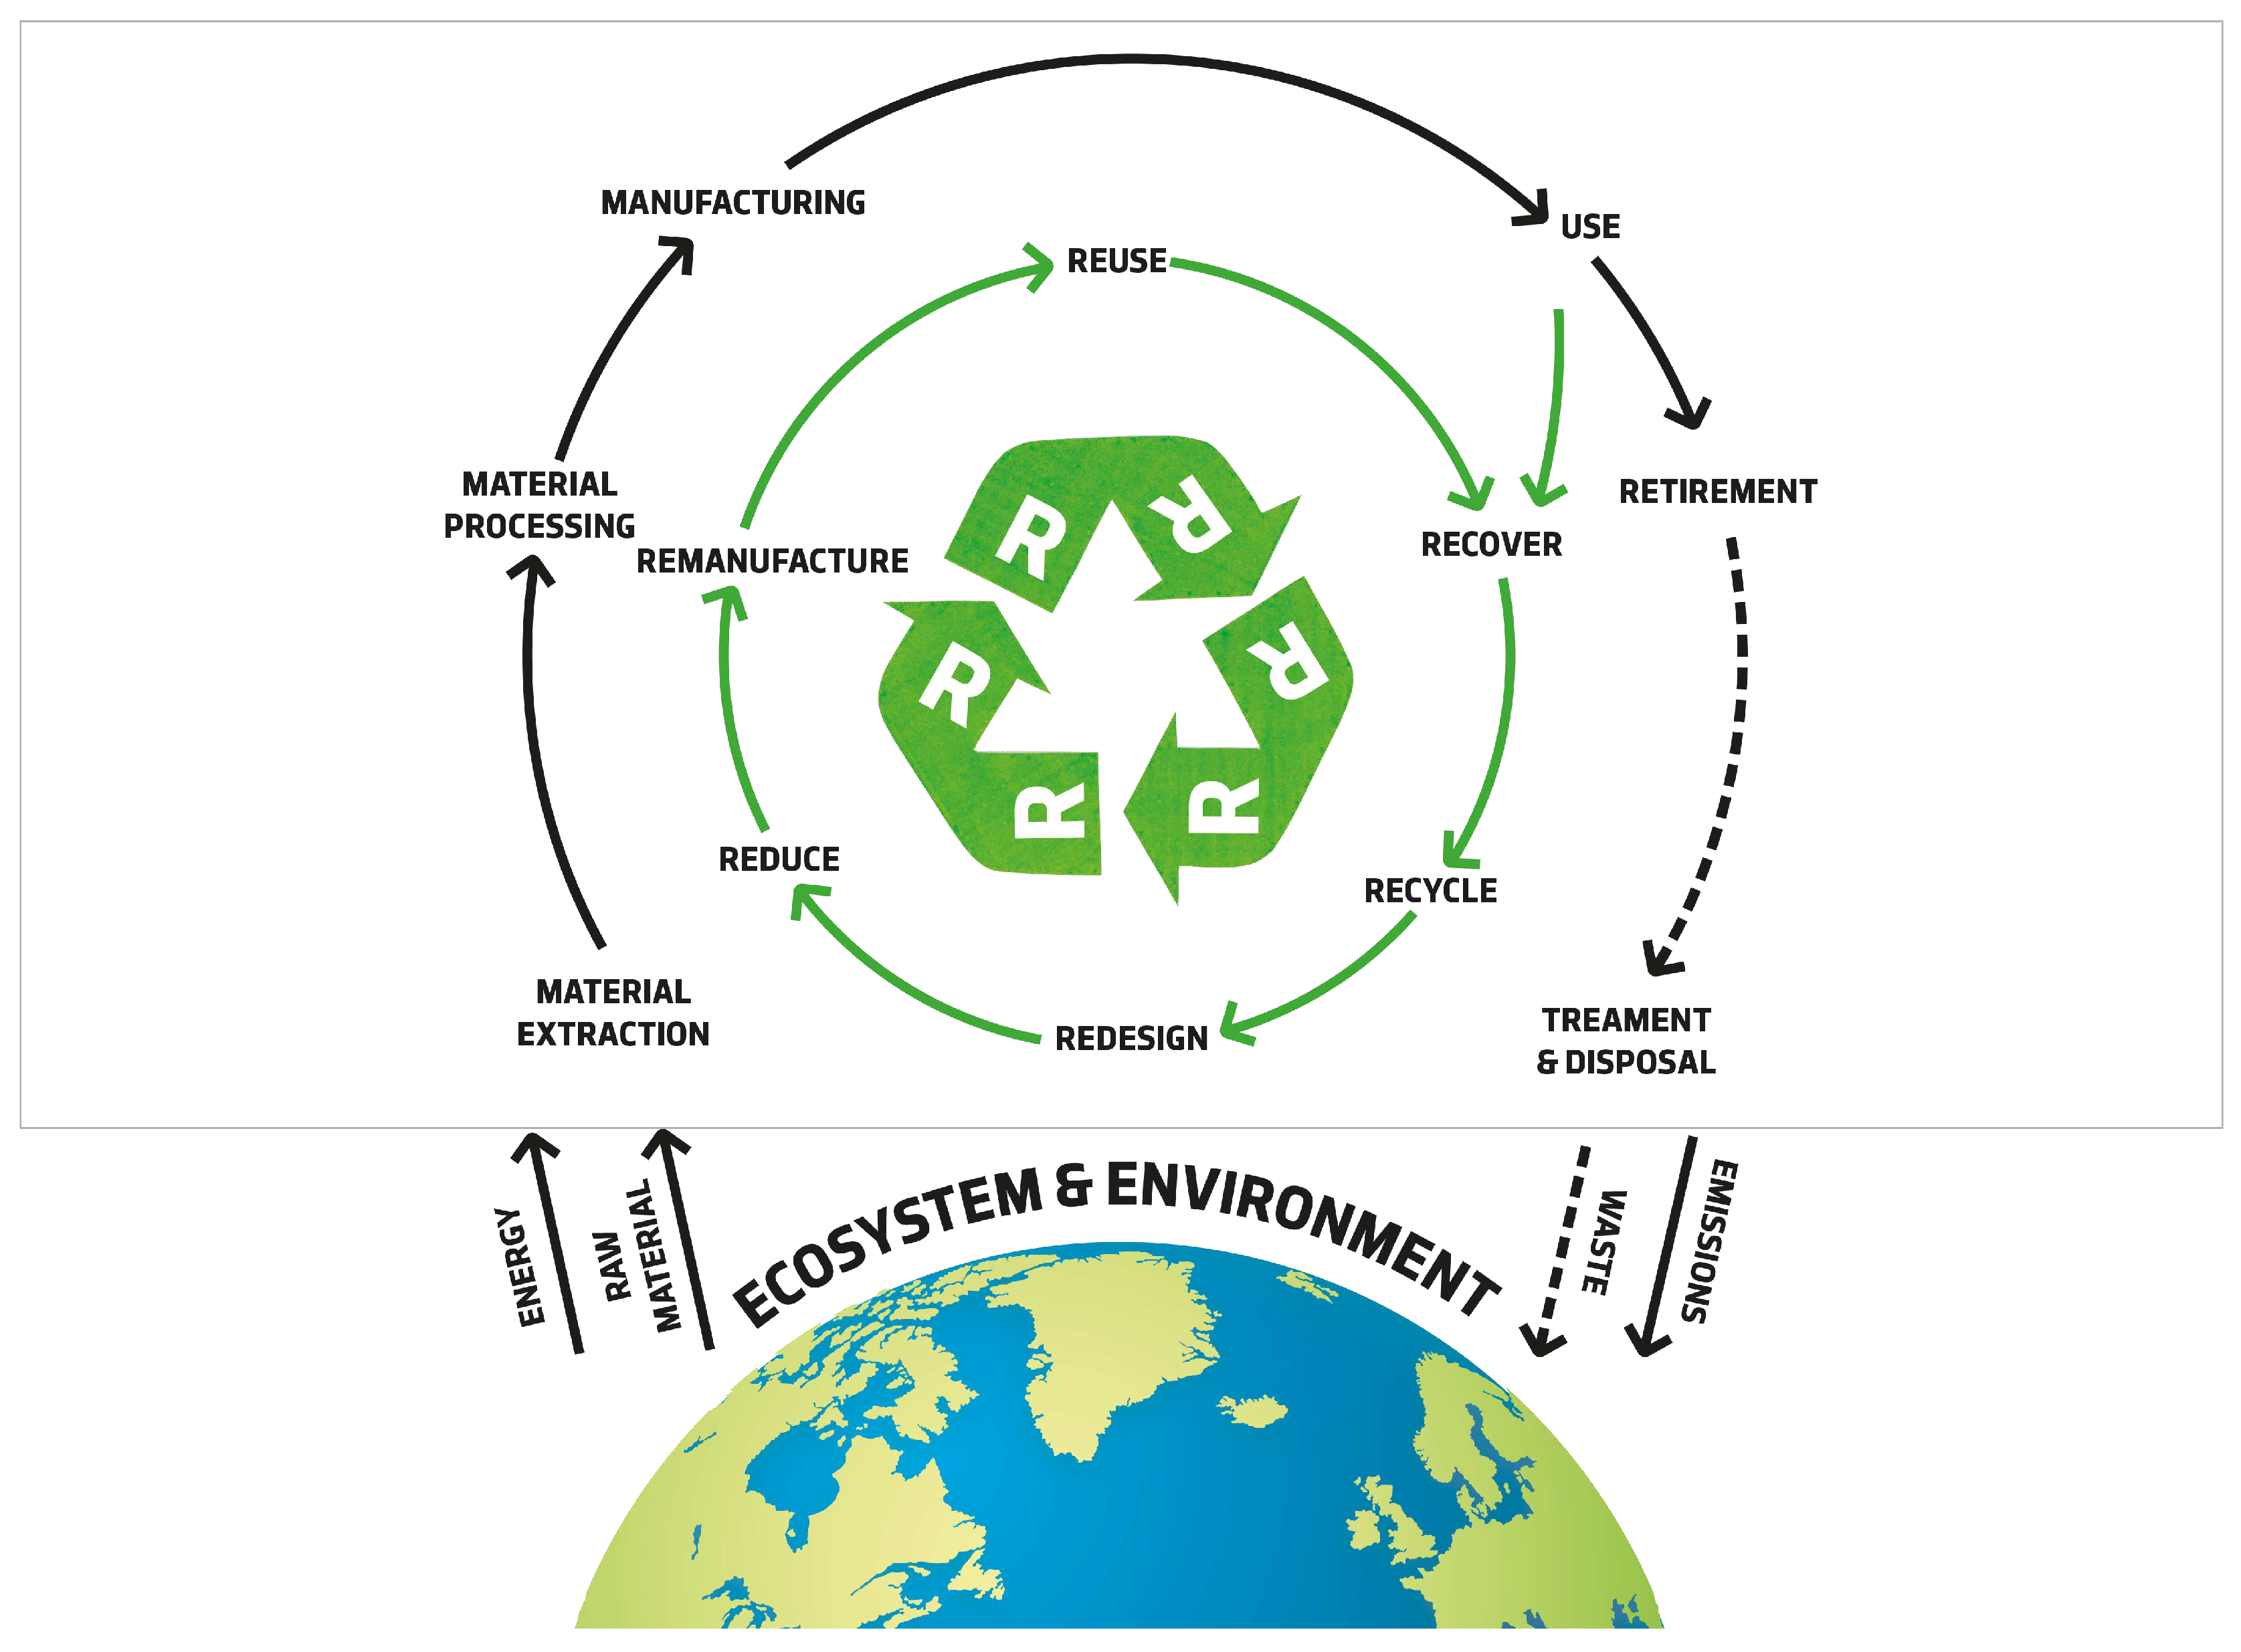

Table 1.
Dimensions according with literature review.
| Dimensions | Authors – Literature |
|---|---|
| Temperature | [18], [23], [27], [30], [31], [50], [32], [26], [24], [49], [25], [21], [12] and [20]. |
| Time | [30], [31], [32], [33], [19], [12] and [20]. |
| Speed | [18], [23], [27], [30], [31], [50], [32], [47], [21] and [12]. |
| Pressure | [30], [31], [32], [26], [49], [48], [12] and [51]. |
| Geometry | [23], [27], [50], [28], [26], [25], [48], [13] and [17]. |
Table 2.
Designations of factors for scrap production.
| Dimensions | Variables | Bounds |
|---|---|---|
| Temperature | ||
| Time | ||
| Speed | ||
| Pressure | ||
| Geometry |
Table 3.
Description of the variables included in the linear model.
| Dimensions | Variables |
|---|---|
| Temperature | : Post Container Temperature (°C); |
| : Max End Temperature (°C); | |
| : Set Temperature Z1 (°C); | |
| : Billet Conical Temperature (°C); | |
| Time | : Speed Time (s); |
| : Dead Time (s); | |
| : Extrusion Time (s); | |
| Speed | : Extrusion Speed (mm/s); |
| : Puller Speed (m/min); | |
| : Pull Length (m); | |
| : DX Puller Traction | |
| Pressure | : Sealing Pressure (bar); |
| : Maximum Extrusion Pressure (bar) | |
| Geometry | : Billet Lenght (mm); |
| : Butt Lenght (mm); | |
| : Number of Holes; | |
| : Specific Weight; | |
| : Number of Billets; | |
| : Bars Lenght (mm); | |
| : Number of Bars (mm); | |
| : Saw Speed (%) |
Table 4.
Descriptive statistics of the variables considered in the linear regression model (Eq. 5).
Table 4.
Descriptive statistics of the variables considered in the linear regression model (Eq. 5).
| Variables | Minimum | Median | Mean | St. deviation | Maximum |
|---|---|---|---|---|---|
| 0 | 2 | 2.49 | 1.65 | 12 | |
| 0 | 0.77 | 1.55 | 1.96 | 78.42 | |
| 0.44 | 4.58 | 4.65 | 1.41 | 12.83 | |
| 0 | 39 | 42.06 | 23.09 | 452 | |
| 56 | 167 | 173.93 | 49.09 | 1200 | |
| 12 | 17 | 18.66 | 3.62 | 33 | |
| 0 | 43.93 | 43.62 | 8.65 | 58.19 | |
| 1 | 13 | 29.78 | 43.35 | 329 | |
| 650 | 865 | 850.98 | 94.41 | 1113 | |
| 12 | 22 | 23.62 | 4.47 | 150 | |
| 2050 | 6500 | 6542.21 | 1550.18 | 12050 | |
| 0 | 14 | 17.24 | 17.19 | 228 | |
| 0 | 14.33 | 13.74 | 5.43 | 31.81 | |
| 67 | 445 | 535.95 | 266.60 | 1372 | |
| 40 | 460 | 457.83 | 17.33 | 510 | |
| 350 | 565 | 557.98 | 27.99 | 600 | |
| 15 | 33 | 33.17 | 4 | 78 | |
| 10 | 70 | 63.85 | 14.74 | 95 | |
| 133 | 240 | 236.47 | 18.43 | 275 | |
| 239 | 247 | 246.79 | 1.06 | 282 | |
| 407 | 435 | 435.43 | 4.06 | 451 |
Table 5.
Coefficients and Collinearity Diagnosis.
| Unst | Std | St Coef | t | Sig. | Collinearity Stat | ||
|---|---|---|---|---|---|---|---|
| Coef | Coef | error | Tolerance | VIF | |||
| (Constant) | 60.447 | 8.033 | 7.524 | 0.000 | |||
| 1.097 | 0.01 | 0.428 | 112.873 | 0.000 | 0.763 | 1.31 | |
| -0.62 | 0.014 | -0.363 | -45.526 | 0.000 | 0.173 | 5.788 | |
| 0.146 | 0.003 | 0.231 | 45.017 | 0.000 | 0.415 | 2.41 | |
| -0.063 | 0.002 | -0.117 | -25.224 | 0.000 | 0.511 | 1.958 | |
| 1.11 | 0.035 | 0.234 | 31.707 | 0.000 | 0.201 | 4.98 | |
| -0.001 | 0.000 | -0.115 | -24.923 | 0.000 | 0.513 | 1,95 | |
| 0.141 | 0.008 | 0.068 | 18.755 | 0.000 | 0.842 | 1.188 | |
| 1.442 | 0.049 | 0.257 | 29.181 | 0.000 | 0.141 | 7.069 | |
| -0.028 | 0.003 | -0.055 | -10.8 | 0.000 | 0.423 | 2.362 | |
| -0.105 | 0.005 | -0.194 | -21.861 | 0.000 | 0.14 | 7.156 | |
| 0.01 | 0.001 | 0.052 | 7.677 | 0.000 | 0.237 | 4.226 | |
| -0.117 | 0.009 | -0.051 | -12.523 | 0.000 | 0.662 | 1.511 | |
| -0.121 | 0.01 | -0.052 | -11.642 | 0.000 | 0.544 | 1.837 | |
| -0.012 | 0.002 | -0.031 | -7.842 | 0.000 | 0.722 | 1.386 | |
| 0.032 | 0.005 | 0.03 | 6.642 | 0.000 | 0.538 | 1.86 | |
| 0.003 | 0.000 | 0.033 | 6.839 | 0.000 | 0.475 | 2.104 | |
| -0.216 | 0.041 | -0.033 | -5.267 | 0.000 | 0.283 | 3.537 | |
| 0.004 | 0.001 | 0.019 | 4.901 | 0.000 | 0.713 | 1.403 | |
| -0.004 | 0.001 | -0.014 | -3.713 | 0.000 | 0.829 | 1.207 | |
| 0.061 | 0.029 | 0.007 | 2.114 | 0.035 | 0.989 | 1.012 | |
Table 6.
Linear Regressions Standardized of the Most Frequent Profiles.
| A | B | C | D | E | F | G | H | I | |
|---|---|---|---|---|---|---|---|---|---|
| (Constant) | -34.924 | -1.5 | -25.761 | -8.202 | -24.239 | -51.198 | -40.935 | 3.766 | -8.292 |
| 0.002 | 0.01 | ||||||||
| 0.114 | 0.671 | -0.013 | -0.267 | -0.471 | -0.094 | 0.305 | -0.007 | ||
| -0.071 | 0.022 | 0.089 | 0.031 | ||||||
| 0.187 | 0.313 | -0.003 | |||||||
| 0.091 | |||||||||
| -1.546 | -0.721 | -2.38 | -1.309 | -2.191 | -2.51 | -1.414 | -1.439 | -1.314 | |
| -0.077 | 0.038 | 0.042 | 0.026 | 0.007 | -0.005 | ||||
| -0.058 | -2.163 | -42.973 | -10.639 | -5.097 | 0.06 | 0.201 | -14.299 | ||
| 0.228 | -0.236 | -0.251 | -0.047 | 0.061 | |||||
| 10.07 | 1.098 | ||||||||
| -52.309 | -1.537 | -2.603 | -12.56 | -34.033 | -63.315 | -50.194 | -2.756 | -10.024 | |
| -0.002 | |||||||||
| 0.046 | -0.066 | -0.007 | 0.013 | 0.038 | |||||
| -0.038 | 0.067 | -0.059 | 0.097 | 0.016 | |||||
| -0.016 | 0.027 | 0.007 | 0.023 | -0.01 | -0.019 | ||||
| 1.142 | 0.932 | 0.875 | 1.099 | 0.896 | 0.798 | 0.828 | 0.925 | ||
| -0.251 | -0.018 | -0.076 | -0.006 | ||||||
| -0.017 | -0.049 | -0.016 | -0.013 | -0.01 | -0.006 | ||||
| 0.023 | 0.031 | -0.147 | |||||||
| -0.064 | 0.024 | -0.033 | 0.035 | ||||||
| -0.006 | -0.012 | 0.01 | |||||||
| -0.016 | 0.075 | -0.02 | -0.004 | ||||||
| Frequency | 2596 | 1331 | 1194 | 980 | 906 | 894 | 842 | 723 | 697 |
| Scrap (KG) | 11.415 | 9.627 | 6.801 | 8.159 | 10.594 | 11.294 | 10.461 | 8.485 | 8.81 |
| 0.804 | 0.606 | 0.96 | 0.966 | 0.925 | 0.996 | 0.962 | 0.998 | 0.986 |
Table 7.
Linear Regressions Standardized of Profiles With Higher Scrap.
| J | K | L | M | N | O | P | Q | R | |
|---|---|---|---|---|---|---|---|---|---|
| (Constant) | -45.593 | 1.274 | -49.869 | -28.252 | 3.308 | 1.952 | 1.621 | 3.083 | -2.039 |
| -0.028 | |||||||||
| 0.102 | -2.42 | -0.121 | -0.109 | ||||||
| -0.011 | -0.102 | 0.346 | |||||||
| 0.648 | 0.036 | ||||||||
| -1.254 | -1.14 | -0.56 | -1.672 | -0.312 | |||||
| -0.013 | 0.018 | -2.180 | 0.012 | 0.093 | 0.032 | 0.015 | 0.054 | ||
| -71.739 | -0.613 | -3.702 | -45.268 | -1.191 | -2.732 | 0.578 | |||
| -0.022 | 0.051 | -1.472 | 0.05 | 0.098 | |||||
| -0.367 | 1.716 | ||||||||
| -1.531 | -5.427 | -72.07 | -0.669 | -0.679 | -1.363 | -2.193 | -2.312 | -0.234 | |
| 0.026 | -0.041 | 0.021 | 0.035 | ||||||
| -0.015 | -0.068 | 0.009 | 0.078 | ||||||
| -0.033 | 0.033 | 0.016 | |||||||
| 0.039 | 0.07 | ||||||||
| 1.015 | 0.526 | 1.152 | 0.654 | 0.512 | 0.942 | 0.728 | 0.86 | 0.096 | |
| 0.033 | -0.047 | 0.081 | |||||||
| 0.041 | -0.038 | ||||||||
| -0.071 | -0.093 | 0.063 | 0.043 | 0.246 | -0.037 | ||||
| 0.876 | -0.074 | -0.417 | |||||||
| -0.017 | 0.044 | ||||||||
| 0.021 | 0.004 | 0.037 | 0.02 | ||||||
| Frequency | 154 | 182 | 227 | 188 | 141 | 301 | 274 | 135 | 107 |
| Scrap (KG) | 43.55 | 43.518 | 43.236 | 41.574 | 35.273 | 25.476 | 23.291 | 22.147 | 20.4 |
| 0.986 | 0.983 | 0.993 | 0.951 | 0.975 | 0.995 | 0.999 | 1 | 0.999 |
Disclaimer/Publisher’s Note: The statements, opinions and data contained in all publications are solely those of the individual author(s) and contributor(s) and not of MDPI and/or the editor(s). MDPI and/or the editor(s) disclaim responsibility for any injury to people or property resulting from any ideas, methods, instructions or products referred to in the content. |
© 2024 by the authors. Licensee MDPI, Basel, Switzerland. This article is an open access article distributed under the terms and conditions of the Creative Commons Attribution (CC BY) license (http://creativecommons.org/licenses/by/4.0/).
Copyright: This open access article is published under a Creative Commons CC BY 4.0 license, which permit the free download, distribution, and reuse, provided that the author and preprint are cited in any reuse.


