
Submitted:
22 January 2024
Posted:
23 January 2024
You are already at the latest version
Abstract
The nano size, physical and chemical properties of Au and Ag nanoparticles (NPs) allow them to be used in medicine or plant protection, but chemical solvents used during synthesis makes them toxic and pose a threat to the environment. Chemical NPs synthesis can be replaced by in vivo synthesis in which independently growing plants such as alfalfa take up and then split the precursor in their cells down to nano size using synthesis-promoting solvents–biomolecules, which can break down materials without free radicals and has anti-inflammatory, antioxidant effects, making NPs environmentally benign.
In this study, two-week-old seedlings of two Medicago sativa L. genotypes, ‘Kometa’ and ‘la Bella’, were exposed to two precursors (AgNO3, HAuCl4) for 24 and 48 h to determine whether in vivo synthesis is possible. Double-blazed and certain wavelength spectrophotometry and confocal microscopy confirmed, statistically significant (P<0.05) changes in light absorption and light fluorescence compared to the control. Confocal microscopy showed both precursors visible in the roots of both genotypes. Currently, NPs synthesis and visualisation methods require a complex, expensive and time-consuming sequence of methods. It is important to find an effective, environmentally friendly, and as cheap and simple as possible method for the biosynthesis of NPs.
Keywords:
Nanoparticles
; Biosynthesis
; Confucal micriscopy
; spectrophotometry
1. Introduction
Due to their size of 1–100 nm, optical, electrical and catalytic characteristics [1], silver (Ag) and gold (Au) nanoparticles (NPs) have multiple applications in medicine as antibacterial agents and even have wound-healing capabilities [2]. In addition to functioning as antibacterial agents, they are also used in textiles, coatings, food packaging and other applications [2]. Au NPs are used in therapy, diagnostics [3] and biomedical applications, such as nuclear medicine, molecular imaging and contrast agents, vaccine development, medical implants, biosensing, and lab-on-chip applications. The synthesis of NPs heavily influences NP properties, which then influences NP applications [4]. It is necessary to analyse the impact and interaction of NPs with the environment and people, as well as to search for factors that have the greatest influence on NP properties [5].
Two widely used approaches are used to synthesise metal NPs: silver and gold. The physical approach is a top–down method in which NPs are made by mechanical breakdown [6]. The most popular methods for physical synthesis of Ag or Au NPs include laser ablation, ultrasonic machining and ball milling [7]. The chemical approach is a bottom–up method in which NPs are made using a nucleation process with water-soluble cations as a precursor that triggers their reduction to metal monomers. Ag or Au NPs can be chemically synthesised using the sol–gel process, pyrolysis and hydrothermal synthesis methods [6].
Although the size, shape and other properties of NPs can be well controlled by physical and chemical methods, metal solvents are often toxic substances, and solvent toxicity can be transferred to synthesised NPs [8]. Due to their small size and ability to increase toxicity, Ag and Au NPs can be dangerously toxic to humans and animals [9,10].
NP biosynthesis, as one of the bottom–up methods, allows the replacement of mechanical or artificially obtained solvents for the synthesis of Ag and Au and other NPs with natural solvents obtained from living organisms, such as plants, bacteria, algae and animals [11,12,13,14,15,16].
Plants are commonly used for NP biosynthesis due to the possibility of growing them easily or maintaining them more easily than bacteria and animals. Various agricultural plants, such as alfalfa (Medicago sativa L.) [17,18,19] and Aloe vera L. [20], are used in NP biosynthesis studies because they contain many biomolecules, such as phenols glucose, fructose, ascorbic acid and citric acid [20,21,22,23], which can divide metal precursors, for example, AgNO3 and HAuCl4 to Ag and Au NPs [22,23,24].
Biosynthesis with plants can be performed using plant extracts obtained from plant parts, including seeds [25], leaves [19] and fruit [26]. Extracts can also be obtained from plant callus cells. It has been established that callus cultures have concentrated biomolecules in larger quantities than vascular plants [27].
The biosynthesis of Au [28], Ag [29], and other NPs [30] is also possible using the in vivo method when the metal precursors are split by plant biomolecules in the plant cells as the plant continues to grow [28].
The realisation of all biosynthesis methods takes time, especially the in vivo method [29]. All three NPs biosynthesis methods (synthesis with extracts from plant parts or callus cultures and in vivo biosynthesis) are much cheaper than physical or chemical methods because they do not use expensive chemical solvents and require only a minimum amount of advanced equipment [14,25,28].
Comparing all mentioned biological methods, the least studied method is the in vivo biosynthesis method [28,29,30]. In vivo biosynthesis needs to be studied further because, recently, a lot of environmental pollution has been discovered. Metals of various sizes, household chemicals, acids, nitrates, salts and other substances enter ecosystems uncontrolled [9]. Plants can absorb these materials and chemicals and then synthesise NPs from them in their cells. After synthesis, NPs can be distributed further throughout the trophic food web [10]. It has already been established that all types of NPs are insoluble and their positive or negative effects pass from organism to organism by increasing the effect [10]. It is necessary to confirm that plants can break down metal precursors on their own, so that later in future studies, the course of this process and its effect on the plant can be analysed, as well as the properties of the obtained NPs [11,12,14].
2. Materials and Methods
2.1. Medicago Sativa L. seedling Cultivation.
Medicago sativa L. seeds of a Spanish genotype (‘la Bella’) were obtained from Wrocław University (Poland) of Environmental and Life Sciences, Department of Genetics, Plant Breeding and Seed Production. Polish genotype (‘Kometa’) variety seeds were provided by Danko breeding company, Poland. The seeds were rinsed with tap water and transferred to Petri plates at 24°C and kept in the dark for 2 d. After a period of germination and growth of 14 days, they were placed in a growth chamber at +24°C and grown in hydroponics as a control group and in the experimental groups, AgNO3 and HAuCl4, for 24 and 48 h. The control group was grown without any precursor [33].
2.2. Obtaining a Plant Suspension from Seedlings for Spectrophotometry.
The seedlings were cut into small pieces, and 25 mg of green alfalfa seedling leaves were weighed for each group. A volume of 4.5 mL of deionised H2O was added to the weighed leaves. The mixture was then ground with a pestle. The resulting mixture was filtered. New filter was used for each sample. Before centrifugation, the mixture was kept in the dark for 30 min [34].
2.3. Determination of Light Absorbance at Different Wavelengths with a Double-Blazed Shimadzu UV-2550PC UV-Vis Spectrophotometer.
Light measurements were taken through all wavelengths, starting with the infrared range (190 nm) to ultraviolet (900 nm), using a double-blazed spectrophotometer SHIMADZU UV-2550PC (Scinteck Instruments, Manassas, Virginia, USA). At certain wavelengths (340–450 nm) where intense absorption occurred, a peak was seen, and light absorbance was measured.
2.4. Determination of Light Absorbance intensity at a Certain Wavelength by Spectrophotometry Using a NanoDrop1000 Spectrophotometer.
The absorbance of the light in the suspension solution was determined using a NanoDrop1000 spectrophotometer (Thermo Scientific, Wilmington, North Carolina, USA). Three replicates of the measurements were performed for each sample. The obtained data were processed using the ND-1000 V3.6.0 computer programme at light wavelengths of 470 and 350 nm for AgNO3 samples and 450 and 650 nm for HAuCl4 samples [33].
2.5. Visualisation of Medicago sativa L. seedlings with Confocal Microscopy.
The leaves and roots of alfalfa were visualised using a confocal laser scanning microscope (CLSM, Nikon Eclipse Ti-E) configured with an A1 R MP microscope system and equipped with a digital sight DS-U3 camera (Nikon, Tokyo, Japan). Small pieces of the samples, together with distilled water, were observed at 600× magnification [35]. For the hermetic sealing of the sample, glue was used, and dyes were not used.
Fluorescence was excited at a 488 nm laser and at a wavelength of 503.0–583.0 nm. Specific confocal system parameters were chosen (laser: 58.2, HV: 217 and pinhole: 4.3). The pictures of samples were carried out and analysed with computer programme NIS Elements AR Analysis 3.2 64-bit [36].
2.7. Statistical Analysis.
The mean, standard deviation (SD), and one-way analysis of variance (ANOVA) were performed to determine the differences and significance (P<0.05) of light absorbance at light wavelengths [33] of 470 and 350 nm for AgNO3 samples and 450 and 650 nm for HAuCl4 samples. One-way analysis of variance (ANOVA) was performed to determine the differences and significance (P<0.05) of light absorbance from NanoDrop1000 spectrophotometer data of 24h and 48h after exposure of precursor. Three replicates for each treatment were performed.
3. Results
3.1. Medicago sativa L. Seedling Cultivation.
Seedlings of both Medicago sativa L. genotypes ‘Kometa’ and ‘la Bella’ were successfully grown; 14 days after germination, the seedlings were between 7 and 9 cm long. Before precursor application, all plants were viable, with green leaves and pale white roots. Twenty-four hours after the addition of 500 or 1000 mg/L AgNO3, the roots of the plants remained brown and the leaves and stems of some plants became lighter. After 48 h of exposure to the precursor, the plant roots were extremely brown at all precursor concentrations. It was clear that Ag precursors settled in large quantities on the roots of the plants, influencing plant growth.
3.2. Obtaining Plant Suspension from Seedlings for Spectrophotometry.
Despite the small size of the seedlings, plant green mass suspensions for spectrophotometric analysis were obtained from all experimental groups. When evaluating the external appearance of the suspension, no drastic colour changes were observed. No deposits or particles of other materials were observed. However, the green colour of some samples was darker.
3.3. Determination of Light Absorbance at Different Wavelengths from 190 to 900 nm with a Double-Blazed Shimadzu UV-2550PC UV-Vis Spectrophotometer.
Using a double-blazed Shimadzu UV-2550PC UV-Vis spectrophotometer, light absorbance was determined at different wavelengths from 190 to 900 nm. Light absorbance results for each alfalfa genotype, depending on the precursor and its exposure time, are summarised in graph figures 1,2,3 and 4. The results of light absorption for the ‘Kometa’ genotype after 24 h exposure to AgNO3 and HAuCl4 are shown in Figure 1.
The most significant changes in the light absorption results compared to the control for the ‘Kometa’ genotype after 24 h of exposure to the precursors are summarised in Table 1.
The results of light absorption for the ‘la Bella’ genotype after 24 h of exposure to AgNO3 and HauCl4 are shown in Figure 2.
The most significant changes in the light absorption results compared to the control for the ‘la Bella’ genotype after 24 h of exposure to the precursors are summarised in Table 2.
The results of light absorption for the ‘Kometa’ genotype after 48 h of exposure to AgNO3 and HAuCl4 are shown in Figure 3.
The most significant changes in the light absorption results compared to the control for the ‘Kometa’ genotype after 48 h of exposure to the precursors are summarised in Table 3.
The results of light absorption for the ‘la Bella’ genotype after 48 h of exposure to AgNO3 and HAuCl4 are shown in Figure 4.
The most significant changes in the light absorption results compared to the control for the ‘la Bella’ genotype after 48 h of exposure to the precursors are summarised in Table 4.
Double-blazed photo-spectroscopy showed that control samples of both alfalfa genotypes had a light absorption peak between 5.00 and 4.5 when the samples received light with a wavelength between 340 and 460 nm. When light was received with a wavelength exceeding 460 nm, the absorption intensity decreased in all control samples and reached a minimum at 900 nm (<1.00).
In both ‘Kometa’ and ‘la Bella’ samples of the experimental groups that received all concentrations of the HAuCl4 precursor for 24 h and almost all concentrations for 48 h, the wavelength period in which the maximum values of light absorption were observed decreased compared to the control group. The decrease depended on the precursor type and its concentration. As the concentration of the precursor increased, the maximum values of light absorption were shown less frequently than in the control groups.
Samples were found where the light absorption peak did not reach the maximum value of 5.00. These were ‘Kometa’ genotype samples that received 250 and 1000 mg/L of the AgNO3 precursor with an exposure time of 24 h. Additionally, ‘la Bella’ samples that received the AgNO3 precursor with concentrations of 250 and 500 mg/L and an exposure time of 24 h.
When the precursors were used for 48 h, samples were detected in which the light absorption peak did not reach the maximum value of 5.00. These results are shown in Table 4. These were the ‘Kometa’ genotype samples that received 100 and 200 mg/L of the HAuCl4 precursor and samples that received 250 mg/L of the AgNO3 precursor. The ‘la Bella’ sample that received 50 mg/L of the HAuCl4 precursor also differed significantly from the control. This was the only one of the HAuCl4 samples to show such a considerable difference from the control. Additionally, ‘la Bella‘ samples that received the AgNO3 precursor at all concentrations showed low absorption peaks with a short wavelength period.
3.4. Determination of Light Absorbance Intensity at a Certain Wavelength by Spectrophotometry Using a NanoDrop1000 Spectrophotometer.
The absorbance of the light in the suspension solution was determined at light wavelengths of 470 and 350 nm for AgNO3 samples and 450 and 650 nm for HAuCl4 samples. The NanoDrop1000 spectrophotometer differs from the double-blazed Shimadzu UV-2550PC UV-Vis spectrophotometer, in that absorbance is determined at a specific wavelength rather than a period. Each sample measurement was repeated in triplicate, and the light absorbance was determined at the selected wavelengths. Table 5 summarises the average data of the 3 measurements of light absorption for the control group and the experimental groups of seedlings of both genotypes after 24 h of exposure to precursors.
After statistical analysis of the data, the spectrophotometry results showed that ‘Kometa’ samples that were irradiated with light at a wavelength of 450 or 650 nm after 24 h of exposure to 50 mg/L HAuCl4 showed a statistically significant increase in light absorption. Samples exposed to 100 mg/L showed a statistically insignificant increase, but samples exposed to 200 mg/L HAuCl4 showed a statistically insignificant decrease. ‘Kometa’ genotype samples exposed to AgNO3 showed statistically significant changes in light absorption measured at both 350 and 470 nm at all precursor concentrations. At concentrations of 250 and 500 mg/L, absorbance at a 470 nm wavelength was reduced compared to the control group, but at the highest concentration of this precursor (1000 mg/L), absorbance was increased. In contrast, in samples irradiated with a light wavelength of 350 nm, absorbance was significantly increased in all three experimental groups. These results are shown in Table 5.
The light absorption results of the Medicago sativa L. genotype ‘la Bella’ were also very different. In samples with HAuCl4, illumination at 450 nm showed a statistically significant decrease in absorbance when the precursor was used at concentrations of 100 mg/L and 200 mg/L. However, at a light wavelength of 650 nm, a statistically significant effect on light absorption was seen only when the precursor was used at a high concentration (200 mg/L). Absorption was reduced in ‘la Bella’ samples that received AgNO3 and were irradiated with light wavelengths of 470 and 350 nm. Statistically significant light absorption decreased when AgNO3 was used at a concentration of 250 mg/L with light waves of 470 and 350 nm. However, the absorbance was not significantly affected at 470 nm with a high precursor concentration (100 mg/L), whereas the highest concentration (1000 mg/L) was able to reduce the absorbance statistically significantly. Overall, the results showed that the sample with 500 mg/L AgNO3 at 350 nm had a statistically significant increase, whereas the highest concentration (1000 mg/L) did not significantly affect absorption.
Almost all of the light absorption data at different wavelengths changed their light absorption values after 24 h of exposure to precursors compared to the control group, except for one sample (‘la Bella‘, 650 nm, HAuCl4, 100 mg/L). However, the results changed unevenly, as only a part of the results (15 of 24) showed statistically significant changes.
Table 6 shows the average data of the 3 measurements of light absorption for the control group and the experimental groups of seedlings of both genotypes after 48 h of exposure to precursors.
These results showed that the changes in light absorption did not fluctuate as often as was seen in the results after 24 h of precursor exposure in alfalfa. In samples of genotype ‘Kometa’ that received HAuCl4 acid for 48 h, light absorption was increased statistically significantly compared to the control group in both experimental groups (HAuCl4 concentrations 50, 100 and 200 mg/L). An increase in absorbance was observed at both wavelengths of light (450 and 650 nm). In samples of ‘Kometa’ genotype that received AgNO3 nitrate for 48 h and were irradiated with light at a wavelength of 470 nm, light absorption was increased compared to the control group at all concentrations (50, 100 and 200 mg/L). However, this increase was not statistically significant. However, with light at a wavelength of 350 nm, its absorption in the ‘Kometa’ samples increased statistically significantly. In ‘la Bella’ genotype samples that received HAuCl4 acid for 48 h, light absorption increased statistically significantly at all acid concentrations (50, 100 and 200 mg/L) compared to the control group. These samples were irradiated with light at a wavelength of 450 nm. However, samples treated with light at a wavelength of 650 nm and an acid concentration of 50 mg/L showed a decrease in absorbance compared to the control, but this was not statistically significant. Samples with the same light wave but a higher acid concentration (100 and 200 mg/L) showed a statistically significant decrease in light absorption compared to the control group. The consistency of the results between samples within the same experimental group was also demonstrated by the remaining samples with AgNO3 chloride; however, these results did not rule out differences between the experimental groups. The results with AgNO3 showed that light absorption decreased statistically significantly at all acid concentrations (250, 500 and 1000 mg/L) compared to the control group when irradiating the samples with light with a wavelength of 470 nm, but the results were completely opposite when using a wavelength of 350 nm, as light absorption at all acid concentrations (250, 500 and 1000 mg/L) increased statistically significantly compared to the control group. These results are shown in Table 6.
Almost all of the results from light absorption data at different wavelengths after 48 h of exposure to precursors, except for 4 samples (‘Kometa’, AgNO3, 450 nm 100 mg/L, 200 mg/L, 1000 mg/L and ‘la Bella’ HAuCl4, 650 nm, 50 mg/L), changed their light absorbance values statistically significantly. This indicates that 48 h of exposure to the precursor caused changes in light absorption more often. HAuCl4 increased light absorption in ‘Kometa’ samples statistically significantly, while in ‘la Bella’ samples, light absorption both decreased and increased depending on the wavelength of the light. Using the AgNO3 precursor in all ‘Kometa’ and ‘la Bella’ samples (at 470 nm) reduced light absorption statistically significantly.
3.5. Visualisation of Medicago sativa L. Seedlings with Confocal Microscopy.
The alfalfa leaves and roots were visualised in both genotypes using a confocal laser scanning microscope after 24 and 48 h of exposure to the precursor. Control and experimental samples with the highest precursor concentrations (‘Kometa’ leaves and roots of control, HAuCl4 200 mg/L, AgNO3 1000 mg/L and ‘la Bella’ leaves and roots of control, HAuCl4 200 mg/L, AgNO3 1000 mg/L) were visualised. Light fluorescence was determined for all the mentioned samples, and all samples were imaged. Some of the images are shown in these results. The peak of light fluorescence in all samples was shown when the samples received light with wavelengths from 530 to 550 nm. The wavelength period of peak light fluorescence intensity in leaf and root cells of ‘Kometa’ and ‘la Bella’ after exposure to precursors is shown in Table 7.
The confocal microscopy results showed that leaves of the ‘Kometa’ genotype from a control sample had some stoma and fragments of a chloroplast. The study used a thick leaf; thus, the leaf tissues and cells overlapped with each other. The maximum fluorescence intensity in ‘Kometa’ leaves for the control sample was about 350 nm, but for the root sample, the fluorescence peak was much higher, exceeding 900 nm.
An image of a ‘Kometa’ genotype leaf after 24 h of exposure to 200 mg/L HAuCl4 in leaves and roots are shown in Figure 1(a).
Figure 1.
Image of root sample with 200 mg/L HAuCl4 from the ‘Kometa’ genotype (a). Image of root sample with HAuCl4 200 mg/L, from the ‘la Bella’ genotype (b). Image of ‘la Bella’ genotype root sample after exposure to 1000 mg/L AgNO3 (c). Image of ‘Kometa’ genotype root sample exposed to 1000 mg/L AgNO3 (d). Image of ‘la Bella’ genotype root sample exposed to 1000 mg/L AgNO3 (e).
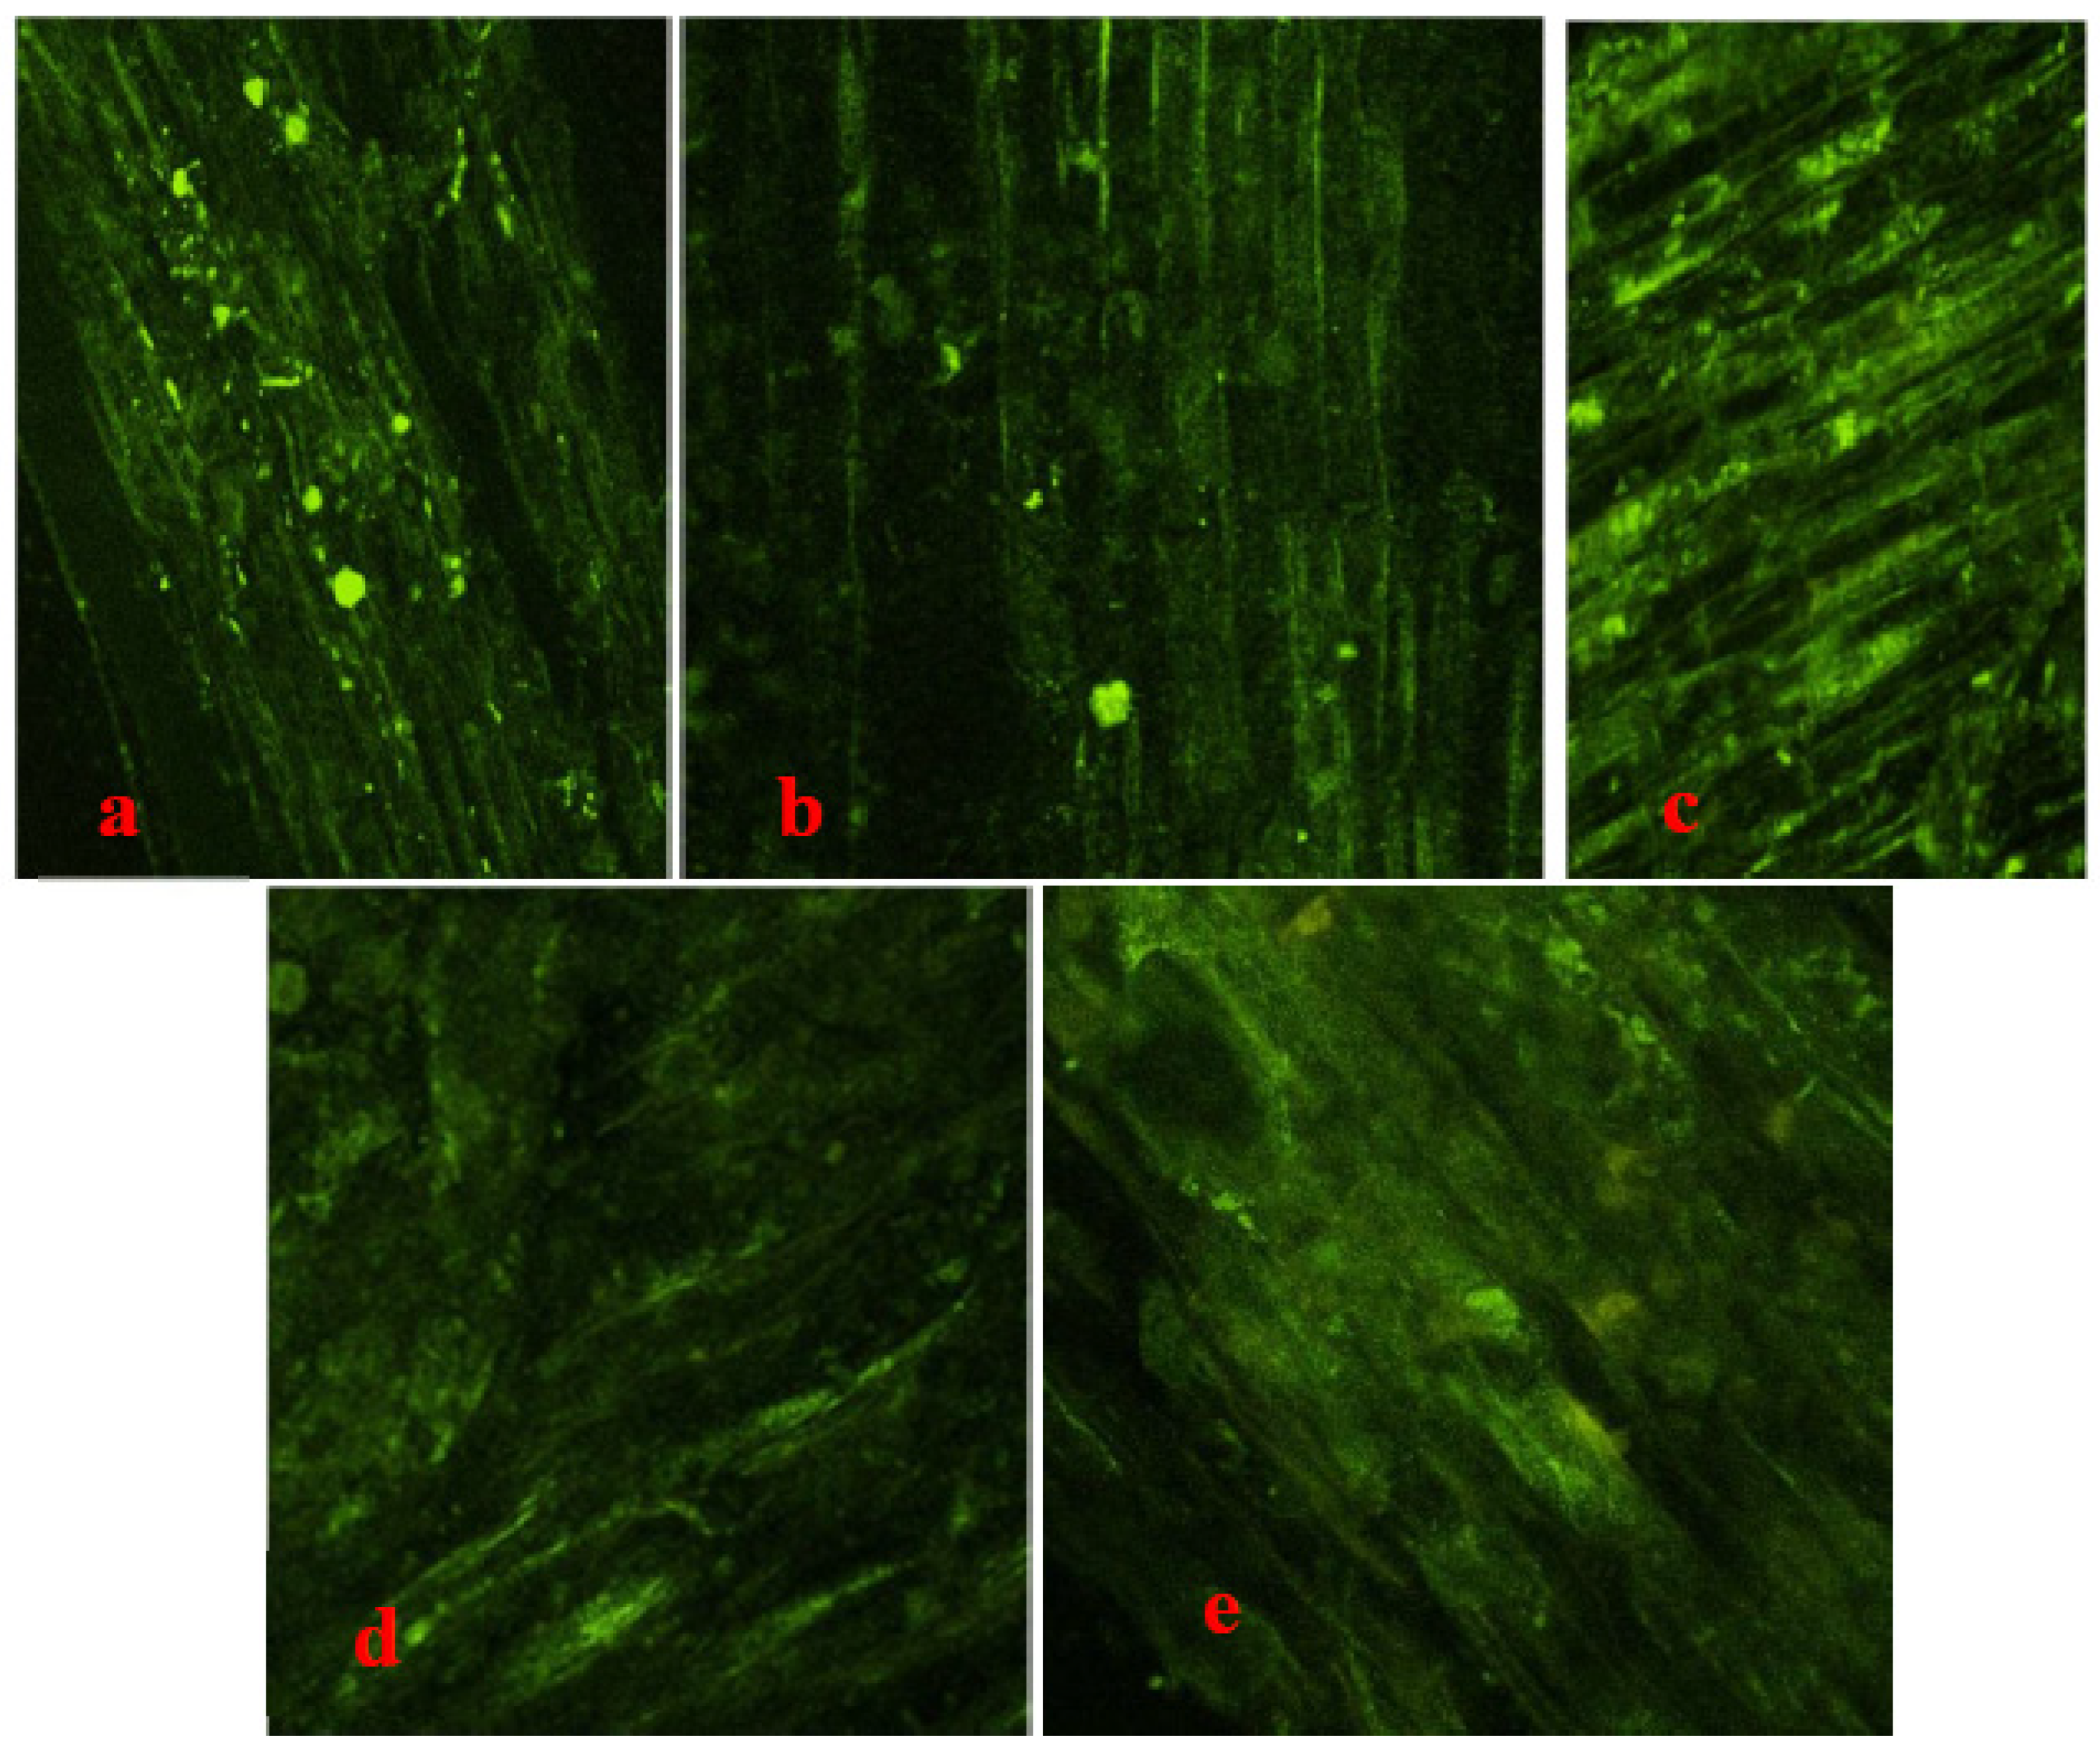
Au particles were seen between the cells of the vascular tissue, which gave off bright fluorescence. The size of these particles could not be determined because they stuck together in many places and formed agglomerates, and some of the particles stuck around the root from the outside and could be seen in the image as larger spots. The maximum fluorescence intensity of these samples for both the leaves and roots increased significantly; thus, HAuCl4 entered the plant roots.
After 24 h of exposure to 1000 mg/L AgNO3, the leaves of the ‘Kometa’ genotype showed an increase in fluorescence intensity compared to the control, but no Ag particles were visible in either leaves or roots.
For the ‘la Bella’ genotype, the control had a maximum fluorescence intensity of about 850 nm for the leaves, but for the root sample, the fluorescence peak was lower, exceeding 650 nm.
An image of the ‘la Bella’ genotype leaf after 24 h of growing with HAuCl4 200 mg/L, and a diagram of light fluorescence in the leaf and root are demonstrated in Figure 1 (b).
Some Au particles were seen between the cells of the vascular tissue, which gave off bright fluorescence. The intensity of these samples for both the leaf and root samples increased significantly; thus, HAuCl4 entered the roots of the plant. Some of the particles formed an agglomerate and were around the root from the outside, as shown in the image as one larger spot.
An image of a ‘la Bella’ genotype leaf after 24 h of exposure to 1000 mg/L AgNO3 is shown in Figure 1 (c).
Some Ag particles in this sample were also seen between the cells of the vascular tissue, which gave off a bright fluorescence. The intensity of both the leaf and root samples increased significantly; thus, AgNO3 also entered the plant roots.
However, the ‘Kometa’ genotype leaves of the control sample and those treated for 48 h with 200 mg/L HAuCl4 showed nothing. In the root sample, vascular tissue cells were partially visible, but no Au particles were visible. The maximum fluorescence intensity in ‘Kometa’ leaves for the control sample was about 1350 nm, but for the root sample, the fluorescence peak was much higher, exceeding 3000 nm. However, in sample leaves and roots of ‘Kometa’ with 200 mg/L HAuCl4 acid, the fluorescence peak was much higher than that of the control, demonstrating that HAuCl4 acid entered the plant and interacted with it.
An image of a ‘Kometa’ genotype leaf after 24 h of exposure to 1000 mg/L AgNO3 is shown in Figure 1 (d).
After 48 h of exposure to 1000 mg/L HAuCl4, ‘Kometa’ genotype leaves showed an increase in fluorescence intensity compared to the control. Ag particles were not visible in the leaf samples. In contrast, AgNO3 particles were visible in the root samples, although they were not abundant; they appeared to be more abundant in the sample medium concentration of silver nitrate.
After 48 h of exposure, leaves of the ‘la Bella’ genotype without any precursor (control) or 200 mg/L HAuCl4 showed nothing. In the root sample, vascular tissue cells were partially visible, and some Au particles could be seen between the tissues, but there were very few. The maximum fluorescence intensity in ‘la Bella’ leaves for the control sample was about 2500 nm, but for the root sample, the fluorescence peak was much lower, exceeding 600 nm. However, in the ‘la Bella’ leaves exposed to 200 mg/L HAuCl4, the fluorescence peak was much lower than the control, and the roots showed a higher fluorescence peak than the control, demonstrating that HAuCl4 acid entered the plant and affected the ‘la Bella’ genotype.
An image of the ‘la Bella’ genotype leaf after 48 h of exposure to 1000 mg/L AgNO3 is shown in Figure 1 (e).
The ‘la Bella’ leaf and root samples exposed to AgNO3 (1000 mg/L) for 48 h did not show a significant increase in fluorescence intensity compared to the control. The same Ag particles were visible in the leaf sample. AgNO3 particles were also visible in the root sample, although there were not many of them.
3.6. Statistical Comparison between the Results from 24 Hours and 48 Hours of Precursor Expose.
One-way analysis of variance (ANOVA) of light absorption from NanoDrop1000 spectrophotometer was performed to determinate, if there is difference between the light absorption between data after 24h and 48h precursor exposure. These results show that, in almost all of the samples, there is no statistically significant difference between the intensity of light absorption in the samples after 24 h exposure to the precursor compere to the intensity of light absorption in the samples after 48 h exposure of precursor. A statistically significant difference (P<0.05) is seen just in “Kometa” genotype samples, which received AgNO3 precursor at concentrations (250 mg/l, 500 mg/l and 1000 mg/l) and were irradiated with light at 470 nm.
4. Discussion
Metal NPs, especially Ag and Au, have very wide applications in medicine, the food industry, cosmetic product production, the improvement of plant protection products and other industries [3]. As the demand for NPs increases, they are being synthesised in larger quantities [2]. Physical and chemical methods make NP synthesis faster and on a large scale but often involve the use of chemical solvents that can further increase the toxicity of NPs [7]. Currently, one of the biggest challenges and urgent goals is to find a method of NP synthesis that is as efficient as possible but healthier for the environment and people [11,12].
Biological synthesis of NPs is an efficient way to obtain NPs without excessive toxicity from chemical solvents. In contrast, biologically synthesised NPs have much better properties because plant biomolecules, as natural solvents, improve the properties of NPs, for example, strengthening the antibacterial properties of Ag NPs [37,38] or making diagnostic examinations with Au NPs as contrast agents more harmless to the human body [22].
Among the methods of NP biosynthesis used in other studies, synthesis in which the precursor is dissolved with plant extract obtained from various plant parts, including leaves, flowers and fruit, is most often used [39,40]. NPs can be seeded very effectively in an extract obtained from plant callus cultures, as they also contain a high diversity and concentration of biomolecules [41].
NPs can also be synthesised biologically in the cells and tissues of independently growing plants (in vivo). The plant just needs to be able to take in the precursor and break it down to nano size. Until now, there have been very few studies in which such a synthesis has been demonstrated with different agricultural plants, including Medicago sativa L. Existing studies claim that the in vivo method should be further researched to find the fastest, simplest and cheapest method for in vivo NP biosynthesis [42,43].
This study used the simplest and cheapest methods to provide and demonstrate the in vivo biosynthesis of Ag and Au NPs in the seedlings of two Medicago sativa L. genotypes, ‘Kometa’ and ‘la Bella’. One of the objectives was to determine which of the two precursor NPs were synthesised more efficiently and whether different selections of alfalfa genotypes influenced NP biosynthesis.
Other studies have reported that Ag and Au NPs affect plant growth; the effect depends on the size, shape and concentration of the NPs. Low and medium concentrations below 20 mg/L easily penetrate plants, reach leaves via vascular tissue, and increase the synthesis and concentration of nitrogen (N), phosphorus (P) and potassium (K) in leaves. However, if higher concentrations of Ag and Au accumulate in the leaves, the defence mechanism at the cell/tissue level is activated in the roots, the proteomic expression changes, antioxidant activity increases, metabolism and reactive oxygen species form, and the total amount of chlorophyll decreases [38].
The results of this study also confirmed that the control plants that did not receive the precursor were healthy, their leaves were bright green, and their roots were light grey in colour. In the experimental groups with any of the precursors at any concentration, the seedling leaves became paler and plant growth suffered. This was especially evident in the samples that had received the highest concentrations of both precursors (AgNO3, 1000 mg/L; HAuCl4, 200 mg/L) for 48 h. Such negative morphological changes could indicate that Ag and Au NPs were successfully synthesised in the samples in this study. AgNO3 is used in agriculture as a growth regulator, which mostly has a positive effect on plant growth, and Au compounds are involved in plant photosynthesis, but toxicity is characteristic only for NPs [34,38].
Relatively high concentrations of the precursor were used in this study. It is possible that higher concentrations of HAuCl4 and AgNO3 stick around the roots of the seedlings and block the root vascular tissue even before the precursor is taken up by the plant. Confocal microscope images also showed that, in the samples that received precursors, their presence was not visible or visible very weakly in the leaves. Ag and Au particles were visible in the root samples of both alfalfa genotypes after 24 or 48 h of exposure to the precursor. It is possible that the technical capabilities of the microscope interfered with obtaining good images; thus, it cannot be claimed that the precursor was not present in the leaves. The presence of the precursor in the plant leaves may be indicated by changes in the maximum fluorescence intensity in all experimental groups compared to the control.
The penetration of both precursors into the green mass of both alfalfa genotypes was confirmed by the results of double-blazed spectrophotometry. As the precursor concentration increased, light absorbance increased for almost all samples compared to the control but decreased for ‘la Bella’ samples that received AgNO3. In general, the results were quite variable. The variability of the results was also confirmed by NanoDrop spectrophotometry, which showed that the presence of both precursors changed the light absorbance in all experimental groups, but both decreased and increased at different concentrations of the precursor.
This study used very young seedlings (only 2 weeks old), while other studies used much older plants (48 days to several months old). Young plants may be more sensitive to precursor- or NP-induced toxicity. Therefore, NP biosynthesis can also be disturbed and difficult. Lower concentrations of precursors should be recommended for future studies [42,43].
According to the confocal microscope images, HAuCl4 penetrated the root tissues of both genotypes after exposure to the precursor for 24 h, but when the exposure was longer, the particles were clearly visible only in the ‘la Bella’ sample. AgNO3 particles were not visible in ‘Kometa’ plants after 24 h of exposure but were visible after 48 h of exposure. In both ‘Kometa’ and ‘la Bella’ samples, the potential synthesis of Ag NPs could take longer than the biosynthesis of Au NPs. In the confocal microscope images, Au particles were visible in 3 different samples, while Ag particles were clearly visible in only two samples. These results indicate that the synthesis of Au NPs is not only faster but also more frequent. According to the confocal microscope results, one of the precursors was clearly visible 3 times in the ‘la Bella’ samples but only 2 times in the ‘Kometa’ samples. However, changes in light fluorescence and absorption were detected in almost all experimental samples; thus, these results did not show which alfalfa genotypes had more efficient biosynthesis.
The particles often formed large agglomerates, which produced bright fluorescence.
This study is significant in that it showed that particles from both HAuCl4 and AgNO3 precursors can penetrate and interact with the young root and leaf cells of two Medicago sativa L. genotypes. Based on the impairment of plant growth after the uptake of precursors and fluorescence intensity changes in confocal microscopy, it can be theoretically stated that Ag and Au NPs might have been synthesised using the in vivo method. This interaction was detected using methods that consume a small number of resources and time.
However, these results are not enough to say absolutely which substances were present in the plant cells, whether they are NPs or still a precursor. It is clearly understood that in vivo biosynthesis studies should be continued and an analysis of the chemical composition of plants should be carried out, which would confirm the presence of NPs. Here, it would be useful to use even more advanced microscopy, such as the scanning electron microscope (SEM) and the transmission electron microscope (TEM), to determine the nano size of one particle.
5. Conclusions
Based on the data obtained in this research, two-week-old seedlings of two Medicago sativa L. genotypes ‘Kometa’ and ‘la Bella’ could absorb both precursors (AgNO3, HAuCl4) into their tissues. The potential in vivo biosynthesis of Ag and Au NPs negatively affected plant growth after precursor uptake. Spectrophotometry methods statistically significantly (P<0.05) confirmed the changes in light absorption compared to the control. Confocal microscopy also showed that particles from the Ag and Au precursors were visible in the roots of both genotypes. However, confocal microscopy was not the most accurate method for NP visualisation, as the magnification needed to be higher. Future studies are needed to provide further updates on NP biosynthesis studies directly with Medicago sativa L. genotypes ‘Kometa’ and ‘la Bella‘ and to make a comparison between them, as other studies have not directly compared these genotypes. Additionally, it is necessary to improve methods of NP visualisation and detection to confirm the synthesis of NPs based on more reliable results, which would provide high-quality microscopy images to determine the size, shape and number of visible particles and clarify which of the Medicago sativa L. genotypes more efficiently biosynthesises Au and Ag NPs. Moreover, it is important to detect NP biosynthesis in older alfalfa plants, which would probably be more similar to the natural conditions in the soil.
Author Contributions
LJ: Experimental design, conceptualisation, methodology, conducting an experiment, writing—original draft. IP: Experimental design, conducting an experiment, review & editing., MJ: Conducting an experiment, review & editing., RG: Providing seeds, review & editing., IK: review & editing. All authors have read and approved the final manuscript.
Funding
This research was funded by Daugavpils University research project No. 14-95/2023/9.
Availability of data and materials
The data presented in this study are available upon request from the corresponding author.
Acknowledgments
The authors are thankful to DANKO Plant Breeding Sp. z o.o., Choryń 27, 64-000 Kościan, Poland for kindly provided seeds. The authors are thankful to the Department of Ecology and Department of Technology, Daugavpils University, especially Ligita Mezaraupe for visualisation of samples with confocal microscopy and Marina Krasovska for sample analysis of double-blazed spectrophotometry with spectrophotometer SHIMADZU UV-2550PC.
Conflicts of Interest
The authors declare that there are no conflicts of interest.
References
- Hawa, A.; Ali, A. A Sagadevan, S.; Wahid, Z. “Silver Nanoparticles in Various New Applications.” In Silver Micro-Nanoparticles - Properties, Synthesis, Characterization, and Applications. IntechOpen, London, UK, 2021, 1-17.
- Singh, C.; Mehata, A.K.; Priya, V.; Malik, A.K.; Setia, A.; Suseela, M.N.L.; Vikas, V., et al. Bimetallic Au–Ag Nanoparticles: Advanced Nanotechnology for Tackling Antimicrobial Resistance. Molecules. 2022; 27(20):7059. [CrossRef]
- Yevale, R.; Khan, N.; Bhadane, S. An overview on nanoparticles. J Drug Delivery Ther. 2019;9(5):171–84. [CrossRef]
- Anik, M.I.; Mahmud, N.; Masud, A.A.; Hasan, M. Gold nanoparticles (GNPs) in biomedical and clinical applications: A review. Nano Select. 3022;4 (3):792-828. [CrossRef]
- Salem, S.S.; Hammad, N.E.; Mohamed, A.A.; El-Dougdoug, W.A. Comprehensive Review of Nanomaterials: Types, Synthesis, Characterization, and Applications. Biointerface Research in Applied Chemistry, 2022; 13(1):41. [CrossRef]
- Jeyaraj, M.; Gurunathan, S.; Qasim, M.; Kang, M.H.; Kim, J.H. A. Comprehensive Review on the Synthesis, Characterization, and Biomedical Application of Platinum Nanoparticles. Nanomaterials. 2019; 9(12):1719. [CrossRef]
- Jiang, Z.; Li, L.; Huang, H.; He, W.; Ming, W. 2022. “Progress in Laser Ablation and Biological Synthesis Processes: “Top-Down” and “Bottom-Up” Approaches for the Green Synthesis of Au/Ag Nanoparticles” International Journal of Molecular Sciences 23, no. 23: 14658. [CrossRef]
- Jamkhande, P.G.; Ghule, N.W.; Bamer, A. H.; Kalaskar, M.G. Metal nanoparticles synthesis: An overview on methods of preparation, advantages and disadvantages, and applications, Journal of Drug Delivery Science and Technology,Volume 53, 2019. [CrossRef]
- Khan, I.; Saeed, K.; Khan, I. Nanoparticles: properties, applications and toxicities. Arabian J Chem. 2019;7(12):908–31. [CrossRef]
- Goswami, P.; Yadav, S.; Mathur, J. Positive and negative effects of nanoparticles on plants and their applications in agriculture. Plant Sci Today. 2019;6(2):232–4. [CrossRef]
- Rathod, R.; Bhawana, P.P. Green synthesis of nanoparticles by mangrove plants and its biomedical application. In: Patra JK, Fraceto LF, Das G, Campos EVR, editors. Green nanoparticles. Nanotechnology in the Life Sciences. Switzerland: Springer Nature Switzerland AG; 2020. p. 308–13.
- Ashiqur, R.; Lin, J.; Jaramillo, F.E.; Bazylinski, D.A.; Jeffryes, C.; Dahoumane, S.A. In vivo biosynthesis of inorganic nanomaterials using eukaryotes—a review. Molecules. 2020;25(14):3246. [CrossRef]
- Bahrulolum, H.; Nooraei, S.; Javanshir, N., et al. Green synthesis of metal nanoparticles using microorganisms and their application in the agrifood sector. J Nanobiotechnol. 2021; 19:86. [CrossRef]
- Chopra, H.; Bibi, S.; Singh, I.; Hasan, M.M.; Khan, M.S.; Yousafi, Q., et al. Green metallic nanoparticles: biosynthesis to applications. Front Bioeng Biotechnol. 2022;10; [CrossRef]
- Alharbi, N.S.; Alsubhi, N.S.; Felimban, A.I. Green synthesis of silver nanoparticles using medicinal plants: characterization and application. J Radiat Res Appl Sci. 2022;15(3):109–24. [CrossRef]
- Ying, S.; Guan, Z.; Ofoegbu, P.C.; Clubb, P.; Rico, C.; He, F.; Hong J. Green synthesis of nanoparticles: current developments and limitations. Environ Technol Innovation. 2022;26(1):102336. [CrossRef]
- Król, A.; Railean-Plugaru, V.; Pomastowski, P.; Buszewski, B. Phytochemical investigation of Medicago sativa L. extract and its potential as a safe source for the synthesis of ZnO nanoparticles: the proposed mechanism of formation and antimicrobial activity. Phytochem Lett. 2019; 31:170–80. [CrossRef]
- Song, K.; Zhao, D.; Sun, H.; Gao, J.; Li, S.; Hu, T.; He, X. Green nanopriming: responses of alfalfa (Medicago sativa L.) seedlings to alfalfa extracts capped and light-induced silver nanoparticles. BMC Plant Biol. 2022; 22:323. [CrossRef]
- Zare-Bidaki, M.; Aramjoo, H.; Mizwari, Z.M.; Mohammadparast-Tabas, P.; Javanshir, R.; Mortazavi-Derazkola, S. Cytotoxicity, antifungal, antioxidant, antibacterial and photodegradation potential of silver nanoparticles mediated via Medicago sativa extract. Arabian J Chem. 2022;15(6):103842. [CrossRef]
- Raeeszadeh, M.; Beheshtipour, J.; Jamali, R.; Akbari, A. The antioxidant properties of alfalfa (Medicago sativa L.) and its biochemical, antioxidant, anti-inflammatory, and pathological effects on nicotine-induced oxidative stress in the rat liver. Oxid Med Cell Longev. 2022; 2022:2691577. [CrossRef]
- Lomelí-Rosales, D.A.; Zamudio-Ojeda, A.; Reyes-Maldonado, O.K.; López-Reyes, M.E. Basulto-Padilla, G.C.; Lopez-Naranjo, E.J., et al. Green synthesis of gold and silver nanoparticles using leaf extract of Capsicum chinense plant. Molecules. 2022;27(5):1692. [CrossRef]
- Iyer, R.I.; Panda, T. Biosynthesis of gold and silver nanoparticles with anti-microbial activity by callus cultures of Michelia champaca L. J Nanosci Nanotechnol. 2016;16(7):7345–57. [CrossRef]
- Anjum, S.; Abbasi, B.H. Thidiazuron-enhanced biosynthesis and antimicrobial efficacy of silver nanoparticles via improving phytochemical reducing potential in callus culture of Linum usitatissimum L. Int J Nanomed. 2016;22(11):715–28. [CrossRef]
- Khan, I.; Bawazeer, S.; Rauf, A.; Qureshi, M.N.; Muhammad, N.; Al-Awthan, Y.S., et al. Synthesis, biological investigation and catalytic application using the alcoholic extract of Black Cumin (Bunium Persicum) seeds-based silver nanoparticles. J Nanostruct Chem. 2022; 12:59–77. [CrossRef]
- Mohamed, T.K.; Widdatallah, M.O.; Ali, M. M.; Alhaj.; A.M.; Elhag, D.E. Green synthesis, characterization, and evaluation of the antimicrobial activity of Camellia sinensis silver nanoparticles. J Nanotechnol. 2021; 2021:2867404. [CrossRef]
- Antony, A.; Shrivastav, N.; Dubey, S.; Acharya, A.; Apoptosis inducing effect on silver nanoparticles synthesized using Magnolia champaca leaf extract on MCF-7 cell line. Int J Curr Pharm Res. 2021;13(3):14–8. [CrossRef]
- Rudrappa, M.; Rudayni, H.A.; Assiri, R.A.; Bepari, A.; Basavarajappa, D.S.; Nagaraja, S.K., et al. Plumeria alba-mediated green synthesis of silver nanoparticles exhibits antimicrobial effect and anti-oncogenic activity against glioblastoma U118 MG cancer cell line. Nanomaterials. 2022;12(3):493. [CrossRef]
- Elemike, E.E.; Onwudiwe, D.C.; Nundkumar, N.; Singh, M.; Iyekowa, O. Green synthesis of Ag, Au and Ag-Au bimetallic nanoparticles using Stigmaphyllon ovatum leaf extract and their in vitro anticancer potential. Mater Lett. 2019; 243:148–52. [CrossRef]
- Marchiol, L.; Mattiello, A.; Pošćić, F.; Giordano, C.; Musetti, R. In vivo synthesis of nanomaterials in plants: location of silver nanoparticles and plant metabolism. Nanoscale Res Lett. 2014; 9:101. [CrossRef]
- Haverkamp, R.G.; Marshall, A.T.; van Agterveld, D. Pick your carats: nanoparticles of gold–silver–copper alloy produced in vivo. J Nanopart Res. 2007; 9:697–700. [CrossRef]
- Tarrahi, R.; Mahjouri, S.; Khataee, A. A review on in vivo and in vitro nanotoxicological studies in plants: a headlight for future targets. Ecotoxicol Environ Saf. 2021; 208:111697. [CrossRef]
- Ying, S.; Guan, Z.; Ofoegbu, P.C.; Clubb, P.; Rico, C.; He, F.; Hong, J. Green synthesis of nanoparticles: current developments and limitations. Environ Technol Innovation. 2022;26(1):102336. [CrossRef]
- Jankovskis, L.; Kokina, I.; Plaksenkova, I.; Jermaļonoka.; M. Impact of Different Nanoparticles on Common Wheat (Triticum aestivum L.) Plants, Course, and Intensity of Photosynthesis. The Scientific World Journal. 2022; 2022:1-8. [CrossRef]
- Plaksenkova, I.; Kokina, I.; Petrova, A.; Jermaļonoka, M.; Gerbreders, V.; Krasovska, M. The impact of zinc oxide nanoparticles on cytotoxicity, genotoxicity, and miRNA expression in barley (Hordeum vulgare L.) seedling. The Scientific World Journal. 2020.pp. 1–13. [CrossRef]
- Rubenina, I.; Gavarane, I.; Kirilova, E.; Mezaraupe, L.; Kirjusina, M. Comparison of the Benzanthrone Luminophores: They Are Not Equalfor Rapid Examination of Parafasciolopsis fasciolaemorpha (Trematoda: Digenea). Biomolecules. 2021;11: 598. [CrossRef]
- Kokina, I.; Plaksenkova, I.; Jermaļonoka, M.; Petrova, A. Impact of iron oxide nanoparticles on yellow medick (Medicago falcata L.) plants. Journal of Plant Interactions. 2020; 15:1, 1-7. [CrossRef]
- Geetha, G.; Harathi, K.; Naidu, C.V. Influence of silver nitrate on in vitro callus induction and indirect shoot organogenesis of Solanum nigrum (L.) an important antiulcer medicinal plant. J. Pharmacy Biol. Sci. 2016; 6: 89-99.
- Khan, S.; Zahoor, M.; Khan, S. R.; Ikram, M.; Islam, N.U. The impact of silver nanoparticles on the growth of plants: The agriculture applications. Heliyon. 2023. 2;9(6): e16928. [CrossRef]
- Haq, T.U.; Ullah, R. Green synthesis and characterization of gold nanoparticles (Au-NPs) using stem extract of Euphorbia neriifolia L. and evaluation of their antibacterial and antifungal potential. Int J Nanosci. 2022;21(1):2250008. [CrossRef]
- Khodadadi, S.; Mahdinezhad, N.; Fazeli-Nasab, B.; Heidari, M.J.; Fakheri, B.; Miri, A. Investigating the possibility of green synthesis of silver nanoparticles using Vaccinium arctostaphlyos extract and evaluating its antibacterial properties. BioMed Res Int. 2021; 2021:5572252. [CrossRef]
- Bernabé-Antonio, A.; Martínez-Ceja, A.; Romero-Estrada, A.; Sánchez-Carranza, J.N.; Columba-Palomares, M.C.; Rodríguez-López, V., et al. Green synthesis of silver nanoparticles using Randia aculeata L. cell culture extracts, characterization, and evaluation of antibacterial and antiproliferative activity. Nanomaterials. 2022; 12:4184. [CrossRef]
- Keshavarzi, M.; Davoodi, D.; Pourseyedi, S.; Taghizadeh, S. The effects of three types of alfalfa plants (Medicago sativa) on the biosynthesis of gold nanoparticles: an insight into phytomining. Gold Bull. 2018; 51:99–110. [CrossRef]
- Marchiol, L.; Mattiello, A.; Pošćić, F.; Giordano, C.; Musetti, R. In vivo synthesis of nanomaterials in plants: location of silver nanoparticles and plant metabolism. Nanoscale Res Lett. 2014; 9:101. [CrossRef]
Figure 1.
The results of light absorption for the ‘Kometa’ genotype after 24 h of exposure to AgNO3 and HAuCl4.
Figure 1.
The results of light absorption for the ‘Kometa’ genotype after 24 h of exposure to AgNO3 and HAuCl4.
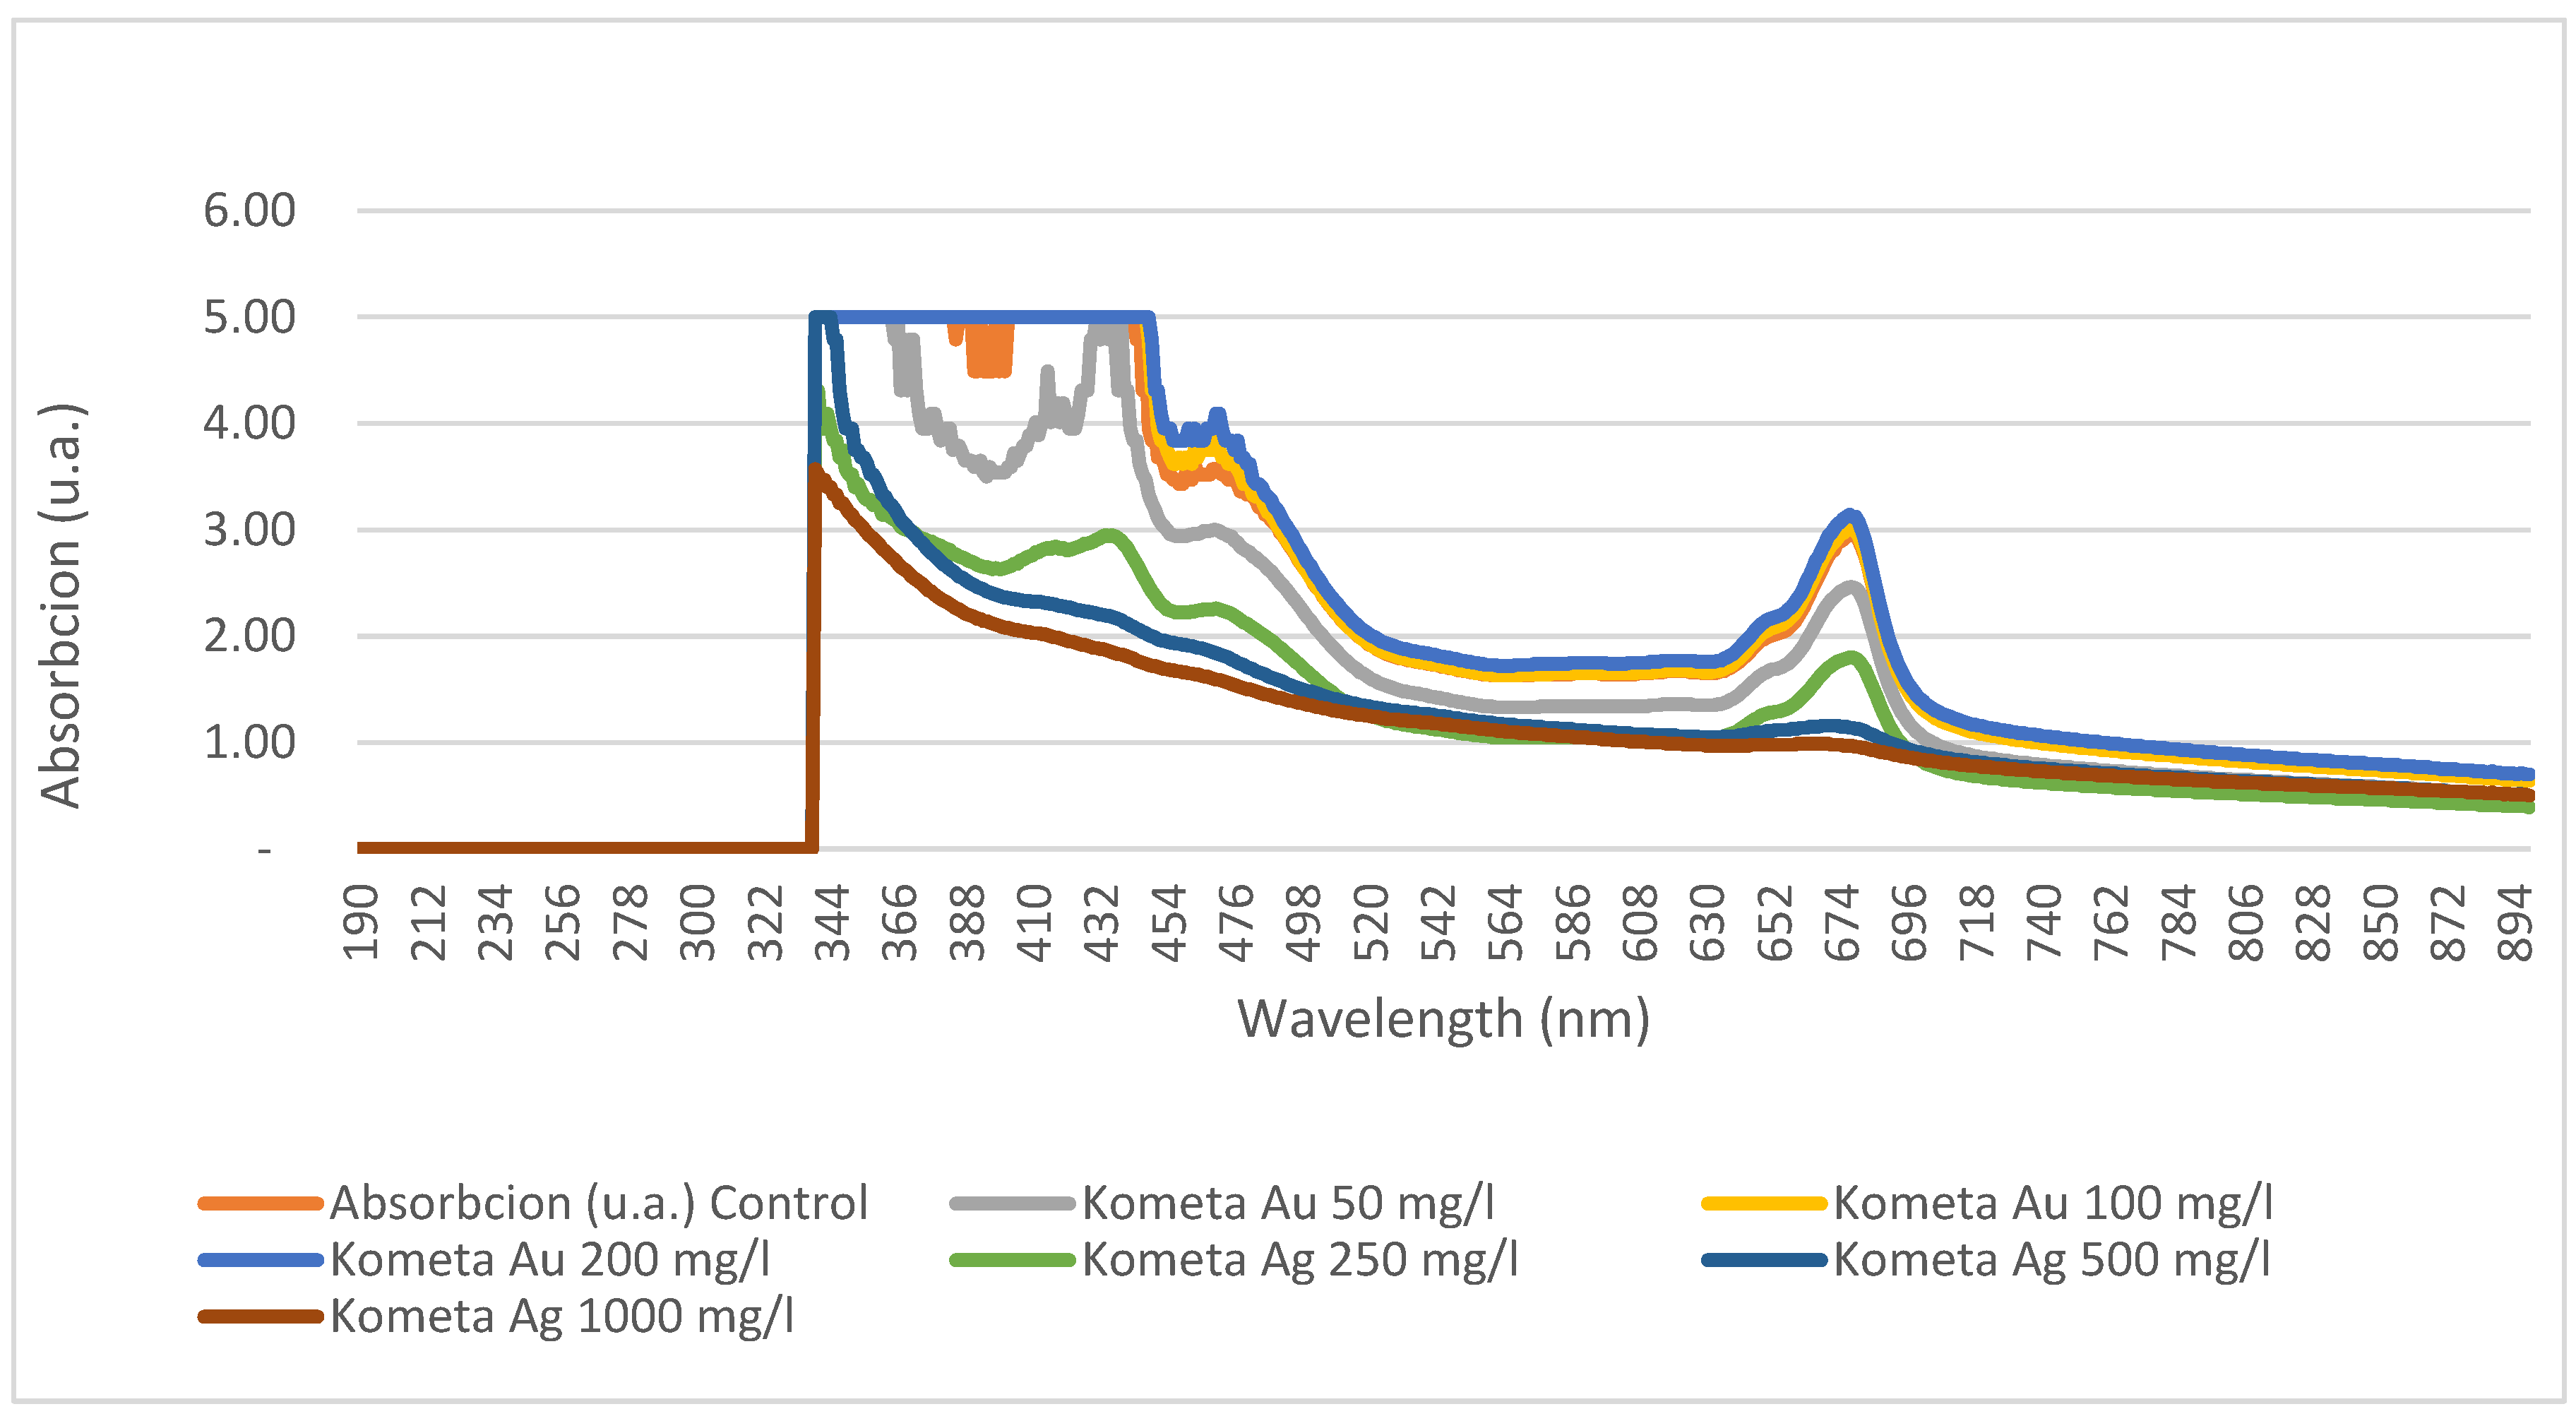
Figure 2.
The results of light absorption for the ‘la Bella’ genotype after 24 h of exposure to AgNO3 and HauCl4.
Figure 2.
The results of light absorption for the ‘la Bella’ genotype after 24 h of exposure to AgNO3 and HauCl4.
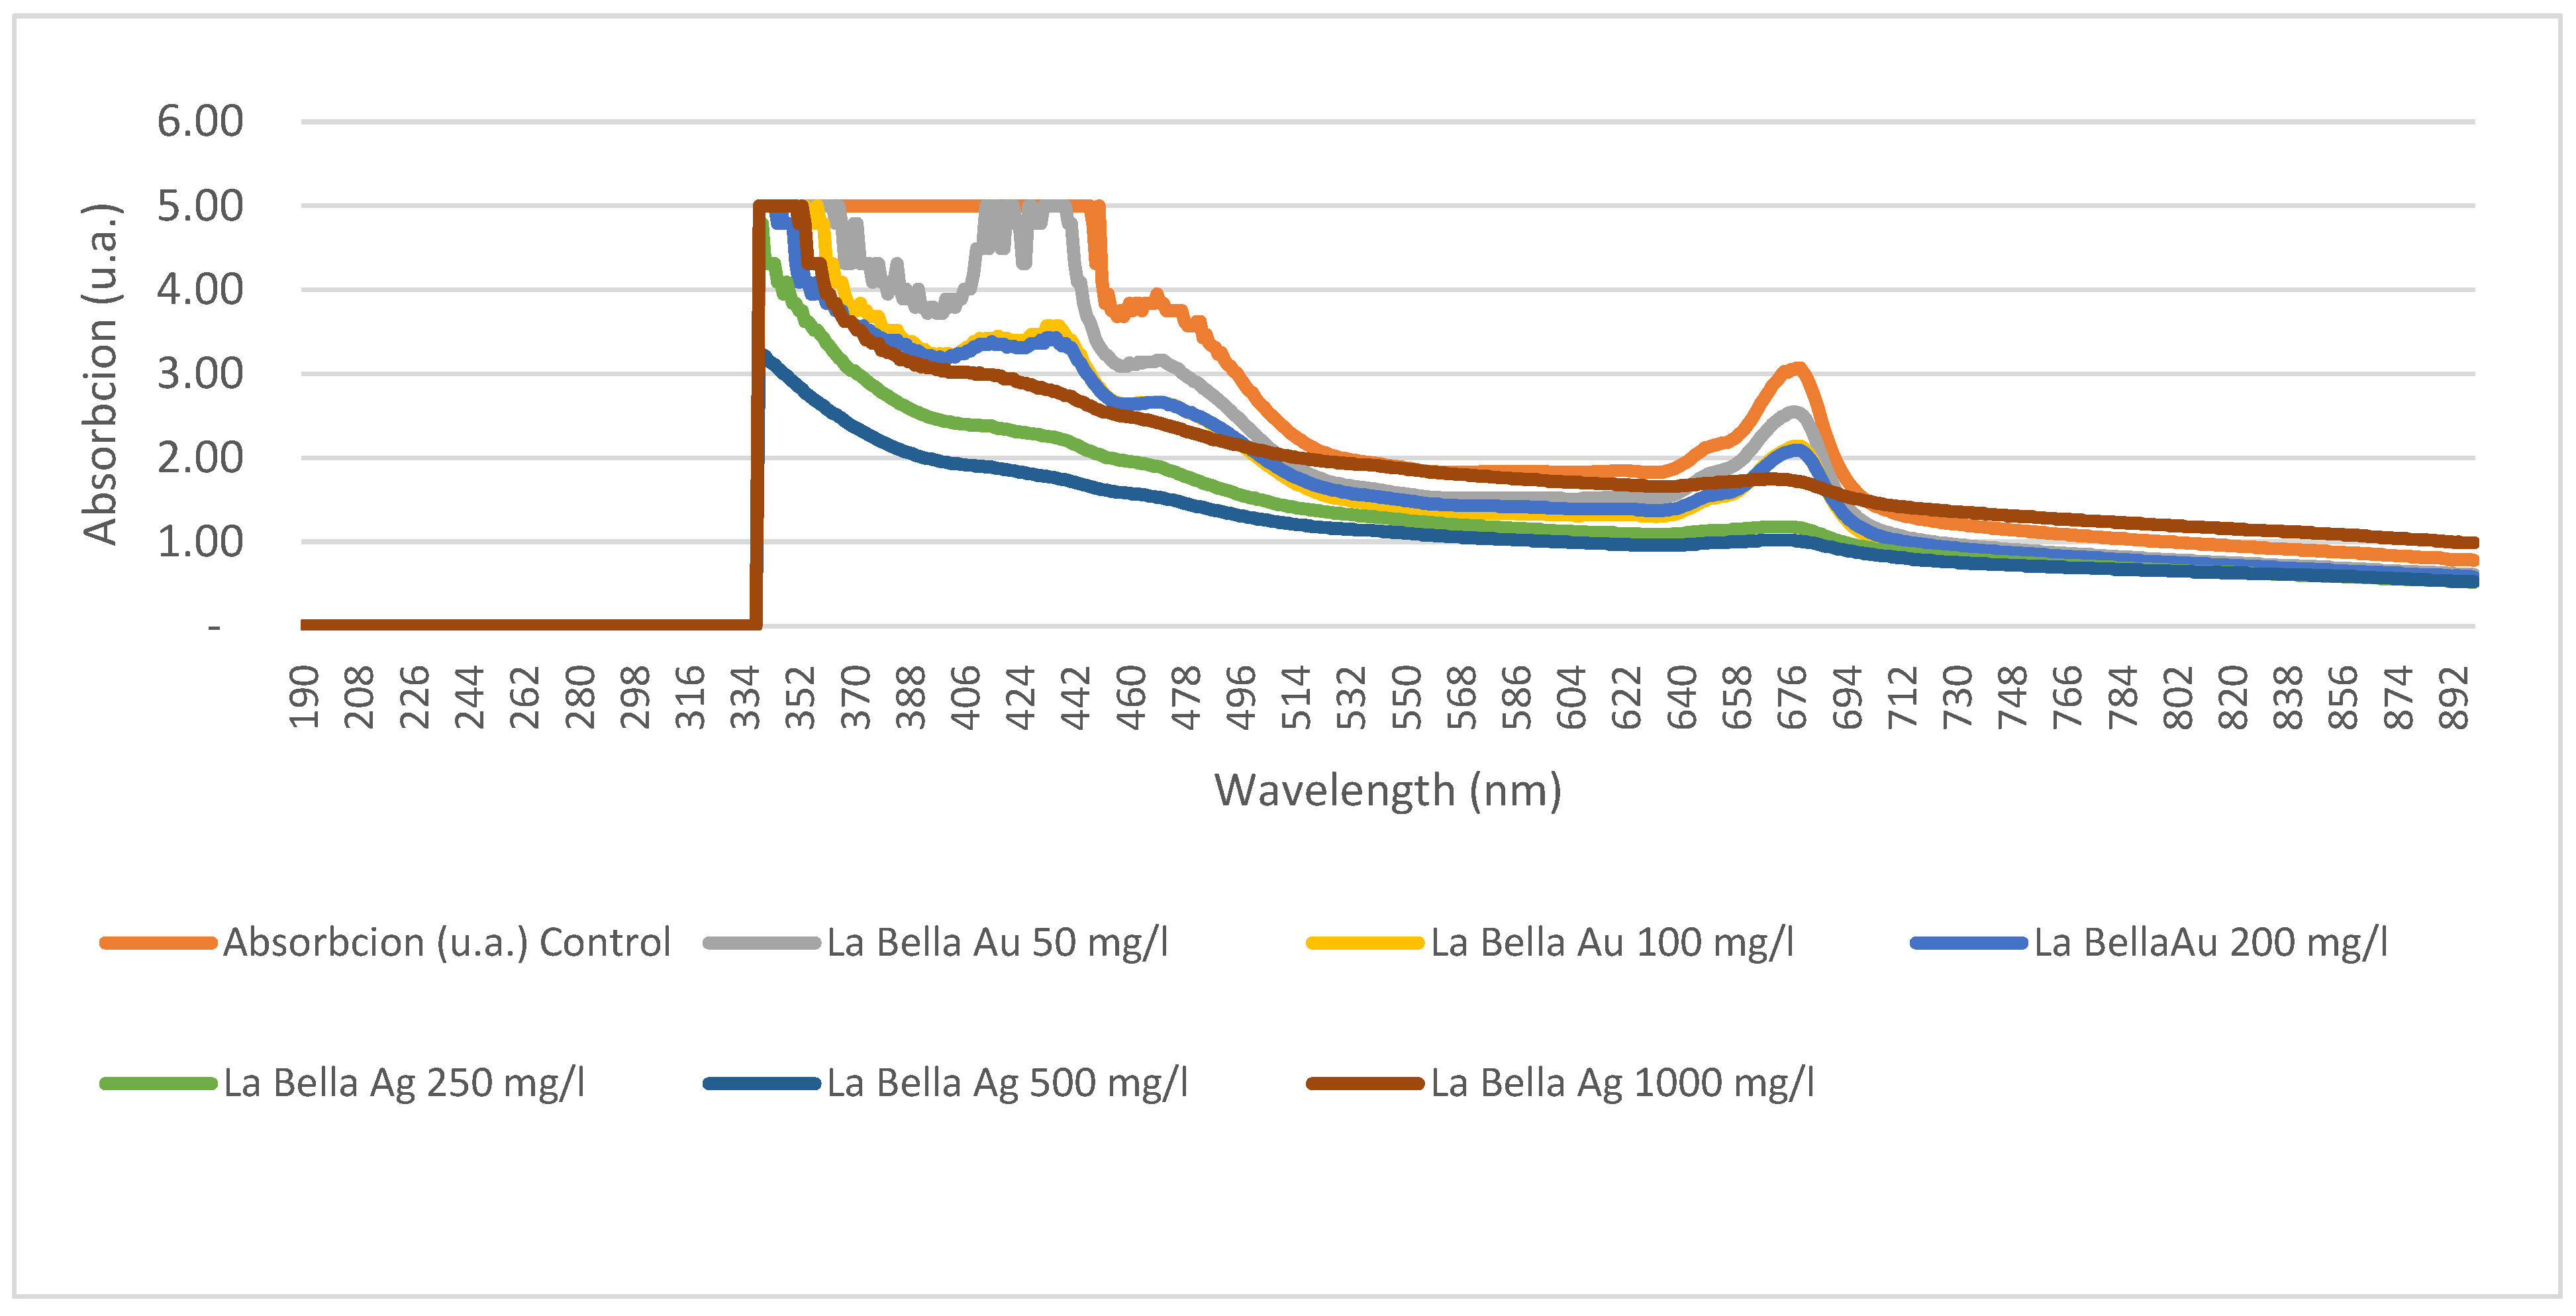
Figure 3.
The results of light absorption for the ‘Kometa’ genotype after 48 h of exposure to AgNO3 and HauCl4.
Figure 3.
The results of light absorption for the ‘Kometa’ genotype after 48 h of exposure to AgNO3 and HauCl4.
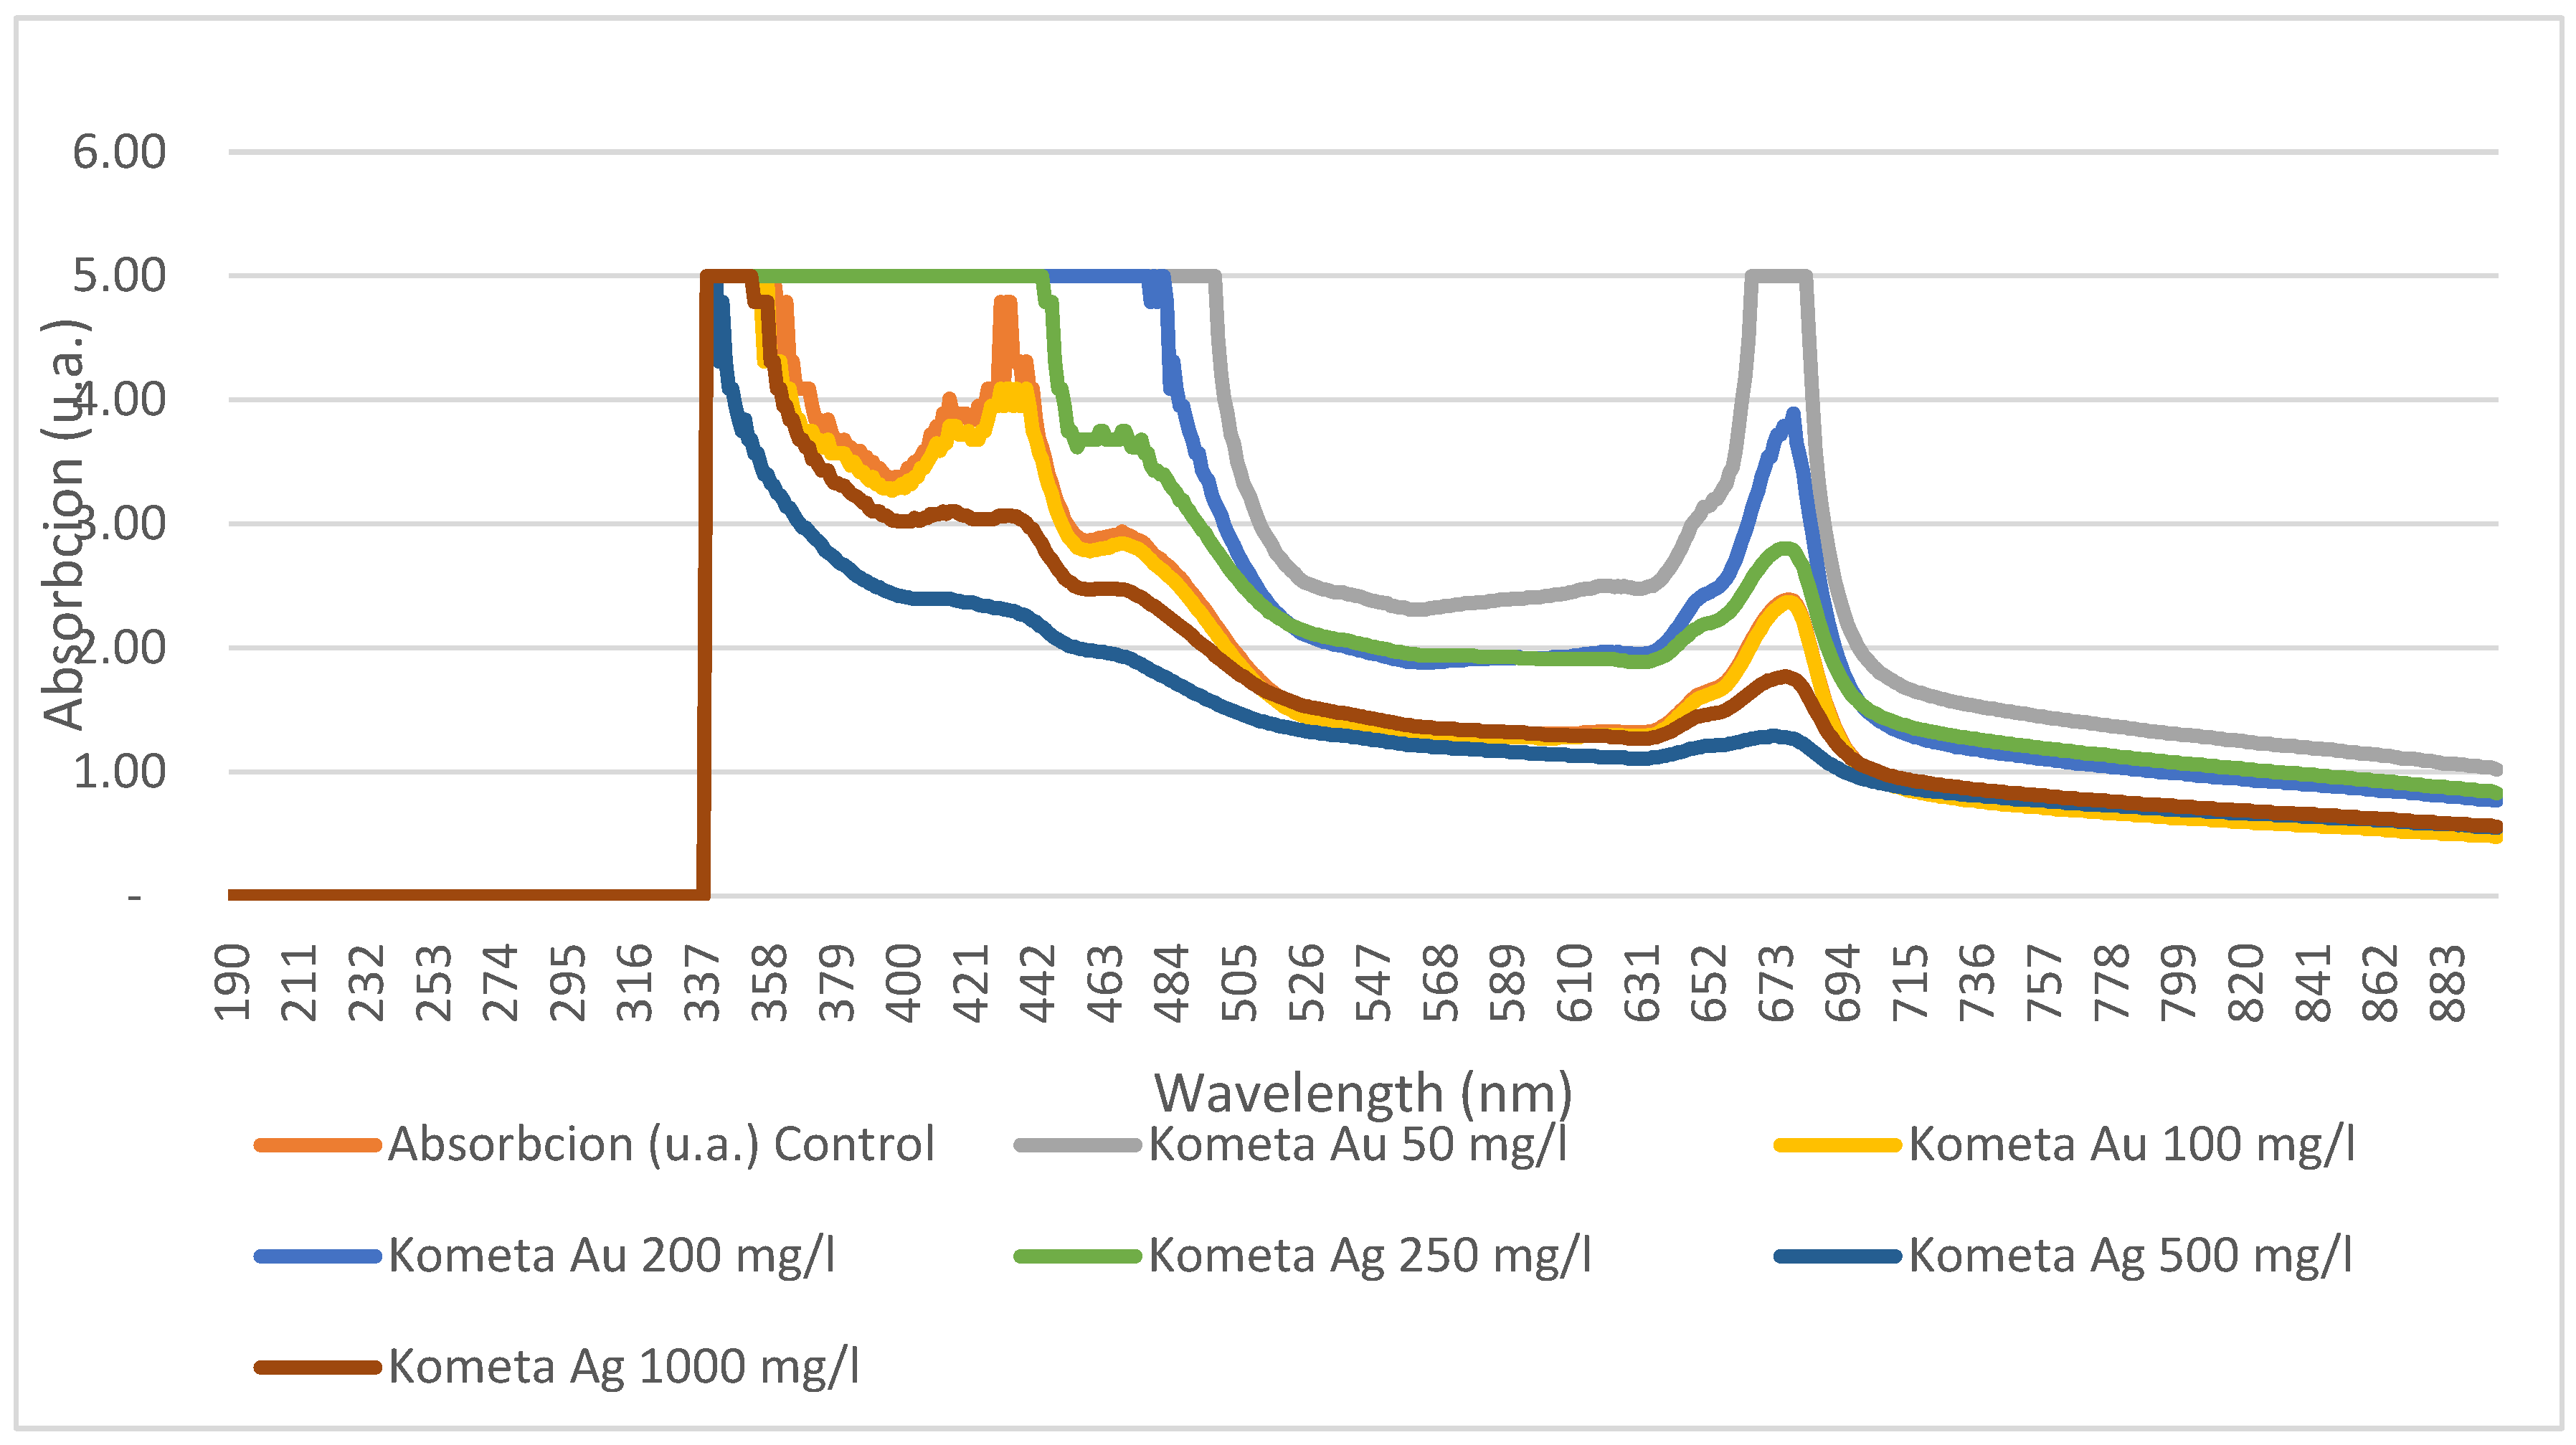
Figure 4.
The results of light absorption for la Bella genotype after 48 h of exposure to AgNO3 and HAuCl4.
Figure 4.
The results of light absorption for la Bella genotype after 48 h of exposure to AgNO3 and HAuCl4.
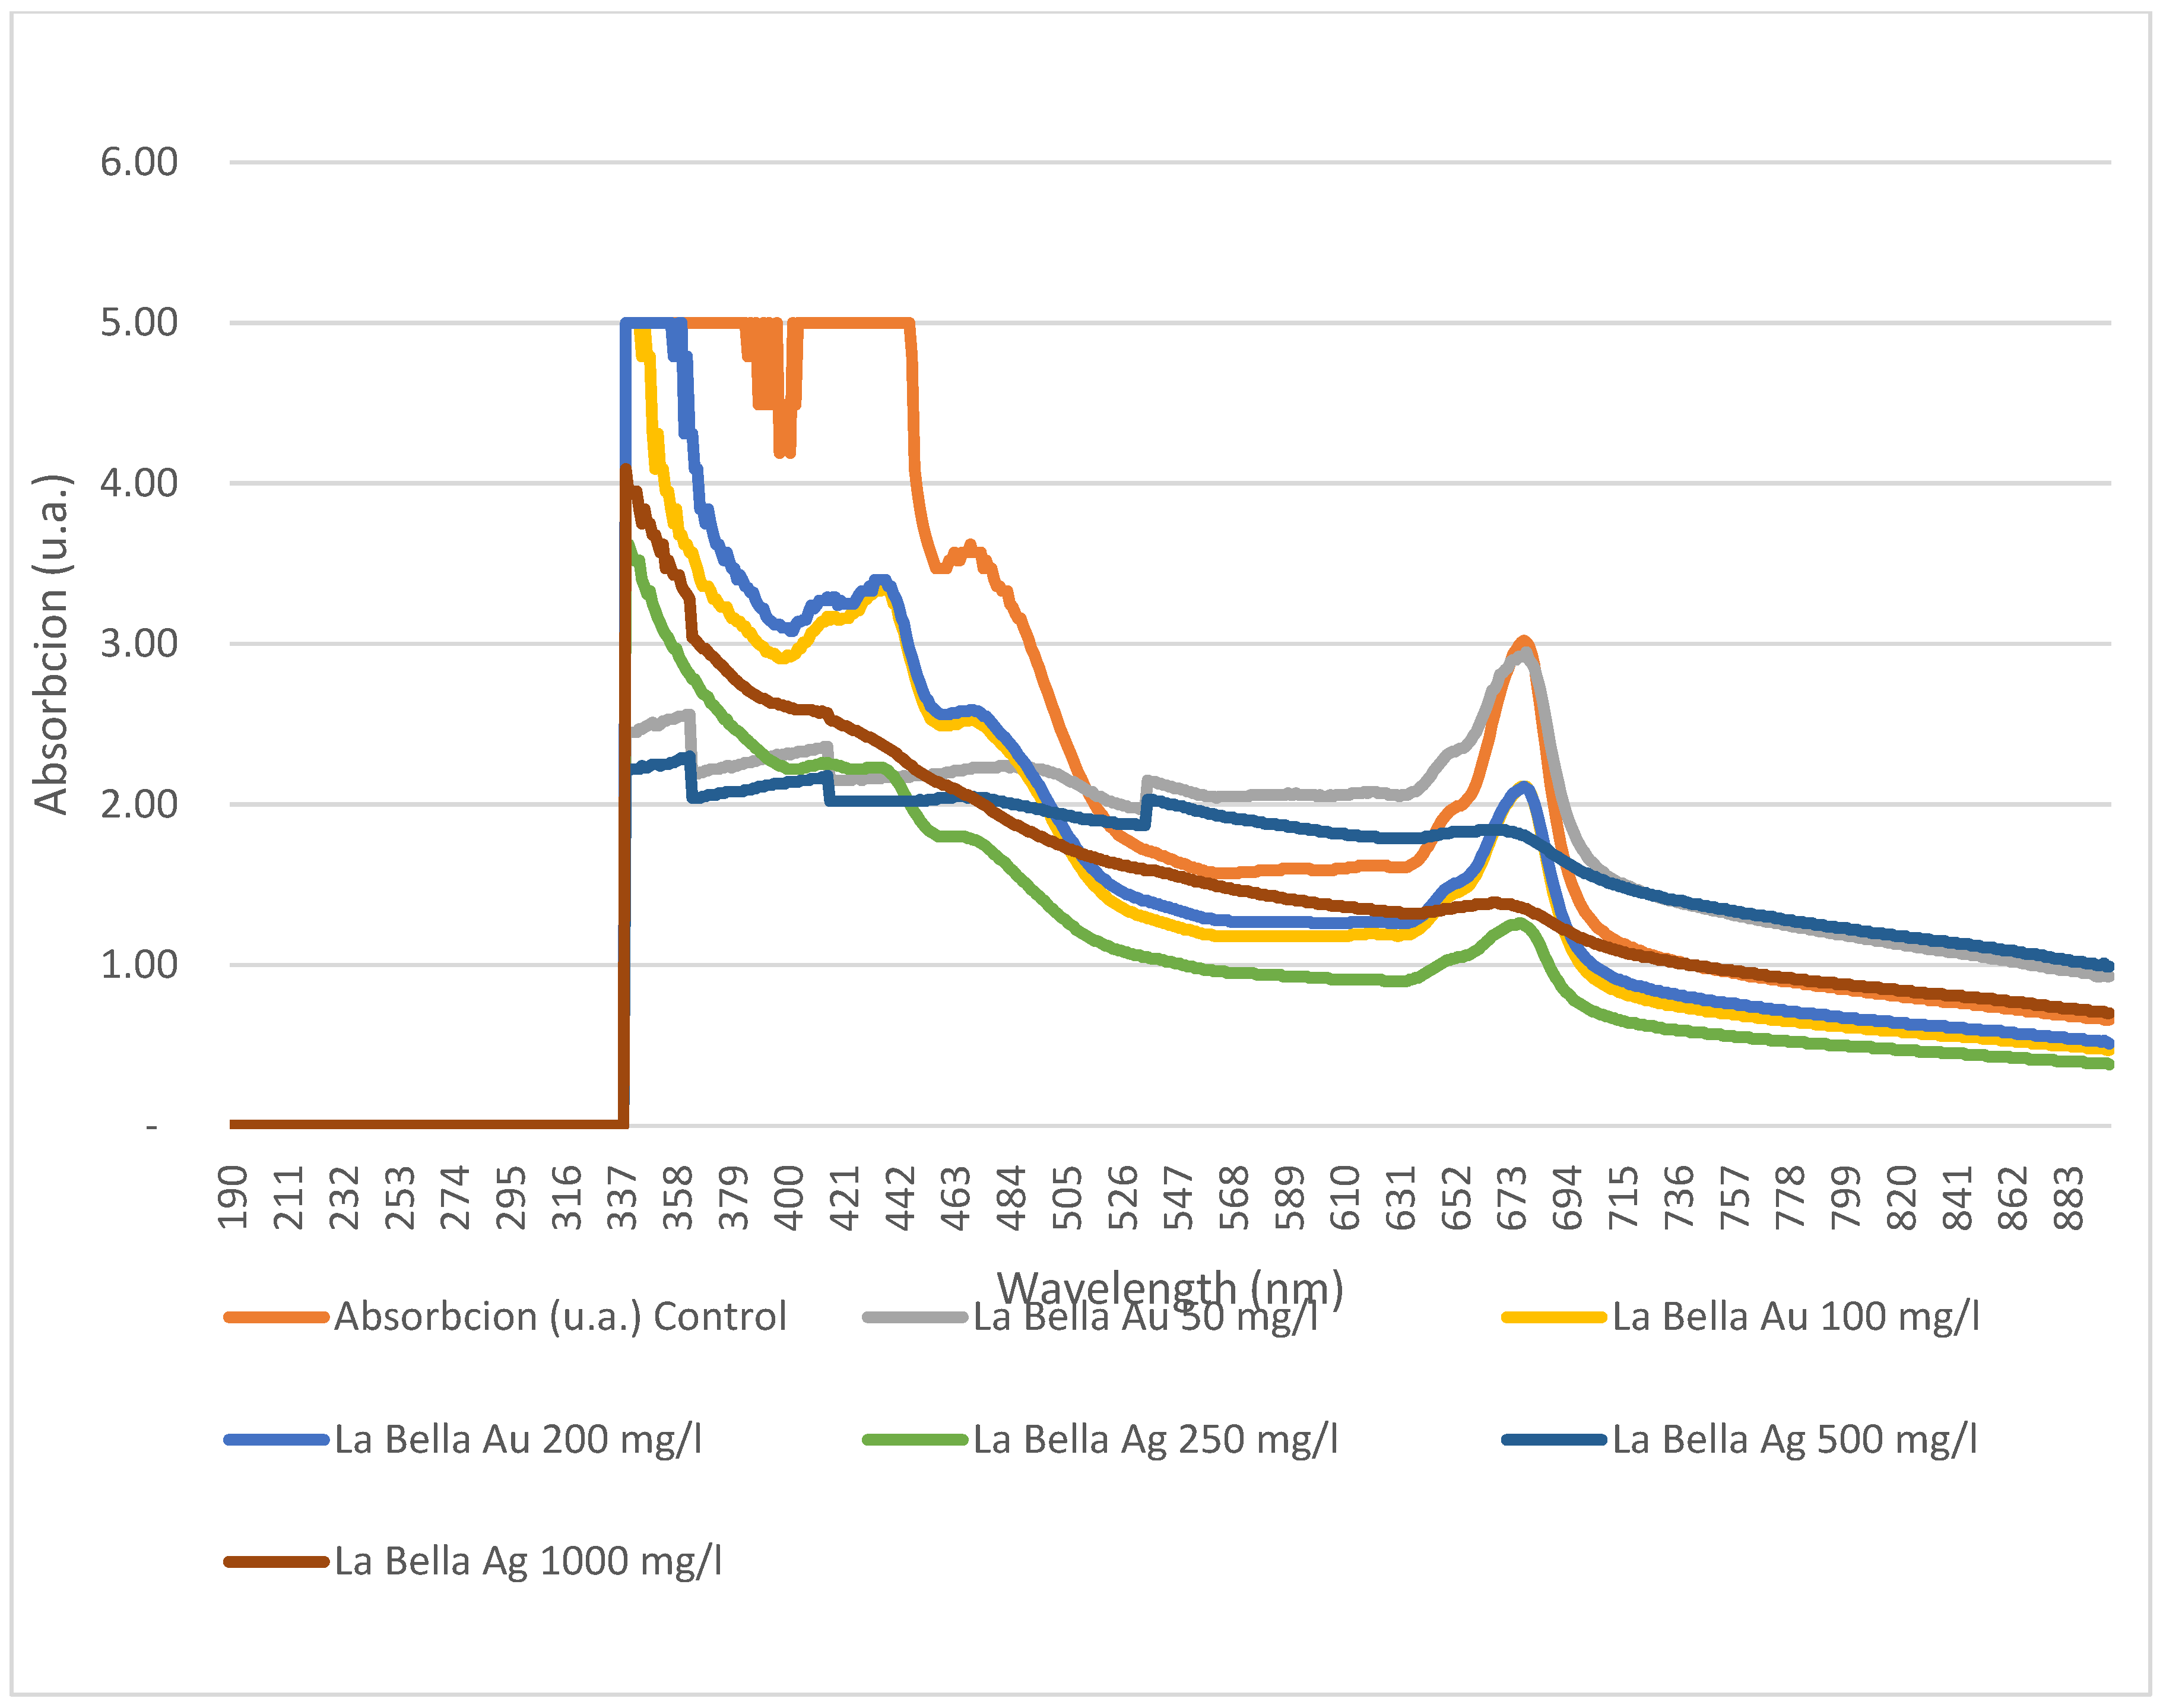

Table 1.
Highest and lowest light absorbance values in ‘Kometa’ after 24 h of AgNO3 and HauCl4 exposure (green indicates results with maximum absorbance values (5.00), yellow - the results in which the absorption values are the highest but do not reach the maximum possible value (5.00), arrow means a decrease in absorption results at the indicated wavelength of light.
| Precursor | Precursor concentration (mg/L) | Light wavelength (nm) | Absorption (u.a.) values |
|---|---|---|---|
| Control | 340–391,399–444 | 5.00 | |
| 392–399 | 4.49 | ||
| 448–899 | ↓ | ||
| 900 | 0.67 | ||
| HAuCl4 | 50 | 340–364, 434, 437, 440 | 5.00 |
| 435–439 | ↓ | ||
| 441–899 | ↓ | ||
| 900 | 0.5 | ||
| 100 | 340–448 | 5.00 | |
| 449–899 | ↓ | ||
| 900 | 0.64 | ||
| 200 | 340–449 | 5.00 | |
| 450–899 | ↓ | ||
| 900 | 0.70 | ||
| AgNO3 | 250 | 341 | 4.31 |
| 340 | 4.09 | ||
| 344 | |||
| 345–899 | ↓ | ||
| 900 | 0.39 | ||
| 500 | 340–345 | 5.00 | |
| 446, 447 | 4.79 | ||
| 348 | 4.31 | ||
| 349 | 4.09 | ||
| 350–899 | ↓ | ||
| 900 | 0.5 | ||
| 1000 | 340 | 4.57 | |
| 341 | 3.52 | ||
| 342, 343 | 3.47 | ||
| 344–899 | ↓ | ||
| 900 | 0.5 | ||
Table 2.
Highest and lowest light absorbance values in ‘la Bella’ after 24 h of AgNO3 and HAuCl4 exposure (green indicates results with maximum absorbance values (5.00), yellow - the results in which the absorption values are the highest but do not reach the maximum possible value (5.00), arrow means a decrease in absorption results at the indicated wavelength of light).
| Precursor | Precursor concentration (mg/L) | Light wavelength (nm) | Absorption (u.a.) values |
|---|---|---|---|
| Control | 340–448, 451 | 5.00 | |
| 449 | 4.79 | ||
| 450 | 4.31 | ||
| 452–899 | ↓ | ||
| 900 | 0.78 | ||
| HAuCl4 | 50 | 340–364, 366, 433–440 | 5.00 |
| 365 | 4.79 | ||
| 367–432 | ↓ | ||
| 441–899 | ↓ | ||
| 900 | 0,61 | ||
| 100 | 340–355, 359 | 5.00 | |
| 356–358 | 4.79 | ||
| 360–899 | ↓ | ||
| 900 | 0.54 | ||
| 200 | 340–345, 447 | 5.00 | |
| 346 | 4.79 | ||
| 348–899 | ↓ | ||
| 900 | 0.58 | ||
| AgNO3 | 250 | 340–341 | 4.79 |
| 342–345 | 4.31 | ||
| 346 | 4.09 | ||
| 345–899 | ↓ | ||
| 900 | 0.52 | ||
| 500 | 340 | 3.25 | |
| 341 | 3.23 | ||
| 341–899 | ↓ | ||
| 900 | 0.53 | ||
| 1000 | 340–352 | 5.00 | |
| 353–899 | ↓ | ||
| 900 | 0.99 | ||
Table 3.
Highest and lowest light absorbance values in ‘Kometa’ after 48 h of AgNO3 and HAuCl4 exposure (green indicates results with maximum absorbance values (5.00), yellow - the results in which the absorption values are the highest but do not reach the maximum possible value (5.00), arrow means a decrease in absorption results at the indicated wavelength of light).
| Precursor | Precursor concentration (mg/L) | Light wavelength (nm) | Absorption (u.a.) values |
|---|---|---|---|
| Control | 340–357, 359 | 5.00 | |
| 358 | 4.79 | ||
| 350 – 899 | ↓ | ||
| 900 | 0.49 | ||
| HAuCl4 | 50 | 340–499 | 5.00 |
| 500–899 | ↓ | ||
| 900 | 1.2 | ||
| 100 | 340–456, 359 | 5.00 | |
| 457–358 | ↓ | ||
| 360–899 | ↓ | ||
| 900 | 0.48 | ||
| 200 | 340–483 | 5.00 | |
| 484–899 | ↓ | ||
| 900 | 0.77 | ||
| AgNO3 | 250 | 340–345 | 5.00 |
| 345–899 | ↓ | ||
| 900 | 0.83 | ||
| 500 | 340–343 | 5.00 | |
| 344–899 | ↓ | ||
| 900 | 0.55 | ||
| 1000 | 340–354 | 5.00 | |
| 355–899 | ↓ | ||
| 900 | 0.56 | ||
Table 4.
Highest and lowest light absorbance values in ‘la Bella’ after 48 h of AgNO3 and HAuCl4 exposure (green indicates results with maximum absorbance values (5.00), yellow - the results in which the absorption values are the highest but do not reach the maximum possible value (5.00), arrow means a decrease in absorption results at the indicated wavelength of light).
| Precursor | Precursor concentration (mg/L) | Light wavelength (nm) | Absorption (u.a.) values |
|---|---|---|---|
| Control | 340–385, 387, 389, 392, 394, 397, 403–447 | 5.00 | |
| 386,388 | 4.79 | ||
| 390–391, 393 | 4.49 | ||
| 395–396 | ↓ | ||
| 398–402 | 4.19 | ||
| 447–899 | ↓ | ||
| 900 | 0.93 | ||
| HAuCl4 | 50 | 340–345 | 2.56 |
| 364–899 | ↓ | ||
| 900 | 0,93 | ||
| 100 | 340–345, 347 | 5.00 | |
| 346 | 4.79 | ||
| 347–899 | ↓ | ||
| 900 | 0.47 | ||
| 200 | 340–357, 360, 361 | 5.00 | |
| 358–359 | 4.79 | ||
| 362–899 | ↓ | ||
| 900 | 0.51 | ||
| AgNO3 | 250 | 340–341 | 3.62 |
| 342–345 | 3.52 | ||
| 346 | 3.40 | ||
| 345–899 | ↓ | ||
| 900 | 0.38 | ||
| 500 | 342 | 2.22 | |
| 364 | 2.30 | ||
| 365–899 | ↓ | ||
| 900 | 0.99 | ||
| 1000 | 340 | 4.09 | |
| 341 | 3.95 | ||
| 342–899 | ↓ | ||
| 900 | 0.70 | ||
Table 5.
Light absorbance data at different wavelengths after 24 h of precursor exposure.
| Genotype | Precursor | Wavelength (nm) | Concentration (mg/L) | Average absorbance |
| ‘Kometa’ | None | 450 | Control | 0.330 |
| ‘Kometa’ | HAuCl4 | 450 | 50 | 0.506*↑ |
| ‘Kometa’ | HAuCl4 | 450 | 100 | 0.336↑ |
| ‘Kometa’ | HAuCl4 | 450 | 200 | 0.327↓ |
| ‘Kometa’ | None | 650 | Control | 0.112 |
| ‘Kometa’ | HAuCl4 | 650 | 50 | 0.168*↑ |
| ‘Kometa’ | HAuCl4 | 650 | 100 | 0.117↑ |
| ‘Kometa’ | HAuCl4 | 650 | 200 | 0.111↓ |
| ‘Kometa’ | None | 470 | Control | 0.112 |
| ‘Kometa’ | AgNO3 | 470 | 250 | 0.089*↓ |
| ‘Kometa’ | AgNO3 | 470 | 500 | 0.065*↓ |
| ‘Kometa’ | AgNO3 | 470 | 1000 | 0.146*↑ |
| ‘Kometa’ | None | 350 | Control | 0.112 |
| ‘Kometa’ | AgNO3 | 350 | 250 | 0.435*↑ |
| ‘Kometa’ | AgNO3 | 350 | 500 | 0.323*↑ |
| ‘Kometa’ | AgNO3 | 350 | 1000 | 0.266*↑ |
| ‘la Bella’ | None | 450 | Control | 0.289 |
| ‘la Bella’ | HAuCl4 | 450 | 50 | 0.306↑ |
| ‘la Bella’ | HAuCl4 | 450 | 100 | 0.216*↓ |
| ‘la Bella’ | HAuCl4 | 450 | 200 | 0.194*↓ |
| ‘la Bella’ | None | 650 | Control | 0.099 |
| ‘la Bella’ | HAuCl4 | 650 | 50 | 0.103↑ |
| ‘la Bella’ | HAuCl4 | 650 | 100 | 0.099= |
| ‘la Bella’ | HAuCl4 | 650 | 200 | 0.069*↓ |
| ‘la Bella’ | None | 470 | Control | 0.269 |
| ‘la Bella’ | AgNO3 | 470 | 250 | 0.195*↓ |
| ‘la Bella’ | AgNO3 | 470 | 500 | 0.282↑ |
| ‘la Bella’ | AgNO3 | 470 | 1000 | 0.199*↓ |
| ‘la Bella’ | None | 350 | Control | 0.463 |
| ‘la Bella’ | AgNO3 | 350 | 250 | 0.354*↓ |
| ‘la Bella’ | AgNO3 | 350 | 500 | 0.512*↑ |
| ‘la Bella’ | AgNO3 | 350 | 1000 | 0.390↓ |
∗indicates a statistically significant difference compared to the control (P<0.05). ↑↓=indicates an increase, decrease, or no change in data compared to the control; bold indicates a statistically insignificant difference compared to the control.
Table 6.
Light absorbance data at different wavelengths after 48 h of precursor exposure.
| Genotype | Precursor | Wavelength (nm) | Concentration (mg/L) | Average absorbance |
| ‘Kometa’ | None | 450 | Control | 0.132 |
| ‘Kometa’ | HAuCl4 | 450 | 50 | 0.295*↑ |
| ‘Kometa’ | HAuCl4 | 450 | 100 | 0.281*↑ |
| ‘Kometa’ | HAuCl4 | 450 | 200 | 0.391*↑ |
| ‘Kometa’ | None | 650 | Control | 0.045 |
| ‘Kometa’ | HAuCl4 | 650 | 50 | 0.099*↑ |
| ‘Kometa’ | HAuCl4 | 650 | 100 | 0.096*↑ |
| ‘Kometa’ | HAuCl4 | 650 | 200 | 0.129*↑ |
| ‘Kometa’ | None | 470 | Control | 0.132 |
| ‘Kometa’ | AgNO3 | 470 | 250 | 0.186↑ |
| ‘Kometa’ | AgNO3 | 470 | 500 | 0.167↑ |
| ‘Kometa’ | AgNO3 | 470 | 1000 | 0.195↑ |
| ‘Kometa’ | None | 350 | Control | 0.045 |
| ‘Kometa’ | AgNO3 | 350 | 250 | 0.283*↑ |
| ‘Kometa’ | AgNO3 | 350 | 500 | 0.320*↑ |
| ‘Kometa’ | AgNO3 | 350 | 1000 | 0.335*↑ |
| ‘la Bella’ | None | 450 | Control | 0.045 |
| ‘la Bella’ | HAuCl4 | 450 | 50 | 0.283*↑ |
| ‘la Bella’ | HAuCl4 | 450 | 100 | 0.320*↑ |
| ‘la Bella’ | HAuCl4 | 450 | 200 | 0.234*↑ |
| ‘la Bella’ | None | 650 | Control | 0.106 |
| ‘la Bella’ | HAuCl4 | 650 | 50 | 0.091↓ |
| ‘la Bella’ | HAuCl4 | 650 | 100 | 0.074*↓ |
| ‘la Bella’ | HAuCl4 | 650 | 200 | 0.073*↓ |
| ‘la Bella’ | None | 470 | Control | 0.293 |
| ‘la Bella’ | AgNO3 | 470 | 250 | 0.157*↓ |
| ‘la Bella’ | AgNO3 | 470 | 500 | 0.142*↓ |
| ‘la Bella’ | AgNO3 | 470 | 1000 | 0.171*↓ |
| ‘la Bella’ | None | 350 | Control | 0.106 |
| ‘la Bella’ | AgNO3 | 350 | 250 | 0.271*↑ |
| ‘la Bella’ | AgNO3 | 350 | 500 | 0.256*↑ |
| ‘la Bella’ | AgNO3 | 350 | 1000 | 0.341*↑ |
∗indicates a statistically significant difference compared to the control (P<0.05). ↑↓=indicates an increase, decrease, or no change in data compared to the control; bold indicates a statistically insignificant difference compared to the control.
Table 7.
The wavelength period of peak light fluorescence intensity in leaf and root cells of ‘Kometa’ and ‘la Bella’ after exposure to precursors.
Table 7.
The wavelength period of peak light fluorescence intensity in leaf and root cells of ‘Kometa’ and ‘la Bella’ after exposure to precursors.
| Genotype | Part of the plant | Precursor | Precursor concentration (mg/L) | Time of precursor exposure (H) | Wavelength period with the highest fluorescence intensity (nm) |
| ‘Kometa’ | Leaf | Control | 24 | 300−350 | |
| Root | 800–900 | ||||
| Leaf | HAuCl4 | 200 | 1600–1150 | ||
| Root | 4000–3500 | ||||
| Leaf | AgNO3 | 1000 | 3250–2750 | ||
| Root | 3750–3500 | ||||
| ‘la Bella’ | Leaf | Control | 850–900 | ||
| Root | 550–650 | ||||
| Leaf | HAuCl4 | 200 | 3750–4000 | ||
| Root | 4000–3500 | ||||
| Leaf | AgNO3 | 1000 | 3750–3500 | ||
| Root | 4000–3750 | ||||
| ‘Kometa’ | Leaf | Control | 48 | 1350–900 | |
| Root | 3000–2250 | ||||
| Leaf | HAuCl4 | 200 | 600–650 | ||
| Root | 2600–2000 | ||||
| Leaf | AgNO3 | 1000 | 2000–1400 | ||
| Root | 3500–3250 | ||||
| ‘la Bella’ | Leaf | Control | 2250–2000 | ||
| Root | 600–400 | ||||
| Leaf | HAuCl4 | 200 | 400–600 | ||
| Root | 2600–2200 | ||||
| Leaf | AgNO3 | 1000 | 1800–1600 | ||
| Root | 3000–2600 | ||||
Disclaimer/Publisher’s Note: The statements, opinions and data contained in all publications are solely those of the individual author(s) and contributor(s) and not of MDPI and/or the editor(s). MDPI and/or the editor(s) disclaim responsibility for any injury to people or property resulting from any ideas, methods, instructions or products referred to in the content. |
© 2024 by the authors. Licensee MDPI, Basel, Switzerland. This article is an open access article distributed under the terms and conditions of the Creative Commons Attribution (CC BY) license (http://creativecommons.org/licenses/by/4.0/).
Copyright: This open access article is published under a Creative Commons CC BY 4.0 license, which permit the free download, distribution, and reuse, provided that the author and preprint are cited in any reuse.


