Submitted:
23 January 2024
Posted:
23 January 2024
You are already at the latest version
Abstract
This article addresses the challenge of simulating rainstorm waterlogging in urban-scale areas where reliable drainage pipe network data is often lacking. Despite existing methods attempting to tackle this issue, there remains a gap in effectiveness. We present a novel approach, the Modified Equivalent Infiltration (MEI) method, building upon the foundation of the Equivalent Infiltration (EI) method. The study focuses on the outer ring area of Shanghai, utilizing data from the "In-Fa" typhoon period for simulation and comparison. Our findings reveal that the MEI method, requiring the same data inputs as the EI method, surpasses its predecessor in both principle and simulation results. Additionally, the MEI method demonstrates robustness in handling rainstorm waterlogging scenarios.
Keywords:
Urban Rainstorm Waterlogging
; Modified Equivalent Infiltration method (MEI)
; Drainage Pipe Data Uncertainty
; Urban resilience
1. Introduction
In recent years, global warming-induced temperature rise has increased the occurrence of extreme precipitation events, coupled with urban development leading to heightened runoff volumes, resulting in more frequent and severe urban flooding globally [1]. With ongoing urbanization and economic growth, the damage from stormwater waterlogging is expected to rise [2,3], prompting a need for effective strategies [4,5]. Addressing waterlogging involves a comprehensive approach, including pre-flooding forecasts, emergency measures, and post-flooding resilience solutions. Central to this is the development of urban rainstorm waterlogging models and numerical simulations to identify high-risk areas and implement timely measures [6,7]. These models provide vital theoretical support for decision-making in urban stormwater flood prevention and mitigation. Generally, coupled models for simulating rainfall waterlogging can be categorized into those simulating flow production processes [8] and those focusing on water distribution based on flow production [9], with the latter requiring indispensable pipe network data.
When doing researches on the community-scale areas, it is easy to obtain the pipe network data and input it into the model, and a number of researchers have made studies. For instance, Li et al. [10] investigated the Yangmei River basin in Tianhe District, Guangzhou City. Similarly, Niu's study [11] encompassed the flight area of an airport, and Qiu et al. [12] concentrated on an old district in Shanghai. Szeląg et al. [13], on the other hand, examined the vicinity of the Si9 canal in Kielce, Poland. However, when expanding the research area into city-scale, there comes to some severe problems [14], for example, credible pipeline network data are neither readily available nor easy to input into the model in urban scale studies.
When dealing with the pipe network data in city-scale area, the problem is actually twofold. On one side, the network data is hard to obtain. In a large number of urban areas, there is no complete data on the pipeline network [15,16]. There are a number of reasons for this, including the fact that the relevant information has been missing from the outset or has been lost over a long period of time for one reason or another, especially given that in some places the pipeline network was constructed decades ago [17]. Or the actual layout of the pipe network not matching the design drawings for various reasons [18], or that there are unrecorded blockages and damages in the network [19,20]. What’s more, it is quite expensive and difficult to onsite measure the drainage network system [18]. On the other side, in city-scale area, the complexity of network data increases, significantly reducing the computational speed of the model. Therefore, in attempts to simulate urban-scale study sites, consideration needs to be given to trade-offs in the pipe network, such as generalising the main pipe network [21,22], by using this approach, the computational costs can be significantly reduced [23]. For example, Wang et al. [24] selected major drainage pipes and simplified minor ones in their simulation of Zhengzhou City, China. Similarly, Yang et al. [25] employed a similar approach in their simulation of rainwater waterlogging in Fengxi New City near Xi'an City in Shaanxi Province, China, simplifying minor pipes while retaining the major drainage pipes. Shrestha et al. [26] followed a similar approach in their study of Phoenix City. This approach is justified by the fact that the data requirements of the coupled model for the simulation of the pipe network are limited to the overflow of the pipe network and not to the entire convergence process [27].
In response to the many problems faced when using pipe network data in the field of urban-scale research, some researchers have attempted to use alternative methods rather than recovering pipe network data, such as the development of synthetic sewerage networks to complement the representation of sewerage systems in urban flood models [28], or using the empirical calibration method of the rainfall comprehensive runoff coefficient [29] , or using community mapping [30], some other researchers have used crowd-sourced data to build models [31]. However, these methods are lacking in hydrology and hydrodynamics principles, therefore, many researchers have proposed corresponding methods based on coupled hydrology-hydrodynamic models, coincidentally, many researchers have replaced the specific drainage network with a parameter called drainage capacity. However, researchers have proposed different approaches on how to substitute this parameter into the model. Some researchers opt to subtract drainage capacity from rainfall [32], while others argue for treating it as an infiltration process, which lead to three methods that are widely used: rainfall reduction method, constant infiltration method, and equivalent infiltration method. In practice, Chen et al. [33] utilized rainfall discounting in their simulations. Chang et al. [34], Leandro et al. [35] used a method of adding drainage capacity into the infiltration process. Wang et al. [36], on the other hand, compared the rainfall discounting method with the constant infiltration method and conclude that the latter produces superior results.
As a matter of fact, all the three methods mentioned above are problematic to a certain extent as far as the principle is concerned. The rainfall reduction method, for instance, produces a rainfall curve that can’t reach a minimum value below zero [36]. This oversimplification disregards the gradual recession of water on the site after the rainfall peak, leading to significant simulation errors. On the other hand, the constant infiltration method converts drainage capacity into a fixed infiltration capacity. While this method can simulate the water recession process following the rainfall peak, it overlooks the temporal changes in the natural infiltration capacity of the site substrate during the actual infiltration process. Consequently, this approach may yield inaccurate results in scenarios where the site substrate exhibits high natural infiltration capacity (e.g., well-landscaped urban areas) or the drainage capacity of the site network is low. As to equivalent infiltration (EI) method, this approach allows the drainage capacity of the pipeline to be influenced by the infiltration curve of the site, an influence that leads to errors that will be explained later.
After analysing the principles, it can be found that among the three methods mentioned above, the equivalent infiltration method is superior to the remaining two. Therefore, this paper chooses to improve the equivalent infiltration method on the basis of the existing research [37] in order to solve the interference brought to the model by the influence of the site infiltration process on the drainage capacity of the pipe network, and proposed a modified equivalent infiltration method (MEI). By using virtual drainage pipes and virtual drainage wells, the MEI method has the same data requirements as the equivalent infiltration method, but with better performance. The method proposed in this study helps to simulate storm waterlogging at urban scale sites where pipe network data are difficult to obtain, and provides a theoretical basis for storm waterlogging prevention and mitigation.
The structure of this article is as follows: section 2 is the principle of MEI method and the evaluation indicators, including the difference between EI and MEI ; section 3 is about the research site and data preprocessing content. In section 4, the error of the model, the comparison between EI and MEI methods, and the influence of well spacing on the simulation results were discussed. And section 5 is conclusion.
2. Materials and Methods
2.1. Principle of the MEI
The MEI method used in this paper also generalises the suppression of site waterlogging by the drainage network into a drainage capacity just as existed methods do. But unlike them, the modified equivalent infiltration method does not superimpose the drainage capacity on the rainfall or infiltration curves, instead, it assumes that there is a virtual drainage pipe in each sub-catchment with upper flow limit. The upper flow limit is equal to the capacity of the drainage system in the sub-catchments. The drainage pipes in the different sub-catchments are independent, and this generalisation allows the principles of the waterlogging simulation model to be fitted as closely as possible in the absence of network data. The different between EI method and MEI method is shown in Figure 1.
Considering that infiltration in the sub-bedding surface is not uniform, a parabola is used for the area distribution of different infiltration intensities [38], and considering Horton’s law, the joint infiltration rate is shown as follow:
Where is the maximum infiltration rate, is the point infiltration rate, i is precipitation rate, n equals to 2.5.
In equation (1), can be considered as a function of the precipitation rate i and the infiltration rate , i.e., . The overall site infiltration rate under the combined effect of site infiltration and pipe network drainage can be expressed as in the equivalent infiltration method, while in the modified method, the combined effect of the two is expressed as , p is drainage capacity, shown in equation (2) and (3):
In equation above, is the combined effect of EI, while is that of MEI. Assuming the constant intensity of infiltration,calculating the relative error between and , the results are surfed in Figure 2.
From Figure 2, it can be seen that as the drainage capacity and rainfall intensity varies, the gap between the joint value of EI and MEI changes as well. As can be seen from line A-B in Figure 2, the relative error stays zero when p is equal to zero, which is well understood because the EI method is indistinguishable from the MEI method when the site drainage intensity is zero. After executed typical scenarios, depending on the drainage capacity and rainfall intensity, this gap varies from over 10% to negative values, thus the error due to combining drainage strength with infiltration strength is not negligible, such as point C, where the relative error is about -20%.
Figure 2 also indicates that the MEI exhibits a lower overflow rate and high joint value when the rainfall intensity is low, for the value of the difference function is negative. However, as the intensity of rainfall increases, there is a reversal in the relationship between the magnitude of the joint value, and the joint value of the MEI becomes lower at this point. Considering the lag in the response of overflow to site waterlogging, this analysis provides insight into the higher total waterlogging area observed for the MEI method after the rainfall peak. Additionally, it explains the observation that the equivalent infiltration method results in more water waterlogging compared to the MEI method prior to the occurrence of the first major rainfall peak. The two phenomena mentioned above will be dealt with later on.
2.2. Evaluation indicators
In this paper, the simulation results are validated using three indicators: the Nash-Sutcliffe efficiency coefficient (NSE), the coefficient of decidability (R2) and the Root Mean Squared Error (RMSE). These three indicators are calculated as follows:
where and are the observed and simulation values of waterlogging depth for site i, and and are the average of the observed and simulation value.
Of these three parameters, the NSE as well as the R2 are used to assess the simulation accuracy of the method, and the RMSE is used to quantify the assessment error.
2.3 Preprocessing of data
Pipe network data include both parameters such as the size and length of underground pipes and parameters related to the location of surface overflow wells. Thus, the lack of credible pipe network data also leads to a lack of well data. For the urban-scale study area where the flood model was applied, the researcher was also no longer able to use specific well locations for sub-basin delineation of the study site using the Thiessen polygon method. In an urban scale study area, the subsurface is predominantly composed of man-made elements; however, it is important to recognize that the presence of other land use types (e.g., forests and grasslands) cannot be ignored. Therefore, considering that the basic condition for the use of the Thiessen polygon method is the isotropic nature of the subsurface of the study site, the division was firstly based on the type of substrate, and then on a secondary level based on selected key points. Given that the distribution of major drainage networks often corresponds to major urban roads [40], the intersections of major roads in the study area were selected as key points for secondary classification.
It is important to note that while the intersections of major roads serve as pivotal points in sub-catchment delineation, they cannot be considered as all well points. This limitation arises due to the increase in flow generated within the sub-catchment as its area expands. If only pivotal points were designated as wells, excessive overflow would occur from a single point, resulting in water depths around the overflow location being higher than actual and the simulated water area being smaller than the real water area. This issue becomes more pronounced with larger sub-catchment areas and higher precipitation intensities.
To address this issue, virtual wells were strategically placed at fixed distances along roads within the study area. This arrangement is based on the assumption that wells are generally located along major roadways and are evenly distributed throughout the site within the city limits. By dispersing the overflow through these virtual wells, the flood distribution across the site is very close to the actual situation, thus reducing the discrepancies mentioned above. Differences in simulation results due to different distribution distances will be discussed later. Therefore, the flow chart of this study is as follows.
3. Case Study
3.1. Research Site
Located in the Yangtze River Delta, Shanghai is subject to a humid subtropical monsoon climate, with abundant precipitation throughout the year and a low-lying, gentle terrain. Heavy rainfall and typhoons have caused varying degrees of flooding and damage to property in Shanghai. In 2005, Typhoon “Metsa” caused heavy rainfall of over 200mm in Xuhui, Changning and Hongkou, resulting in 238 roads in Shanghai being waterlogged to a depth of 20-30cm; from 6th to 8th in October 2013, Typhoon “Fate” caused severe flooding in Shanghai, paralysing traffic and affecting 97,000 people. What’s more the "In-Fa" led to the emergency relocation of 362,000 people from Shanghai, the cancellation of all flights at Pudong and Hongqiao airports.
The research site is the region within the outer ring of Shanghai, with an area of approximately 620 square kilometers and a high degree of urbanization, is Shanghai’s central part. The sub-surface is mostly concrete in built-up areas and asphalt on roads, and the overall permeability of the site is low.
Figure 4.
Research Site Position
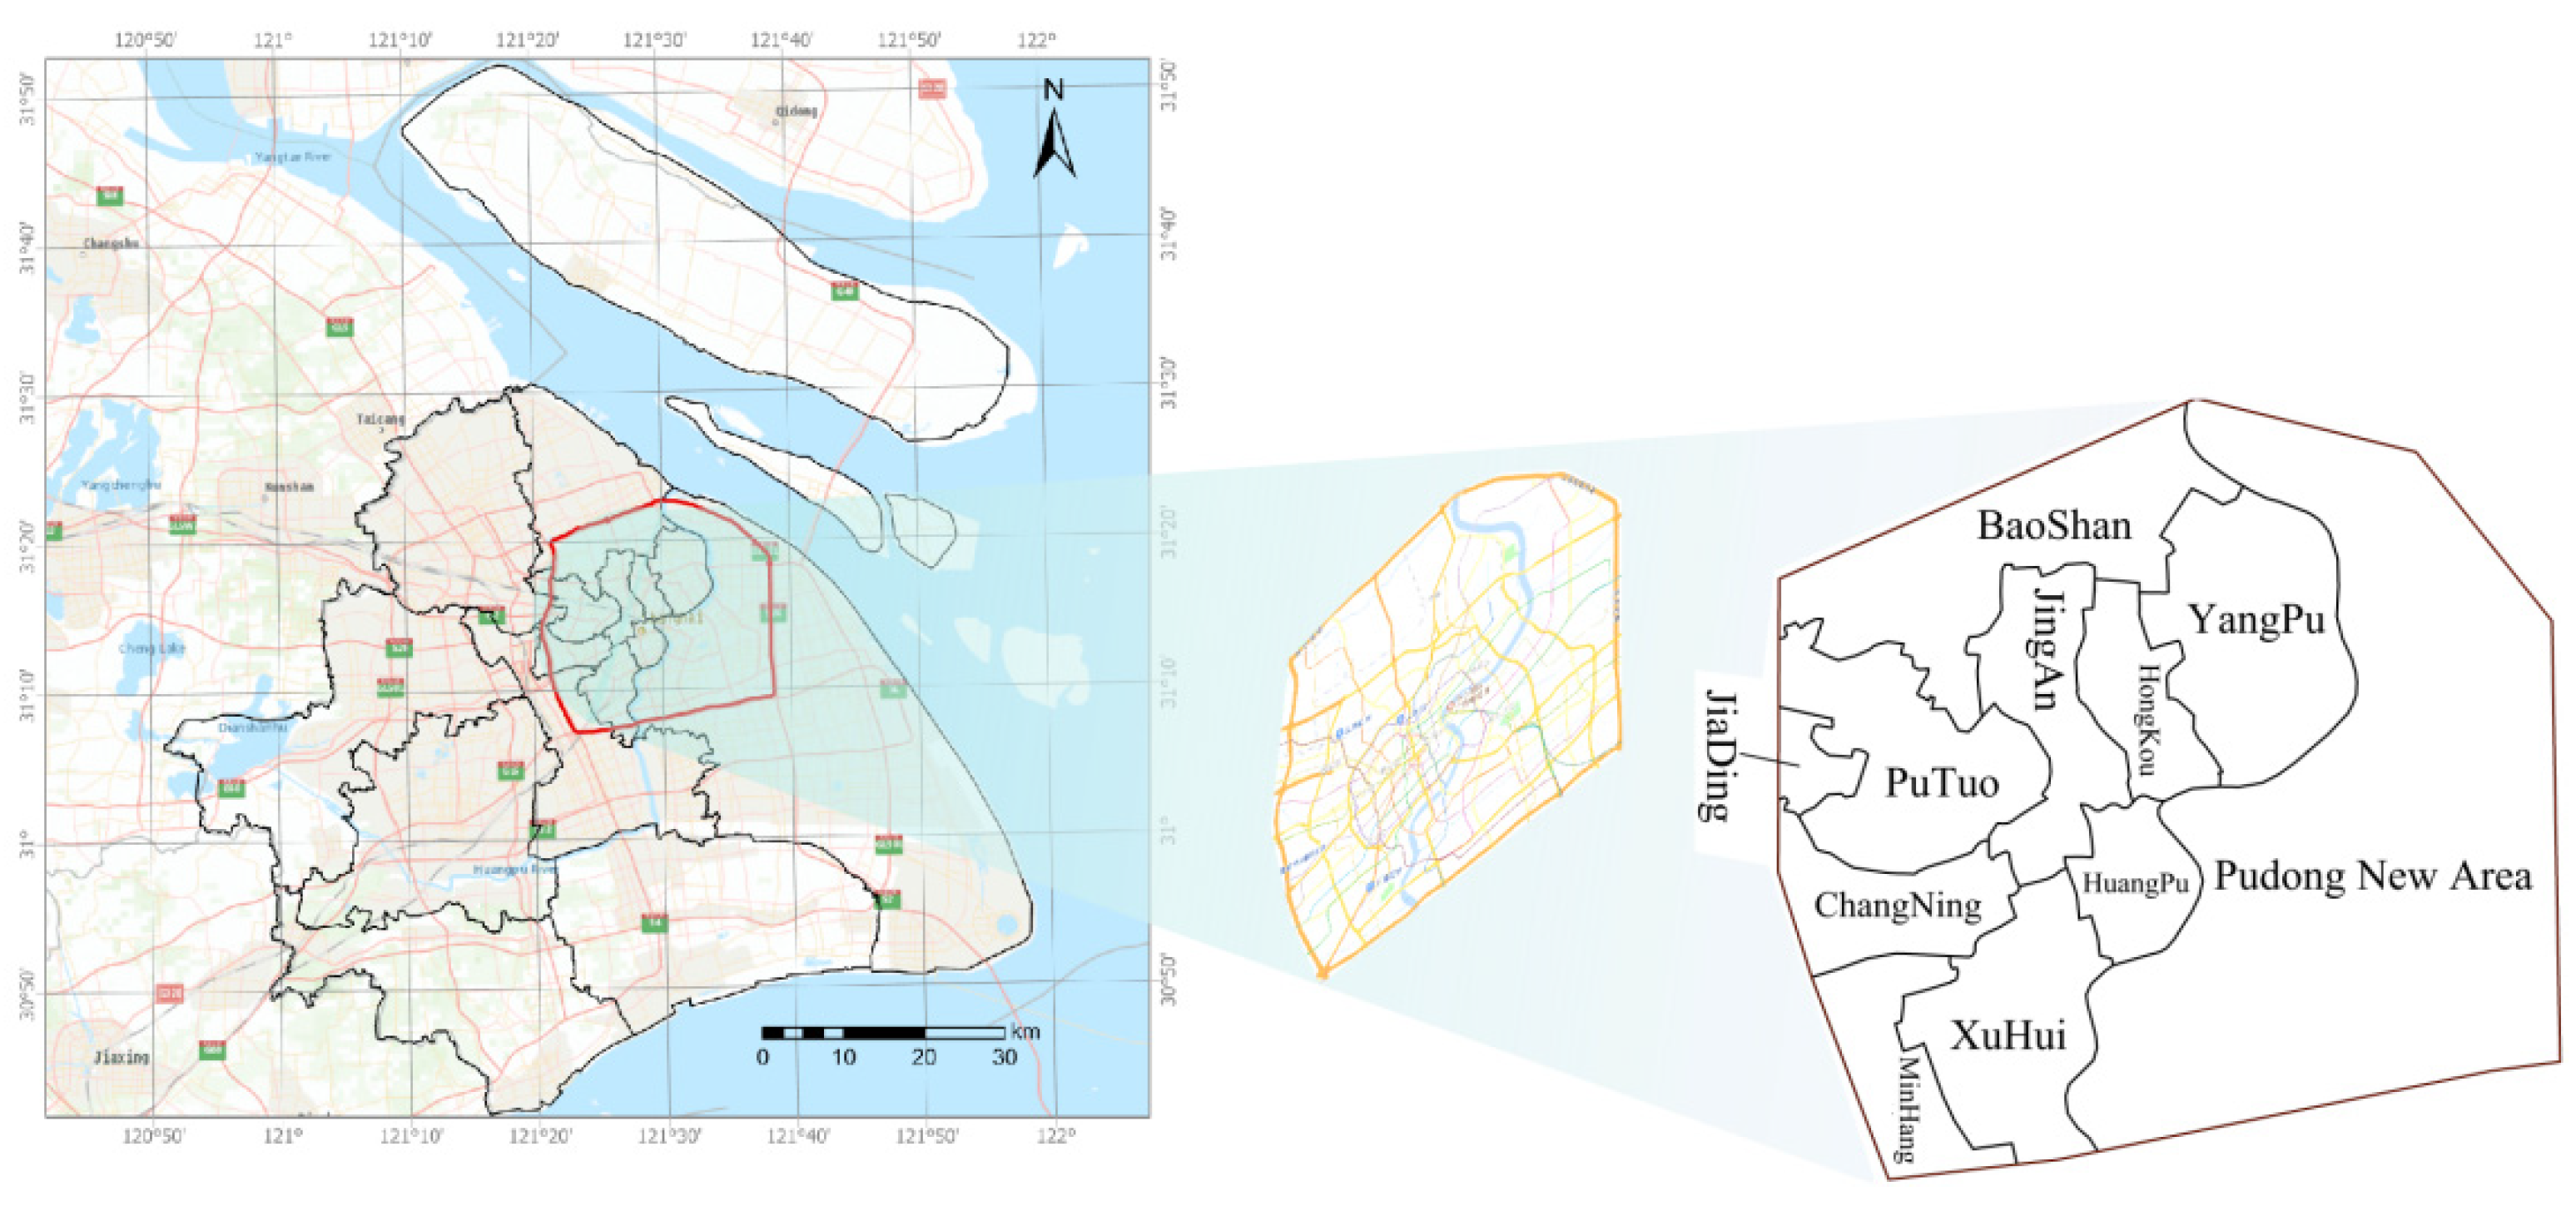
The rainfall data used in the model are measured at various rainfall stations in Shanghai during the landfall of Typhoon "In-Fa" at the end of July 2021. 19 rainfall stations within and outside the Outer Ring Road are involved in the study site. The slope of the sub-catchment is derived from the Shanghai DEM map; the Manning's coefficient of the site is derived from the vector map of Shanghai land use types. In the calculation of the percentage of imperviousness in the sub-catchment area, it is assumed that the road and building coverage area is impervious and the rest of the area is permeable. The road coverage area is calculated by generalising the road width according to the national standard for classification of Class 1-4, and then superimposed with the building coverage area to calculate the impervious area.
Other parameters, such as permeability and the amount of water stored in impermeable depressions, are calibrated from the SWMM user manual and other research results available in Shanghai [39].
In addition to the above parameters, one of the most important parameters of this paper is to study the drainage capacity of each part of the site. Although Shanghai has already planned the drainage capacity of the urban pipe network, as said before, due to the force majeure effects such as the presence of debris in the pipe network, clogging of the drainage wells, and the aging of the pipe network, it is inevitable that the actual drainage capacity of the site will be lower than the theoretical value in case of heavy rainfall, and therefore it is necessary to calibrate the drainage capacity of the site by using the following equations.
where L is the total overflow volume (), l is the overflow volume at a given moment in the sub-catchment (), i is the precipitation volume at a given moment in the sub-catchment, is the joint value at a given moment in the sub-catchment () calculated by equation (3). From this, the inundation process during the first flood of the precipitation process can be used to calibrate the drainage capacity p of different areas of the site in combination with the reported depth of water in each waterlogged cell and the time of occurrence of the waterlogging.
4. Results and discussion
4.1. Model validation
Typhoon "In-Fa" impacted Shanghai from July 25 to July 28, 2021. The simulation process commenced at 2:30 am on July 25 and concluded at 18:30 pm on July 26, encompassing a 40-hour duration of continuous rainfall. By comparing the occurrence of waterlogging reported by the plots within the study site during the precipitation period with the corresponding locations in the simulation results at the corresponding time, a reasonable agreement was observed between the simulation results and the reported waterlogging depths on July 25. Furthermore, a total of 28 reports of waterlogging on the research site were recorded from July 25 to July 26. Among these reports, 12 were documented on July 25 and 16 on July 26. Specifically, 11 reports corresponded to July 25 and 14 reports to July 26. Considering that the reported time may not precisely align with the exact time of waterlogging occurrence, the simulated results for the half-hour period before and after the reported time for certain identified waterlogging areas between July 25 and July 26 were aggregated, leading to the following Table 2.
The error validation results show that the simulation results have some deviations compared with the actual simulation data, the average relative error of the waterlogging depth is about 31.2%. The NSE, R2 and RMSE values during Typhoon "In-Fa" were calculated to be 0.818, 0.945 and 2.741 respectively. It can be concluded that the model is well coupled with the measured data and can effectively simulate the distribution of water accumulation during the rainfall time.
4.2. Comparison between EI and MEI
Figure 7 shows the change of waterlogging area over time, it can be seen that the model successfully simulates the 40-hour rainfall process, capturing four distinct peaks, which are named rain peak A/B/C/D in Figure 7, respectively. The peak A and C exhibit lower intensities, while the B and D demonstrate higher intensities. Figure 8 shows the results obtained after counting waterlogging on the site using the equivalent infiltration method with the same parameter sets as the MEI method and differentiated by the same water depth intervals.
From Figure 8, it can be seen that the trend of change in the waterlogged area of the site obtained by the EI method is similar to that of the MEI method (in Figure 7), but at the peaks of the rainfall it is different from that of the MEI method, especially at peak B and C.
To further compare the difference between EI and MEI in terms of waterlogging area, the total waterlogging area maps obtained from both methods were extracted for comparison and the results obtained are shown in Figure 9.
There is no significant difference in the total flooded area between the two methods at the beginning of the rainfall period (beginning of peak A). However, the difference in total flooded area between the EI method and the MEI method becomes progressively more pronounced after the onset of rainfall peak A. The EI method produces a smaller flooded area while the MEI method produces a larger flooded area. This difference persists for the next three rainfall peaks, and this phenomenon arises because the synergistic value calculated by the EI method is larger than that calculated by the MEI method during the higher rainfall, and therefore the total overflow volume during the rainfall peaks is smaller for the EI method, which in turn leads to a smaller total waterlogging area, as can be seen in Figure 2 in the previous section. It is worth noting that the flooded area from the EI method shows a platform during the second small rainfall peak C, during which no significant peak in the flooded area can be observed. From this, it can be tentatively concluded that the difference in the results obtained by the two methods is influenced heavily by the rainfall intensity.
Based on the three evaluation indicators mentioned in section 2.2, the simulation results of EI method and MEI method are compared, as shown in Figure 10.
As can be seen from the figure above, the average relative error of the results obtained from the two methods is similar. After calculation, the NSE and R2 of the results obtained using the MEI method (0.818,0.945) are better than those obtained using the EI method (0.699,0.918) , as to RMSE, the EI method is 3.436, with 2.741 for MEI method. The indicators indicating that the results obtained using the MEI method are closer to the measured values and the results are more reliable when using the same drainage capacity distribution.
4.3. Effect of spatial distribution of virtual well
The MEI method was used in this study to address the lack of pipe network data. This method involves the construction of virtual pipe within sub-basins to simulate the role of the actual underground drainage network in receiving surface runoff from the site. As stated previously, this method requires the placement of virtual well points within the site at regular intervals to refine the hydraulic interaction between the surface and the pipe network. As a parameter at the discretion of the researcher, this section discusses the effect of the distance of virtual well placement on the simulation results.
To assess the influence of well point placement, virtual wells were positioned at distances of 200m, 300m and 400m for simulation and subsequent comparison. Figure 11 below shows the final results of these simulations, categorised in terms of overflow point distances(m) and waterlogging depth intervals(cm).
The comparison of the different scenarios indicates that the waterlogging area exhibits little variation across depth intervals when the spacing of virtual overflow points is set at 200m, 300m, and 400m. Moreover, since the total hydraulic interaction within the sub-catchment area remains unaffected by the change in spacing of points, it can be inferred that the distribution of waterlogging area demonstrates strong similarity among these scenarios. Consequently, considering the need to enhance calculation efficiency, a spacing of 300m is selected for the placement of virtual overflow points in the modified equivalent infiltration method.
In simulations of rainstorm waterlogging at sites with incomplete pipe network data, it is inevitable that the placement distance of virtual wells is determined by the researcher's own experience. The comparison of the aforementioned scenarios demonstrates that the MEI method consistently produces similar and stable results, even when researchers employ different spacing for the virtual wells if the distance is proper. This highlights the method's robustness.
5. Conclusions
In this paper, the MEI method is proposed to address the issue of missing data on urban drainage networks, as an improvement of the equivalent infiltration method. This method involves extrapolating the drainage ability of a specific pipe network to the drainage capacity of the entire area and replacing specific wells with virtual wells distributed along the roads. The paper includes both qualitative and quantitative tests based on the measured data of Typhoon "In-Fa." Comparing with the equivalent infiltration method, the improved method can better simulate water-prone areas and the severity of water accumulation under rainstorm conditions with same data conditions, both qualitatively and quantitatively. The MEI’s average relative error of water depth is approximately 31%, with an NSE (Nash-Sutcliffe Efficiency) of 0.818, R2 (coefficient of determination) of 0.945, and RMSE (Root Mean Squared Error) of 2.741.
Additionally, by comparing different virtual well distances, it was found that the simulation results of the waterlogging simulation model constructed using the MEI method remained consistent when varied the parameter of virtual wells’ deployment distance in a suitable range, demonstrating the model's stability.
By employing the model using the MEI method, it becomes possible to simulate the spatial distribution and temporal evolution of flooding more accurately. This capability provides theoretical support for various subsequent studies, including accessibility analysis and other related research areas. Addressing these issues and further refining the model will contribute to its overall effectiveness and utility in practical flood control and urban planning applications.
Author Contributions
Conceptualization, L.J. and Z.M.; methodology, L.J.; software, L.J.; validation, Z.M. and J.S.; formal analysis, J.S.; investigation, G.J. and W.X.; resources, Z.M.; data curation, L.J. and Z.M.; writing—original draft preparation, L.J.; writing—review and editing, Z.M., J.S. and L.J.; visualization, G.J., W.X. and Z.H.; supervision, Z.M; project administration, Z.M; funding acquisition, Z.M. All authors have read and agreed to the published version of the manuscript.
Funding
This research was funded by Shanghai Science and Technology Innovation Action Plan Program, China, grant number No. 21DZ1201205
Data Availability Statement
Due to the privacy reasons, the data is not applicable.
Acknowledgments
The authors wish to thank the anonymous reviewers for their constructive comments and valuable suggestions.
Conflicts of Interest
The authors declare no conflicts of interest.
References
- Teng, J.; Jakeman, A.J.; Vaze, J.; Croke, B.F.; Dutta, D.; Kim, S.J.E.M. Flood inundation modelling: A review of methods, recent advances and uncertainty analysis. Environmental modelling & software 2017, 90, 201–216. [Google Scholar]
- Bernet, D.B.; Prasuhn, V.; Weingartner, R. Surface water floods in Switzerland: what insurance claim records tell us about the damage in space and time. Natural Hazards and Earth System Sciences 2017, 17, 1659–1682. [Google Scholar] [CrossRef]
- Moncoulon, D.; Veysseire, M.; Naulin, J.P.; Wang, Z.X.; Tinard, P.; Desarthe, J.; Hajji, C.; Onfroy, T.; Regimbeau, F.; Déqué, M. Modelling the evolution of the financial impacts of flood and storm surge between 2015 and 2050 in France. International Journal of Safety and Security Engineering 2016, 6, 141–149. [Google Scholar] [CrossRef]
- Chen, P.; Wang, Z.; Zeng, Z.; Chen, X. Assessing influence of future urbanization on hydrological process in typical river basin. Journal of Hydroelectric Engineering 2020, 39, 69–77. [Google Scholar]
- Mignot, E.; Li, X.; Dewals, B. Experimental modelling of urban flooding: A review. Journal of Hydrology 2019, 568, 334–342. [Google Scholar] [CrossRef]
- Zhang, Q.; Wu, Z.; Guo, G.; Zhang, H.; Tarolli, P. Explicit the urban waterlogging spatial variation and its driving factors: The stepwise cluster analysis model and hierarchical partitioning analysis approach. Science of the Total Environment 2021, 763, 143041. [Google Scholar] [CrossRef] [PubMed]
- Xia, J.; Zhang, Y.; Liang, C.; Liu, J. Review on urban storm water models. Engineering Journal of Wuhan University 2018, 51, 95–105. [Google Scholar]
- Armson, D.; Stringer, P.; Ennos, A.R. The effect of street trees and amenity grass on urban surface water runoff in Manchester, UK. Urban Forestry & Urban Greening 2013, 12, 282–286. [Google Scholar]
- Skotnicki, M.; Sowiński, M. The influence of depression storage on runoff from impervious surface of urban catchment. Urban Water Journal 2015, 12, 207–218. [Google Scholar] [CrossRef]
- Li, S.; Wang, Z.; Lai, C.; Wu, X.; Chen, X.; Lin, G.; Zhao, J. Hydrological effect simulation of LID-underground integrated pipe corridors in Yangmei River Basin. Water Resources Protection 2022, 38, 68–75. [Google Scholar]
- Niu, Y. (2022). Rainwater Pipe Network and Waterlogging Risk Assessment of Airport Traffic Area Based on SWMM and MIKE Model. Journal of Municipal Technology, 40(07): 242-245(In Chinese).
- Qiu, R.; Cao, J.; Zhang, X. Qiu, R.; Cao, J.; ,Zhang, X. (2022). Parameter Selection of Pollutant Module in SWMM Model Based on the Study of Non-Point Source Pollutants in Old Residential Areas. China Municipal Engineering(04): 51-54(In Chinese).
- Szeląg, B.; Suligowski, R.; De Paola, F.; Siwicki, P.; Majerek, D.; Łagód, G. Influence of urban catchment characteristics and rainfall origins on the phenomenon of stormwater flooding: Case study. Environmental Modelling & Software 2022, 150, 105335. [Google Scholar]
- Guo, K.; Guan, M.; Yu, D. Urban surface water flood modelling–a comprehensive review of current models and future challenges. Hydrology and Earth System Sciences 2021, 25, 2843–2860. [Google Scholar] [CrossRef]
- Kratt, C.B.; Woo, D.K.; Johnson, K.N.; Haagsma, M.; Kumar, P.; Selker, J.; Tyler, S. Field trials to detect drainage pipe networks using thermal and RGB data from unmanned aircraft. Agricultural Water Management 2020, 229, 105895. [Google Scholar] [CrossRef]
- Okwori, E.; Pericault, Y.; Ugarelli, R.; Viklander, M.; Hedström, A. Data-driven asset management in urban water pipe networks: a proposed conceptual framework. Journal of Hydroinformatics 2021, 23, 1014–1029. [Google Scholar] [CrossRef]
- Sitzenfrei, R.; Möderl, M.; Rauch, W. Assessing the impact of transitions from centralised to decentralised water solutions on existing infrastructures–Integrated city-scale analysis with VIBe. Water research 2013, 47, 7251–7263. [Google Scholar] [CrossRef] [PubMed]
- Tscheikner-Gratl, F.; Caradot, N.; Cherqui, F.; Leitão, J.P.; Ahmadi, M.; Langeveld, J.G.; Le Gat, Y.; Scholten, L.; Roghani, B.; Rodríguez, J.P. Sewer asset management–state of the art and research needs. Urban Water Journal 2019, 16, 662–675. [Google Scholar] [CrossRef]
- Mohammadiun, S.; Yazdi, J.; Hager, J.; Salehi Neyshabouri SA, A.; Sadiq, R.; Hewage, K.; Alavi Gharahbagh, A. Effects of bottleneck blockage on the resilience of an urban stormwater drainage system. Hydrological Sciences Journal 2020, 65, 281–295. [Google Scholar] [CrossRef]
- Barton, N.A.; Hallett, S.H.; Jude, S.R. The challenges of predicting pipe failures in clean water networks: a view from current practice. Water Supply 2022, 22, 527–541. [Google Scholar] [CrossRef]
- Chang, X.; Xu, Z.; Zhao, G.; Du, L. (2016). Urban rainfall-runoff simulations and assessment of low impact development facilities using swmm model—a case study of qinghe catchment in beijing. Journal of Hydroelectric Engineering, 35(11):84-93.
- Ma, M.; Li, J.; Deng, C. Analysis of urban waterlogging and pollution load based on swmm model. Journal of Hydroelectric Engineering 2017, 36, 62–72. [Google Scholar]
- Wu, L.; Tajima, Y.; Sanuki, H.; Shibuo, Y.; Furumai, H. A novel approach for determining integrated water discharge from the ground surface to trunk sewer networks for fast prediction of urban floods. Journal of Flood Risk Management 2022, 15, e12773. [Google Scholar] [CrossRef]
- Wang, H.; Hu, Y.; Guo, Y.; Wu, Z.; Yan, D. Urban flood forecasting based on the coupling of numerical weather model and stormwater model: A case study of Zhengzhou city. Journal of Hydrology: Regional Studies 2022, 39, 100985. [Google Scholar] [CrossRef]
- Yang, Y.; Li, J.; Huang, Q.; Xia, J.; Li, J.; Liu, D.; Tan, Q. Performance assessment of sponge city infrastructure on stormwater outflows using isochrone and SWMM models. Journal of Hydrology 2021, 597, 126151. [Google Scholar] [CrossRef]
- Shrestha, A.; Mascaro, G.; Garcia, M. Effects of stormwater infrastructure data completeness and model resolution on urban flood modeling. Journal of Hydrology 2022, 607, 127498. [Google Scholar] [CrossRef]
- Liang, Q.; Smith, L.; Xia, X. New prospects for computational hydraulics by leveraging high-performance heterogeneous computing techniques. Journal of Hydrodynamics 2016, 28, 977–985. [Google Scholar] [CrossRef]
- Dasallas, L.; An, H.; Lee, S. Developing synthetic sewer pipe system for data-scarce domains in application for urban flood modeling. Hydrology Research 2023, 54, 1387–1406. [Google Scholar] [CrossRef]
- Xu, H.; Wang, Y.; Fu, X.; Wang, D.; Luan, Q. Urban Flood Modeling and Risk Assessment with Limited Observation Data: The Beijing Future Science City of China. International Journal of Environmental Research and Public Health 2023, 20, 4640. [Google Scholar] [CrossRef]
- Petersson, L.; Ten Veldhuis, M.C.; Verhoeven, G.; Kapelan, Z.; Maholi, I.; Winsemius, H.C. Community mapping supports comprehensive urban flood modeling for flood risk management in a data-scarce environment. Frontiers in earth science 2020, 8, 304. [Google Scholar] [CrossRef]
Figure 1.
Comparison of the principles((a) for the MEI method and (b) for the EI method).
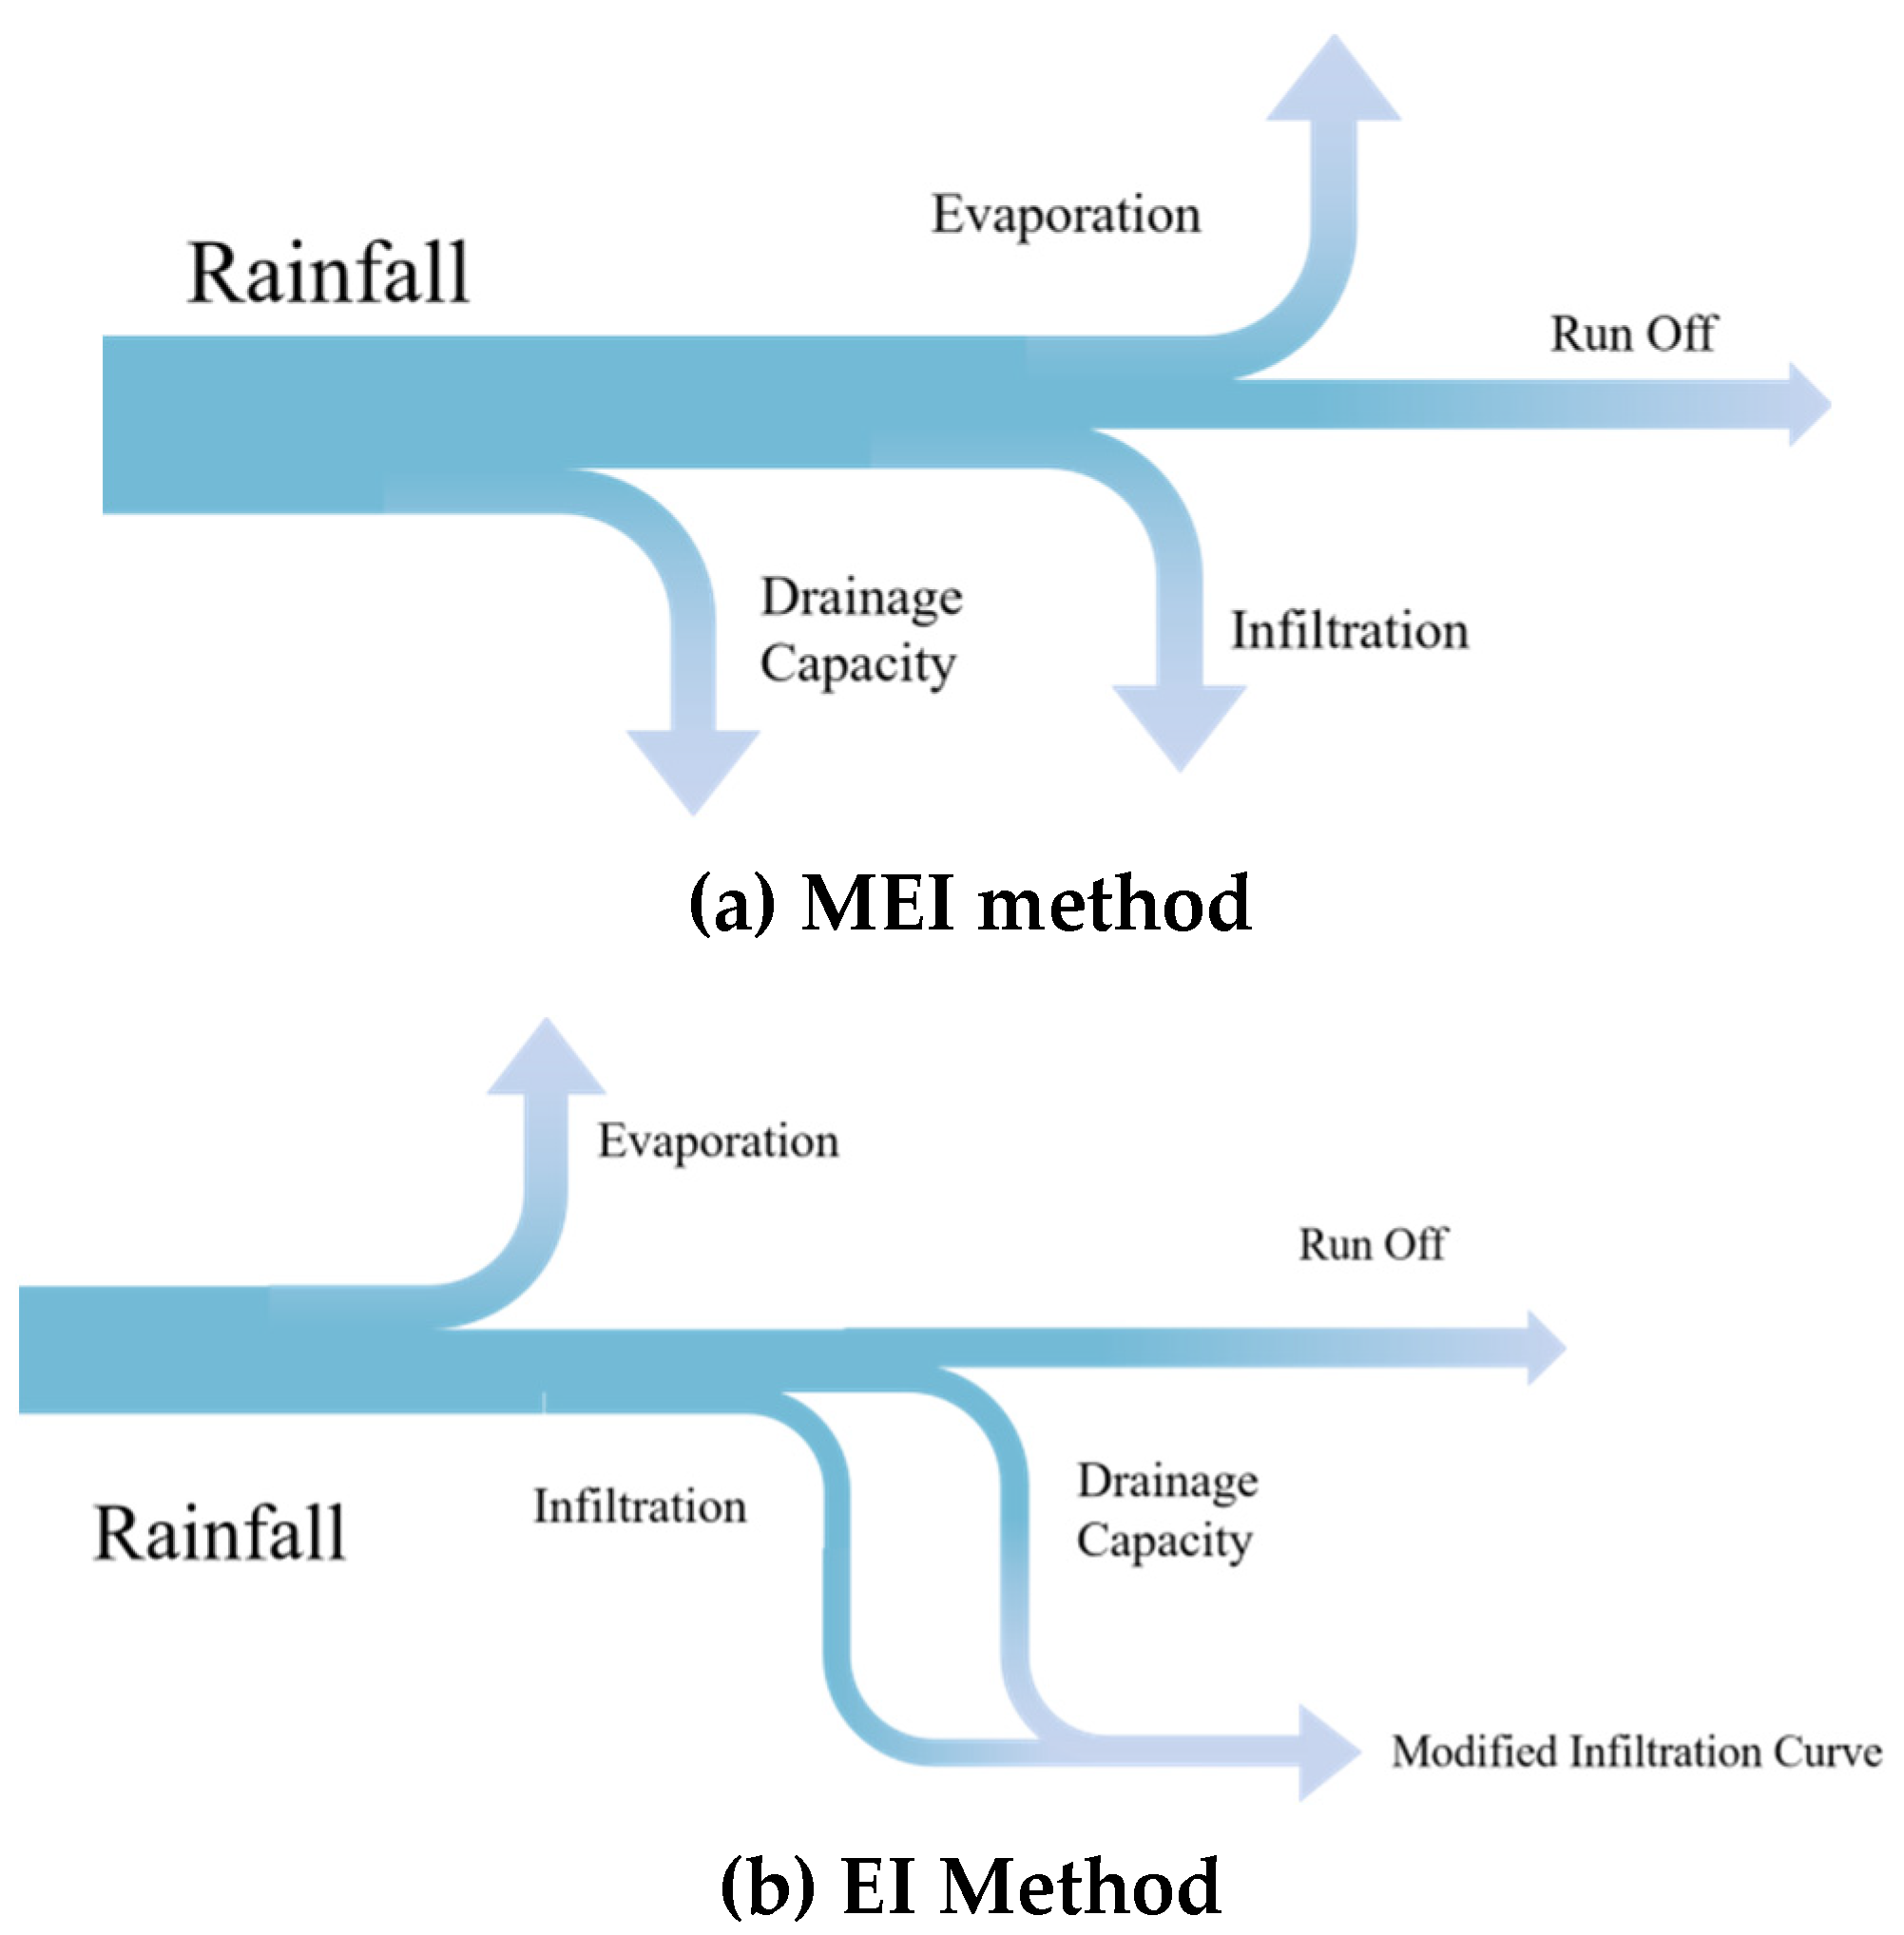
Figure 2.
Comparison of joint effects of drainage capacity and infiltration.
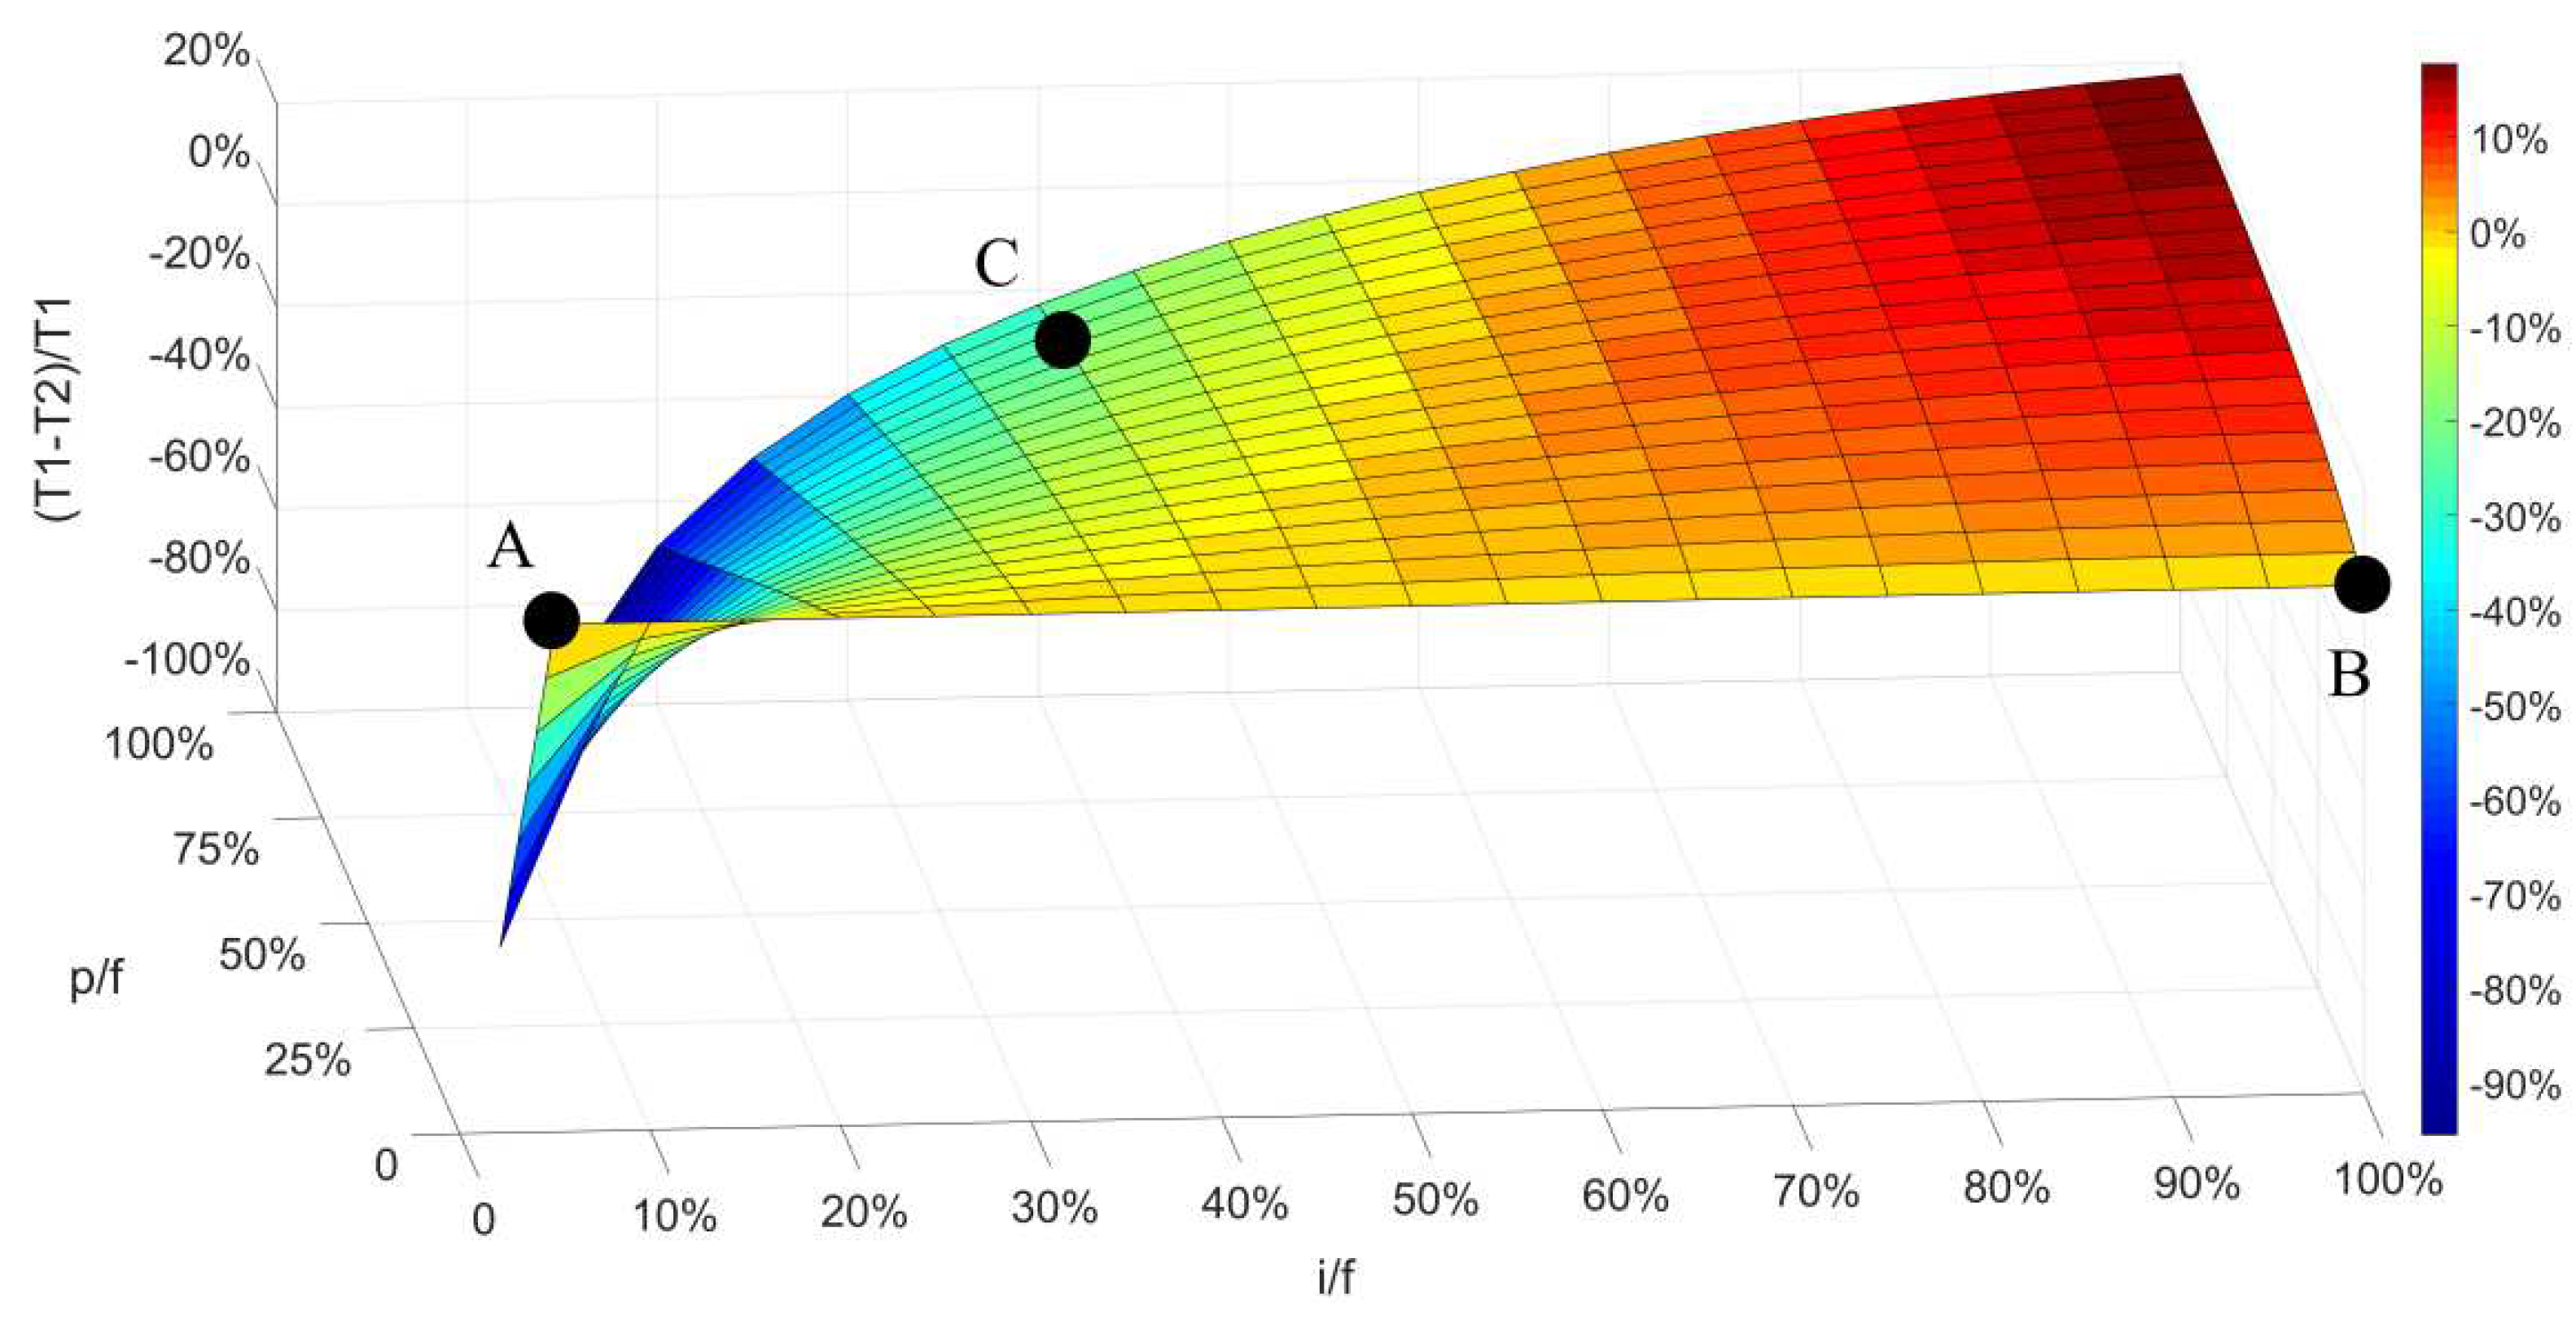
Figure 3.
Methodology flow chart.
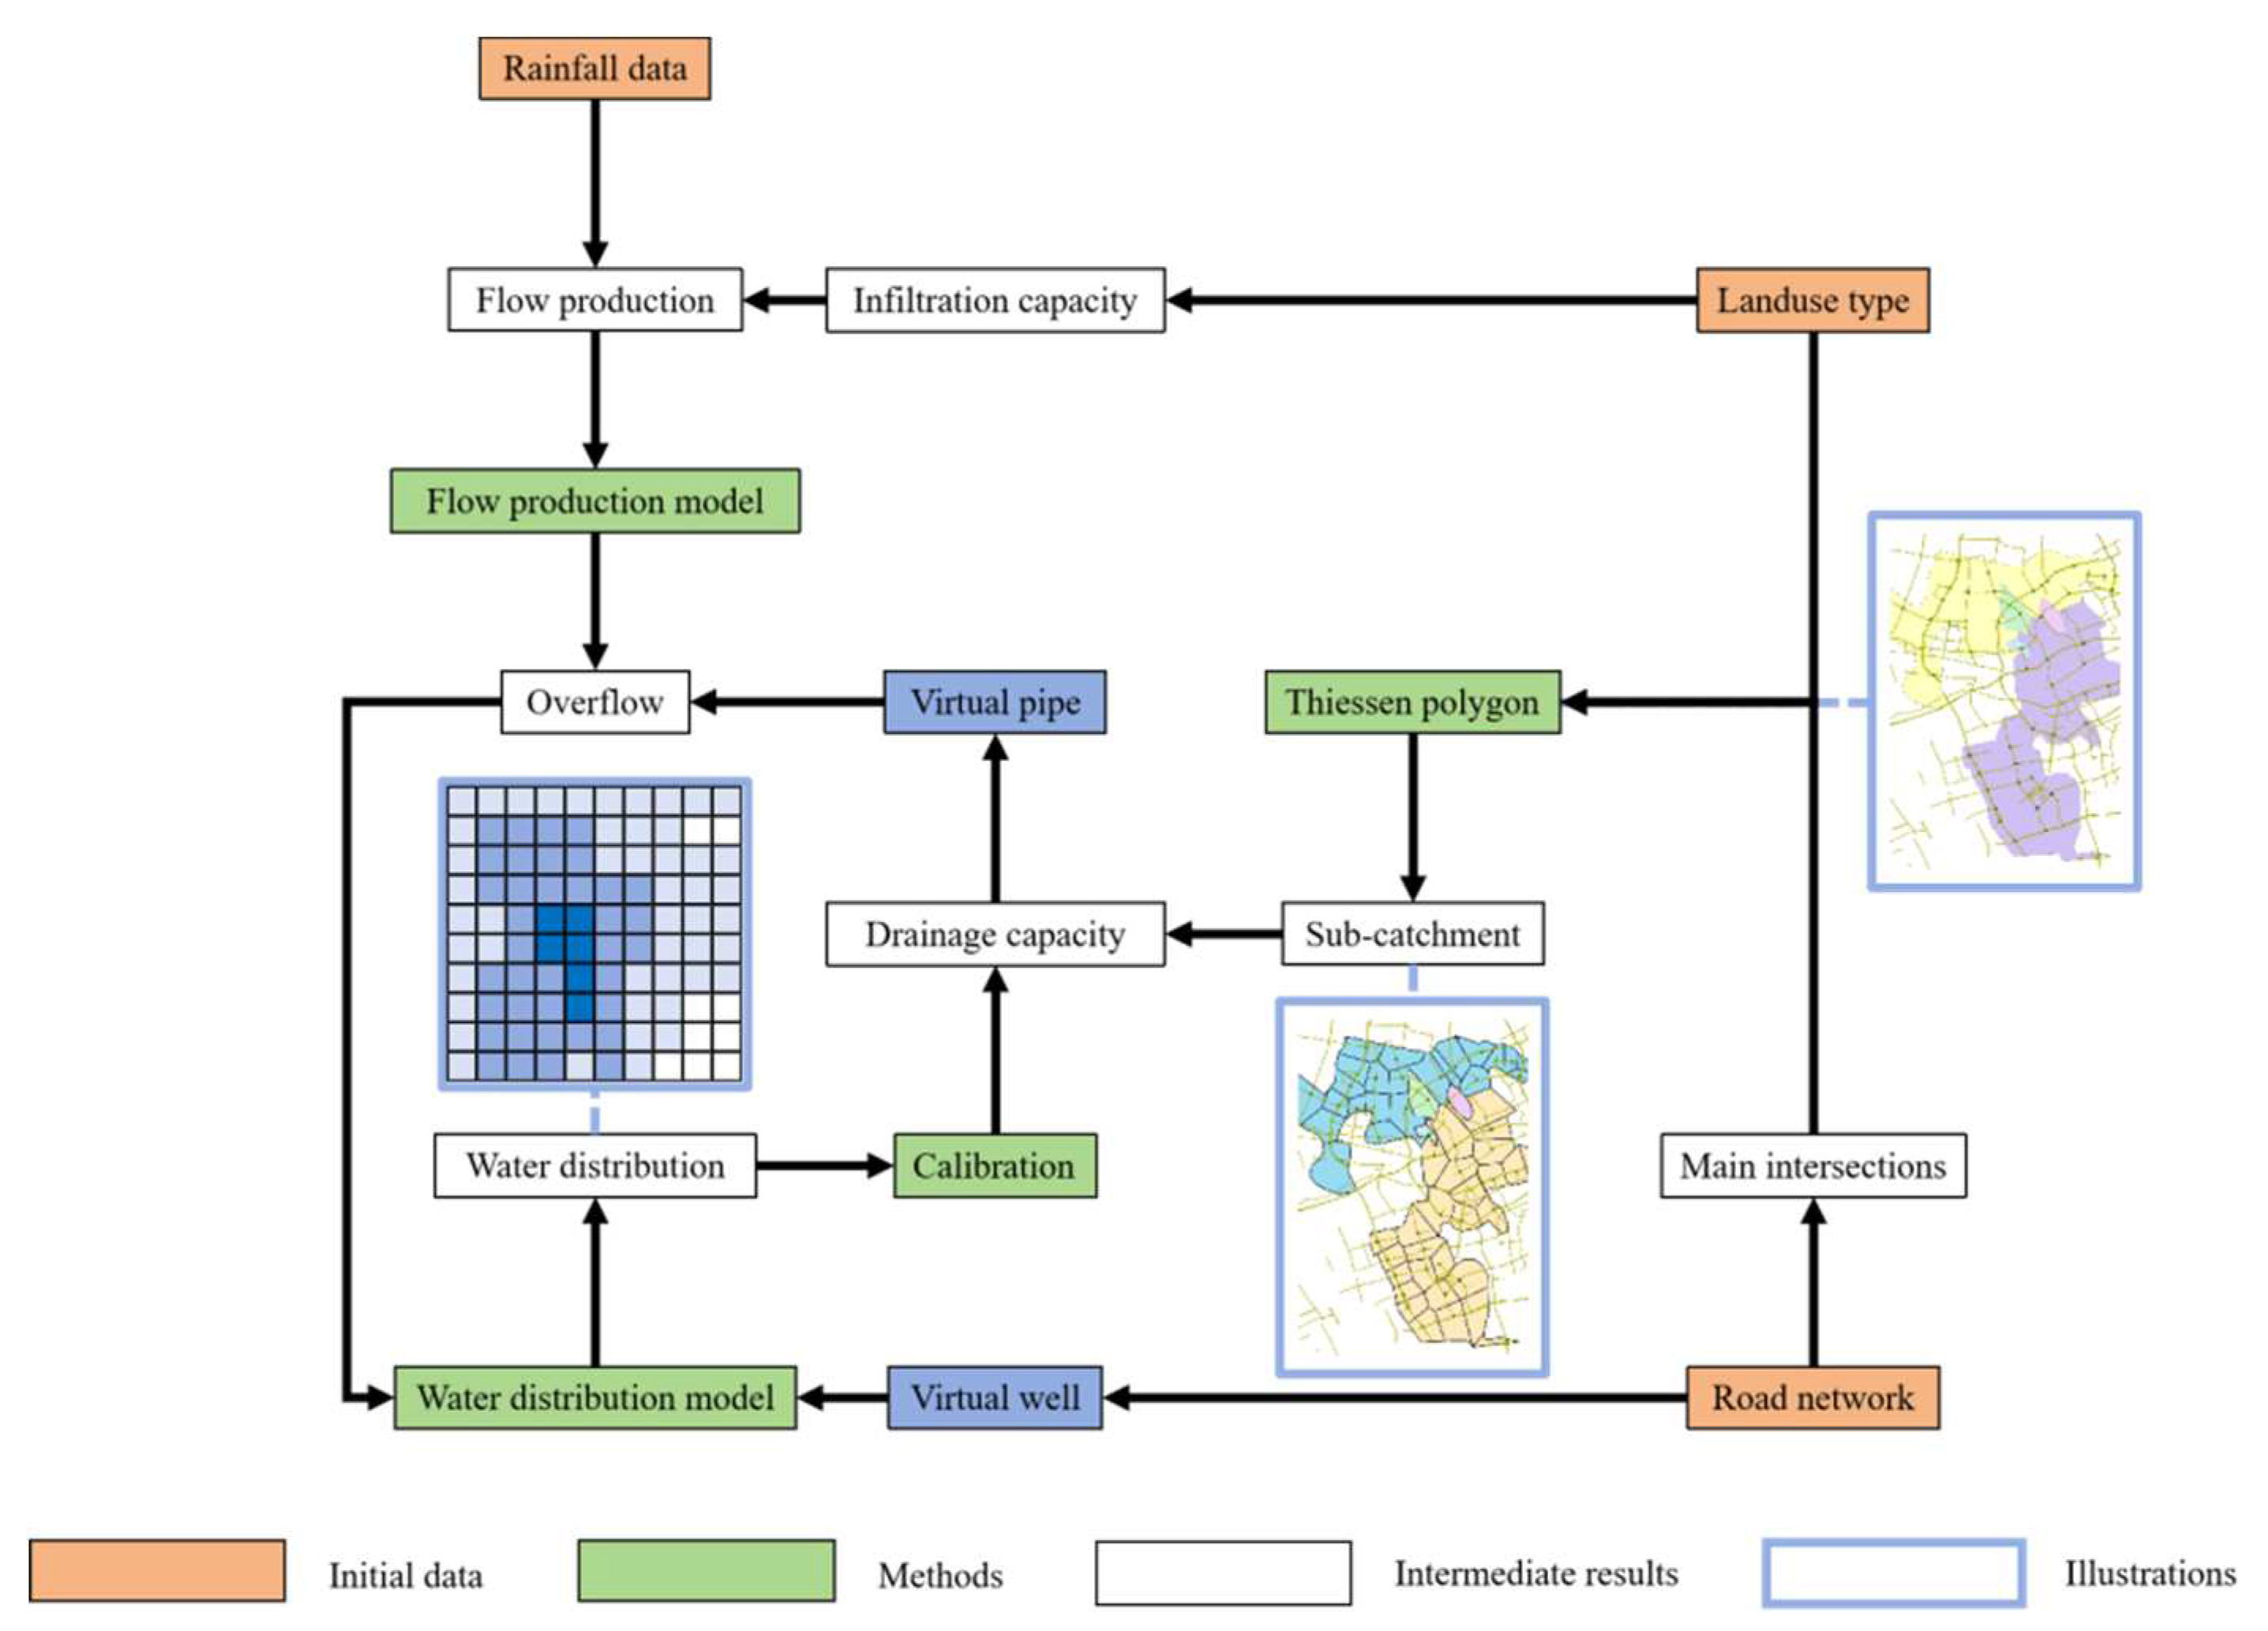
Figure 7.
Temporal variation of waterlogging area for MEI.
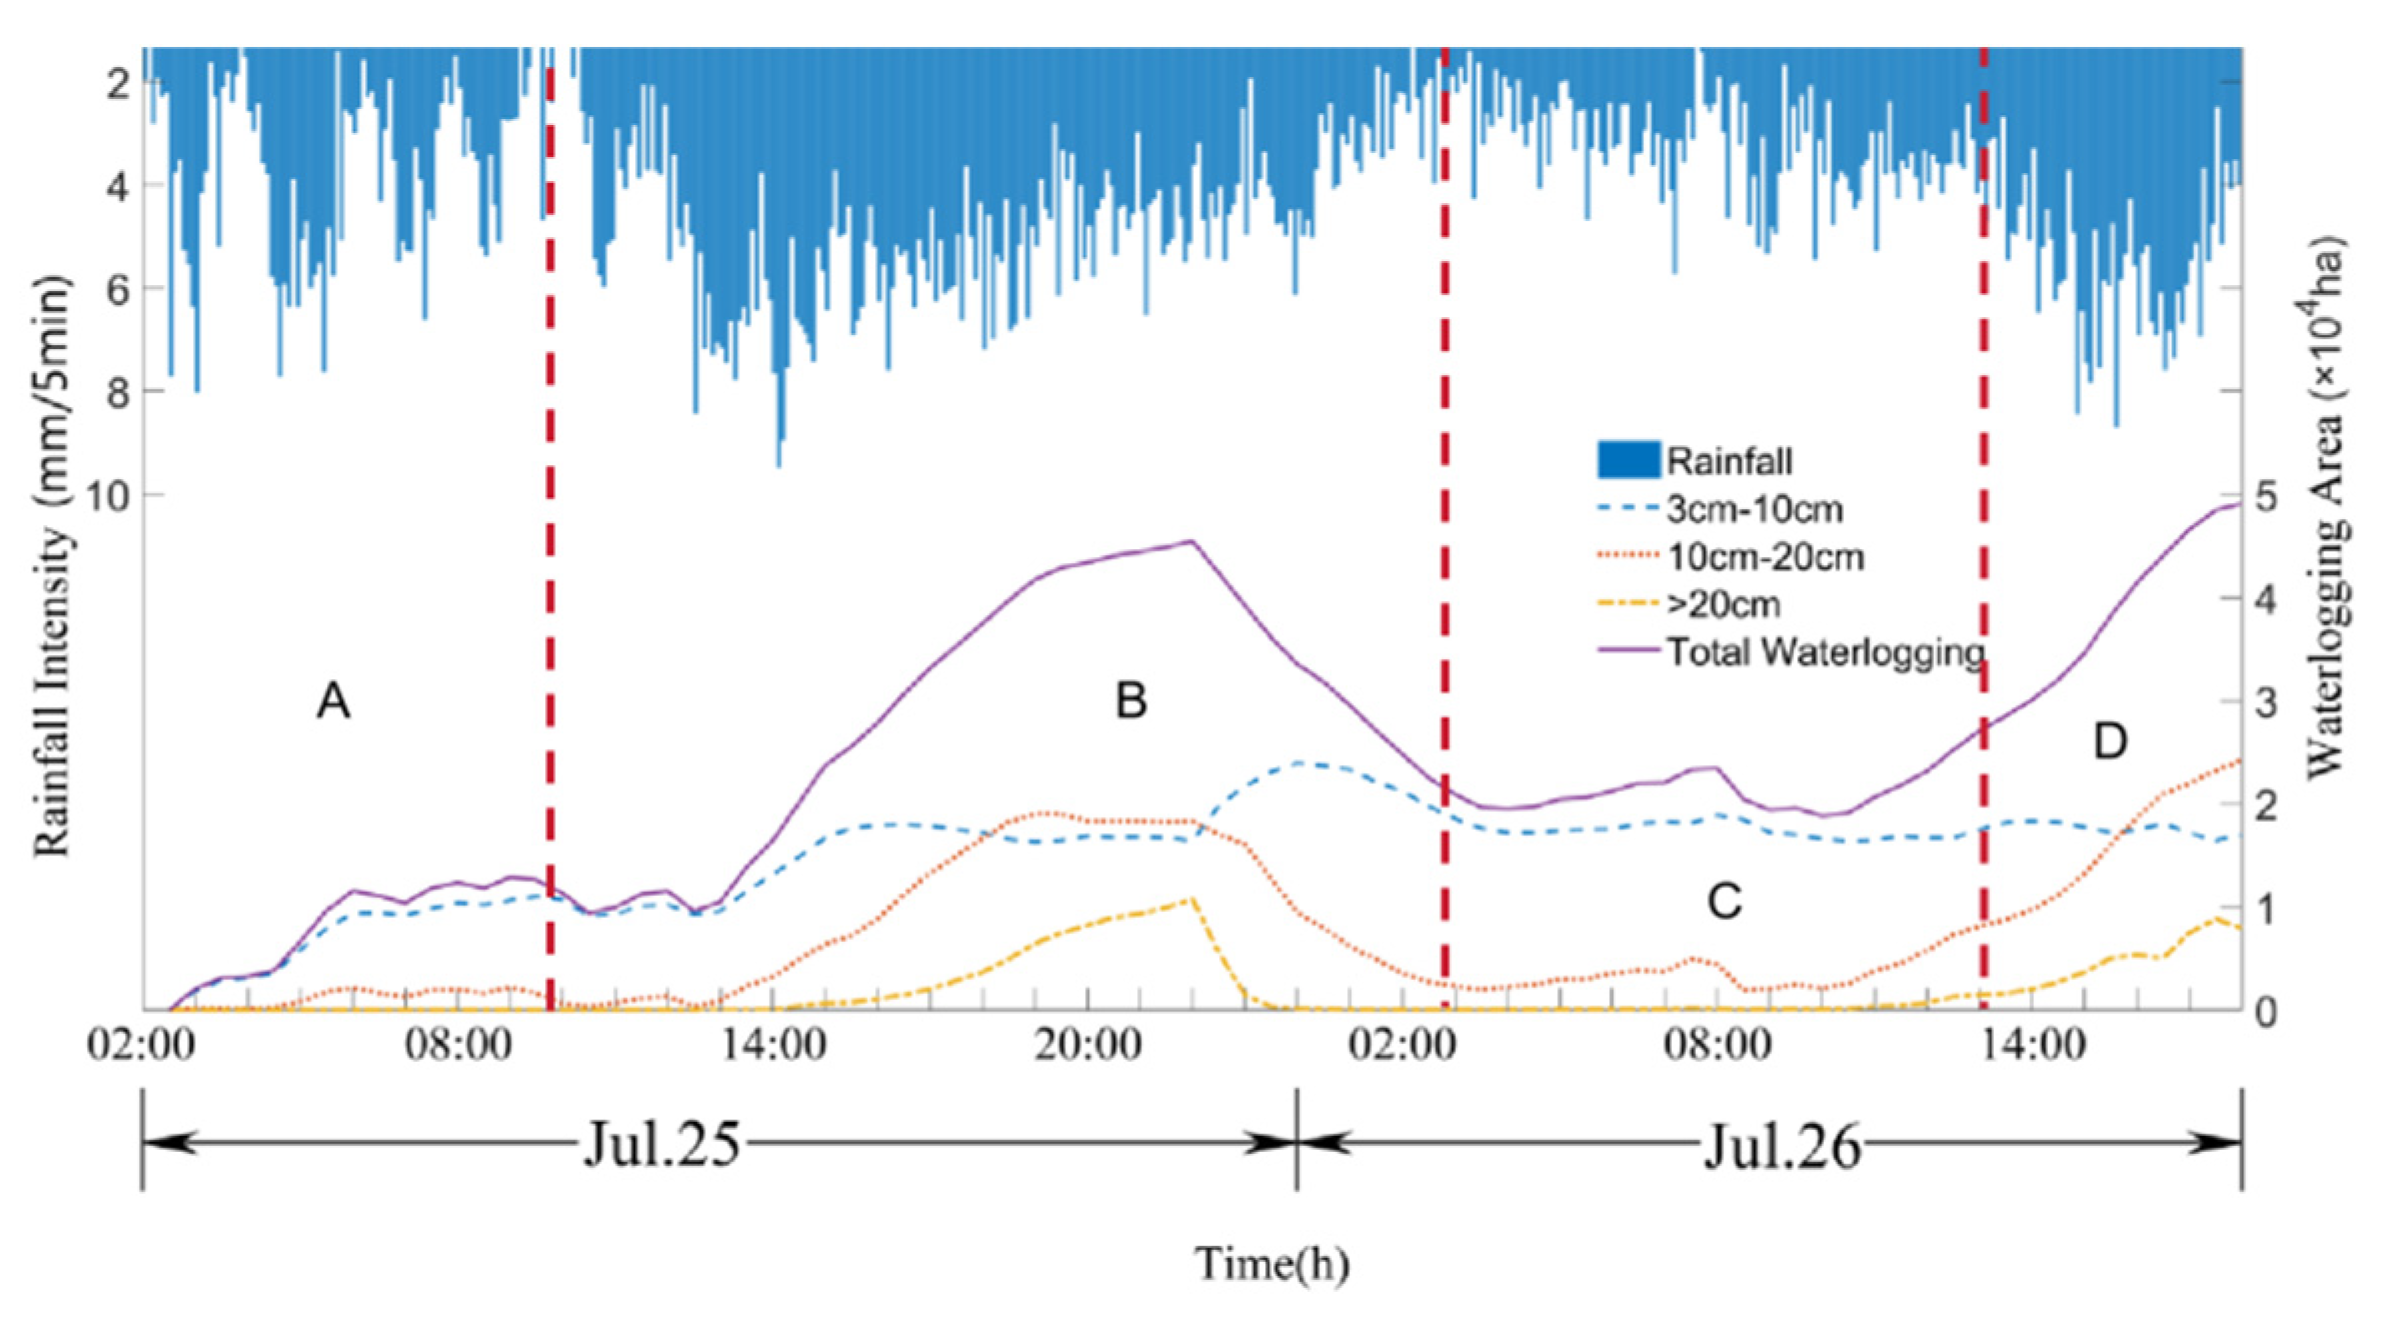
Figure 8.
Temporal variation of waterlogging area for EI.
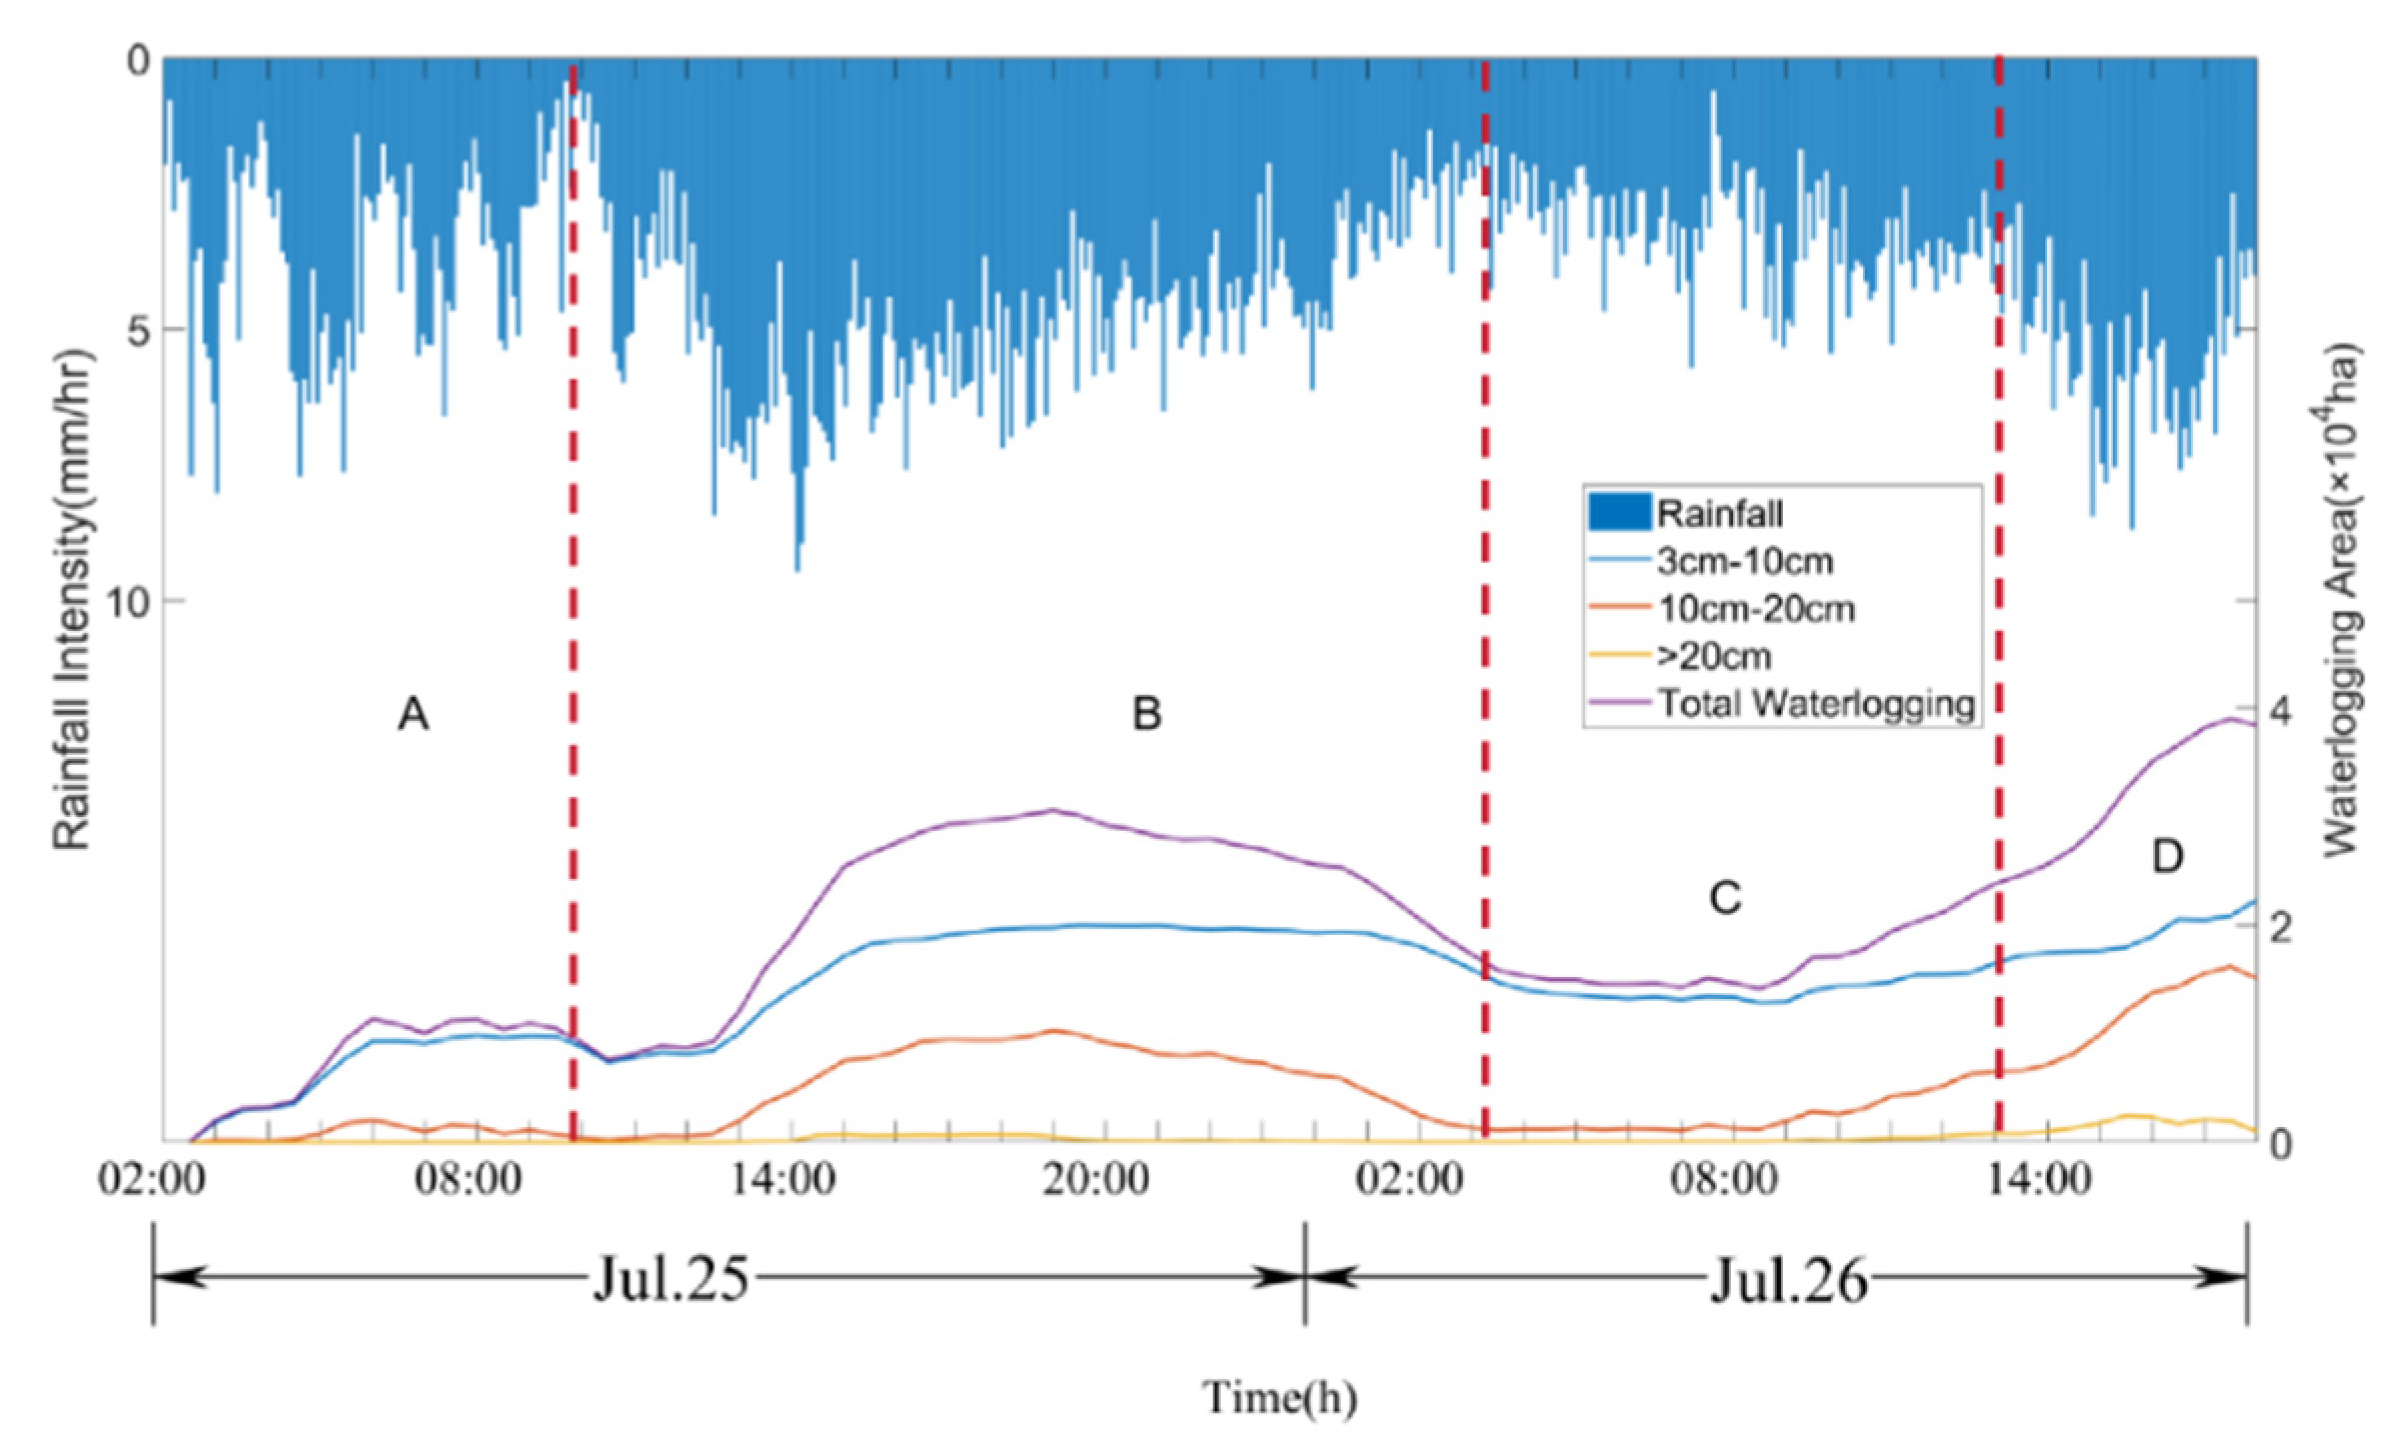
Figure 9.
Comparison of the change in total waterlogged area.
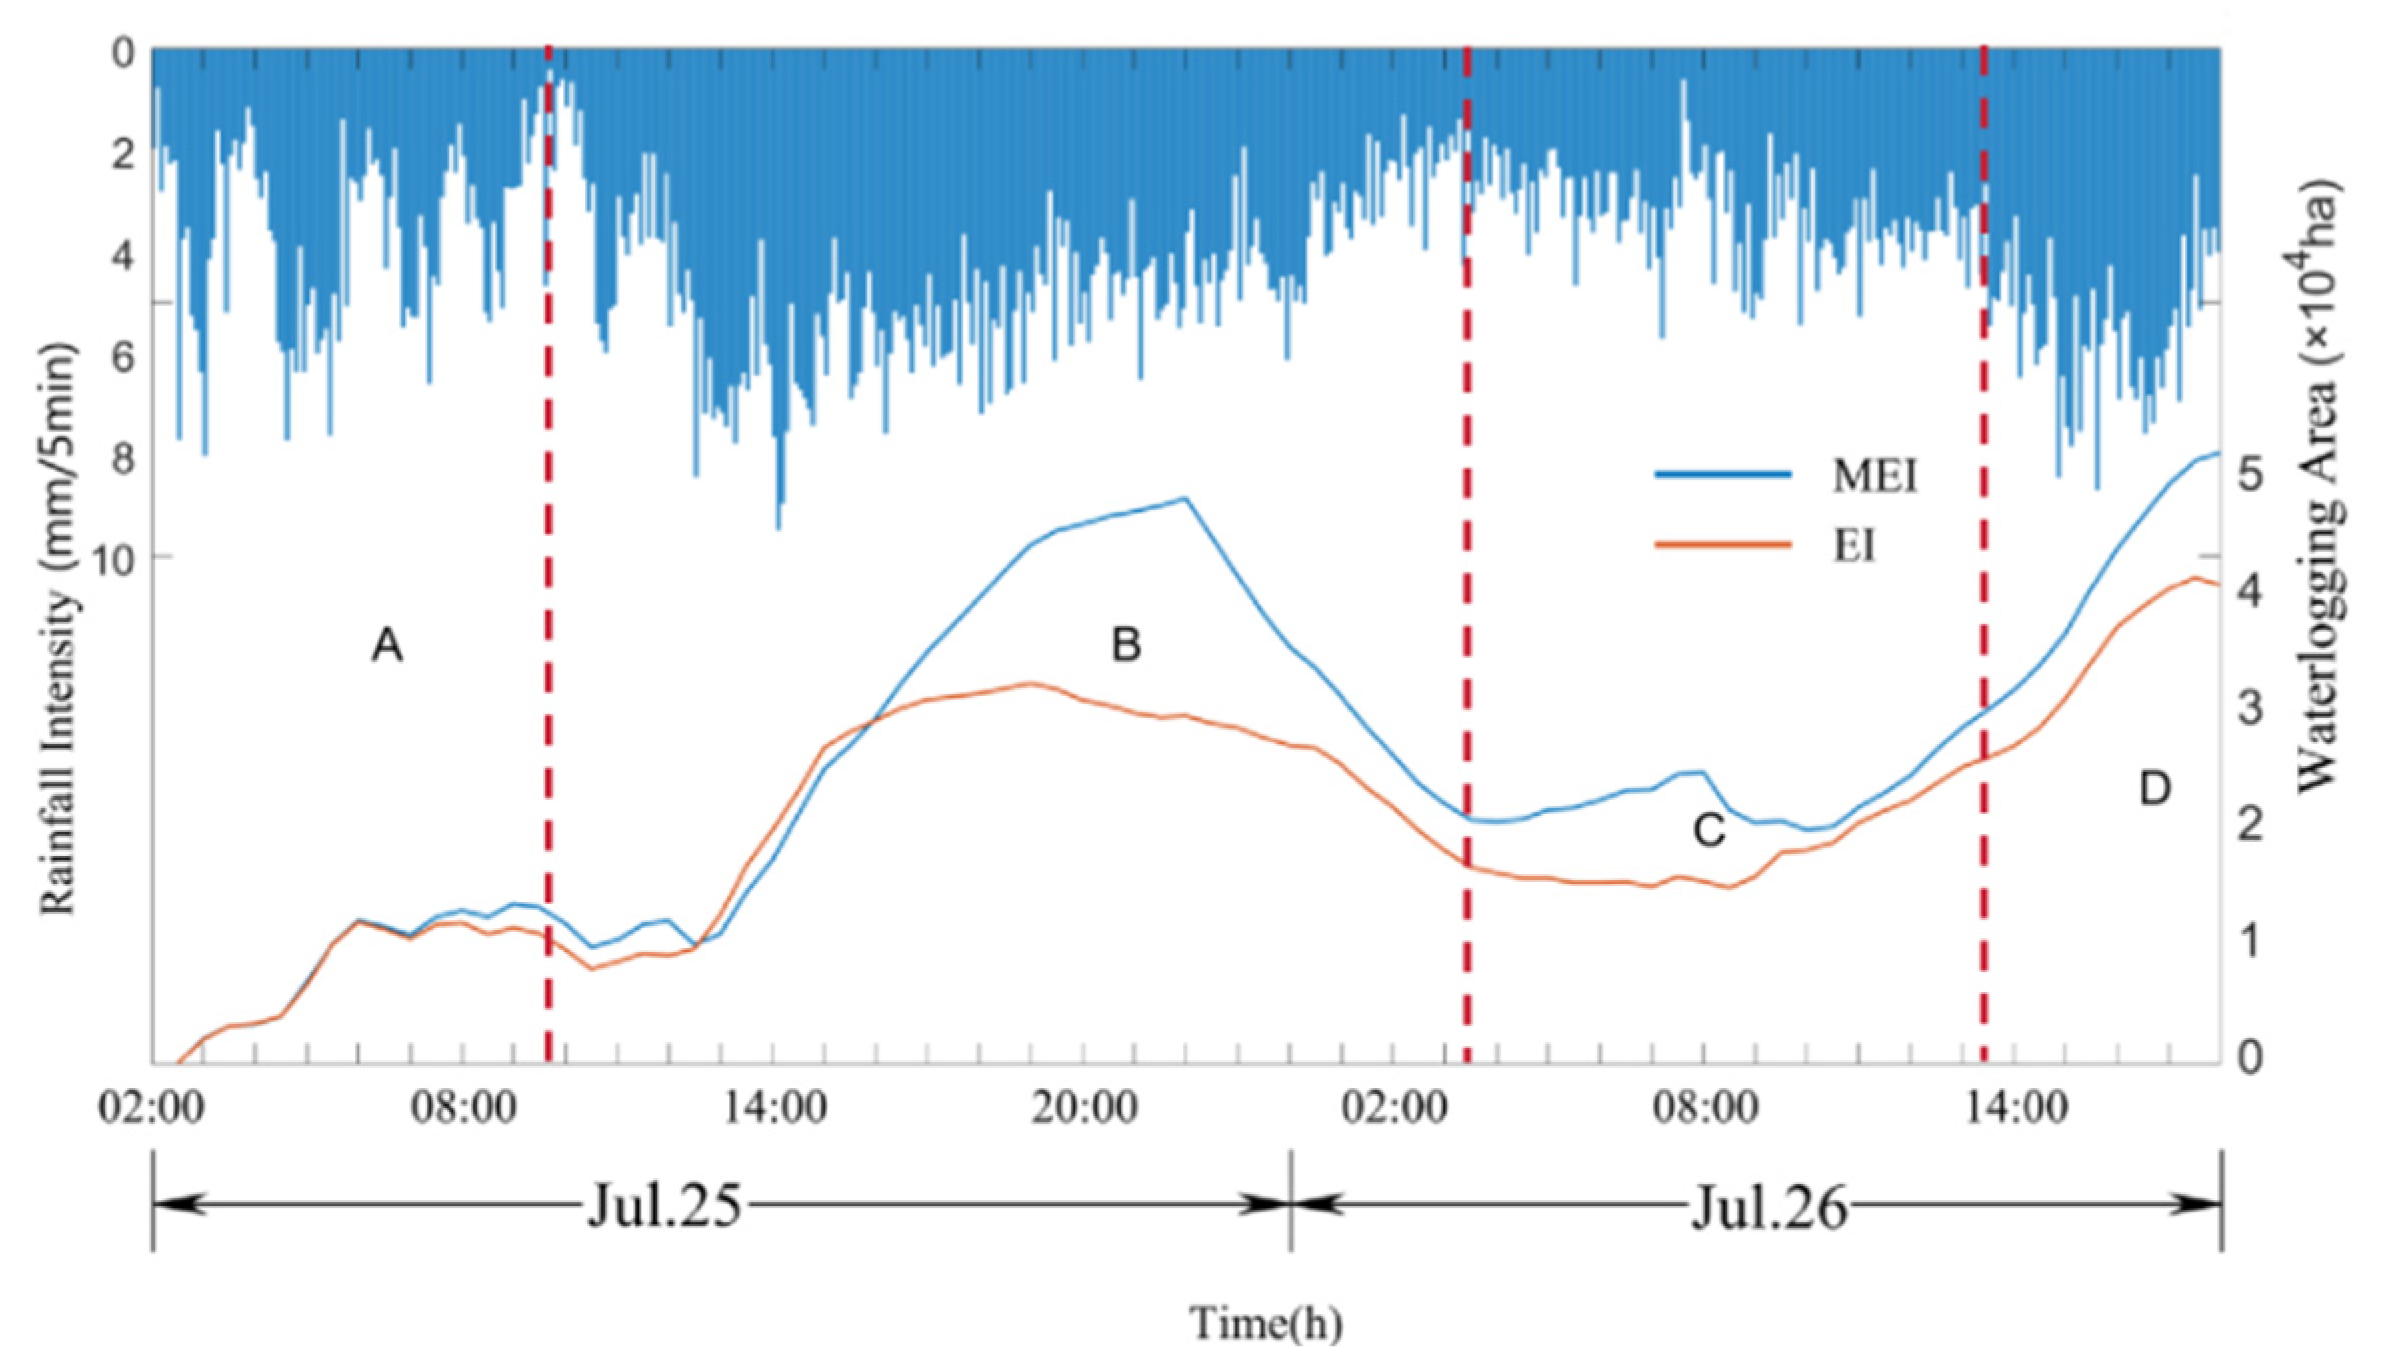
Figure 10.
Comparison of the results of the two methods.
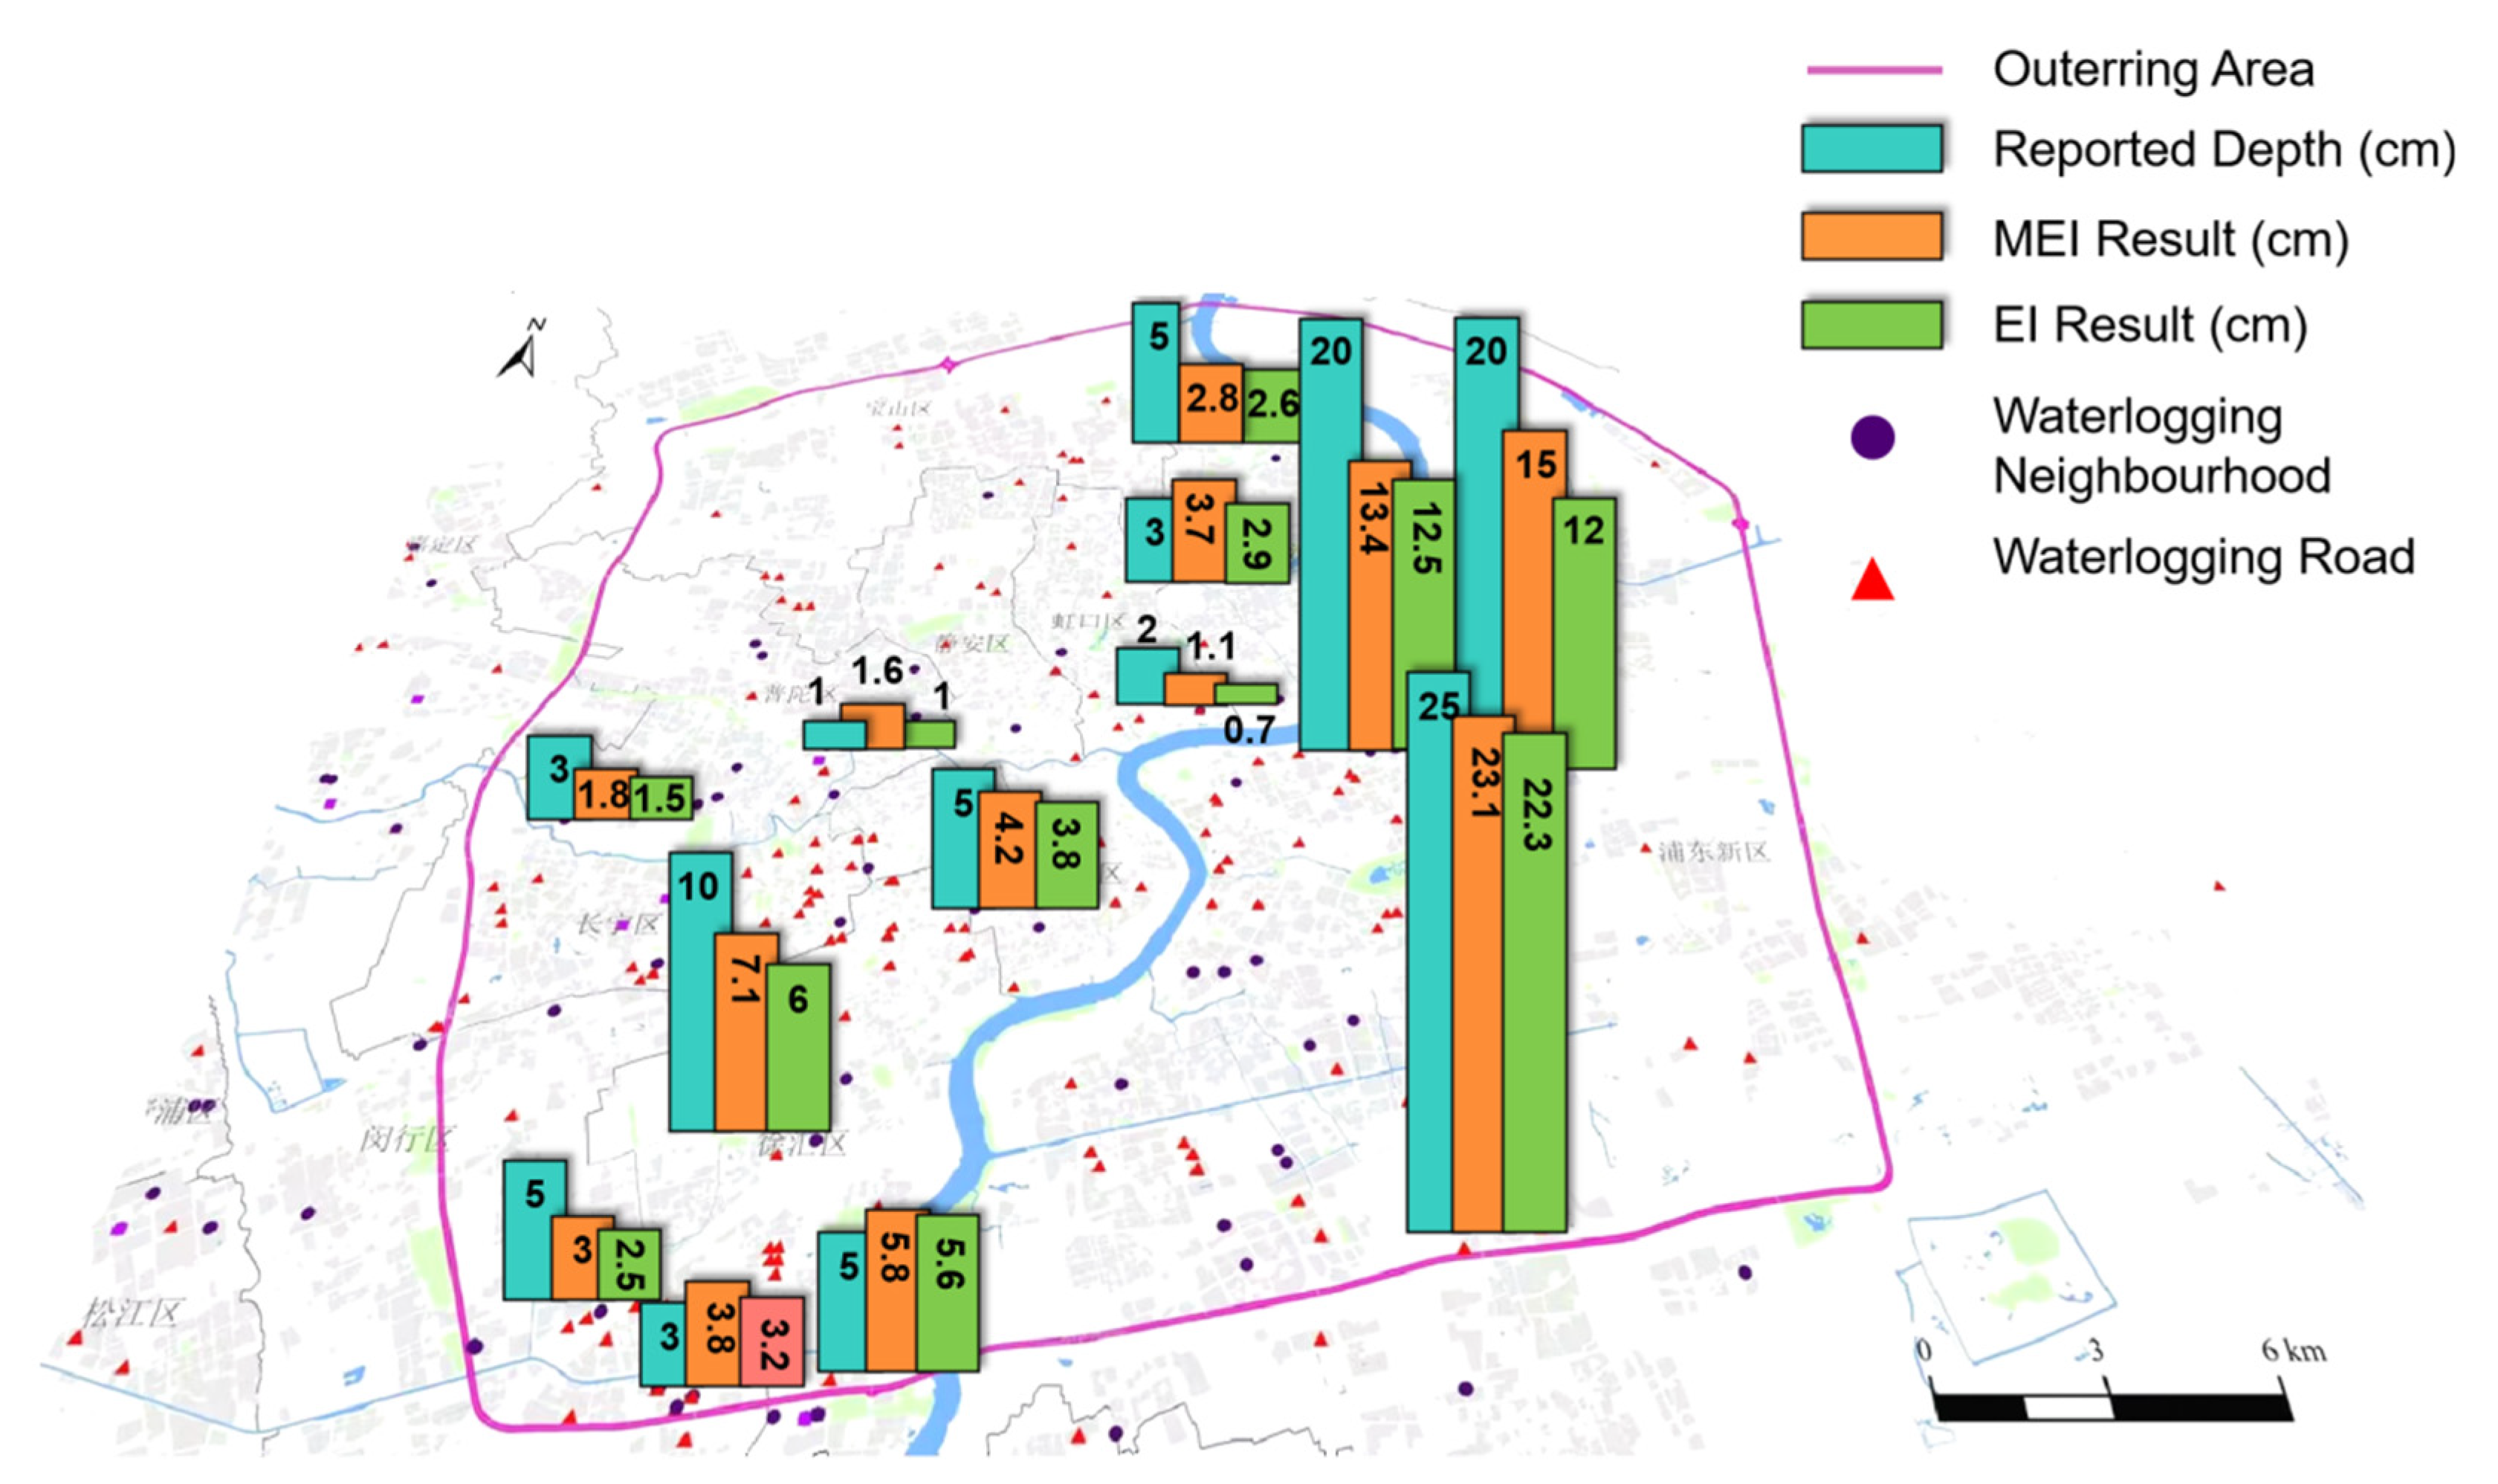
Figure 11.
Comparison of waterlogged areas (X-axis is time, Y-axis is waterlogging area).
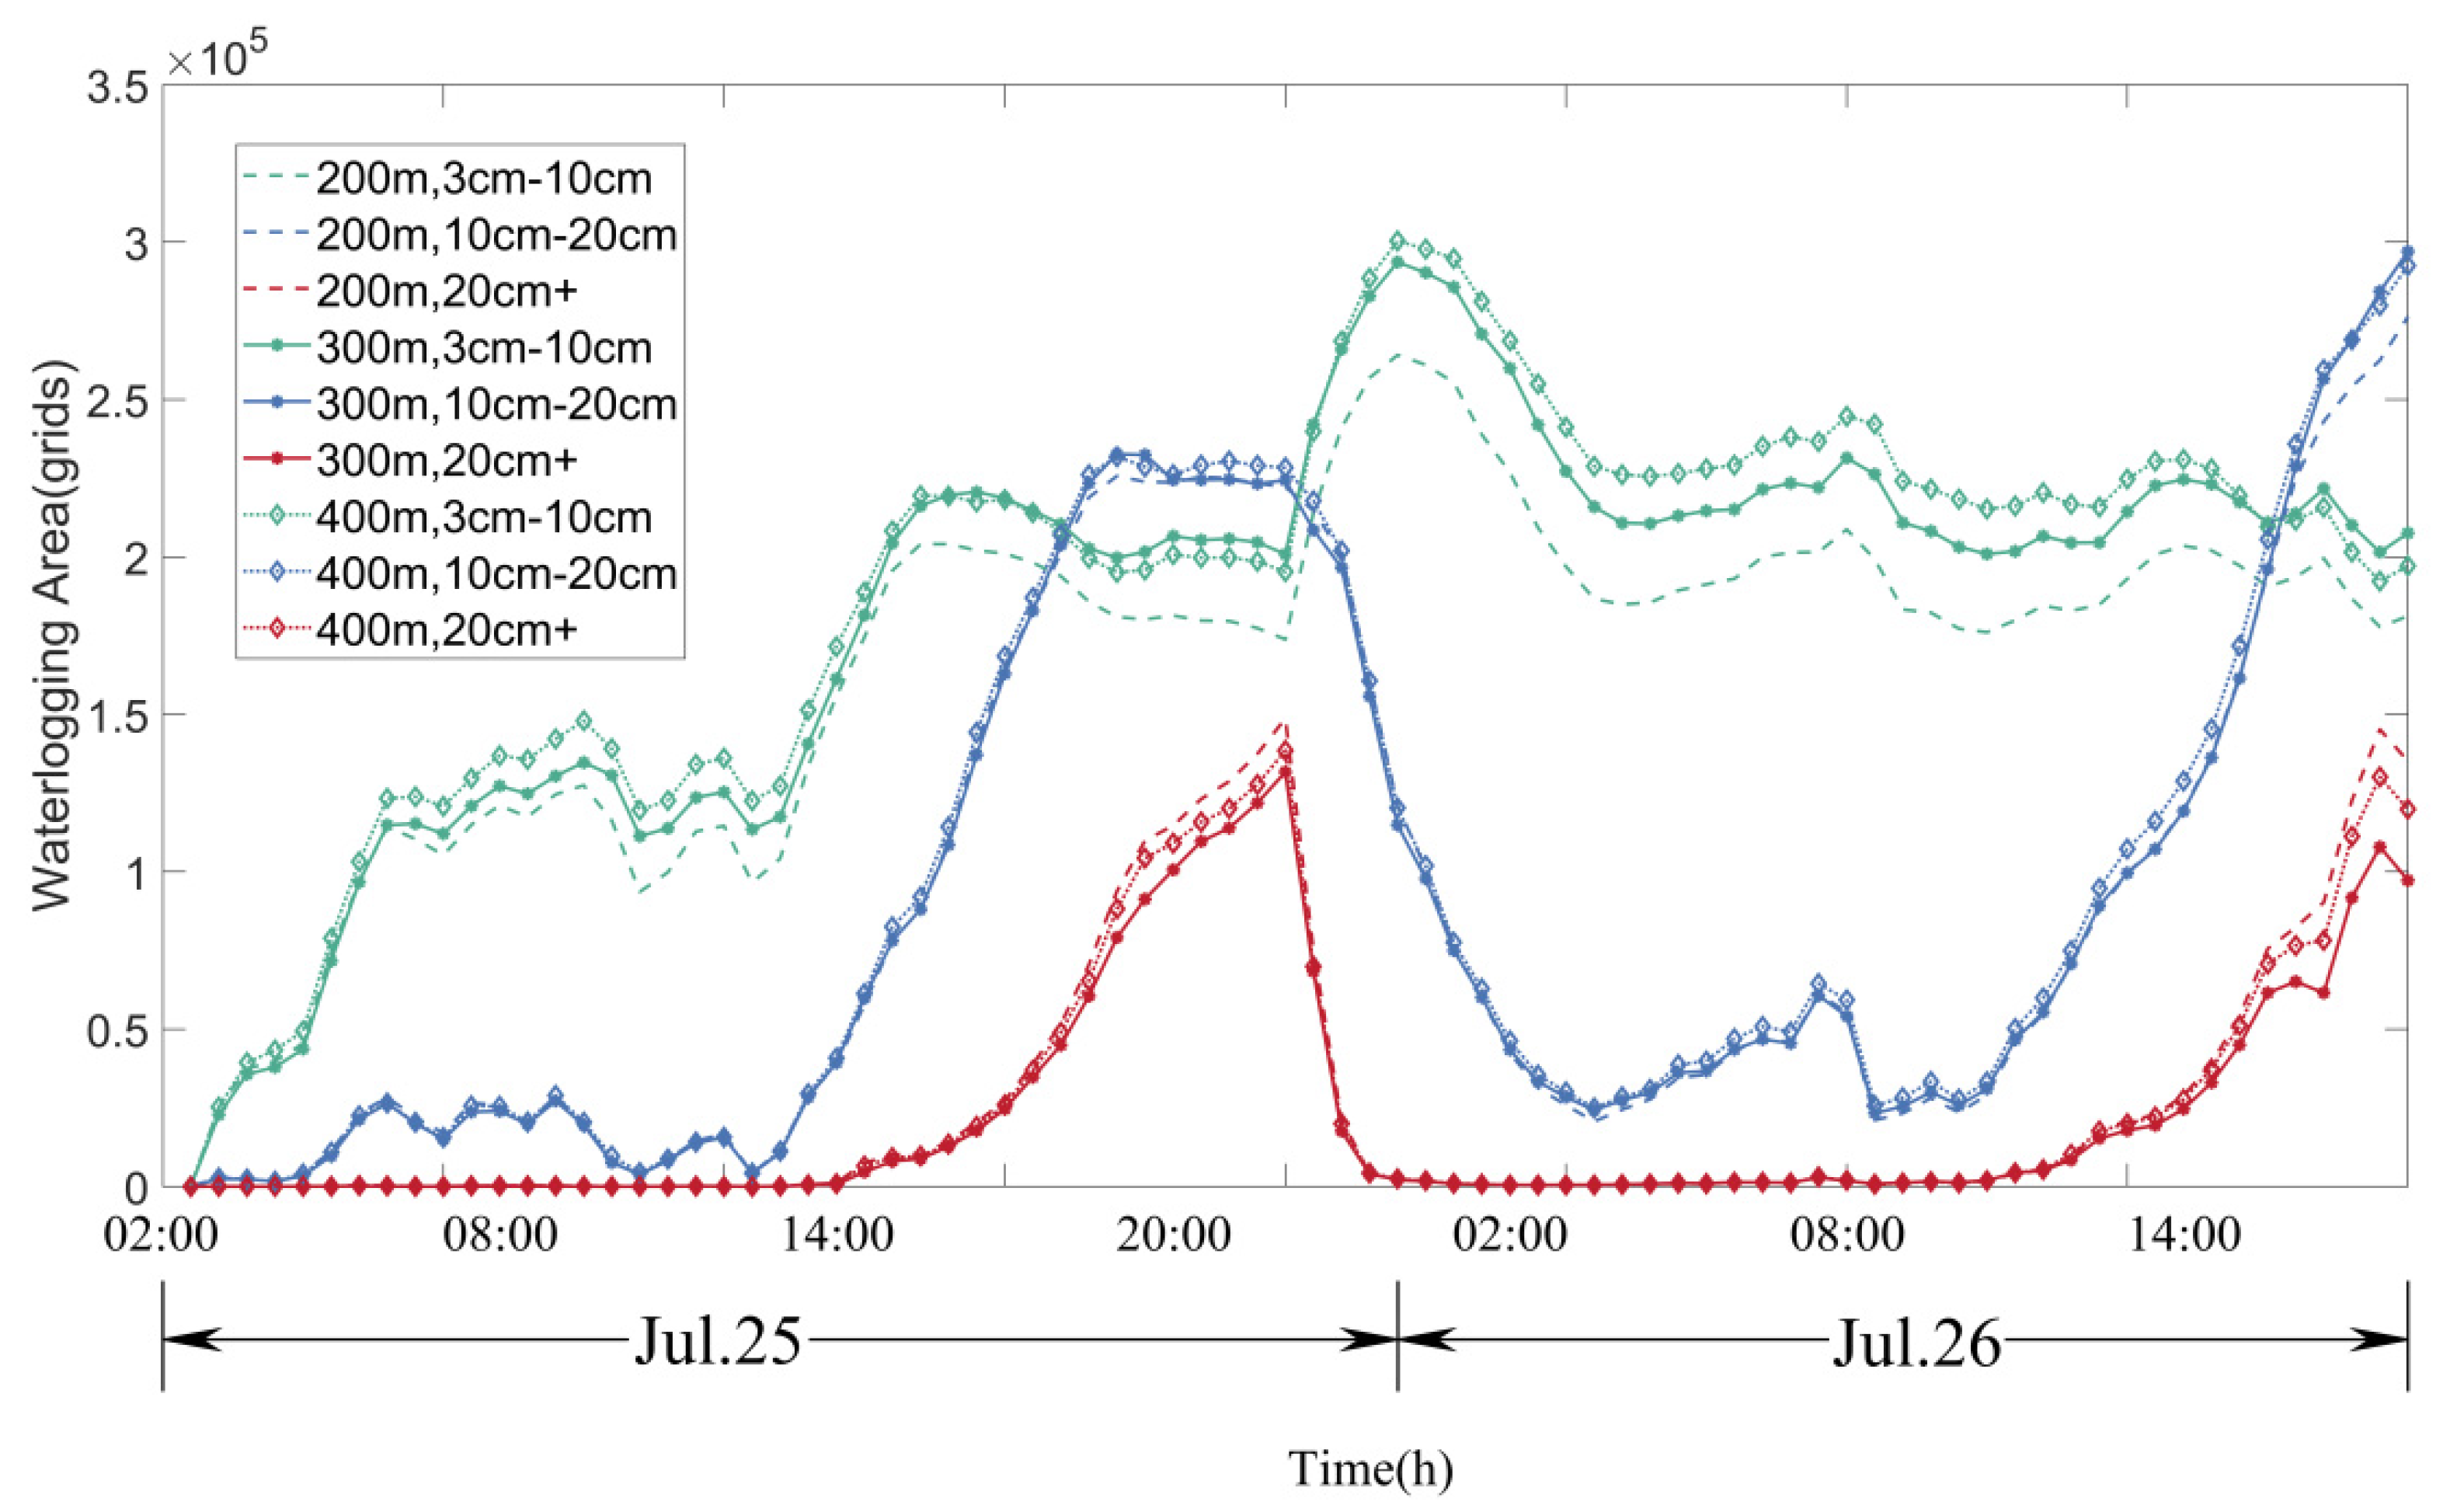

Table 1.
Partial parameter rate values.
| Name | Description | Values |
|---|---|---|
| D-Imperv | Impermeable depression storage | 1.905 mm |
| D-Perv | Water storage in permeable depressions | 3.81 mm |
| MaxRate | Maximum infiltration rate | 76.2 mm/h |
| MinRate | Minimum infiltration rate | 2.54 mm/h |
| Decay | Attenuation factor | 6 |
Table 2.
Validation of errors.
| No. | Reporting Depth(cm) | Average Depth(cm) | Relative error (%) |
|---|---|---|---|
| (Ⅰ) | 5 | 2.8 | 44 |
| (Ⅱ) | 5 | 3 | 40 |
| (Ⅲ) | 20 | 15 | 25 |
| (Ⅳ) | 5 | 5.8 | 16 |
| (Ⅴ) | 10 | 7.1 | 29 |
| (VI) | 2 | 1.1 | 45 |
| (VII) | 3 | 3.7 | 23 |
| (VIII) | 1 | 1.6 | 60 |
| (IX) | 3 | 3.8 | 27 |
| (X) | 3 | 1.8 | 40 |
| (XI) | 20 | 13.4 | 33 |
| (XII) | 25 | 23.1 | 10 |
| (XIII) | 5 | 4.2 | 22 |
| Average Relative error | 31.2 |
Disclaimer/Publisher’s Note: The statements, opinions and data contained in all publications are solely those of the individual author(s) and contributor(s) and not of MDPI and/or the editor(s). MDPI and/or the editor(s) disclaim responsibility for any injury to people or property resulting from any ideas, methods, instructions or products referred to in the content. |
© 2024 by the authors. Licensee MDPI, Basel, Switzerland. This article is an open access article distributed under the terms and conditions of the Creative Commons Attribution (CC BY) license (http://creativecommons.org/licenses/by/4.0/).
Copyright: This open access article is published under a Creative Commons CC BY 4.0 license, which permit the free download, distribution, and reuse, provided that the author and preprint are cited in any reuse.


