Submitted:
22 January 2024
Posted:
23 January 2024
You are already at the latest version
Abstract
New measures are being developed for quality monitoring of early care and education (ECE) programs in Majority World countries. However, limited psychometric work has identified items most indicative of quality or optimized the content of these tools. Therefore, the goal of this study was to showcase the empirical steps needed to streamline ECE quality monitoring measures and create more efficient, yet psychometrically-robust, versions of these tools for Majority World countries. We used data on the Measuring Early Learning Environments (MELE) instrument that was administered to 250 ECE programs in one anonymous Sub-Saharan country. Findings from Item Response Theory techniques pointed to several items that should be retained for shorter versions of the MELE. Together with findings from correlational analyses with teacher/classroom characteristics and child outcomes, these results also showed that shorter versions of the MELE retained similar amounts of information on ECE quality and precision relative to the original instrument. Collectively, these results showed that it is possible to improve the MELE’s measurement efficiency by retaining a subset of highly informative items that maintain the original instrument’s psychometric adequacy. We recommend researchers and practitioners interested in optimizing similar tools for monitoring in their context to follow these empirical steps.
Keywords:
early childhood
; education
; quality
; measurement
; monitoring
; majority world
; item response theory
; psychometrics
1. Introduction
In recent years, many Majority World countries (also sometimes referred to as low- and middle-income or Global South countries) have made considerable investments in expanding the coverage of their early care and education (ECE) programs[1]. ECE broadly refers to the provision of care outside the family home for children from birth to the compulsory primary school age[2]. Pre-COVID estimates suggest that 1.67 billion preprimary-age children globally participate in these services[3]. The growing recognition of the importance of ECE programs has prompted the inclusion of ECE in the United Nations Sustainable Development Goals, with Target 4.2 stating that “by 2030 all girls and boys should have access to quality early childhood development, care and pre- primary education”[4].
Despite the expansion of ECE programs in many Majority World countries[1], descriptive studies suggest that the quality of these large-scale services is generally very low[1,5]. This is concerning because evidence, mostly from the United States, shows that ECE services may have positive impacts on children only when they are implemented with sufficient quality[6,7]. In fact, studies show that low-quality ECE programs may not only fail to generate the desired positive outcomes on beneficiary children, but can even be detrimental to their development[8]. Access to high-quality programs is even more important in Majority World countries, where children are on average exposed to a broader range of developmental risk factors, such as poor nutrition, inadequate sanitation, and chronic poverty[9].
National-level monitoring systems that generate actionable data are critical to ensuring ECE quality at scale[10]. Ideally, building a national monitoring system begins by setting national quality standards which consider both the evidence from developmental science on ECE quality as well as local definitions of quality[11]. These standards then form the basis for developing a measure of quality with indicators that can assess progress towards these goals and that are feasible to implement at scale[11]. Having reliable, accurate data from these quality measures on the specific program features or “core ingredients” that are most important for child outcomes can then guide quality improvement decisions and investment of limited resources[1].
Developing quality monitoring tools that consider these conceptual and technical factors is a complex task. While several measures have been developed to assess ECE quality, they may not be suitable for regular monitoring in Majority World countries for two main reasons. First, given that most existing measures were developed for use in Minority World countries (e.g., the United States, countries in Western Europe), their content may not always align with the needs, realities, and priorities in other contexts[12]. For example, studies have shown that, while many ECE programs in Minority World countries strongly emphasize one-on-one instruction, many cultures within Majority World countries tend to prioritize collective learning and social cohesion instead[12,13]. Second, considering most measures of ECE quality have been developed for research purposes, they tend to be very complex, time-consuming, and costly to train and administer for routine monitoring at scale, in particular for programs that operate in resource-constrained environments[14,15]. These two reasons explain in part why most Majority World countries typically rely on easily quantifiable indicators (e.g., teacher-child ratios, compliance with health and safety routines) to assess quality, if quality is monitored at all[16].
In recent years, new instruments have been developed to address these conceptual and logistical concerns and support national-level ECE quality monitoring in Majority World countries. With this goal in mind, ongoing development of these new measures is particularly focused on their potential for developmental and cultural relevance of content, logistical feasibility, and ability to generate actionable data, while at the same time also ensuring that they meet acceptable psychometric standards.
One key example is the Measuring Early Learning Environments or “the MELE”[17] — an instrument recently created by the Measuring Early Learning Quality & Outcomes (MELQO) initiative[18]. The MELE was designed as a “pool” of 42 items that measure quality constructs perceived as potentially relevant across countries. To ensure cultural sensitivity, stakeholders select items from this pool that reflect local priorities and adapt them to their cultural context. To facilitate measurement at scale and with minimal resources, the MELE is also open source and often comprised mostly of items indexed in a simple yes/no format. In addition, to maximize data use and impact, supporting guidelines and materials for adaption have been designed to facilitate item alignment with national standards. Lastly, the MELE was also designed with the goal of being psychometrically rigorous[10]. Given its recent development, however, only a handful of studies report on whether the MELE has acceptable psychometric properties. In addition, to our knowledge, no psychometric work has been conducted on the MELE or other quality measures to help identify best-performing items and further streamline their content. Considering the limited resources that are often available for quality monitoring[18], improvements in the measurement efficiency of these new quality tools for use in Majority World countries is needed.
The goal of this study was to showcase the empirical steps that can be used to further streamline ECE quality monitoring measures for use in Majority World countries and create versions of these tools that are more feasible and efficient for large-scale data collection, but nonetheless psychometrically-justified. New research initiatives such as the MELQO are striving to create measures for use in Majority World countries that can balance developmental and cultural relevance, logistical practicality, data actionability, and psychometric reliability. The present study will contribute to this objective by demonstrating how advanced psychometric techniques can help reduce instrument length/administration (i.e., make these measures more feasible), while also attending to their empirical rigor.
2. Measuring ECE Quality in Majority World countries
2.1. Developing an ECE quality monitoring measure
The purpose of ECE quality monitoring measures is to collect data over time that can be used for improving services at scale. In general, these measures are scored by trained observers who visit ECE classrooms and then rate various items using different response scales. Below, we discuss four themes that should be considered when developing an ECE quality monitoring measure, specifically: developmental and cultural relevance of content, logistical feasibility, data actionability, and psychometric rigor.
First, the content of quality monitoring tools should reflect findings from developmental science on ECE quality and child development, as well as local definitions of quality[18,19]. While there is no universal definition for ECE quality, experts tend to distinguish between elements of structure and process. Broadly speaking, structural quality refers to the availability of resources that may support high-quality interactions in a learning environment, such as the infrastructure (e.g., space and lighting), sanitation and safety protocols, and educator qualifications (e.g., their training, education, and experience). Process quality, on the other hand, focuses on the frequency, type, and nature of interactions that occur between children, between children and educators, and between parents and educators[5], for example whether they are warm, responsive to children’s cues, and rich in language. Although both structural and process quality dimensions are considered important, studies find that process quality features tend to have a stronger impact on child development across countries[6,20,21]. Studies also suggest that structural quality may be foundational (i.e., necessary but not sufficient) for process quality to occur[22]. For example, educators in classrooms with low child-adult ratios may have more opportunities to provide responsive interactions to children. While the general principles from these findings are intended to be universal (i.e., warm and responsive interactions matter for child development regardless of the setting), the specific ways in which these high-quality features are manifested in practice (i.e., what is considered a “warm” or “responsive” interaction in the local setting) are likely to vary from context to another[23]. Therefore, in addition to considering these findings from the developmental sciences, measures should also consider local stakeholders’ views of quality. This is important to ensure the resulting measure reflects the cultural context in which it will be administered and is responsive to the needs of local classrooms[12]. For example, studies have shown that, while teasing and sarcasm are often regarded as expressions of negative climate in ECE settings within the United States, they are perceived in many Latin American countries as acceptable social mechanisms to direct children’s behavior and engagement in instructional activities[13].
Second, ECE quality instruments should also reflect the practical realities of the contexts for which they are developed. Most importantly, these practical realities refer to the human and financial resources available for conducting ECE quality assurance. In particular, when considering the logistical feasibility of a quality monitoring tool, it is important to keep in mind the purpose of the resulting measure — namely, routine administration at scale rather than a one-time quality snapshot. In this sense, sustainable quality monitoring is a different endeavor than implementing even the largest research study[24]. Specifically, the former requires building the infrastructure and securing the resources to train, collect and analyze item data, as well as provide feedback to inform quality improvement quickly and over time[24]. With these concerns in mind, and considering that most programs in Majority World countries operate in resource-constrained environments, experts agree that quality monitoring tools should be short, easy-to -train -administer and -interpret, and ideally freely available[10].
Third, to affect change, ECE quality tools should also generate actionable data (i.e., data that are insightful in guiding service quality improvement efforts). For this purpose, tight feedback loops should be established with policy and practice where data are used to inform decisions and drive change over time. Consequences from data collected, or how the data are used to inform decisions, may vary substantially. Broadly speaking, consequences can range from low to high stakes (or anything in between). In general, low stakes consequences refer to targeting ECE programs in need of greater support (e.g., material or formative); high stakes consequences, on the other hand, often take the form of incentives for ECE settings to improve indicators (e.g., through additional funding), or penalties for not meeting standards (e.g., through program closure or accreditation loss). Few studies exist on the relative efficiency of these various quality assurance systems, especially in Majority World countries. A recent look at monitoring systems in Sub-Saharan Africa, however, suggested that prioritizing improvement over punitive measures may be more desirable in contexts where access to ECE is already limited, as the latter may create further barriers for teachers and/or families to take part in these services[25].
Lastly, in addition to balancing these conceptual and logistical concerns, ECE quality measures should also show evidence for psychometric rigor. In particular, once item selection and adaption are finalized, psychometric studies should be conducted to examine whether resulting measures meet acceptable properties. For example, experts recommend that measures demonstrate, among other factors, evidence of acceptable internal consistency (i.e., data support the hypothesized structure), and relations to other variables (i.e., items correlate with other variables relevant to the construct being measured[26]). These sources of evidence can indicate the extent to which the resulting quality tool is measuring what it is supposed to.
In the present paper, we bring together the second and fourth theme to consider how empirical research can be used to further streamline a quality measure’s content in a way that improves its logistical feasibility while maintaining its psychometric adequacy. Item Response Theory (IRT) methods, in particular, are best-suited for optimizing measurement[27]. For instance, one variant of IRT models called the 2-parameter logistic model generates two parameters that can be used to identify items that should be prioritized for instrument development: an information and a location parameter. Together, these parameters can be used to identify items that are most useful or informative at distinguishing between ECE programs at different levels of the construct (i.e., ECE quality, for the purposes of this study). Considering the above-mentioned priority of logistical feasibility, coupled with the fact that ECE programs in many countries are stressed and have limited resources available to invest in quality assurance[28], there is a pressing need to create efficient measures that can support sustainable monitoring at scale.
2.2. Empirical work on measuring ECE quality in Majority World countries
There is a large body of work on the conceptualization and measurement of ECE quality in Minority World countries, especially in the United States, where quality monitoring is now closely connected to Early Childhood Development (ECD) policy[18]. However, the literature on measuring ECE program quality in Majority World countries is limited. Within this literature, studies based on measures developed explicitly for use in Majority World countries is even more scarce. Empirical work in Majority World countries has mostly used three observational tools: the Early Childhood Education Rating System (ECERS)[29], the Classroom Assessment Scoring System (CLASS)[30] and the MELE. While a handful of other measures exist (e.g., TIPPS[31] and BEQI[32]), these three tools are currently the dominant ones to measure ECE quality. ECERS and CLASS were developed in the United States and have been used extensively in Majority World countries in the last decade[12]. The MELE, on the other hand, was explicitly developed to facilitate the measurement of pre-primary learning environments in Majority World countries and was only released in 2017[18].
2.2.1. ECERS and CLASS
ECERS and CLASS are the most widely used and researched instrument to assess ECE quality in international contexts[12]. Collectively, these tools have faced challenges regarding the four priorities for monitoring tools mentioned above. Specifically, both instruments are known for being theoretically grounded in learning and developmental theories from industrialized countries [12], which explains why their widespread application in Majority World countries has been criticized for their potential cultural misalignment[12]. In addition, considering both ECERS and CLASS were originally developed for research purposes, their logistical feasibility for regular at-scale monitoring is, unsurprisingly, very limited. In particular, both instruments require extensive training, are very time consuming and complex to administer, and are not free of charge [33]. Regarding their actionability, these measures’ applications in Majority World countries have been so far, to our knowledge, focused on research and evaluation only, rather than for supporting national-level quality monitoring. In the last ten years, for example, ITERS (the version of the ECERS focused on children ages three years and below) has been used in several countries across Latin America to provide a picture of the overall quality status of the ECE system, including in Peru, Bolivia and Ecuador[5]. Similarly, CLASS has been used for descriptive purposes in Peru[34] and Mexico[35], and for program evaluation in Ecuador[36] and Chile[37].
Regarding their empirical rigor, despite their extensive application in global contexts, the psychometric properties of ECERS and CLASS outside the United States are not well established. For CLASS, in particular, results have been mixed so far. While a handful of studies in China[38], Chile[13] and Turkey[39] have been able to replicate the instrument’s original factor structure in the local context, other studies in Peru[22], Kosovo and Ukraine[40], and Ecuador[14] found that it failed to meet conventional standards for absolute model fit. For ECERS, on the other hand, studies have consistently not been able to verify the measure’s original factor structure in the study context[41,42]. Evidence of associations between ECERS and CLASS’ scores and child outcomes is also scarce and limited to cross-sectional studies[6], with two exceptions that used CLASS for a randomized controlled trial in Ecuador[36] and Chile[37]. Results for the ECERS were generally mixed, with some studies finding positive associations with child developmental outcomes[43,44], and others reporting inconsistent results where some associations were positive and others were negative[41]. Results for the CLASS were a little more consistent, as studies generally found positive associations between quality scores and child development[13,34,36]. For both instruments, however, the magnitude of these correlations was generally very low.
2.2.2. The MELE
Overall, these findings for ECERS and CLASS prompted the development of new measures such as the MELE that could respond to a need for locally-relevant and logistically-feasible quality measurement at scale in Majority World countries. As mentioned before, the MELE was designed as an open-source pool of items from which countries can select and adapt items to their local context. For this reason, after item selection and adaption, the MELE structures (i.e., the number of dimensions and items) intentionally differ from one country to another. In addition, item scoring is generally straightforward and adaption material put an emphasis on ensuring concordance with national standards to maximize data use and impact[18].
To date, the MELE has been field tested in a number of Majority World countries including, for example, Tanzania and Indonesia[10], China[45], Lao PDR[46] and Vietnam[47]. In addition, several countries are at different stages of adopting the MELE as a national tool for regular quality monitoring. Most notably, following a rigorous adaptation and piloting process in the local context[8,48], Colombia is currently using the MELE for routine monitoring of preprimary education[49]. In addition, in Peru, the MELE was adapted and piloted in three regions of the country in 2016, then administered at national level in 2017 and again in 2019 in both public and private ECE programs. The Ministry of Education is currently revising the instrument and is planning another national-level data collection in 2023[50]. Finally, stakeholders in Mexico are in the process of finishing the first conceptual adaptation of the MELE in the State of Nueva Leon and are planning the first pilot study for the end of 2023[49].
Given its recent release in 2017, to our knowledge, only four peer-reviewed studies report results from administering an adapted version of this measure to their local context. Specifically, the MELE was used in rural China with the objective of examining associations between classroom quality and child outcomes, as well as understanding whether area of residence (urban vs. rural) moderated this relationship[45]. Another study in Colombia administered the MELE to a nationally representative sample of publicly-funded early childhood centers with the goal of describing ECE quality in the country and validating the tool against a measure of child development[41]. In Vietnam, the MELE was used in a quasi-experimental evaluation of a training program, which found positive effects on the quality of privately-run, low-cost childcare programs delivered by a non-governmental organization[47]. Finally, the MELE was carefully adapted in one study in an anonymous Sub-Saharan African country that reports the psychometric properties from administering the adapted version of this instrument to a sample of 250 ECE programs[18].
All four studies reported statistically significant (albeit small) positive associations between ECE quality as measured by the MELE and child outcomes[8,45,47], except for the study in sub-Saharan Africa which found positive associations between one (out of three) quality subscales and children’s learning[18]. Information on the psychometric functioning of the MELE scores in these various settings was limited. Specifically, all four studies reported that the MELE scores had generally acceptable internal consistency. In addition, the study in Sub-Saharan Africa[18] examined the dimensionality of the MELE data in the local context and found support for the hypothesized three-factor structure.
Overall, despite the potential value of the MELE to support quality monitoring in Majority World countries, rigorous analyses reporting on the measure’s psychometric properties are scarce. In addition, to our knowledge, no empirical study has used advanced psychometric techniques to improve the MELE’s efficiency (in particular, IRT techniques, which are the modern standard for test optimization) and encourage its adoption for national-level quality assurance among Majority World countries. Considering the growing interest in many Majority World countries for moving towards data-driven ECE programs[18], building a knowledge base documenting how the feasibility of instruments such as the MELE can be maximized without compromising their psychometric validity is an important area of empirical research.
3. The Present Study
In light of the above, the goal of this study was to showcase the empirical steps needed to streamline an ECE quality monitoring measure and create more efficient and feasible, yet psychometrically-robust, versions of the tool for quality monitoring in a Majority World country.
Specifically, Step 1 involves reviewing a measure’s content with local experts and stakeholders and retaining/adapting items in a way that ensures consistency with local priorities and meanings of quality (i.e., content analysis). Step 2 consists of describing the items and their inter-relations (i.e., descriptive statistics and internal consistency), and Step 3 involves exploring the number of latent factors represented by the data (i.e., dimensionality assessment). Next, Step 4 consists of estimating IRT item parameters to identify the most informative items that should be prioritized in shorter versions of the measure (i.e., IRT parameters estimation). Finally, in Step 5, shorter versions of the measure (based on items prioritized in Step 4) are comparted to the original instrument in terms (a) the information they provide, and (b) their correlations with external variables (i.e., comparing the short and long forms).
We illustrate how to implement these steps in practice using data on a version of the MELE that was adapted for use in a country in Sub-Saharan Africa (where government officials asked to remain anonymous). Raikes et al. [18] provided a detailed description of the review process of the MELE “pool of items” with local stakeholders in this country (Step 1), and also reported the psychometric properties of the adapted version of the measure within a sample of 250 ECE programs in this context (Steps 2 and 3). We refer to their findings to illustrate Steps 1 to 3. We then build on their work by showing how IRT techniques can be used to select most informative items that should be prioritized within an ECE quality monitoring tool in this country (Step 4), as well as to compare the information and precision retained by shorter versions of the tool (Step 5).
A handful of studies have reported on the content review and basic descriptive and psychometric characteristics of the MELE and other ECE quality monitoring tools for Majority World countries (Steps 1 to 3). However, to our knowledge, this is the first study that extends this work to show how IRT methods can be used to streamline an ECE quality monitoring measure (Steps 4 and 5). As previously mentioned, IRT is the modern standard for optimizing the efficiency of large-scale measure design, for several reasons. Most importantly, it provides item parameter estimates that indicate how well an item is able to distinguish among ECE programs for different levels of the latent trait or theoretical construct (in this case, ECE quality). Together, these two parameters can be used to improve the measure’s efficiency by selecting items that maximize information at the level of the latent trait that is aligned with the study/measurement objective. For the present study, considering our goal was to optimize a monitoring tool for ECE programs operating in a predominantly low-quality context, we focused on selecting items that were particularly informative at differentiating between ECE programs at the lower end of the quality distribution.
Our study was guided by the following research questions, which focus on Steps 4 and 5 of the streamlining process:
1. Which items in the full-length MELE provide the greatest information on ECE quality in a country in Sub-Saharan Africa? With these in mind, which items should be prioritized in the creation of shorter versions of the measure to be used for monitoring purposes in this context?
2. How do the proposed shorter forms of varying length compare to the (full-length) MELE in terms of (a) the information they provide, and (b) their correlations with external variables? In other words, is it possible to implement a measure with fewer items but similar efficiency/precision to monitor ECE quality in this context?
4. Materials and Methods
4.1. Procedures
Data for the present study come from an anonymous country in Sub-Saharan Africa. The government of this Sub-Saharan African country joined the MELQO project to generate information about its ECE programs. The country has a population of over 2 million people, and approximately 70 percent of the population lives in rural areas with limited access to basic health and education services. ECE is provided through a combination of public (government-run and financed) and private (privately ownership, unregulated, fee- based for parents) programs for children between four and six years of age. Around 33 percent of age-eligible children are enrolled in these ECE services[18].
While the country had made substantial progress in recent years on the ECD policy front (e.g., the adoption of a national policy for integrated early education services), it had never collected data on the status of its ECE programs. For this purpose, a MELQO team was formed, comprised of a technical advisor, members of the Ministry of Education, local early childhood experts, and other stakeholders[18]. This team led the adaptation process of the MELE instrument to the local context, which is described in detail in Raikes et al. [18].The adaptation process of the MELE with key stakeholders resulted in a 25-item instrument (the MELE-Adapted or “MELE-A”).
Sampling for the MELQO study was convenience-based and recruitment was conducted using government lists. Specifically, 250 ECE programs across four country zones representing all the regions in the country were selected for participation in the study. Of these 250 programs, 85 percent were private, reflecting the ratio of private to public programs in the country. In each center, one teacher/classroom was identified as the focal point for the observation. In addition, within each focal classroom, approximately four children were randomly selected for the study. The final study sample included 250 ECE programs/classrooms/teachers and 979 children attending those classrooms[18].
Data collection included classroom observations for the MELE-A, survey data for teacher/classroom characteristics, survey data for child/family characteristics, and child development direct assessments. The MELE-A, survey data, and child development assessments were collected by independent teams on the same day. In each team, one person was responsible for the classroom observation, two people were responsible for the survey data (for both the teacher/classroom and child/family characteristics), and one person was responsible for the child assessments.
Classroom observations were conducted by local ministry staff who were trained by the instrument developers. Observers went through a process of small-scale piloting before data collection to familiarize themselves with the tool. The MELE-A was completed through a 2-hour observation of routine educational practices during a scheduled morning visit. Teachers were instructed to conduct the class as normal, and observers coded all items during this 2-hour session. Parents of the randomly selected children were notified of the study and invited to participate in the survey at the school the day of the classroom observation. Parent interviews and child assessments occurred during or after the classroom observation. After the classroom observation, teachers were interviewed to collect various demographic characteristics (e.g., education, age, experience, job satisfaction), as well as information on their classroom (e.g., number of children)[18].
The present study used only de-identified, secondary data from this anonymous Sub-Saharan Africa country. The original study design is documented in Raikes et al. [18] and was reviewed and approved by the first author’s institution as exempt under category 4b at 45 CFR 46.104 under the 2018 Requirements.
4.2. Participants
Sample descriptive statistics are reported in Table 1. Children were on average five years of age at the time of data collection, and half of them were female. Sixty percent of mothers completed primary school or less. Families possessed an average of 44 percent of the 15 assets measured (e.g., availability of basic services, household appliances). In terms of opportunities for play activities in the home environment, 20 percent of families reported having read to their child at least once in the week prior to the interview. Similarly, 27 percent of them reported that an adult had played at least once with the child in that same timeframe. Teachers had on average nine years of experience in pre-primary education. Their education level varied substantially: 24 percent of them had completed at most primary school, 29 percent middle school, 19 percent high school, and 24 percent had completed some form of college or other tertiary education. Teachers reported being generally satisfied with their jobs. They also scored highly on items asking about the support they receive and the resources that are available to them for teaching. Classrooms in our sample had on average 20 children enrolled, with substantial variation between them (M = 19.94 [SD = 17.12], range = 2–200 students).
4.3. Measures
4.3.1. The MELE-A
The MELE-A (i.e., the version of the MELE specifically adapted with local stakeholders for the anonymous country in Sub-Saharan Africa) is comprised of three dimensions: Health/Safety, Materials/Space, and Classroom interactions. Item prompts and scoring options for the MELE-A can be found in the Supplemental Material (Table S1).
The first two dimensions assess indicators related to structural quality, while the third dimension is process-quality focused. Specifically, Health/Safety includes four items that assess potential risk factors for children in terms of water, toilet facilities, handwashing, and general safety conditions. They are scored on a four-point Likert-type scale (1 “lowest quality/very dangerous; 4 “highest quality/not dangerous”).
Materials/Space examines the availability of different learning materials in the classroom (e.g., writing utensils, educational toys, art supplies), as well as whether classroom and yard spaces are adequate to conduct learning activities. It is comprised of 12 dichotomous items (0 “not available/not adequate”; 1 “available/adequate”).
Finally, Classroom interactions focuses on multiple facets of teachers’ interactions with children, including the degree to which the learning activities embody playful learning principles (i.e., whether the pedagogy includes academic materials with games, songs, toys, pretend play and dialogue with children)[18]. Specifically, playful learning is assessed for five activities: math, literacy, fine motor, free play, and music/movement. Each activity is rated from one to three (1 “lowest quality observed”; 3 “highest quality observed.”). Classroom Interactions also assesses the degree of teacher and child engagement, whether there are signs of teacher negativity in the classroom, and the extent to which the teacher is able to provide an individualized instruction to students (0 “not at all” to 4 “very much so”).
4.3.2. Child development
Child development, learning, and socio-emotional development was assessed through the MODEL instrument[17], also developed by the MELQO initiative specifically for use in Majority World countries. MODEL has two parts. The first part focuses on children’s socio-emotional development and is assessed through a parent and a teacher questionnaire. Parents and teacher reported on the same 10 items asking about children’s socio-emotional behavior (e.g., “How often does the child stop an activity when told to?”). Each item is scored on a three-point Likert-type scale (0 “never”; 1 “sometimes”; 2 “often/always.”). Socio-emotional scores reported by parents were available for 906 children (93 percent of the sample). To reduce teacher burden, teachers reported on a random subset of children in their classroom (M = 1.99 students/teacher [SD = .15], range = 1–3 students), for a total of 473 children[18]. For this study, the total socio-emotional score was created by factor analysis on all 10 items, separately for parent-reported and teacher-reported responses.
The second part focuses on children’s development and learning and is assessed by a trained observer with a total of ten tasks related to spatial vocabulary (4 items), verbal counting (1 item), producing a set (3 items), number identification (10 items), letter identification (16 items), expressive language (5 items), listening comprehension (5 items), name writing (1 items), head toes knees shoulders (15 items), and pencil tap (14 items). This direct assessment takes on average 30 minutes to complete with each child and most items are scored dichotomously (0 “incorrect”; 1 “correct”), except for verbal counting, name writing, and head toes knees shoulders. For verbal counting, children were asked to count out loud starting at one, and they were stopped when they stated a number incorrectly or when they reached 30. For name writing, children were given two minutes to write their name on a piece of paper, and the item was scored on a four-point Likert-type scale (0 “scribbles”; 1 “symbol-like marks”; 2 “non-name letters”; 3 “has letters in name but not correct”; 4 “correct”). Finally, for head toes knees shoulders, children were provided instructions to do the opposite of what the observer would say (e.g., touch their toes when instructed to touch their shoulders) and items were scored on a three-point Likert-type scale (0 “correct”; 1 “child self-corrects”; 3 “correct)[18]. For this study, a total learning and development score was created by factor analysis on all items and was available for 857 children (88 percent of the sample).
4.4. Steps for streamlining an ECE quality monitoring measure
We review below five key steps that can be used to short-form an ECE quality monitoring measure, including: Content analysis (Step 1), Descriptive statistics and internal consistency (Step 2), Dimensionality assessment (Step 3), IRT parameters estimation (Step 4), and Comparison of the long and short forms (Step 5). We illustrate each step with the practical example of streamlining the MELE measure for application in the anonymous Sub-Saharan country. For Steps 1 to 3, we refer to Raikes et al. [18], which described the review process of the MELE items with local stakeholders in the country and reported the descriptive and psychometric characteristics of the measure after administering it to a sample of 250 ECE programs in this context. For Steps 4 and 5, we describe how the present study built on their work by using advanced psychometric methods to improve the measure’s efficiency.
4.4.1. Step 1: Content analysis
Step 1 involves reviewing a measure’s content to retain items that are consistent with local priorities and meanings of quality. This process is important to ensure the measure includes constructs (and corresponding items) that generate insightful data for guiding service quality improvement efforts in the local context. Content review is usually conducted by a group of experts with experience/knowledge about ECE quality measurement in general (e.g., international researchers specialized in ECE quality scale development), as well as local stakeholders who understand the context’s beliefs, values and priorities regarding ECE quality (e.g., teachers, ministry officials, local researchers). In addition to reviewing and prioritizing dimensions/items, experts can also adapt items to ensure clarity and cultural relevance, as well as suggest new content if a construct/item viewed as important for the local setting is missing. Content analysis may also involve small-scale piloting to examine whether further adaptions (for example to clarify some items) are needed.
As mentioned earlier, the MELE was designed as a core of common items which reflect several ECE quality dimensions viewed as potentially relevant across countries, from which local stakeholders prioritize items for measurement in their context. In the case of the anonymous Sub-Saharan country, a team (comprised of a technical advisor, ministry officials, local early childhood experts and other stakeholders) conducted content analysis in three phases: (1) a review of the MELE core items and their alignment with national ECE policy documents; (2) a week-long stakeholder workshop to generate a draft version of MELE-A; and (3) small-scale pilot testing to create a final version of the MELE-A. A detailed description of the content analysis process can be found in Raikes et al. [18].
4.4.2. Step 2: Descriptive statistics and internal consistency
Once a set of dimensions/items have been prioritized based on content relevance (Step one), a descriptive analysis providing a basic overview of the items (e.g., mean, standard deviation) as well how items’ scores fit together (i.e., internal consistency through Cronbach’s alpha or McDonald’s omega coefficients) is warranted to become familiar with the data and get a general idea of the measure’s psychometric functioning.
For the MELE-A, Raikes et al. [18] reported that quality scores had adequate internal consistency for all three dimensions, although results for Health/Safety were just below the 0.70 traditional cut-off ( = 0.65 for Health/Safety, = 0.87 for Materials/Space, and = 0.83 for Classroom Interactions). Details on the MELE-A descriptive statistics are provided in Appendix A.
4.4.3. Step 3: Dimensionality Assessment
Step 3 involves exploring the dimensionality of the data or, in other words, whether items are measuring a single or multiple latent traits. One key assumption that underlies the IRT framework is the unidimensionality of the latent trait (i.e., items on the test should only measure one construct). This assumption implies that an IRT model should only be estimated (in Step 4) for a set of items that have been shown to measure a single latent trait. If multiple factors emerge in the data (in Step 3), for this assumption to hold, a separate IRT model should be estimated (in Step 4) for each set of items that measure the same latent factor. Dimensionality assessment may be conducted in different ways, including through principal component analysis (PCA), exploratory factor analysis (EFA), or confirmatory factor analysis (CFA).
For the MELE-A, Raikes et al. [18] used CFA to examine the dimensionality of the data, as this method is best-suited to confirm a hypothesized factor structure. Specifically, categorical CFA was conducted using the weighted least squares mean- and variance- adjusted estimator (WLSMV); factor loadings > 0.3 were considered acceptable, and overall model fit was determined using criteria of the Comparative Fit Index (CFI) 0.90 and the Root Mean Squared Error of Approximation (RMSEA) 0.08. Results showed that all items had acceptable factor loadings, and the three-factor model had adequate model fit ((395) = 688.92, p < 0.001; RMSEA = 0.055; CFI = 0.904)[18].
4.4.4. Step 4: IRT parameters estimation
Step 4 consists of fitting an IRT model to each set of items that have been shown to measure a single latent trait. IRT assumes the latent trait (ECE program quality in our case), also referred to as theta, to be organized on a continuum which can be conceptualized as a z-score type metric (i.e., with mean zero and expressed in standard deviation units)[51]. Negative theta values on the left tail of the continuum indicate lower program quality, and positive values on the right tail indicate higher program quality. One variant of IRT models called the 2-parameter (2-PL) logistic model can be used to estimate two parameters for each item (information and location) that indicate which quality levels on this continuum can be estimated with most precision. Specifically, the item information parameter indicates how well that item is able to distinguish between ECE programs at different levels of quality (i.e., how much information it provides to distinguish among ECE programs). The location parameter for that item complements this information by indicating where on the quality continuum (i.e., at which values of theta) that item is particularly effective at distinguishing between ECE programs.
For ease of interpretation, this precision is best represented visually with an Item Information Function (IIF), a bell-shaped curve for each item that shows the amount of information it provides (y-axis) across different values of the latent trait (x-axis). The taller the IIF at given values of theta, the more effective that item is at distinguishing between ECE programs at those values. Together, these two parameters can be used to prioritize items that maximize information at the level of the latent trait that is aligned with the study/measurement objective. For example, if the study/measurement objective is to capture variation between low-quality ECE programs (or ECE programs at the lower tail of the quality distribution), items that provide more information at lower values of theta should be prioritized. In addition, the overall precision of the dimension/measure (rather than each individual item) can also be visually represented with the Test Information Function (TIF) – a bell-shaped curve that sums the IIFs of all items on the dimension. The TIF is also generally graphed together with the Conditional Standard Error of Measurement (CSEM), its inverse function, which shows measurement error for the dimension across the latent trait distribution.
For the present study, because dimensionality assessment (Step 3) showed that each MELE-A dimension was measuring a single latent trait, we fitted a separate IRT model to each dimension. Specifically, we fitted a graded response model (GRM) to the Health/Safety and Classroom interaction dimensions considering their items were ordinal. For the Materials/Space dimension, we fitted a two-parameter IRT model (2pl IRT), which is suited for dichotomous items. For each dimension, we also reported the IIF, TIF, and associated CSEM. Using this information, we flagged as candidates for exclusion items that were generally uninformative (i.e., their IIF was flat throughout the entire latent trait distribution), or that provided low information at values of theta below or close to the average of the distribution. We chose to discard those items because our study goal was to support quality monitoring of programs operating in a predominantly low-quality context. In other words, items that were retained are particularly effective at guiding service improvement efforts that require distinguishing between ECE programs at the average and lower end of the quality distribution.
4.4.5. Step 5: Comparing the short and long forms
Step 5 involves creating shorter versions of the measure by progressively dropping items that have been identified as less informative (in Step 4) and comparing these versions in terms of: (a) the overall information they provide; and (b) the criterion validity of their scores (i.e., correlations with external variables). The information retained across different versions of a measure can be determined by comparing their TIF. As mentioned earlier, the TIF is a bell-shaped curve that represents the sum of the IIFs of all items on the measure. Because IRT item parameters are assumed to be invariant across populations and to be independent of other items embedded in the measure[27], individual IIFs can be added/subtracted to compare the information offered by different combinations of items.
In addition, the criterion validity of the total scores for different versions can also be examined to compare the precision that is “forgone” as items are being dropped from the measure. Criterion validity involves correlating the measure’s total score with external variables one would expect the measure to be correlated with. When streamlining a tool, ideally, one would want the strength of the correlations for the full-length measure and shorter versions of the measure to be quite similar; this would indicate that not much precision is being lost by dropping specific items.
In our example, for the Materials/Space and Classroom interactions dimensions, we compared in each case the TIF for the full dimension (i.e., comprised of all original items) to the TIFs of three shorter versions of the dimension. For Health/Safety, we maintained the original version of the dimension considering its very short length (i.e., four items) and the limited practical gains that would result from dropping only one or two items from the dimension. In addition, we assessed the strength of the correlations between the full dimension and the shorter dimension scores with teacher/classroom characteristics identified in the literature as potentially important for ECE quality, as well as child developmental outcomes. For the latter, we also examined correlations when controlling for a set of child and family characteristics (e.g., child age and gender, maternal education) that are highlighted in the literature as potential predictors of child development to see if their inclusion affected our results. For this exercise, MELE-A dimension scores were constructed as the average of all items on the dimension, then converted to z-scores.
4.4.6. Missing data and software
For the correlation analyses, we performed multiple imputation by chained equations (MICE) to handle missing data on the MELE-A items, teacher/classroom characteristics, child/family characteristics, and child outcomes. MICE was used given its efficiency, ability to use all available data, and preservation of sample size[52,53]. Missingness rates ranged from 1.6 to 22.8 percent for the MELE-A items, 1.2 to 16.8 percent for teacher/classroom characteristics, 7.5 to 30.8 percent for child and family controls, and 7.5 to 10.6 percent for child outcomes. All analyses were conducted in Stata 17[54].
5. Results
5.1. Step 4: IRT parameters estimation
Item information and location parameters are reported in Table 2, and IIFs are shown in Figure 1. TIFs and associated CSEM are shown in Figure 2.
For the Health/Safety dimension, item information parameters ranged from = 0.68-1.89 (Table 2). Two items, drinking water (item 1) and handwashing (item 2), stood out as very uninformative across all values of theta (Figure 1). Nonetheless, no items were flagged for exclusion considering the minimal gains in administration cost and time that would result from shortening this dimension.
For the Materials/Space dimension, information parameters ranged from = 0.35 - 3.40. Items related to classroom and yard space (items 14 and 16) were very uninformative across all values of theta. Child portfolios (item 13) also had a low information parameter (= 1.05) and provided information mostly at above-average values of ECE quality. These three items were identified as the first candidates for exclusion from this dimension (version 1). Additionally, two items were moderately informative at the target values of theta: whether the teacher was using a curriculum (item 11), and whether the teacher organized activities around a specific core topic or “theme” (item 12). These were flagged as items to be removed from a subsequent shorter version of the dimension (version 2). The availability of learning materials (items 5 to 8) were the most informative items, particularly at values of theta between -2 and 0. Related to these, item 15 assessing whether children could access materials organized into learning corners was also highly informative (a = 2.49), mostly at average values of the latent trait. These were identified as items that should be retained in all dimension specifications. Educational toys (item 9) and Storybooks (item 10) were relatively less informative than other learning materials and were the last two items to be flagged for exclusion from the dimension (version 3).
For the Classroom interactions dimension, information parameters ranged from = 0.63 – 2.22, with teacher negativity (item 23) identified as the first candidate for exclusion as it provided very little information throughout the latent trait distribution (version 1). Next, among the items assessing playful learning, free play (item 20) and music/movement (item 21) were flagged as the next candidates to be dropped, the former for being generally uninformative and the latter for being moderately informative, but mostly for above-average quality ECE programs (version 2). Finally, we also dropped playful learning for math and literacy (items 17 and 18), and retained only the most informative item assessing playful learning (fine motor activities, item 19). Items related to child and teacher engagement (items 22 and 24) as well as the provision of an individualized instruction (item 25) were highly informative at distinguishing between below-average quality ECE programs and were kept in all dimension specifications.

Table 2.
Item information and location parameters based on 2-pl IRT and Graded Response Models.
| Scale and Item | Scoring range |
a | b1 | b2 | b3 |
| Health/Safety (4 items) | |||||
| 1. Drinking water | [1-4] | 0.68 | -1.16 | -0.85 | -0.62 |
| 2. Handwashing | [1-4] | 0.76 | -1.71 | -0.41 | 1.76 |
| 3. Toilet facilities | [1-4] | 1.52 | -0.07 | 1.38 | 2.75 |
| 4. Safety conditions | [1-4] | 1.89 | -1.28 | -0.20 | 1.18 |
| Materials/Space (12 items) | |||||
| 5. Materials (writing) | [0-1] | 2.48 | -0.89 | ||
| 6. Materials (art) | [0-1] | 3.16 | -0.53 | ||
| 7. Materials (fantasy) | [0-1] | 3.40 | -0.31 | ||
| 8. Materials (blocks) | [0-1] | 3.38 | -0.12 | ||
| 9. Materials (toys) | [0-1] | 1.89 | -0.27 | ||
| 10. Materials (storybooks) | [0-1] | 1.69 | -0.22 | ||
| 11. Curriculum | [0-1] | 1.35 | -0.64 | ||
| 12. Theme | [0-1] | 1.58 | -0.53 | ||
| 13. Child Portfolios | [0-1] | 1.05 | 1.31 | ||
| 14. Classroom space | [0-1] | 0.35 | -2.15 | ||
| 15. Learning corners | [0-1] | 2.49 | 0.02 | ||
| 16. School yard | [0-1] | 0.92 | -0.39 | ||
| Classroom interactions (9 items) | |||||
| 17. Playful Learning (math) | [1-3] | 1.50 | -0.16 | 1.62 | |
| 18. Playful Learning (literacy) | [1-3] | 1.70 | -0.16 | 1.31 | |
| 19. Playful Learning (fine motor) | [1-3] | 2.19 | 0.39 | 1.31 | |
| 20. Playful Learning (free play) | [1-3] | 1.12 | -0.39 | 1.71 | |
| 21. Playful Learning (music) | [1-3] | 1.55 | 0.80 | 1.71 | |
| 22. Teacher engagement | [1-4] | 2.03 | -1.97 | -1.22 | 0.63 |
| 23. Teacher negativity (reversed) | [1-4] | 0.61 | -6.55 | -3.93 | -1.81 |
| 24. Child engagement | [1-4] | 1.76 | -1.83 | -0.86 | 0.68 |
| 25. Individualized instruction | [1-4] | 2.34 | -0.84 | -0.09 | 1.33 |
Note. Graded response models for Health/Safety (n = 246) and Classroom interactions (n = 247), and 2-parameter (2-PL) logistic model for Materials/Space (n = 247); a= information parameter estimates; b = location parameter estimates.
Figure 1.
(a) Item information function (IIF) estimated from graded response model (n = 246); (b) IIF estimated from graded response model (n = 247); (c) IIF estimated from 2-parameter logistic model model (n = 247).
Figure 1.
(a) Item information function (IIF) estimated from graded response model (n = 246); (b) IIF estimated from graded response model (n = 247); (c) IIF estimated from 2-parameter logistic model model (n = 247).
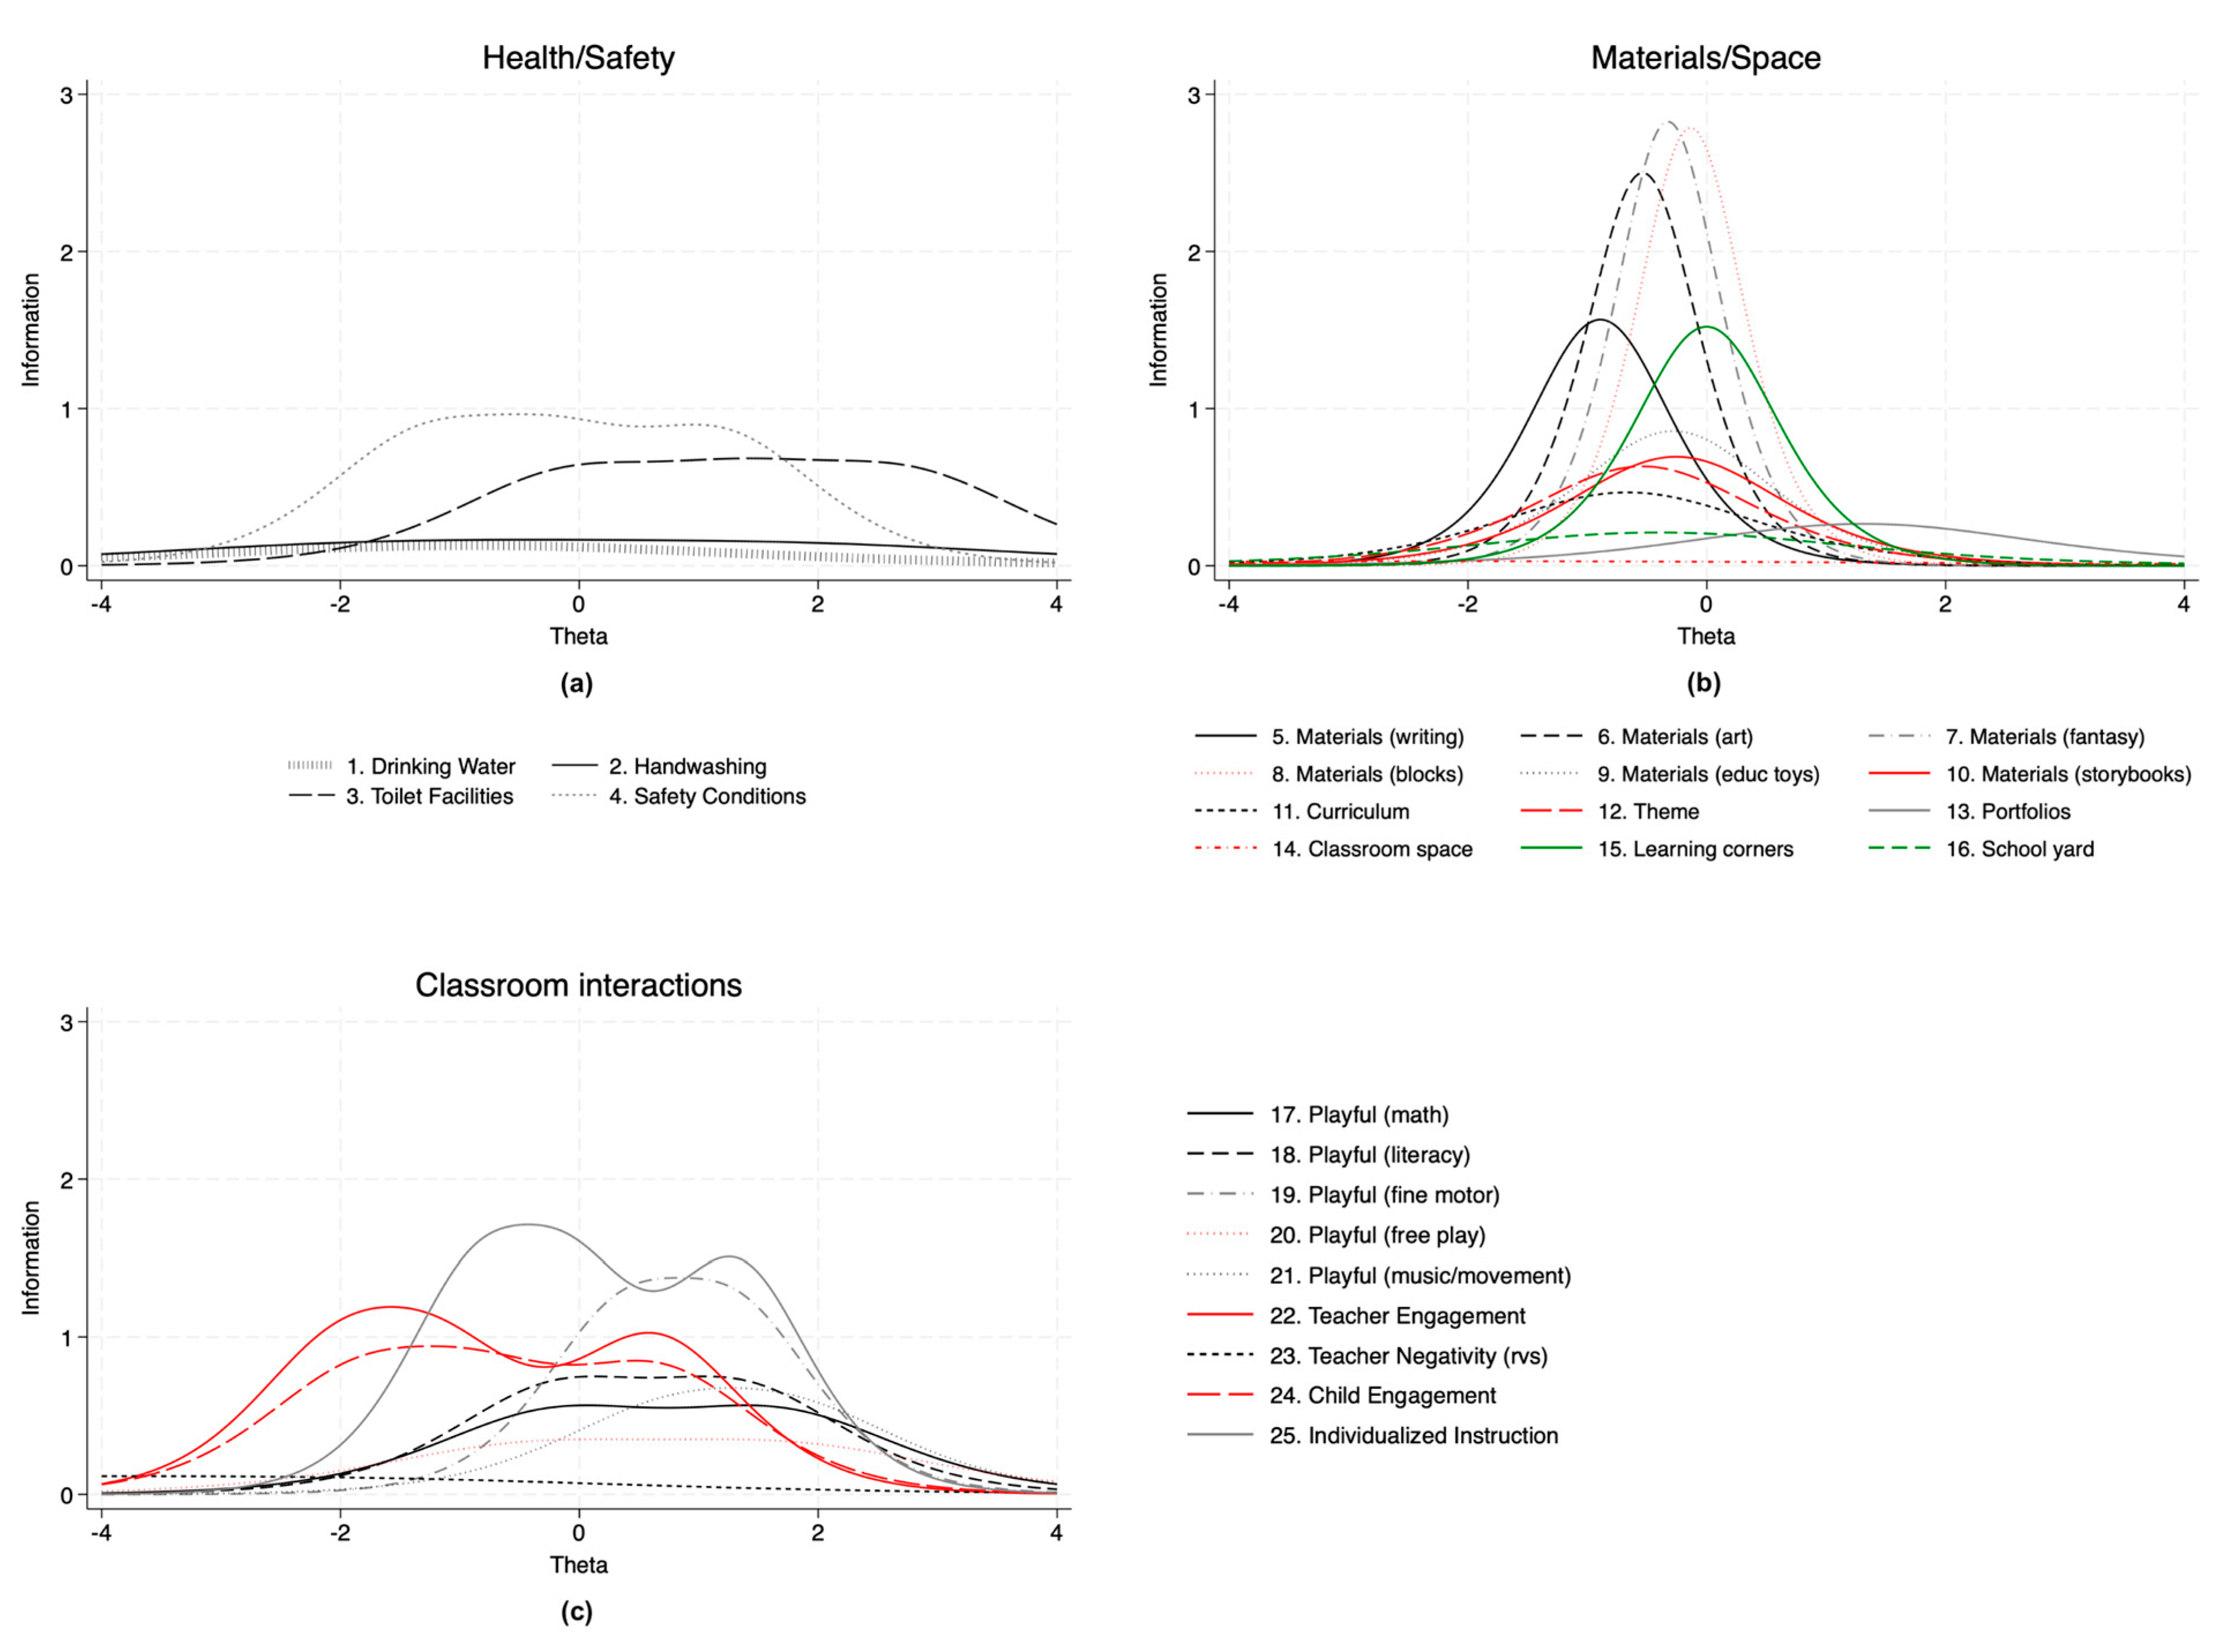
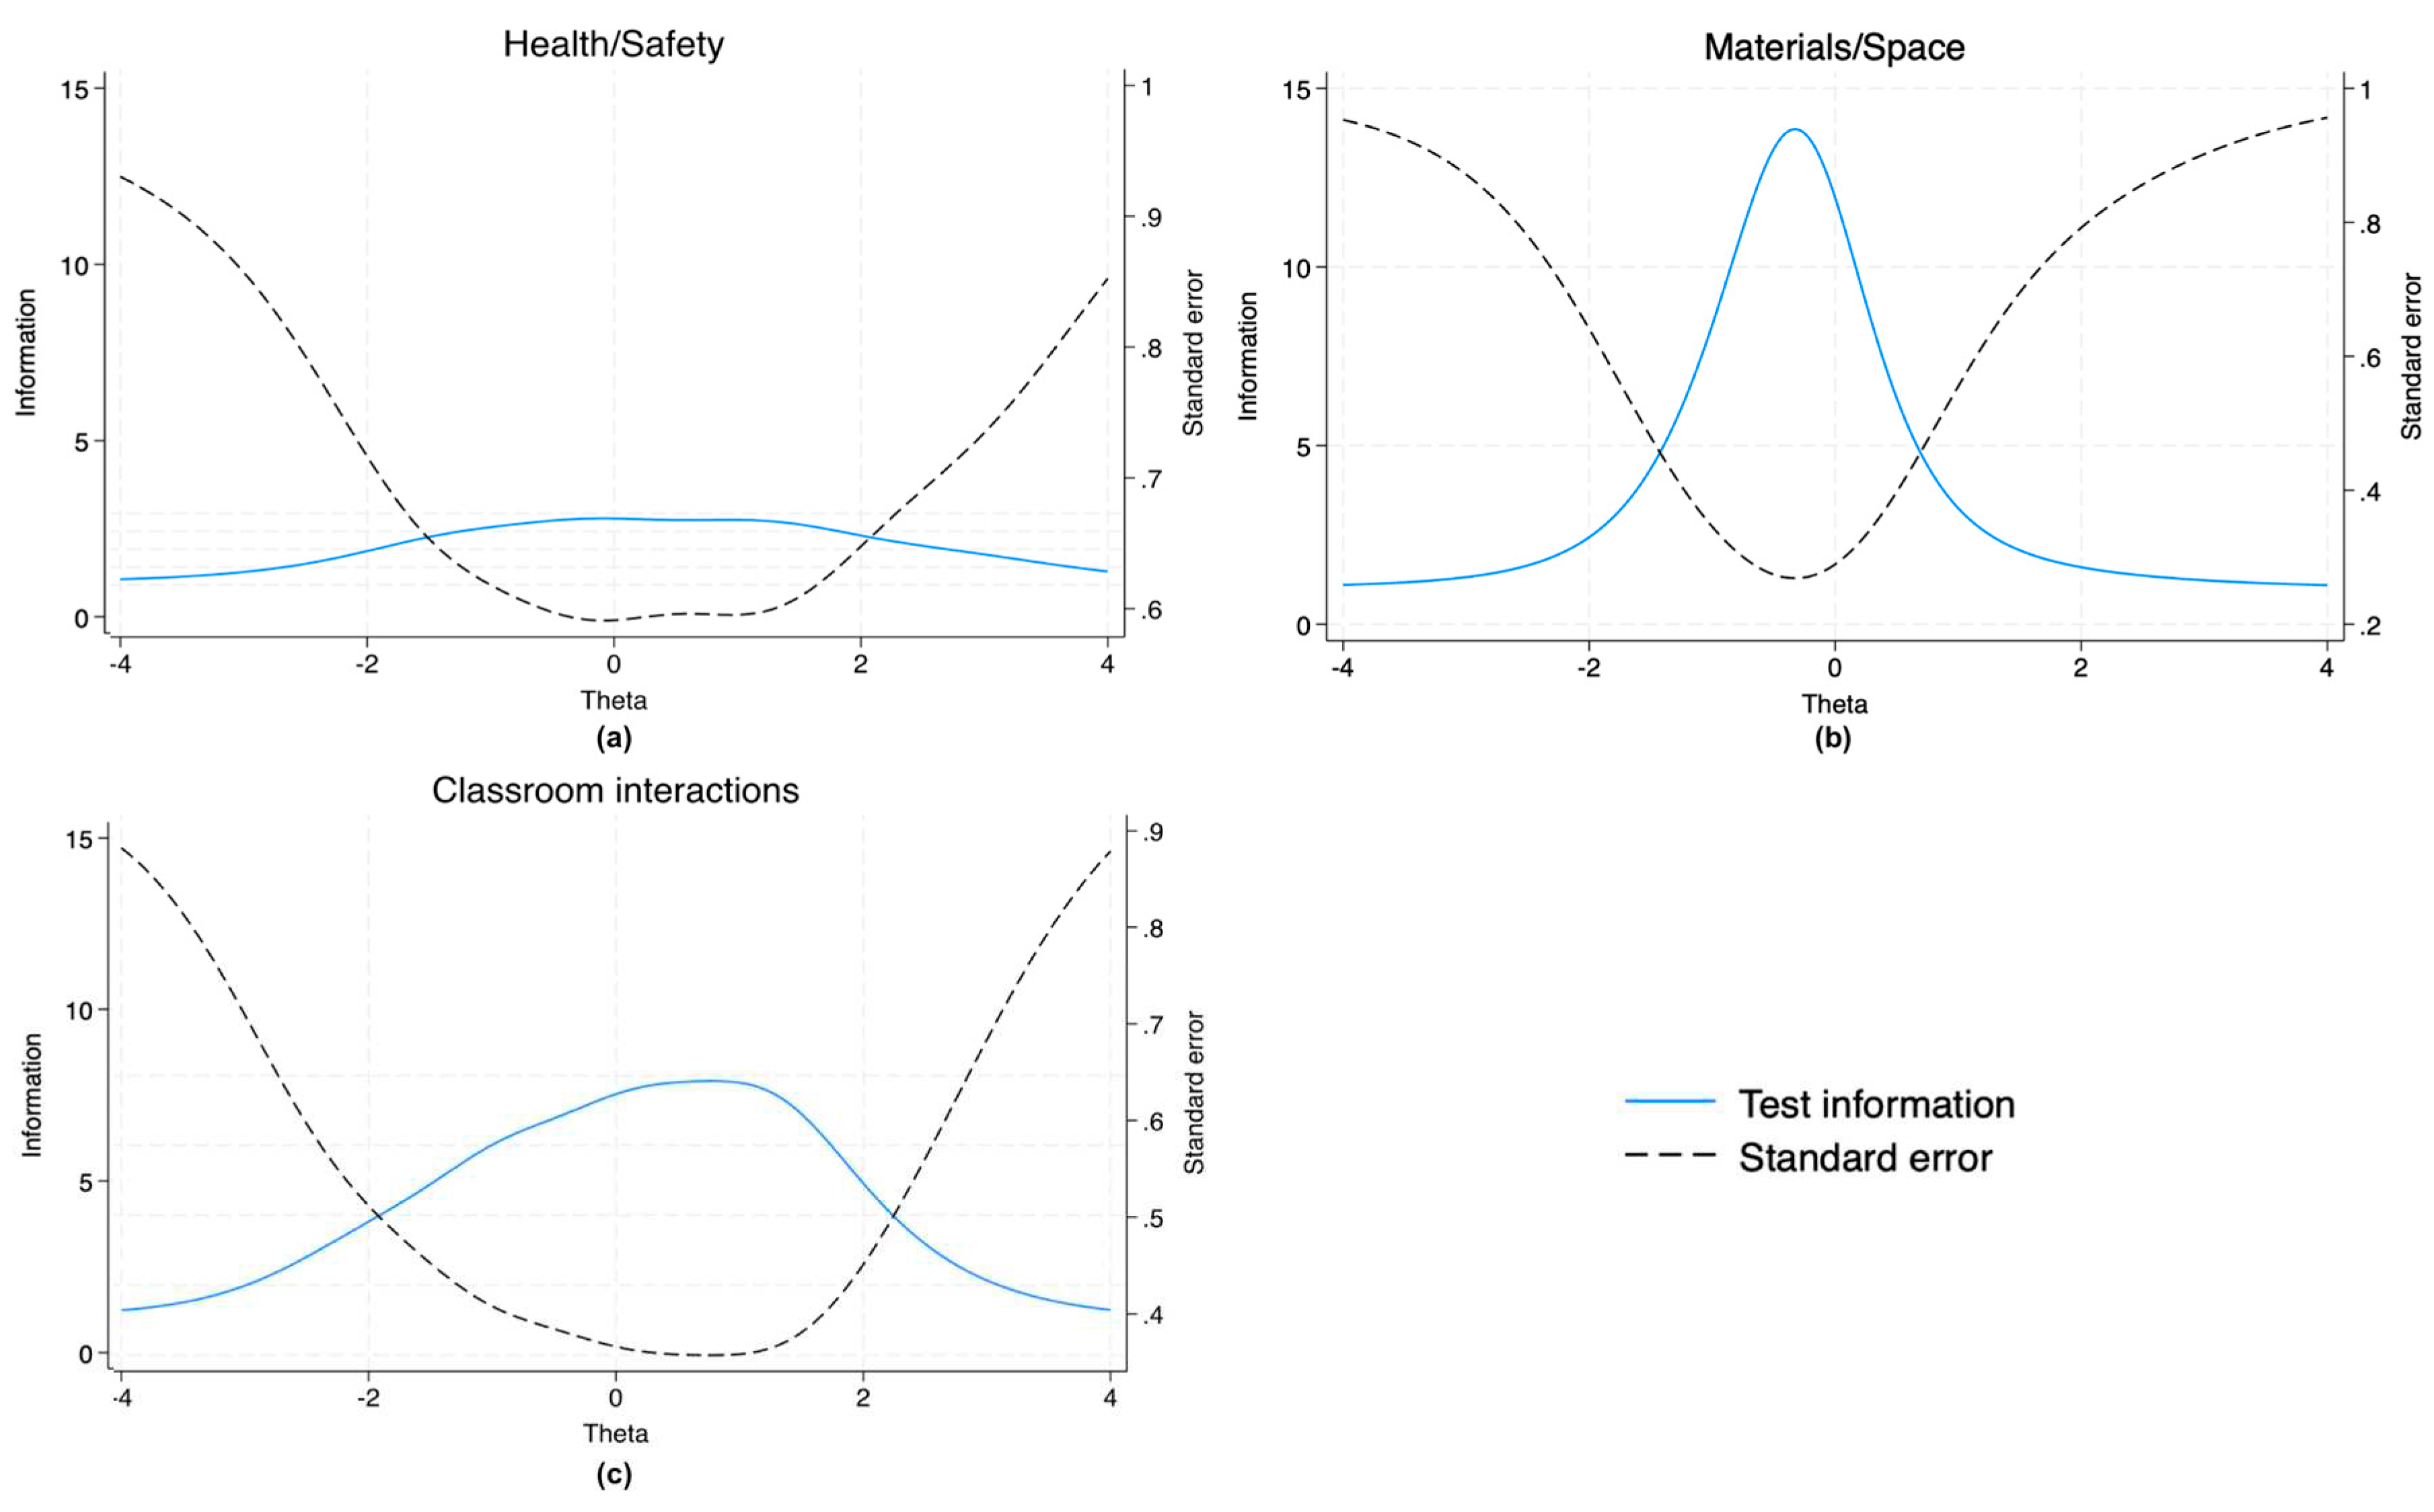
Figure 2.
(a) Test Information Function (TIF) and Conditional Standard Errors of Measurement (CSEM) estimated from graded response model (n = 246); (b) TIF and CSEM estimated from graded response model (n = 247); (c) TIF and CSEM estimated from 2-parameter logistic model (n = 247).
Figure 2.
(a) Test Information Function (TIF) and Conditional Standard Errors of Measurement (CSEM) estimated from graded response model (n = 246); (b) TIF and CSEM estimated from graded response model (n = 247); (c) TIF and CSEM estimated from 2-parameter logistic model (n = 247).
5.2. Step 5: Comparing the short and long forms
TIFs for different dimension specifications for Materials/Space and Classroom interactions are shown in Figure 3 and Figure 4, respectively. Details on which items were included in each specification are also reported in Table A3. Results showed that, in both cases, the reduction of items produced lower levels of information, but not considerably so. In particular, for the Materials/Space dimension, the reduction of information at values of theta below the average was very minimal (Figure 3). For the Classroom interactions dimension, the largest decrease in information at below-average values of theta occurred when dropping all items assessing playful learning except for fine motor activities (Figure 4).
Correlations with teacher/classroom characteristics and child outcomes are shown in Table 3. Correlation coefficients for teachers/classroom characteristics were of the expected sign (except for class size with the Health/Safety dimension) but low/very low in magnitude, including for the original versions of the dimensions. The Materials/Space dimension, in particular, had statistically significant correlations (in the expected direction) with most teacher/classroom characteristics. For child outcomes, only child development and learning had significant, positive correlations with all three dimensions, but again their magnitude was very low. Results were generally consistent when including child and family controls, although coefficients magnitudes were slightly lower (Table S2). Most importantly, for both teacher/classroom characteristics and child outcomes, the magnitude of the coefficients for the original dimensions and those for the shorter dimensions were practically the same.
Figure 3.
Test information functions (TIF) for different specifications of the Materials/Space subscale estimated from a 2-parameter logistic model (n = 247).
Figure 3.
Test information functions (TIF) for different specifications of the Materials/Space subscale estimated from a 2-parameter logistic model (n = 247).
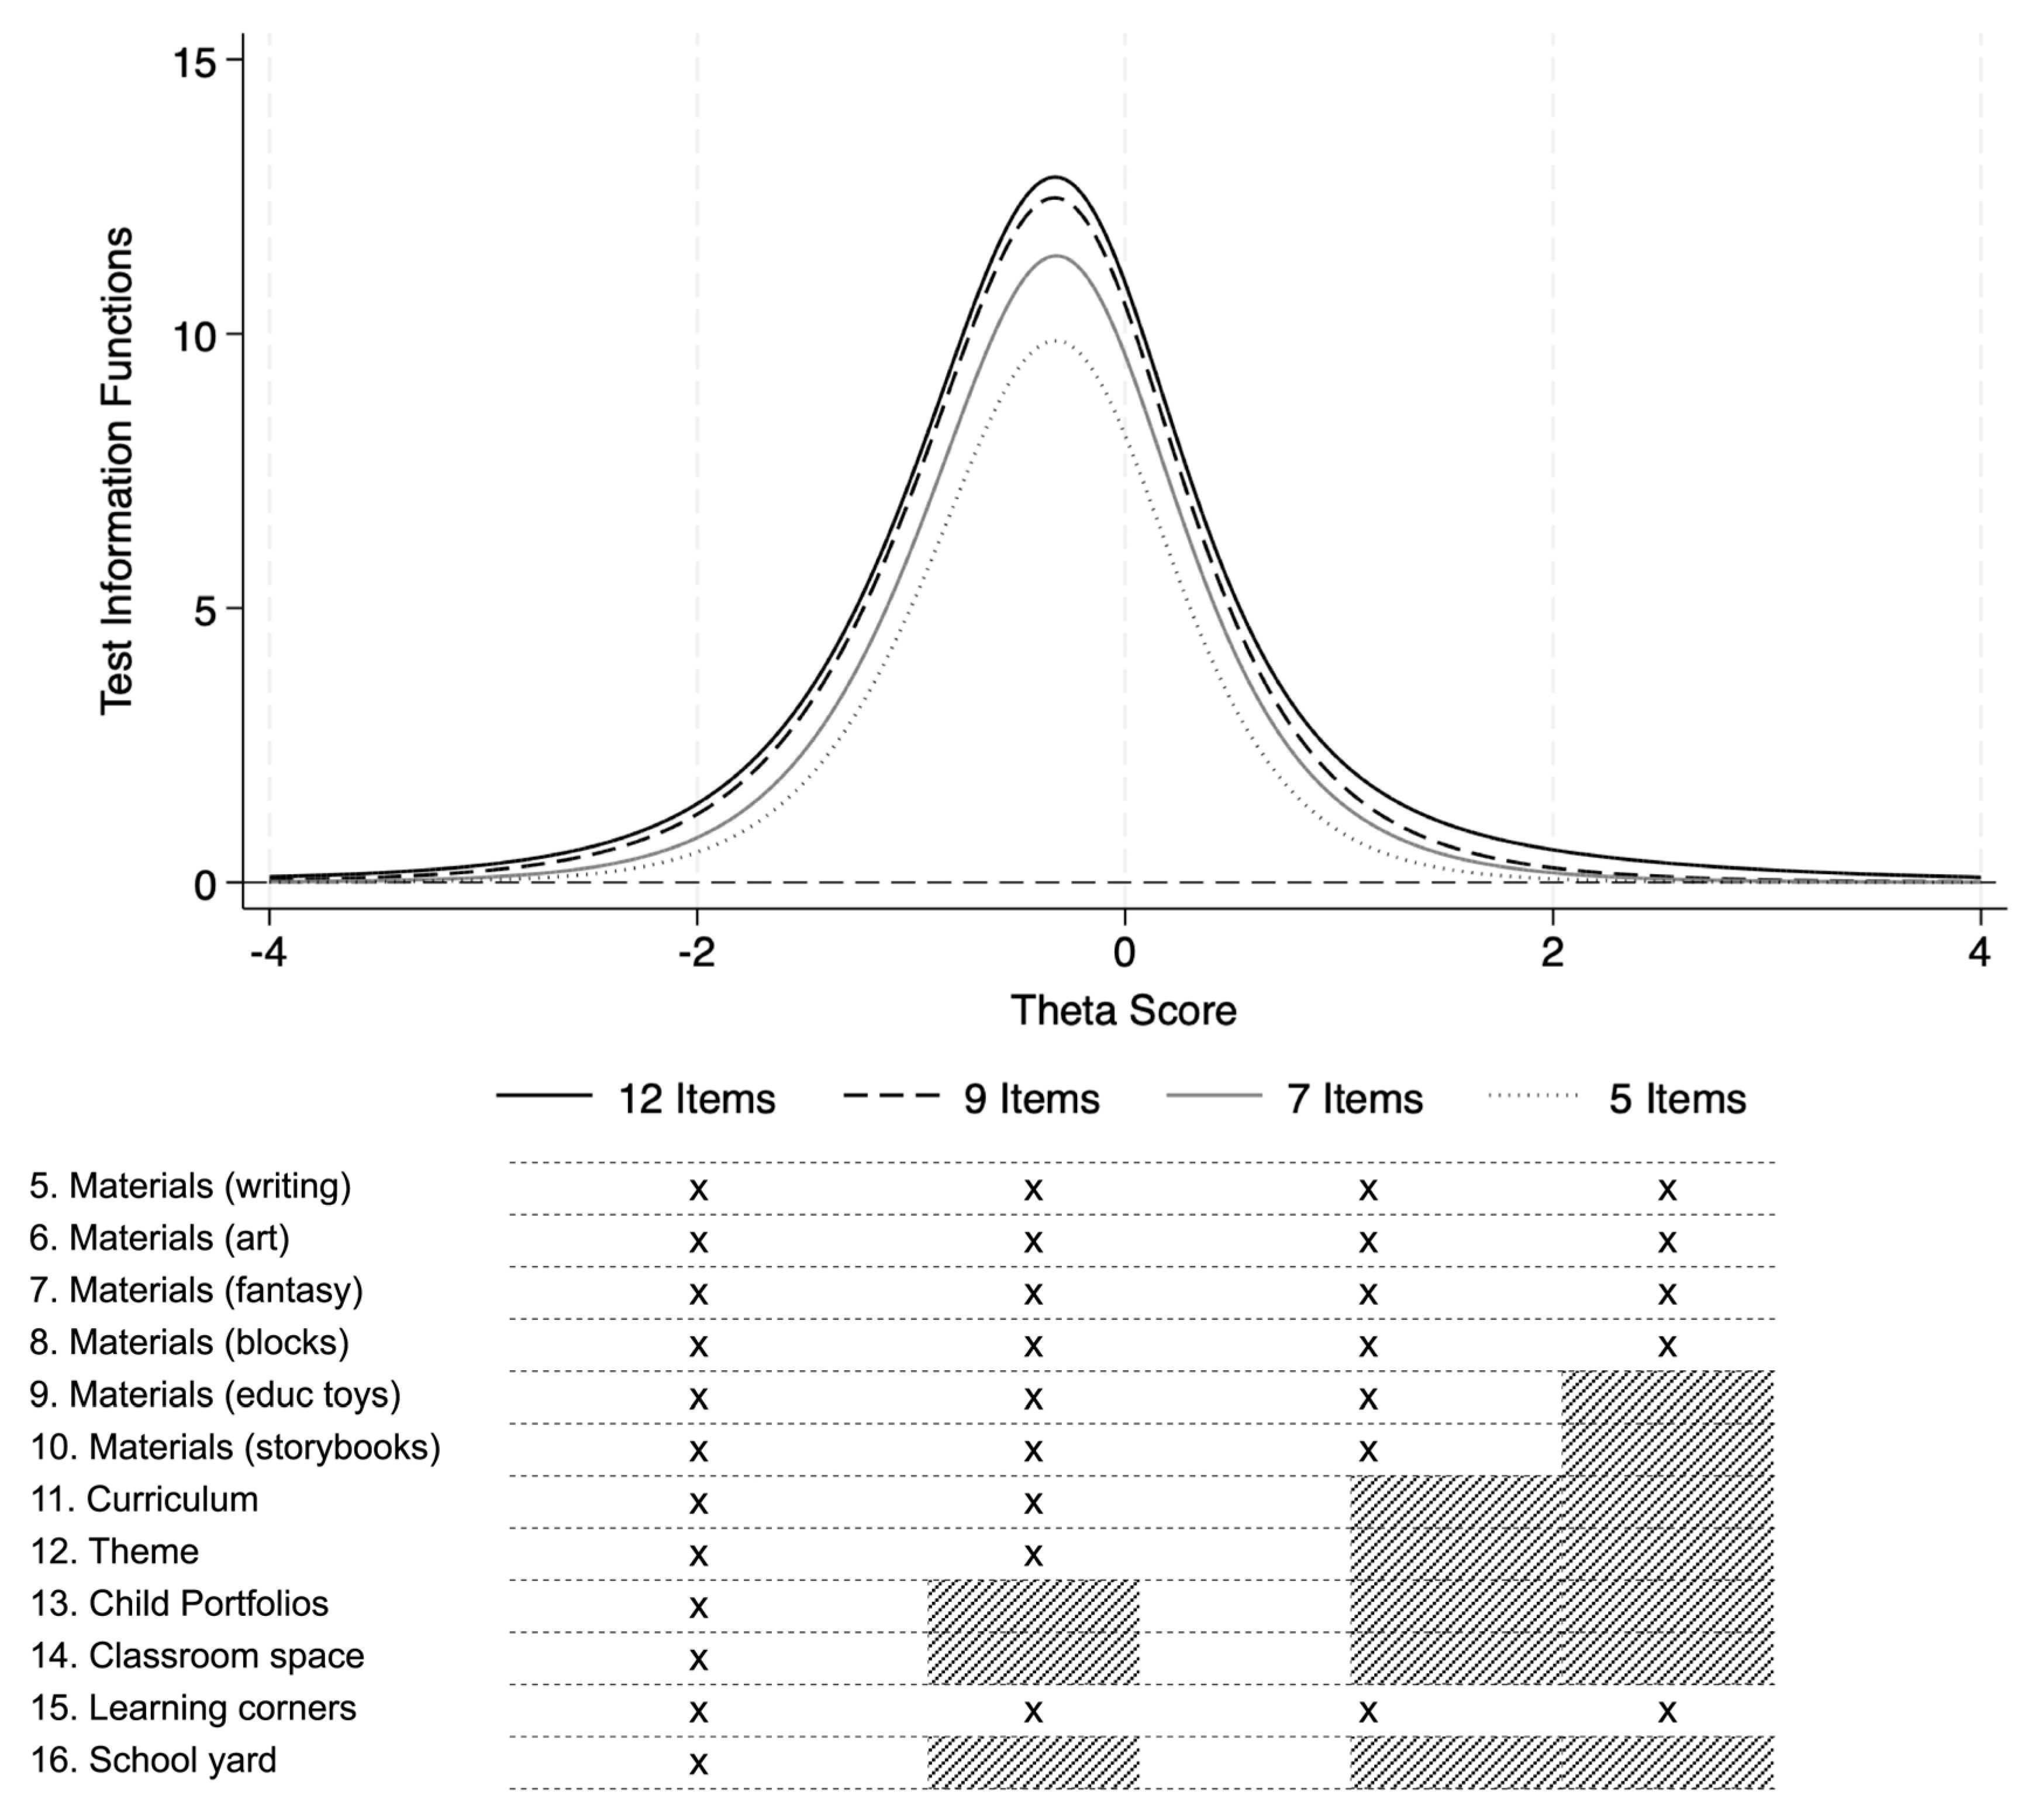
Figure 4.
Test information functions (TIF) for different specifications of the Classroom Interactions subscale estimated from a graded response model (n = 247).
Figure 4.
Test information functions (TIF) for different specifications of the Classroom Interactions subscale estimated from a graded response model (n = 247).
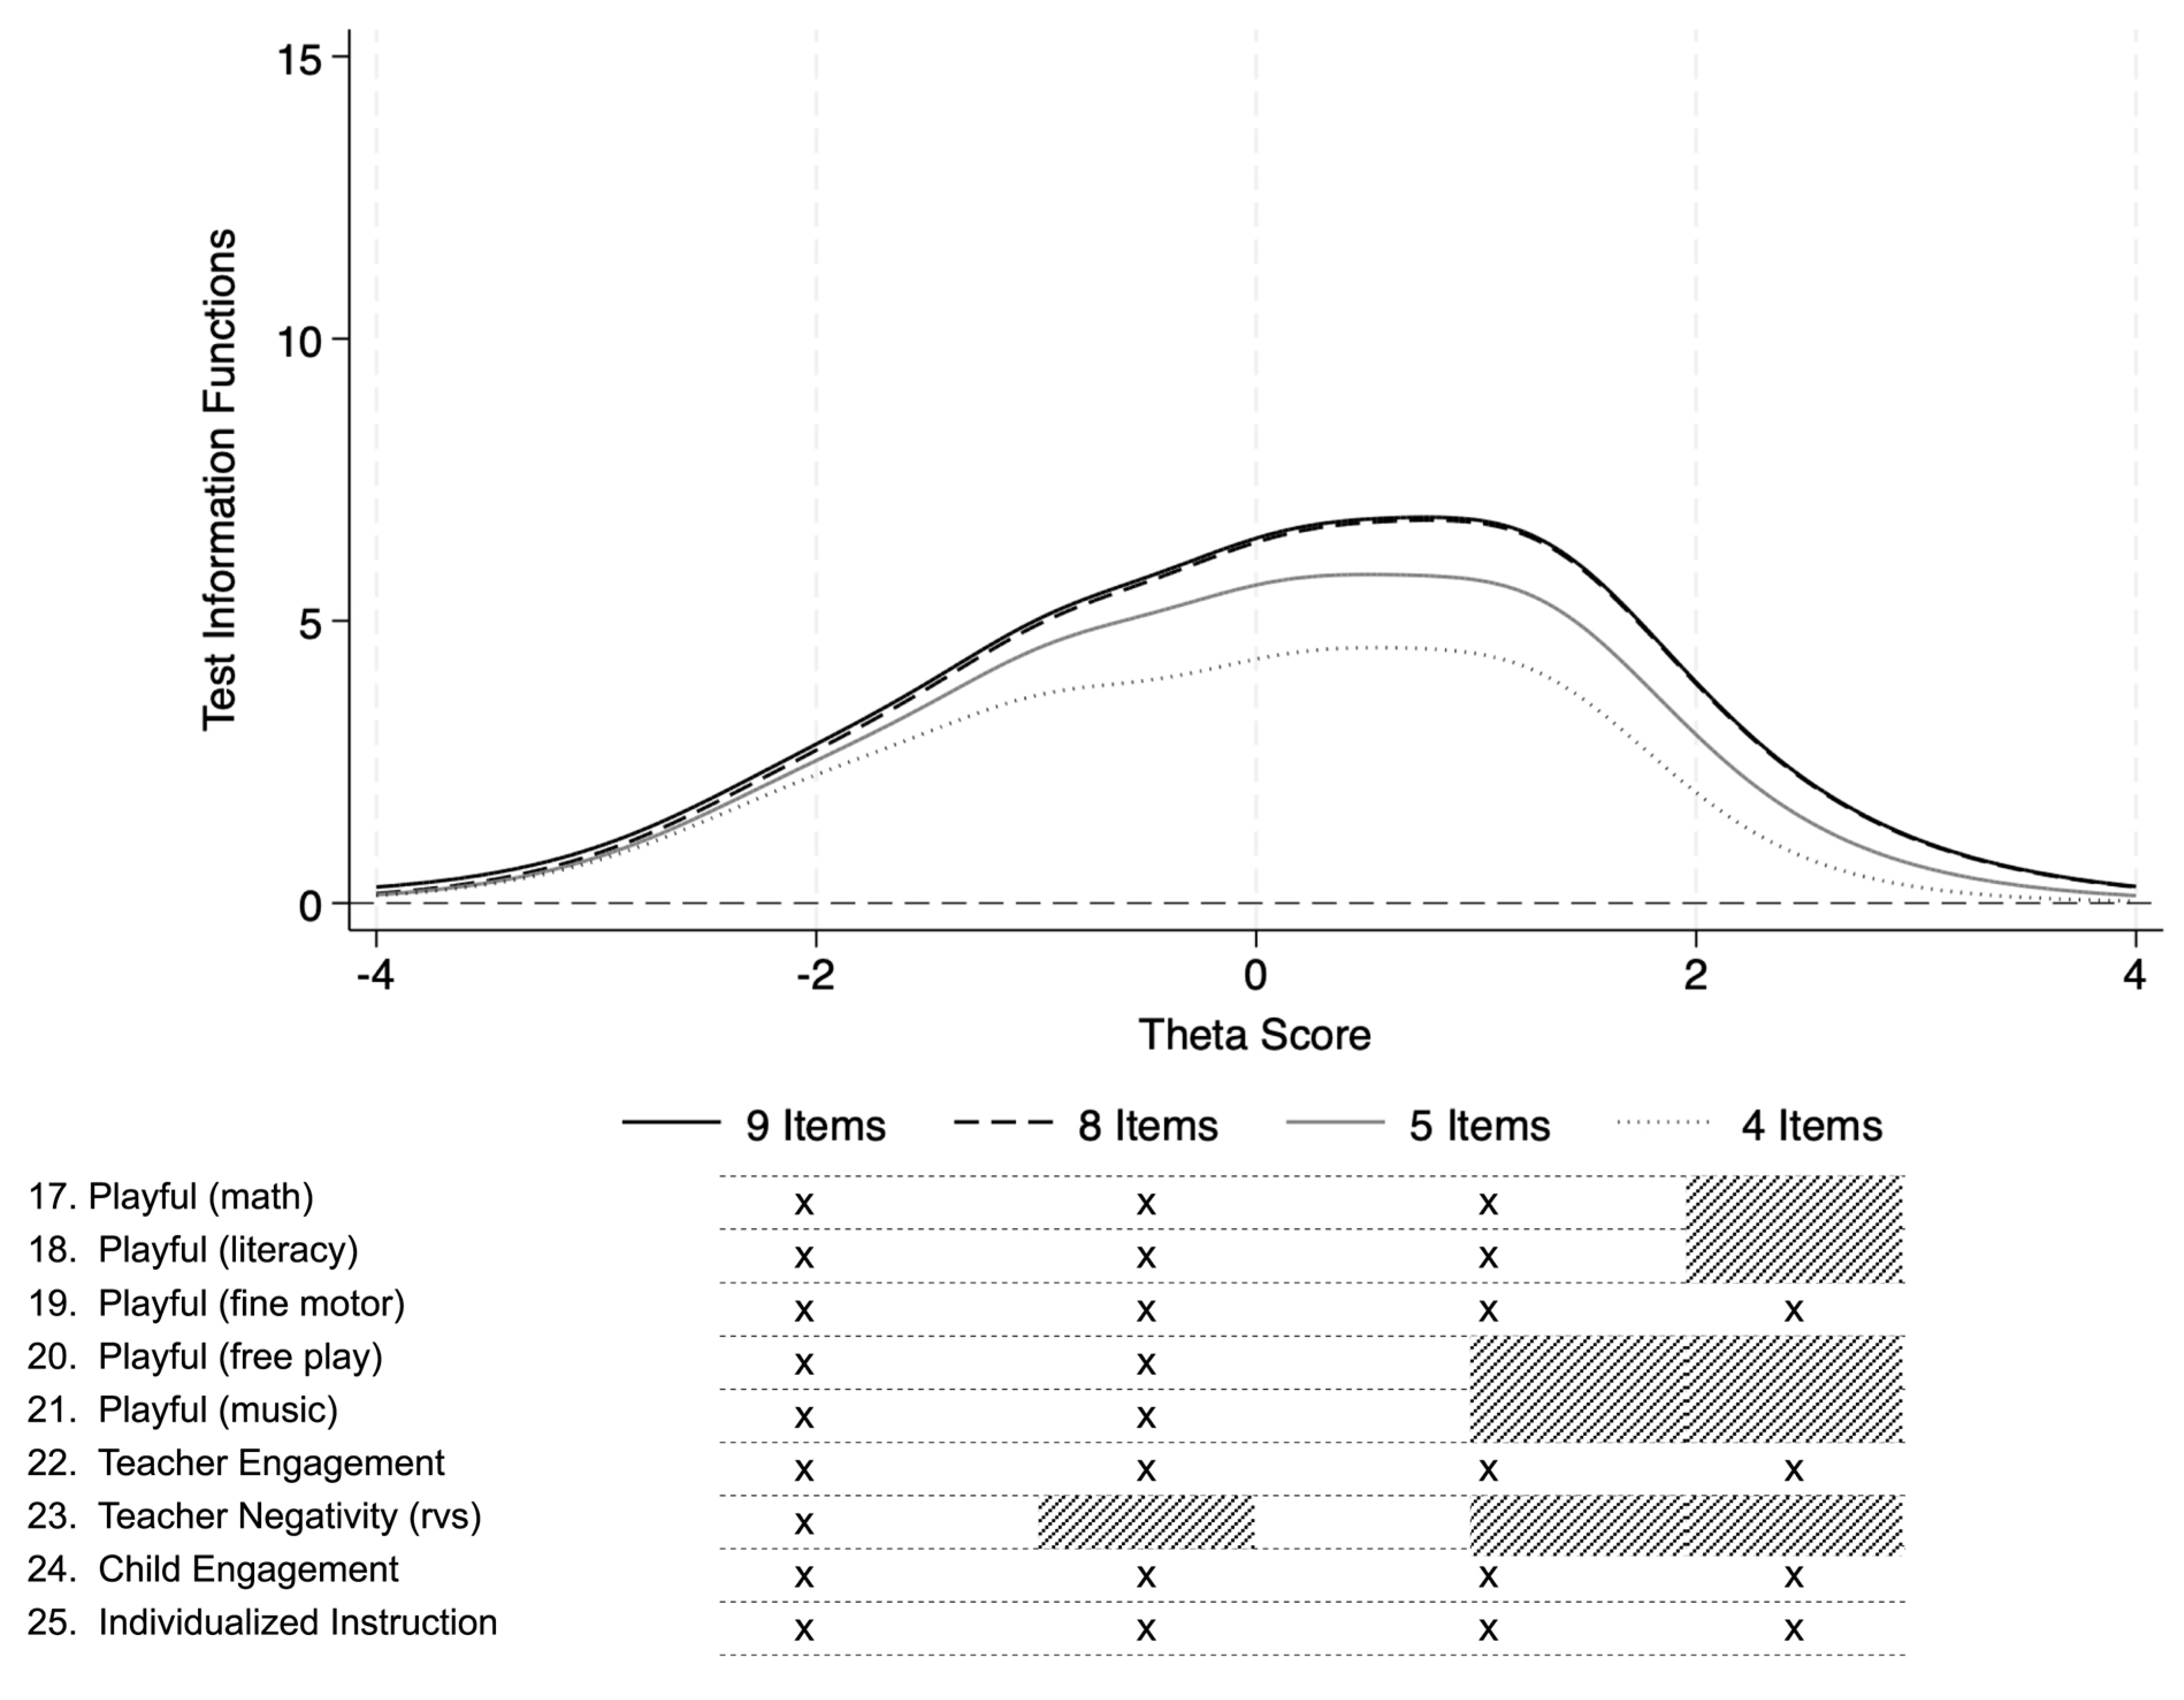
Table 3.
Validity evidence based on correlations with other variables.
| Panel A: correlations with teacher and classroom characteristics | ||||||
| Experience (yrs) | Education (yrs) | Job satisfaction |
Class size | Teacher-child ratio |
Private school | |
| Health/Safety (four items) | -0.06 | 0.21** | 0.06 | 0.17** | -0.16* | -0.10 |
| Materials/Space | ||||||
| Twelve items (full MELE-A) | 0.24** | 0.35** | 0.18** | 0.03 | -0.17* | -0.27** |
| Nine items | 0.25** | 0.33** | 0.19** | 0.03 | -0.17* | -0.24** |
| Seven items | 0.23** | 0.32** | 0.20** | 0.04 | -0.18* | -0.24** |
| Five items | 0.23** | 0.31** | 0.17* | 0.05 | -0.19** | -0.23** |
| Classroom interactions | ||||||
| Nine items (full MELE-A) | -0.06 | 0.16* | 0.16* | -0.04 | -0.04 | -0.10 |
| Eight items | -0.05 | 0.19** | 0.16* | -0.02 | -0.04 | -0.12+ |
| Five items | -0.04 | 0.21** | 0.17** | -0.03 | -0.02 | -0.14* |
| Four items | -0.05 | 0.21** | 0.15* | -0.00 | -0.01 | -0.13* |
| Panel B: correlations with child development outcomes | ||||||
| Development and learning | Socioemotional (PR) | Socioemotional (TR) | ||||
| Health/Safety (four items) | 0.11* | -0.06 | 0.00 | |||
| Materials/Space | ||||||
| Twelve items (full MELE-A) | 0.15** | 0.09* | 0.05 | |||
| Nine items | 0.16** | 0.07+ | 0.04 | |||
| Seven items | 0.15** | 0.08+ | 0.04 | |||
| Five items | 0.14** | 0.07+ | 0.04 | |||
| Classroom interactions | ||||||
| Nine items (full MELE-A) | 0.08+ | -0.03 | -0.02 | |||
| Eight items | 0.10* | -0.03 | -0.02 | |||
| Five items | 0.13** | 0.00 | -0.01 | |||
| Four items | 0.15** | 0.01 | 0.00 | |||
Note. Teacher job satisfaction is measured on a five-point Likert-like scale (1 "strongly disagree"; 5 "strongly agree"). In Panel B, child development scores are expressed in standard deviations. Standard errors are clustered at the classroom level. PR refers to parent-reported and TR to teacher-reported; + p < 0.10, * p < 0.05, ** p < 0.01.
6. Discussion
In this study, we showcased the empirical steps that can be used to streamline an ECE quality monitoring measure and create more efficient versions of the tool while minimally reducing its reliability and correlations with external variables. To illustrate these steps, we used data on the MELE-A that was administered to sample of 250 ECE programs in one anonymous Sub-Saharan African country. For Steps 1 to 3, we referred to findings reported by Raikes et al. [18], who reported that scores on the MELE-A had overall adequate internal consistency, and confirmed the hypothesized three-factor structure of the measure. We then built on their findings and showed, through IRT analyses, that several items on the MELE-A could be prioritized to create shorter versions of the instrument’s dimensions. Together with findings from correlational analyses with teacher/classroom characteristics and child outcomes, our results also showed that shorter versions of the MELE retained similar amounts of information on ECE quality and precision relative to the original instrument. Collectively, these findings demonstrated that it is possible to improve the MELE-A’s measurement efficiency by retaining a subset of highly informative items that maintain similar levels of psychometric adequacy. Researchers and practitioners interested in shortening the MELE for application in their setting should conduct these steps with local data, as the most efficient items on the measure will likely vary across contexts.
6.1. Improving measurement efficiency
Improving measurement efficiency is important considering the limited resources most countries and stakeholders can dedicate to ECE quality monitoring, as well as the current scarcity of quality measures that are feasible for routine administration at scale. In our example with the MELE-A, reducing the instrument’s length from 25 items (full length measure) to potentially 13 items (shortest version in our analyses; Table A3) creates efficiency gains by reducing (i) administration/scoring time, as well as (ii) training, administration and interpretation demands. However, specific efficiency gains differ from one dimension to another. For the Materials/Space dimension, for example, reducing items from 12 to four (Table A3) will mostly reduce administration/scoring time, will few consequences on training, administration and interpretation demands. Specifically, training and administration demands will be practically unchanged because all items on this dimension are very tangible, easy to verify, and are coded as a simple checklist that the fieldwork can fill out independently, without having to observe and document what the teacher and children are doing. In the shortest four-item version, however, fieldworkers can save on administration time considering they only have to do a quick “inventory” of four types of learning materials (i.e., for writing, art, fantasy play, and blocks), without the need to inspect outer spaces, or rate teachers’ use of teaching materials (e.g., curriculum, theme, child portfolios).
For the Classroom interactions dimension, on the other hand, reducing the total number of items from nine to four (Table A3) could significantly reduce training, administration and interpretation demands, with little-to-no impact on the time required for administration/scoring. All items on this dimension focus on children’s experiences and interactions with educators, which are very subtle and complex to observe and rate. Because items are ambiguous and leave room for subjective interpretation, each one requires extensive training before data collection to reach acceptable reliability levels across fieldworkers. As such, each item that is discarded significantly reduces the overall training workload. In addition, discarding items may even increase data quality during training as trainers/fieldworkers can focus all their time and attention on fewer items and, in doing so, become “expert” coders in the prioritized items. Data quality may also improve during data collection as fieldworkers’ cognitive load is reduced by having fewer items to focus on during the observation. On the other hand, observing four items instead of nine, in this example, is unlikely to reduce administration time. Even with fewer items to focus on, fieldworkers still need to allow sufficient time for routines and interactions to naturally unfold before they have enough information to rate the quality of children’s experiences. For example, in less than two hours, it would be very difficult for fieldworkers to evaluate the overall quality of the teacher’s engagement - specifically whether she seems to “often ignore children’s requests” or whether she appears to “enjoy teaching and shows verbal affection” - regardless of the total numbers of items on the dimension.
Based on these findings from the MELE-A, we can assume that specific efficiency gains from optimizing ECE quality monitoring tools will vary according to the nature and complexity of the items in the measure. Considering this, researchers and practitioners interested in shortening quality monitoring tools should carefully review the items on the specific measure they intend to optimize and make decisions regarding whether to retain or discard these items not only based on empirical results, but also practical considerations. Several measures other than the MELE are currently being developed specifically for use in Majority World countries including, for example, the Brief Early Childhood Quality Inventory[32] (BEQI) and the Teaching Quality in Early Childhood Education tool[55] (Teach ECE). While there is currently little-to-no literature on these instruments, their use is expected to increase in upcoming years. Future research documenting the trade-offs from optimizing one measure versus another could support researchers and practitioners in making more informed decisions when selecting a measure for application in their local context.
6.2. Maintaining the measure’s psychometric properties
Improving measurement efficiency while maintaining the original measure’s psychometric adequacy is also important to ensure the resulting, more efficient version of the tool is still measuring what it is supposed to. In this study, we showed that shorter versions of the MELE-A’s dimensions retained similar amounts of information and precision relative to the original instrument. This suggests that shorter versions of the MELE-A are not only more efficient (as described above), but also are not compromised in terms of their ability to capture information relevant to children’s development and learning.
However, it is important to note that for the original and short forms alike, the associations between the MELE and child outcomes were weak. These results call into question the MELE’A utility to monitor progress towards quality indicators that are relevant for child development. However, these weak correlations are also consistent with evidence from the field and highlight the universal challenge of developing ECE quality measures that are predictive of child outcomes. As detailed earlier, evidence from the United States shows low and inconsistent associations between ECE quality and child outcomes[56]. Evidence from Majority World countries is particularly rare and mixed [12]. In general, this suggests the field needs more research to improve the ability of these measures — particularly those intended for quality monitoring — to capture dimensions of quality relevant for child learning and development.
6.3. Construct and content relevance
We end with some cautionary notes about the empirical exercise presented in this study. Earlier, we discussed four themes that should be considered when developing an ECE quality monitoring measure: developmental and cultural relevance of content, logistical feasibility, data actionability, and psychometric rigor. In this study, we focused on improving the logistical feasibility and psychometric rigor of measures by using advanced psychometric techniques to guide the selection of highly informative items. While we succeeded in this goal, we recognize that there are important construct/content-relevant considerations that should be kept in mind during this type of exercise.
Regarding cultural and contextual relevance, for example, the prioritization of some items through a purely empirical exercise may lead to the deletion of other items that are highly valued in the local context or, further, are explicitly included in national standards as key indicators of quality. For example, when developing the full MELE-A in the anonymous Sub-Saharan country, content analysis led to the addition of an item on teachers’ use of a “theme” during the lesson to align with local teacher training programs[18]; in turn, this item was flagged as relatively uninformative in our empirical exercise. Therefore, local experts and stakeholders should review shortened versions of the tool to decide whether items flagged as good candidates for exclusion should in fact be discarded.
In addition, regarding data actionability, this exercise may also end up discarding items that are considered critical indicators for children’s safety, such as, for example, items included in the Health/Safety dimension of the MELE-A that assess risk factors related to water and toilet facilities. In such cases, it may be desirable to intentionally include some inefficient items (i.e., items that are not informative at distinguishing between programs of varying quality) to ensure all ECE settings comply with minimal safety standards. This may be particularly important in Majority World countries where structural quality levels tend to be much lower than in Minority World countries[5]. Moreover, local authorities may also decide to keep a few “easy” items (i.e., items with high rates of compliance) in order to increase confidence and motivation among ECE programs, particularly for those that consistently score at the lower end of the quality distribution.
On a related note, it is also important to recognize that measure development is as a dynamic exercise where item prioritization should evolve alongside changes in the overall quality of ECE programs in a given area. Specifically, if the goals of monitoring are being met, minimal levels of structural quality should improve over time, leaving more room for items describing the ideal learning environments ECE programs should be providing to children (e.g., items assessing the quality of the interactions they are exposed to). This shift in focus is important to ensure ECE settings can foster children’s development and support them in reaching their full potential, rather than simply keeping them safe while caregivers are at work.
Finally, we would like to emphasize that most efficient items on the MELE will vary across contexts and, as such, shortened versions of the measure presented in our analyses should not be used “as they are.” Instead, researchers and practitioners interested in shortening the MELE for application in their local context should follow the empirical steps presented in this study and prioritize highly informative items accordingly. This necessitates beginning the streamlining process with the more intensive and potentially costly exercise of collecting observational data using full-length tools across a representative group of ECE programs.
6.4. Limitations and future directions
There are two main limitations to this study. First, regarding internal validity, because the data were cross-sectional, we were not able to present causal evidence of the MELE-A’s predictive validity, or whether children’s experiences of higher-quality classrooms as defined by the MELE-A led to higher developmental outcomes over time. Second, there were limitations to how data for the MELE were collected, in particular the lack of detail documenting observer reliability, and the significant amount of missing data on some items which may have biased our results, even when imputations were implemented. Similarly, our sample of ECE programs was not nationally representative, leading to questions about the external validity of our findings at a national level.
As mentioned earlier, given their recent development, rigorous applications and psychometric studies on the MELE and similar instruments are still scarce. Future research on the MELE with longitudinal data and random selection of programs is important to address the above-mentioned limitations related to internal and external validity. In addition, sampling more than one classroom per ECE program would also improve analyses by allowing for the inclusion of program fixed effects and controlling for time-invariant characteristics of these settings and the populations that they serve (e.g., differences in socioeconomic status across neighborhoods). Also, sampling the same classroom more than once over a relatively limited amount of time would also allow to examine additional aspects of psychometric rigor, such as test-retest reliability. Finally, future studies which also include training data (e.g., inter-rater reliability, test-retest) would provide much-needed evidence on the potential for the MELE and similar measures to provide accurate and consistent data.
7. Conclusions
In sum, while many Majority World countries have expanded the coverage of their ECE programs, their quality remains a concern[1]. Monitoring data are crucial to guide program quality improvement efforts and support high-quality service delivery at scale. Currently, several measures such as the MELE are being developed to support national-level ECE quality monitoring specifically in Majority World countries. However, despite the potential for these instruments to respond to the conceptual and logistics needs of many programs operating in Majority World countries, rigorous psychometric studies on these measures are currently scarce. To our knowledge, this was the first study to pair practical, step-by-step guidance with empirical data from perhaps the most popular ECE quality assessment used in Majority World countries – the MELE – in the hopes of supporting practitioners and researchers interested in adopting and optimizing similar tools for regular quality monitoring in their local contexts. Given that quality monitoring systems are in their early stages in most Majority World countries — coupled with the fact that programs have limited resources to invest in quality assurance — this is a critical time to develop cost-efficient tools that can generate accurate data and, ultimately, ensure that children in these settings have an experience that supports their healthy development.
Supplementary Materials
The following supporting information can be downloaded at the website of this paper posted on Preprints.org., Table S1: Item prompts and scoring options for the MELE-A Classroom Observation Tool; Table S2: validity evidence based on associations with child developmental outcomes, controlling for child and family characteristics.
Author Contributions
Conceptualization, M.D., A.R., D.C.M.; methodology, M.D., A.R., D.C.M.; formal analysis, M.D.; writing—original draft preparation: M.D; writing— review and editing, M.D., A.R., D.C.M. All authors have read and agreed to the published version of the manuscript.
Funding
This research received no external funding.
Institutional Review Board Statement
This study used only secondary, de-identified data. The original study and data collection reported in Raikes et al. [18] were reviewed and approved by the first author’s institution as exempt under category 4b at 45 CFR 46.104 under the 2018 Requirements.
Data Availability Statement
This study used only secondary, de-identified data which may be made available upon request from the corresponding author. Data are not publicly available following instructions from the anonymous Sub-Saharan country to restrict their access.
Acknowledgments
The authors would like to thank the government officials, civil society, researchers and other stakeholders of the anonymous Sub-Saharan country involved in the adaptation process of the MELE. We would also like to thank all the fieldworkers, teachers and families involved in data collection for the original study. Finally, we also thank Prof. Andrew Ho and Prof. Junlei Li at Harvard University for their comments.
Conflicts of Interest
The authors declare no conflicts of interest.
Appendix A: Descriptive statistics for the Measuring Early Learning Environments – Adapted (MELE-A)
Item-level descriptive statistics for the MELE-A are reported in Table A1. Figure A1 shows the distribution of all non-dichotomous items on the measure, and Table A2 reports the inter-item correlations.
Table A1.
Item descriptive statistics and item-rest correlations for the MELE-A (n = 250).
| Subscale and Item | Scoring range |
n | Mean | SD | r |
| Health/Safety (4 items) | |||||
| 1. Drinking water | [1-4] | 237 | 2.89 | 1.40 | 0.22 |
| 2. Handwashing | [1-4] | 238 | 2.56 | 1.09 | 0.23 |
| 3. Toilet facilities | [1-4] | 245 | 1.72 | 0.83 | 0.38 |
| 4. Safety conditions | [1-4] | 240 | 2.58 | 0.99 | 0.41 |
| Materials/Space (12 items) | |||||
| 5. Materials (writing) | [0-1] | 193 | 0.75 | 0.44 | 0.57 |
| 6. Materials (art) | [0-1] | 203 | 0.66 | 0.48 | 0.67 |
| 7. Materials (fantasy) | [0-1] | 216 | 0.60 | 0.49 | 0.69 |
| 8. Materials (blocks) | [0-1] | 218 | 0.54 | 0.50 | 0.67 |
| 9. Materials (toys) | [0-1] | 213 | 0.57 | 0.50 | 0.58 |
| 10. Materials (storybooks) | [0-1] | 199 | 0.57 | 0.50 | 0.52 |
| 11. Curriculum | [0-1] | 227 | 0.66 | 0.47 | 0.46 |
| 12. Theme | [0-1] | 246 | 0.64 | 0.48 | 0.48 |
| 13. Child Portfolios | [0-1] | 241 | 0.24 | 0.43 | 0.30 |
| 14. Classroom space | [0-1] | 240 | 0.68 | 0.47 | 0.14 |
| 15. Learning corners | [0-1] | 240 | 0.50 | 0.50 | 0.58 |
| 16. School yard | [0-1] | 238 | 0.58 | 0.50 | 0.35 |
| Classroom interactions (9 items) | |||||
| 17. Playful Learning (math) | [1-3] | 226 | 1.68 | 0.71 | 0.49 |
| 18. Playful Learning (literacy) | [1-3] | 200 | 1.73 | 0.75 | 0.52 |
| 19. Playful Learning (fine motor) | [1-3] | 175 | 1.51 | 0.74 | 0.58 |
| 20. Playful Learning (free play) | [1-3] | 167 | 1.81 | 0.74 | 0.40 |
| 21. Playful Learning (music) | [1-3] | 219 | 1.42 | 0.71 | 0.53 |
| 22. Teacher engagement | [1-4] | 246 | 3.05 | 0.82 | 0.47 |
| 23. Teacher negativity (reversed) | [1-4] | 235 | 3.62 | 0.71 | 0.22 |
| 24. Child engagement | [1-4] | 234 | 2.92 | 0.92 | 0.38 |
| 25. Individualized instruction | [1-4] | 245 | 2.40 | 1.00 | 0.56 |
Note. r = item-rest correlation (i.e., correlation between each item and subscale score on the other items) for the Measuring Early Learning Environments – Adapted (MELE-A).
Figure A1.
Histograms for non-dichotomous items in the Measuring Early Learning Environments – Adapted (MELE-A).
Figure A1.
Histograms for non-dichotomous items in the Measuring Early Learning Environments – Adapted (MELE-A).
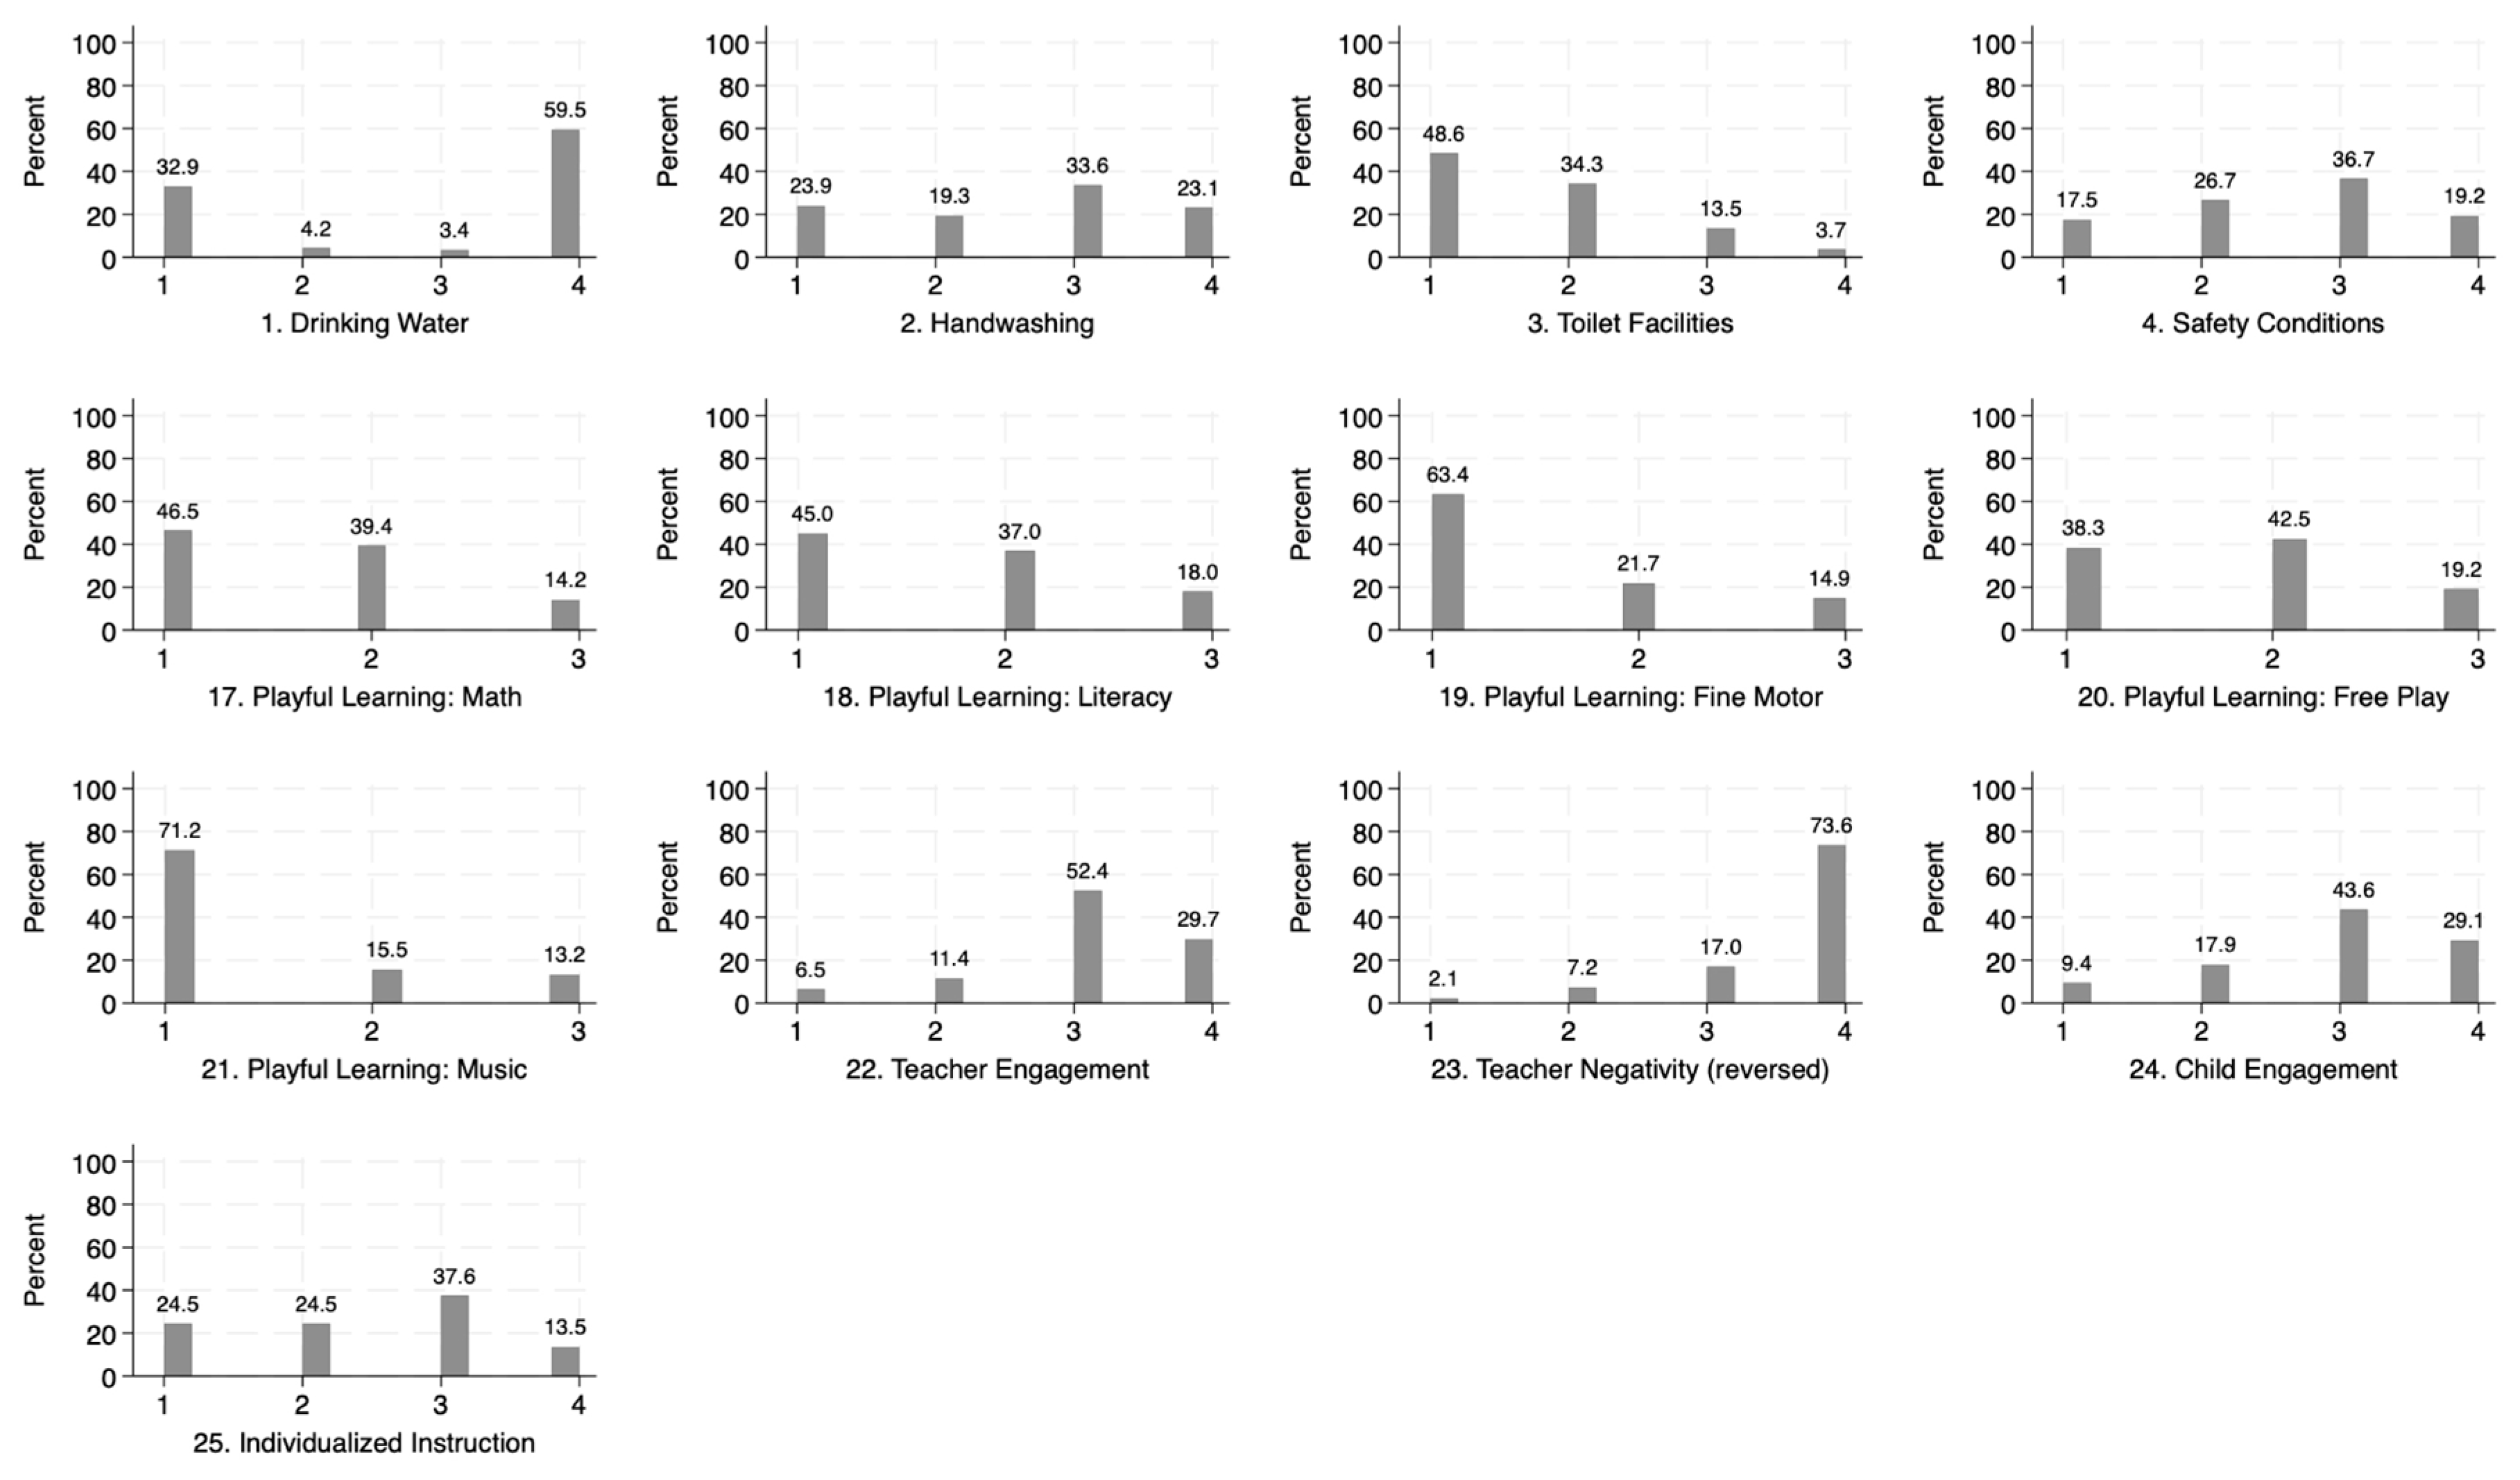
Table A2.
Inter-item correlations for the MELE-A.
| Health/Safety (4 items) | 1 | 2 | 3 | 4 | ||||||||
| 1. Drinking water | 1 | |||||||||||
| 2. Handwashing | 0.08 | 1 | ||||||||||
| 3. Toilet facilities | 0.25** | 0.16 | 1 | |||||||||
| 4. Safety conditions | 0.20** | 0.28** | 0.39** | 1 | ||||||||
| Materials/Space (12 items) | 5 | 6 | 7 | 8 | 9 | 10 | 11 | 12 | 13 | 14 | 15 | 16 |
| 5. Materials (writing) | 1 | |||||||||||
| 6. Materials (art) | 0.71** | 1 | ||||||||||
| 7. Materials (fantasy) | 0.48** | 0.54** | 1 | |||||||||
| 8. Materials (blocks) | 0.44** | 0.51** | 0.57** | 1 | ||||||||
| 9. Materials (toys) | 0.39** | 0.49** | 0.47** | 0.48** | 1 | |||||||
| 10. Materials (storybooks) | 0.27** | 0.41** | 0.46** | 0.45** | 0.31** | 1 | ||||||
| 11. Curriculum | 0.33** | 0.40** | 0.36** | 0.40** | 0.39** | 0.31** | 1 | |||||
| 12. Theme | 0.33** | 0.44** | 0.38** | 0.40** | 0.44** | 0.23** | 0.45** | 1 | ||||
| 13. Child Portfolios | 0.13 | 0.26** | 0.20** | 0.24** | 0.22** | 0.23** | 0.21** | 0.28** | 1 | |||
| 14. Classroom space | 0.10 | 0.21** | 0.13 | 0.07 | 0.20** | 0.16 | 0.05 | 0.02 | -0.05 | 1 | ||
| 15. Learning corners | 0.33** | 0.42** | 0.61** | 0.56** | 0.37** | 0.42** | 0.30** | 0.38** | 0.20** | 0.09 | 1 | |
| 16. School yard | 0.31** | 0.19** | 0.34** | 0.35** | 0.17 | 0.30** | 0.17 | 0.08 | 0.17** | 0.14 | 0.30** | 1 |
| Classroom interactions (9 items) | 17 | 18 | 19 | 20 | 21 | 22 | 23 | 24 | 25 | |||
| 17. Playful Learning (math) | 1 | |||||||||||
| 18. Playful Learning (literacy) | 0.53** | 1 | ||||||||||
| 19. Playful Learning (fine motor) | 0.43** | 0.41** | 1 | |||||||||
| 20. Playful Learning (free play) | 0.27** | 0.27** | 0.49** | 1 | ||||||||
| 21. Playful Learning (music) | 0.48** | 0.50** | 0.44** | 0.33** | 1 | |||||||
| 22. Teacher engagement | 0.29** | 0.33** | 0.36** | 0.19 | 0.27** | 1 | ||||||
| 23. Teacher negativity (reversed) | 0.08 | 0.07 | 0.14 | 0.08 | 0.11 | 0.35** | 1 | |||||
| 24. Child engagement | 0.23** | 0.28** | 0.39** | 0.27** | 0.16 | 0.47** | 0.10 | 1 | ||||
| 25. Individualized instruction | 0.34** | 0.35** | 0.49** | 0.36** | 0.34** | 0.45** | 0.23** | 0.50** | 1 |
Note. pairwise correlations for items on the Measuring Early Learning Environments – Adapted (MELE-A) ; + p < 0.10, * p < 0.05, ** p < 0.01.
Appendix B: Items included in the original and shorther versions of the Measuring Early Learning Environments – Adapted (MELE-A)
Table A3.
Original (full length) MELE-A and shorter versions.
| Scale and Item | 25 items (Original) | 21 items | 17 items | 13 items |
| Health/Safety (4 items) | ||||
| 1. Drinking water | x | x | x | x |
| 2. Handwashing | x | x | x | x |
| 3. Toilet facilities | x | x | x | x |
| 4. Safety conditions | x | x | x | x |
| Materials/Space (12 items) | ||||
| 5. Materials (writing) | x | x | x | x |
| 6. Materials (art) | x | x | x | x |
| 7. Materials (fantasy) | x | x | x | x |
| 8. Materials (blocks) | x | x | x | x |
| 9. Materials (toys) | x | x | x | |
| 10. Materials (storybooks) | x | x | x | |
| 11. Curriculum | x | x | ||
| 12. Theme | x | x | ||
| 13. Child Portfolios | x | |||
| 14. Classroom space | x | |||
| 15. Learning corners | x | x | x | x |
| 16. School yard | x | |||
| Classroom interactions (9 items) | ||||
| 17. Playful Learning (math) | x | x | x | |
| 18. Playful Learning (literacy) | x | x | x | |
| 19. Playful Learning (fine motor) | x | x | x | x |
| 20. Playful Learning (free play) | x | x | ||
| 21. Playful Learning (music) | x | x | ||
| 22. Teacher engagement | x | x | x | x |
| 23. Teacher negativity (reversed) | x | |||
| 24. Child engagement | x | x | x | x |
| 25. Individualized instruction | x | x | x | x |
References
- Yoshikawa, H.; Wuermli, A.J.; Raikes, A.; Kim, S.; Kabay, S.B. Toward High-Quality Early Childhood Development Programs and Policies at National Scale: Directions for Research in Global Contexts. Soc. Policy Rep. 2018, 31, 1–36. [Google Scholar] [CrossRef]
- Britto, P.R.; Yoshikawa, H.; Boller, K. Quality of Early Childhood Development Programs in Global Contexts Rationale for Investment, Conceptual Framework and Implications for Equity. Soc. Policy Rep. 2011, 25, 1–31. [Google Scholar] [CrossRef]
- McCoy, D.C.; Cuartas, J.; Behrman, J.; Cappa, C.; Heymann, J.; López Bóo, F.; Lu, C.; Raikes, A.; Richter, L.; Stein, A.; et al. Global Estimates of the Implications of COVID-19-related Preprimary School Closures for Children’s Instructional Access, Development, Learning, and Economic Wellbeing. Child Dev. 2021, 92, e883–e899. [Google Scholar] [CrossRef]
- United Nations Development Program The Millennium Development Goals Report 2015; United Nations: New York, 2015.
- Berlinski, S.; Schady, N. The Early Years. Child Well-Being and the Role of Public Policy; Palgrave Macmillan: New York, 2015; ISBN 978-1-137-53648-8. [Google Scholar]
- von Suchodoletz, A.; Lee, D.S.; Henry, J.; Tamang, S.; Premachandra, B.; Yoshikawa, H. Early Childhood Education and Care Quality and Associations with Child Outcomes: A Meta-Analysis. PloS One 2023, 18, e0285985–e0285985. [Google Scholar] [CrossRef] [PubMed]
- Meloy, B.; Gardner, M.; Darling-Hammond, L. Untangling the Evidence on Preschool Effectiveness: Insights for Policymakers; Learning Policy Institute: Palo Alto, CA, 2019. [Google Scholar]
- Maldonado-Carreño, C.; Yoshikawa, H.; Escallón, E.; Ponguta, L.A.; Nieto, A.M.; Kagan, S.L.; Rey- Guerra, C.; Cristancho, J.C.; Mateus, A.; Caro, L.A.; et al. Measuring the Quality of Early Childhood Education: Associations with Children’s Development from a National Study with the IMCEIC Tool in Colombia. Child Dev. 2022, 93, 254–268. [Google Scholar] [CrossRef] [PubMed]
- Zhang, L.; Ssewanyana, D.; Martin, M.-C.; Lye, S.; Moran, G.; Abubakar, A.; Marfo, K.; Marangu, J.; Proulx, K.; Malti, T. Supporting Child Development Through Parenting Interventions in Low- to Middle-Income Countries: An Updated Systematic Review. Front. Public Health 2021, 9, 671988–671988. [Google Scholar] [CrossRef]
- Raikes, A.; Sayre, R.; Davis, D.; Anderson, K.; Hyson, M.; Seminario, E.; Burton, A. The Measuring Early Learning Quality & Outcomes Initiative: Purpose, Process and Results. Early Years Lond. Engl. 2019, 39, 360–375. [Google Scholar] [CrossRef]
- Raikes, A.; Yoshikawa, H.; Britto, P.R.; Iruka, I. Children, Youth and Developmental Science in the 2015-2030 Global Sustainable Development Goals. Soc. Policy Rep. 2017, 30, 1–23. [Google Scholar] [CrossRef]
- Chen, S.; Wolf, S. Measuring the Quality of Early Childhood Education in Low- and Middle-Income Countries. Front. Psychol. 2021, 12, 774740–774740. [Google Scholar] [CrossRef] [PubMed]
- Leyva, D.; Weiland, C.; Barata, M.; Yoshikawa, H.; Snow, C.; Treviño, E.; Rolla, A. Teacher-Child Interactions in Chile and Their Associations With Prekindergarten Outcomes. Child Dev. 2015, 86, 781–799. [Google Scholar] [CrossRef]
- Lopez Boo, F.; Dormal, M.; Weber, A. Validity of Four Measures of Child Care Quality in a National Sample of Centers in Ecuador. PloS One 2019, 14, e0209987–e0209987. [Google Scholar] [CrossRef] [PubMed]
- Raikes, A.; Newman, M.J.; Burton, A. Quality Standards and Quality Assurance Systems for Pre-Primary Education; United Nations Children’s Fund: New York, 2019. [Google Scholar]
- Anderson, K.; Soonarane, M. Guide on Early Childhood Education Quality Assurance Systems for Africa; USAID Research Technical Assistance Center: Washington, DC, 2021. [Google Scholar]
- World Bank; United Nations Educational, S.; United Nations Children’s Fund; Brookings Institution, C. for U.E. Overview: Measuring Early Learning Quality and Outcomes (MELQO); Brookings Institution: Washington, DC, 2017;
- Raikes, A.; Koziol, N.; Davis, D.; Burton, A. Measuring Quality of Preprimary Education in Sub-Saharan Africa: Evaluation of the Measuring Early Learning Environments Scale. Early Child. Res. Q. 2020, 53, 571–585. [Google Scholar] [CrossRef]
- Anderson, K.; Raikes, A.; Kosaraju, S.; Solano, A. National Early Childhood Care and Education Quality Monitoring Systems; The Brookings Institution: Washington, DC, 2017. [Google Scholar]
- Howes, C.; Burchinal, M.; Pianta, R.; Bryant, D.; Early, D.; Clifford, R.; Barbarin, O. Ready to Learn? Children’s Pre-Academic Achievement in Pre-Kindergarten Programs. Early Child. Res. Q. 2008, 23, 27–50. [Google Scholar] [CrossRef]
- Mashburn, A.J.; Pianta, R.C.; Hamre, B.K.; Downer, J.T.; Barbarin, O.A.; Bryant, D.; Burchinal, M.; Early, D.M.; Howes, C. Measures of Classroom Quality in Prekindergarten and Children’s Development of Academic, Language, and Social Skills. Child Dev. 2008, 79, 732–749. [Google Scholar] [CrossRef] [PubMed]
- Hanno, E.C.; Gonzalez, K.E.; Lebowitz, R.B.; McCoy, D.C.; Lizárraga, A.; Korder Fort, C. Structural and Process Quality Features in Peruvian Early Childhood Education Settings. J. Appl. Dev. Psychol. 2020, 67, 101105–101115. [Google Scholar] [CrossRef]
- Hanno, E.C.; Jones, S.M.; Lesaux, N.K. Back to Basics: Developmental Catalysts of Quality Improvement in Early Education and Care. Policy Insights Behav. Brain Sci. 2021, 8, 200–207. [Google Scholar] [CrossRef]
- Pianta, R.C.; Hamre, B.K.; Nguyen, T. Measuring and Improving Quality in Early Care and Education. Early Child. Res. Q. 2020, 51, 285–287. [Google Scholar] [CrossRef]
- Raikes, A.; Sayre, R.; Lima, J.H.N.A. Early Childhood Care & Education Quality Assurance Systems in Africa; USAID Research Technical Assistance Center: Washington, DC, 2021. [Google Scholar]
- American Educational Research Association (AERA); American Psychological Association (APA); National Council on Measurement in Education (NCME). Standards for Educational and Psychological Testing; American Educational Research Association: Washington, DC, 2014; ISBN 978-0-935302-35-6. [Google Scholar]
- Yen, W.; Fitzpatrick, A.R. Item Response Theory. In Educational measurement; Brennan, R.L., Ed.; American Council on Education/Praeger: Westport, Connecticut, 2006; pp. 111–153. [Google Scholar]
- Raikes, A.; Rao, N.; Yoshikawa, H.; Cohrssen, C.; Behrman, J.; Cappa, C.; Devercelli, A.; Lopez Boo, F.; McCoy, D.; Richter, L. Global Tracking of Access and Quality in Early Childhood Care and Education. Int. J. Child Care Educ. Policy Seoul 2023, 17, 14–14. [Google Scholar] [CrossRef]
- Harms, T.; Clifford, R.; Cryer, D. Early Childhood Environment Rating Scale (ECERS-R); Rev. ed.; Teachers College Press: New York, 2004; ISBN 978-0-8077-4549-6. [Google Scholar]
- Pianta, R.C.; La Paro, K.; Hamre, B.K. Classroom Assessment Scoring System (CLASS) Manual, Pre-K; Paul H. Brookes Pub. Co.: Baltimore, MD, 2008; ISBN 978-1-55766-941-4. [Google Scholar]
- Seidman, E.; Raza, M.; Kim, S.; McCoy, J.M. Teacher Instructional Practices & Processes System–TIPPS: Manual and Scoring System; New York University: New York, 2014. [Google Scholar]
- Raikes, A.; Sayre Mojgani, R.; Heinzel-Nelson Alvarenga Lima, J.; Davis, D.; Cassell, C.; Waldman, M.; Escalante, E. Profiles of Quality in Three Distinct Early Childhood Programs Using the Brief Early Childhood Quality Inventory (BEQI). Int. J. Early Child. 2023, 1–26. [Google Scholar] [CrossRef]
- Lopez Boo, F.; Araujo, M.C.; Tomé, R. How Is Child Care Quality Measured?: A Toolkit; Inter-American Development Bank: Washington, DC, 2016. [Google Scholar]
- Araujo, M.C.; Dormal, M.; Schady, N. Childcare Quality and Child Development. J. Hum. Resour. 2019, 54, 656–682. [Google Scholar] [CrossRef]
- Rubio-Codina, M.; Dormal, M.; Araujo, M.C. Observing Home-visiting Quality at Scale with the Home Visit Rating Scales and a Supervisor Checklist in Peru. Infant Ment. Health J. 2019, 40, 343–362. [Google Scholar] [CrossRef]
- Araujo, M.C.; Carneiro, P.; Cruz-Aguayo, Y.; Schady, N. Teacher Quality and Learning Outcomes in Kindergarten *. Q. J. Econ. 2016, 131, 1415–1453. [Google Scholar] [CrossRef]
- Yoshikawa, H.; Leyva, D.; Snow, C.E.; Treviño, E.; Barata, M.C.; Weiland, C.; Gomez, C.J.; Moreno, L.; Rolla, A.; D’Sa, N.; et al. Experimental Impacts of a Teacher Professional Development Program in Chile on Preschool Classroom Quality and Child Outcomes. Dev. Psychol. 2015, 51, 309–322. [Google Scholar] [CrossRef]
- Hu, B.Y.; Dieker, L.; Yang, Y.; Yang, N. The Quality of Classroom Experiences in Chinese Kindergarten Classrooms across Settings and Learning Activities: Implications for Teacher Preparation. Teach. Teach. Educ. 2016, 57, 39–50. [Google Scholar] [CrossRef]
- Ertürk Kara, H.G.; Gönen, M.S.; Pianta, R. The Examination of the Relationship between the Quality of Teacher-Child Interaction and Children’s Self-Regulation Skills. H. U. Journal of Education. 2017, 32, 880–895. [Google Scholar] [CrossRef]
- von Suchodoletz, A.; Larsen, R.; Uka, F.; Nadyukova, I.; Pakarinen, E.; Lerkkanen, M.-K. Investigating Quality Indicators of Early Childhood Education Programs in Kosovo, Ukraine and Finland. Int. J. Early Years Educ. 2022, 30, 290–306. [Google Scholar] [CrossRef]
- Betancur, L.; Maldonado-Carreño, C.; Votruba-Drzal, E.; Bernal, R. Measuring Preschool Quality in Low- and Middle-Income Countries: Validity of the ECERS-R in Colombia. Early Child. Res. Q. 2021, 54, 86–98. [Google Scholar] [CrossRef]
- Mariano, M.; Caetano, S.C.; Ribeiro da Silva, A.; Surkan, P.J.; Martins, S.S.; Cogo-Moreira, H. Psychometric Properties of the ECERS-R Among an Epidemiological Sample of Preschools. Early Educ. Dev. 2019, 30, 511–521. [Google Scholar] [CrossRef]
- Li, K.; Hu, B.Y.; Pan, Y.; Qin, J.; Fan, X. Chinese Early Childhood Environment Rating Scale (Trial) (CECERS): A Validity Study. Early Child. Res. Q. 2014, 29, 268–282. [Google Scholar] [CrossRef]
- Malmberg, L.-E.; Mwaura, P.; Sylva, K. Effects of a Preschool Intervention on Cognitive Development among East-African Preschool Children: A Flexibly Time-Coded Growth Model. Early Child. Res. Q. 2011, 26, 124–133. [Google Scholar] [CrossRef]
- Su, Y.; Rao, N.; Sun, J.; Zhang, L. Preschool Quality and Child Development in China. Early Child. Res. Q. 2021, 56, 15–26. [Google Scholar] [CrossRef]
- Sincovich, A.; Lam, B.; Gregory, T.; Rodilosso, N.; Brinkman, S. Early Childhood Education Quality and Child Development in Lao Pdr. Popul. Med. 2023, 5. [Google Scholar] [CrossRef]
- Hentschel, E.; Tran, H.T.; Ha Nguyen, V.; Tran, T.; Yousafzai, A.K. The Effects of a Childcare Training Program on Childcare Quality and Child Development: Evidence from a Quasi-Experimental Study in Vietnam. Child. Youth Serv. Rev. 2023, 147, 106844. [Google Scholar] [CrossRef]
- Ponguta, L.A.; Maldonado-Carreño, C.; Kagan, S.L.; Yoshikawa, H.; Nieto, A.M.; Aragón, C.A.; Mateus, A.; Rodríguez, A.M.; Motta, A.; Varela, L.R.; et al. Adaptation and Application of the Measuring Early Learning Quality and Outcomes (MELQO) Framework to Early Childhood Education Settings in Colombia: Implications for National Policy and the Sustainable Development Goals. Z. Für Psychol. 2019, 227, 105–112. [Google Scholar] [CrossRef]
- Maldonado-Carreño, C. (Universidad de los A., Bogota, Colombia). Personal Communication, 2023.
- Seminario, E. (Global T. for C., New York University, USA). Personal Communication, 2023.
- Toland, M.D. Practical Guide to Conducting an Item Response Theory Analysis. J. Early Adolesc. 2014, 34, 120–151. [Google Scholar] [CrossRef]
- Lall, R. How Multiple Imputation Makes a Difference. Polit. Anal. 2016, 24, 414–433. [Google Scholar] [CrossRef]
- McCleary, L. Using Multiple Imputation for Analysis of Incomplete Data in Clinical Research. Nurs. Res. N. Y. 2002, 51, 339–343. [Google Scholar] [CrossRef]
- StataCorp. Stata Statistical Software: Release 17; StataCorp LLC: College Station, TX, 2021. [Google Scholar]
- World Bank Group Teach ECE (English). Available online: http://documents.worldbank.org/curated/en/872841622106329571/Teach-ECE (accessed on 8 January 2014).
- Burchinal, M. Measuring Early Care and Education Quality. Child Dev. Perspect. 2018, 12, 3–9. [Google Scholar] [CrossRef]
Table 1.
Descriptive statistics on children, teachers, and schools.
| n | Mean/ % | SD | |
| Children and families (N = 979) | |||
| Female (%) | 906 | 0.54 | 0.49 |
| Age (years) | 860 | 5.49 | 0.54 |
| Child has disability (%) | 900 | 0.13 | 0.34 |
| Mother's highest level of education (%) | |||
| Less than primary | 677 | 0.13 | 0.34 |
| Primary | 677 | 0.47 | 0.50 |
| Middle school | 677 | 0.19 | 0.39 |
| High school | 677 | 0.12 | 0.32 |
| College or higher | 677 | 0.10 | 0.30 |
| Assets (% out of 15) | 903 | 0.44 | 0.18 |
| Child was read to at least once last week (%) | 889 | 0.20 | 0.40 |
| Child played with adult at least once last week (%) | 890 | 0.27 | 0.44 |
| Number of child storybooks | 902 | 0.58 | 2.35 |
| Child plays with (%) | |||
| Homemade toys | 902 | 0.78 | 0.42 |
| Toys from shop | 904 | 0.74 | 0.44 |
| Household objects | 904 | 0.90 | 0.30 |
| Teachers (N = 250) | |||
| Female (%) | 221 | 0.88 | 0.32 |
| Age (years) | 222 | 39.66 | 12.06 |
| Preprimary experience (years) | 208 | 9.10 | 7.31 |
| Highest education level (%) | |||
| Less than primary | 221 | 0.04 | 0.20 |
| Primary | 221 | 0.24 | 0.43 |
| Middle school | 221 | 0.29 | 0.45 |
| High school | 221 | 0.19 | 0.39 |
| College or higher | 221 | 0.24 | 0.43 |
| Perceptions (1 "strongly disagree"; 5 "strongly agree") | |||
| Satisfied with job | 222 | 4.07 | 1.08 |
| Receives adequate support from school board | 221 | 3.98 | 1.18 |
| Overwhelmed with workload | 222 | 2.28 | 1.22 |
| Has adequate resources for teaching | 222 | 2.36 | 1.31 |
| Has training to be an effective teacher | 222 | 3.35 | 1.34 |
| Classrooms & Schools (N = 250) | |||
| Teacher-child ratio | 242 | 0.11 | 0.07 |
| Class size | 243 | 19.94 | 17.12 |
| School is private (%) | 247 | 0.85 | 0.36 |
Disclaimer/Publisher’s Note: The statements, opinions and data contained in all publications are solely those of the individual author(s) and contributor(s) and not of MDPI and/or the editor(s). MDPI and/or the editor(s) disclaim responsibility for any injury to people or property resulting from any ideas, methods, instructions or products referred to in the content. |
© 2024 by the authors. Licensee MDPI, Basel, Switzerland. This article is an open access article distributed under the terms and conditions of the Creative Commons Attribution (CC BY) license (http://creativecommons.org/licenses/by/4.0/).
Copyright: This open access article is published under a Creative Commons CC BY 4.0 license, which permit the free download, distribution, and reuse, provided that the author and preprint are cited in any reuse.


