Submitted:
18 January 2024
Posted:
19 January 2024
You are already at the latest version
Abstract
Metastatic castration-resistant prostate cancer (mCRPC) remains a lethal disease due to the absence of effective therapies. A more comprehensive understanding of molecular events, encompassing the dysregulation of microRNAs (miRs) and metabolic reprogramming, holds the potential to unveil precise mechanisms underlying mCRPC. This study aims to assess the expression of selected serum exosomal miRs (miR-15a, miR-16, miR-19a-3p, miR-21, and miR-141a-3p) alongside serum metabolomic profiling and their correlation in patients with mCRPC and benign prostate hyperplasia (BPH). Blood serum samples from mCRPC patients (n=51) and BPH patients (n=48) underwent metabolome analysis through 1H-NMR spectroscopy. The expression levels of serum exosomal miRs in mCRPC and BPH patients were evaluated using quantitative real-time polymerase chain reaction (qRT‒PCR). The 1H-NMR metabolomics analysis revealed significant alterations in lactate, acetate, citrate, 3-hydroxybutyrate, and branched-chain amino acids (BCAAs, including valine, leucine, and isoleucine) in mCRPC patients compared to BPH patients. MiR-15a, miR-16, miR-19a-3p, and miR-21 exhibited a down-regulation of more than twofold in the mCRPC group. Significant correlations were predominantly observed between lactate, citrate, acetate, and miR-15a, miR-16, miR-19a-3p, and miR-21. The importance of integrating metabolome analysis of serum with selected serum exosomal miRs in mCRPC patients has been confirmed, suggesting their potential utility as clinical diagnostic markers.
Keywords:
metastatic castration-resistant prostate cancer
; microRNA
; 1H-NMR metabolomics
1. Introduction
Prostate cancer stands as the second most prevalent cancer globally, exhibiting the highest incidence rates in North and South America, Europe, Australia, and the Caribbean [1]. Despite being commonplace, the existing diagnostic methods for prostate cancer, incorporating digital rectal examination (DRE), serum prostate-specific antigen (PSA) levels, and transrectal ultrasound (TRUS)-guided biopsy, remain unsatisfactory [2]. Radiological imaging techniques, such as multiparametric magnetic resonance imaging (mpMRI), and nuclear medicine methods, notably skeletal scintigraphy and positron emission tomography (PET) utilizing 68Ga prostate-specific membrane antigen (PSMA) ligands, play pivotal roles in diagnosing advanced stages of prostate cancer [3]. There is also an increasing focus on MRI-guided prostate biopsy [4].
Metastatic castration-resistant prostate cancer represents the terminal stage of prostate cancer, marked by the failure of antiandrogen therapy and the metastasis of cancer to distant organs, such as the skeleton [5]. This condition is inevitably linked with a grim prognosis for the patient [6]. Recent advances in the systemic treatment of mCRPC encompass chemotherapy with Docetaxel and Cabazitaxel, immunotherapy, and nuclear medicine therapies such as 223RaCl2 (Xofigo), 177Lu PSMA, and 225Ac PSMA [7].
Cancer cells have long been recognized for their extensive metabolic alterations, and the reprogramming of cellular energy metabolism represents an emerging hallmark of cancer, exemplified by the Warburg effect [8]. In normal prostate epithelial cells, aerobic conditions typically lead to glycolysis instead of oxidative metabolism. These cells utilize glucose and aspartate to synthesize and secrete citrate into the lumen, a crucial component of semen [9,10]. This metabolic profile is a consequence of zinc accumulation in prostate cells, inhibiting the tricarboxylic acid (TCA) cycle enzyme, m-aconitase [11]. The progression of prostate cancer involves a decrease in zinc concentrations, leading to the reactivation of m-aconitase and the initiation of citrate oxidation through the TCA cycle [12]. In contrast to many tissues in the human body, the metabolism of primary prostate cancer cells is characterized by high lipogenesis, lower glycolysis, and dependence on oxidative phosphorylation [13]. Consequently, citrate can be exported to the cytoplasm and converted back into acetyl-CoA for de novo synthesis of fatty acids and cholesterol [14]. Characteristic of advanced metastatic stages, prostate cancer cells become highly glycolytic, inhibiting mitochondrial respiration and exhibiting the Warburg effect. Additionally, deregulated anabolism/catabolism of fatty acids and amino acids have been identified as metabolic regulators supporting cancer cell growth [15].
MicroRNAs (miRs) are small non-coding RNA molecules that regulate gene expression and can be dysregulated in various types of diseases, including prostate cancer [16]. Analyzing their expression in prostatic tissues or biological fluids, such as blood, can help identify specific patterns associated with the disease. Additionally, these panels provide prognostic markers, with specific miRs linked to tumor aggressiveness and prognosis, offering insights into disease spread and treatment response. Furthermore, changes in miRs expression during treatment can be monitored for insights into therapy effectiveness and potential therapeutic targets in manipulating miRs for influencing prostate cancer growth or metastasis. The amalgamation of miRs and PSA data exhibited heightened sensitivity and specificity for prostate cancer diagnosis compared to utilizing PSA alone. This integrated diagnostic strategy outperformed the use of PSA in isolation, where sensitivity and specificity are increased [17].
The analysis of a miRs panel in prostate cancer offers additional insights into the molecular aspects of the disease. The presence of malignancy in an organism is evident through altered metabolism, and it is known that many miRs play a critical role in regulating cellular metabolism under normal and pathological conditions. Therefore, the present study aimed to determine the changes in the expression of selected exosomal miRs (miR-15a, miR-16, miR-19a-3p, miR-21, and miR-141a-3p) along with the serum metabolomic profiles between mCRPC and BPH patients, for use as potential non-invasive candidate biomarkers for accurate prostate cancer diagnosis.
2. Results
2.1. Relative changes in blood metabolites
Statistically significant differences were observed in the relative concentrations of blood serum metabolites associated with energy metabolism, including lactate, acetate, citrate, 3-hydroxybutyrate, and essential amino acids BCAAs between mCRPC patients and the BPH group (Table 1). The most notable alterations were evident for citrate (relative difference of 38%) and acetate (relative difference of 24%). Valine and leucine, sharing numerous biochemical pathways, exhibited very similar changes, both decreasing by about 18% in the mCRPC group compared to the BPH group. The alteration in blood serum levels of their third co-metabolite isoleucine was weaker, with a marginally significant decrease of 11% in mCRPC patients against BPH patients. Figure 1 presents boxplots illustrating the significantly altered metabolites in the serum of mCRPC patients and the BPH group.
Comparison of median serum concentrations of metabolites such as alanine, glucose, pyruvate, phenylalanine, tyrosine, glutamine, threonine, lysine, branched-chain keto acids (BCKAs), creatine, creatinine, proline, histidine, succinate, and tryptophan did not reveal significant differences.
2.2. Exosomal miRNA expression in the serum samples of mCRPC
Table 2 presents the fold regulation levels of selected exosomal miRs, namely miR-15a, miR-16, miR-19a-3p, miR-21, and miR-141a-3p. The results demonstrate that the expression levels of serum exosomal miR-15a, miR-16, miR-19a-3p, and miR-21 were significantly down-regulated in mCRPC patients compared with BPH patients (p < 0.05). Among them, the highest three-fold decrease was observed in the expression level of miR-16 in mCRPC compared to BPH patients. However, the expression level of miR-141a-3p did not exhibit a significant variation within the mCRPC patient group compared to the BPH group (p > 0.05).
Table 3 shows the Pearson correlation coefficient (PCC) for selected serum exosomal miRs (miR-15a, miR-16, miR-19a-3p, miR-21, and miR-141a-3p). The analysis revealed a large number of significant correlations at the p < 0.05 level. We found a significant positive correlation between miR-15a, miR-16, miR-19a-3p, and miR-21 levels in patients with mCRPC.
2.3. Correlations between miRs and metabolites levels
We investigated the correlation between the expression profile of selected serum exosomal miRs and metabolites in mCRPC patients (Table 4). Lactate showed a significant correlation with miR-15a, miR-16, and miR-19a-3p (p < 0.05), respectively. The results demonstrated that citrate and lysine were negatively correlated with serum miR-15a, miR-19a-3p, and miR-21 (p < 0.05), respectively. A significant correlation of 3-hydroxybutyrate with miR-15a and miR-21 (p < 0.05) was also observed. Furthermore, acetate was positively correlated with miR-19a-3p, miR-21, and miR-141a-3p (p < 0.05), respectively. Additionally, glutamine levels were positively correlated with miR-15a and miR-16 (p < 0.05). BCAAs did not show a significant correlation with selected exosomal miRs.
3. Discussion
As of the present date, mCRPC remains an incurable disease, and ongoing research is focused on novel therapeutic agents aimed at maximizing the survival and quality of life for these patients. Consequently, it is crucial to identify critical events in the progression of prostate malignancy through the integration of metabolomic and other omics techniques. NMR spectroscopy has proven to be a suitable methodology for evaluating the metabolic profile, effectively distinguishing between mCRPC patients and those with benign prostatic hyperplasia. Our findings indicate that certain metabolites, such as lactate, acetate, and citrate, are present in higher concentrations in the blood serum of mCRPC patients, while others, including 3-hydroxybutyrate and branched-chain amino acids (BCAAs), are decreased. Furthermore, our investigation reveals that serum exosomal miRs, specifically miR-15a, miR-16, miR-19a-3p, and miR-21, exhibit significant potential as diagnostic markers for mCRPC, especially when combined with lactate, citrate, and acetate.
Normal prostate epithelial cells exhibit an inefficient energy metabolism characterized by the inactivation of the tricarboxylic acid (TCA) cycle, resulting in high citrate production [9]. The neoplastic transformation in prostate cells coincides with the restoration of the TCA cycle and an increased generation of ATP from glucose oxidation [18]. In advanced stages of disease, prostate cancer cells display overexpression of glucose transporters and key glycolytic enzymes [9], leading to increased glucose consumption and lactate release [19]. The elevated lactate produced in hypoxic tumor areas is secreted into the extracellular environment [20], resulting in a high concentration of serum lactate (approximately 40 mM) observed in the serum of various cancer patients compared to the lactate concentration in healthy tissue and serum (1.5 to 3 mM) [21]. We observed elevated serum lactate levels in mCRPC patients compared to the BPH group, which aligns with previously reported findings in prostate cancer tissues [22,23,24]. We propose that cells in the tumor microenvironment produce lactate, serving as the source of increased blood serum lactate in patients with prostate cancer, and it may contribute to tumor cell invasion, metastasis, and immunosuppression [21].
Previously, it was demonstrated that intracellular citrate concentrations in the normal prostate peripheral zone exceed those in other soft tissues (10,000-15,000 nmols/gram vs. 250-450 nmols/gram). Similarly, citrate concentrations in prostatic ductal fluids are higher than in blood plasma (40-150 mM vs. approximately 0.2 mM [25,26]. Numerous studies employing animal models, cell lines, and tissue extracts have consistently shown reduced citrate levels in prostatic tissue of individuals with prostate adenocarcinoma compared to those with normal prostate peripheral zone and BPH [27,28,29,30]. The exact cause of this reduction, whether due to altered citrate production (e.g., low Zn2+ levels leading to increased m-aconitase activity) and/or changes in citrate transportation, remains unclear [31].
In our study, we observed significantly higher blood serum citrate levels in mCRPC patients compared to BPH patients. We hypothesize that prostate cancer cells take up this serum citrate through specific transporters expressed in the plasma membrane [32,33], and intracellularly utilize it to support prostate cancer metabolism, proliferation, fatty acid synthesis, and protein acetylation [34]. Similar findings were reported by Buszewska-Forajta et al. (2022)[35], who observed higher serum concentrations of citrate in the prostate cancer group compared to the BPH group, with no significant changes in citrate concentration based on the clinical stage of the tumor. In contrast, Kumar et al. (2016) reported a significant decrease in citrate levels in filtered serum obtained from prostate cancer patients compared to BPH patients[30]. Huang et al. (2017) found a lower risk of T4 prostate cancer in men with higher serum citrate and fumarate concentrations compared to controls, as determined by ultrahigh performance liquid chromatography/mass spectroscopy (LC-MS) and gas chromatography/mass spectroscopy (GC-MS)[36].
Prostate cancer bone metastases represent the final stage of metastasis, associated with aggressive tumor growth and the development of primarily osteoblastic bone disease [37]. Typically, bone metastases in prostate cancer are osteoblastic, involving the deposition of newly formed bone, but they can also manifest as osteolytic, characterized by the destruction of normal bone, or mixed [38]. During bone formation, osteoblasts synthesize citrate, which becomes incorporated into the new bone. Conversely, during bone resorption, citrate is released from the bone into the blood [27]. Hence, we suggest that this constitutes another significant source of citrate in mCRPC patients, contributing to the elevated citrate levels observed in the serum.
Moreover, the process of oncogenesis is linked to alterations in the uptake and metabolism of amino acids. Amino acids serve as the building blocks of proteins and also act as intermediate metabolites fueling various biosynthetic pathways [39]. Branched-chain amino acids (BCAAs), including leucine, isoleucine, and valine, are preferentially taken up by tumors. Being essential amino acids, their plasma levels are contingent on dietary intake and whole-body protein turnover [40,41]. Numerous studies have identified associations between circulating BCAAs levels and various human cancer types [42,43,44]. The study by Giskeødegård et al. (2015) demonstrated increased serum levels of BCAAs in prostate cancer patients compared to the BPH group [45]. Our findings, indicating significantly lower levels of serum BCAAs in the mCRPC group compared to the BPH group, align with the results of a few studies [46,47]. Similarly, Zhang et al. (2022) also observed significantly decreased serum BCAAs levels in prostate cancer patients with bone metastasis compared to prostate cancer or BPH patients, suggesting that downregulated BCAAs might be closely related to bone metastasis in prostate cancer progression [48]. We hypothesize that the decrease in serum BCAAs levels could result from higher BCAAs uptake through the L-type amino acid transporter LAT1 (SLC7A5), which is highly expressed in prostate tumor tissues [49], and subsequent catabolism of BCAAs for energy production by prostate cancer cells. Furthermore, BCAAs metabolism might be affected by genetic mutations, the tumor microenvironment, food intake, and the individual's health status [50].
Interestingly, we did not observe any differences in the corresponding branched-chain keto acids (BCKAs), such as ketoleucine, ketoisoleucine, and ketovaline, as well as glucose serum levels between the mCRPC and BPH groups. Additionally, we did not notice changes in alanine and glutamine levels, the main amino acids responsible for ammonia detoxification in extrahepatic tissues. Similarly, no differences were detected for other evaluated essential amino acids – phenylalanine, histidine, threonine, and tryptophan. These observations, coupled with the above-discussed facts, support the hypothesis of the selective utilization of branched-chain amino acids (BCAAs) by prostate cancer cells as an energy substrate rather than their accelerated usage in proteosynthesis during the formation of new cells.
Another metabolite that we found altered in the serum of mCRPC patients relative to BPH patients is 3-hydroxybutyrate, a representative ketone body. Ketone body metabolism is dysregulated in various types of cancer, and most tumor cells are unable to use ketone bodies for energy due to abnormalities in mitochondrial structure or function [51,52]. It has been reported that tumor cells can use ketone bodies as precursors for lipid synthesis rather than as energy substrates [53]. The study by Rodrigues et al. (2017) showed that the administration of 3-hydroxybutyrate may accelerate tumor growth [54]. However, there are also many studies presenting the anti-cancer effect of a ketogenic diet, a condition linked with increased ketone bodies levels [55].
Interestingly, Saraon et al. (2013) identified the ketogenic pathway as a novel bioenergetic pathway potentially involved in the progression of prostate cancer from low-grade to high-grade disease, followed by androgen independence[56]. Moreover, increased expression of both ketogenic and ketolytic enzymes (ACAT1, BDH1, HMGCL, and OXCT1) was reported with prostate cancer progression, gradually increasing with tumor grade [56,57]. Huang et al. (2017) showed that serum 3-hydroxybutyrate was associated with an increased risk of fatal prostate cancer in men diagnosed with metastatic disease[36].
Acetate, a short-chain fatty acid, serves as a substrate for the synthesis of acetyl coenzyme A (acetyl-CoA), primarily utilized in the de novo synthesis of fatty acids in prostate cancer cells, despite the abundance of circulating fatty acids. This metabolic phenotype is associated with prostate cancer progression and androgen independence [58,59]. Our findings align with previous studies reporting elevated serum acetate levels in various cancer types, including squamous oral carcinoma [60], lung cancer [61], and colon cancer [62]. We surmise that higher serum acetate levels may originate from the diet, with a significant portion generated by the metabolism of intestinal contents by the gut microbiome and/or from endogenous sources [63]. This pool of acetate serves as an alternative carbon source for fatty acid synthesis in cancer cells, potentially supporting the growth or metastasis of prostate tumors.
Numerous miRs have been reported to play significant roles in physiological and pathological processes, including cancer. Exosomes containing miRs, secreted by cancer cells, can be internalized by neighboring or distant recipient cells, facilitating tumor development [16]. The miRs from the miR-15/16 cluster are acknowledged as tumor suppressors, with documented reductions in various cancers, such as chronic lymphocytic lymphoma [64], pituitary adenomas [65], and prostate cancer [66]. Consistent with prior research, we observed a significant downregulation of serum exosomal miR-15a and miR-16 (fold regulation of -2.00 and -3.24, respectively) in mCRPC patients. Jin et al. (2018) proposed that miR-15a/16 inhibit components of the TGF-β signaling pathways in the LNCaP cell line, implying a potential association with prostate cancer progression and metastasis [67]. Specifically, miR-15a and miR-16-1 exert their effects by targeting multiple oncogenes, including BCL2, MCL1, CCND1, and WNT3A. Moreover, the reduced expression of miR-15 and miR-16 in cancer-associated fibroblasts significantly enhances tumor growth and progression [68]. Additionally, miR-15a and miR-16-1 impact fatty acid metabolism, primarily downregulating fatty acid synthase expression in mammary cells [69]. Thus, we speculate that the modulation of de novo fatty acid synthesis by miR-15a and miR-16, in conjunction with elevated serum levels of acetate and citrate, could potentially increase lipid synthesis in prostate cancer cells, and promotes tumor invasiveness and metastatic ability.
MiRNA-19a-3p has been identified as a suppressor of invasion and metastasis in prostate cancer by inhibiting SOX4 (SRY-related high-mobility group box 4), a factor involved in the development, differentiation of cells and organs, as well as the initiation and progression of cancer [70]. In our study, a significant downregulation of serum exosomal miR-19a-3p expression was observed in mCRPC patients. Previous research demonstrated that overexpression of miR-19a-3p led to the downregulation of proteins associated with invasion and metastasis in prostate cancer DU145 cells [71]. They reported a significant reduction in miR-19a-3p expression in 121 archived prostate cancer tissues, including 76 non-bone metastatic prostate cancer tissues and 45 bone metastatic prostate cancer tissues. Furthermore, they found that upregulation of miR-19a-3p repressed osteolytic bone lesions. We hypothesize that the downregulation of miR-19a-3p could potentially promote osteolysis and the release of citrate from bone into the bloodstream.
MiR-21 exhibits a dual nature, acting both as an oncogene and a tumor-suppressor [72]. Primarily, miR-21 downregulates PTEN expression, fostering the activation of the PI3K/Akt signaling pathway, thereby propelling cancer progression. Its overexpression impedes apoptosis and plays a crucial role in initiating pro-survival autophagy [73]. MiR-21 significantly contributes to metabolic reprogramming by inducing glycolysis and lactate production, consequently enhancing tumor advancement [74,75]. Moreover, it has been shown that miR-21 plays an essential role in lipid synthesis, fatty acid oxidation, and lipoprotein formation [76,77]. To our knowledge, this is likely the first study reporting the correlation of miR-21 levels with citrate and acetate levels in the serum of mCRPC patients, potentially affecting lipid homeostasis in prostate cancer cells. Moreover, miR-21 stimulates epithelial-mesenchymal transition (EMT) and upregulates the expression of matrix metalloproteinase-2 (MMP-2) and matrix metalloproteinase-9 (MMP-9), promoting tumor metastasis. MiR-21 is a target of anti-cancer agents like curcumin and curcumol, and its downregulation blocks tumor progression. However, upregulation of miR-21 can result in cancer resistance to chemotherapy and radiotherapy [78]. Variations exist in the findings of these studies, and further investigations are required to determine the suitability of miR-21 as a reliable marker for prostate cancer. In line with our study, Damodaran et al. (2021) revealed significant down-regulation of miR-21 in prostate cancer patients[79]. Conversely, Kim et al. (2021) reported no significant alterations in miR-21 and miR-141 levels in extracellular vesicles of prostate cancer patients compared to the control group [66]. Our investigation showed decreased expression of serum exosomal miR-21 levels in mCRPC patients. Jokovic et al. (2018) compared plasma and exosomal levels of miRs, indicating elevated exosomal miR-21 levels in prostate cancer patients with increased serum PSA values and those with aggressive prostate cancer, while plasma samples did not yield significant results [80]. Consequently, their observations suggest potential prognostic significance for exosomal miR-21 expression levels in prostate cancer.
MiR-141 exhibits distinct expression patterns across various malignancies, influencing tumor behaviors such as EMT, proliferation, migration, metastasis, invasion, and drug resistance, contingent upon cancer type. The study by Xiao et al. (2012) revealed that small heterodimer protein (Shp) is a direct target of miR-141, leading to Shp downregulation [81]. Acting as a corepressor and metabolic regulator, the reduced Shp, induced by miR-141, transcriptionally regulates androgen receptor genes in prostate cells. This underscores miR-141's significance in influencing the androgen receptor signaling pathway, contributing to prostate cancer progression. Sharma and Baruch (2019) identified miR-141 as a promising marker for metastatic prostate cancer [82]. Akalin et al.'s (2022) study suggests potential diagnostic value for miR-141-3p in identifying aggressive prostate cancer [83]. In a meta-analysis by Ye et al. (2020), encompassing seven studies and 414 prostate cancer patients, miR-141 demonstrated diagnostic sensitivity and specificity of 0.70 (95% CI 0.64-0.75) and 0.73 (95% CI 0.64-0.80), respectively[28]. Conversely, other studies, consistent with our findings, reported no significant alteration of miR-141 in prostate cancer tissues or blood extracellular vesicles [39,66].
4. Materials and Methods
4.1. Study population
This study received approval from the Ethical Board of Jessenius Faculty of Medicine, Comenius University, and was conducted in accordance with the Declaration of Helsinki. Prior to obtaining blood samples, informed written consent was obtained from all participants. The study included 51 patients with mCRPC and 48 patients diagnosed with BPH. Three mCRPC patients were excluded from the study due to low measured PSA levels. Men diagnosed with BPH served as the disease control group.
Examinations for mCRPC patients were conducted at the Clinic of Nuclear Medicine at the University Hospital Martin and Jessenius Faculty of Medicine, Comenius University. Skeletal scintigraphy was performed, revealing positive findings indicative of multiple skeletal metastases. Additionally, clinical staging and tumor grading, along with the assessment of PSA levels (Beckman Coulter Access® Hybritech® assay, Beckman Coulter, Fullerton, CA, USA), were carried out. Venous blood samples were collected in collaboration with the Clinic of Nuclear Medicine and the Clinic of Urology at the University Hospital Martin, Slovakia. Table 5 provides information on the age, PSA levels within both studied groups, as well as the staging characterization and histopathological grading of mCRPC patients.
4.2.1. H-NMR metabolomics
Blood handling for metabolomic measurements. Blood specimens were collected using VACUETTE® serum tubes and promptly subjected to centrifugation within one hour of collection. The centrifugation process at 2000 rpm/4°C/10 min resulting in the separation of serum. The samples were stored at -80°C until use. Serum denaturation was carried out according to Nagana et al. (2015): 600 µl of methanol was added to 300 µl of blood serum, the mixture was vortexed and frozen at -24°C for 30 min. After subsequent centrifugation at 14 000 rpm/room temperature/30 min, 700 µl of supernatant was taken, dried, and stored at -80°C [84]. Before NMR measurement, the dried matter was soluted in 500 µl of deuterated water and 100 µl of stock solution (phosphate buffer 200 mM, pH 7.4), 0.30 mM TSP-d4 (trimethylsilylpropionic acid-d4) as a chemical shift reference in deuterated water. Finally, the final solution was transferred into a 5 mm NMR tube.
Data acquisition and processing. Nuclear Magnetic Resonance (NMR) data were acquired using a 600 MHz NMR spectrometer, Avance III, from Bruker, equipped with a TCI CryoProbe, operating at a temperature of 310 K. Initial settings, including field shimming, receiver gain, and water suppression frequency, were optimized using an independent sample and then applied consistently across all measurements. After preparation, samples were stored in a Sample Jet automatic machine for a maximum of 2 hours, kept at approximately 5°C. Before measurement, each sample underwent preheating at 310 K for 5 minutes. An exponential noise filter with 0.3 Hz line broadening was applied prior to Fourier transform. All data were subjected to zero-filling. The acquisition order of samples was randomized for the experiments.
Bruker profiling protocols were modified as follows: noesy with presaturation (noesygppr1d): FID size 64k, dummy scans 4, number of scans: 64, spectral width 20.4750 ppm; profiling cpmg (cpmgpr1d, L4 = 126, d20 = 3 ms): number of scans: 256, spectral width 20.4750 ppm. For a subset of 15 randomly chosen samples, 2D spectra were measured: cosy with presaturation (cosygpprqf): FID size 4 k, dummy scans 8, number of scans 16, spectral width 16.0125 ppm. Homonuclear J-resolved (jresgpprqf) utilized a FID size of 8 k, 16 dummy scans, 32 scans. All experiments were conducted with a relaxation delay of 4 s. Across all samples, the half-width of the TSP-d4 signal was consistently maintained below 1.0 Hz.
Spectra were solved using multiple references, including a human metabolomic database (www.hmda.ca)[85], the Chenomx software (free trial version), an internal metabolite database, and a review of relevant metabolomic literature [84]. Proton chemical shifts were compared with the TSP-d4 signal assigned a chemical shift of 0.000 ppm. Peak multiplicities were verified through J-resolved spectra, while homonuclear cross-peaks were confirmed using 2D cosy spectra.
All spectra were binned into bins of 0.001 ppm in size. No additional normalization methods were applied to the data since an equal volume of blood serum was used for all measurements. Subsequently, the intensities of selected bins were summed exclusively for spectra subregions where only one metabolite was assigned or minimally affected by other co-metabolites. Metabolites exhibiting weak intense peaks or significant peak overlap were omitted from the analysis. The resulting values were utilized as relative concentrations of metabolites in each sample.
4.3. Exosomal miRs expression
The serum exosomal miR-15a, miR-16, miR-19-3p, miR-21 and miR-141a-3p were selected based on their demonstrated high diagnostic efficacy in previous studies. Total exosomal RNA containing miR was isolated through a spin column-based method (Serum/Plasma ExoRNAse Midi Kit, Qiagen, Hilden, Germany) following the manufacturer’s instructions. Before isolation of total RNA, 0.5 ml of serum was initially centrifuged at 3000×g/room temperature/15 min. The RNA purity and quantity were measured using a NanoPhotometer (Implen, GmbH, Germany).
Total exosomal RNA was reverse transcribed into cDNA using an TaqMan MicroRNA Reverse Transkription Kit (Applied Biosystems, Foster City, CA, USA), and TaqMan MicroRNA Assay Kit (Applied Biosystems) containing miR RT primers of selected miRs (miR-15a, miR-16, miR-19a-3p, miR-21 and miR-141a-3p). QRT-PCR was performed using TaqMan Universal PCR Master Mix II, no UNG (Applied Biosystems) and carried out by CFX96 Real-Time PCR Detection System (Bio-Rad Laboratories, Hercules, CA, USA) and processed as described previously [86,87]. The expression levels of exosomal miRs were normalized to miR-1233, identified as the most suitable control for data normalization. Each sample was analyzed in duplicate, and the data were processed using the 2−ΔΔCt method.
4.4. Statistical analysis
1H-NMR metabolomics. The distribution of metabolic data was approached by Shapiro-Wilk test which is suitable to detect non-normality in small sample size (n<50)[88]. The test rejected normality in about half of the data. The null hypothesis of equality of population medians among mCRPC patients and BPH patients by non-parametrical Mann-Whitney-U test. A p-value of 0.05 was used as a threshold to claim significance. Calculations were carried out in OriginPro 2019 (v.9.6.0.172, OriginLab, USA) and Matlab (v. 2015b, Mathworks, USA).
Exosomal miR expression. We employed the Shapiro-Wilk test to assess the normality of the dataset. Subsequently, we utilized the non-parametric Mann-Whitney U test to discern significant differences between groups. Differences were deemed statistically significant at a threshold of p<0.05. Visualization of the results was accomplished using GraphPad.
5. Conclusion
In conclusion, this study highlights the potential of metabolomic changes and serum exosomal miR-15a, miR-16, miR-19a-3p, and miR-21 as promising diagnostic markers for mCRPC. A major strength of this study lies in the observed changes, which exhibit high diagnostic efficiency and contribute to a better understanding of prostate cancer pathogenesis. However, the study's limitation is the relatively small sample size, restricting its clinical applicability, and larger studies are warranted in the future. Additionally, the use of BPH patients as the control group may pose a limitation, despite accumulating evidence suggesting important anatomic, pathologic, and genetic links between BPH and prostate cancer, along with their well-established epidemiologic association [89].
Author Contributions
Conception and design of the research: M.K.S, D.E and A.E. Participation in patient enrolment, surgical procedures, and sample collection: D.E., H.P., R.D and L.B.; Analysis and interpretation of the data: E.B, M.Š., J.J. and M.K.B.; Statistical analysis: E.B. and A.E; Writing of the manuscript: M.K.S., D.E. and A.E.; Critical revision of the manuscript for intellectual content: M.K.S., P.K and E.H., Funding acquisition: M.K.S. and E.H. All authors have read and agreed to the published version of the manuscript.
Funding
This work was supported by the Agency of Ministry of Education, Science, Research and Sport of the Slovak Republic (grant no. 1/0014/22) and by the Operational Program Integrated Infrastructure for the project: “Research of spectroscopic methods for early, non-invasive real-time identification of selected diseases from the condensate of gases released by lungs and skin. “ code ITMS: 313011BWX6, co-financed from the resources of the European Regional Development Fund.
Institutional Review Board Statement
The study was conducted in accordance with the Declaration of Helsinki, and approved by the Ethical Board of Jessenius Faculty of Medicine, Comenius (protocol code EK 6/2022 and 14/04/2022).”.
Informed Consent Statement
Informed consent was obtained from all the subjects involved in the study.
Data Availability Statement
The datasets used and/or analysed during the current study are available from the corresponding author on reasonable request.
Conflicts of Interest
Declare conflicts of interest or state “The authors declare no conflicts of interest.”.
References
- Bergengren, O.; Pekala, K.R.; Matsoukas, K.; Fainberg, J.; Mungovan, S.F.; Bratt, O.; Bray, F.; Brawley, O.; Luckenbaugh, A.N.; Mucci, L.; et al. 2022 Update on Prostate Cancer Epidemiology and Risk Factors-A Systematic Review. Eur Urol 2023, 84, 191–206. [Google Scholar] [CrossRef]
- Descotes, J.L. Diagnosis of Prostate Cancer. Asian J Urol 2019, 6, 129–136. [Google Scholar] [CrossRef]
- Kubihal, V.; Sharma, S.; Kumar, R.; Seth, A.; Kumar, R.; Kaushal, S.; Sarangi, J.; Gupta, R.; Das, C. Multiparametric Magnetic Resonance Imaging, 68Ga Prostate-Specific Membrane Antigen Positron Emission Tomography-Computed Tomography, and Respective Quantitative Parameters in Detection and Localization of Clinically Significant Prostate Cancer in Intermediate- and High-Risk Group Patients: An Indian Demographic Study. Indian J Nucl Med 2021, 36, 362–370. [Google Scholar] [CrossRef] [PubMed]
- Masoom, S.N.; Sundaram, K.M.; Ghanouni, P.; Fütterer, J.; Oto, A.; Ayyagari, R.; Sprenkle, P.; Weinreb, J.; Arora, S. Real-Time MRI-Guided Prostate Interventions. Cancers (Basel) 2022, 14, 1860. [Google Scholar] [CrossRef]
- Ferretti, S.; Mercinelli, C.; Marandino, L.; Litterio, G.; Marchioni, M.; Schips, L. Metastatic Castration-Resistant Prostate Cancer: Insights on Current Therapy and Promising Experimental Drugs. Res Rep Urol 2023, 15, 243–259. [Google Scholar] [CrossRef]
- Myint, Z.W.; Allison, D.B.; Ellis, C.S. A Case Report of Metastatic Castration-Resistant Prostate Cancer Harboring a PTEN Loss. Front Oncol 2021, 11. [Google Scholar] [CrossRef]
- Mottet, N.; van den Bergh, R.C.N.; Briers, E.; Van den Broeck, T.; Cumberbatch, M.G.; De Santis, M.; Fanti, S.; Fossati, N.; Gandaglia, G.; Gillessen, S.; et al. EAU-EANM-ESTRO-ESUR-SIOG Guidelines on Prostate Cancer-2020 Update. Part 1: Screening, Diagnosis, and Local Treatment with Curative Intent. Eur Urol 2021, 79, 243–262. [Google Scholar] [CrossRef]
- Warburg, O. On the Origin of Cancer Cells. Science 1956, 123, 309–314. [Google Scholar] [CrossRef] [PubMed]
- Cardoso, H.J.; Carvalho, T.M.A.; Fonseca, L.R.S.; Figueira, M.I.; Vaz, C.V.; Socorro, S. Revisiting Prostate Cancer Metabolism: From Metabolites to Disease and Therapy. Med Res Rev 2021, 41, 1499–1538. [Google Scholar] [CrossRef] [PubMed]
- Strmiska, V.; Michalek, P.; Eckschlager, T.; Stiborova, M.; Adam, V.; Krizkova, S.; Heger, Z. Prostate Cancer-Specific Hallmarks of Amino Acids Metabolism: Towards a Paradigm of Precision Medicine. Biochim Biophys Acta Rev Cancer 2019, 1871, 248–258. [Google Scholar] [CrossRef]
- Costello, L.C.; Feng, P.; Milon, B.; Tan, M.; Franklin, R.B. Role of Zinc in the Pathogenesis and Treatment of Prostate Cancer: Critical Issues to Resolve. Prostate Cancer Prostatic Dis 2004, 7, 111–117. [Google Scholar] [CrossRef]
- Twum-Ampofo, J.; Fu, D.X.; Passaniti, A.; Hussaind, A.; Siddiqui, M.M. Metabolic Targets for Potential Prostate Cancer Therapeutics. Curr Opin Oncol 2016, 28, 241–247. [Google Scholar] [CrossRef]
- Beier, A.M.K.; Puhr, M.; Stope, M.B.; Thomas, C.; Erb, H.H.H. Metabolic Changes during Prostate Cancer Development and Progression. J Cancer Res Clin Oncol 2023, 149, 2259–2270. [Google Scholar] [CrossRef]
- Halliday, K.R.; Fenoglio-Preiser, C.; Sillerud, L.O. Differentiation of Human Tumors from Nonmalignant Tissue by Natural-Abundance 13C NMR Spectroscopy. Magn Reson Med 1988, 7, 384–411. [Google Scholar] [CrossRef]
- Li, Z.; Zhang, H. Reprogramming of Glucose, Fatty Acid and Amino Acid Metabolism for Cancer Progression. Cell Mol Life Sci 2016, 73, 377–392. [Google Scholar] [CrossRef]
- Bartel, D.P. MicroRNAs: Genomics, Biogenesis, Mechanism, and Function. Cell 2004, 116, 281–297. [Google Scholar] [CrossRef]
- Zidan, H.E.; Abdul-Maksoud, R.S.; Elsayed, W.S.H.; Desoky, E.A.M. Diagnostic and Prognostic Value of Serum MiR-15a and MiR-16-1 Expression among Egyptian Patients with Prostate Cancer. IUBMB Life 2018, 70, 437–444. [Google Scholar] [CrossRef] [PubMed]
- Cutruzzolà, F.; Giardina, G.; Marani, M.; Macone, A.; Paiardini, A.; Rinaldo, S.; Paone, A. Glucose Metabolism in the Progression of Prostate Cancer. Front Physiol 2017, 8. [Google Scholar] [CrossRef] [PubMed]
- Santotoribio, J.D.; Jimenez-Romero, M.E. Serum Biomarkers of Inflammation for Diagnosis of Prostate Cancer in Patients with Nonspecific Elevations of Serum Prostate Specific Antigen Levels. Transl Cancer Res 2019, 8, 273–278. [Google Scholar] [CrossRef]
- de la Cruz-López, K.G.; Castro-Muñoz, L.J.; Reyes-Hernández, D.O.; García-Carrancá, A.; Manzo-Merino, J. Lactate in the Regulation of Tumor Microenvironment and Therapeutic Approaches. Front Oncol 2019, 9. [Google Scholar] [CrossRef]
- Chetta, P.; Sriram, R.; Zadra, G. Lactate as Key Metabolite in Prostate Cancer Progression: What Are the Clinical Implications? Cancers (Basel) 2023, 15. [Google Scholar] [CrossRef]
- Lima, A.R.; Pinto, J.; Bastos, M. de L.; Carvalho, M.; Guedes de Pinho, P. NMR-Based Metabolomics Studies of Human Prostate Cancer Tissue. Metabolomics 2018, 14. [Google Scholar] [CrossRef]
- Tessem, M.B.; Swanson, M.G.; Keshari, K.R.; Albers, M.J.; Joun, D.; Tabatabai, Z.L.; Simko, J.P.; Shinohara, K.; Nelson, S.J.; Vigneron, D.B.; et al. Evaluation of Lactate and Alanine as Metabolic Biomarkers of Prostate Cancer Using 1H HR-MAS Spectroscopy of Biopsy Tissues. Magn Reson Med 2008, 60, 510–516. [Google Scholar] [CrossRef]
- Van Asten, J.J.A.; Cuijpers, V.; Hulsbergen-Van De Kaa, C.; Soede-Huijbregts, C.; Witjes, J.A.; Verhofstad, A.; Heerschap, A. High Resolution Magic Angle Spinning NMR Spectroscopy for Metabolic Assessment of Cancer Presence and Gleason Score in Human Prostate Needle Biopsies. MAGMA 2008, 21, 435–442. [Google Scholar] [CrossRef] [PubMed]
- Costello, L.C.; Franklin, R.B. The Clinical Relevance of the Metabolism of Prostate Cancer; Zinc and Tumor Suppression: Connecting the Dots. Mol Cancer 2006, 5. [Google Scholar] [CrossRef] [PubMed]
- Costello, L.C.; Franklin, R.B. Concepts of Citrate Production and Secretion by Prostate: 2. Hormonal Relationships in Normal and Neoplastic Prostate. Prostate 1991, 19, 181–205. [Google Scholar] [CrossRef] [PubMed]
- Costello, L.C.; Franklin, R.B. Plasma Citrate Homeostasis: How It Is Regulated; And Its Physiological and Clinical Implications. An Important, But Neglected, Relationship In. HSOA J Hum Endocrinol 2016, 1, 1–8. [Google Scholar] [CrossRef]
- Ye, Y.; Yuan, X.H.; Wang, J.J.; Wang, Y.C.; Li, S.L.; Ding, J. The Diagnostic Value of MiRNA-141 in Prostate Cancer: A Systematic Review and PRISMA-Compliant Meta-Analysis. Medicine 2020, 99, E19993. [Google Scholar] [CrossRef]
- Zheng, H.; Zhu, Y.; Shao, X.; Cai, A.; Dong, B.; Xue, W.; Gao, H. Distinct Metabolic Signatures of Hormone-Sensitive and Castration-Resistant Prostate Cancer Revealed by a 1H NMR-Based Metabolomics of Biopsy Tissue. J Proteome Res 2020, 19, 3741–3749. [Google Scholar] [CrossRef]
- Kumar, D.; Gupta, A.; Mandhani, A.; Sankhwar, S.N. NMR Spectroscopy of Filtered Serum of Prostate Cancer: A New Frontier in Metabolomics. Prostate 2016, 76, 1106–1119. [Google Scholar] [CrossRef]
- Costello, L.C.; Franklin, R.B.; Feng, P. Mitochondrial Function, Zinc, and Intermediary Metabolism Relationships in Normal Prostate and Prostate Cancer. Mitochondrion 2005, 5, 143–153. [Google Scholar] [CrossRef]
- Haferkamp, S.; Drexler, K.; Federlin, M.; Schlitt, H.J.; Berneburg, M.; Adamski, J.; Gaumann, A.; Geissler, E.K.; Ganapathy, V.; Parkinson, E.K.; et al. Extracellular Citrate Fuels Cancer Cell Metabolism and Growth. Front Cell Dev Biol 2020, 8. [Google Scholar] [CrossRef] [PubMed]
- Mycielska, M.E.; Dettmer, K.; Rummele, P.; Schmidt, K.; Prehn, C.; Milenkovic, V.M.; Jagla, W.; Madej, G.M.; Lantow, M.; Schladt, M.; et al. Extracellular Citrate Affects Critical Elements of Cancer Cell Metabolism and Supports Cancer Development In Vivo. Cancer Res 2018, 78, 2513–2523. [Google Scholar] [CrossRef] [PubMed]
- Icard, P.; Simula, L.; Zahn, G.; Alifano, M.; Mycielska, M.E. The Dual Role of Citrate in Cancer. Biochim Biophys Acta Rev Cancer 2023, 1878. [Google Scholar] [CrossRef] [PubMed]
- Buszewska-Forajta, M.; Monedeiro, F.; Gołębiowski, A.; Adamczyk, P.; Buszewski, B. Citric Acid as a Potential Prostate Cancer Biomarker Determined in Various Biological Samples. Metabolites 2022, 12. [Google Scholar] [CrossRef] [PubMed]
- Huang, J.; Mondul, A.M.; Weinstein, S.J.; Karoly, E.D.; Sampson, J.N.; Albanes, D. Prospective Serum Metabolomic Profile of Prostate Cancer by Size and Extent of Primary Tumor. Oncotarget 2017, 8, 45190–45199. [Google Scholar] [CrossRef] [PubMed]
- Whitburn, J.; Edwards, C.M. Metabolism in the Tumour-Bone Microenvironment. Curr Osteoporos Rep 2021, 19, 494–499. [Google Scholar] [CrossRef]
- Yin, J.J.; Pollock, C.B.; Kelly, K. Mechanisms of Cancer Metastasis to the Bone. Cell Res 2005, 15, 57–62. [Google Scholar] [CrossRef]
- Martinez-Outschoorn, U.E.; Peiris-Pagés, M.; Pestell, R.G.; Sotgia, F.; Lisanti, M.P. Cancer Metabolism: A Therapeutic Perspective. Nat Rev Clin Oncol 2017, 14, 11–31. [Google Scholar] [CrossRef]
- McGarrah, R.W.; White, P.J. Branched-Chain Amino Acids in Cardiovascular Disease. Nat Rev Cardiol 2023, 20, 77–89. [Google Scholar] [CrossRef]
- Jung, M.K.; Okekunle, A.P.; Lee, J.E.; Sung, M.K.; Lim, Y.J. Role of Branched-Chain Amino Acid Metabolism in Tumor Development and Progression. J Cancer Prev 2021, 26, 237–243. [Google Scholar] [CrossRef]
- Ericksen, R.E.; Lim, S.L.; McDonnell, E.; Shuen, W.H.; Vadiveloo, M.; White, P.J.; Ding, Z.; Kwok, R.; Lee, P.; Radda, G.K.; et al. Loss of BCAA Catabolism during Carcinogenesis Enhances MTORC1 Activity and Promotes Tumor Development and Progression. Cell Metab 2019, 29, 1151–1165.e6. [Google Scholar] [CrossRef] [PubMed]
- Hattori, A.; Tsunoda, M.; Konuma, T.; Kobayashi, M.; Nagy, T.; Glushka, J.; Tayyari, F.; McSkimming, D.; Kannan, N.; Tojo, A.; et al. Cancer Progression by Reprogrammed BCAA Metabolism in Myeloid Leukaemia. Nature 2017, 545, 500–504. [Google Scholar] [CrossRef] [PubMed]
- Mayers, J.R.; Wu, C.; Clish, C.B.; Kraft, P.; Torrence, M.E.; Fiske, B.P.; Yuan, C.; Bao, Y.; Townsend, M.K.; Tworoger, S.S.; et al. Elevation of Circulating Branched-Chain Amino Acids Is an Early Event in Human Pancreatic Adenocarcinoma Development. Nat Med 2014, 20, 1193–1198. [Google Scholar] [CrossRef] [PubMed]
- Giskeødegård, G.F.; Hansen, A.F.; Bertilsson, H.; Gonzalez, S.V.; Kristiansen, K.A.; Bruheim, P.; Mjøs, S.A.; Angelsen, A.; Bathen, T.F.; Tessem, M.B. Metabolic Markers in Blood Can Separate Prostate Cancer from Benign Prostatic Hyperplasia. Br J Cancer 2015, 113, 1712–1719. [Google Scholar] [CrossRef] [PubMed]
- Dereziński, P.; Klupczynska, A.; Sawicki, W.; Pałka, J.A.; Kokot, Z.J. Amino Acid Profiles of Serum and Urine in Search for Prostate Cancer Biomarkers: A Pilot Study. Int J Med Sci 2017, 14, 1–12. [Google Scholar] [CrossRef] [PubMed]
- Miyagi, Y.; Higashiyama, M.; Gochi, A.; Akaike, M.; Ishikawa, T.; Miura, T.; Saruki, N.; Bando, E.; Kimura, H.; Imamura, F.; et al. Plasma Free Amino Acid Profiling of Five Types of Cancer Patients and Its Application for Early Detection. PLoS One 2011, 6. [Google Scholar] [CrossRef]
- Zhang, X.; Xia, B.; Zheng, H.; Ning, J.; Zhu, Y.; Shao, X.; Liu, B.; Dong, B.; Gao, H. Identification of Characteristic Metabolic Panels for Different Stages of Prostate Cancer by 1H NMR-Based Metabolomics Analysis. J Transl Med 2022, 20. [Google Scholar] [CrossRef] [PubMed]
- Sakata, T.; Ferdous, G.; Tsuruta, T.; Satoh, T.; Baba, S.; Muto, T.; Ueno, A.; Kanai, Y.; Endou, H.; Okayasu, I. L-Type Amino-Acid Transporter 1 as a Novel Biomarker for High-Grade Malignancy in Prostate Cancer. Pathol Int 2009, 59, 7–18. [Google Scholar] [CrossRef]
- Peng, H.; Wang, Y.; Luo, W. Multifaceted Role of Branched-Chain Amino Acid Metabolism in Cancer. Oncogene 2020, 39, 6747–6756. [Google Scholar] [CrossRef]
- Seyfried, T.N.; Flores, R.E.; Poff, A.M.; D’Agostino, D.P. Cancer as a Metabolic Disease: Implications for Novel Therapeutics. Carcinogenesis 2014, 35, 515–527. [Google Scholar] [CrossRef] [PubMed]
- Puchalska, P.; Crawford, P.A. Multi-Dimensional Roles of Ketone Bodies in Fuel Metabolism, Signaling, and Therapeutics. Cell Metab 2017, 25, 262–284. [Google Scholar] [CrossRef] [PubMed]
- Hwang, C.Y.; Choe, W.; Yoon, K.S.; Ha, J.; Kim, S.S.; Yeo, E.J.; Kang, I. Molecular Mechanisms for Ketone Body Metabolism, Signaling Functions, and Therapeutic Potential in Cancer. Nutrients 2022, 14. [Google Scholar] [CrossRef] [PubMed]
- Rodrigues, L.M.; Uribe-Lewis, S.; Madhu, B.; Honess, D.J.; Stubbs, M.; Griffiths, J.R. The Action of β-Hydroxybutyrate on the Growth, Metabolism and Global Histone H3 Acetylation of Spontaneous Mouse Mammary Tumours: Evidence of a β-Hydroxybutyrate Paradox. Cancer Metab 2017, 5. [Google Scholar] [CrossRef] [PubMed]
- Ferrere, G.; Alou, M.T.; Liu, P.; Goubet, A.G.; Fidelle, M.; Kepp, O.; Durand, S.; Iebba, V.; Fluckiger, A.; Daillère, R.; et al. Ketogenic Diet and Ketone Bodies Enhance the Anticancer Effects of PD-1 Blockade. JCI Insight 2021, 6. [Google Scholar] [CrossRef] [PubMed]
- Saraon, P.; Cretu, D.; Musrap, N.; Karagiannis, G.S.; Batruch, I.; Drabovich, A.P.; Van Der Kwast, T.; Mizokami, A.; Morrissey, C.; Jarvi, K.; et al. Quantitative Proteomics Reveals That Enzymes of the Ketogenic Pathway Are Associated with Prostate Cancer Progression. Mol Cell Proteomics 2013, 12, 1589–1601. [Google Scholar] [CrossRef] [PubMed]
- Labanca, E.; Bizzotto, J.; Sanchis, P.; Anselmino, N.; Yang, J.; Shepherd, P.D.A.; Paez, A.; Antico-Arciuch, V.; Lage-Vickers, S.; Hoang, A.G.; et al. Prostate Cancer Castrate Resistant Progression Usage of Non-Canonical Androgen Receptor Signaling and Ketone Body Fuel. Oncogene 2021, 40, 6284–6298. [Google Scholar] [CrossRef] [PubMed]
- Yoshii, Y.; Furukawa, T.; Saga, T.; Fujibayashi, Y. Acetate/Acetyl-CoA Metabolism Associated with Cancer Fatty Acid Synthesis: Overview and Application. Cancer Lett 2015, 356, 211–216. [Google Scholar] [CrossRef] [PubMed]
- Zadra, G.; Loda, M. When Fat Goes down, Prostate Cancer Is on the Ropes. Mol Cell Oncol 2019, 6. [Google Scholar] [CrossRef]
- Gupta, A.; Gupta, S.; Mahdi, A.A. 1H NMR-Derived Serum Metabolomics of Leukoplakia and Squamous Cell Carcinoma. Clin Chim Acta 2015, 441, 47–55. [Google Scholar] [CrossRef]
- Singh, A.; Prakash, V.; Gupta, N.; Kumar, A.; Kant, R.; Kumar, D. Serum Metabolic Disturbances in Lung Cancer Investigated through an Elaborative NMR-Based Serum Metabolomics Approach. ACS Omega 2022, 7, 5510–5520. [Google Scholar] [CrossRef] [PubMed]
- Gu, J.; Xiao, Y.; Shu, D.; Liang, X.; Hu, X.; Xie, Y.; Lin, D.; Li, H. Metabolomics Analysis in Serum from Patients with Colorectal Polyp and Colorectal Cancer by 1H-NMR Spectrometry. Dis Markers 2019, 2019. [Google Scholar] [CrossRef] [PubMed]
- Hosios, A.M.; Vander Heiden, M.G. Acetate Metabolism in Cancer Cells. Cancer Metab 2014, 2. [Google Scholar] [CrossRef]
- Aqeilan, R.I.; Calin, G.A.; Croce, C.M. MiR-15a and MiR-16-1 in Cancer: Discovery, Function and Future Perspectives. Cell Death Differ 2010, 17, 215–220. [Google Scholar] [CrossRef]
- Feng, Y.; Mao, Z.G.; Wang, X.; Du, Q.; Jian, M.; Zhu, D.; Xiao, Z.; Wang, H.J.; Zhu, Y.H. MicroRNAs and Target Genes in Pituitary Adenomas. Horm Metab Res 2018, 50, 179–192. [Google Scholar] [CrossRef] [PubMed]
- Kim, J.; Cho, S.; Park, Y.; Lee, J.; Park, J. Evaluation of Micro-RNA in Extracellular Vesicles from Blood of Patients with Prostate Cancer. PLoS One 2021, 16. [Google Scholar] [CrossRef]
- Jin, W.; Chen, F.; Wang, K.; Song, Y.; Fei, X.; Wu, B. MiR-15a/MiR-16 Cluster Inhibits Invasion of Prostate Cancer Cells by Suppressing TGF-β Signaling Pathway. Biomed Pharmacother 2018, 104, 637–644. [Google Scholar] [CrossRef] [PubMed]
- Musumeci, M.; Coppola, V.; Addario, A.; Patrizii, M.; Maugeri-Saccá, M.; Memeo, L.; Colarossi, C.; Francescangeli, F.; Biffoni, M.; Collura, D.; et al. Control of Tumor and Microenvironment Cross-Talk by MiR-15a and MiR-16 in Prostate Cancer. Oncogene 2011, 30, 4231–4242. [Google Scholar] [CrossRef] [PubMed]
- Wang, J.; Zhang, X.; Shi, J.; Cao, P.; Wan, M.; Zhang, Q.; Wang, Y.; Kridel, S.J.; Liu, W.; Xu, J.; et al. Fatty Acid Synthase Is a Primary Target of MiR-15a and MiR-16-1 in Breast Cancer. Oncotarget 2016, 7, 78566–78576. [Google Scholar] [CrossRef]
- Feng, Y.G.; Zhao, J.F.; Xiao, L.; Rao, W.Y.; Ran, C.; Xiao, Y.H. MicroRNA-19a-3p Suppresses Invasion and Metastasis of Prostate Cancer via Inhibiting SOX4. Eur Rev Med Pharmacol Sci 2018, 22, 6245–6251. [Google Scholar] [CrossRef]
- Wa, Q.; Li, L.; Lin, H.; Peng, X.; Ren, D.; Huang, Y.; He, P.; Huang, S. Downregulation of MiR-19a-3p Promotes Invasion, Migration and Bone Metastasis via Activating TGF-β Signaling in Prostate Cancer. Oncol Rep 2018, 39, 81–90. [Google Scholar] [CrossRef] [PubMed]
- Schramedei, K.; Mörbt, N.; Pfeifer, G.; Läuter, J.; Rosolowski, M.; Tomm, J.M.; Von Bergen, M.; Horn, F.; Brocke-Heidrich, K. MicroRNA-21 Targets Tumor Suppressor Genes ANP32A and SMARCA4. Oncogene 2011, 30, 2975–2985. [Google Scholar] [CrossRef] [PubMed]
- Bautista-Sánchez, D.; Arriaga-Canon, C.; Pedroza-Torres, A.; De La Rosa-Velázquez, I.A.; González-Barrios, R.; Contreras-Espinosa, L.; Montiel-Manríquez, R.; Castro-Hernández, C.; Fragoso-Ontiveros, V.; Álvarez-Gómez, R.M.; et al. The Promising Role of MiR-21 as a Cancer Biomarker and Its Importance in RNA-Based Therapeutics. Mol Ther Nucleic Acids 2020, 20, 409–420. [Google Scholar] [CrossRef] [PubMed]
- Dai, Q.; Li, N.; Zhou, X. Increased MiR-21a Provides Metabolic Advantages through Suppression of FBP1 Expression in Non-Small Cell Lung Cancer Cells. Am J Cancer Res 2017, 7, 2121. [Google Scholar] [PubMed]
- Chen, S.; Chen, X.; Shan, T.; Ma, J.; Lin, W.; Li, W.; Kang, Y. MiR-21-Mediated Metabolic Alteration of Cancer-Associated Fibroblasts and Its Effect on Pancreatic Cancer Cell Behavior. Int J Biol Sci 2018, 14, 100–110. [Google Scholar] [CrossRef] [PubMed]
- Yang, Z.; Cappello, T.; Wang, L. Emerging Role of MicroRNAs in Lipid Metabolism. Acta Pharm Sin B 2015, 5, 145–150. [Google Scholar] [CrossRef] [PubMed]
- Ni, K.; Wang, D.; Xu, H.; Mei, F.; Wu, C.; Liu, Z.; Zhou, B. MiR-21 Promotes Non-Small Cell Lung Cancer Cells Growth by Regulating Fatty Acid Metabolism. Cancer Cell Int 2019, 19. [Google Scholar] [CrossRef]
- Hashemi, M.; Mirdamadi, M.S.A.; Talebi, Y.; Khaniabad, N.; Banaei, G.; Daneii, P.; Gholami, S.; Ghorbani, A.; Tavakolpournegari, A.; Farsani, Z.M.; et al. Pre-Clinical and Clinical Importance of MiR-21 in Human Cancers: Tumorigenesis, Therapy Response, Delivery Approaches and Targeting Agents. Pharmacol Res 2023, 187. [Google Scholar] [CrossRef] [PubMed]
- Damodaran, M.; Chinambedu Dandapani, M.; SimonDuraiRaj; SandhyaSundaram; VenkatRamanan, S.; Ramachandran, I.; Venkatesan, V. Differentially Expressed MiR-20, MiR-21, MiR-100, MiR-125a and MiR-146a as a Potential Biomarker for Prostate Cancer. Mol Biol Rep 2021, 48, 3349–3356. [CrossRef]
- Joković, S.M.; Dobrijević, Z.; Kotarac, N.; Filipović, L.; Popović, M.; Korać, A.; Vuković, I.; Savić-Pavićević, D.; Brajušković, G. MiR-375 and MiR-21 as Potential Biomarkers of Prostate Cancer: Comparison of Matching Samples of Plasma and Exosomes. Genes (Basel) 2022, 13. [Google Scholar] [CrossRef]
- Xiao, J.; Gong, A.Y.; Eischeid, A.N.; Chen, D.; Deng, C.; Young, C.Y.F.; Chen, X.M. MiR-141 Modulates Androgen Receptor Transcriptional Activity in Human Prostate Cancer Cells through Targeting the Small Heterodimer Partner Protein. Prostate 2012, 72, 1514–1522. [Google Scholar] [CrossRef] [PubMed]
- Sharma, N.; Baruah, M.M. The MicroRNA Signatures: Aberrantly Expressed MiRNAs in Prostate Cancer. Clin Transl Oncol 2019, 21, 126–144. [Google Scholar] [CrossRef] [PubMed]
- Akalin, I.; Erol, B.; Aslan, E.; Ozkanli, S.S.; Efiloglu, O.; Yildirim, S.; Caskurlu, T.; Yildirim, A.; Karaman, M.I. A New Promising Pathway in Aggressive Prostate Cancer: Treg/Mir-Let8c/Lin28b. Arch Esp Urol 2022, 75, 459–466. [Google Scholar] [CrossRef] [PubMed]
- Nagana Gowda, G.A.; Gowda, Y.N.; Raftery, D. Expanding the Limits of Human Blood Metabolite Quantitation Using NMR Spectroscopy. Anal Chem 2015, 87, 706–715. [Google Scholar] [CrossRef] [PubMed]
- Wishart, D.S.; Guo, A.C.; Oler, E.; Wang, F.; Anjum, A.; Peters, H.; Dizon, R.; Sayeeda, Z.; Tian, S.; Lee, B.L.; et al. HMDB 5.0: The Human Metabolome Database for 2022. Nucleic Acids Res 2022, 50, D622–D631. [Google Scholar] [CrossRef] [PubMed]
- Sarlinova, M.; Halasa, M.; Mistuna, D.; Musak, L.; Iliev, R.; Slaby, O.; Mazuchova, J.; Valentova, V.; Plank, L.; Halasova, E. MiR-21, MiR-221 and MiR-150 Are Deregulated in Peripheral Blood of Patients with Colorectal Cancer. Anticancer Res 2016, 36, 5449–5454. [Google Scholar] [CrossRef]
- Benko, J.; Sarlinova, M.; Mikusova, V.; Bolek, T.; Pec, M.J.; Halasova, E.; Galajda, P.; Samos, M.; Mokan, M. MiR-126 and MiR-146a as Markers of Type 2 Diabetes Mellitus: A Pilot Study. Bratisl Lek Listy 2023, 124, 527–533. [Google Scholar] [CrossRef] [PubMed]
- Mishra, P.; Pandey, C.M.; Singh, U.; Gupta, A.; Sahu, C.; Keshri, A. Descriptive Statistics and Normality Tests for Statistical Data. Ann Card Anaesth 2019, 22, 67–72. [Google Scholar] [CrossRef]
- Ørsted, D.D.; Bojesen, S.E. The Link between Benign Prostatic Hyperplasia and Prostate Cancer. Nat Rev Urol 2013, 10, 49–54. [Google Scholar] [CrossRef]
Figure 1.
Relative concentrations of metabolites in blood serum in mCRPC patients and BPH patients. Data are presented as medians normalised to median of BPH set to 1, data variance is shown by Q1 and Q3. *p<0.05; **p=0.05-0.01; *** p<0.001.
Figure 1.
Relative concentrations of metabolites in blood serum in mCRPC patients and BPH patients. Data are presented as medians normalised to median of BPH set to 1, data variance is shown by Q1 and Q3. *p<0.05; **p=0.05-0.01; *** p<0.001.
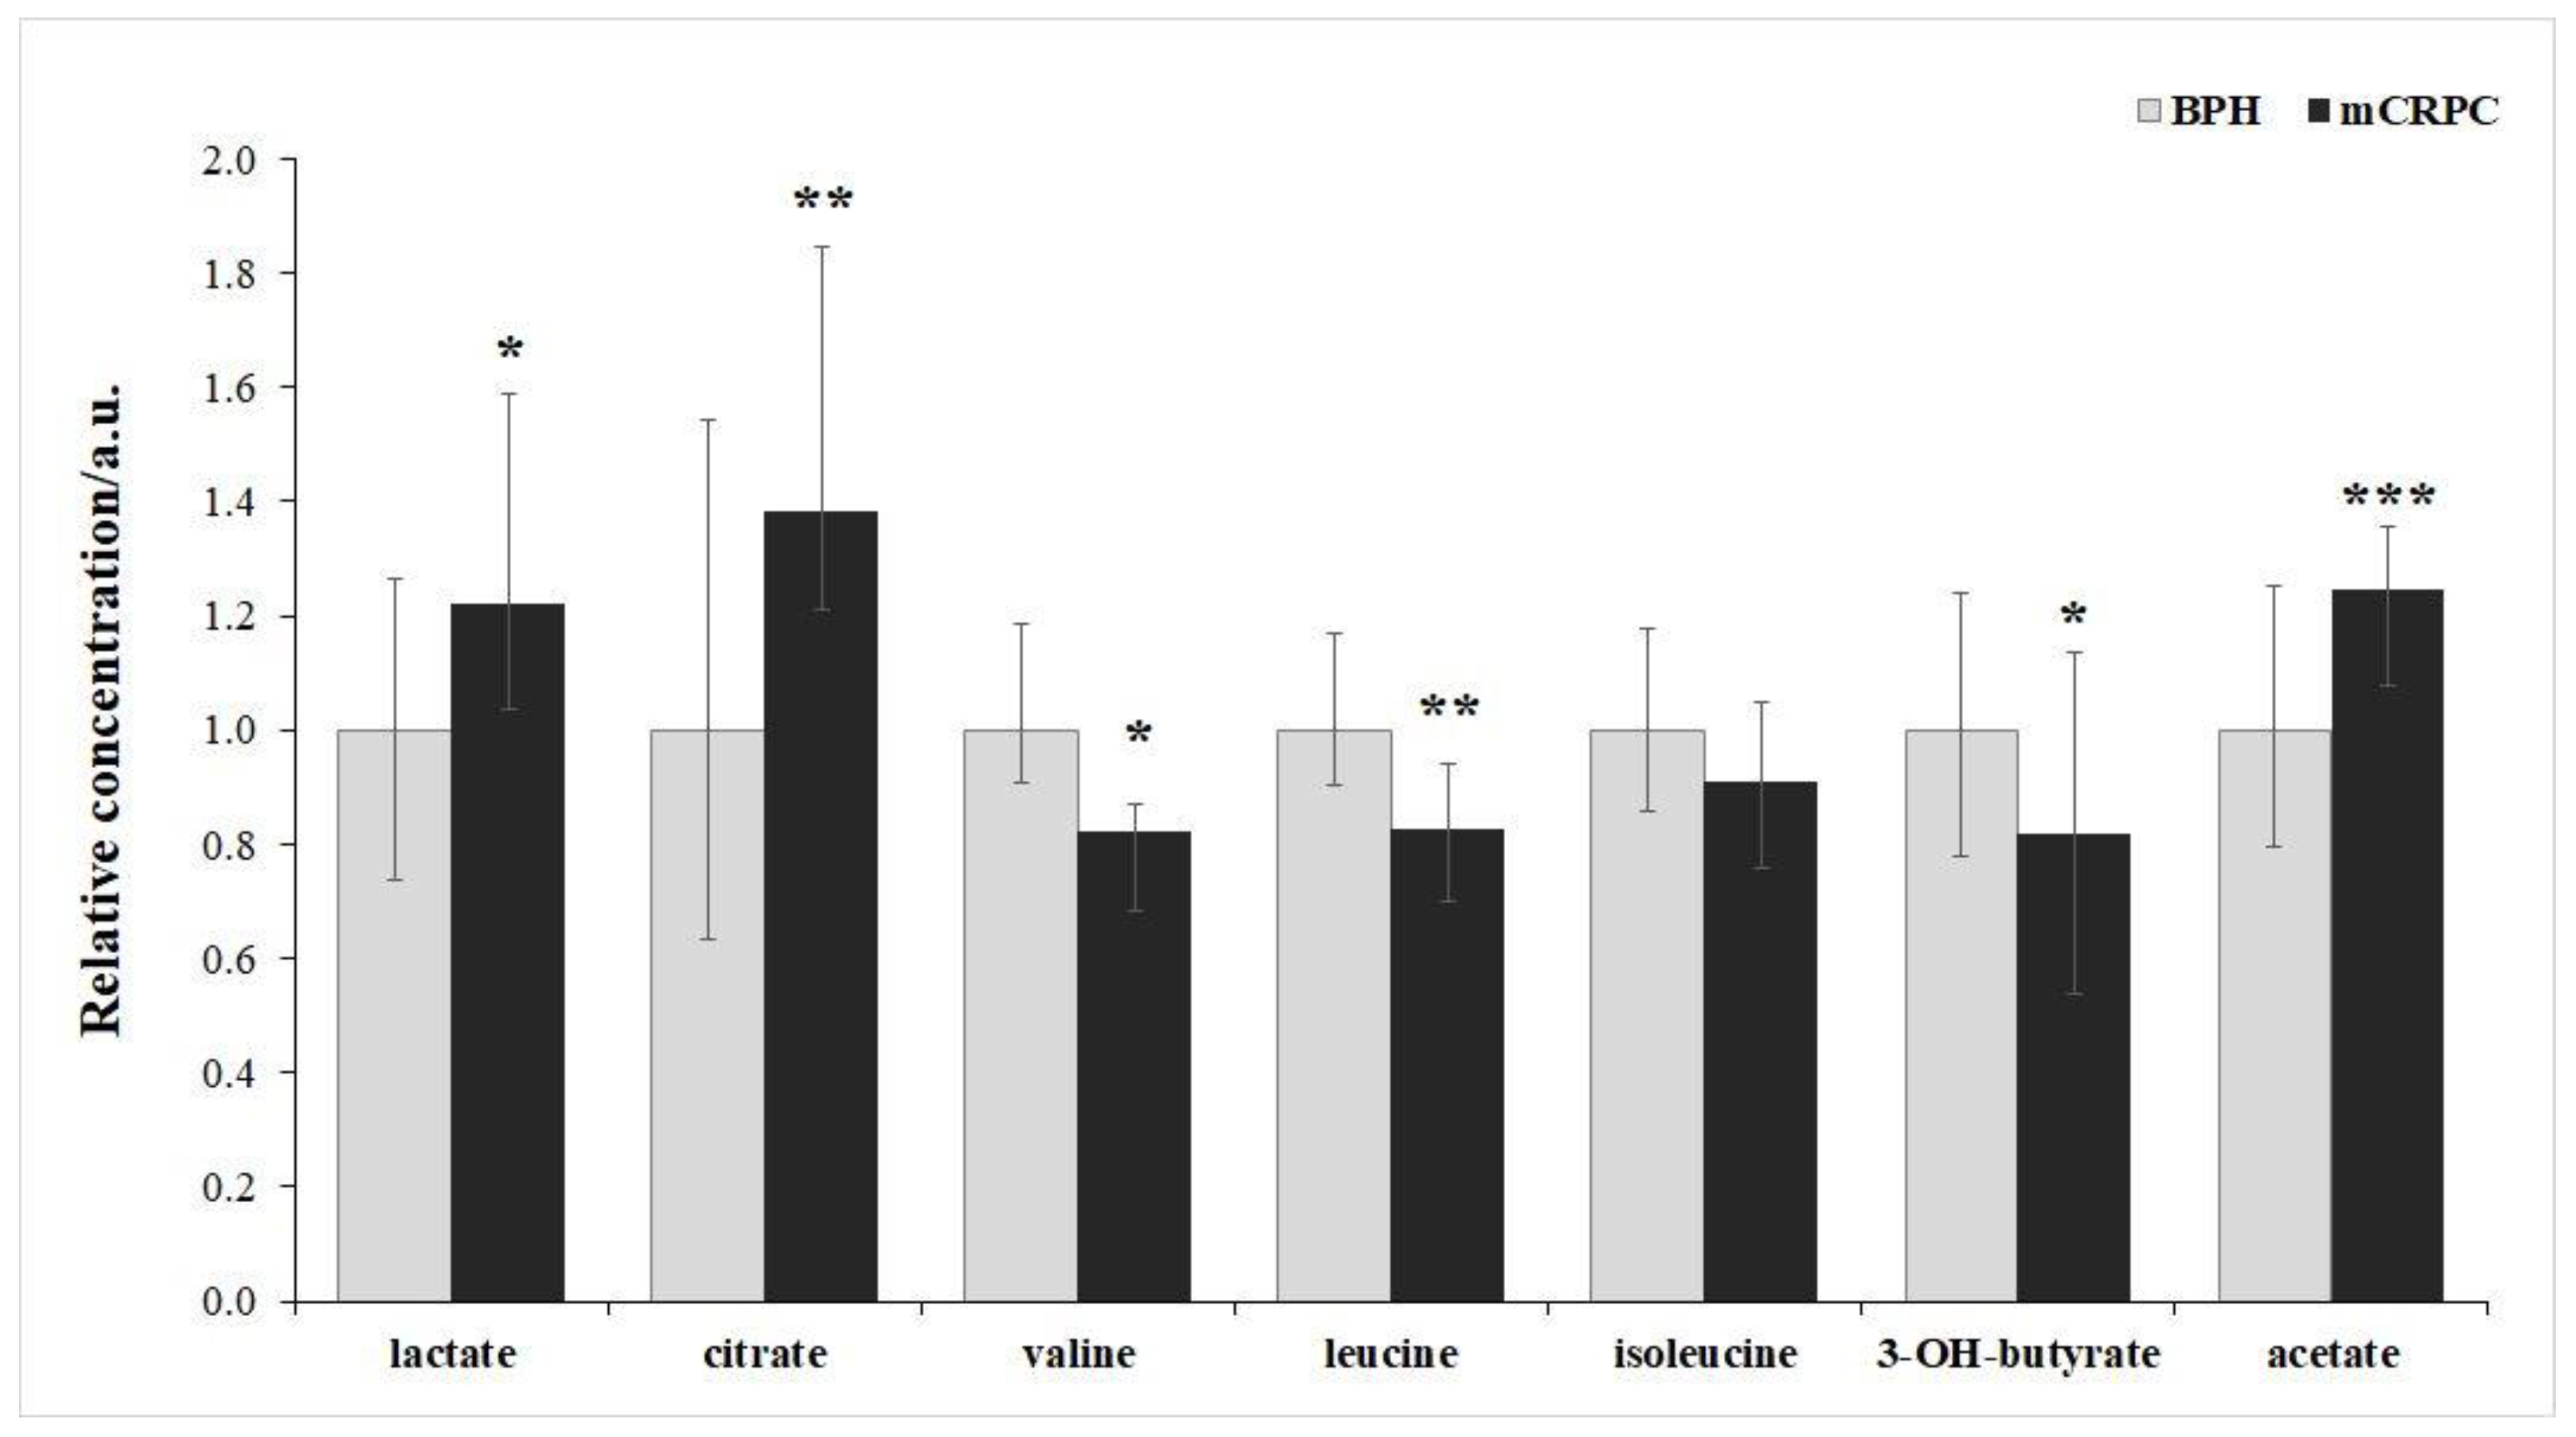

Table 1.
Statistical comparison of relative concentration of blood serum metabolites in mCRPC patients and BPH group. P value derived from Mann-Whitney-U test, percentual change derived from medians.
Table 1.
Statistical comparison of relative concentration of blood serum metabolites in mCRPC patients and BPH group. P value derived from Mann-Whitney-U test, percentual change derived from medians.
| Metabolite |
Percentage change mCRPC vs BPH group |
P-value |
| Lactate | 22% | 0.04 |
| Citrate | 38% | 0.003 |
| Valine | -18% | 0.02 |
| Leucine | -18% | 0.002 |
| Isoleucine | -11% | 0.06 |
| 3-hydroxybutyrate | -19% | 0.03 |
| Acetate | 24% | 0.00002 |
Table 2.
Fold regulation levels of exosomal miRs (miR-15a, miR-16, miR-19a-3p, miR-21, and miR-141a-3p) between mCRPC and BPH patients.
Table 2.
Fold regulation levels of exosomal miRs (miR-15a, miR-16, miR-19a-3p, miR-21, and miR-141a-3p) between mCRPC and BPH patients.
| miR | Fold regulation +/- |
P-value |
|---|---|---|
| miR-15a | -2.00 | 0.006 |
| miR-16 | -3.24 | 4.33 × 10⁻⁶ |
| miR-19a-3p | -2.78 | 1.11 ×10⁻⁵ |
| miR-21 | -2.39 | 0.003 |
| miR-141a-3p | +1.23 | 0.41 |
+, up regulation (comparing to BPH group); -, down regulation (comparing to BPH group).
Table 3.
Correlation analysis between the serum exosomal miRs.
| miR-15a | miR-16 | miR-19a-3p | miR-21 | miR-141a-3p | |||
|---|---|---|---|---|---|---|---|
| miR-15a |
Pearson Corr. P-value |
1.00 - |
0.73 5.94×10⁻⁹ |
0.80 6.22×10⁻¹² |
0.81 3.99×10⁻⁹ |
0.13 0.38 |
|
| miR-16 |
Pearson Corr. P-value |
0.73 5.94×10⁻⁹ |
1.00 - |
0.79 9.88×10⁻¹² |
0.38 0.01 |
0.01 0.95 |
|
| miR-19a-3p |
Pearson Corr. P-value |
0.80 6.22×10⁻¹² |
0.79 9.88 ×10⁻¹² |
1.00 - |
0.72 7.44×10⁻⁹ |
0.22 0.13 |
|
| miR-21 |
Pearson Corr. P-value |
0.81 3.99×10⁻¹² |
0.38 0.01 |
0.72 7.44×10⁻⁹ |
1.00 - |
0.29 0.04 |
|
| miR-141a-3p |
Pearson Corr. P-value |
0.13 0.38 |
0.01 0.95 |
0.22 0.13 |
0.29 0.04 |
1.00 - |
|
Table 4.
Correlation analysis of serum exosomal miRs and metabolites.
| miR-15a | miR-16 | miR-19a-3p | miR-21 | miR-141a-3p | ||
|---|---|---|---|---|---|---|
| Lactate |
Pearson Corr. P-value |
0.35 0.01 |
0.31 0.03 |
0.33 0.03 |
0.27 0.06 |
0.01 0.92 |
| Citrate |
Pearson Corr. P-value |
-0.47 9.23×10⁻⁴ |
-0.24 0.11 |
-0.35 0.02 |
-0.47 7.61×10⁻⁴ |
-0.24 0.09 |
| Valine | Pearson Corr. P-value |
0.05 0.73 |
0.05 0.071 |
0.15 0.33 |
0.14 0.35 |
-0.09 0.55 |
| Leucine | Pearson Corr. P-value |
-0.04 0.78 |
-0.02 0.89 |
0.05 0.72 |
0.08 0.55 |
-0.09 0.55 |
| Isoleucine | Pearson Corr. P-value |
-0.23 0.11 |
-0.09 0.52 |
-0.07 0.62 |
-0.12 0.44 |
-0.08 0.59 |
| 3-hydroxybutyrate |
Pearson Corr. P-value |
0.28 0.05 |
0.09 0.51 |
0.17 0.24 |
0.33 0.03 |
0.05 0.72 |
| Acetate |
Pearson Corr. P-value |
0.16 0.29 |
0.01 0.96 |
0.30 0.04 |
0.46 0.001 |
0.42 0.003 |
| Glutamine |
Pearson Corr. P-value |
0.28 0.05 |
0.28 0.05 |
0.21 0.16 |
0.19 0.21 |
-0.14 0.36 |
| Lysine |
Pearson Corr. P-value |
-0.44 0.002 |
-0.22 0.14 |
-0.29 0.05 |
-0.39 0.006 |
-0.04 0.81 |
Table 5.
Description of the cohort under study.
| mCRPC patients | BPH patients | P-value | |
|---|---|---|---|
| Number | 51 | 48 | > 0.05 |
| Age (years, mean ± SD) Range |
73.5 ± 7.65 (58 - 85) |
67.5 ± 6.54 (55 - 84) |
< 0.05 |
| PSA (ng/ml, mean ± SD) Range |
103.5 ± 1478.7 (2.2 - 9506) |
3.29 ± 9.77 (0.2 – 66.5) |
< 0.05 |
|
T Staging T2 T3 T4 |
No. 2 35 14 |
N/A |
– |
|
N staging N0 N1 |
No. 40 11 |
N/A |
– |
|
M staging* M1a M1b M1c |
No. 8 51 4 |
N/A |
– |
| Gleason score 6 7 8 9 10 |
No. 1 9 17 20 4 |
N/A |
– |
*one or more staging for each patient. N/A, not applicable.
Disclaimer/Publisher’s Note: The statements, opinions and data contained in all publications are solely those of the individual author(s) and contributor(s) and not of MDPI and/or the editor(s). MDPI and/or the editor(s) disclaim responsibility for any injury to people or property resulting from any ideas, methods, instructions or products referred to in the content. |
© 2024 by the authors. Licensee MDPI, Basel, Switzerland. This article is an open access article distributed under the terms and conditions of the Creative Commons Attribution (CC BY) license (http://creativecommons.org/licenses/by/4.0/).
Copyright: This open access article is published under a Creative Commons CC BY 4.0 license, which permit the free download, distribution, and reuse, provided that the author and preprint are cited in any reuse.


