Submitted:
18 January 2024
Posted:
19 January 2024
You are already at the latest version
Abstract
Soil microbiome plays key role in plant health. Native soil microbiome inoculation, metagenomic profiling and high-throughput cultivation require efficient microbe extraction. The sonication and oscillation are most common methods to extract soil microbiome. However, the extraction efficiency of those methods has barely been investigated. Here, we compared the culturable microbe numbers, community structures and alpha diversities among the methods including sonication, oscillation, centrifugation and their processing time. The results showed that, sonication significantly increases culturable colony number compare with oscillation and centrifugation factors. Furthermore, sonication strategy shows a main factor influence extraction efficiency, but increased sonication time can recovery this impact. Finally, processing times of extraction show a significant negative relationship with α diversity among extracted microbiota. In conclusion, sonication is a main factor for enrich in-suit microbiota, and increased extraction time significantly decrease α diversity of extracted microbiota. These results can provide insights into the isolation and utilization of microorganism source.
Keywords:
extraction microbiota
; microbiota diversity
; sonication
; oscillation
; processing times
1. Introduction
Microbes [1] perform a variety of vital functions that are essential for healthy ecosystems, ranging from nutrient recycling, antibiotic production and waste decomposition. Many in-situ extracted microorganisms are used to improve human health [2], control environmental pollution [3], and enhance agricultural production [4]. One of the useful microbiome transplant was fecal microbiota transplantation (FMT)[5]. FMT has been used to treat a variety of diseases, such as infectious diseases [6], inflammatory bowel diseases, oncologic diseases, hematological diseases [7], and neurodegenerative diseases[8]. Additionally, microbes make a huge contribution to environmental governance and can also assist in the elimination of pollutants from hyperthermal, acidic, hypersaline, or basic industrial waste[9]. Microbial biotechnology offers sustainable routes to plastic production and waste management[3]. Microorganisms are an important element in modeling sustainable agriculture[10] and are crucial in maintaining plants’ growth, development, and yield[7]. Nowadays, it has been demonstrated that the plant microbiome can be modified by transplanting the microbiota, with exciting results for the control of plant diseases[10]. Therefore, Microbiota extraction methods are an important element in isolated and transplanted microbes.
Microbiota extraction methods contained sonication, oscillation, and centrifugal process to enrich in-suit microbiota[11,12]. However, few focusing are intended in extraction factors impacted extraction microbiota. In this study, we firstly tested centrifuge, oscillation, and sonication influence of effectiveness on the culturable bacterial numbers, community structure and diversity of extracted soil microbiota. Sonication showed the most significant effect on the extracted microbiota. Then methods with different sonication strategy and time were designed to explore how sonication affected the extraction efficiency, and the results showed that sonication strategy was a main factor influence extraction efficiency and increase sonication time can recovery this impact. Finally, we analyzed the α diversity among all methods extracted microbiota, and their correlation with the processing times. The α diversity among extracted microbiota showed a significant negative relationship with processing time. In conclusion, our study promotes a further understanding of the impact of extraction methods on microbiota, which can provide better insights into the isolation and utilization of microorganism source.
2. Material and Methods
2.1. Soil Sampling
The soil used in the experiments was collected from a rice field, at Taojiang County, Yiyang City, Hunan Province, China (28°38′09″ N, 112°0′57″ E). The top 3~20 cm of the soil was collected and sieved (3-mm sieve) to remove rocks and other debris. Soil was overnight air-dried at room temperature when used.
2.2. Design Soil Microbiota Extraction Methods
In order to compare the effect sizes of centrifuge, oscillation, and sonication on soil microbiota extraction, we designed four method groups (CK, CF, UT1 and LT, Table 1). For each method, 10 g of prepared-soil was mixed with 50 ml of sterile water at a conical bottle. For extract microbiota, oscillation 30 min at 200 rpm (as CK); oscillation for 3 hours at 200 rpm (as LT); sonication 2 min at a frequency of 30kHz after oscillation 30 min at 200 rpm (as UT1). And then the suspensions were incubated for 15 min at room temperature to precipitate soil. The supernatant was the extracted microbiota. Additionally, the CK method extracted microbiota was subjected to centrifugation (600 rpm, 1 min, 4℃) as LT method. The extracted microbiota was stored at -80℃ before further analysis.
2.3. Investigate Effect Size of Sonication Time and Strategy among Extraction Microbiota
Based on the above analysis, we found that sonication was a main factor of microbiota extraction. For furthermore compared the effect size of sonication time and strategy, we designed two methods to compare with the previous method UT1. Base on method UT1, oscillation time was divided into two equal part (15 min), and inserted the sonication treatment in the middle as a new sonication strategy method. For detail, oscillation 15 min at 200 rpm, inserted sonication 2 min (as UT2) or 6 min (as UT3) at a frequency of 30kHz, then continue oscillation 15 min at 200 rpm. The extracted microbiota was stored at -80℃ before further analysis.
2.4. Plate Counting
To accurately quantify the culturable bacterial populations within the extracted microbiota, we employed the standard plate counting method to enumerate viable bacteria [14]. Diluted the extracted microbiota 106 times using sterile water through ten-fold series continuous dilution method, and then 70 μL diluted microbiota was spread on nutrient broth agar (NA) medium. The plate was incubated overnight at 28℃ before calculated colony-forming unit (C.F.U.). Each extraction method repeats 18 times. Plotted and unpaired one-way analysis of variance (ANOVA) with Tukey’s test were conducted using GraphPad Prism 8 software (San Diego, USA).
2.5. 16S rRNA Amplicon Sequencing
The extracted microbiota was analyzed the microbiota diversity through 16S rRNA sequencing (three replicates per method, each replicate mixed three extracted microbiota). Total DNA was extracted using MagPure Soil DNA LQ Kit (Magen, Shanghai, China) base on the manufacturer’s instructions. NanoDrop ND-1000 spectrophotometer (Thermo Fisher Scientific, USA) and agarose gel electrophoresis was used to test the quality and quantity of DNA. Extracted DNA was diluted to a concentration of 1 ng/μL and stored at -20°C for further experiment. PCR amplification of bacterial 16S rRNA gene fragments (V3–V4 region) was performed using Takara Ex Taq (Takara, Beijing, China) and the barcoded primers 343F (5′-TACGGRAGGCAGCAG-3′) and 798R (5′-AGGGTATCTAATCCT-3′). Amplicons were visualized using agarose gel electrophoresis and purified using Agencourt AMPure XP beads (Beckman Coulter, Pasadena, USA) twice. After purification, the DNA was quantified using Qubit dsDNA assay kit (Yeasen, Shanghai, China). Equal amounts of purified DNA were pooled for sequencing on the NovaSeq 6000 platform (Illumina Inc, USA) at Shanghai OEbiotech (Shanghai, China).
2.6. Data Analysis
The 16S rRNA gene fragment sequences were processed using QIIME2 v.2021.4[13]. Paired-end reads were detected and the adapters were removed using vsearch v.2.26.1 [14]. After trimming, paired-end reads were filtered for low-quality sequences, denoised, merged and clustered using DADA2 v.2020.2.0[15]. Amplicon sequence variants (ASVs) and a feature table were generated using QIIME2. All ASVs were annotated using the Silva v138.1 reference databases[16]. A principal coordinates analysis (PCoA) based on Bray Curtis distances was performed using the R package vegan [17]. Diversity and differential abundance analyses were performed using STAMP v.2.1.3 software [18].
3. Results
3.1. Sonication Increased Culturable Bacteria Diversity
To determine culturable bacteria diversity of extracted microbiota from three extraction methods, we counted the bacterial numbers using plate counting (Figure 1, Table S1). The results showed that culturable bacterial numbers extracted from UT1 (sonication) method had a significantly higher than extracted from CK, CF (centrifugation) and LT (oscillation) methods (Figure 1A, p < 0.05, unpaired one-way ANOVA with Tukey’s test). And the culturable bacterial morphology extracted from UT1 method showed more diversity than extracted from CK, CF and LT methods (Figure 1B, Figure S1). However, bacterial numbers extracted from CK, CF and LT methods showed no significant difference (Figure 1A, p > 0.05) and similar diversity (Figure 1B, Figure S1, Table S2), respectively. Theres results indicated that sonication was a main factor to increase culturable bacteria diversity.
3.2. Ultrasonic Was Main Factor Impact Composition and Diversity of Extracted Microbiota
For further investigate the effect size of microbiota diversity variation between three extraction methods, we analyzed their microbiome using 16s rRNA sequencing. Principal coordinate analysis (PCoA) showed that UT1, LT and CK extracted microbiome were significant separated to three parts (p < 0.001, PERMANOVA by adonis, Figure 2B). And the first and second principal coordinated axis (PCo1 and PCo2) explained 50.19% and 15.92% variation, respectively (Figure 2B). Compared the microbiome with CK, we found that UT1, LT and CF methods contributed 67.37%, 58.42% and 29.43% effect size for microbiome variation (Figure 2C). For further investigate the composition variation among three extraction methods, we analyzed their taxonomy at phylum and order level (Figure 2A, Figure S2, S3, S4, S5).
We found that Proteobacteria, Acidobacteria, Chloroflexi, Actinobacteria and Nitrospirae were top 5 enriched phylum among CK, UT1, CF and LT extracted microbiota (Figure S2). And extraction method UT1 can significant enrich Proteobacteria and Actinobacteria compared with CK method (p < 0.01, Figure S3). Acidobacteriales, Nitrospirales, Rhodospirillales, Burkholderiales and Rhizobiales were the top 5 enriched order among CK, UT1, CF and LT extracted microbiota (Figure 2). Compared with CK method, CF, LT and UT1 extracted microbiota were significantly enriched 1, 2 and 4 orders among top 20 enriched order, respectively (p <0.05, Figure 2D, E, F). The relative abundance of Chlorobiales in CF method extracted microbiota were significantly enrich than CK method extracted (p < 0.05, Figure 2D). And, the relative abundance of Sphingomonadales and Burkholderiales in the LT method extracted microbiota were significantly higher than that in the CK method extracted (p < 0.05, Figure 2E). In addition, compared with CK method, UT1 method extracted microbiota significantly increased the relative abundance of Sphingomonadales, Neisseriales, Burkholderiales and Xanthomonadales (p < 0.05, Figure 2F). These results indicated sonication significant enriched of suit microbiota.
3.3. Sonication Time and Strategy Impact Culturable Bacteria Diversity
Many extraction microbiota methods used sonication before oscillation, and different sonication treatment time[19]. However, how those factor impact extracted microbiota diversity was few investigated. So that, we designed sonication treatment before oscillation method UT2 and increased ultrasonic treatment time method UT3. Compared with UT1, culturable bacterial number and diversity from method UT2 was significant decreased (p < 0.05, Figure 3, Table S3). Interestingly, culturable bacterial number and diversity from increase sonication time method UT3 was significant increased than from method UT2 (p < 0.05, Figure 3A, Table S4), and no significant difference than from method UT1(p > 0.05, Figure 3A, Table S4). These results showed that sonication strategy decrease culturable bacteria diversity, and increase sonication time can recovery this impact.
3.4. Sonication Strategy Impact Microbiota Composition among Extraction
In order to investigate the effect size of microbiome variation between sonication time and strategy, we analyzed their extracted microbiota composition through 16s rRNA sequencing. Principal coordinate analysis showed that extracted microbiota from UT1 and UT2 methods were significant separated to two clusters (p < 0.001, PERMANOVA by adonis, Figure 4B). And the first and second principal coordinated axis (PCo1 and PCo2) explained 61.37% and 13.26% variation, respectively (Figure 4B). Compared with method UT2, different sonication strategy method UT1 extracted microbiota showed 68.88% effect size of microbiome variation, however increased sonication time method UT3 extracted microbiota just showed 26.26% effect size (Figure 4C). Further analysis the taxonomy diversity among the three methods extracted microbiota, we found that Proteobacteria, Acidobacteria, Chloroflexi, Actinobacteria and Nitrospirae were the top 5 enriched phylum among three method extracted microbiota (Figure S2). And Actinobacteria from UT2 extracted microbiota was significant decreased than from UT1 extracted microbiota (p < 0.05, Figure S3). However, UT3 extracted microbiota was no significant difference than from UT2 extracted microbiota at phylum level (p > 0.05, Figure S3).
Then, we analyzed the composition of extracted at the order level. We found that Acidobacteriales, Nitrospirales, Rhizobiales, Rhodospirillales and Nitrosomonadales were the top 5 enriched order among three method extracted microbiota (Figure 4A). Difference analysis showed that relative abundance of extracted microbiota of UT2 and UT3 methods significantly decreased 6 and 3 orders than of UT1 method among top 20 enriched orders, respectively (Figure 4D). At detail, relative abundance of Sphingomonadales, Chlorobiales, Xanthomonadales, Burkholderiales, Sphingobacteriales and Desulfuromonadales extracted from UT2 method significantly decreased than that of UT1 (p < 0.05, Figure 4D). But compared with UT1 method, relative abundance of Sphingomonadales, Sphingobacteriales and Chlorobiales among UT3 method extracted microbiota showed a significantly decreased (p < 0.05, Figure 4E). These results showed that ultrasonic strategy was a main effect factor for extracted microbiota variation, and increase ultrasonic time was hard to recovery extracted microbiota diversity.
3.5. Processing Time Significant Decreased Extracted Microbiota α-Diversity
Additionally, we found that culturable bacterial number and diversity from the longer processing time method LT was decreased (Figure 1A, Figure S1). Therefore, we hypothesis that processing time may impact the extracted microbiota diversity. To investigate the correlation between processing time and microbiota diversity, we analyzed the Shannon index (α-diversity) across all methods used for microbiota extraction. Results showed that less processing time method CK showed the highest Shannon index, and the longest processing time LT showed a significant lower Shannon index (Figure 5A). Interestingly, the less processing time but change sonication strategy method UT2 also significantly decreased Shannon index (Figure 5A), however increased sonication time method UT3 increased Shannon index. These results consistent with previous result that ultrasonic strategy was a main effect factor for extracted microbiota diversity. Further, we calculated all methods processing time, and their correlation with Shannon index. We found that the processing time showed a significantly negative relationship with Shannon index of extracted microbiota (p < 0.05, Figure 5B). These results lead to the conclusion that processing time and ultrasonic strategy are the primary factors influencing the microbiota extraction process.
4. Discussion
Over an extended period, the microbiome has consistently been acknowledged as a pivotal constituent of plant ecosystems. Within the realm of microbiota research, microbial extraction is an indispensable procedural facet. Nevertheless, contemporary literature is relatively scant regarding methodologies for microbiome extraction. Within the scope of this investigation, diverse approaches to extracting soil microbial communities were methodically designed. Specifically, the oscillation, centrifugation, ultrasonication, and processing time on the cultivable bacterial count, community structure, and diversity of the extracted microbial communities were explored. Primarily, in terms of oscillation, we found that oscillation was not used in the extraction process of Actinobacteria in the past studies [20,21], and in this study, it was also confirmed that the length of oscillation time did not affect Actinobacteria. Conversely, within the realm of rhizosphere Acidobacteria, varying agitation times, spanning from 0 min[20] to 1 h[22], were found to engender a decrement in the relative abundance of Acidobacteria. This observation aligns with our findings, where the LT treatment led to a significant reduction in Acidobacteria abundance compared to the CK (p< 0.05, Figure 4). The decrease of microbial community α-diversity caused by increasing oscillation time, which may be related to the length of processing time, will be discussed later.
Historically, research has harnessed ultrasonication technology for recover microorganisms from wood surfaces, demonstrating superior yields compared to grinding, without inducing significant microbial mortality [23]. Notably, ultrasonication has been employed in the medical domain to collect bacterial samples from biofilms adhering to prosthetic surfaces[24]. Furthermore, in the water treatment industry, ultrasonication systems have exhibited superior microbial control capabilities[25]. These instances underscore the pivotal role of ultrasonic technology in microbiome extraction. It is noteworthy that low-intensity ultrasound alone may not effectively kill bacteria. Instead, the stable cavitation of ultrasound facilitates alterations in bacterial cell membranes, influencing bacterial adhesion and growth [26]. This phenomenon likely renders microorganisms more amenable to extraction from a diverse array of materials, a premise that aligns with the outcomes of this study where ultrasonication led to an increased cultivable bacterial count in extractions (Figure 1), emerging as a primary determinant of microbiome extraction efficiency. Nevertheless, it should be noted that certain studies have employed post-ultrasonication agitation as a strategy to enhance the culturing efficiency of bacteria isolated from the ultrasonication process. Contrarily, the findings presented in this study, as illustrated in Figure S1, suggest that this methodology might lead to a reduction in the diversity of the extracted microbial population. This observed effect could potentially be ascribed to the reattachment of bacteria to the substrates during the incubation phase, which necessitates further investigation.
Finally, we found that the extraction of microbiota α-diversity was significantly reduced with the extension of processing time (Figure 5). Studies have shown that microbial environmental fluctuations can induce responses of microbial communities, populations, and individuals on a time scale [27]. In a study of the effects of microbial soil amendments on the bacterial microbiome of strawberry roots, it was found that the longer the use of the amendments, the lower the α-diversity of the strawberry root microbial community [19], which is consistent with our findings. Soil pores are usually filled with different proportions of air and nutrients. Due to the prolonged processing time in the extraction process, nutrients and oxygen are lost, and microorganisms compete for scarce resources [28], resulting in changes in microbial communities and affecting microbial activity. There is vertical habitat heterogeneity in space and time between nutrients and oxygen in lakes, resulting in large differences in bacterial community structure [29,30], which is an excellent example. This may explain the significant reduction in α diversity of the extracted flora in this study as a result of increased processing time, but we expect that changes in microbial diversity in response to extraction methods are likely dependent on more factors. In conclusion, this study offered crucial insights into microbial community dynamics and the efficiency of various extraction techniques. Researchers can refine and optimize extraction protocols by the quantity and diversity of microbial communities.
Supplementary Materials
The following supporting information can be downloaded at the website of this paper posted on Preprints.org.
Author Contributions
D.Z., P.S., and Z.L. conceived the idea for the study. Z.L., C.Z., J.M., and Q.P. performed the bioinformatic analyses and visualized the data. Z.L., C.Z., and J.M. analyzed the data. Z.L., X.D., S.S., J.C., and C.Z. conducted formal data analysis and review. W.P., P.S., and D.Z. conducted review. Z.L., C.Z., L.C., Z.G., W.Z., and J.M. conducted the soil sampling, microbiota extraction and the microbiological experiments. The manuscript was written by Z.L., C.Z., J.M., and Q.P. All authors read and approved the final manuscript.
Funding
This study was supported by a grant from 2020 Hainan Science and Technology Major Project (ZDKJ202001), Hunan agricultural science and technology innovation fund (2023CX18), the National Natural Science Foundation of China (32302316), the National Natural Science Foundation of China (31901854), independent research project of State Key Laboratory of Hybrid Rice (2023MS02), independent research project of State Key Laboratory of Hybrid Rice (2023MS03).
Data Availability Statement
Raw sequence data (16S rRNA gene fragment sequencing) generated in this study have been deposited in the Genome Sequence Archive of the BIG Data Center [31], Chinese Academy of Sciences under accession PRJCA021722 [https://ngdc.cncb.ac.cn/bioproject/browse/PRJCA021722].
Acknowledgments
We are thankful to the Longping Branch of Graduate School of Hunan University and Institute of Plant Protection, Hunan Academy of Agricultural Sciences, for their support. At the same time, I also thank everyone for their hard work.
Conflicts of Interest
The authors declare no conflict of interest.
References
- Natarajan, A.; Bhatt, A. S. Microbes and microbiomes in 2020 and beyond. Nature Communications. 2020,11(1), 4988. [CrossRef]
- Puschhof, J.; Pleguezuelos-Manzano, C.; Clevers, H. Organoids and organs-on-chips: Insights into human gut-microbe interactions. Cell host & microbe. 2021,29(6), 867-878. [CrossRef]
- Choi,S,Y.; Lee,Y.; Yu,H,E.; Cho, I,J.; Kang, M.; Lee, S. Sustainable production and degradation of plastics using microbes. Nature Microbiology. 2023, 8(12), 2253-2276. 12. [CrossRef]
- Jansson, J, K.; McClure, R.; Egbert, R, G. Soil microbiome engineering for sustainability in a changing environment. Nature Biotechnology. 2023,1-13. [CrossRef]
- Airola,C.;Severino,A.;Porcari,S.;Fusco,W.;Mullish,B.H.;Gasbarrini,A.;Cammarota,G.;Ponziani,F.R.;Ianiro,G.Future Modulation of Gut Microbiota: From Eubiotics to FMT, Engineered Bacteria, and Phage Therapy.Antibiotics.2023,12,868. [CrossRef]
- Akbar,S.; Gu,L.; Sun,Y.F.; Zhang,L.; Lyu,K.; Huang,Y.; Yang,Z. Understanding host-microbiome-environment interactions: Insights from Daphnia as a model organism. Science of the Total Environment.2022,808,152093. [CrossRef]
- Matheson,J.A.; Damian,H.R.M. The Role of Fecal Microbiota Transplantation in the Treatment of Neurodegenerative Diseases: A Review.Int.International Journal of Molecular Sciences.2023,24,1001. [CrossRef]
- Nadarajah,K.;Abdul Rahman,N.S.N..The Microbial Connection to Sustainable Agriculture.Plants.2023,12,2307. [CrossRef]
- Ahn,J.S.;Choi,Y.J.;Kim,H.B.;Chung,H.J.; Hong,S.Y. Identification of the Intestinal Microbes Associated with Locomotion. International Journal of Molecular Sciences.2023,24(14),11392. [CrossRef]
- Vanessa,S. Liver-Gut-Interaction: Role of Microbiome Transplantation in the Future Treatment of Metabolic Disease.Journal of Personalized Medicine.2023,13,220. [CrossRef]
- Li, P. D.; Zhu, Z. R.; Zhang, Y.; Xu, J.; Wang, H.; Wang, Z.; Li, H. The phyllosphere microbiome shifts toward combating melanose pathogen. Microbiome. 2022,10(1), 1-17. 1. [CrossRef]
- Su, P.; Wicaksono, W. A.; Li, C.; Michl, K.; Berg, G.; Wang, D.; Xiao, Y.L.; Huang, R.Y.; Kang, H.X.; Zhang, D.Y.; Cernava, T.; Liu, Y. Recovery of metagenome-assembled genomes from the phyllosphere of 110 rice genotypes. Scientific Data. 2022,9(1), 254. 1. [CrossRef]
- Bolyen, E.; Rideout, J. R.; Dillon, M. R.; Bokulich, N. A.; Abnet, C. C.; Al-Ghalith, G. A.; Caporaso, J. G. Reproducible, interactive, scalable and extensible microbiome data science using QIIME 2. Nature biotechnology. 2019,37(8), 852-857. [CrossRef]
- Rognes, T.; Flouri, T.; Nichols, B.; Quince, C.; Mahé, F. VSEARCH: a versatile open source tool for metagenomics. PeerJ. 2016,4, e2584. [CrossRef]
- Callahan, B. J.; McMurdie, P. J.; Rosen, M. J.; Han, A. W.; Johnson, A. J. A.; Holmes, S. P. DADA2: High-resolution sample inference from Illumina amplicon data. Nature methods. 2016,13(7), 581-583. [CrossRef]
- Quast, C.; Pruesse, E.; Yilmaz, P.; Gerken, J.; Schweer, T.; Yarza, P.; Glöckner, F. O. The SILVA ribosomal RNA gene database project: improved data processing and web-based tools. Nucleic acids research. 2012,41(D1), D590-D596. [CrossRef]
- Oksanen, J. vegan: Community Ecology Package-R package version. 2011,1.17-8. http://CRAN.R-project.org/package=vegan.
- Parks, D. H.; Tyson, G. W.; Hugenholtz, P.; Beiko, R. G. STAMP: statistical analysis of taxonomic and functional profiles. Bioinformatics. 2014,30(21), 3123-3124. [CrossRef]
- Deng, S.; Wipf, H. M. L.; Pierroz, G.; Raab, T. K.; Khanna, R.; Coleman-Derr, D. A plant growth-promoting microbial soil amendment dynamically alters the strawberry root bacterial microbiome. Scientific reports. 2019, 9(1), 17677. [CrossRef]
- Naylor, D.; DeGraaf, S.; Purdom, E.; Coleman-Derr, D. Drought and host selection influence bacterial community dynamics in the grass root microbiome. The ISME journal. 2017,11(12), 2691-2704. [CrossRef]
- Sharma, P.; Thakur, D. Antimicrobial biosynthetic potential and diversity of culturable soil actinobacteria from forest ecosystems of Northeast India. Scientific reports. 2020,10(1), 4104. [CrossRef]
- Campolino, M. L.; de Paula Lana, U. G.; Gomes, E. A.; Coelho, A. M.; de Sousa, S. M. Phosphate fertilization affects rhizosphere microbiome of maize and sorghum genotypes. Brazilian Journal of Microbiology. 2022,53(3), 1371-1383. [CrossRef]
- Ismaïl, R.; Aviat, F.; Michel, V.; Le Bayon, I.; Gay-Perret, P.; Kutnik, M.; Fédérighi, M. Methods for recovering microorganisms from solid surfaces used in the food industry: a review of the literature. International journal of environmental research and public health. 2013,10(11), 6169-6183. [CrossRef]
- Rodriguez-Merchan, E.C. The Function of Sonication in the Diagnosis of Periprosthetic Joint Infection After Total Knee Arthroplasty. Archives of Bone and Joint Surgery. 2022, 10(9), 735. [Google Scholar] [CrossRef]
- Broekman, S.; Pohlmann, O.; Beardwood, E.S.; de Meulenaer, E. C. Ultrasonic treatment for microbiological control of water systems. Ultrasonics sonochemistry. 2010, 17(6), 1041–1048. [Google Scholar] [CrossRef]
- Yu, H.; Chen, S.; Cao, P. Synergistic bactericidal effects and mechanisms of low intensity ultrasound and antibiotics against bacteria: a review. Ultrasonics sonochemistry. 2012, 19(3), 377–382. [Google Scholar] [CrossRef] [PubMed]
- Nguyen, J.; Lara-Gutiérrez, J.; Stocker, R. Environmental fluctuations and their effects on microbial communities, populations and individuals. FEMS Microbiology Reviews 2021, 45(4), fuaa068. [Google Scholar] [CrossRef] [PubMed]
- Chepsergon, J.; Moleleki, L. N. Rhizosphere bacterial interactions and impact on plant health. Current Opinion in Microbiology. 2023, 73, 102297. [Google Scholar] [CrossRef] [PubMed]
- Shade, A.; Read, J. S.; Welkie, D. G.; Kratz, T. K.; Wu, C. H.; McMahon, K. D. Resistance, resilience and recovery: aquatic bacterial dynamics after water column disturbance. Environmental microbiology. 2011, 13(10), 2752–2767. [Google Scholar] [CrossRef] [PubMed]
- Shade, A.; Jones, S. E.; McMahon, K. D. The influence of habitat heterogeneity on freshwater bacterial community composition and dynamics. Environmental microbiology. 2008, 10(4), 1057–1067. [Google Scholar] [CrossRef] [PubMed]
- BIG Data Center Members. Database resources of the BIG data center in 2018. Nucleic Acids Res. 2018, 46, D14–D20. [Google Scholar] [CrossRef] [PubMed]
- Chen,Y.;Wang,J.;Yang,N.;Wen,Z.Y.;Sun,X.P.;Chai,Y.R.;Ma,Z.H.Wheat microbiome bacteria can reduce virulence of a plant pathogenic fungus by altering histone acetylation.Nature Communications.2018,9,3429. [CrossRef]
- Levine,B.H.;Hoffman,J.M. Gut Microbiome Transplants and Their Health Impacts across Species. Microorganisms, 2023, 11(6), 1488. [CrossRef]
- Anguita-Maeso, M.; Navas-Cortés, J. A.; Landa, B. B. Insights into the Methodological, Biotic and Abiotic Factors Influencing the Characterization of Xylem-Inhabiting Microbial Communities of Olive Trees. Plants 2023, 12, 912. [Google Scholar] [CrossRef] [PubMed]
- Weng,X.H.;Wang,M.Y.;Sui,X.;Frey,B.;Liu,Y.N.;Zhang,R.T.;Ni,H.W.;Li,M.H.High Ammonium Addition Changes the Diversity and Structure of Bacterial Communities in Temperate Wetland Soils of Northeastern China.Microorganisms.2023,11,2033. [CrossRef]
- Abakumov, E.; Zverev, A.; Andronov, E.; Nizamutdinov, T. N. Microbial Composition of Natural, Agricultural, and Technogenic Soils of Both Forest and Forest-Tundra of the Russian North .Applied Sciences.2023,13,8981. [CrossRef]
- Watanabe,M.;Igarashi,K.;Kato,S.;Kamagata,Y.;Kitagawaa,W.Critical Effect of H2O2 in the Agar Plate on the Growth of Laboratory and Environmental Strains.Microbiology Spectrum.2022,10,1-8. [CrossRef]
- Liu,J.Q.;Zhou,H.B.;Yang,Z.Y.;Wang,X.;Chen,H.N.;Zhong,L.;Zheng,W.T.; Niu,W.J.;Wang,S.;Ren,X.M.;et al. Rational construction of genome-reduced Burkholderiales chassis facilitates efficient heterologous production of natural products from proteobacteria.Nature Communications.2021,12,4347. [CrossRef]
- Moreno-Forero, S. K.; Van Der Meer, J. R. Genome-wide analysis of Sphingomonas wittichii RW1 behaviour during inoculation and growth in contaminated sand. The ISME Journal 2015, 9, 150–165. [Google Scholar] [CrossRef]
- Müller,R.H.; Rohwerder, T.; Harms,H.; Degradation of fuel oxygenates and their main intermediates by Aquincola tertiaricarbonis L108. Microbiology, 2008, 154(5): 1414-1421. [CrossRef]
- Jung,M.Y.; Sedlacek,C.J.; Kits,K.D.; MuellerA.J.;Rhee,S.K.;Hink,L.;Nicol,J.W.; Bayer.B.;Morley,L.L.; Wright,C.;de la Torre,J.R.;et al. Ammonia-oxidizing archaea possess a wide range of cellular ammonia affinities.The ISME Journal.2022,16,272–283. [CrossRef]
- Martín Giménez, V. M.; Modrego, J.; Gómez-Garre, D.; Manucha, W.; de las Heras, N. Gut Microbiota Dysbiosis in COVID-19: Modulation and Approaches for Prevention and Therapy. International Journal of Molecular Sciences 2023, 24, 12249. [Google Scholar] [CrossRef] [PubMed]
- Nirmalkar,K.;Qureshi,F.;Kang,D.K.;Hahn,J.;Adams,J.B.;Rosa,K.B.Shotgun Metagenomics Study Suggests Alteration in Sulfur Metabolism and Oxidative Stress in Children with Autism and Improvement after Microbiota Transfer Therapy.International Journal of Molecular Sciences.2022,23,13481. [CrossRef]
- Yang,Q.;Wei,Y.M.;Zhu,Y.H.;Guo,J.J.;Zhang,J.Y.;He,Y.J.;Li,X.;Liu,J.;Zhou.W.The Interaction between Gut Microbiota and Host Amino Acids Metabolism in Multiple Myeloma.Cancers.2023,15,1942. [CrossRef]
- Hsu,M.;Tun,K.M.;Batra,K.;Haque,L.;Vongsavath,T.;Hong,A.S.Safety and Efficacy of Fecal Microbiota Transplantation in Treatment of Inflammatory Bowel Disease in the Pediatric Population: A Systematic Review and Meta-Analysis.Microorganisms.2023,11,1272. [CrossRef]
- Wirth,U.;Jiang,T.;Schardey,J.;Kratz,K.;Li,M.M.;Schirren,M.;Kühn,F.;Bazhin,A.;Werner,J.;Guba,M.;et al.The Role of Microbiota in Liver Transplantation and Liver Transplantation-Related Biliary Complications.International Journal of Molecular Sciences.2023,24,4841. [CrossRef]
- Chen,Y.L.;Yao,Z.M.;Sun,Y.;Wang,E.Z.;Tian,C.J.;Sun,Y.;Liu,J.;Sun,C.Y.;Tian,L.Current Studies of the Effects of Drought Stress on Root Exudates and Rhizosphere Microbiomes of Crop Plant Species.International Journal of Molecular Sciences.2022,23,2374. [CrossRef]
- Enagbonma, B. J.; Fadiji, A. E.; Ayangbenro, A. S.; Babalola, O. O. Communication between Plants and Rhizosphere Microbiome: Exploring the Root Microbiome for Sustainable Agriculture. Microorganisms 2023, 11, 2003. [Google Scholar] [CrossRef] [PubMed]
- Bourak,K.;Sare,A.R.;Allaoui,A.;Jijakli,M.H.;Massart,S.Impact of Two Phosphorus Fertilizer Formulations on Wheat Physiology, Rhizosphere, and Rhizoplane Microbiota.International Journal of Molecular Sciences.2023,24,9879. [CrossRef]
- Campolino, M. L.; de Paula Lana, U. G.; Gomes, E. A.; Coelho, A. M.; de Sousa, S. M .Phosphate fertilization afects rhizosphere microbiome of maize and sorghum genotypes. Brazilian Journal of Microbiology.2022,53,1371–1383. [CrossRef]
- Lee, S. M.;Kong, H. G.; Song, G. C.; Ryu, C. M. . Disruption of Firmicutes and Actinobacteria abundance in tomato rhizosphere causes the incidence of bacterial wilt disease. The ISME journal.2021,15(1), 330-347. [CrossRef]
- Toyoda, A.; Shibata, Y.; Matsuo, Y.; Terada, K.; Sugimoto, H.; Higashi, K.; Mori,H.;Ikeuchi,A.;Ito,M.;Katahira, S. Diversity and compositional differences of the airborne microbiome in a biophilic indoor environment. Scientific Reports.2023,13(1), 8179. [CrossRef]
- Jiang, G.;Zhang, Y.; Gan, G.; Li, W.;Wan, W.; Jiang, Y.;Yang,T.J.;Zhang,Y.;Xu,Y.C.;Wang,Y.K.; et al. Exploring rhizo-microbiome transplants as a tool for protective plant-microbiome manipulation. ISME Commun .2022,2, e00094-8. [CrossRef]
- Deng, S.; Wipf, H. M. L.; Pierroz, G.; Raab, T. K.; Khanna, R.; Coleman-Derr, D. A plant growth-promoting microbial soil amendment dynamically alters the strawberry root bacterial microbiome. Scientific reports. 2019, 9(1), 17677. [Google Scholar] [CrossRef] [PubMed]
- Nelson, A. R.;Narrowe, A. B.; Rhoades, C. C.; Fegel, T. S.; Daly, R. A.; Roth, H. K.; Chu ,R.K.;Amundson,K.K.;Young ,R.B.;Steindorff,A.S.; et al. Wildfire-dependent changes in soil microbiome diversity and function. Nature microbiology. 2022,7(9), 1419-1430. [CrossRef]
- Bahram, M.;Espenberg, M.; Pärn, J.; Lehtovirta-Morley, L.; Anslan, S.; Kasak, K.; Kõljalg,U.; Liira,J.; Maddison,M.;Moora,M.;et al.Structure and function of the soil microbiome underlying N2O emissions from global wetlands. Nature Communications.2022,13(1), 1430. [CrossRef]
- Maier, B. A.; Kiefer, P.; Field, C. M.; Hemmerle, L.; Bortfeld-Miller, M.; Emmenegger, B.; Schäfer,M.; Pfeilmeier ,S.;Sunagawa,S.; Vogel,C.M.; et al. A general non-self response as part of plant immunity. Nature plants.2021, 7(5), 696-705. [CrossRef]
- Mendes, L.W.; Raaijmakers, J.M.; de Hollander, M.; Mendes, R.; Tsai, S.M. Influence of resistance breeding in common bean on rhizosphere microbiome composition and function. The ISME journal 2018, 12(1), 212–224. [Google Scholar] [CrossRef] [PubMed]
- Bruto, M.; Prigent-Combaret, C.; Muller, D.; Moënne-Loccoz, Y. Analysis of genes contributing to plant-beneficial functions in plant growth-promoting rhizobacteria and related Proteobacteria. Scientific reports. 2014, 4(1), 6261. [Google Scholar] [CrossRef] [PubMed]
- Das, S.; Bernasconi, E.; Koutsokera, A.; Wurlod, D. A.; Tripathi, V.; Bonilla-Rosso, G.; Aubert,J.; Derkenne, M.F.; Mercier,L.;Pattaroni,C.;et al.A prevalent and culturable microbiota links ecological balance to clinical stability of the human lung after transplantation. Nature communications.2021,12(1), 2126. [CrossRef]
Figure 1.
Effect of different extraction methods on the number of culturable bacteria. A. CFU value of soil bacterial suspension extracted from each extraction methods. Letters indicate by one-way ANOVA and Tukey’s HSD, the same letters indicated no significant difference, while different letters indicated significant difference (p < 0.0001). Different colors represent different treatment groups, rose red, blue, yellow and green represent CK, CF, UT1 and LT respectively. The scatter represents the sample data, bars represent mean ± SD. B. Colony phenotypes of soil bacteria culturable in each extraction methods. Eighteen repeats of each extraction methods. Groups are abbreviated as: control method, CK; Centrifugation method, CF; Sonication method, UT1; Oscillation method, LT.
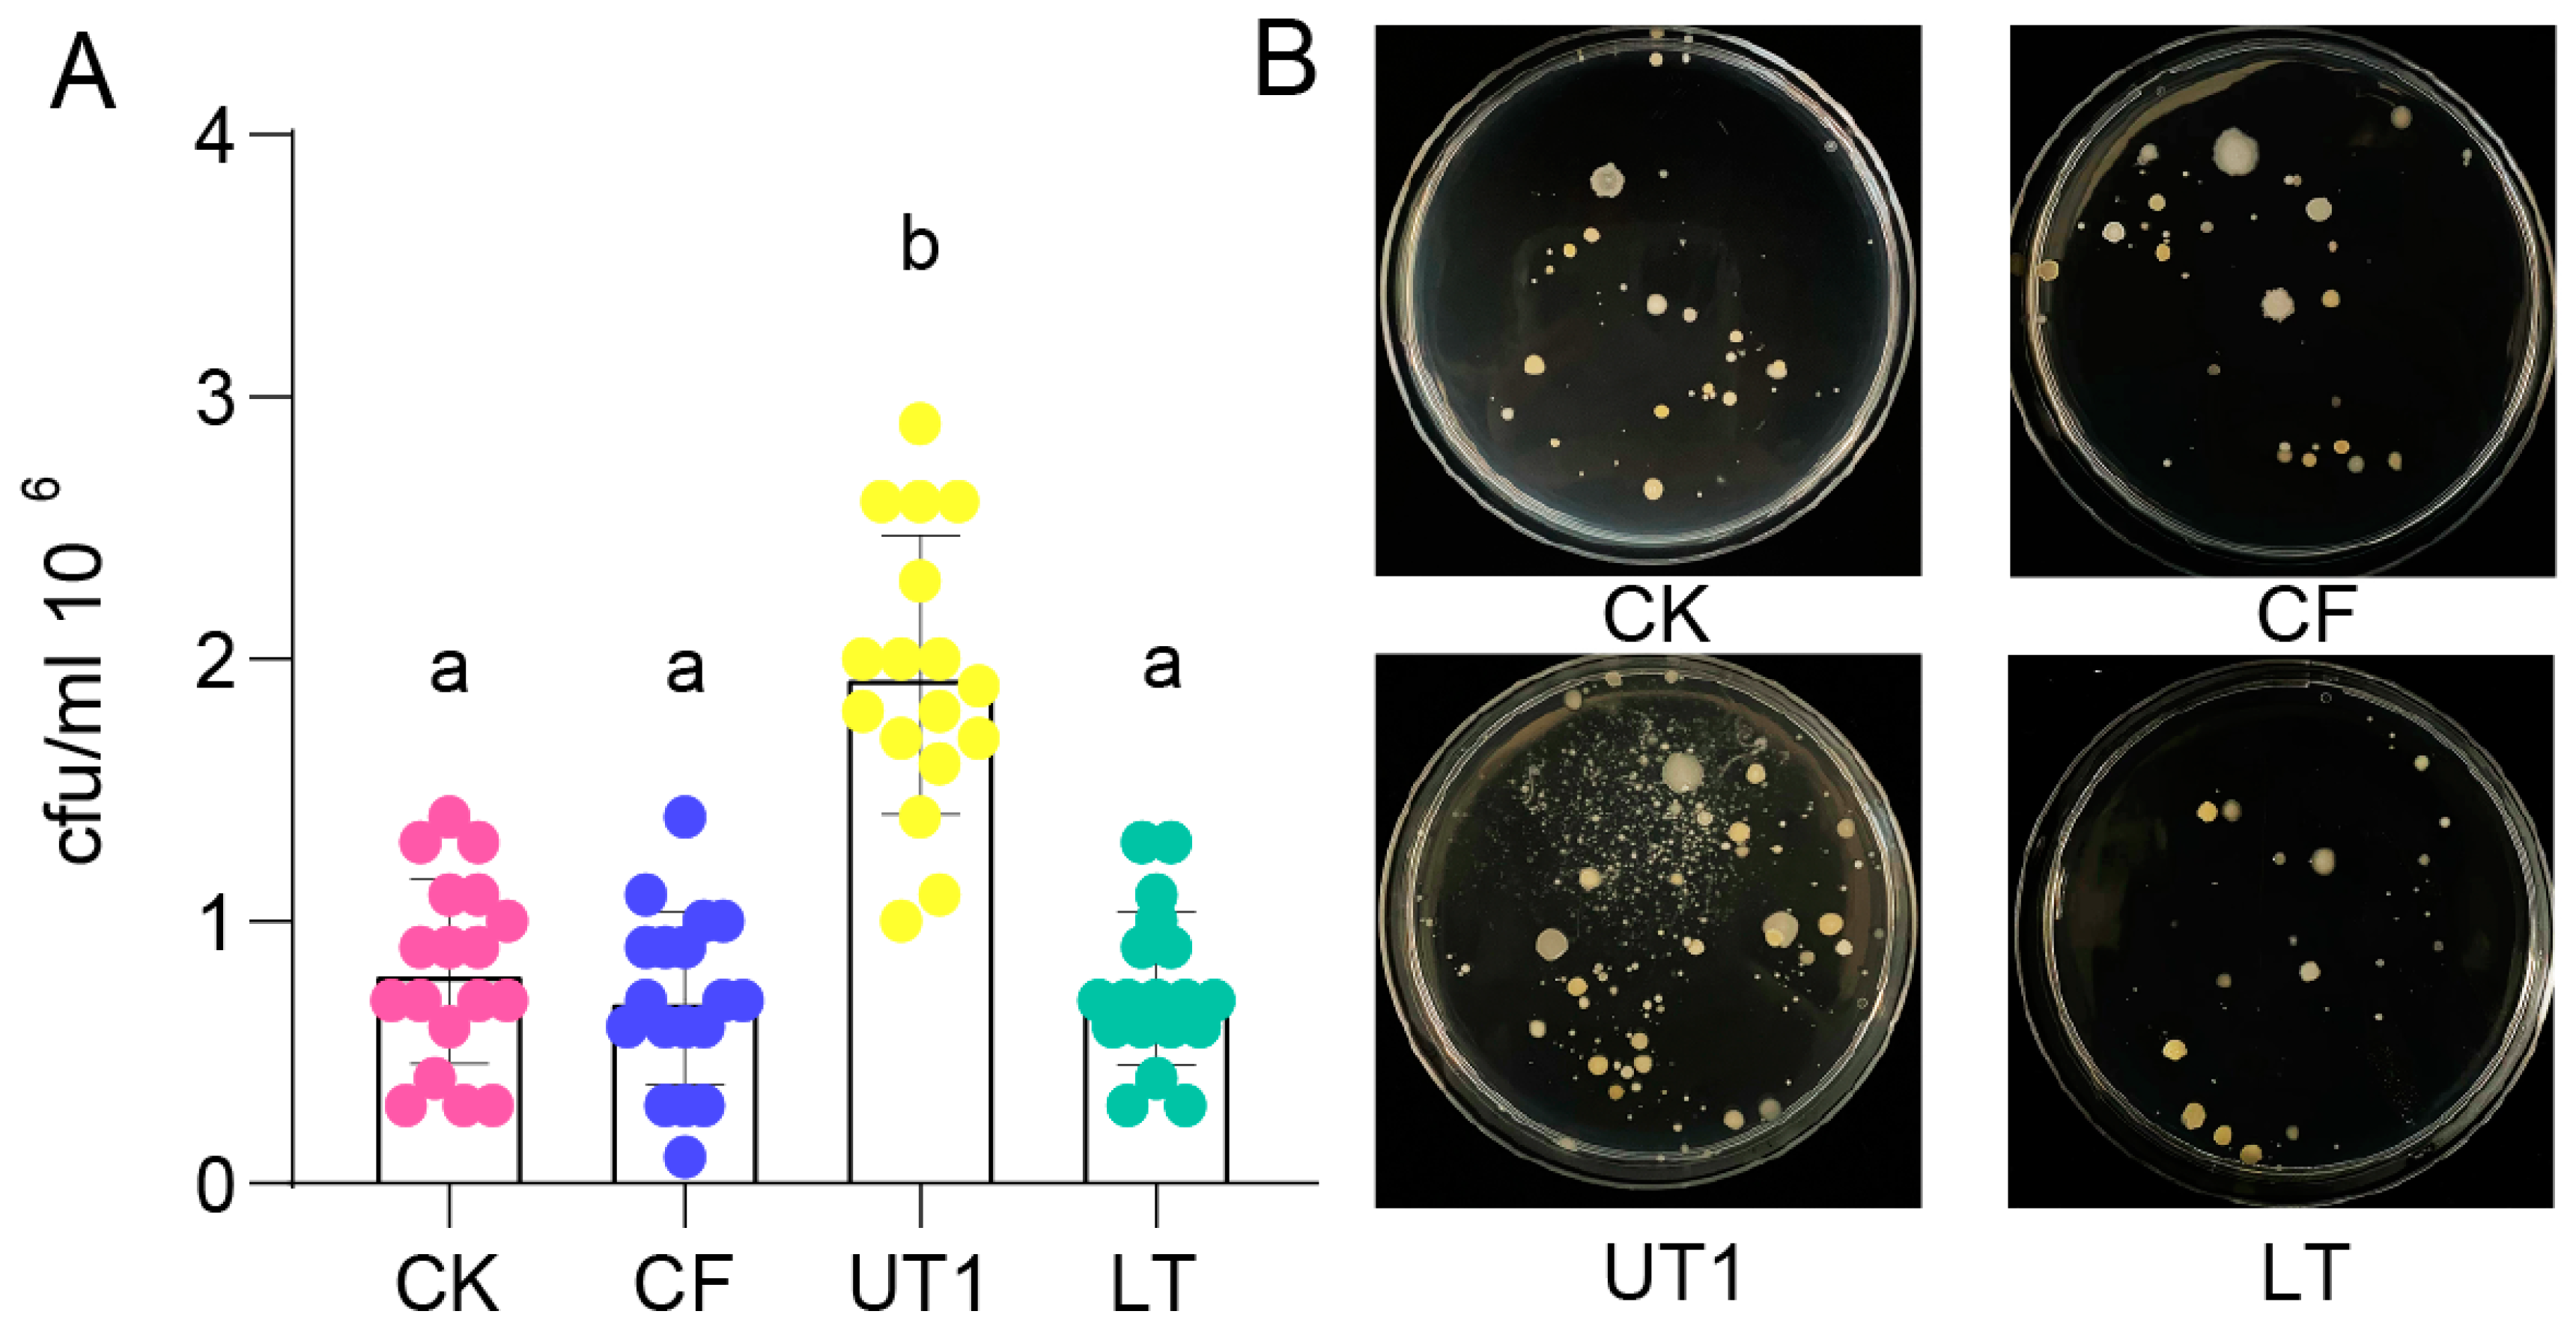
Figure 2.
Effects of different extraction factors on bacterial community diversity and composition. A. Relative abundance of bacterial communities extracted through CK, CF, UT1 and LT at the order level. B. Unconstrained PCoA based on Bray-Curtis distance showed bacterial community aggregation under different extraction method (p < 0.001, p value calculated by PERMANOVA). C. The extracted bacterial community of each method was compared to CK method in PCoA followed by PERMANOVA, and the effect size of the extracted method was plotted in increasing order. Differences analysis of top10 order among CK and CF extracted microbiota (D), CK and UT1 extracted microbiota (E), and CK and LT extracted microbiota (F). The histogram showed the difference of species abundance between the two groups. The dot and bar plot shows the percentage of species between the two groups in each sample. The difference in proportions between groups is shown with 95% confidence intervals. Only p < 0.05 (Welch’s t test), are shown and composition. Each method repeated three times. Abbreviations same as Figure 1.
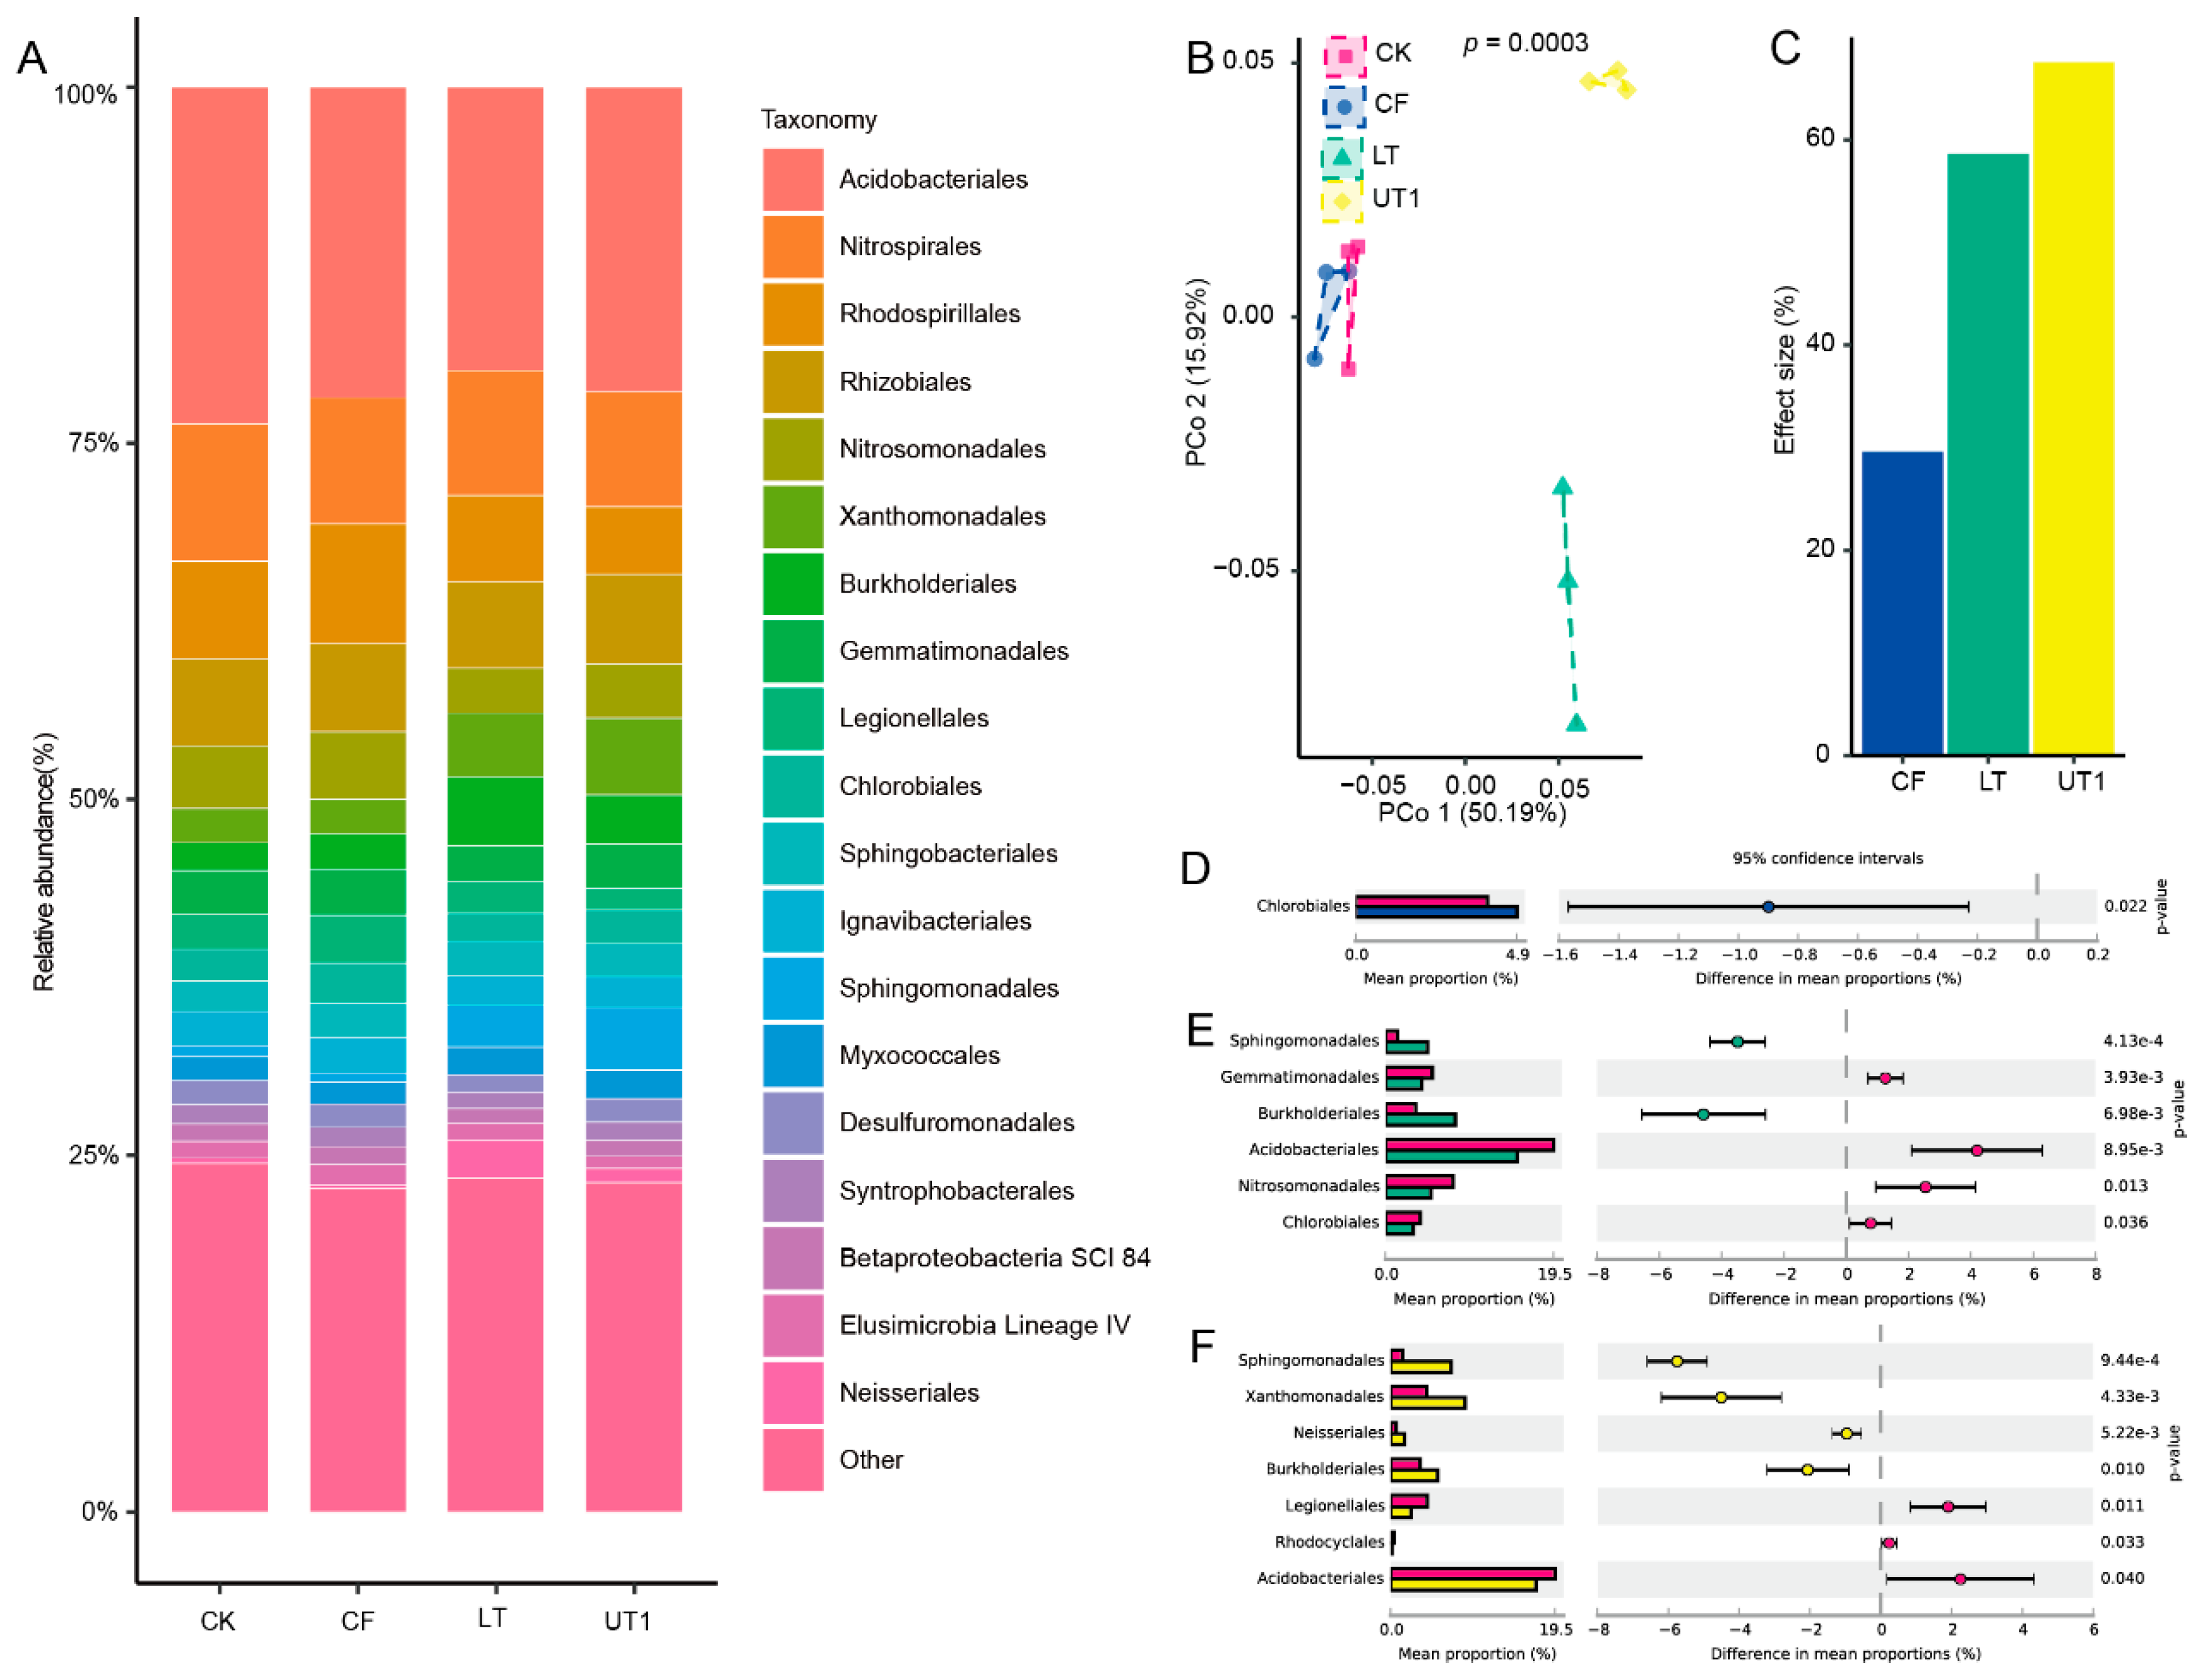
Figure 3.
Effects of sonication methods on bacterial culture. A. CFU value of soil bacterial suspension extracted from each treatment. Letters indicated by one-way ANOVA and Tukey’s HSD, the same letters indicated no significant difference, while different letters indicated significant difference (p < 0.0001). Different colors represent different treatment groups, yellow, dark green and pink represent UT1, UT2 and UT3 treatment respectively, the scatter represents the sample data, bars represent mean±SD. B. Colony phenotypes of soil bacteria culturable in each treatment. Eighteen repeats per extraction method. Groups are abbreviated as: Sonication method, UT1; Sonication method used new strategy, UT2; Increased sonication times of new strategy method, UT3.
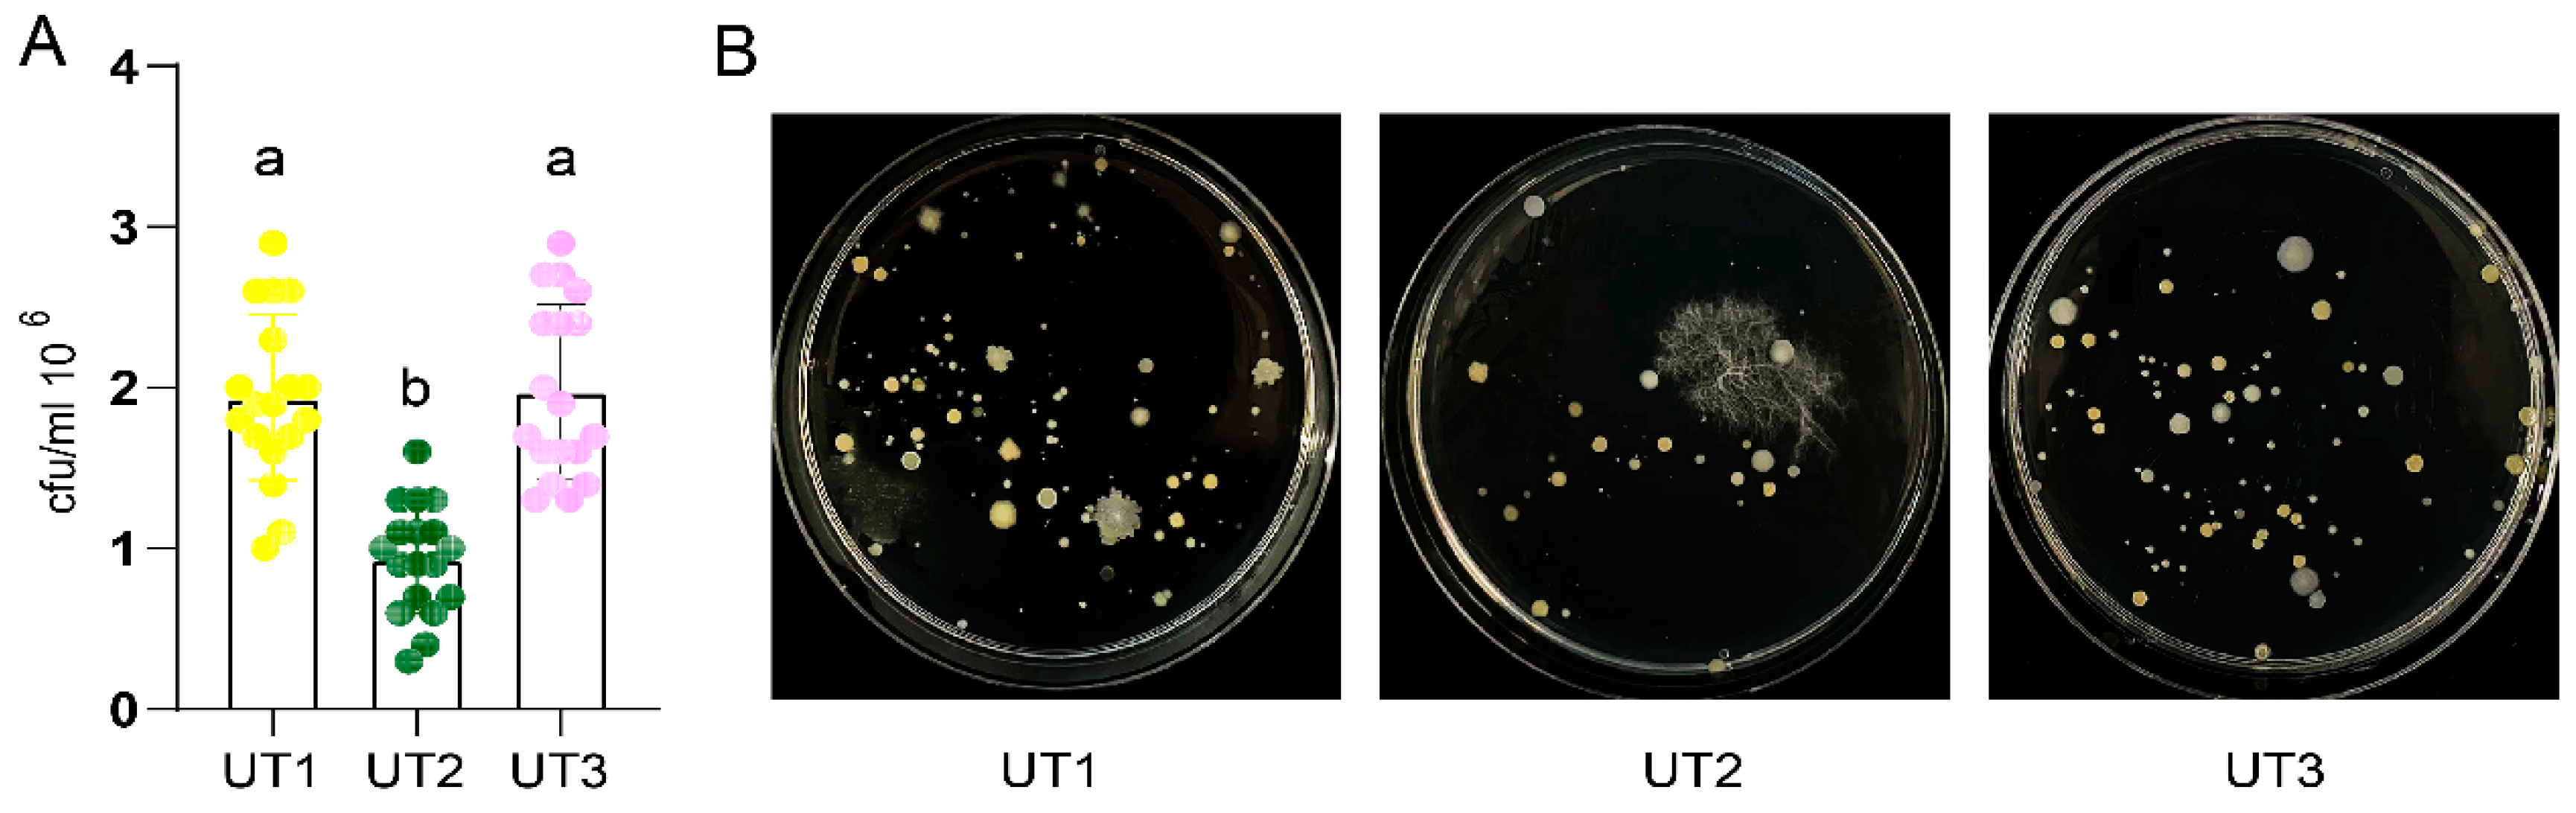
Figure 4.
Effects of sonication methods on bacterial community diversity and composition. A. Relative abundance of bacterial communities treated with UT1, UT2 and UT3 at the order level. B. Unconstrained PCoA based on Bray-Curtis distance showed bacterial community aggregation under different treatments (p < 0.001, p value calculated by PERMANOVA). C. The extracted bacterial community of each method was compared to UT2 method in PCoA followed by PERMANOVA, and the effect size of the extracted method was plotted in decreasing order. Differences analysis of top10 order among UT1 and UT2 extracted microbiota (D), and UT1 and UT3 extracted microbiota (E). The histogram showed the difference of species abundance between the two groups. The dot and bar plot shows the percentage of species between the two groups in each sample. The difference in proportions between groups is shown with 95% confidence intervals. Only p value < 0.05 (Welch’s t test), are shown and composition. Each method repeated three times. Abbreviations same as Figure 3.
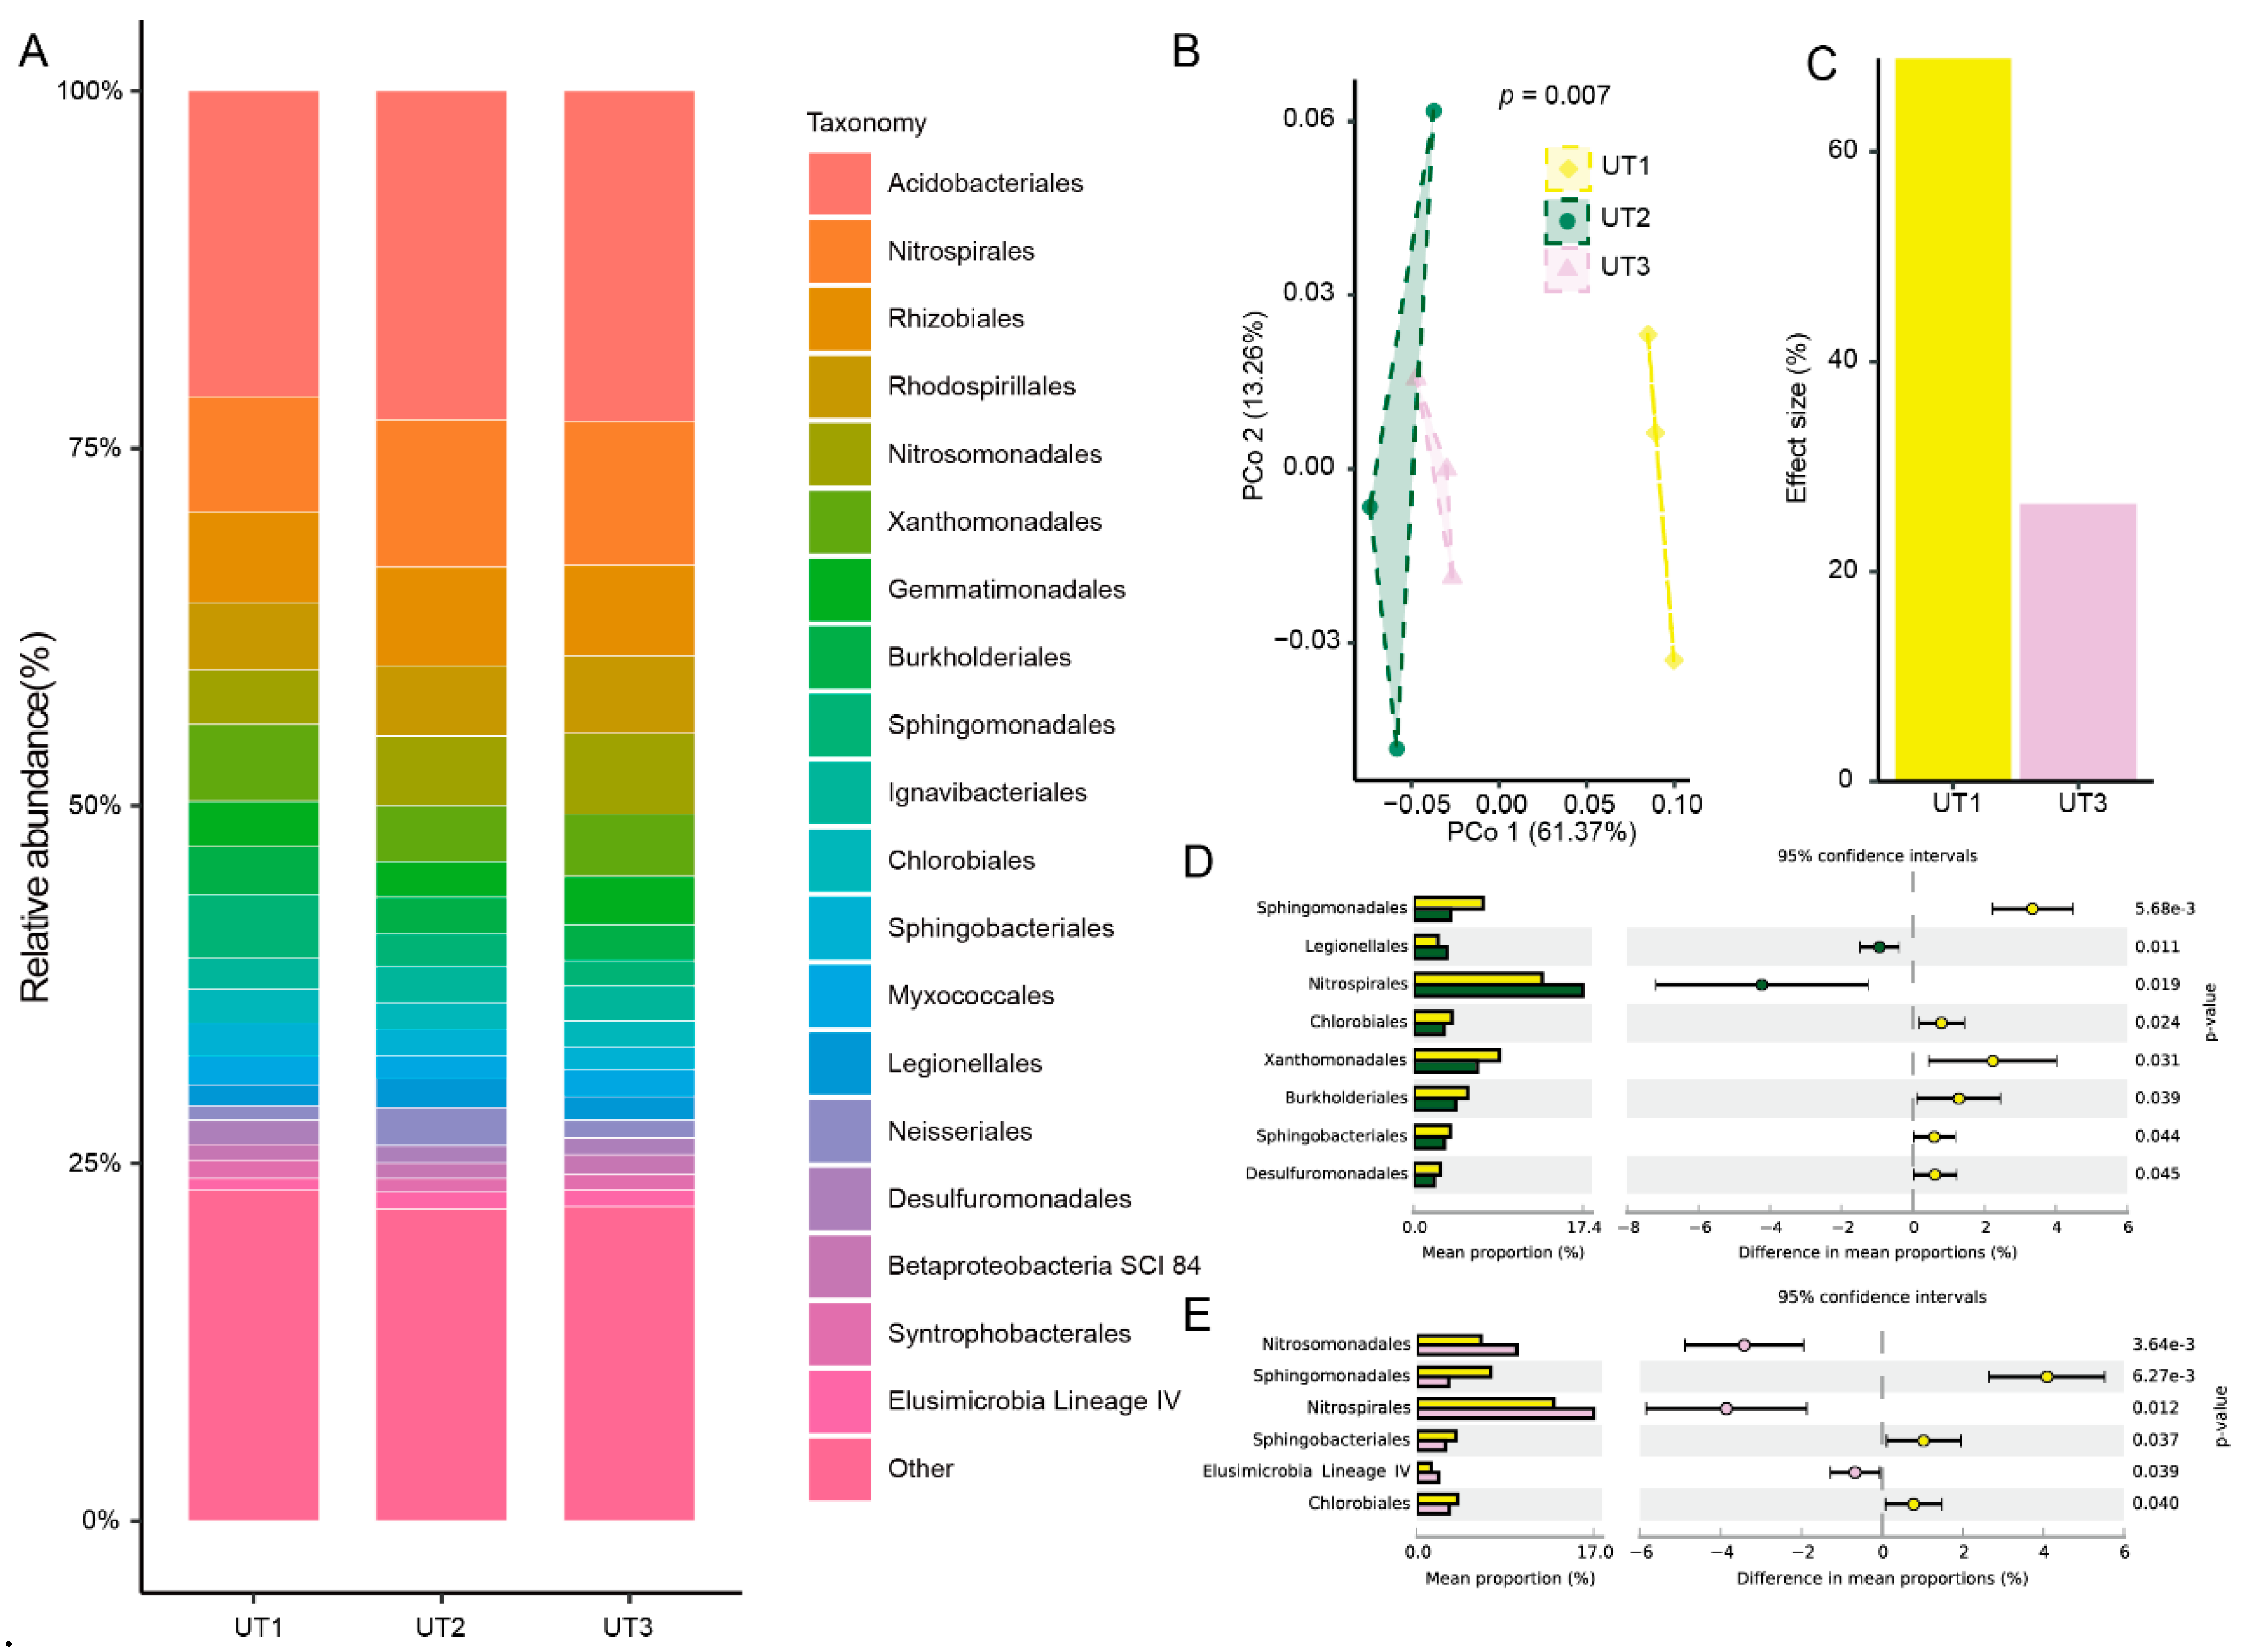
Figure 5.
Comparison of α diversity in different treatment bacterial communities. A. Shannon index of bacterial communities under different treatments. By one-way ANOVA compared with Tukey’s test, the same letters indicated no significant difference and different letters indicated significant difference (p < 0.001). B. Correlation analysis between processing time and Shannon index. The processing time of each extraction method was analyzed in increasing order (UT1 is the same as UT2). The dashed line represents a negative correlation between processing time and Shannon index (R=-0.707, p=0.0011). The scatter represents individual sample data, and the top and bottom of the box represent the 75th and 25th percentiles, respectively. The line in the box represents the median. The upper and lower must extend from the upper and lower edges of the box, respectively, to data within a range of no more than 1.5 quartiles. Abbreviations same as Figure 1 and Figure 2.
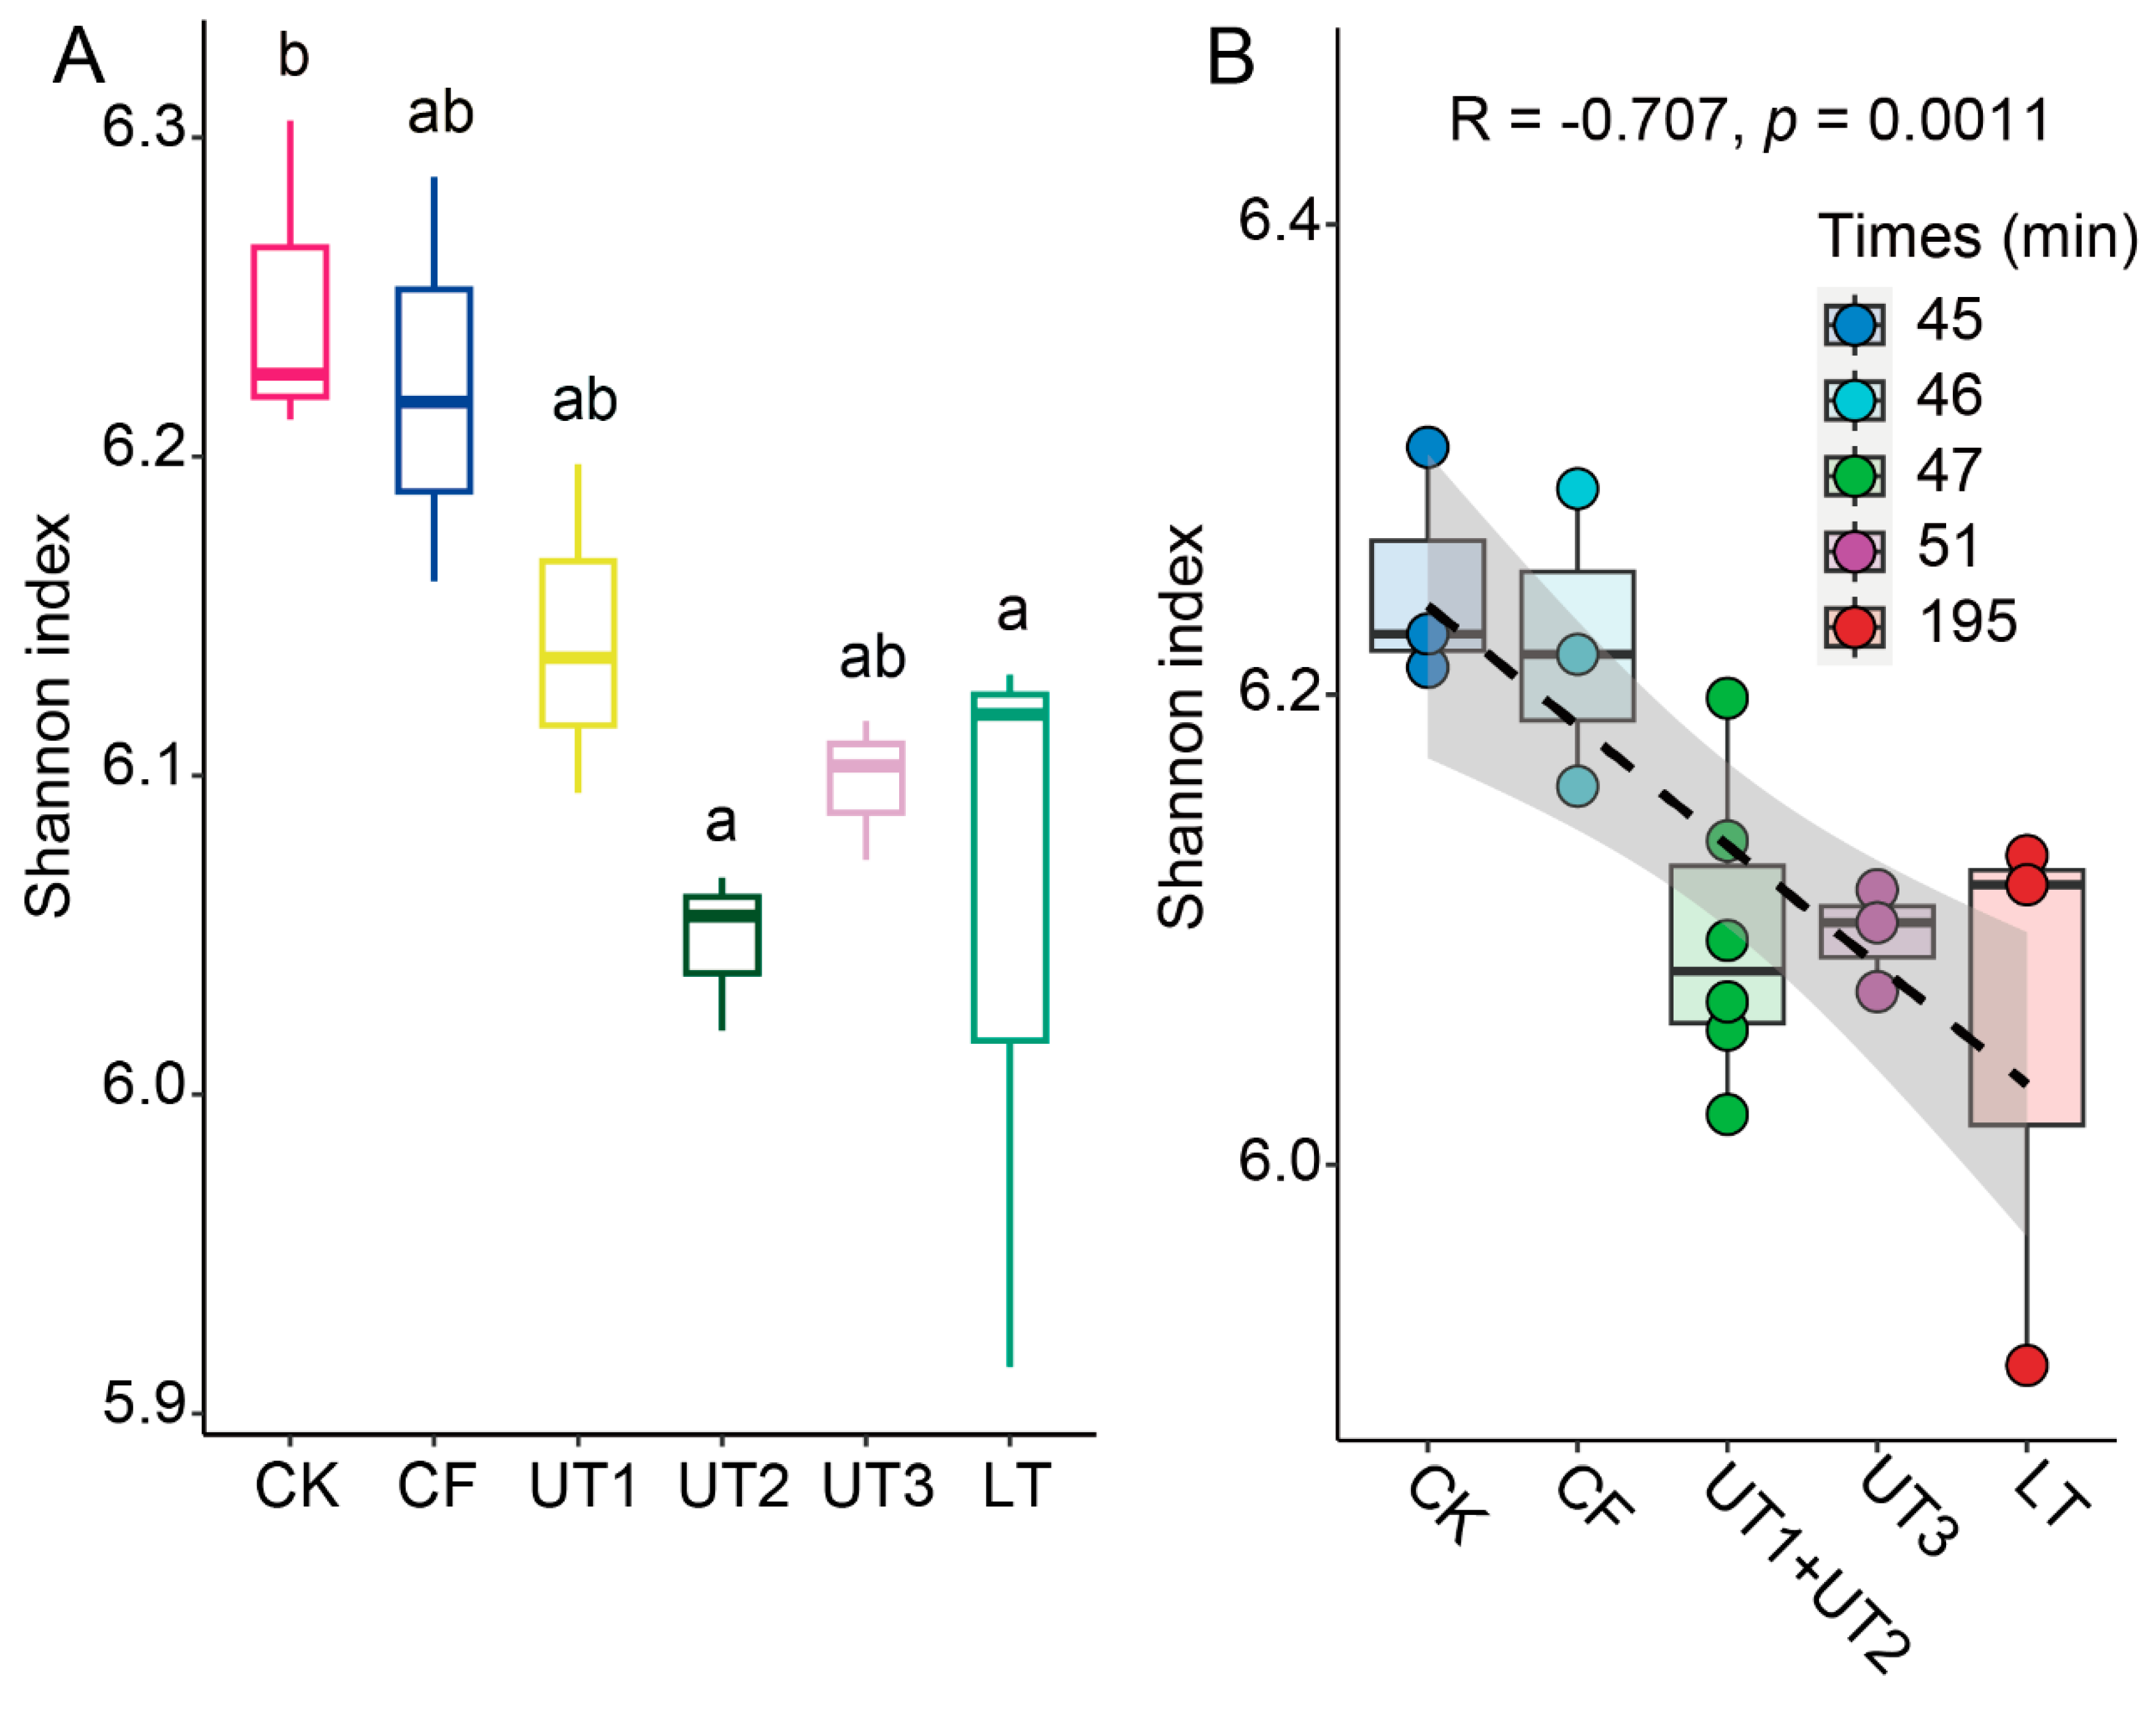

Table 1.
Factors of soil microbiota extraction methods.
| Method name | Oscillation (200 rpm) | Sonication (30kHz) | Centrifugation (600 rpm, 4 ℃) |
| CK | 30 min | - | - |
| CF | 30 min | - | 1 min |
| UT1 | 30 min | 2 min | - |
| LT | 180 min | - | - |
Disclaimer/Publisher’s Note: The statements, opinions and data contained in all publications are solely those of the individual author(s) and contributor(s) and not of MDPI and/or the editor(s). MDPI and/or the editor(s) disclaim responsibility for any injury to people or property resulting from any ideas, methods, instructions or products referred to in the content. |
© 2024 by the authors. Licensee MDPI, Basel, Switzerland. This article is an open access article distributed under the terms and conditions of the Creative Commons Attribution (CC BY) license (http://creativecommons.org/licenses/by/4.0/).
Copyright: This open access article is published under a Creative Commons CC BY 4.0 license, which permit the free download, distribution, and reuse, provided that the author and preprint are cited in any reuse.


