Submitted:
11 January 2024
Posted:
18 January 2024
You are already at the latest version
Abstract
Integrating sustainable processes and innovative waste utilization not only addresses environ-mental challenges but also aligns with evaluating energy sustainability and creating the circular waste management. This study presents a comparative analysis of liquid fuel production from waste tires and water hyacinth using two thermochemical methods: co-pyrolysis (direct method) and co-gasification integrated with the Fischer-Tropsch (FT) process (indirect method). The As-pen Plus simulation software version 9 is employed to develop models, determining optimal operating conditions for maximum liquid fuel, and assessing economic viability. Co-pyrolysis simulations reveal an increase in oil products and a decrease in gas products with higher blending weight ratios of waste tires/water hyacinth (W/B) and lower pyrolyser temperatures. Operating at 400°C with a blending weight ratio of 75:25 provided the maximum liquid fuel rate of 6649.22 gal/day. For co-gasification, optimal conditions (W/B = 50:50, T = 800°C, steam to feed ratio (S/F) = 1) result in the highest syngas yield of 115.92 kmol/h. Fischer-Tropsch simulations demonstrate an increase in gasoline and a decrease in diesel with rising reactor temperatures. At 230°C, the maximum liquid fuel rate reaches 8817.15 gal/day. The economic and production yield analysis indicates that the indirect method better than the direct method, providing higher liquid fuel yields and investment worthiness.
Keywords:
Liquid fuel
; Co-pyrolysis
; Co-gasification
; Fischer-Tropsch
; Economic analysis
1. Introduction
Current global energy consumption is increasing continuously due to the increasing global population and technological advances, which encourage the consumption of fossil fuels. While fossil fuels are declining, finite and contributing to global warming. The BP Statistical Review of World Energy 2021 provided that up to 83.1% of the world primary energy consumption in 2020 comes from fossil fuels [1]. Thus, biomass is perceived as a renewable energy source for liquid fuel production and can replace fossil fuels in the future.
Thermochemical process is one of the standard technologies to convert biomass feedstock into biofuel. Among various thermochemical techniques, pyrolysis and gasification are the most remarkable methods for liquid fuel production. Pyrolysis can directly convert biomass into biofuel in the absence of air or oxygen. This method is referred to as a direct method. This method can provide a maximum amount of liquid and a minimum amount of gas product. K. Nattawut et al. [2] reported that the bio-oils from fast pyrolysis of tobacco processing wastes provides good quality due to high carbon content, hydrogen content and high calorific value. Bio-oil mainly consists of alkanes and benzene derivatives that are valuable components for upgrading to liquid fuel. However, the obtained bio-oil should be treated before the intended application. High tar formation, a high cooling rate for the vapors, and a high amount of ash and char are contained in the liquids [3].
Liquid fuel production from the gasification integrated with the Fischer-Tropsch process is referred to the indirect method. Biomass is reacted with a gasifying agent to produce a synthesis gas consisting of hydrogen, carbon monoxide, carbon dioxide and methane). Then, the synthesis gas is further supplied to the Fischer-Tropsch process, which converts carbon monoxide and hydrogen into liquid fuels. Y.D. Kim et al. [4] reported that the syngas from the gasification process provides a high caloric value and optimal syngas composition for diesel production. After the syngas is purified, it is sent to the Fischer-Tropsch process to produce diesel. The obtained diesel has suitable chemical and physical properties that can be used as an alternative to commercial diesel. Although the indirect method of biomass can produce clean and environmentally friendly fuels, this method has several stages and is more complex than the direct method [5].
Feedstock type is one of the main factors affecting the quality and quantity of liquid fuel. Biomass is a low-value, limited-use and abundant agricultural residue that can be used as a feedstock. M. Saleem [6] investigated the possibility of utilizing agricultural biomass as a renewable and sustainable future energy source. This work reported that biomass can be used as a feedstock in biofuel production and probably replace fossil fuel resources. In addition, liquid fuel from biomass is more cost-effective and environmentally friendly than fossil fuels. The rapid diffusion of water hyacinths in various water sources creates ecological and economic problems. Water hyacinths have a large quantity that could be used as biomass due to the total calorific value is 14.46 MJ/kg, which is comparable to rice straw or rice husk [7]. In addition, water hyacinth is considered a suitable choice in this work for reducing waste and increasing raw material value. However, this biomass has many disadvantages such as high moisture and oxygen content, low calorific value and indefinite availability [8]. J. Alvarez et al. [9] reported that the bio-oil from co-feeding compared to the bio-oil from pure biomass provides higher carbon, lower oxygen, low water contents and high calorific value. Thus, the co-feeding of waste tires and biomass can reduce the disadvantages that come with pure biomass.
In the production of liquid fuels, the desired component of bio-oil not only depends on the operating conditions but also on the global market demand because the demand and supply of liquid fuels are the main factors in the production process. Thus, an economic analysis should be performed. This analysis uses the total capital investment, annual operating, and annual revenues cost as an indicator to investigate the feasibility of liquid fuel production from the two methods. However, this study aims to find the most efficient and cost-effective method for liquid fuel production. Although several studies have been published on liquid fuel production from co-feeding through the thermochemical process (direct and indirect method), studies comparing the two methods are still scarce. Thus, this research aims to compare liquid fuel production from co-feeding through direct and indirect methods. Waste tires and water hyacinths are feedstock in different blending weight ratios. In addition, the optimum operating conditions of each method are determined by the production yield of liquid fuel. Therefore, the direct method (pyrolysis) and indirect method (gasification integrated with the Fischer-Tropsch process) are simulated using the Aspen Plus version 9. To investigate the comparative analysis of the two methods, the production rate and economic analysis to find the best method for liquid fuel production are considered.
2. Materials and Experimental Methods
Waste tires and water hyacinth are prepared for determining the proximate and ultimate analysis because both feedstocks are nonconventional components and there is no information about the same in Aspen Plus Simulation software. Waste tires and water hyacinths were air-dried and crushed to a particle size distribution of 0.2-0.5 mm. After being baked in the oven at 70 °C for 24 h, the powders were sieved with a 0.5 mm mesh and kept in a container filled with silica gel to prevent moisture to be further used in the laboratory [10]. Thermogravimetric analyzer (TGA) and elemental analyzer were used to determine the proximate and ultimate analysis of feedstocks, following the American Society for Testing Materials (ASTM) Standard. The proximate and ultimate analysis results of waste tires and water hyacinths are shown in Table 1.
3. Methodology
3.1. Process Description
Figure 1 presents the model of the co-pyrolysis process designed through Aspen Plus Simulation software version 9. In this study, the feedstocks consist of waste tires and water hyacinth, which are fed into the process with different blending weight ratio of waste tires/water hyacinth (0:100, 25:75, 50:50, 75:25, and 100:0). Waste tires (TIRE stream) and water hyacinth (BIOMASS stream) are fed into the DECOM1 and DECOM2 with the difference ratio to decompose the chemical composition of feedstocks as nonconventional components to conventional components by using the information of the proximate and ultimate analysis, according to Table 1. Next, the chemical compositions of feedstocks (TIRE-I and BIOM-I streams) are preheated in HEATER1 and HEATER2 before sending into the pyrolyser (PYRO). In the pyrolyser, the thermal decomposition process of anaerobic organic compounds occurs and then, the products of solid and gas are generated. Solid is separated at the bottom of the pyrolyser while all gases are compressed (COMPRESS) and quenched to be liquid with a cooler (COOLER1) before sending those to the hydrotreating unit (HYDRO). Hydrogen (H2 stream) is added to the reactor to react with the oxygenated compounds. The products are composed of pyro-oil, water, and other gases. The product stream (HYDRO-O stream) is supplied to the heater (HEATER3), turbine (TURBINE), and cooler (COOLER2) to adjust to the conditions before sending those to the flash drum (FLASH1). The flash drum is used to separate pyro-oil and gases. OIL stream is sent into the decanter (DECANTER) to separate pyro-oil and water. Pyro-oil (OIL-PRO stream) is the desired product, while water (WATER-1 stream) is changed to steam by using a heater (HEATER4) before sending the steam to the methane reforming process. A part of gases (GASES stream), carbon dioxide and hydrogen sulfide are separated by the absorption unit (SEPCO2-1). PSA unit (SEPCH4) is used to separate methane from flue gas, in which flue gas is sent into the PSA unit (SEPH2-1) to separate hydrogen from flue gas. In this model, the steam methane reforming (SMR) process, in which the reaction of methane and steam occurs in the REFORMER, is proposed to produce hydrogen for the hydrotreating unit. The products obtained from the reforming process (REFORMAT stream) consisting of steam (H2O), hydrogen (H2), carbon dioxide (CO), carbon dioxide (CO2), methane (CH4), nitrogen (N2) and oil (i.e., C12H26, C14H30 and C10H22) are decreased in temperature through a cooler (COOLER3) before sending them into the flash drum (FLASH2), which is used here to separate water. The carbon dioxide is separated from the reformate using the absorption unit (SEPCO2-2) while CO and CH4 are removed using the PSA unit (SEPH2-2). Finally, the purified H2 (H2-RECO2 stream) is used for the hydrotreating unit.
Figure 2 presents the model of gasification and the Fischer-Tropsch process designed through Aspen Plus simulator version 9. Waste tires (TIRE stream) and water hyacinth (BIOMASS stream) with different blending weight ratio are delivered to the decomposition units (DECOM1 and DECOM2) and heater (HEATER1 and HEATER2) before being sent to the gasifier (GASIFIER). Steam (STEAM stream) as a gasifying agent is fed into GASIFIER, where there are many chemical reactions that occurred as listed in Table 2. When the chemical reactions are carried out, the products, including solid and gas, are provided. Solid products (CHAR+ASH stream) are separated by using cyclone (SEPCHAR) while gas products (DECHAR) are sent to the REACTH2S reactor, where all sulfur in the DECHAR stream is converted to hydrogen sulfide. The effluent stream (H2S-O stream) consisting of hydrogen, carbon monoxide, carbon dioxide, methane, steam, nitrogen, and hydrogen sulfide are sent to two absorption units: SEPH2S that separates hydrogen sulfide and SEPCO2 that removes carbon dioxide. Clean gas products (SEPCO2-1 stream) are fed into the cooler (COOLER1) and sent into the REACTNH3 reactor where all nitrogen in the SEPCO2-2 stream is converted to ammonia. The effluent stream (NH3-O stream) consisting of hydrogen, carbon monoxide, methane, steam, and ammonia are sent to the PSA unit (SEPNH3) to separate ammonia before sending them to the cooler (COOLER2). Moreover, water contaminated with gas products is removed using a flash drum (SEPWATER) and is recycled as the gasifying agent. The synthesis gas (FT-I stream) consisting of hydrogen and carbon monoxides is fed into the Fischer-Tropsch reactor (FT-REACT) to produce the fuel. The fuel products, composed of off-gas, gasoline, diesel, and wax, are separated by distillation columns (DISTIL1, DISTIL2, and DISTIL3).
3.2. Process Simulation
In this study, the investigations on liquid fuel production through co-pyrolysis and co-gasification integrated with FT process are performed by using Aspen Plus simulator version 9. The Peng-Robinson equation of state with Boston-Mathias (PR-BM) modifications are chosen to calculate the thermodynamic properties of the conventional components in this simulation model. To calculate the enthalpy and density of the nonconventional components, the property methods that include HCOALGEN and DCOALIGT are chosen. The reactor models in both methods consist of RYield, RGibbs and REquil. The selection of each rector model depended on the purpose of use and assumption. The RYield model is chosen to represent decomposition unit where the product yields for a given feed must be specified [11]. The gasifier is modelled by RGibbs model which can calculate the phase and chemical equilibrium of the reaction by minimizing the Gibbs free energy. This model is useful when temperature and pressure are known, and the reaction stoichiometry is unknown [12]. The REquil reactor model which represents hydrotreating unit can determine the product composition based on the equilibrium state of the occurred reactions when the temperature, pressure and reaction stoichiometry are known [13]. Lastly, the RYield reactor is chosen to model FT process where the reaction extent or conversion must be specified. This model is useful when the temperature and pressure are known, and the reaction kinetics are unknown.
The following assumptions are made to simulate the models of liquid fuel production.
- The total flow rate of feedstocks is 1000 kg/h and the gasifying agent (steam) is supplied to the process at 1 bar and 150 °C
- The model is operated at a steady state and isothermal condition.
- No heat and pressure losses occur in the reactor.
- Tar formation is not considered, and char is assumed to be ash.
- The obtained pyro-oil contains C12H26S, C15H33N, C14H12O2, and C10H12O4 only.
- All gases are real gases, the syngas including H2, CO, CO2, CH4, H2O, NH3, and H2S.
- H2/CO ratio is approximately 2 and calculated the yield of the FT products (C1 - C38) by the Anderson-Schulz-Flory (ASF) distribution.
FT process which is operated in a temperature range of 150 to 300 oC is used to convert syngas (CO and H2) into liquid fuel through various chemical reactions [14]. The production yield of the FT process can be estimated with the ASF distribution following Equations (9) and (10). The ASF distribution depends on the FT temperature and syngas composition (H2/CO ratio). The FT products are liquid fuel up to C38, assuming that the other production yield is water.
In this study, the effects of blending weight ratio and pyrolyser temperature on the product compositions are examined for the co-pyrolysis process. In the co-gasification integrated FT process, the effects of blending weight ratio (W/B), gasifier temperature (T), steam to feed (S/F) ratio, and the FT temperature on the product compositions are investigated. The ranges of operating conditions are listed in Table 3.
3.3. Economic Analysis
The capital investment, operating cost, and revenue cost were evaluated. All the costs were adjusted and reported for the 2021 cost year with the Chemical Engineering Plant Cost Index (CEPCI). The total capital investment cost can be determined according to the method in Table 4.
The financial value is based on the baseline data using the effect of capacity and time. Capacity affects the purchased equipment cost because of the different capacities of equipment, which follows Equation (11).
where cost0 is an initial cost, size0 an initial size or capacity of the unit, and n is a scaling factor, these adjust the new cost (costnew) at the new size or capacity of the unit from literature sources or Aspen Plus simulation software. Time affects the value of money due to global demand and supply change at any time. The CEPCI is the main factor used to adjust the costs at different points in time as shown by the following Equation (12).
where Costbase is the cost in a base year and costselect is the cost in a selected year, CEPCIbase denotes the index value for a base year and CEPCIselect denotes the index value for a selected year [16]. This study references the purchased equipment cost with capacities close to those determined in the process model as shown in Table 5.
The selling price of the annual costs can be estimated from the literature sources. Although the global demand and supply affect the selling price, this study uses the information in Table 6 to estimate the annual costs in the reference year.
4. Results and Discussion
4.1. Model Validation
To ensure that the proposed model can predict realistic results, gases, oils, and other products obtained from both models are compared with the experimental data extracted from the literature. In case of co-pyrolysis model, the simulated results are compared with the experimental data of D. Pradhan et al. [41]. Their experiment used mahua seed and waste thermocol as a feedstock in which the proximate and ultimate analysis results are listed in Table 7. In their work, the co-pyrolysis process operated at 550 °C and 1 bar with the blending weight ratio 1:1. The experimental results showed that the products are composed of gases, oil, char and aqueous liquid. Under the same feed-stock and operating conditions, the model validation, as shown in Table 8, indicates that the simulated results agree with the experimental data. The root means square error (RMS) is 11.90, which is an acceptable value for this study. The gas products obtained from the model have more proportion than the experimental data while the oil, char and aqueous liquid products obtained from the model have less proportion than one. The deviation between simulation and experiment can be explained by two reasons: (1) The model uses simplified assumptions about the reaction mechanism which may not reflect the complex reality of the reaction. The product obtained from the simulation is calculated by minimizing the Gibbs free energy. These gas products have lower Gibbs free energy compared to oil, char, and aqueous liquid products. This means that they are more stable and energetically favorable to form during the reaction and (2) this model does not consider the effect of the catalyst to specify the desired products. Although the validation results deviate, this model is acceptable.
Next, the simulated results obtained from the gasification model are compared with the experimental data of W. Doherty et al. [42]. Feedstock used in their experiment was wood chips in which proximate and ultimate analysis are listed in Table 7. In their work, the gasification process operated at 850 °C and 1 bar with the mass flow rate of biomass and a S/F ratio as 1508.64 kg/h and 0.75, respectively. The conditions of steam were at 450°C and 1 bar. The experimental results showed that the products are composed of gases (H2, CH4, CO, and CO2), char, and others (H2S, NH3, and H2O). The comparison of product gas composition between simulation results and experimental data under the same feedstock and operating conditions are shown in Table 9. It is found that the simulation results show similar trends with the experimental data. RMS is 9.26, which is an acceptable value for this study. However, it can be observed that higher hydrogen, lower carbon dioxide, and methane concentrations can be provided compared with the experimental data. The deviation between simulation and experiment can be explained by two reasons: (1) the calculation of the product gas composition based on the equilibrium which neglects the effect of a catalyst and (2) tar formation is not considered in this study.
4.2. Liquid Fuel Production from the Co-Pyrolysis Process
Figure 3a represents the effect of the blending weight ratio on the product compositions when the pyrolyser temperature is fixed at 600°C. In this study, the blending weight ratio of feedstocks (W/B) varied as 0:100, 25:75, 50:50, and 75:25, respectively. The simulation results show that gas product is lower while oil product is higher with increasing blending weight ratio (waste tires increases while water hyacinth decreases). According to the ultimate analysis, the waste tires have carbon as the main component whereas water hyacinth has oxygen as a main component and both feedstocks have similar amounts of hydrogen. It should be noted that the oil product consists of mainly hydrocarbon (hydrogen and carbon) content whereas the gas product is mainly composed of carbon dioxide which is referred to the oxygenated compound. Therefore, when the ratio of waste tires increases, carbon and hydrogen can easily combine to form hydrocarbon compounds in the oil products. On the other hand, when the ratio of water hyacinth increases, oxygen can easily combine with other components to form the oxygenated compound in the gas products. However, there is no result reported in Figure 3a at the blending weight ratio of 100:0. It can be implied that the use of feedstock as pure waste tires (no water hyacinth) cannot generate oil products consisting of C10H12O4. This is because the small amount of oxygen in waste tires is not sufficient to form the oxygenated compound in oil products.
Figure 3b presents the effect of pyrolyser temperature varying between 400°C and 800°C on the product at the blending weight ratio of 75:25. The simulation results show that increasing pyrolyser temperature can slightly increase the gas products whereas the oil products may slightly decrease. When the pyrolyser temperature is higher, the larger hydrocarbon chains will be cracked into the smaller ones, according to the study conducted by H.Y. Ismail et al [43]. At the pyrolyser temperature of 400 °C, the desired product (oil yield) has the largest quantity and the undesired product (gas yield) has the smallest amount. Therefore, the pyrolyser temperature of 400 °C is the most suitable for the pyrolysis process.
4.3. Liquid Fuel Production through the Co-Gasification Integrated with Fischer-Tropsch Process
Figure 4a presents the effect of blending weight ratio on the product gas compositions at the gasifier temperature of 800 °C and S/F ratio of 1. It is found that the concentrations of H2 little change at the beginning and decrease after that when the blending weight ratio increases. The concentrations of CO2 decrease while the concentrations of CO and CH4 increase when the blending weight ratio increases. At higher blending weight ratios of solid waste, adding solid waste to the feedstock can increase the production of H2 and CO in the syngas due to the high volatile matter content of solid waste. In addition, it also increases the reactivity of the feedstock, leading to a higher conversion of carbon to syngas. As a result, the CH4 concentration in the syngas may increase. However, at high blending weight ratios of biomass, the higher oxygen content of biomass promotes the oxidation of syngas due to the presence of oxygen-containing functional groups in the biomass. As a result, H2 and CO2 concentrations may decrease due to loss of oxidation whereas the CO2 content in the syngas may increase. In this study, the target of H2/CO ratio is around 2 to further use in the FT process according to Y.D. Kim et al. [4]. The results reveal that the H2/CO ratio as 3.32, 2.44, 1.93, 1.60, and 1.28 can be provided when the blending weight ratio is 0:100, 25:75, 50:50, 75:25, and 100:0, respectively. Although the blending weight ratio at 75:25 provides a higher CO content than the blending weight ratio at 50:50, the H2/CO ratio close to 2 can be provided when the blending ratio is 50:50. Therefore, the blending weight ratio of 50:50 is suitable for liquid fuel production through co-gasification integrated with the FT process.
Figure 4b presents the effect of gasifier temperature, varying between 500 and 1000 °C, on the product gas compositions at the blending weight ratio of 50:50 and S/F ratio of 1. It can be observed that the concentrations of CO2 and CH4 decrease whereas the concentrations of H2 and CO increase with increasing temperature. This is because the Bouduard and water gas reactions as endothermic reactions favor high gasifier temperature operation and thus, the forward reaction can occur. On the other hand, the methanation reaction as the exothermic reaction is shifted to the reactant side when the gasifier temperature increases. In addition, increasing gasifier temperature causes the reverse water gas shift (WGS) reaction, leading to a decrease in the concentration of CO2. The drop in CH4 concentration is caused by the consumption in the steam methane reforming (SMR) reaction. From the simulation results, the gasifier temperature of 800°C is suitable for the gasification process because the H2/CO ratio is mostly close to 2 and provides the high concentration of H2 and CO for the following FT process.
Figure 4c shows the influence of S/F ratio, varying between 0.8 and 1.2, on the product gas compositions at the blending weight ratio of 50:50 and the gasifier temperature of 800 °C. It can be observed that increasing S/F ratio leads to an increase in the H2 and CO2 concentrations and a decrease in CO and CH4 concentrations. Adding steam into the process will support the water gas and SMR reactions and this results in the increase of H2 and CO concentrations while the CH4 concentration decreases due to the SMR reaction. However, the CO concentration decreases with an increase in the S/F ratio because the WGS reaction will occur continuously and leads to H2 and CO2 concentrations being increased. The simulation results indicate that S/F ratio of 1 is suitable for the gasification because it can provide the suitable H2/CO ratio and product yield for the FT process.
Figure 5 represents the impact of FT reactor temperature, varying between 200 and 250 °C, on the production rate of FT products at the reactor pressure of 1 bar and H2/CO ratio of 2. From the simulation results, it is found that the production rate of off-gas and gasoline increases with increasing temperature, whereas the production rate of diesel and wax decreases. Increasing FT temperature causes the decomposition of larger hydrocarbon chains into smaller ones but increases the lower hydrocarbon chains. In addition, the product rate of the FT process was estimated with the ASF distribution that depends on the FT temperature and syngas composition (H2/CO ratio). The simulation results show that the production rate of liquid fuel (gasoline and diesel) as 549.15, 704.17, 789.90, 819.04, 807.62, and 769.67 kg/h can be obtained when FT is operated at 200, 210, 220, 230, 240 and 250°C, respectively. Therefore, the FT reactor temperature at 230 °C is suitable for the FT process as it provides the highest production rate of liquid fuel.
4.4. Economic Analysis
To evaluate the worthiness of the liquid fuels production from the co-pyrolysis and co-gasification integrated with the Fischer-Tropsch process, an economics analysis is performed to estimate the total capital investment, annual operating cost, and the annual revenues of both methods. Figure 6a presents the financial value of the liquid fuel production obtained from the co-pyrolysis and co-gasification integrated with the Fischer-Tropsch process in the present year. The results reveal that the total capital investment of the co-pyrolysis and co-gasification integrated with the FT process are 25.01 and 20.49 million U.S. dollars, respectively. Annual operating costs are 2.98 and 1.98 million U.S. dollars/year, respectively. Annual revenues are 8.04 and 13.86 million U.S. dollars/year for co-pyrolysis and co-gasification, respectively. From the results, it can be concluded that the annual operating cost and total capital investment of the co-pyrolysis process has higher than that of co-gasification integrated with the FT process. This is because the co-pyrolysis process requires a hydrotreating process where hydrogen reacts with the oxygenated compounds to produce liquid fuel and thus, the use of hydrogen as expensive reactant in the process causes higher cost. To reduce the cost of the co-pyrolysis process in the long term, the steam methane reforming process should be installed to produce hydrogen for usage in the plant.
Figure 6b presents the production rate of the liquid fuel production obtained from the co-pyrolysis and co-gasification integrated with the FT process. The results indicate that gasoline is produced at around 5063.62 gal/day from the co-gasification integrated with the FT process and as it operates at high-temperature conditions, the larger hydrocarbon chain (diesel) is decomposed into the smaller ones (gasoline). The biodiesel occurs in both methods, the co-pyrolysis process provides a higher production rate of biodiesel (6649.22 gal/day) than the co-gasification integrated with the FT process (3753.54 gal/day). Because the co-gasification integrated with the FT process operates at higher temperature conditions than the co-pyrolysis process, the larger hydrocarbon chains are possibly decomposed into the smaller ones more than in the co-pyrolysis process. However, the co-gasification integrated with the FT process has a higher production rate of liquid fuel than the co-pyrolysis process.
5. Conclusions
This study conducts a comparative analysis of liquid fuel production from waste tires and water hyacinth, employing two methods: co-pyrolysis and co-gasification integrated with the Fischer-Tropsch process. Utilizing Aspen Plus simulation software version 9, the model is developed to determine optimal operating conditions for liquid fuel production, considering production yield and economics. The syngas compositions and pyrolysis products are calculated by minimizing Gibbs free energy, and Fischer-Tropsch products are determined using the ASF distribution.
Co-pyrolysis simulations indicate that oil products increase while gas products decrease with higher blending weight ratios and lower pyrolyser temperatures. Operating at 400 °C with a 75:25 blending weight ratio yields the maximum liquid fuel rate of 6649.22 gal/day. For co-gasification, the simulation results reveal that, in the co-gasification process, a decrease in blending weight ratio correlates with an increase in hydrogen concentration, accompanied by elevated gasifier temperature and S/F ratio. Conversely, an increase in both blending weight ratio and gasifier temperature corresponds to higher carbon monoxide concentration, while the S/F ratio decreases. Optimal conditions (blending weight ratio 50:50, 800 °C, S/F ratio 1) result in the maximum syngas yield of 115.92 kmol/h and the H2/CO ratio of approximately 2 is considered for the subsequent Fischer-Tropsch process. In the Fischer-Tropsch process, gasoline increases while diesel decreases with rising reactor temperatures, reaching the maximum liquid fuel rate of 8817.15 gal/day at 230 °C.
The comparative analysis of economics and production yield reveals that the indirect method outperforms the direct method in terms of higher liquid fuel yield and investment worthiness. However, the choice between the methods is contingent on external factors, which are not explored in this study.
Acknowledgements
This work was financially supported by King Mongkut’s Institute of Technology Ladkrabang (Grant No. 2567-02-01-002). Y. Patcharavorachot would also thank the financial support provided by National Research Council of Thailand (NRCT) (Grant No. NRCT5-RSA63024-02).
Nomenclature
| ASF | Anderson-Schulz-Flory Distribution |
| ASTM | American Society for Testing Materials |
| CEPCI | Chemical Engineering Plant Cost Index |
| FT | Fischer-Tropsch Process |
| H2/CO | Hydrogen to Carbon Dioxide Ratio |
| MEA | Monoethanolamine Absorption |
| PR-BM | Peng-Robinson Equation of State with Boston-Mathias |
| PSA | Pressure Swing Adsorption |
| RMS | Root Means Square Error |
| SMR | Steam Methane Reforming |
| S/F | Steam to Feed Ratio |
| T | Gasifier Temperature |
| TGA | Thermogravimetric Analysis |
| WGS | Water Gas Shift Reaction |
| W/B | Waste Tires to Water Hyacinth Ratio |
References
- bp, “Statistical Review of World Energy 2021, 2021. Available online: https://www.bp.com/content/dam/bp/business-sites/en/global/corporate/pdfs/energy-economics/statistical-review/bp-stats-review-2021-full-report.pdf (accessed on 1 March 2022).
- N. Khuenkaeo, S. Phromphithak, T. Onsree, S. R. Naqvi, and N. Tippayawong, “Production and characterization of bio-oils from fast pyrolysis of tobacco processing wastes in an ablative reactor under vacuum,” PLoS One, vol. 16, no. 7 July, Jul. 2021. [CrossRef]
- M. J. Kabir, A. A. Chowdhury, and M. G. Rasul, “Pyrolysis of municipal green waste: A modelling, simulation and experimental analysis,” Energies (Basel), vol. 8, no. 8, pp. 7522–7541, Aug. 2015. [CrossRef]
- Y. D. Kim et al., “Fischer–tropsch diesel production and evaluation as alternative automotive fuel in pilot-scale integrated biomass-to-liquid process,” Appl Energy, vol. 180, pp. 301–312, Oct. 2016. [CrossRef]
- J. Hu, F. Yu, and Y. Lu, “Application of fischer-tropsch synthesis in biomass to liquid conversion,” Catalysts, vol. 2, no. 2, pp. 303–326, Jun. 2012. [CrossRef]
- M. Saleem, “Possibility of utilizing agriculture biomass as a renewable and sustainable future energy source,” Heliyon, vol. 8, no. 2, Feb. 2022. [CrossRef]
- S. Sukarni, Y. Zakaria, S. Sumarli, R. Wulandari, A. Ayu Permanasari, and M. Suhermanto, “Physical and Chemical Properties of Water Hyacinth (Eichhornia crassipes) as a Sustainable Biofuel Feedstock,” IOP Conf Ser Mater Sci Eng, vol. 515, no. 1, 2019. [CrossRef]
- S. Sukarni, Y. Zakaria, S. Sumarli, R. Wulandari, A. Ayu Permanasari, and M. Suhermanto, “Physical and Chemical Properties of Water Hyacinth (Eichhornia crassipes) as a Sustainable Biofuel Feedstock,” in IOP Conference Series: Materials Science and Engineering, Institute of Physics Publishing, 2019. [CrossRef]
- J. Alvarez, M. Amutio, G. Lopez, L. Santamaria, J. Bilbao, and M. Olazar, “Improving bio-oil properties through the fast co-pyrolysis of lignocellulosic biomass and waste tyres,” Waste Management, vol. 85, pp. 385–395, Feb. 2019. [CrossRef]
- J. Wannapeera, N. Worasuwannarak, and S. Pipatmanomai, “Product yields and characteristics of rice husk, rice straw and corncob during fast pyrolysis in a drop-tube/fixed-bed reactor.”. 1 March. Available online: http://www.sjst.psu.ac.th (accessed on 1 March 2023).
- J. F. Peters, S. W. Banks, A. v. Bridgwater, and J. Dufour, “A kinetic reaction model for biomass pyrolysis processes in Aspen Plus,” Appl Energy, vol. 188, pp. 595–603, 2017. [CrossRef]
- L. P. R. Pala, Q. Wang, G. Kolb, and V. Hessel, “Steam gasification of biomass with subsequent syngas adjustment using shift reaction for syngas production: An Aspen Plus model,” Renew Energy, vol. 101, pp. 484–492, Feb. 2017. [CrossRef]
- K. Atsonios, K. D. Panopoulos, N. Nikolopoulos, A. A. Lappas, and E. Kakaras, “Integration of hydroprocessing modeling of bio-liquids into flowsheeting design tools for biofuels production,” Fuel Processing Technology, vol. 171, pp. 148–161, Mar. 2018. [CrossRef]
- R. Rauch, A. Kiennemann, and A. Sauciuc, “Fischer-Tropsch Synthesis to Biofuels (BtL Process),” in The Role of Catalysis for the Sustainable Production of Bio-Fuels and Bio-Chemicals, Elsevier Inc., 2013, pp. 397–443. [CrossRef]
- M. Marchese, S. Chesta, M. Santarelli, and A. Lanzini, “Techno-economic feasibility of a biomass-to-X plant: Fischer-Tropsch wax synthesis from digestate gasification,” Energy, vol. 228, Aug. 2021. [CrossRef]
- R. M. Swanson, A. Platon, J. A. Satrio, and R. C. Brown, “Techno-economic analysis of biomass-to-liquids production based on gasification,” Fuel, vol. 89, no. SUPPL. 1, Nov. 2010. [CrossRef]
- F. Trippe, M. Fröhling, F. Schultmann, R. Stahl, and E. Henrich, “Techno-economic assessment of gasification as a process step within biomass-to-liquid (BtL) fuel and chemicals production,” Fuel Processing Technology, vol. 92, no. 11, pp. 2169–2184, Nov. 2011. [CrossRef]
- “Industrial Cyclone,” For Shot Blasting Dust, 2021. Available online: https://www.indiamart.com/proddetail/industrial-cyclone-3548704733.html (accessed on 12 April 2022).
- R. D. Ashby, A. J. McAloon, D. K. Y. Solaiman, W. C. Yee, and M. Reed, “A process model for approximating the production costs of the fermentative synthesis of sophorolipids,” J Surfactants Deterg, vol. 16, no. 5, pp. 683–691, Sep. 2013. [CrossRef]
- H. P. Loh, J. Lyons, and C. W. White, “Process Equipment Cost Estimation Final Report,” 2002.
- G. Herz, E. Reichelt, and M. Jahn, “Design and evaluation of a Fischer-Tropsch process for the production of waxes from biogas,” Energy, vol. 132, pp. 370–381, 2017. [CrossRef]
- M. M. Wright, D. E. Daugaard, J. A. Satrio, and R. C. Brown, “Techno-economic analysis of biomass fast pyrolysis to transportation fuels,” Fuel, vol. 89, no. SUPPL. 1, Nov. 2010. [CrossRef]
- C. N. Hamelinck, A. P. C. Faaij, H. den Uil, and H. Boerrigter, “Production of FT transportation fuels from biomass; technical options, process analysis and optimisation, and development potential,” Energy, vol. 29, no. 11, pp. 1743–1771, 2004. [CrossRef]
- “Ammonia Scrubber,” For Chemical Industry, 2021. Available online: https://www.indiamart.com/proddetail/ammonia-scrubber-23341476412.html (accessed on 12 April 2022).
- N. Inc and S. Francisco, “Equipment Design and Cost Estimation for Small Modular Biomass Systems, Synthesis Gas Cleanup, and Oxygen Separation Equipment; Task 2: Gas Cleanup Design and Cost Estimates—Wood Feedstock,” 2006. Available online: http://www.osti.gov/bridge (accessed on 12 April 2022).
- “Guangzhou supply SBR tyre rubber granules wholesale price,” 2021. Available online: https://www.alibaba.com/product-detail/Guangzhou-supply-SBR-tyre-rubbergranules_60654773455.html?spm=a2700.wholesale.0.0.72cc639a4iptg6 (accessed on 12 April 2022).
- D. T. Nega, A. V. Ramayya, F. Manenti, and A. F. Amaral, “Turning curse into cure: Potential of water hyacinth for bio-refining - A contextual investigation of Lake Tana,” Environmental Challenges, vol. 5, Dec. 2021. [CrossRef]
- H. C. Frey and Y. Zhu, “Techno-economic analysis of combined cycle systems,” in Combined Cycle Systems for Near-Zero Emission Power Generation, Elsevier, 2012, pp. 306–328. [CrossRef]
- W. Li, Q. Dang, R. Smith, R. C. Brown, and M. M. Wright, “Techno-economic analysis of the stabilization of bio-oil fractions for insertion into petroleum refineries,” ACS Sustain Chem Eng, vol. 5, no. 2, pp. 1528–1537, Feb. 2017. [CrossRef]
- T. R. Brown, R. Thilakaratne, R. C. Brown, and G. Hu, “Techno-economic analysis of biomass to transportation fuels and electricity via fast pyrolysis and hydroprocessing,” Fuel, vol. 106, pp. 463–469, 2013. [CrossRef]
- S. Bunch, K. Cort, E. Jhonson, D. Elliott, K.M. Stoughton, “Water and Wastewater Annual Price Escalation Rates for Selected Cities across the United States,” 2017.
- TYNE MORGAN, “Natural Gas Prices Only Account for 15% of Run-Up in Anhydrous Ammonia Prices, Shows New Texas A&M Study,” 2021. (accessed on 12 April 2022).
- U.S. Department of Energy, “Fuel Prices,” 2021. 2 April. Available online: https://afdc.energy.gov/fuels/prices.html (accessed on 12 April 2022).
- Susan Kraemer, “Zero Carbon Cement Production With Solar Thermal,” 2012. https://cleantechnica.com/2012/04/10/zero-carbon-cement-production-withsolar-thermal/. (accessed on 12 April 2022).
- Energy Information Administration, “Price of Ethane,” 2021. https://investors.westlake.com/industry pricing/default.aspx. (accessed on 12 April 2022).
- Energy Information Administration, “U.S. All Grades All Formulations Retail Gasoline Prices,” 2021. Available online: http://www.eia.gov/dnav/pet/hist/LeafHandler.ashx?n=pet&s=eer_epjk_pf4_rgc_dpg&f=a (accessed on 12 April 2022).
- myLPG.eu, “Chart of fuel prices in United States of America,” 2021. Available online: https://www.mylpg.eu/stations/united-states-of-america/prices/ (accessed on 12 April 2022).
- Energy Information Administration, “NATURAL GAS,” 2021. Available online: https://www.eia.gov/dnav/ng/hist/n3035us3m.htm (accessed on 12 April 2022).
- Boulder County, “Hazardous Waste Disposal Costs for Businesses,” 2021. Available online: https://www.bouldercounty.org/environment/hazardous-waste/disposal-costsfor-businesses/ (accessed on 12 April 2022).
- Wilson, M.; Morris, T.; Gale, J.; Thambimuthu, K.; Feron, P.H.M. New solvents based on amino-acid salts for co2 capture from flue gases. Greenhouse Gas Control Technologies.
- D. Pradhan, V. Volli, R. K. Singh, and S. Murgun, “Co-pyrolysis behavior, engine performance characteristics, and thermodynamics of liquid fuels from mahua seeds and waste thermocol: A comprehensive study,” Chemical Engineering Journal, vol. 393, Aug. 2020. [CrossRef]
- W. Doherty, A. Reynolds, and D. Kennedy, “The effect of air preheating in a biomass CFB gasifier using ASPEN Plus simulation,” Biomass Bioenergy, vol. 33, no. 9, pp. 1158–1167, Sep. 2009. [CrossRef]
- H. Y. Ismail, A. Abbas, F. Azizi, and J. Zeaiter, “Pyrolysis of waste tires: A modeling and parameter estimation study using Aspen Plus®,” Waste Management, vol. 60, pp. 482–493, Feb. 2017. [CrossRef]
Figure 1.
The model of the co-pyrolysis process (direct method).
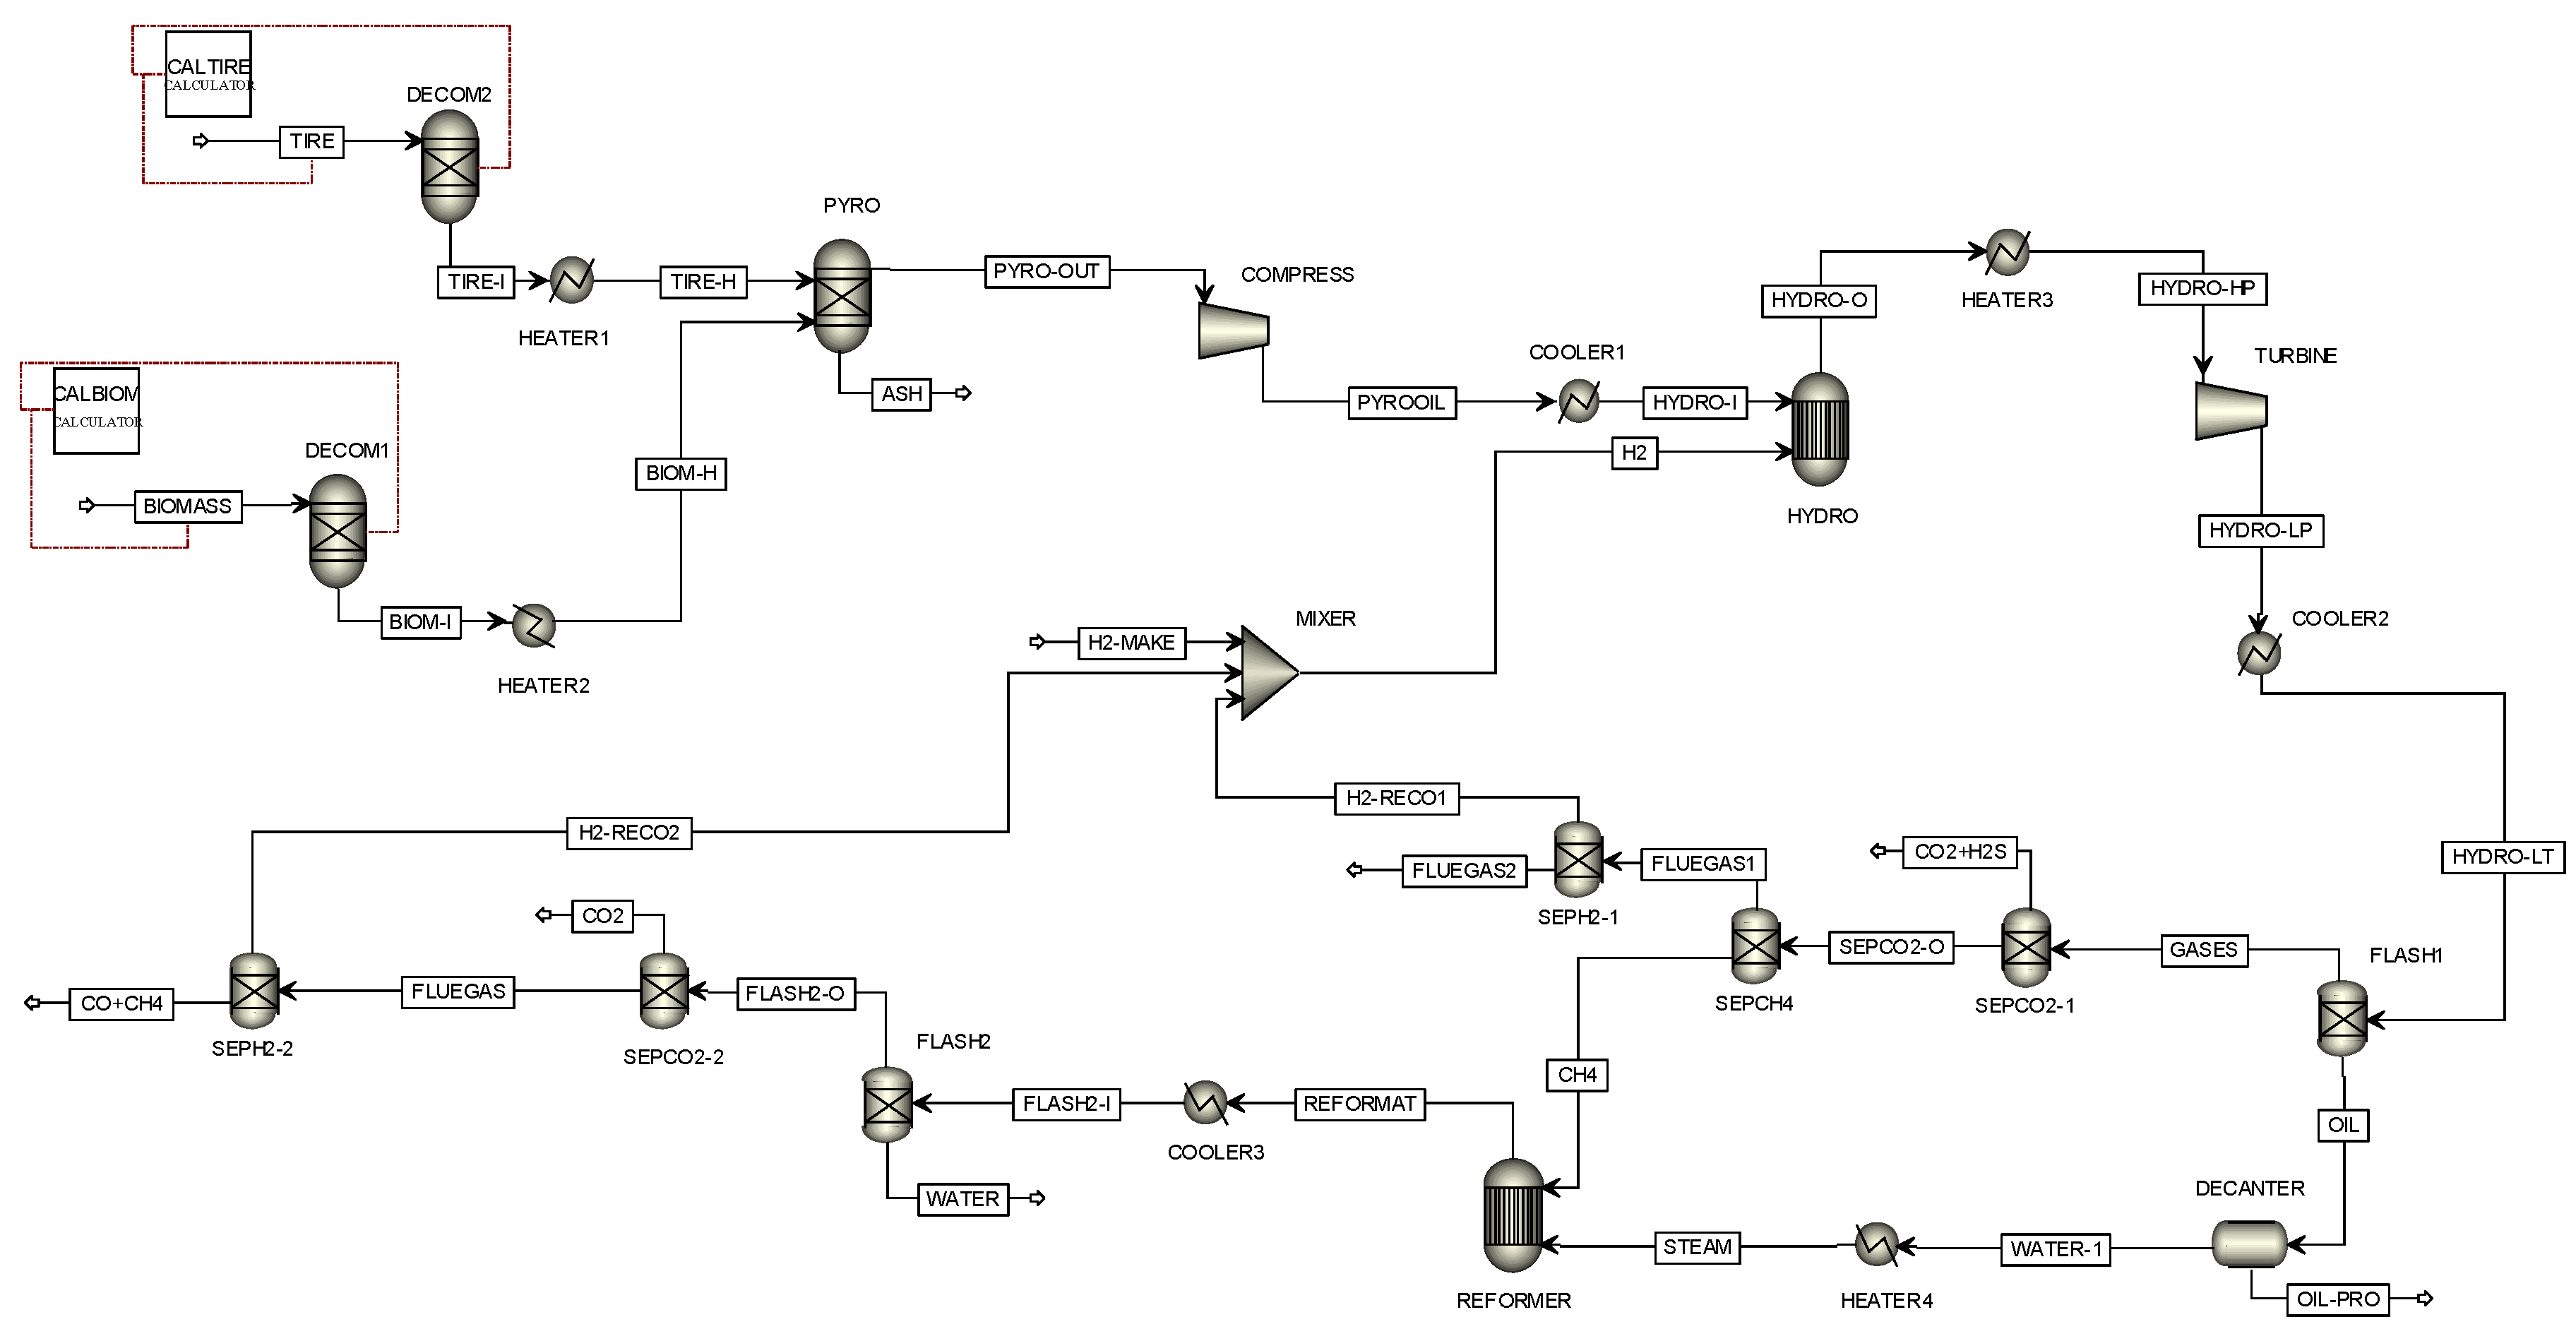
Figure 2.
The model of gasification integrated with the Fischer-Tropsch process (indirect method).
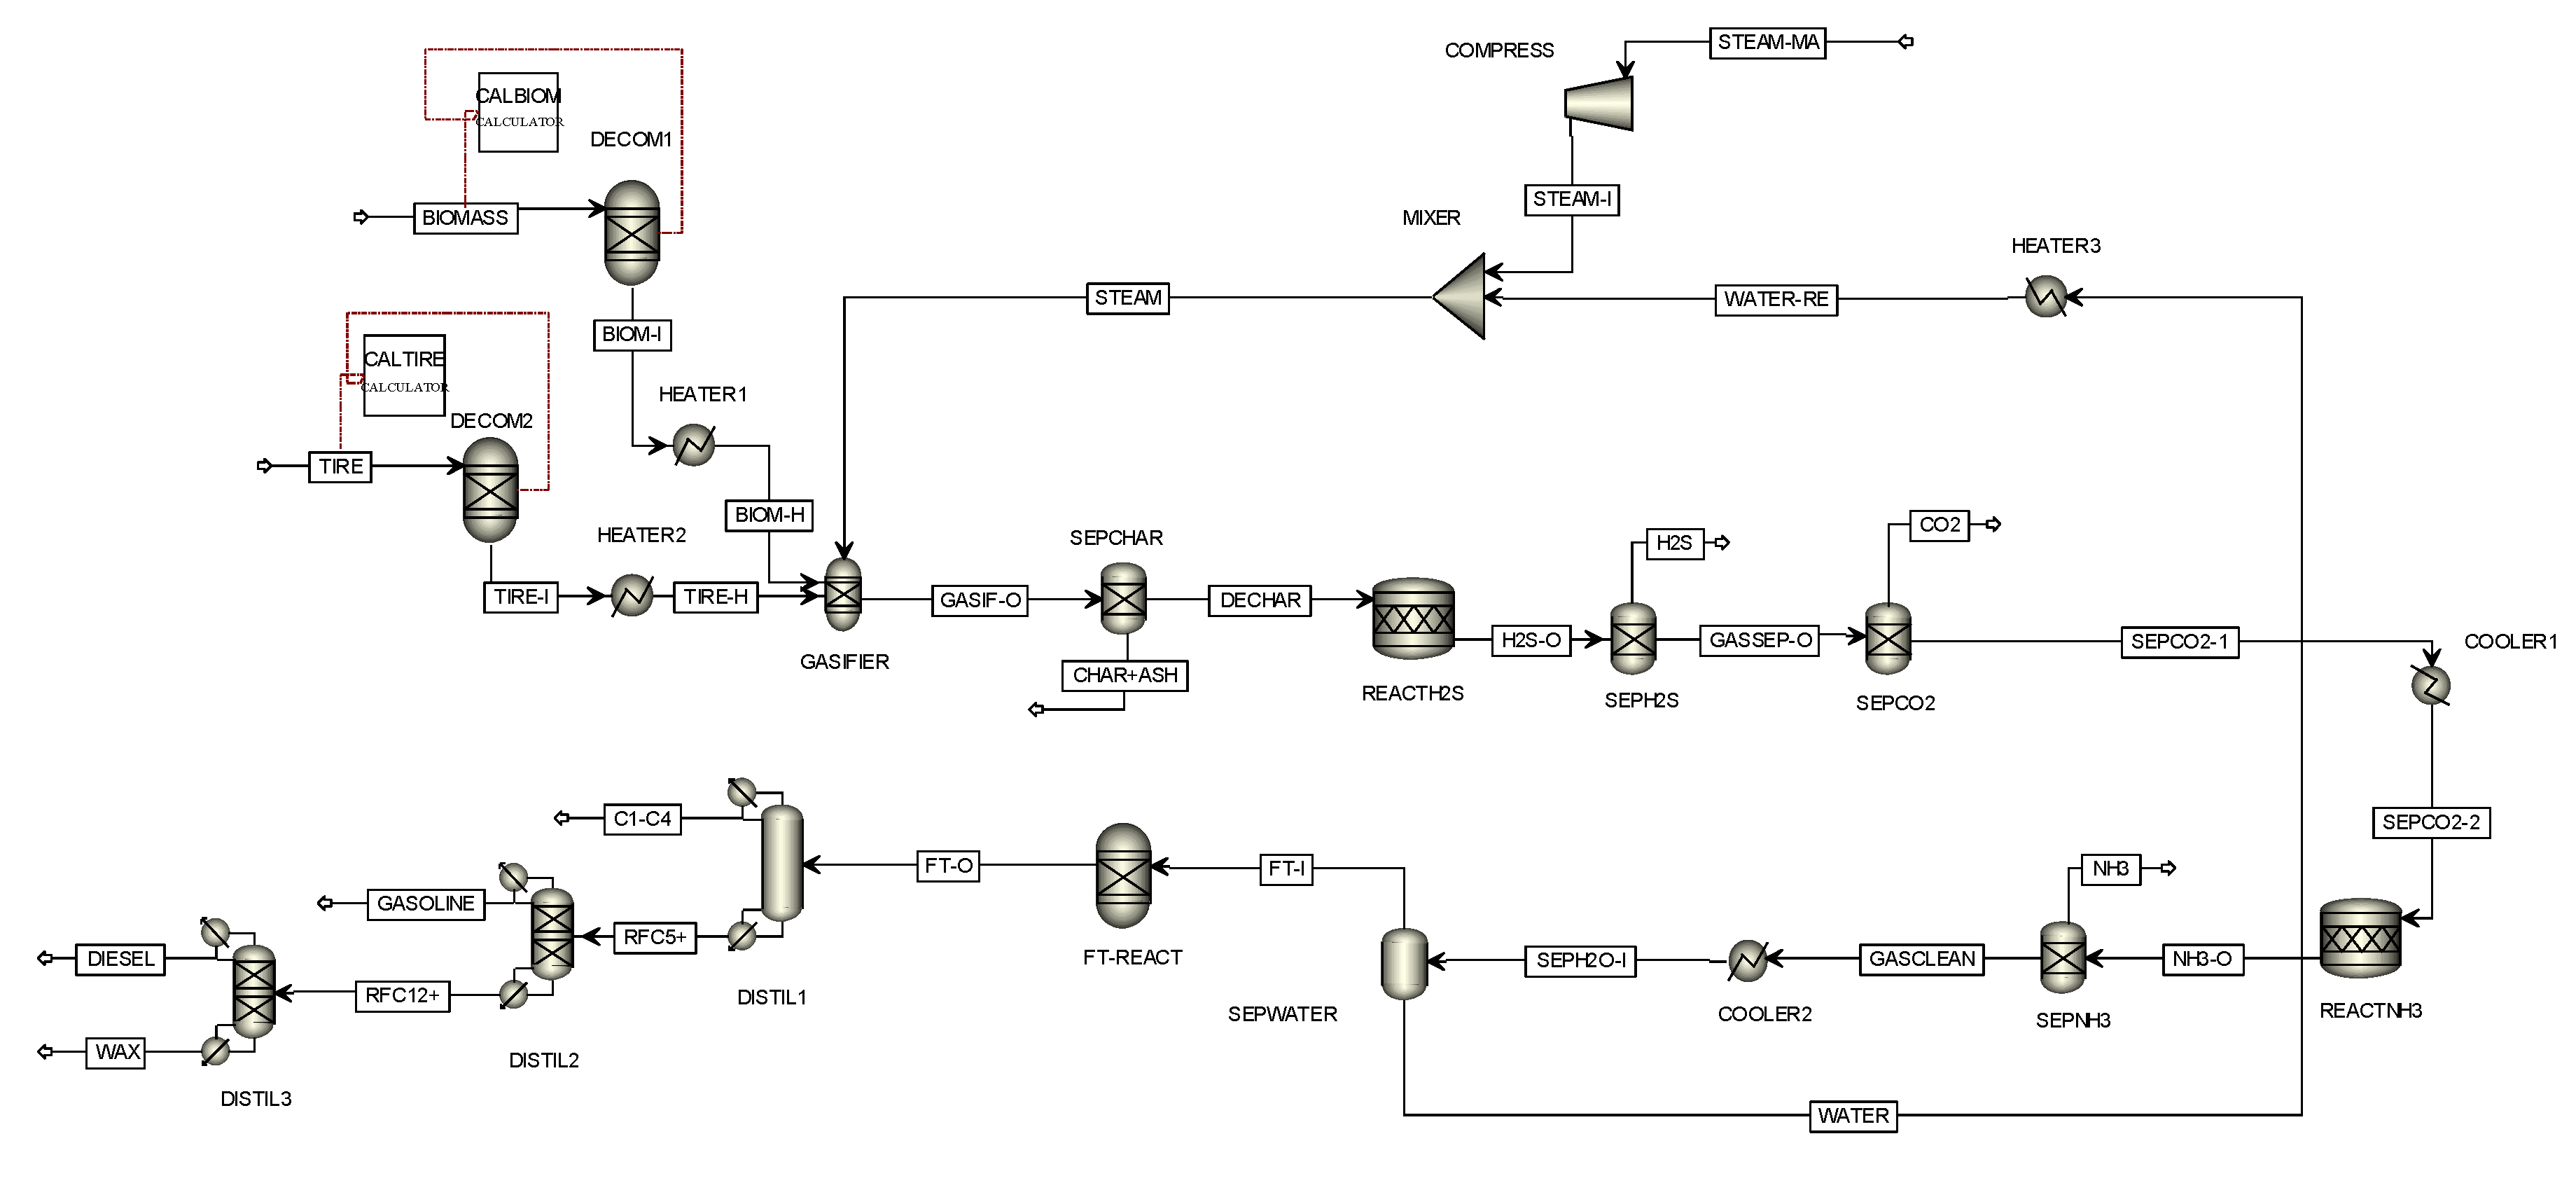
Figure 3.
Effect of (a) blending weight ratio (T = 600 °C) and (b) pyrolyser temperature (W/B = 75:25) on the product.
Figure 3.
Effect of (a) blending weight ratio (T = 600 °C) and (b) pyrolyser temperature (W/B = 75:25) on the product.
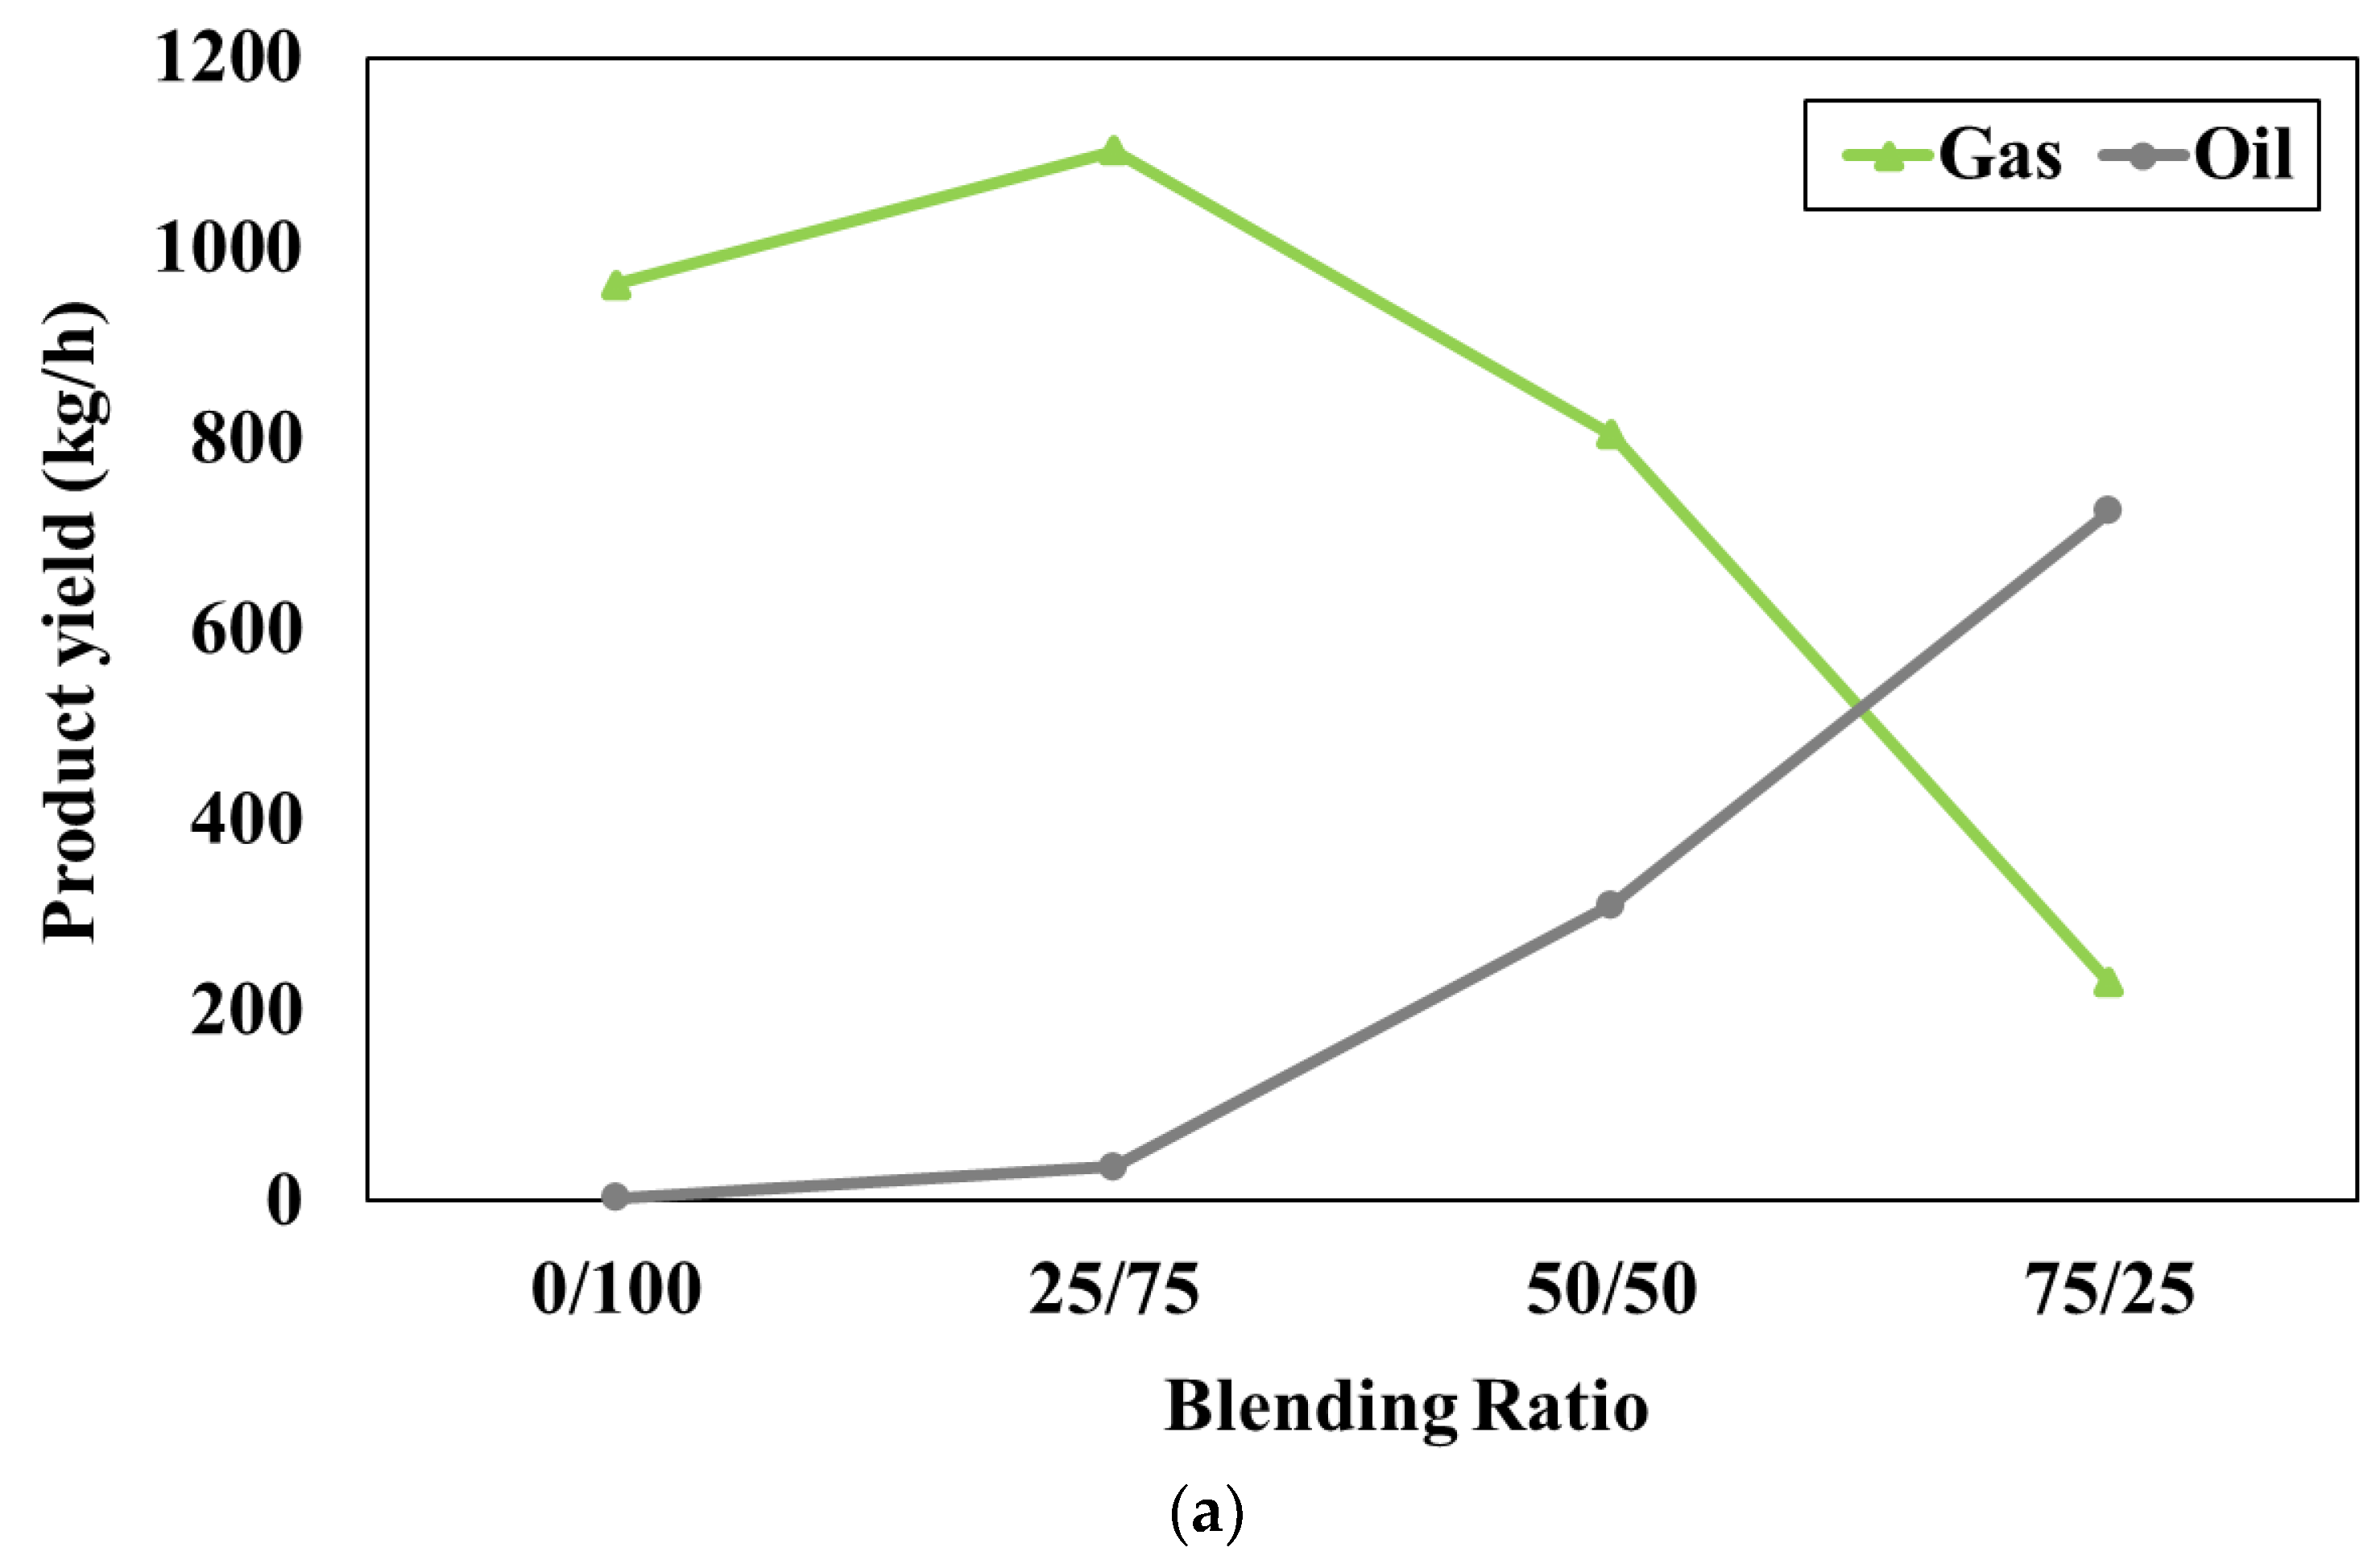
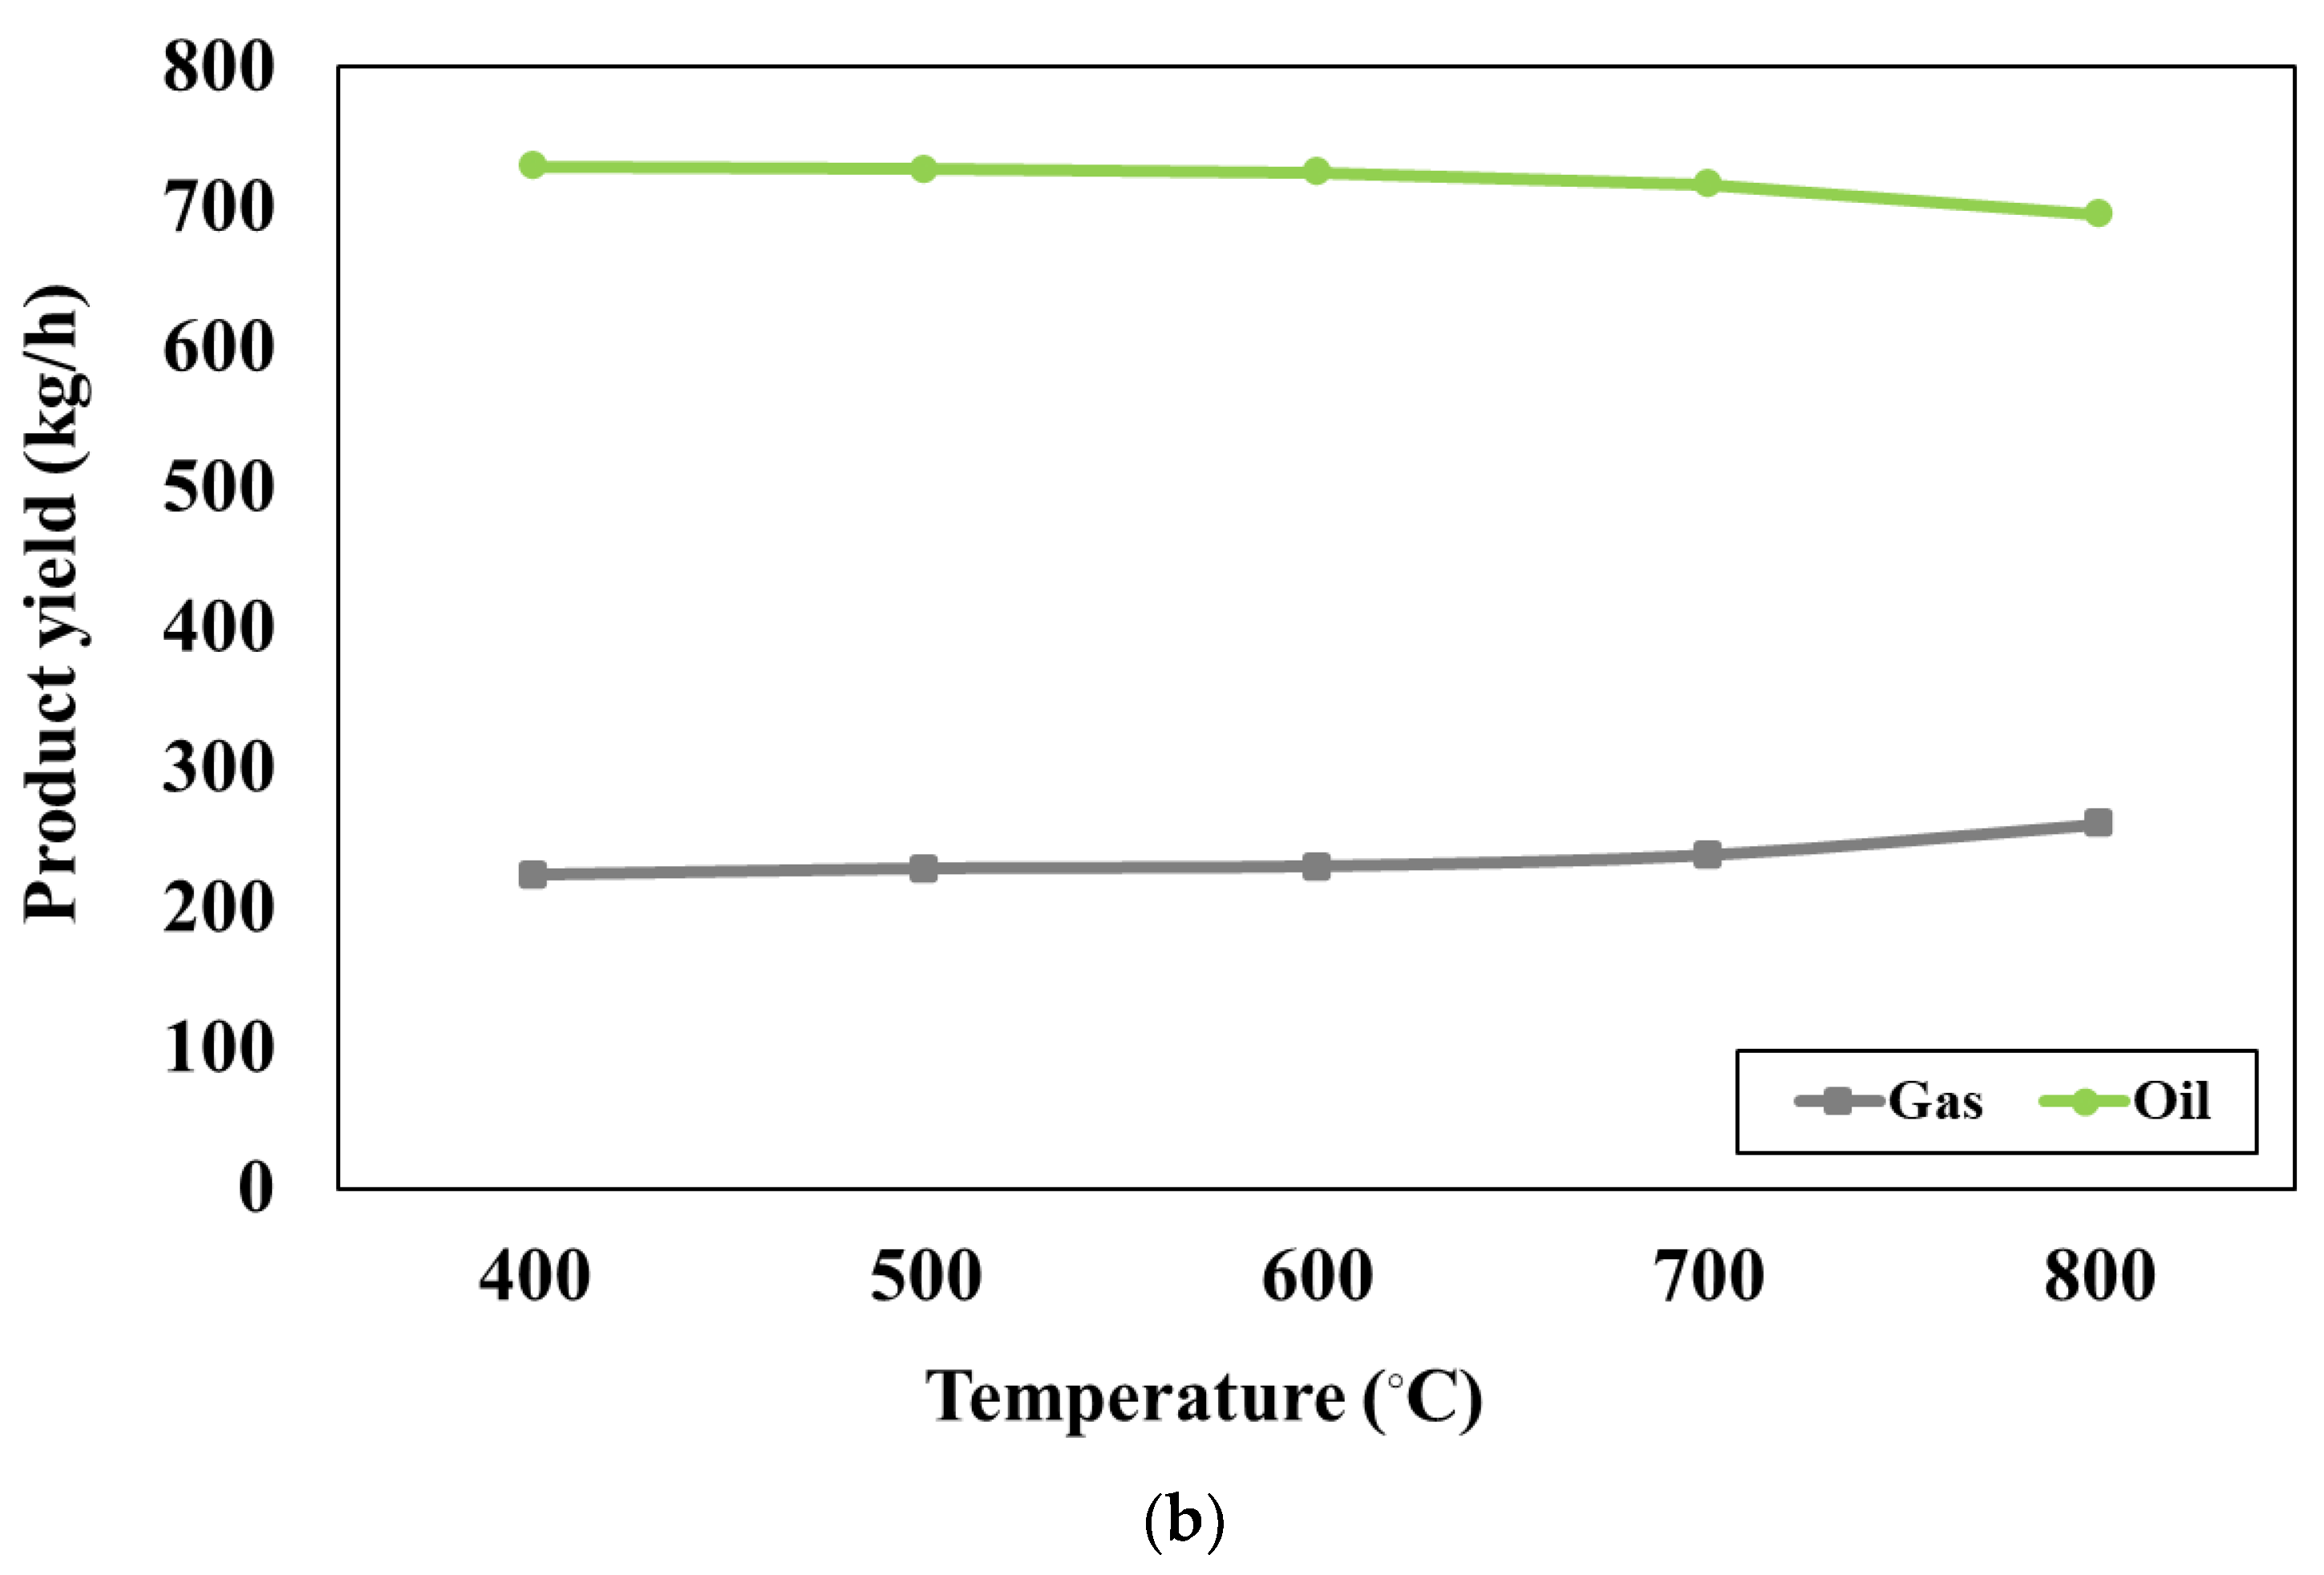
Figure 4.
Effect of (a) blending weight ratio (T = 800 °C and S/F = 1), (b) gasifier temperature (W/B = 50:50 and S/F = 1) and steam to feed ratio (T = 800 °C and W/B = 50:50) on the product gas compositions.
Figure 4.
Effect of (a) blending weight ratio (T = 800 °C and S/F = 1), (b) gasifier temperature (W/B = 50:50 and S/F = 1) and steam to feed ratio (T = 800 °C and W/B = 50:50) on the product gas compositions.
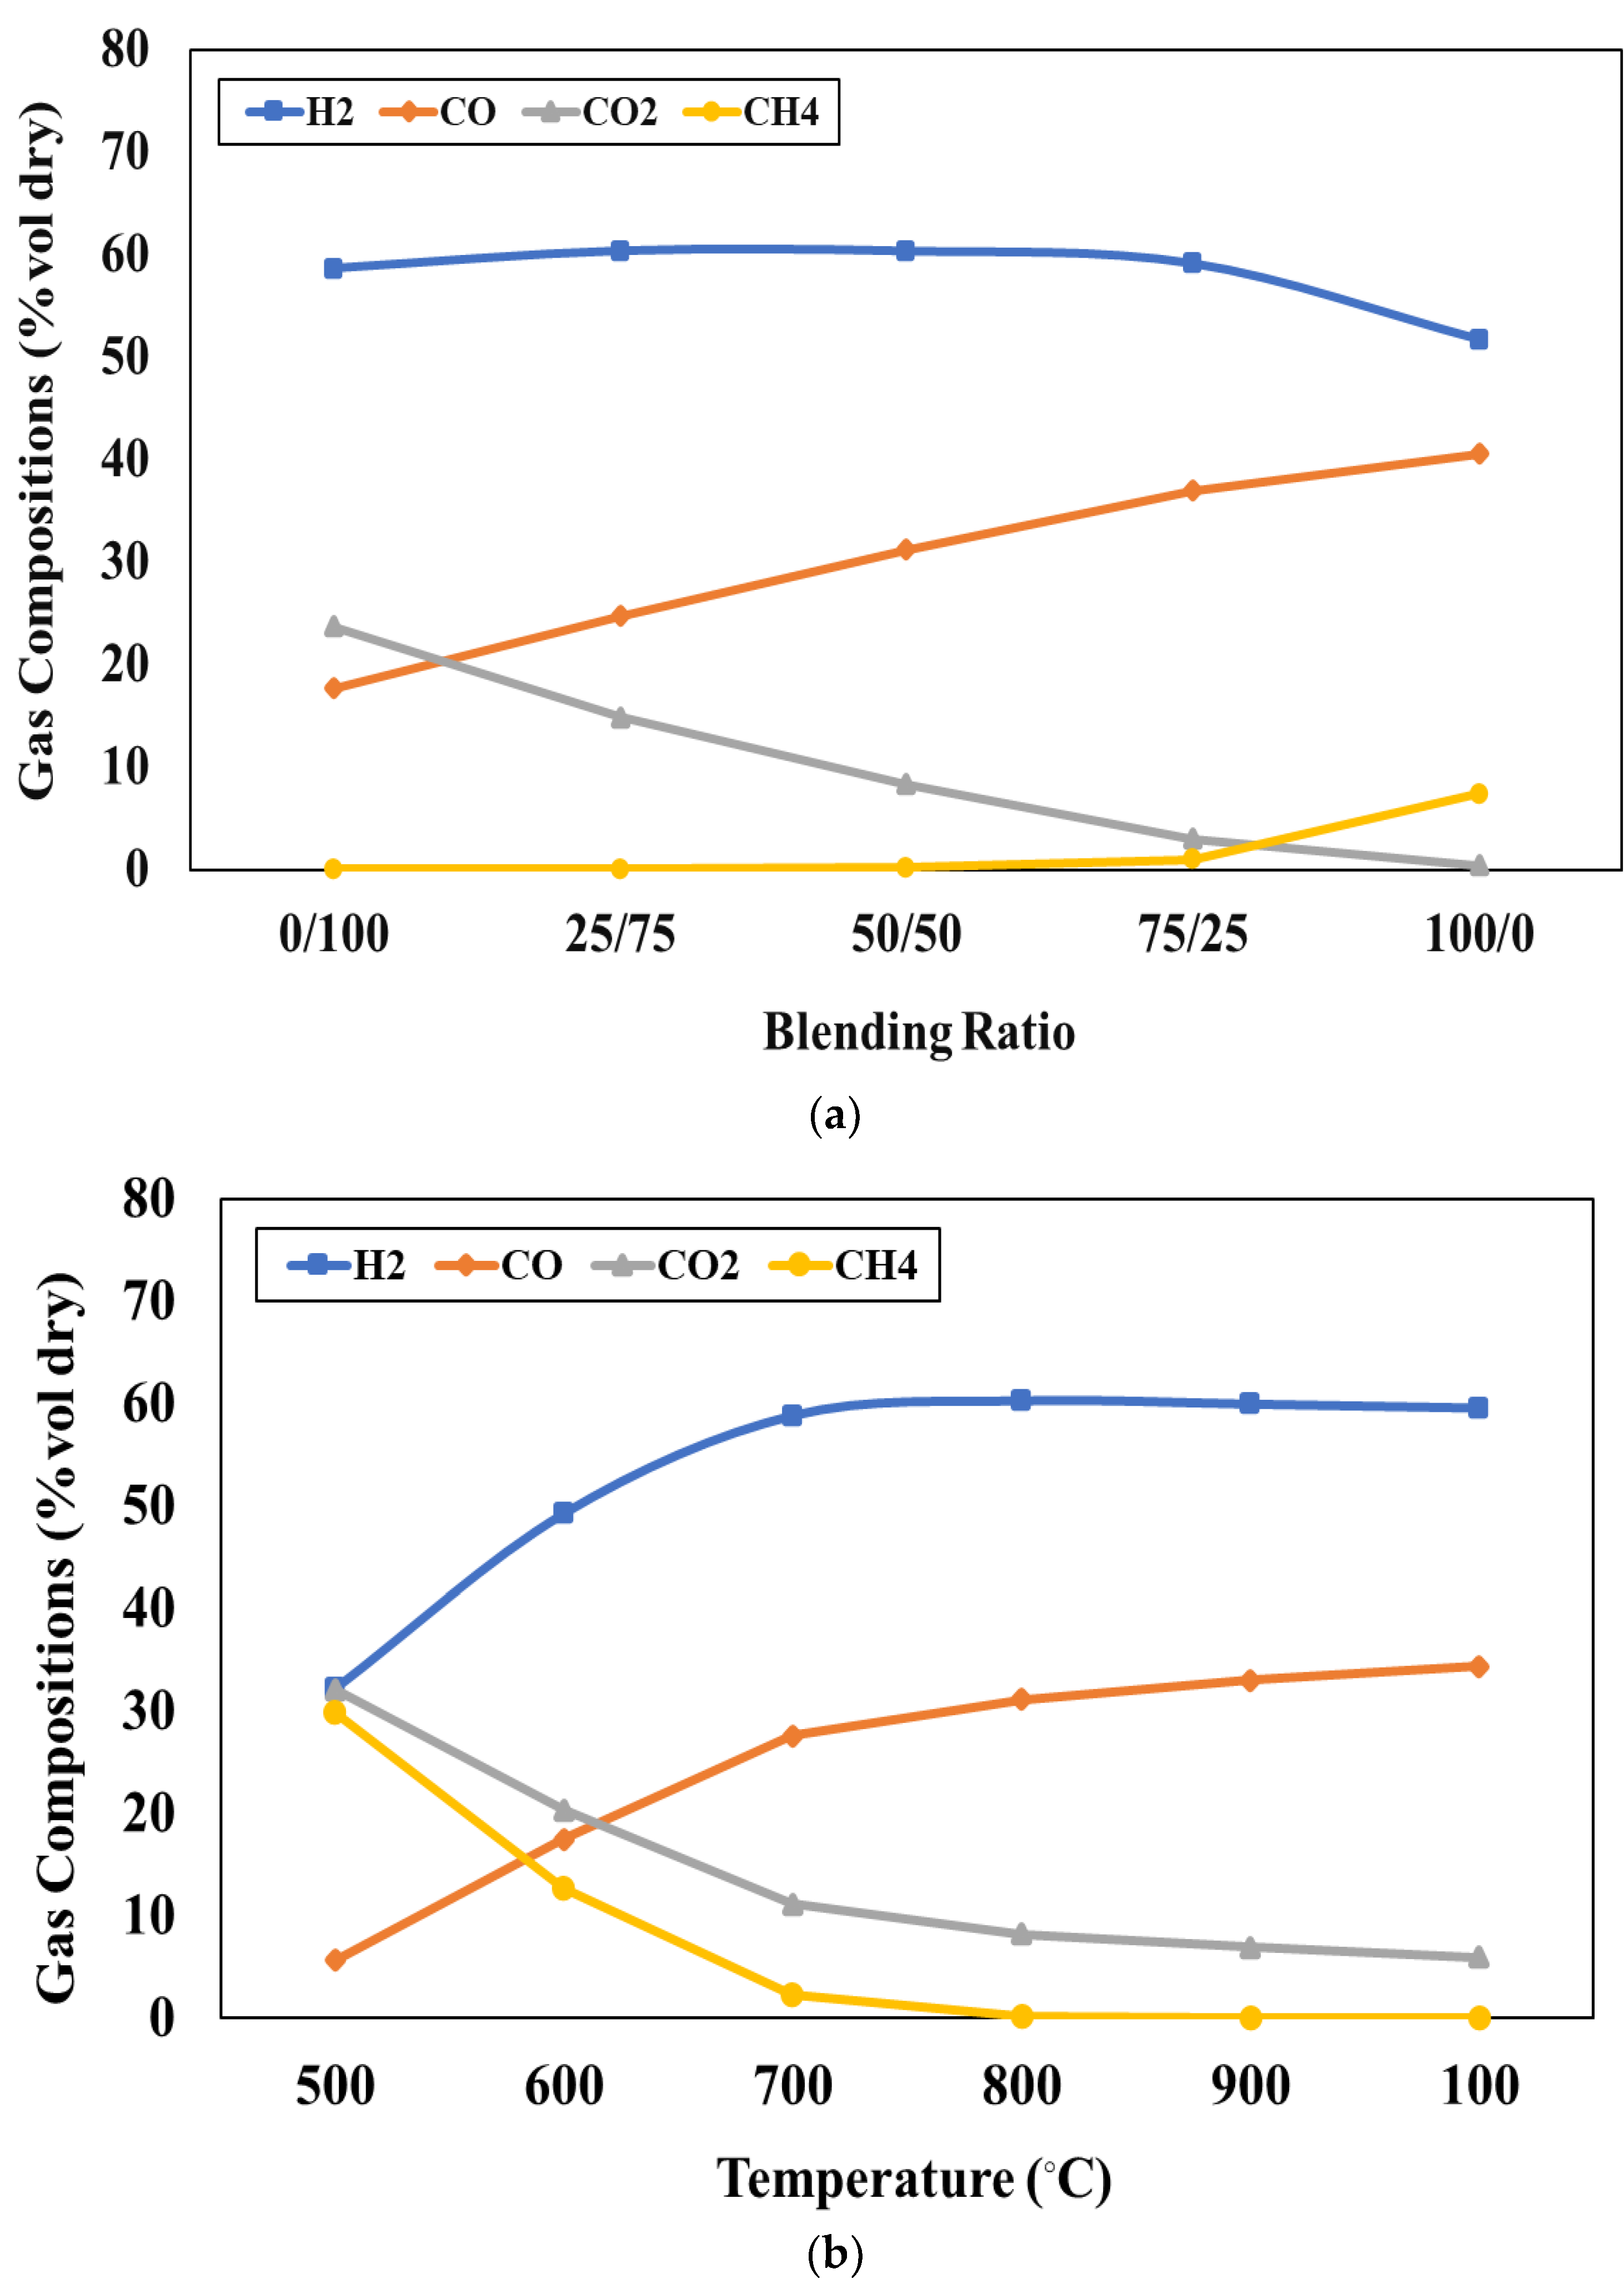
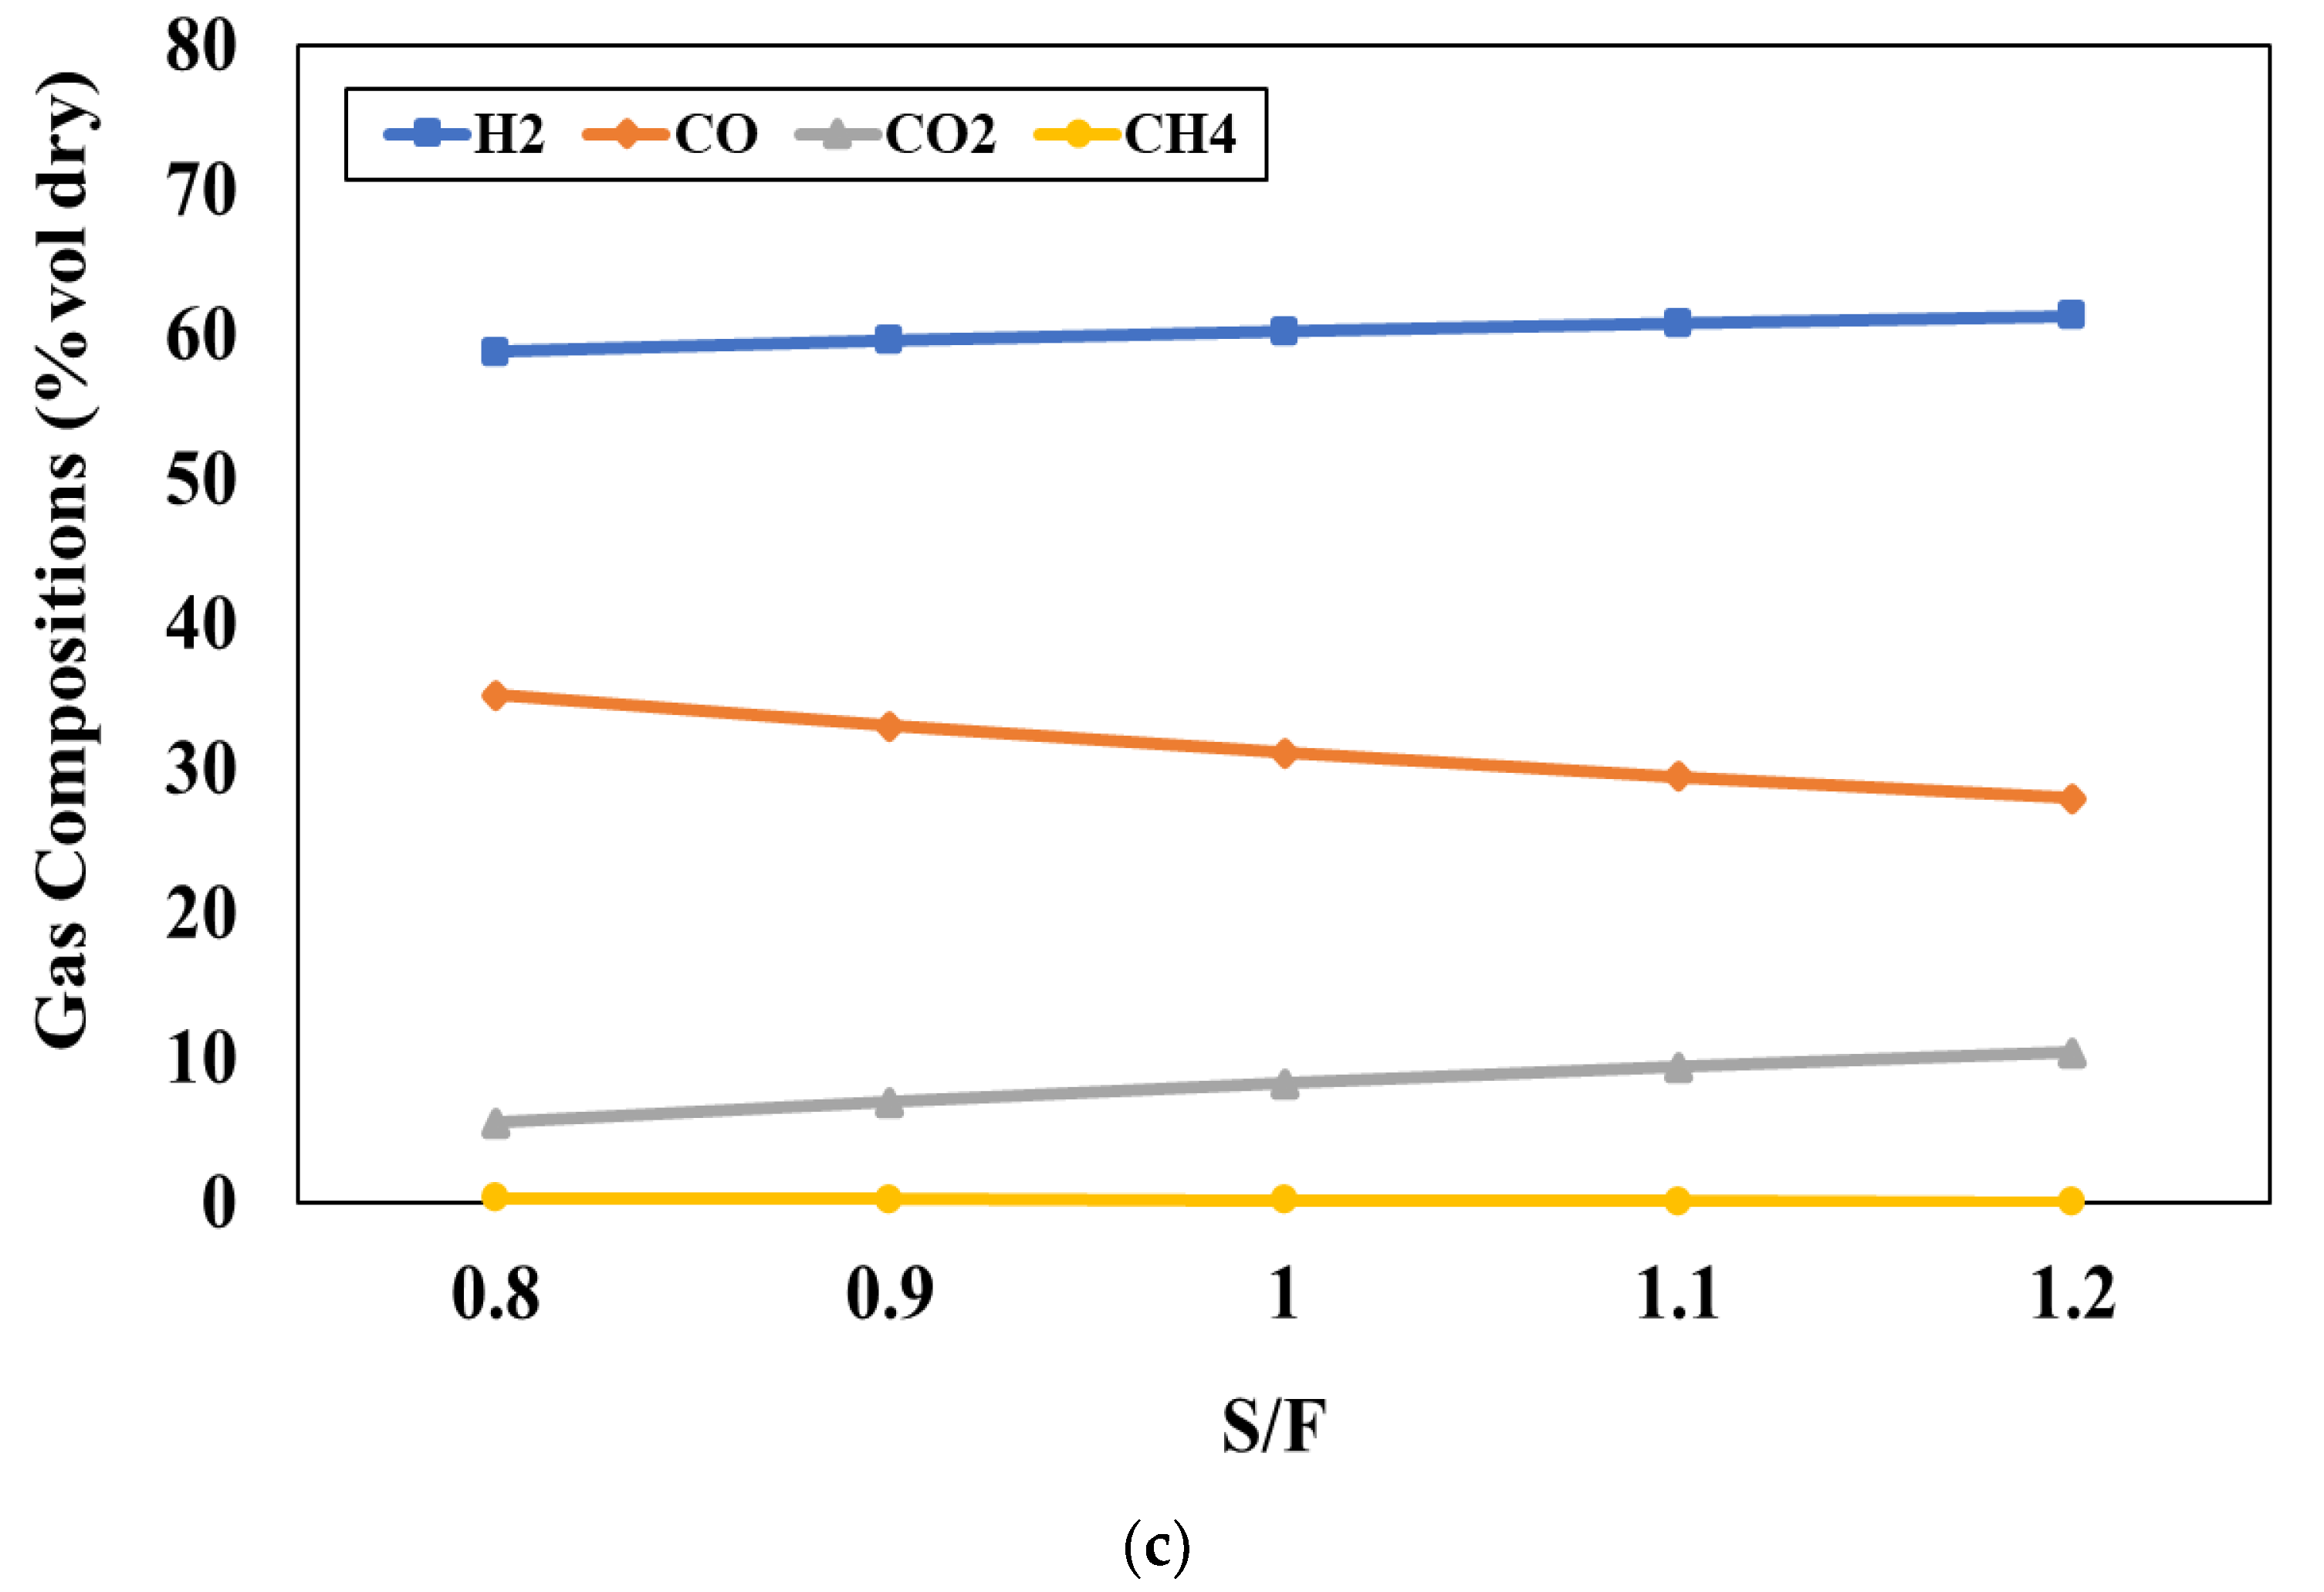
Figure 5.
Effect of Fischer-Tropsch reactor temperature on the production rate of liquid fuel at the reactor pressure of 1 bar and H2/CO ratio of 2.
Figure 5.
Effect of Fischer-Tropsch reactor temperature on the production rate of liquid fuel at the reactor pressure of 1 bar and H2/CO ratio of 2.
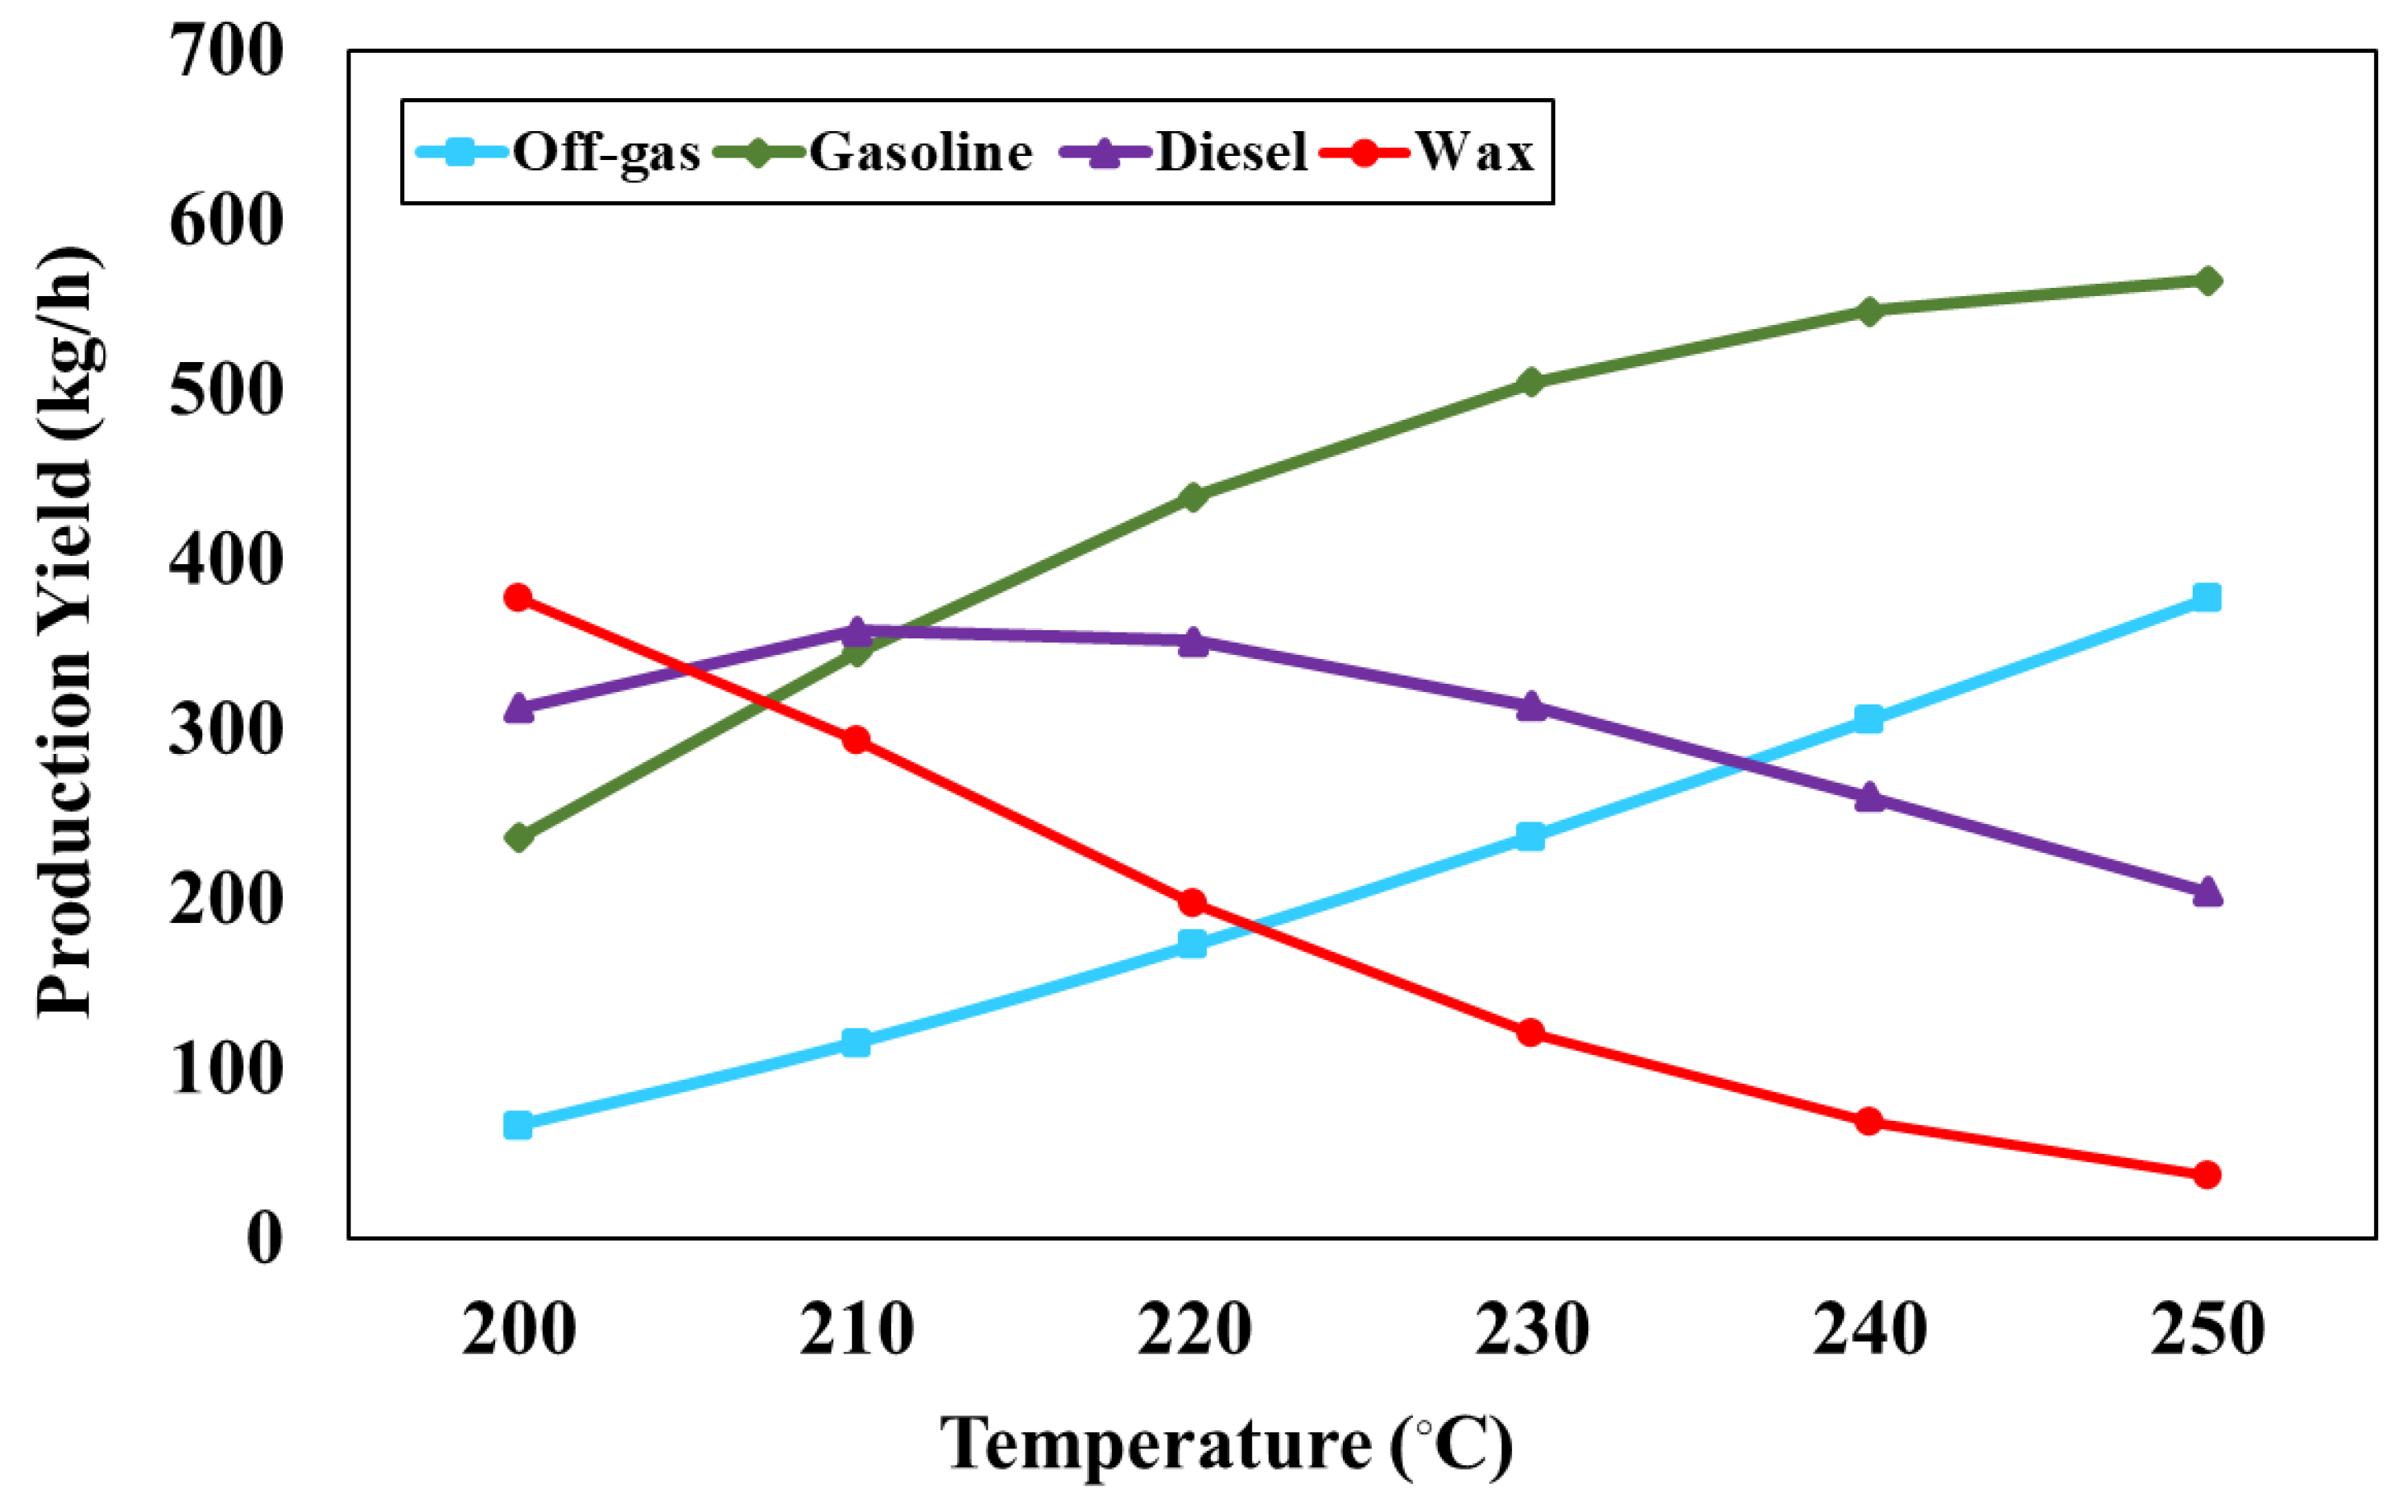
Figure 6.
Economic analysis of (a) Financial value of the liquid fuels production at the present year and (b) Production rate of the liquid fuel production obtained from both processes.
Figure 6.
Economic analysis of (a) Financial value of the liquid fuels production at the present year and (b) Production rate of the liquid fuel production obtained from both processes.
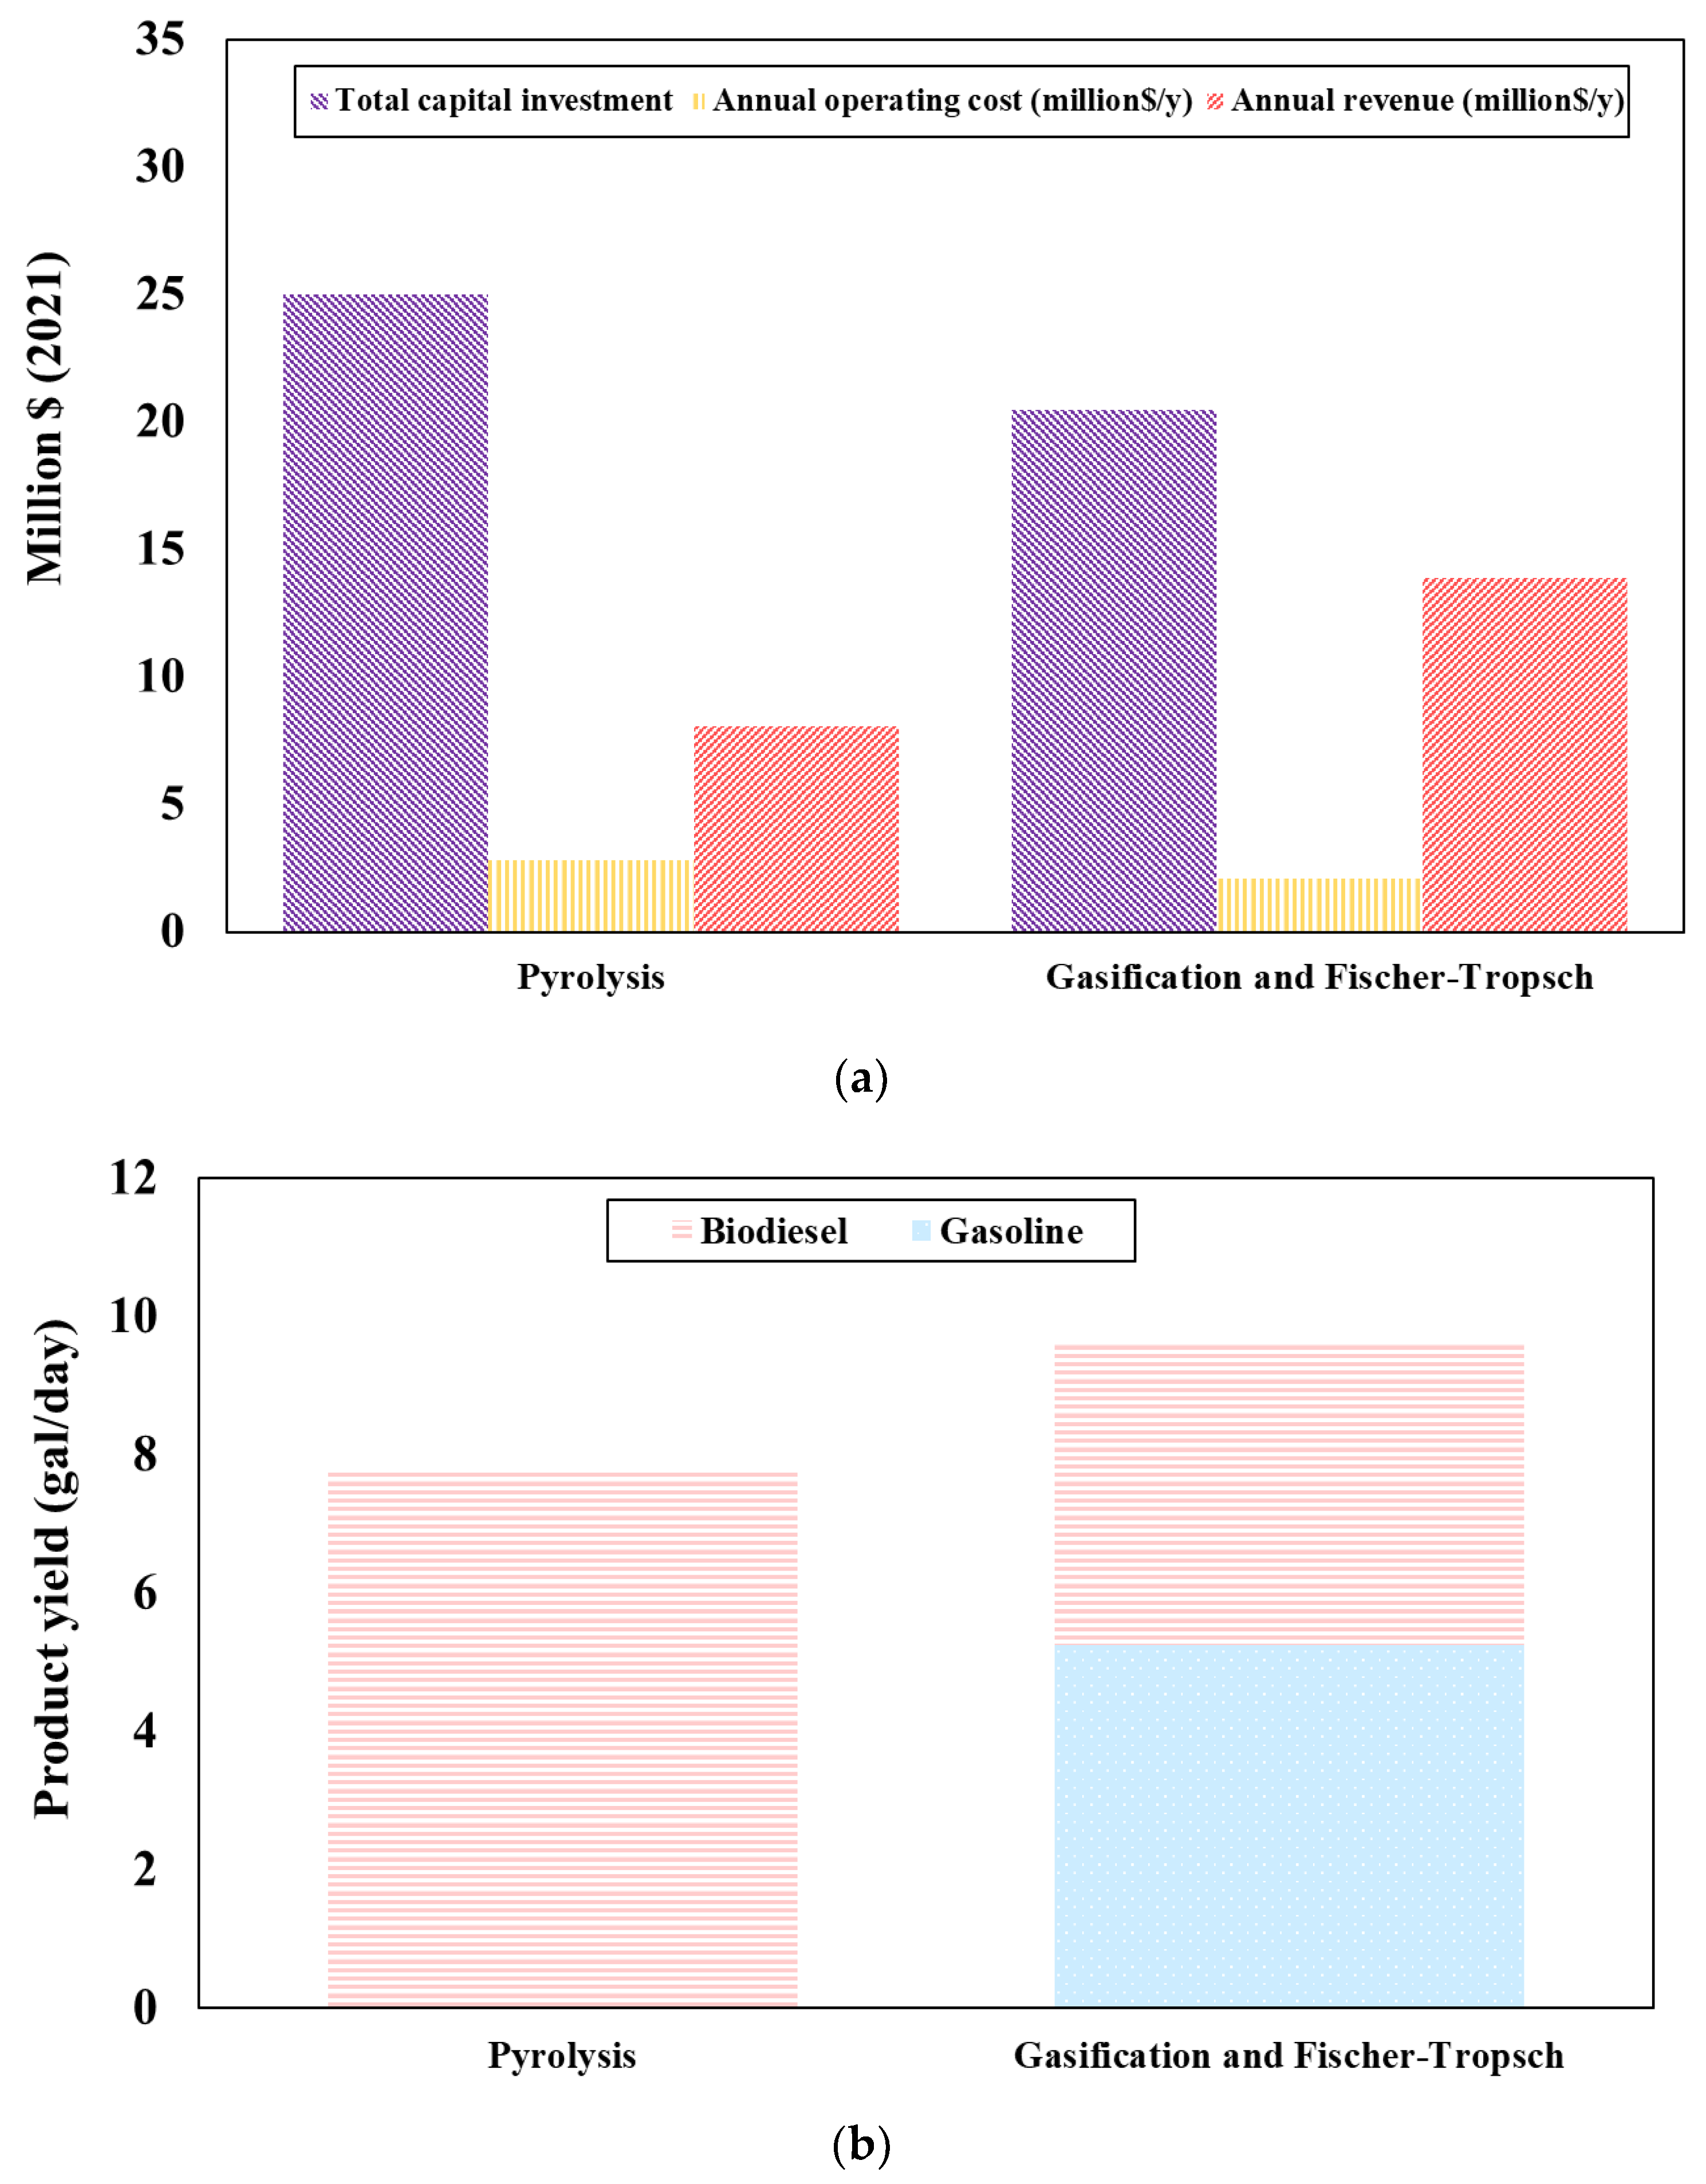

Table 1.
Proximate and ultimate analysis results of feedstocks.
| Characteristics | Waste tires | Water hyacinth |
|---|---|---|
| Proximate analysis (%wt, dry basis) | ||
| Moisture content | 0.66 | 9.98 |
| Volatile matter | 50.06 | 57.02 |
| Fixed carbon | 40.28 | 33.15 |
| Ash content | 9.66 | 9.83 |
| Ultimate analysis (%wt, dry basis) | ||
| Carbon | 79.16 | 35.41 |
| Hydrogen | 7.34 | 5.35 |
| Oxygen* | 1.11 | 48.81 |
| Nitrogen | 0.60 | 0.54 |
| Sulphur | 2.13 | 0.06 |
| LHV [MJ/kg] | 37.25 | 22.19 |
* By different.
Table 2.
Possible chemical reactions occurred in the gasifier.
| Partial oxidation | C + 1/2O2 → CO | ∆H = -110 kJ/mol | (1) |
| Combustion | H2 + 1/2O2 → H2O | ∆H = -242 kJ/mol | (2) |
| C + O2 → CO2 | ∆H = -393 kJ/mol | (3) | |
| Bouduard | C + CO2 ↔ 2CO | ∆H = +172 kJ/mol | (4) |
| Water gas | C + H2O ↔ CO + H2 | ∆H = +131 kJ/mol | (5) |
| Methanation | C + 2H2 ↔ CH4 | ∆H = -75 kJ/mol | (6) |
| Water gas shift | CO + H2O ↔ CO2 + H2 | ∆H = -41 kJ/mol | (7) |
| Steam methane reforming | CH4 + H2O → CO + 3H2 | ∆H = +206 kJ/mol | (8) |
Table 3.
The operating conditions of the main equipment.
| Unit Name | Unit model | Range of operating conditions | |
|---|---|---|---|
| Temperature [°C] | Pressure [bar] | ||
| DECOMP1 | RYield | 25 | 1 |
| DECOMP2 | RYield | 25 | 1 |
| PYRO | RGibbs | 400-800 | 1 |
| HYDRO | REquil | 360 | 70 |
| REFORMER | REquil | 700 | 1 |
| GASIFIER | RGibbs | 500-1000 | 1 |
| FT-REACT | RYield | 200-250 | 30 |
Table 4.
Methodology for capital cost estimation.
| Parameter | Method |
|---|---|
| Total purchased equipment cost (TPEC) | Aspen Plus Simulation software and literature |
| Total installed cost (TIC) | TPEC x installation factor (3.02) |
| Indirect cost (IC) | |
| Engineering and supervision | 32% of TPEC |
| Construction expenses | 34% of TPEC |
| Legal and contractor’s fees | 23% of TPEC |
| Total direct and indirect costs (TDIC) | TIC + IC |
| Contingency | 20% of TDIC |
| Fixed capital investment (FCI) | TDIC + Contingency |
| Working capital (WC) | 15% of FCI |
| Land use | 6% of TPEC |
| Total capital investment | FCI + WC + Land |
Table 5.
Overview of the main equipment based on the reference year.
| Equipment | Base capacity | Base cost (million US$) | Scale factor | Reference year |
|---|---|---|---|---|
| Compressor | 3500 kW | 0.17 | 1.00 | 2010 [17] |
| Cyclone | 200000 m3/h | 1.97 | 0.65 | 2021 [18] |
| Decanter | 98389 L/h | 1.34 | 0.70 | 2013 [19] |
| Distillation columna | - | - | - | 1998 [20] |
| Flash druma | - | - | - | 1998 [20] |
| FT reactor | 2.7 kmol/sว | 14.91 | 0.72 | 2015 [21] |
| Gasifier | 200 MW | 19.80 | 0.70 | 2010 [17] |
| Hydrotreating unit | 2000 tons/day | 14.80 | 0.80 | 2010 [22] |
| PSA | 9600 kmol feed/h | 23.00 | 0.70 | 1993 [23] |
| Pyrolyser | 2000 tons/day | 45.90 | 0.80 | 2010 [22] |
| Scrubber | 1000 CFM | 0.004 | 0.70 | 2021 [24] |
| Steam methane reformer | 101885 lb/hH2 produced | 98.80 | 0.80 | 2005 [25] |
| Turbine | 25 MW | 11.97 | 1.00 | 2015 [21] |
a Estimated from calculation.
Table 6.
Materials and disposal costs based on the reference year.
| Item | Price (US$) | Reference year |
|---|---|---|
| Feedstocks | ||
| Waste tires (size 1-3 mm) | 0.258/kg | 2021 [26] |
| Water hyacinth | 0.056/kg | 2021 [27] |
| Chemicals | ||
| Activated Carbon | 2.190/kg | 2010 [28] |
| Co catalyst | 33.070/kg | 2007 [16] |
| Pyrolysis catalyst | 11.023/kg | 2016 [29] |
| Utilities | ||
| Cooling water | 0.0003/kg | 2007 [16] |
| Hydrogen | 1.330/kg | 2010 [30] |
| Process steam | 0.009/kg | 2007 [16] |
| Water | 0.003/gal | 2016 [31] |
| Products | ||
| Ammonia | 0.678/kg | 2021 [32] |
| Biodiesel (B99-B100) | 3.473/gal | 2021 [33] |
| Carbon monoxide | 0.600/kg | 2012 [34] |
| Ethane | 0.209/kg | 2021 [35] |
| Gasoline | 3.094/gal | 2021 [36] |
| LPG | 2.098/gal | 2021 [37] |
| Natural gas | 0.001/gal | 2021 [38] |
| Wax | 2.73/kg | 2018 [15] |
| Other | ||
| Ash/Char disposal | 0.024/kg | 2007 [16] |
| Hydrogen sulfide removal | 4.674/kg | 2021 [39] |
| MEA | 0.028/kg CO2 | 2004[40] |
Table 7.
Proximate and ultimate analysis of mahua seed, waste thermocol and wood chip.
| Characteristics | Mahua seed | Waste thermocol | Wood chip |
|---|---|---|---|
| Proximate analysis (%wt, dry basis) | |||
| Moisture content | 8.60 | 0.20 | 20.00 |
| Volatile matter | 92.12 | 99.10 | 80.00 |
| Fixed carbon | 5.58 | 0.50 | 18.84 |
| Ash content | 2.30 | 0.40 | 1.16 |
| Ultimate analysis (%wt, dry basis) | |||
| Carbon | 61.20 | 89.10 | 51.19 |
| Hydrogen | 8.40 | 9.30 | 6.08 |
| Oxygen* | 23.30 | 0.00 | 41.35 |
| Nitrogen | 4.10 | 1.20 | 0.20 |
| Sulphur | 0.70 | 0.00 | 0.02 |
*By different.
Table 8.
Comparison of the product compositions between the simulation result and the experimental data.
Table 8.
Comparison of the product compositions between the simulation result and the experimental data.
| Product | Composition (%wt) | |
|---|---|---|
| Experimental result | Simulation result | |
| Gas | 9.50 | 29.82 |
| Oil | 73.00 | 68.93 |
| Char | 11.00 | 1.25 |
| Aqueous liquid | 6.50 | 0.00 |
| RSM | 11.90 | |
Table 9.
Comparison of the product compositions between the simulation model and the experimental data.
Table 9.
Comparison of the product compositions between the simulation model and the experimental data.
| Product | Composition (%vol, dry) | |
|---|---|---|
| Experimental result | Simulation result | |
| H2 | 46.45 | 59.02 |
| CO | 21.91 | 27.00 |
| CO2 | 21.50 | 13.97 |
| CH4 | 10.14 | 0.02 |
| RSM | 9.26 | |
Disclaimer/Publisher’s Note: The statements, opinions and data contained in all publications are solely those of the individual author(s) and contributor(s) and not of MDPI and/or the editor(s). MDPI and/or the editor(s) disclaim responsibility for any injury to people or property resulting from any ideas, methods, instructions or products referred to in the content. |
© 2024 by the authors. Licensee MDPI, Basel, Switzerland. This article is an open access article distributed under the terms and conditions of the Creative Commons Attribution (CC BY) license (https://creativecommons.org/licenses/by/4.0/).
Copyright: This open access article is published under a Creative Commons CC BY 4.0 license, which permit the free download, distribution, and reuse, provided that the author and preprint are cited in any reuse.


