
Submitted:
16 January 2024
Posted:
17 January 2024
You are already at the latest version
Abstract
Cooling fans are one of the critical components of air-forced (AF) dry-type transformers for regulating internal temperatures. Therefore, effective malfunction detection is crucial to maintain the transformer temperature within an acceptable range and prevent overheating. Regular maintenance occurs periodically and issues with cooling fans may arise between maintenance periods, leading to prolonged operation under malfunctioning conditions and potential failures. In addition, utilities typically have online information about whether a fan works or not without providing information about cooling fan malfunctioning circumstances. To address these challenges, this study proposes learning-based online monitoring techniques to detect malfunctions in AF transformer cooling fans. Random forests (RFs) and convolutional neural networks (CNNs) are developed to classify the audio signals from cooling fans into normal and malfunctioning classes. Unlike RFs, which require separate feature extraction, CNNs are trained based on spectrogram images derived from audio signals. Thus, various time-frequency techniques are utilized for feature extraction in RFs. Besides, multiple data augmentation techniques are employed to enhance the dataset size and diversity. Algorithmic performance is optimized through hyperparameter tuning and classifier threshold adjustment. Simulations reveal that CNNs outperform RFs, whereas the latter provides superior interpretability of acoustic features compared to the former.
Keywords:
Malfunction detection
; air-forced power transformers
; cooling fans
; acoustic features
; learning algorithms
; data augmentation
; joint time-frequency feature extraction.
I. INTRODUCTION
Transformers play a vital role in electrical power systems by stepping up or down voltage. Transformers can be categorized into different types based on their specific functions, including distribution, power, and instrument transformers [1]. Regardless of the transformer type, the reliable operation of transformers is crucial to ensure the stability and quality of the power supply. The copper losses result from the electrical resistance in the transformer winding, and iron losses associated with the transformer magnetic core increase the temperature of the windings and the core [2]. Exposing the transformers to excessive heat may lead to insulation degradation, component decomposition, reduced lifespan, and even catastrophic failures [3]. To prevent the overheating of transformers, cooling systems are essential. By transferring excess heat to an external medium, a cooling system efficiently dissipates heat generated within transformers. A proper cooling system not only enhances the lifespan of transformers but also contributes to energy efficiency, reducing the operational costs associated with transformer maintenance [4]. The design of transformer cooling systems varies based on the transformer type. These systems may incorporate specific components, such as oil, pumps, fans, and radiators to regulate and maintain transformers within specified temperature limits.
- A.
- TRANSFORMER COOLING SYSTEM METHODS
Based on the cooling medium employed, transformers are commonly classified into two primary categories: dry-type transformers, which rely on air, and oil-type transformers, which utilize oil-air [5].
- 1)
- DRY-TYPE TRANSFORMERS
The dry-type transformers dissipate heat generated during operation by using air as a cooling medium. Cooling methods for dry-type transformers typically are based on air-natural (AN) and air-forced (AF) methods. The AN method is generally utilized in small transformers (less than 3 MVA) and uses natural air circulation for cooling [6], [7]. However, natural air is not enough for cooling the transformer with higher loads. In this case, additional fans are embedded to improve airflow and transformer cooling system efficiency as the AF method [7].
- 2)
- OIL-TYPE TRANSFORMERS
The oil-type or oil-immersed transformers use oil-air as a cooling medium. Oil circulates through windings and core transferring heat away from the transformer. Additionally, oil provides insulation for transformers [8]. Oil-type transformers can be cooled by a variety of methods. The oil-natural air-natural (ONAN) method dissipates heated oil naturally into the surrounding air without relying on forced cooling mechanisms. In contrast, the oil-natural air-forced (ONAF) method uses external fans. In the oil-forced air-forced (OFAF) method, external pumps and fans facilitate both oil and air circulation [9].
- B.
- MONITORING OF COOLING SYSTEMS
Monitoring and detecting malfunctions in cooling systems is critical for preventing transformer overheating. Various studies have been conducted to monitor the cooling system conditions of transformers. Offline and online methods are typically used to assess the condition of the cooling system of transformers [10].
- 1)
- OFFLINE AND ONLINE MONITORING
Offline methods refer to regular maintenance checks conducted periodically outside the real-time operation of the transformer. However, the cooling systems may malfunction in between maintenance periods, which can result in overheating and potential problems. Moreover, regular maintenance inspections are costly because transformers must be disconnected from the grid [11]. On the other hand, online methods can continuously monitor cooling fan conditions. Most utilities only have access to online information on whether the cooling fans are working or not. However, this method cannot detect cooling systems malfunctioning [12]. Despite their limitations, online methods have the potential for malfunctioning detection allowing for the timely detection of faults and early alerts.
- 2)
- OVERVIEW OF ONLINE COOLING SYSTEM MONITORING TECHNIQUES
A variety of online cooling system monitoring techniques have been employed across transformer types. For example, in [11], a simple online regressive monitoring algorithm was proposed, utilizing a minimal set of sensor feedback to estimate the temperature and life expectancy of ONAF transformers. The thermal modeling approach outlined in reference [13] employed ambient, top-oil, winding, and radiator temperatures as indicators for the estimation of the top-oil and radiator temperatures in oil-immersed AF transformers. Additionally, Sn2-based gas sensors were employed [14] to identify faults in oil-type transformers by analyzing characteristic gases emitted from the transformer oil. As demonstrated in [15], the internet of Things consists of a temperature acquisition module, data processing unit, transmitting module, and control module utilized for remote monitoring of traditional oil-immersed transformers, with a text message informing of any failures. In [16], a novel multi-input and multi-output polynomial neural network was proposed to classify the transformer states as normal and abnormal states based on the characteristic gases namely H2, CH4, C2H2, C2H4, and C2H6 serving as inputs.
In the existing literature, malfunction detection of cooling fans, which serve as key components in AF transformers and auxiliary equipment in oil-type transformers, has not received much attention. A novel approach to early fault detection in oil-immersed transformer fans was proposed in [17]. Based on existing top-oil temperature data, it utilized the oil exponent concept as a parameter of fan operation. A thermal model for malfunction detection in cooling fans of ONAF power transformers was presented in [18] based on monitoring the error in top-oil temperatures. An alarm signal is triggered, if the standard error exceeds a limit. [19] presented an online improved method for estimating the hot-spot temperature of ONAN transformers, when auxiliary cooling fans are employed. A novel online algorithm for fan malfunction detection in ONAF transformers integrated with renewable energy resources was proposed in [20]. This algorithm relies on detecting changes in the estimated parameters of top-oil temperature, such as oil convection, ambient temperature, and load factor.
- 3)
- AF TRANSFORMER COOLING FAN MONITORING
While various studies were conducted on the malfunction detection of cooling fans of transformers, a certain gap still remains. Many existing studies focused on online fault detection of oil-type transformer cooling fans. In such studies, the malfunctioning detection of cooling fans relies on complementary indicators, such as top-oil temperature, oil convection, dissolved gas analysis, and oil quality. However, such indicators are not applicable to AF transformers, which primarily use cooling fans as their cooling system. Therefore, an independent online monitoring method is essential for the malfunctioning detection of AF transformers ensuring reliable operation, preventing overheating, and extending transformer lifetime.
Recognizing this gap in the existing literature on cooling fan malfunction of AF transformers, this study presents an innovative acoustic-based method that utilizes audio signals from AF transformers as an effective alternative indicator. Acoustic data is non-intrusive, allowing microphones to be placed near cooling fans without requiring major modifications to existing infrastructure. It also enables real-time monitoring, providing instant alerts and minimizing latency in malfunction detection. Additionally, acoustic data collection is cost-effective and it is easy to install [21].
A simple microphone was used to collect the required data for the learning algorithms. Various data augmentation techniques were employed to increase the diversity and number of the training dataset. Random forests (RFs), a machine learning algorithm, and convolutional neural networks (CNNs), a deep learning model, were utilized to train the online models. CNNs were trained on spectrogram images derived from audio signals. This allows CNNs to automatically learn relevant features from the spectrogram representations, whereas RFs require a distinct process to extract the features from audio signals. Accordingly, different joint time-frequency feature extraction approaches were used to capture relevant acoustic characteristics from the raw audio signals. Then, a classification task was conducted to group the audio signals into normal and malfunctioning classes by using the RFs and CNNs. Hyperparameter tuning and classifier threshold optimization were utilized to enhance the learning algorithm performances. Finally, the trained learning models were evaluated with different metrics. It should be noted that the proposed methods in this study, can be applied to other types of transformers that are equipped with cooling fans.
- C.
- ONTRIBUTIONS
The main contributions of this study can be summarized as follows:
- We introduce machine and deep learning methods to address the gap in the literature regarding malfunction detection in AF transformer cooling fans.
- Acoustic data are used to detect malfunctions in transformer cooling fans. Utilizing simple microphones to collect audio signals, the study provides a novel approach to online monitoring of cooling fan conditions. This introduces alternative data types and methods that would help operational decision-making.
- We also develop a comprehensive optimization process for classifier threshold optimization to enhance the performance of the learning algorithms for fault detection in transformer cooling systems.
II. METHODOLOGY
This section outlines the techniques employed for malfunction detection in AF transformer cooling fans.
- A.
- DATA COLLECTION AND PREPROCESSING
In this study, a dataset of 300 recorded voices from an AF transformer cooling fan was collected. The audio signals had a sample rate of 44100 per second and a length of 225792 samples resulting in an approximate duration of 5.12 seconds. These recordings were obtained from an AF transformer located in a closed room away from an urban area. The dataset consists of 200 instances recorded during the normal fan operation and 100 instances captured during the fan malfunctions at different loads and fan speeds. The recording process involved using a high-quality microphone placed close to the transformer cooling fan to capture acoustic signals accurately. The data were organized along with their corresponding labels and were divided into three subsets including training, validation, and test. The training subset was used to train the learning models. The validation subset was used to evaluate the performance of the model during the training phase and tuning of hyperparameters. The test subset contained unseen data that the model was not exposed to them during the training or validation step.
- 1)
- DATA AUGMENTATION
Since the number of data samples was limited, the data augmentation techniques were used to artificially expand the size of the training dataset by creating additional samples as it helps mitigate the risk of overfitting and improves the generalization capability and robustness of the learning models [22]. It is essential to ensure that data augmentation does not distort the integrity of the original signals and to avoid applying data augmentation to validation and test datasets [23].
Data augmentation has a wide application in learning algorithms. In the context of deep learning, particularly in image processing, techniques such as flipping, rotation, image cropping, and shifting are widely utilized to diversify the training dataset. However, applying these traditional image-based augmentation techniques to spectrogram images derived from audio signals may substantially alter or distort their time-frequency characteristics. To address this challenge, the SpecAugment data augmentation techniques which are specifically designed for augmenting spectrograms without altering their acoustic characteristics were developed [24]. The SpecAugment methods of frequency and time masking techniques that have been shown to effectively increase the diversity of the spectrograms were employed in this study [25]. A frequency mask sets a band of frequencies as in the spectrogram to zero, where is the consecutive frequency to be masked. Number of consecutive frequencies of was set from the uniform distribution , where F is a frequency mask parameter. Besides, was adjusted from the interval , where is the number of frequency channels. This simulates the effect of removing a certain range of frequencies from the audio signals. As a result, the model becomes more robust to missing frequency bands when trained on augmented data. Time masking involves selecting a segment of time and setting all values in the spectrogram for that segment to zero. The procedure for setting consecutive time steps to zero is similar to that for frequency masking, except instead of frequency, time is used. Consequently, the model is robust to occurrences in the real-world such as short silences or missing audio. The selection of frequency and time mask parameters are mainly arbitrary and per the recommendation of [25].
Furthermore, in this study, a range of the most common audio signal augmentation methods including time stretching, time shifting, and noise injection were utilized in order to expand the training data sets.
Time stretching involves modifying the speed of audio signals while preserving their pitch. This method could simulate variations in fan speed. By randomly adjusting the playback speed within a range from 0.8 to 1.5, we generated new audio samples that represent the fan operating at different speeds [26].
Time shifting involves moving an audio signal forward or backward in time. This technique allows us to simulate changes in the start time of the fan operation. By randomly introducing time shifts to the audio recordings, we created additional samples reflecting different instances when the cooling fan began its operation [27].
Noise injection involves adding various types and levels of noise to the audio samples to simulate real-world recording conditions. In this study, we employed two distinct noise injection methods, such as white noise and environmental noise, each serving a specific purpose. White noise is a fundamental source of randomness, characterized by equal energy distribution across all frequencies and a flat power spectral density [28]. Using this method allows us to convey the unpredictability that is present in real-world audio recordings into our audio samples. To add white noise to the cooling fan audio signals, the process involves the following steps [29]:
- Calculating the power of the original audio signal:where N is the length of the original audio signal and represents the power of the original audio signal, respectively.
- Select a random Signal-to-Noise Ratio (SNR) within a range from 7 to 20 dB [30].
- Calculating of the desired noise power:where indicates the desired noise power.
- Generating white noise by sampling from a normal distribution with mean 0 and standard deviation of 1.
- Scaling the white noise to match the desired noise power:where ,, and indicates scale factor, variance of the white noise, and scaled white noise, respectively.
- Adding the scaled white noise to the original audio signal:where is the injected audio signal with the white noise.
Environmental noise includes various background sounds and disturbances that are typically present in a specific setting. This study incorporated a range of environmental noise sources, including thunder, rain, wind, and ambient noise. The processes for adding environmental noise to cooling fan audio signals are the same as for adding white noise. To simulate the conditions more realistically, we have used a range of different SNRs from 1 to 40 dB to account for variability and fluctuation in environmental noises [31].
Audio augmentation techniques can be applied parallelly and sequentially. In parallel augmentation, multiple augmentation techniques are applied simultaneously to the audio data. It is particularly useful to generate a diverse set of augmented data. Whereas sequential augmentation is applied one after another. This approach can be beneficial when there is a need to expand a limited dataset by generating additional samples. In this study, both parallel and sequential data augmentation approaches were utilized to take advantage of the benefits associated with them.
- B.
- FEATURE EXTRACTION AND SPECTROGRAM REPRESENTATION
Since the recorded audio data were in the form of signals and thus not suitable for learning algorithms, they needed to be converted into an appropriate format. Accordingly, feature extraction techniques were utilized in RFs and CNNs leverage spectrogram representation.
- 1)
- FEATURE EXTRACTION TECHNIQUES
Feature extraction is a crucial step for detecting malfunctions from the signals because the training and testing of RF algorithms highly depend on the features used to develop them [32]. This is achieved through feature extraction, which transforms the audio signals into representative features. This study employed various joint time-frequency feature extraction methods to derive meaningful representations from audio signals. To calculate time-frequency domain features from a signal, audio signals were divided into smaller windows or segments. For each window, the time and frequency features were calculated. Besides, the next window should overlap with the previous window to prevent loss of information at the window edges. Choosing the window length and overlapping time are mainly arbitrary and per the recommendation of [33].
We employed the following time-domain feature extraction methods that are effective in identifying the dominant features of the audio signals [34]:
- RMS quantifies the amplitude of a signal over a certain time period and represents the overall energy of the signal as follows:where K is the number of samples in a window.
- ZCR counts how many times the signal crosses the zero-amplitude line as follows:
-
Kurtosis factor quantifies the extent to which a distribution is heavy-tailed or light-tailed relative to a normal distribution and could be expressed as follows:A positive kurtosis suggests heavier tails, a negative kurtosis suggests lighter tails and a kurtosis of 0 indicates normal tails.
- The shape factor provides insight into the duration and relative proportions of the positive and negative peaks in a signal amplitude by describing its shape or waveform as follows:
- The crest factor measures the ratio between the peak amplitude and RMS as follows:
- The impulse factor is used to characterize the impulsiveness or transient nature of a signal. It provides information about sudden changes or impulses within a signal and could be expressed as follows:
- Besides, statistical measures such as the mean, variance, minimum, and maximum of signals were calculated for each window.
To calculate the frequency-domain features, the signals were transformed from the time domain to the frequency domain using the Fast Fourier Transform (FFT) as follows [36]:
where is the frequency domain of .
After this transformation, the following frequency-domain feature extraction methods that have demonstrated great capability in capturing information about the energy distribution of audio signals were employed [35]:
- Spectral centroid calculates the location of the mass center of a spectrum providing an estimate of the dominant frequency in the signal and could be expressed as follows [36]:Where, is the frequency of bin i in the FFT of the window.
- The Spectral bandwidth is the standard deviation of the distribution of spectral components around the spectral centroid as follows [37]:
- Spectral flatness measures the uniformity of the power spectrums of a signal in the frequency distribution. Mathematically, spectral flatness is the ratio of the geometric mean to the arithmetic mean of the power spectrums [38]:
- Spectral flux represents the rate of change in the spectral content of a signal providing information about how quickly the frequency energy distribution of the signals change. The spectral flux is the 2-norm of the difference between the magnitude spectra of consecutive frames [39].
- Peak frequency can be determined by identifying the frequency value associated with the maximum power in the signals [40].
Feature extraction was performed over short segments of the audio signals. Therefore, each feature extraction technique generated a vector of features where each value corresponds to a specific window in an audio signal. These vectors represent the time and frequency characteristics of an audio signal. It should be noted that using multiple and various feature extraction techniques helps to capture various aspects and characteristics of the audio signal, which can improve the performance, robustness, and accuracy of the learning algorithms.
- 2)
- SPECTROGRAM REPRESENTATION TECHNIQUE
Inputs to CNN algorithms typically consist of multi-dimensional arrays of pixel values that encode visual information. Since CNN models have been extensively developed and trained on image datasets, using image representations allows to leverage predefined deep learning models that have demonstrated success in various computer vision tasks [41]. To leverage the power of deep learning models for audio processing, a common practice is to convert audio signals into spectrogram image representations [24]. By employing this technique, the temporal evolution of audio signals can be transformed into a multi-dimensional visual representation. This transformation enables CNN models to extract meaningful audio features and learn complex patterns from spectrograms. Accordingly, in this study, the spectrogram technique was utilized to develop the CNN classification model. Spectrograms were generated from audio signals as follows [42]:
- Using a windowing technique, audio signals were divided into short overlapping segments.
- FFT was applied to each segment to transform the audio signal from the time domain to the frequency domain.
- The power spectrum was calculated by taking the squared magnitude of the Fourier transform.
- By plotting the power spectrum values as a heat map or a grayscale image, the spectrograms are created. The X-axis represents time, the Y-axis indicates frequency, and the intensity or color of each pixel indicates the magnitude or power of the corresponding frequency component.
One significant advantage of using spectrogram representations over feature extraction techniques in audio processing is the ability to apply SpecAugment techniques to the training spectrogram samples. In other words, frequency and time masking techniques were applied to the spectrograms in addition to time shifting, time stretching, and noise injection techniques that had been applied to the original training audio signals.
- C.
- DATA NORMALIZATION TECHNIQUES
Another technique that can improve learning models is data scaling or normalization [43]. The purpose of the rescaling is to normalize the values of spectrograms and extracted features so that they fall within a specific range. In this study, the normalization scaled the data values to the range of [0, 1]. By scaling, the model can learn more effectively and converge faster [44].
- D.
- LEARNING ALGORITHMS
After the preprocessing techniques and preparing the audio signal to the suitable formats, the data can be fed into learning algorithms. Recently, deep learning models have attracted scholar attention due to their ability to achieve high accuracy and extract features from data automatically [45]. However, one of the complexities associated with deep learning models is their interpretability and explainability [46]. Deep learning models operate as black boxes, meaning it is challenging to understand the underlying patterns. On the other hand, machine learning models like the RF algorithms provide a transparent and interpretable framework for analyzing the features. Additionally, RFs are well-suited for this study because they are less prone to overfitting due to imbalanced data, especially when the dataset size is not large enough to mitigate this risk [47]. Therefore, we employed two powerful learning approaches, namely CNNs and RFs to achieve both high accuracy and feature extraction explanations.
- E.
- EVALUATION METRICS
To evaluate the performance of the fitted RFs and CNNs for the detection of cooling fan malfunctions, we employed the following key evaluation metrics [48]:
- Accuracy: it measures the overall correctness of the model predictions. It calculates the ratio of correctly classified samples to the total number of samples.
- Recall: it measures the ability of the models to correctly identify all instances of cooling fan malfunctions, providing insights into their capacity to minimize cases where malfunctioning cooling fans are not detected.
- F1 score: It balances the trade-off between the ability to correctly classify malfunctioning predictions and recall the ability to capture all malfunctioning instances.
- F.
- TECHNIQUES TO IMPROVE LEARNING MODELS
This section outlines methods for improving the performance of learning models, including hyperparameter tuning, learning curve analysis, and classifier boundary threshold adjustment.
- 1)
- HYPERPARAMETER TUNING
Unlike the learning model parameters, which are set during training, hyperparameters are the parameters of learning algorithms that should be tuned before training. Since the performance of learning models highly depends on the hyperparameters of the model, tuning the hyperparameters is a crucial step in learning algorithms. In this study, Bayesian optimization, a probabilistic model-based optimization technique was employed to find the optimal set of hyperparameters. This systematic approach involves several key steps [49]. First, we defined a search space encompassing the hyperparameters relevant to the learning models. Then, we selected accuracy as the objective function to quantify the performance of these models. Bayesian optimization began with initial random evaluations of this objective function to build an initial surrogate model. This surrogate model approximated the true objective function and guided the selection of hyperparameters to evaluate next, using an acquisition function that balanced exploration and exploitation. The process iteratively refined the surrogate model, optimizing the acquisition function until a predefined convergence criterion was met. Ultimately, Bayesian optimization provided us with the optimal set of hyperparameters, which we used to train the learning models.
- 2)
- LEARNING CURVE
To ensure the learning models were trained effectively on the dataset, a comprehensive learning curve analysis was conducted on the training and validation datasets. It helps to identify underfitting, which occurs when the learning models are too simple to capture the underlying patterns within the data, and overfitting, which occurs when the models are overly complex and essentially memorize the training data instead of generalizing from it. In addition, it provides insight into whether or not more training data should be acquired, or regularization techniques should be employed to enhance the performance of the models.
To construct the learning curves for RFs, we trained the RFs initially with a single audio signal and subsequently evaluated them on the validation data. The training sample size was incrementally increased to cover the entire training dataset. For each training sample size, the learning curve was created by plotting the accuracy of both the training and validation data. However, in CNNs, the learning curve demonstrates how the loss of the model changes with respect to the number of epochs or iterations. An optimal learning curve is characterized by a small gap between the training and validation curves, indicating good generalization. Additionally, when both curves stabilize at a low loss (for CNNs) or high accuracy (for RFs), it suggests that learning algorithms perform well on the dataset. Such trends indicate that the models are generalizing effectively and adding further training data may not yield significant improvements. Conversely, if these characteristics are not observed in the learning curves, it is an indication that the model performance may be suboptimal and require further adjustment [50].
- 3)
- ADJUSTING THE CLASSIFICATION THRESHOLD
In addition to hyperparameters that considerably impact the learning classifier algorithms, the decision boundary for classifying samples must be optimized. The decision boundary for classifying samples into normal or malfunctioning classes in the learning algorithms is typically set at a threshold of 0.5 by default. In other words, if the probability of a sample belonging to the normal class is greater than or equal to 0.5, it is classified as normal; otherwise, it will be classified as malfunctioning. However, the default threshold of 0.5 may not be optimal. To determine the optimal threshold, the receiver operating characteristic (ROC) curve was used. ROC curves are graphical representations of the performance of a learning classifier across various thresholds. The Y-axis represents the true positive rate (TPR) and the X-axis represents the false positive rate (FPR). The TPR and FPR can be expressed as follows:
where TP and TN are the numbers of correctly classified normal and malfunctioning cases, whereas FP and FN are the counts of incorrectly classified malfunctioning and normal cases, respectively. The top-left corner of the ROC plot denotes the ideal point where the TPR is 1 and the FPR is 0. So, the optimal threshold is the point closest to the top-left corner of the plot [51].
- G.
- FEATURE IMPORTANCE
RFs offer a transparent and interpretable framework for feature analysis. They create a hierarchical structure of decision rules that can be easily visualized and understood. In an RF model, nodes and branches represent specific features and their corresponding thresholds, enabling a clear interpretation of the model decision-making process. To leverage RF capability to analyze features and enhance interpretability, we utilized the SHapley Additive exPlanations (SHAP) method [52]. SHAP values quantify the importance and contribution of the extracted time-frequency features to identify which acoustic features or characteristics of the cooling fan sounds are most influential in determining whether a malfunction is present.
Besides, the organizational flowchart of the simulation procedure in this study is shown in Figure 1.
III. RESULTS AND DISCUSSION
- A.
- DATA PREPROCESSING AND AUGMENTATION
In this study, time stretching, time shifting and noise injection data augmentation techniques were employed sequentially and parallelly to enrich the training dataset.
Time stretching was used to generate additional audio samples for both normal and malfunctioning operation of the fan sounds. By randomly adjusting the playback speed within a range from 0.8 to 1.5, we generated new audio samples with lengths ranging from 3.4 to 6.4 seconds. The size of the training dataset was further increased by shifting the original and stretched signals randomly. Besides, artificially generated and original audio signals were rendered more realistic by exposing them to white and environmental noises. In this study, we assumed that 20 percent of the training data were exposed to environmental and white noise randomly. Figure 2 and Figure 3 display the various data augmentation techniques used for a single instance of the normal and malfunctioning cooling fan operation. A stretch factor of 0.9 increased the original audio signal duration from 5.2 seconds to 5.8 seconds. This change created a slower auditory perception, simulating a cooling fan operating at a reduced speed while preserving the original pitch. Due to the use of small stretch factors, the shape of the signal was not distorted significantly, confirming the credibility of the time stretching method. Time shifting preserved amplitude, frequency content, and energy whereas displacing the signal by 0.5 seconds along the time axis to the right. Thundering noise has minimal impact on the original signal characteristics up to the 2-second. However, after this point, thundering noise significantly changed the amplitude, frequency components, and energy of the original signal, serving as a real example of how environmental factors can affect acoustic audio signals. White noise introduced fluctuations in amplitude, influenced the frequency content by spreading energy across all frequencies, and increased the overall energy of the signal resulting in variations in loudness. The combination of these data augmentation techniques significantly expanded the training dataset diversity.
- B.
- FEATURE EXTRACTION AND SPECTROGRAM REPRESENTATION
Noticeable distinctions are observed in terms of amplitude, frequency, and spectral density in Figure 2 and Figure 3. However, we explored more specific audio characteristics in the following sections to gain a deeper understanding of these differences for developing effective RF and CNN classifier models.
- 1)
- FEATURE EXTRACTION RESULTS
A comprehensive set of time and frequency features was extracted from both normal and malfunctioning AF transformer audio signals to aid learning algorithms in discriminating between the two. For example, Figure 4 presents the extracted joint time-frequency features for the original normal and malfunctioning audio signals depicted in Figure 2 and Figure 3. It seems that certain features such as ZCR, spectral centroid, and spectral bandwidth exhibit substantial differences between normal and malfunctioning audio signals. These differences indicate that normal and malfunctioning fans produce unique audio characteristics offering valuable discriminative characteristics for effectively distinguishing between the two types of signals. In malfunctioning cooling fans, high ZCR values can be attributed to abrupt changes, transient events, or irregular sound patterns. However, the spectral centroid and spectral bandwidth values are notably higher for the normal audio signals in comparison to the malfunctioning one. The difference in spectral centroid can be attributed to the fact that normal cooling fans tend to produce consistent and relatively steady sounds, which results in a higher spectral centroid. The elevated spectral bandwidth in the normal signals indicates a broader range of frequencies present in these audio samples. It is consistent with the typical behavior of healthy cooling fans, which produce sounds spanning various frequencies. In contrast, malfunctioning fans often generate audio signals with a narrower frequency range, leading to lower spectral bandwidth values. In addition, spectral flatness values are higher for normal audio indicating that normal signals have a more uniform distribution of power across the frequency spectrum. This aligns with the expected behavior of normal cooling fans, which produce audio signals with a balanced distribution of energy across different frequencies. Further, the dominance of peak frequency in normal audio signals suggests that normal cooling fans tend to produce consistent frequency peaks in their signals. It is noteworthy that the variance for normal audio signals remains relatively steady with small fluctuations whereas malfunctioning audio signals exhibit large fluctuations. Besides, the RMS and minimum values are relatively higher for malfunctioning audio signals, which may indicate more pronounced sound intensity and possible irregularities in the malfunctioning audio signal. However, for the remaining features, no significant distinction can be observed between the audio signals of cooling fans. These distinctive extracted features from the audio signals of cooling fans were used as discriminators in the classification of normal and malfunctioning AF transformer audio signals using the RFs.
- 2)
- SPECTROGRAM REPRESENTATION
To leverage the power of CNNs for AF transformer malfunctioning detection, we transformed the audio signals into spectrogram image representations. Figure 5 displays original spectrograms alongside their time-frequency masked counterparts, derived from the original normal and malfunctioning audio signals shown in Figure 2 and Figure 3. Darker shades indicate lower energy or amplitude, whereas brighter colors signify higher energy. The masked frequency and time areas appear as horizontal and vertical bands of blackness, respectively, indicating zero energy or absence of information in those specific frequency and time regions. The spectrogram of the malfunctioning audio signal exhibits a brighter area than the normal one. This suggests a higher energy or amplitude in the malfunctioning signal, indicating potential irregularities or abnormalities in the frequency distribution. Besides, in the malfunctioning audio signal, several bright frequency bands in low and high frequencies are observed, whereas only a few are seen for normal function. This indicates a significant concentration of energy at various frequencies in the normal and malfunctioning signal. These observations underscore the distinctions within the spectrograms, indicating their potential as effective discriminators for classifying normal and malfunctioning audio signals in AF transformer cooling fans using CNNs.
- C.
- CNN CLASSIFICATION
A CNN classification algorithm was developed in this study to classify the spectrograms into normal and malfunctioning classes. The image pixels were normalized into values between 0 and 1 to achieve better convergence rates during training. Then, the CNN model was developed with multiple layers, including convolutional layers for feature extraction and max-pooling layers for dimensionality reduction. Besides, batch normalization and dropout layers were implemented to improve model generalization ability and prevent overfitting. The optimal hyperparameters of the fitted CNN by using Bayesian optimization are given in Table I.

TABLE I.
Optimal hyperparameters of the fitted CNN.
| Hyperparameters | Values |
| Number of convolutional layers | 3 |
| Number of dense layers | 2 (fully connected) |
| Kernel size of the first layers | 3×3 |
| Number of neurons in the first dense layer | 256 |
| Number of neurons in the second dense layer | 8 |
| Activation function of the layers | Relue and sigmoid |
| Pooling size after the first layer | 2×2 |
| Pooling size after the second layer | 2×2 |
| Dropout rate | 0.5 |
| Batch size | 32 |
| Loss function | Categorical cross-entropy |
| Learning rate | 0.001 |
| Learning rule | Adam |
- 1)
- CNN LEARNING CURVE ANALYSIS
Figure 6 demonstrates the learning curve of the trained CNN by using the loss of the training and validation datasets. Initial training and validation losses are relatively high. This indicates that the model started with a high error rate, which is expected as the model was initialized with random weights. The training losses decreased as the epochs increased and converged to a stable point indicating that the CNN learned to fit the training datasets. A similar trend is observed in the validation set indicating that the model was generalizing well to validation data but shows some fluctuations. These fluctuations may be due to the model facing new patterns in the validation set that it had not encountered during training. Both the training and validation curves converged after epochs around 20 and beyond this point, both losses fluctuate slightly but stay relatively constant. Accordingly, further adding more training data is unlikely to yield significant improvements. In addition, the gap between the training and validation loss is very low representing that the fitted CNN does not suffer from overfitting or underfitting. Consequently, the fitted CNN performs well and is able to capture the underlying patterns of the audio signals.
- 2)
- CNN OPTIMAL CLASSIFIER THRESHOLD ANALYSIS
Besides, the CNN model was executed multiple times with various thresholds, and in each iteration, the FPR and TPR were calculated. The resulting ROC curve is depicted in Figure 7. The diagonal line serves as a baseline and denotes a random classifier that has no discriminative ability between the normal and malfunctioning classes. ROC curves represent CNN performance at various thresholds. This curve is above the diagonal line indicating the CNN ability to distinguish between the normal and malfunctioning classes. The closest point to the top-left corner of the ROC plot occurs at a TPR of 0.96 and an FPR of 0.06. This point suggests that the model correctly identifies 96% of the actual normal audio signals and only 6% of the malfunctioning signals are incorrectly classified as normal, which is relatively low. The high TPR of 0.96 means the superior ability of the CNNs to detect the normal class. The low FPR of 0.06 implies that the model has low false alarms and rarely misclassifies malfunctioning instances as normal. This is crucial in operational settings to avoid unnecessary maintenance or inspections. This optimal point corresponds to a classification threshold of 0.44. That means CNNs classify instances as normal if the probability of them being normal is greater than or equal to 0.44; Otherwise, they are classified as malfunctioning.
To evaluate the impact of the optimal threshold, Table II presents the performance metrics of the CNN model using both the optimal threshold of 0.44 and the default threshold of 0.5. The optimal threshold of 0.44 results in superior performance to the commonly used threshold of 0.5 across all metrics. These results underscore the importance of optimizing the classification threshold when developing the learning models.
Based on the evaluation of the CNN model using the optimal threshold of 0.44, high values of F1 score, accuracy, and recall for both the test and training datasets exhibit the robust performance of the CNN to classify the cooling fan normal and malfunction operation. Model accuracy on unseen data is remarkably high at 97%, indicating that CNN is able to classify 97% of the audio signals in the test dataset correctly. A recall of 0.96 on the test set means that the CNN model correctly identified 96% of the actual normal cooling fan instances. Besides, an F1 Score of 0.98 indicates that the model effectively identified normal and malfunctioning cooling fan states, with very few classification errors. As a result of the fitted CNN on the entire training sample size, the model can be trusted in real-world applications where accurate classification of cooling fan operational states (evidenced by the high accuracy), identifying normal fans (evidenced by the high recall), and avoiding false alarms (high F1 score) are critical. Furthermore, the slight differences in performance metrics between the training and test datasets could be attributed to the extensive data augmentation applied to the training datasets. That is, the test datasets which are not subject to the same level of variability, the model could classify the data easier.
TABLE II.
CNN PERFORMANCE WITH DIFFERENT THRESHOLD.
| Threshold | Metric | Training | Test |
| 0.44 | Accuracy | 0.94 | 0.97 |
| Recall | 0.96 | 0.96 | |
| F1 score | 0.95 | 0.98 | |
| 0.5 | Accuracy | 0.89 | 0.92 |
| Recall | 0.9 | 0.89 | |
| F1 score | 0.92 | 0.94 |
- 3)
- DATA AUGMENTATION ANALYSIS
In addition, to specifically assess the impact of data augmentation techniques on model performance and their ability to capture hidden patterns in audio signals, CNNs were trained with the optimal threshold on the non-augmented data, 50%, 75%, and 100% of the entire training samples. Results using 100% of the data are those in Table II and for non-augmented data, 50%, and 75% of the training samples were provided in Table III. Model performance drops as the training sample size decreases. When only the non-augmented training data was used, performance metrics decreased noticeably. Due to the limited diversity and size of the raw dataset, the model may not be effectively trained to generalize well to unseen data. However, as the training sample size increases to 50%, 75%, and 100%, all through data augmentation techniques, model performance improves considerably. This improvement suggests that data augmentation plays a significant role in enhancing model performance and generalization ability.
The consistently high performance of the model trained on 100% of the current augmented training dataset indicates that the existing level of data augmentation is acceptable. The model has achieved strong results across multiple evaluation metrics. This indicates that the model has effectively learned the complexities of the audio signals and can be utilized for malfunction detection in AF transformers.
- 4)
- RANDOM FOREST CLASSIFICATION
In this section, the RF classifier was employed to classify the audio signals of the AF transformer. Similar to CNN, all preprocessing techniques (except for SpecAugment techniques) were utilized to prepare the samples for further analysis. To train RFs, features were extracted from a combination of time and frequency-domain methods. The Bayesian optimization was applied to find the optimal hyperparameters of the RF algorithm. Table IV provides the architecture and optimal hyperparameters of the RFs by utilizing Bayesian optimization.
TABLE III.
CNN PERFORMANCE ON VARIOUS TRAINING SAMPLE SIZES.
| Training sample size | Metric | Training | Test | |
| 75% | Accuracy | 0.90 | 0.83 | |
| Recall | 0.88 | 0.85 | ||
| F1 score | 0.92 | 0.88 | ||
| 50% | Accuracy | 0.77 | 0.73 | |
| Recall | 0.73 | 0.66 | ||
| F1 score | 0.8 | 0.79 | ||
| Non-augmented | Accuracy | 0.58 | 0.54 | |
| Recall | 0.48 | 0.42 | ||
| F1 score | 0.63 | 0.54 |
TABLE IV.
Parametric values of the random forest.
| Hyperparameters | Values |
| n_estimators | 200 |
| max_depth | 50 |
| min_samples_split | 20 |
| min_samples_leaf | 1 |
| max_features | Auto |
| min_impurity_decrease | 0.0 |
| bootstrap | True |
| class_weight | 2×2 |
| ccp_alpha | 0.0 |
| criterion | entropy |
| warm_start | True |
| Learning rate | 0.001 |
| Learning rule | Adam |
- 1)
- RF LEARNING CURVE ANALYSIS
The learning curve of the RF classifier is shown in Figure 8. The RF model exhibits perfect accuracy with a single training sample. This is expected given that the RFs have been trained on a singular data point and can predict it accurately. In contrast, validation accuracy is significantly low at this stage. When trained on just one sample, the model fails to generalize to the diverse patterns present in the validation dataset. As the training sample size increases, the RF model encounters more diverse data, making perfect accuracy harder to achieve in the training dataset. This slight reduction in training accuracy signifies the model shift from memorizing data to generalizing across varied patterns. In addition, as the training sample size increases, the validation accuracy rises, indicating that RF models can generalize and predict unseen data more accurately. However, after about 6-7 steps, both curves become fairly stable suggesting that further data may not yield significant improvements. Furthermore, the small gap between the training and validation curves indicates that the model is complex enough to capture the underlying patterns in the data. So, achieving high accuracy without overfitting or underfitting indicates that the developed RF classifier serves as a highly reliable and effective model for the malfunctioning detection of AF transformer cooling fans.
- 2)
- RF OPTIMAL CLASSIFIER THRESHOLD ANALYSIS
The next essential step is identifying the optimal threshold for RF classifiers to improve their performance. Similar to the methodology employed for the CNN, for each threshold, the corresponding FPR and TPR were calculated and presented in Figure 9. The optimal threshold for the RF classifier is determined to be 0.39, corresponding to a TPR of 0.91 and an FPR of 0.12. With a high TPR of 0.91, the model demonstrates strong capability in correctly identifying normal cooling fans. Simultaneously, the relatively low FPR of 0.12 indicates a minimized false alarm rate. The performance of the RF classifier under both optimal and default thresholds is summarized in Table V. The comparison confirms that by employing the optimal threshold of 0.39, the model yields accuracy, recall, and F1 scores better than the default threshold of 0.5. Therefore, the threshold of 0.39 makes the RF classifier more effective for detecting malfunctioning cooling fans than the default threshold of 0.5. These high levels of accuracy, F1 score, and recall indicate that the model is effective at classifying the cooling fan operational status as normal or malfunctioning.
TABLE V.
RANDOM FOREST PERFORMANCE WITH DIFFERENT THRESHOLDS.
| Threshold | Metric | Training | Test |
| 0.39 | Accuracy | 0.93 | 0.91 |
| Recall | 0.93 | 0.91 | |
| F1 score | 0.93 | 0.92 | |
| 0.5 | Accuracy | 0.89 | 0.92 |
| Recall | 0.9 | 0.89 | |
| F1 score | 0.92 | 0.94 |
- 3)
- FEATURE IMPORTANCE ANALYSIS
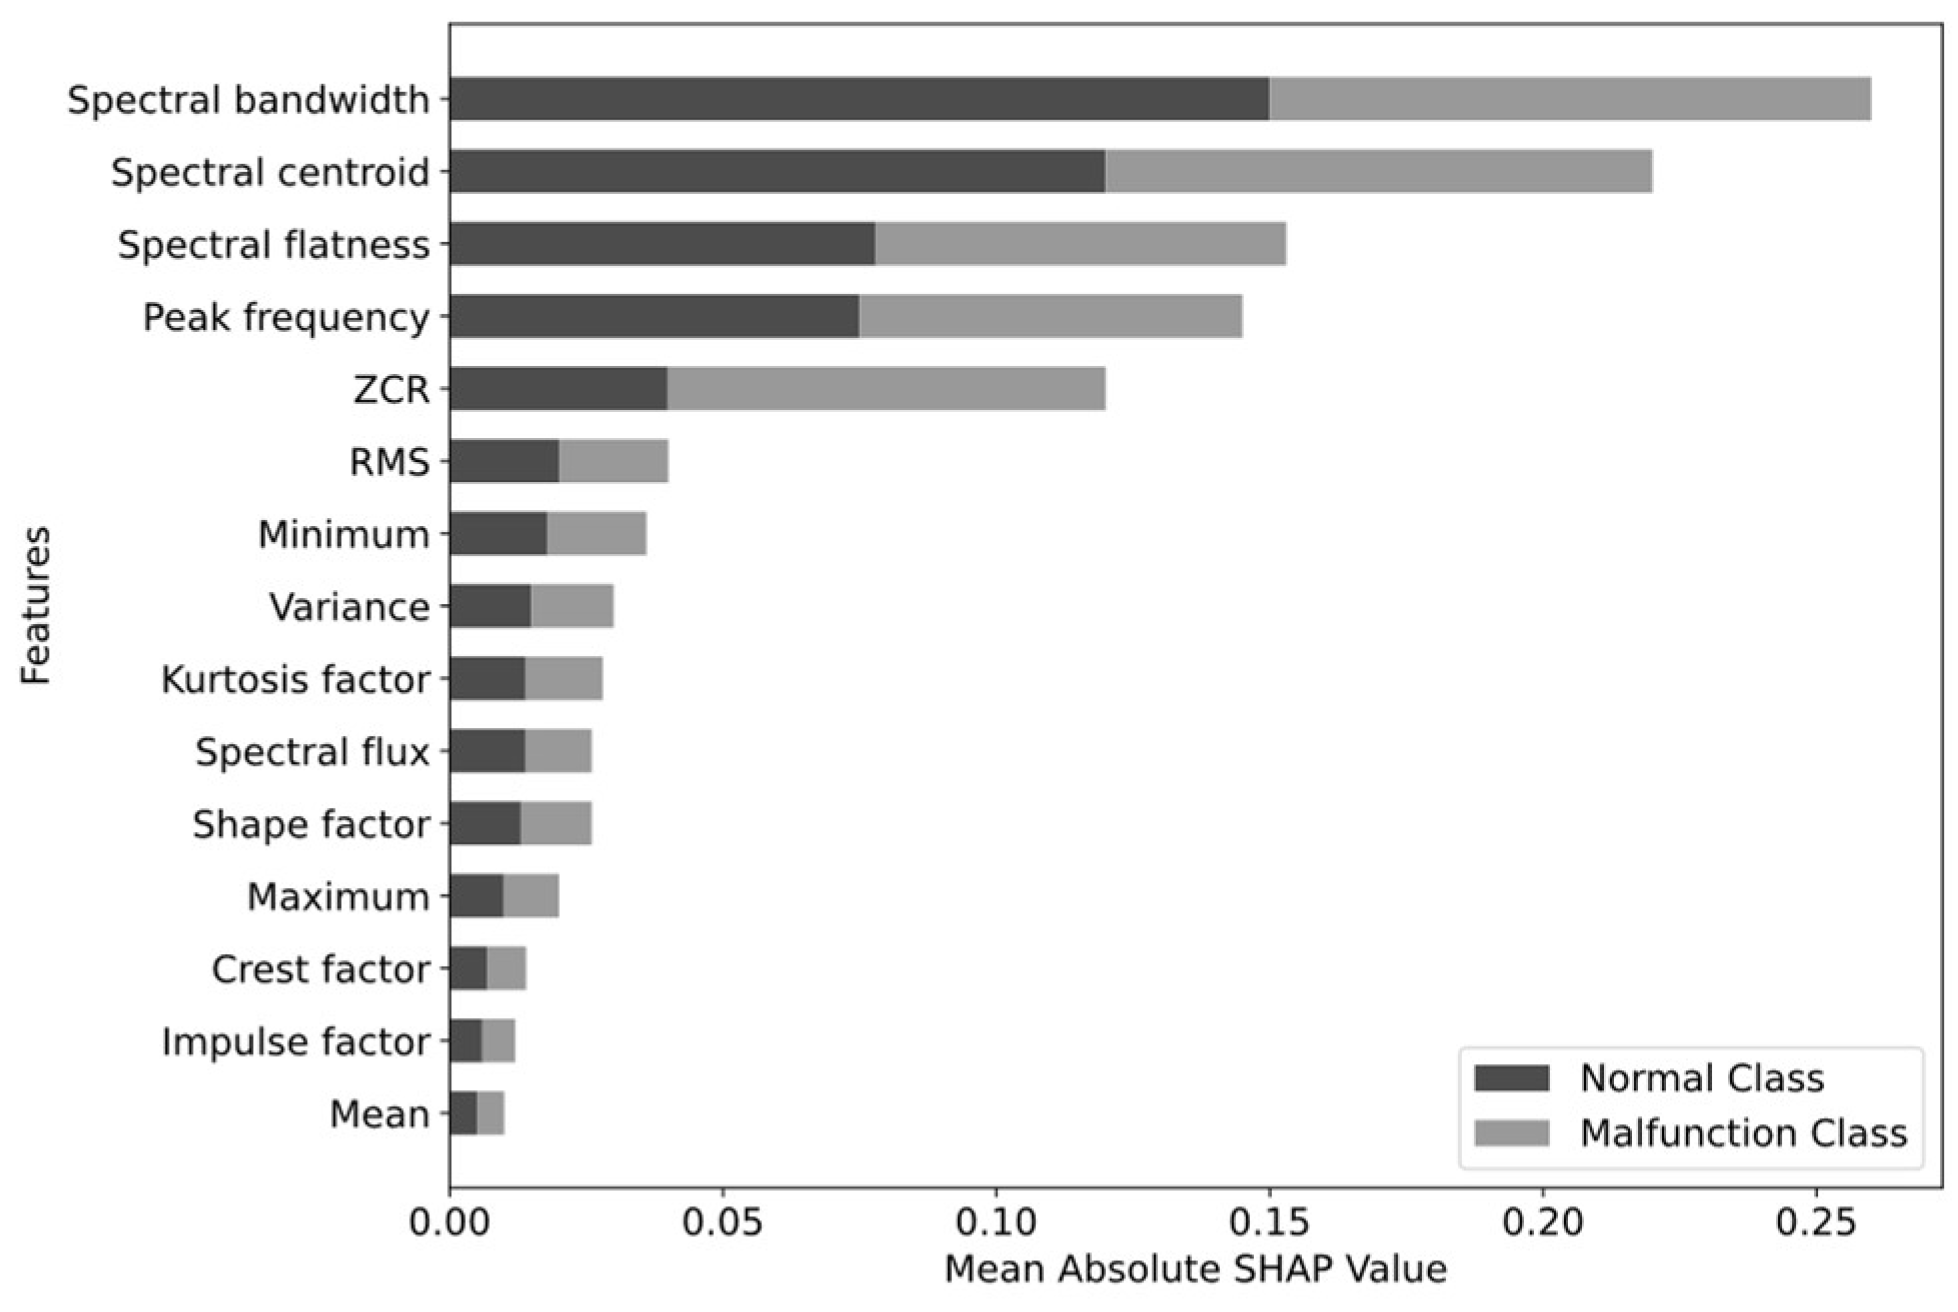
Although the RF classifier performs lower than CNNs, it offers a special advantage in feature interpretability and explainability that is rarely achievable with CNNs. Figure 10 demonstrates this capability by presenting the SHAP values, in which each feature importance was measured by its mean absolute value across all samples. Among the various time-frequency features utilized for classifying AF transformer cooling fan operating states, spectral bandwidth stands as the most significant feature. Its high importance in both classes reveals that the spread of frequencies in audio signals is a key discriminant in classifying fan operational status. Following the spectral bandwidth, the second important feature is the spectral centroid, indicating that malfunctioning fan and healthy fan audio signals have a distinct center of mass in the frequency distribution. For instance, a malfunctioning fan may produce a different whining or buzzing sound than a healthy fan, resulting in a different distribution of frequencies in the audio signals. Spectral flatness, peak frequency, and ZCR are the next significant features, with relatively the same importance values. The slightly higher SHAP value of peak frequency for normal fans compared to malfunctioning fans indicates that the dominant frequency in the audio signals of normal fans is slightly more influential in classification than the audio signals of malfunctioning fans. A high SHAP value of ZCR for malfunctioning fans compared to normal fans implies that malfunctioning cooling fans in AF transformers produce signals with more abrupt amplitude changes. However, the remaining features contribute less to the classification task. RMS, minimum, variance, Kurtosis factor, spectral flux, shape factor, and maximum have moderate or insignificant contributions. The crest factor, impulse factor, and mean have the least contribution. This means that the specific shape of the waveform, impulsiveness, and average amplitude level of the signals are not strong indicators for classifying fan statuses.
In the task of malfunction detection of AF transformer cooling fans, the CNN outperforms the RF classifier across accuracy, recall, and F1 score. This superior performance can be attributed to the following factors. First, CNNs can learn hierarchical features automatically from raw data, whereas RFs are limited by manually extracted features, potentially missing the characteristic and relevant features in the data. Secondly, the deep architecture of CNNs is capable of capturing complex, non-linear relationships, a capability that may be limited in random forests. Third, CNNs benefit from a wider range of data augmentation techniques than RFs by time and frequency masking techniques on the spectrograms. This enhances CNNs learning from a more diverse dataset.
IV. CONCLUSION
Cooling fans are the key components of AF transformers and auxiliary equipment in oil-type transformers. Failure to timely identify malfunctions in these cooling fans can lead to component decomposition, reduced lifespan, and even catastrophic failures. While existing cooling fan monitoring systems can capture overt malfunctions, they are limited to complementary indicators such as top-oil temperature, dissolved gas analysis, and oil quality. This study addressed this gap by introducing an acoustic-based online monitoring approach for malfunction detection in AF dry-type transformer cooling fans. Using a single microphone, the audio voices of the AF transformer cooling fans were collected. CNNs and RF classifiers were developed to detect the fan conditions. Since the recorded audio data was limited, various data augmentations were employed to increase the size and diversity of the datasets. Time-frequency domain feature extraction methods were used to provide input to the RF models, whereas the CNNs exploited spectrograms. Moreover, the performance of these learning algorithms was enhanced through hyperparameter tuning using Bayesian optimization and classification boundary threshold optimization using ROC methods. The simulation results revealed that the CNN classifier yielded a high accuracy of 97%, coupled with a high recall and f1 score of 0.96, and 0.98, respectively, indicating substantiating ability for early malfunction detection. Although the RF classifier presented marginally lower performance metrics, its capability in feature interpretability provided insight into the extracted features. The findings of this study suggest several areas for future research:
- Considering the extracted important features in this study, explore different feature extraction techniques to improve random forest performance.
- Investigating ensemble learning methods, including the combination of CNNs and random forest algorithms.
- Analyzing the effect of varying audio signal lengths on the detection of malfunctions.
- Evaluation of different data augmentation strategies, such as ensemble methods.
- Incorporating multi-modal sensor data, including vibration and temperature sensors, to develop a more comprehensive system.
References
- R. Abbasi, “Fault detection and diagnosis in power transformers: a comprehensive review and classification of publications and methods,” Electric Power Systems Research, vol. 209, p. 107990, Aug. 2022. [CrossRef]
- Hackl, J. Kullick, and N. Monzen, “Generic loss minimization for nonlinear synchronous machines by analytical computation of optimal reference currents considering copper and iron losses,” in 2021 22nd IEEE International Conference on Industrial Technology (ICIT), IEEE, Mar. 2021, pp. 1348–1355. [CrossRef]
- L. Raeisian, H. Niazmand, E. Ebrahimnia-Bajestan, and P. Werle, “Thermal management of a distribution transformer: An optimization study of the cooling system using CFD and response surface methodology,” International Journal of Electrical Power & Energy Systems, vol. 104, pp. 443–455, Jan. 2019. [CrossRef]
- Lei, S. Bu, Q. Wang, N. Zhou, L. Yang, and X. Xiong, “Load Transfer Optimization Considering Hot-Spot and Top-Oil Temperature Limits of Transformers,” IEEE Transactions on Power Delivery, vol. 37, no. 3, pp. 2194–2208, Jun. 2022. [CrossRef]
- H. Amiri, “Analysis and comparison of actual behavior of oil-type and dry-type transformers during lightning,” in 2021 25th Electrical Power Distribution Conference (EPDC), IEEE, Aug. 2021, pp. 1–4. [CrossRef]
- M. S. Mahdi et al., “Effect of fin geometry on natural convection heat transfer in electrical distribution transformer: Numerical study and experimental validation,” Thermal Science and Engineering Progress, vol. 14, p. 100414, Dec. 2019. [CrossRef]
- M. Ngo, Y. Cao, D. Dong, R. Burgos, K. Nguyen, and A. Ismail, “Forced Air-Cooling Thermal Design Methodology for High-Density, High-Frequency, and High-Power Planar Transformers in 1U Applications,” IEEE J Emerg Sel Top Power Electron, vol. 11, no. 2, pp. 2015–2028, Apr. 2023. [CrossRef]
- Wang et al., “A New Testing Method for the Dielectric Response of Oil-Immersed Transformer,” IEEE Transactions on Industrial Electronics, vol. 67, no. 12, pp. 10833–10843, Dec. 2020. [CrossRef]
- S. Zhao, Q. Liu, M. Wilkinson, G. Wilson, and Z. Wang, “A Reduced Radiator Model for Simplification of ONAN Transformer CFD Simulation,” IEEE Transactions on Power Delivery, vol. 37, no. 5, pp. 4007–4018, Oct. 2022. [CrossRef]
- S. Tenbohlen, S. Coenen, M. Djamali, A. Müller, M. Samimi, and M. Siegel, “Diagnostic Measurements for Power Transformers,” Energies (Basel), vol. 9, no. 5, p. 347, May 2016. [CrossRef]
- W. Zhan, A. E. Goulart, M. Falahi, and P. Rondla, “Development of a Low-Cost Self-Diagnostic Module for Oil-Immerse Forced-Air Cooling Transformers,” IEEE Transactions on Power Delivery, vol. 30, no. 1, pp. 129–137, Feb. 2015. [CrossRef]
- L. Wang, W. Zuo, Z.-X. Yang, J. Zhang, and Z. Cai, “A Method for Fans’ Potential Malfunction Detection of ONAF Transformer Using Top-Oil Temperature Monitoring,” IEEE Access, vol. 9, pp. 129881–129889, 2021. [CrossRef]
- V. Shiravand, J. Faiz, M. H. Samimi, and M. Mehrabi-Kermani, “Prediction of transformer fault in cooling system using combining advanced thermal model and thermography,” IET Generation, Transmission & Distribution, vol. 15, no. 13, pp. 1972–1983, Jul. 2021. [CrossRef]
- Q. Zhang, Q. Zhou, Z. Lu, Z. Wei, L. Xu, and Y. Gui, “Recent Advances of SnO2-Based Sensors for Detecting Fault Characteristic Gases Extracted From Power Transformer Oil,” Front Chem, vol. 6, Aug. 2018. [CrossRef]
- Xiao-hui Cheng and Yang Wang, “The remote monitoring system of transformer fault based on The internet of Things,” in Proceedings of 2011 International Conference on Computer Science and Network Technology, IEEE, Dec. 2011, pp. 84–87. [CrossRef]
- Zou, R. Deng, Q. Mei, and L. Zou, “Fault diagnosis of a transformer based on polynomial neural networks,” Cluster Comput, vol. 22, no. S4, pp. 9941–9949, Jul. 2019. [CrossRef]
- L. Wang, W. Zuo, Z.-X. Yang, J. Zhang, and Z. Cai, “A Method for Fans’ Potential Malfunction Detection of ONAF Transformer Using Top-Oil Temperature Monitoring,” IEEE Access, vol. 9, pp. 129881–129889, 2021. [CrossRef]
- M. Djamali and S. Tenbohlen, “Malfunction Detection of the Cooling System in Air-Forced Power Transformers Using Online Thermal Monitoring,” IEEE Transactions on Power Delivery, vol. 32, no. 2, pp. 1058–1067, Apr. 2017. [CrossRef]
- H. Zhang, G. Liu, B. Lin, H. Deng, Y. Li, and P. Wang, “Thermal evaluation optimization analysis for non-rated load oil-natural air-natural transformer with auxiliary cooling equipment,” IET Generation, Transmission & Distribution, vol. 16, no. 15, pp. 3080–3091, Aug. 2022. [CrossRef]
- M. Djamali and S. Tenbohlen, “A validated online algorithm for detection of fan failures in oil-immersed power transformers,” International Journal of Thermal Sciences, vol. 116, pp. 224–233, Jun. 2017. [CrossRef]
- J. Picaut, A. Can, N. Fortin, J. Ardouin, and M. Lagrange, “Low-Cost Sensors for Urban Noise Monitoring Networks—A Literature Review,” Sensors, vol. 20, no. 8, p. 2256, Apr. 2020. [CrossRef]
- P. Thanapol, K. Lavangnananda, P. Bouvry, F. Pinel, and F. Leprevost, “Reducing Overfitting and Improving Generalization in Training Convolutional Neural Network (CNN) under Limited Sample Sizes in Image Recognition,” in 2020 - 5th International Conference on Information Technology (InCIT), IEEE, Oct. 2020, pp. 300–305. [CrossRef]
- Shorten and T. M. Khoshgoftaar, “A survey on Image Data Augmentation for Deep Learning,” J Big Data, vol. 6, no. 1, p. 60, Dec. 2019. [CrossRef]
- S. Park et al., “SpecAugment: A Simple Data Augmentation Method for Automatic Speech Recognition,” in Interspeech 2019, ISCA: ISCA, Sep. 2019, pp. 2613–2617. [CrossRef]
- L. K. Shahidi, L. M. Collins, and B. O. Mainsah, “Parameter tuning of time-frequency masking algorithms for reverberant artifact removal within the cochlear implant stimulus,” Cochlear Implants Int, vol. 23, no. 6, pp. 309–316, Nov. 2022. [CrossRef]
- Abeysinghe, S. Tohmuang, J. L. Davy, and M. Fard, “Data augmentation on convolutional neural networks to classify mechanical noise,” Applied Acoustics, vol. 203, p. 109209, Feb. 2023. [CrossRef]
- Q. Wang, J. Q. Wang, J. Du, H.-X. Wu, J. Pan, F. Ma, and C.-H. Lee, “A Four-Stage Data Augmentation Approach to ResNet-Conformer Based Acoustic Modeling for Sound Event Localization and Detection,” IEEE/ACM Trans Audio Speech Lang Process, vol. 31, pp. 1251–1264, 2023. [CrossRef]
- M. Goubeaud, P. Jousen, N. Gmyrek, F. Ghorban, and A. Kummert, “White Noise Windows: Data Augmentation for Time Series,” in 2021 7th International Conference on Optimization and Applications (ICOA), IEEE, May 2021, pp. 1–5. [CrossRef]
- J. Chen, W. Yi, and D. Wang, “Filter Bank Sinc-ShallowNet with EMD-based Mixed Noise Adding Data Augmentation for Motor Imagery Classification,” in 2021 43rd Annual International Conference of the IEEE Engineering in Medicine & Biology Society (EMBC), IEEE, Nov. 2021, pp. 5837–5841. [CrossRef]
- N. Yalta, S. Watanabe, T. Hori, K. Nakadai, and T. Ogata, “CNN-based Multichannel End-to-End Speech Recognition for Everyday Home Environments,” in 2019 27th European Signal Processing Conference (EUSIPCO), IEEE, Sep. 2019, pp. 1–5. [CrossRef]
- C.-I. Lai, Y.-S. Chuang, H.-Y. Lee, S.-W. Li, and J. Glass, “Semi-Supervised Spoken Language Understanding via Self-Supervised Speech and Language Model Pretraining,” in ICASSP 2021 - 2021 IEEE International Conference on Acoustics, Speech and Signal Processing (ICASSP), IEEE, Jun. 2021, pp. 7468–7472. [CrossRef]
- S. Khalid, T. Khalil, and S. Nasreen, “A survey of feature selection and feature extraction techniques in machine learning,” in 2014 Science and Information Conference, IEEE, Aug. 2014, pp. 372–378. [CrossRef]
- K. M. M. Prabhu, Window Functions and Their Applications in Signal Processing. Boca Raton: CRC Press, 2018. [CrossRef]
- J. Chen, B. Xu, and X. Zhang, “A Vibration Feature Extraction Method Based on Time-Domain Dimensional Parameters and Mahalanobis Distance,” Math Probl Eng, vol. 2021, pp. 1–12, Jul. 2021. [CrossRef]
- G. Sharma, K. Umapathy, and S. Krishnan, “Trends in audio signal feature extraction methods,” Applied Acoustics, vol. 158, p. 107020, Jan. 2020. [CrossRef]
- S. Kavitha and J. Manikandan, “Improved Methodology of SVM to Classify Acoustic Signal by Spectral Centroid,” Journal of Trends in Computer Science and Smart Technology, vol. 3, no. 4, pp. 294–304, May 2022. [CrossRef]
- M. Lagrange and F. Gontier, “Bandwidth Extension of Musical Audio Signals With No Side Information Using Dilated Convolutional Neural Networks,” in ICASSP 2020 - 2020 IEEE International Conference on Acoustics, Speech and Signal Processing (ICASSP), IEEE, May 2020, pp. 801–805. [CrossRef]
- J. Herre, E. Allamanche, and O. Hellmuth, “Robust matching of audio signals using spectral flatness features,” in Proceedings of the 2001 IEEE Workshop on the Applications of Signal Processing to Audio and Acoustics (Cat. No.01TH8575), IEEE, 2001, pp. 127–130. [CrossRef]
- J. T. Geiger, B. Schuller, and G. Rigoll, “Large-scale audio feature extraction and SVM for acoustic scene classification,” in 2013 IEEE Workshop on Applications of Signal Processing to Audio and Acoustics, IEEE, Oct. 2013, pp. 1–4. [CrossRef]
- X. Zhang, Z. Su, P. Lin, Q. He, and J. Yang, “An audio feature extraction scheme based on spectral decomposition,” in 2014 International Conference on Audio, Language and Image Processing, IEEE, Jul. 2014, pp. 730–733. [CrossRef]
- S. Hershey et al., “CNN architectures for large-scale audio classification,” in 2017 IEEE International Conference on Acoustics, Speech and Signal Processing (ICASSP), IEEE, Mar. 2017, pp. 131–135. [CrossRef]
- M. Dorfler, R. Bammer, and T. Grill, “Inside the spectrogram: Convolutional Neural Networks in audio processing,” in 2017 International Conference on Sampling Theory and Applications (SampTA), IEEE, Jul. 2017, pp. 152–155. [CrossRef]
- R. Nematirad, A. Pahwa, B. Natarajan, and H. Wu, “Optimal sizing of photovoltaic-battery system for peak demand reduction using statistical models,” Front Energy Res, vol. 11, Dec. 2023. [CrossRef]
- M. A. Siddiqi and W. Pak, “An Agile Approach to Identify Single and Hybrid Normalization for Enhancing Machine Learning-Based Network Intrusion Detection,” IEEE Access, vol. 9, pp. 137494–137513, 2021. [CrossRef]
- R. Nematirad and A. Pahwa, “Solar Radiation Forecasting Using Artificial Neural Networks Considering Feature Selection,” in 2022 IEEE Kansas Power and Energy Conference (KPEC), IEEE, Apr. 2022, pp. 1–4. [CrossRef]
- P. Linardatos, V. Papastefanopoulos, and S. Kotsiantis, “Explainable AI: A Review of Machine Learning Interpretability Methods,” Entropy, vol. 23, no. 1, p. 18, Dec. 2020. [CrossRef]
- M. P. Neto and F. V. Paulovich, “Explainable Matrix - Visualization for Global and Local Interpretability of Random Forest Classification Ensembles,” IEEE Trans Vis Comput Graph, vol. 27, no. 2, pp. 1427–1437, Feb. 2021. [CrossRef]
- Yousaf et al., “Emotion Recognition by Textual Tweets Classification Using Voting Classifier (LR-SGD),” IEEE Access, vol. 9, pp. 6286–6295, 2021. [CrossRef]
- H. Cho, Y. Kim, E. Lee, D. Choi, Y. Lee, and W. Rhee, “Basic Enhancement Strategies When Using Bayesian Optimization for Hyperparameter Tuning of Deep Neural Networks,” IEEE Access, vol. 8, pp. 52588–52608, 2020. [CrossRef]
- J. B. Morrison, “Putting the learning curve in context,” J Bus Res, vol. 61, no. 11, pp. 1182–1190, Nov. 2008. [CrossRef]
- K. H. Zou, C.-R. Yu, K. Liu, M. O. Carlsson, and J. Cabrera, “Optimal Thresholds by Maximizing or Minimizing Various Metrics via ROC-Type Analysis,” Acad Radiol, vol. 20, no. 7, pp. 807–815, Jul. 2013. [CrossRef]
- T.-T.-H. Le, H. Kim, H. Kang, and H. Kim, “Classification and Explanation for Intrusion Detection System Based on Ensemble Trees and SHAP Method,” Sensors, vol. 22, no. 3, p. 1154, Feb. 2022. [CrossRef]
Figure 1.
Organizational flowchart of the simulation procedure in this study.
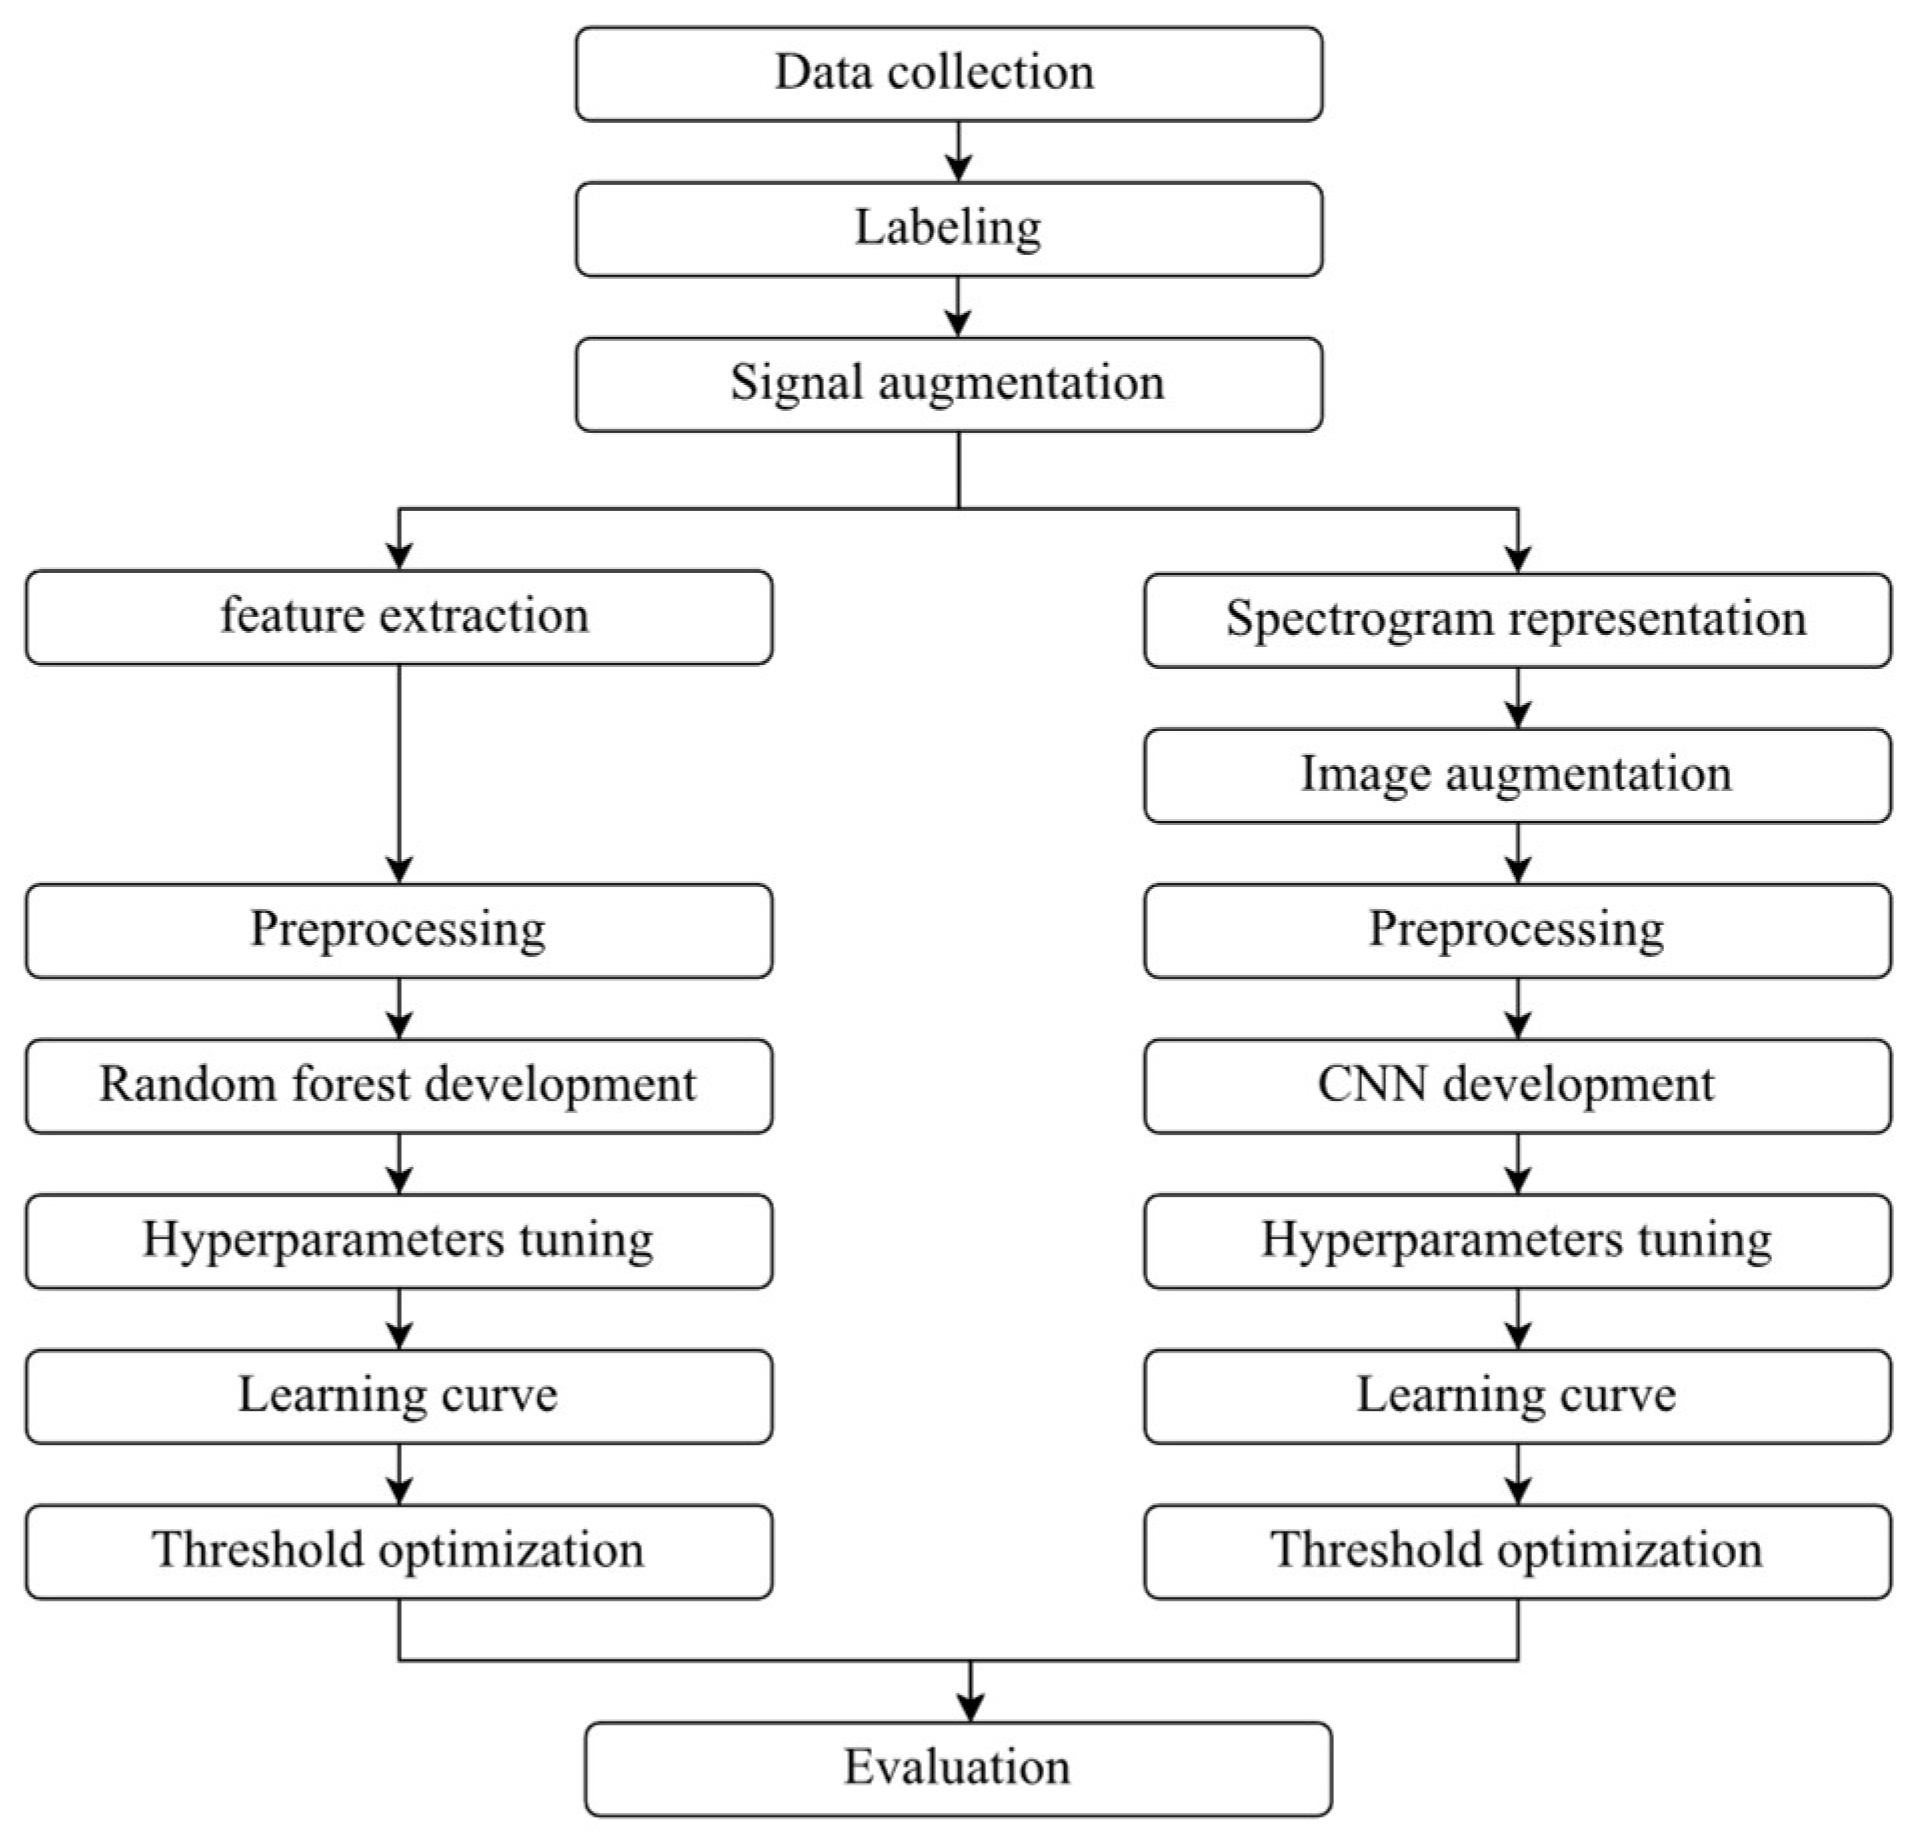
Figure 2.
Various data augmentation techniques used to a single instance of the normal cooling fan audio signal.
Figure 2.
Various data augmentation techniques used to a single instance of the normal cooling fan audio signal.

Figure 3.
Various data augmentation techniques used to a single instance of the malfunctioning cooling fan audio signal.
Figure 3.
Various data augmentation techniques used to a single instance of the malfunctioning cooling fan audio signal.
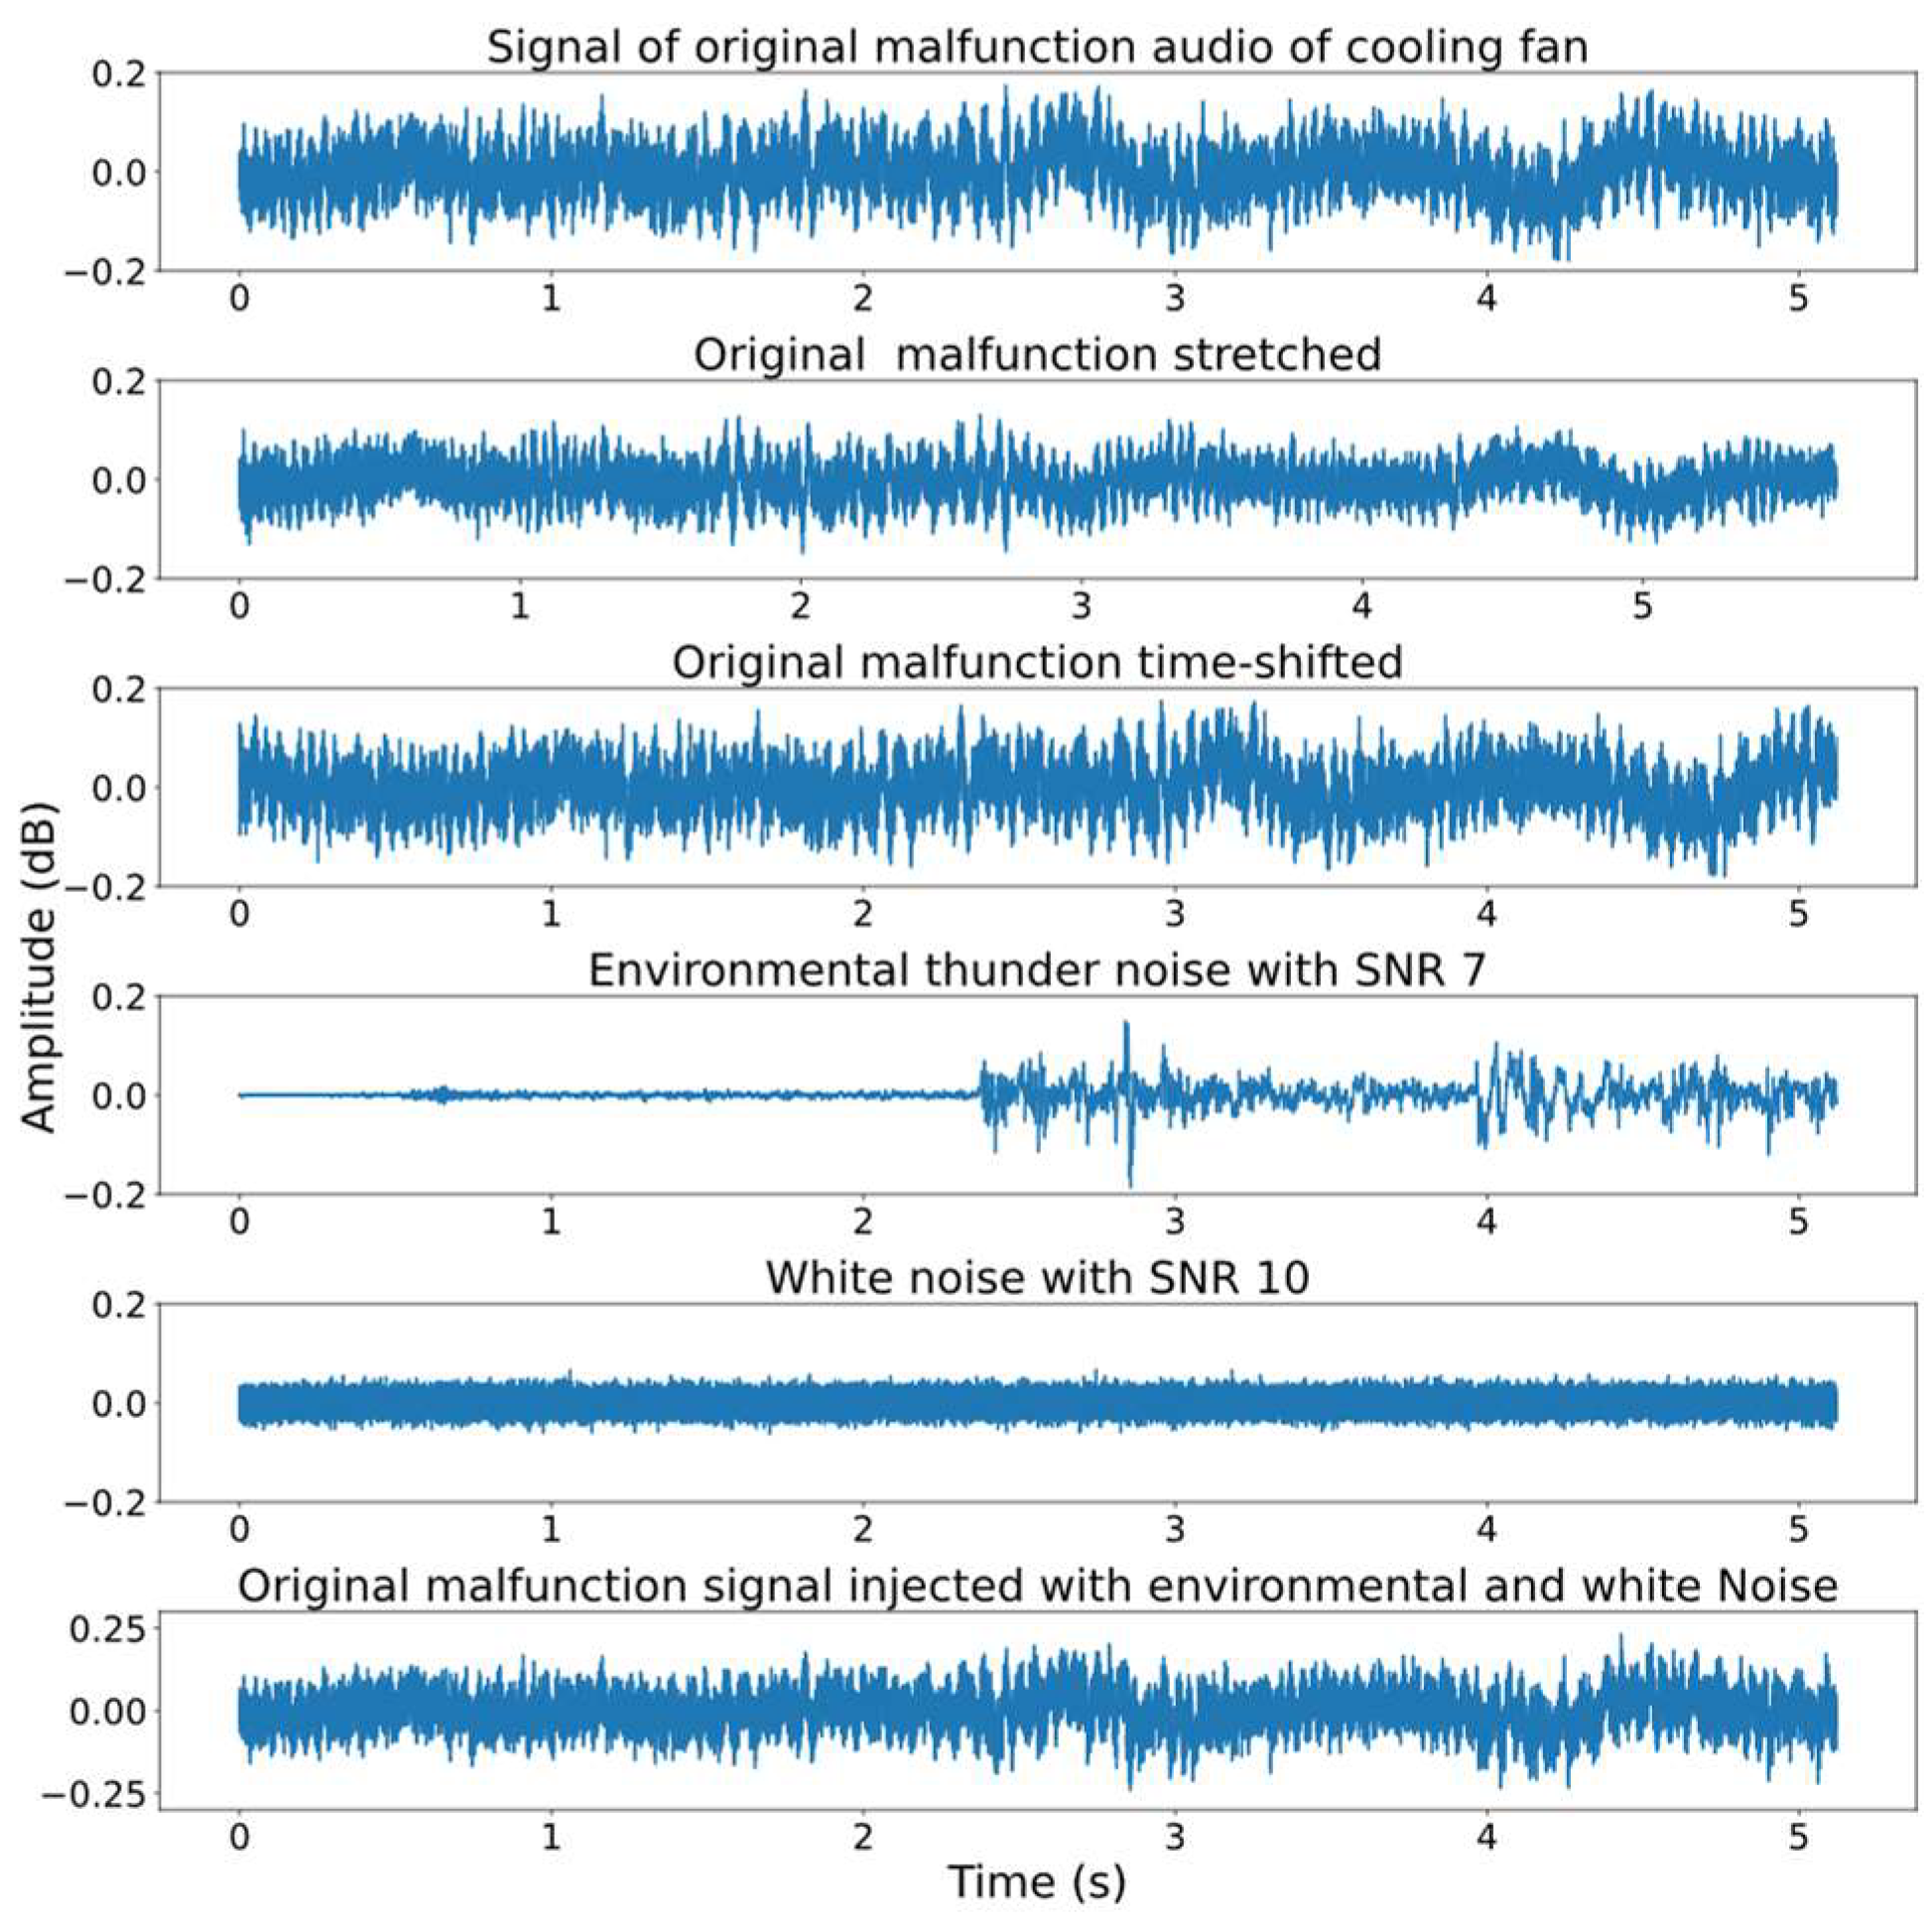
Figure 4.
Derived joint time-frequency characteristics for the original normal and malfunctioning audio signals depicted in Figure 2 and Figure 3.
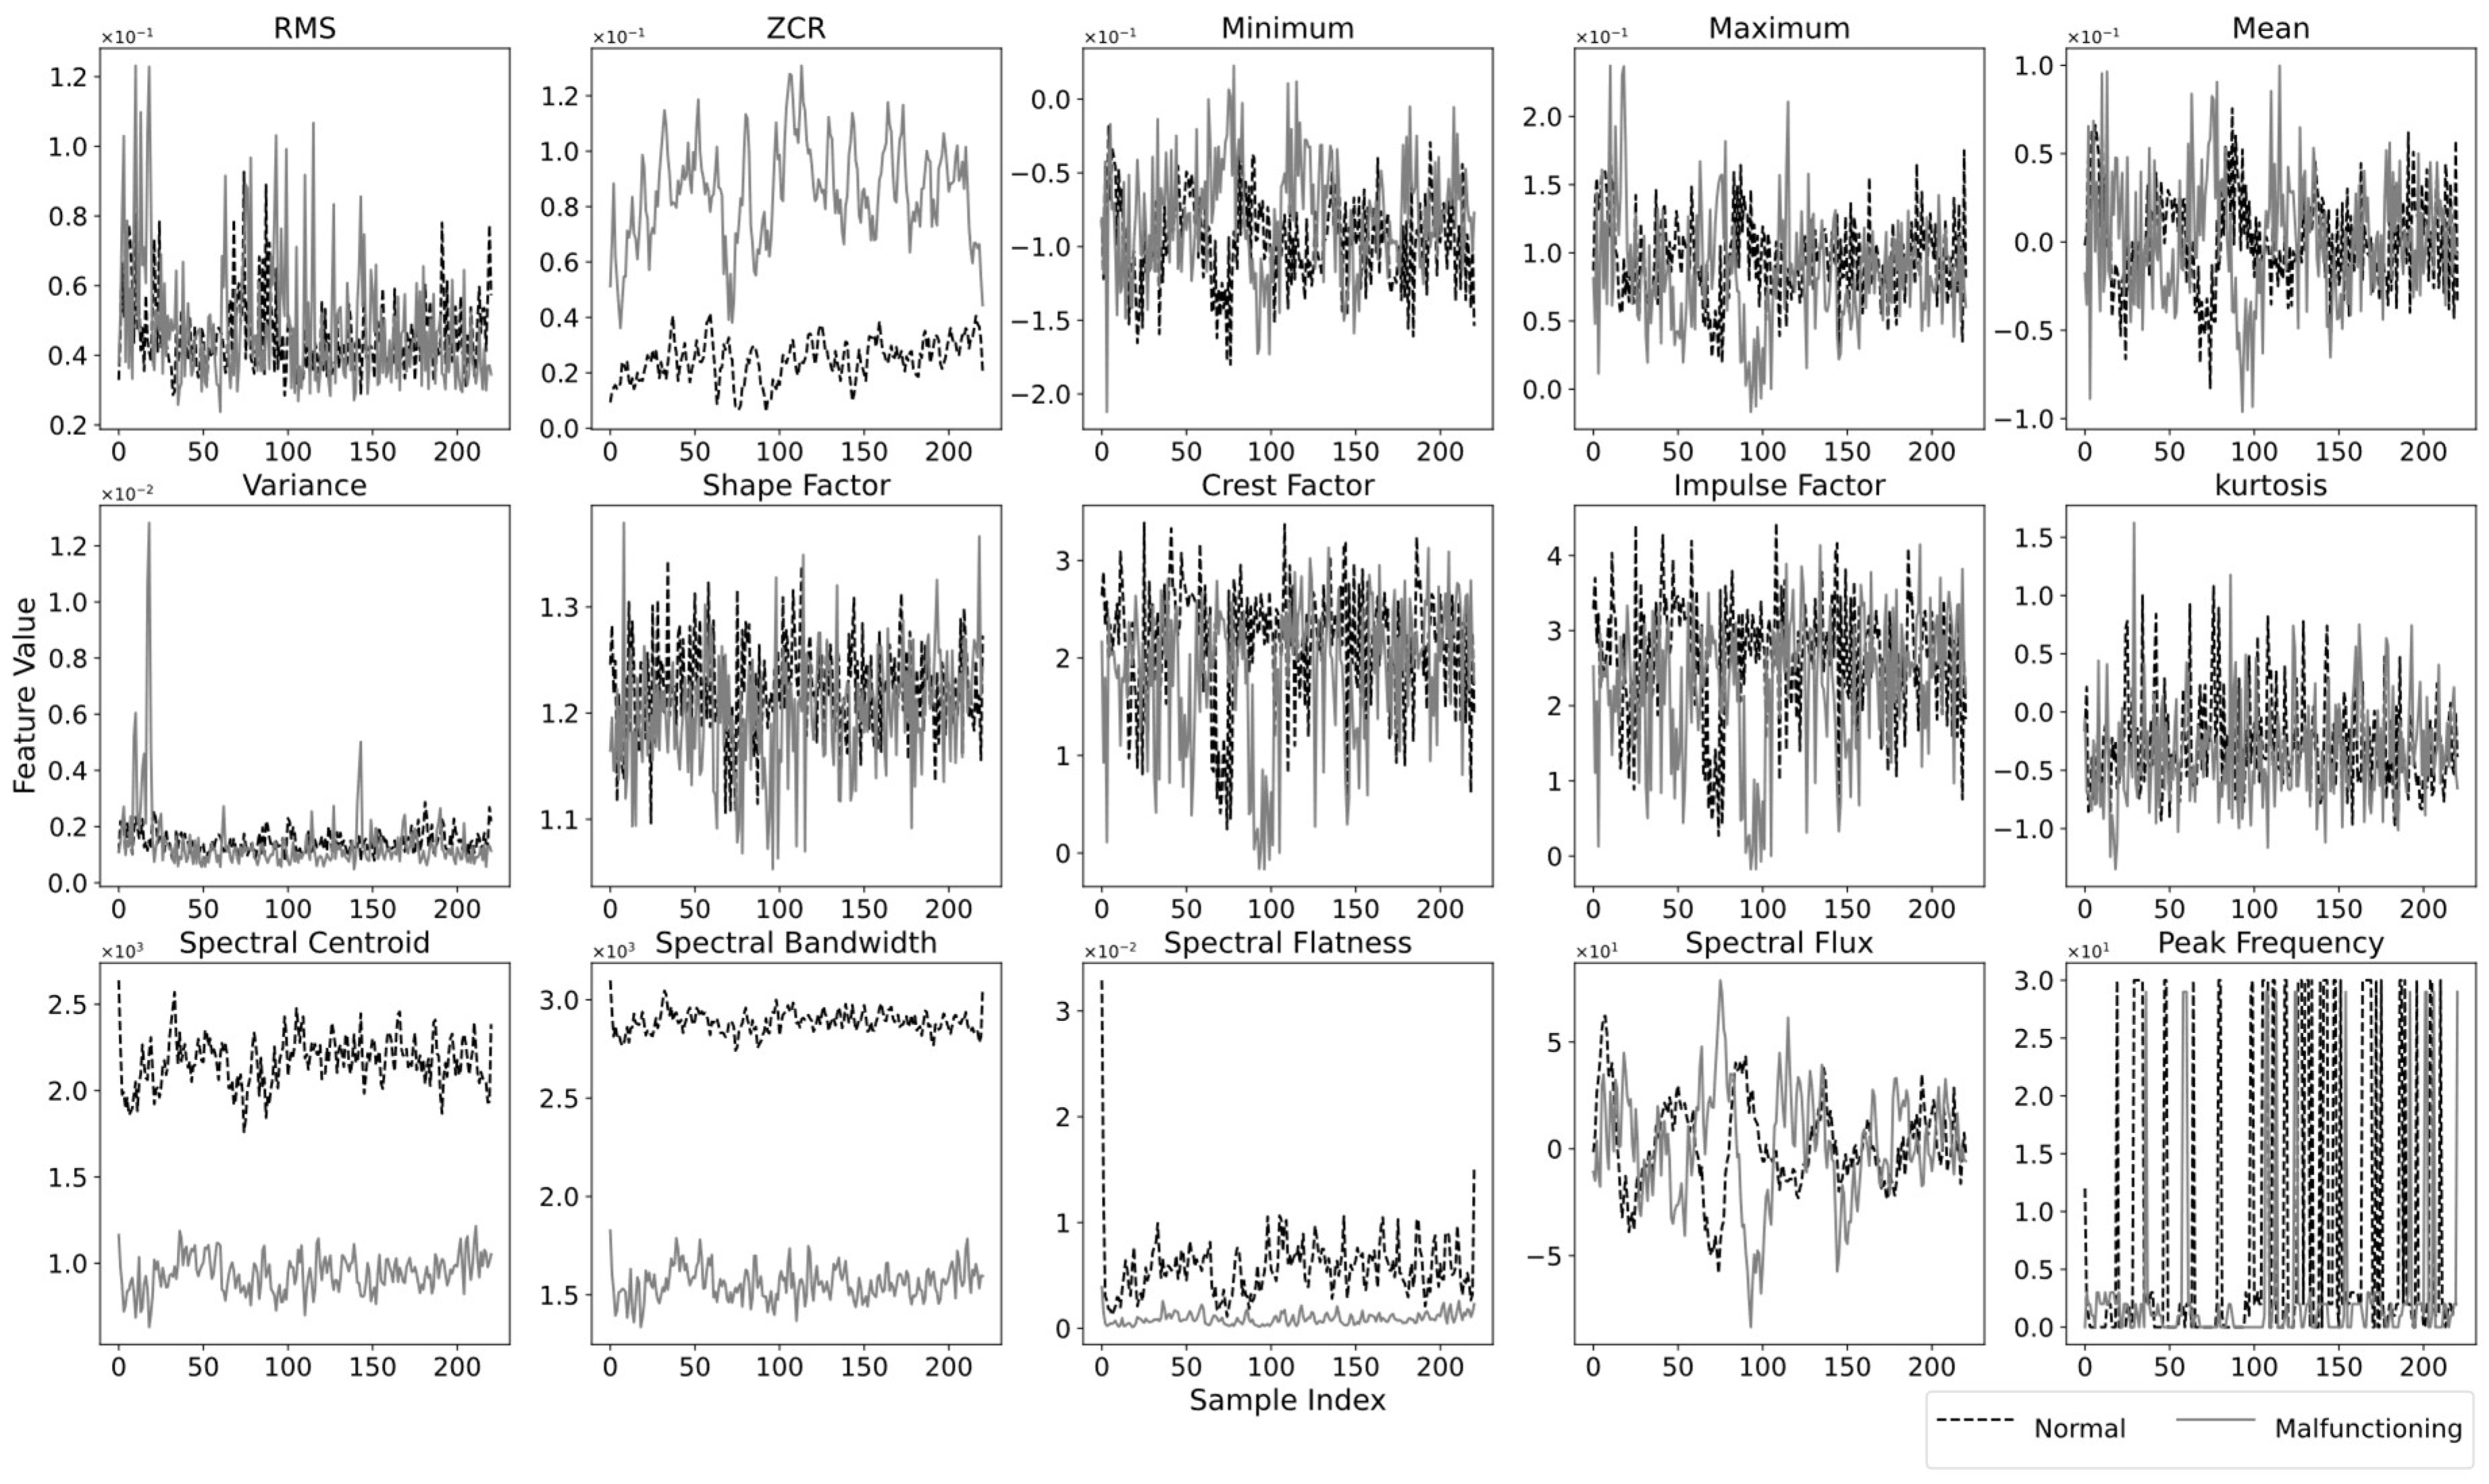
Figure 5.
Spectrogram of the original normal and malfunctioning audio signal augmented with frequency and time masking depicted in Figure 2 and Figure 3.
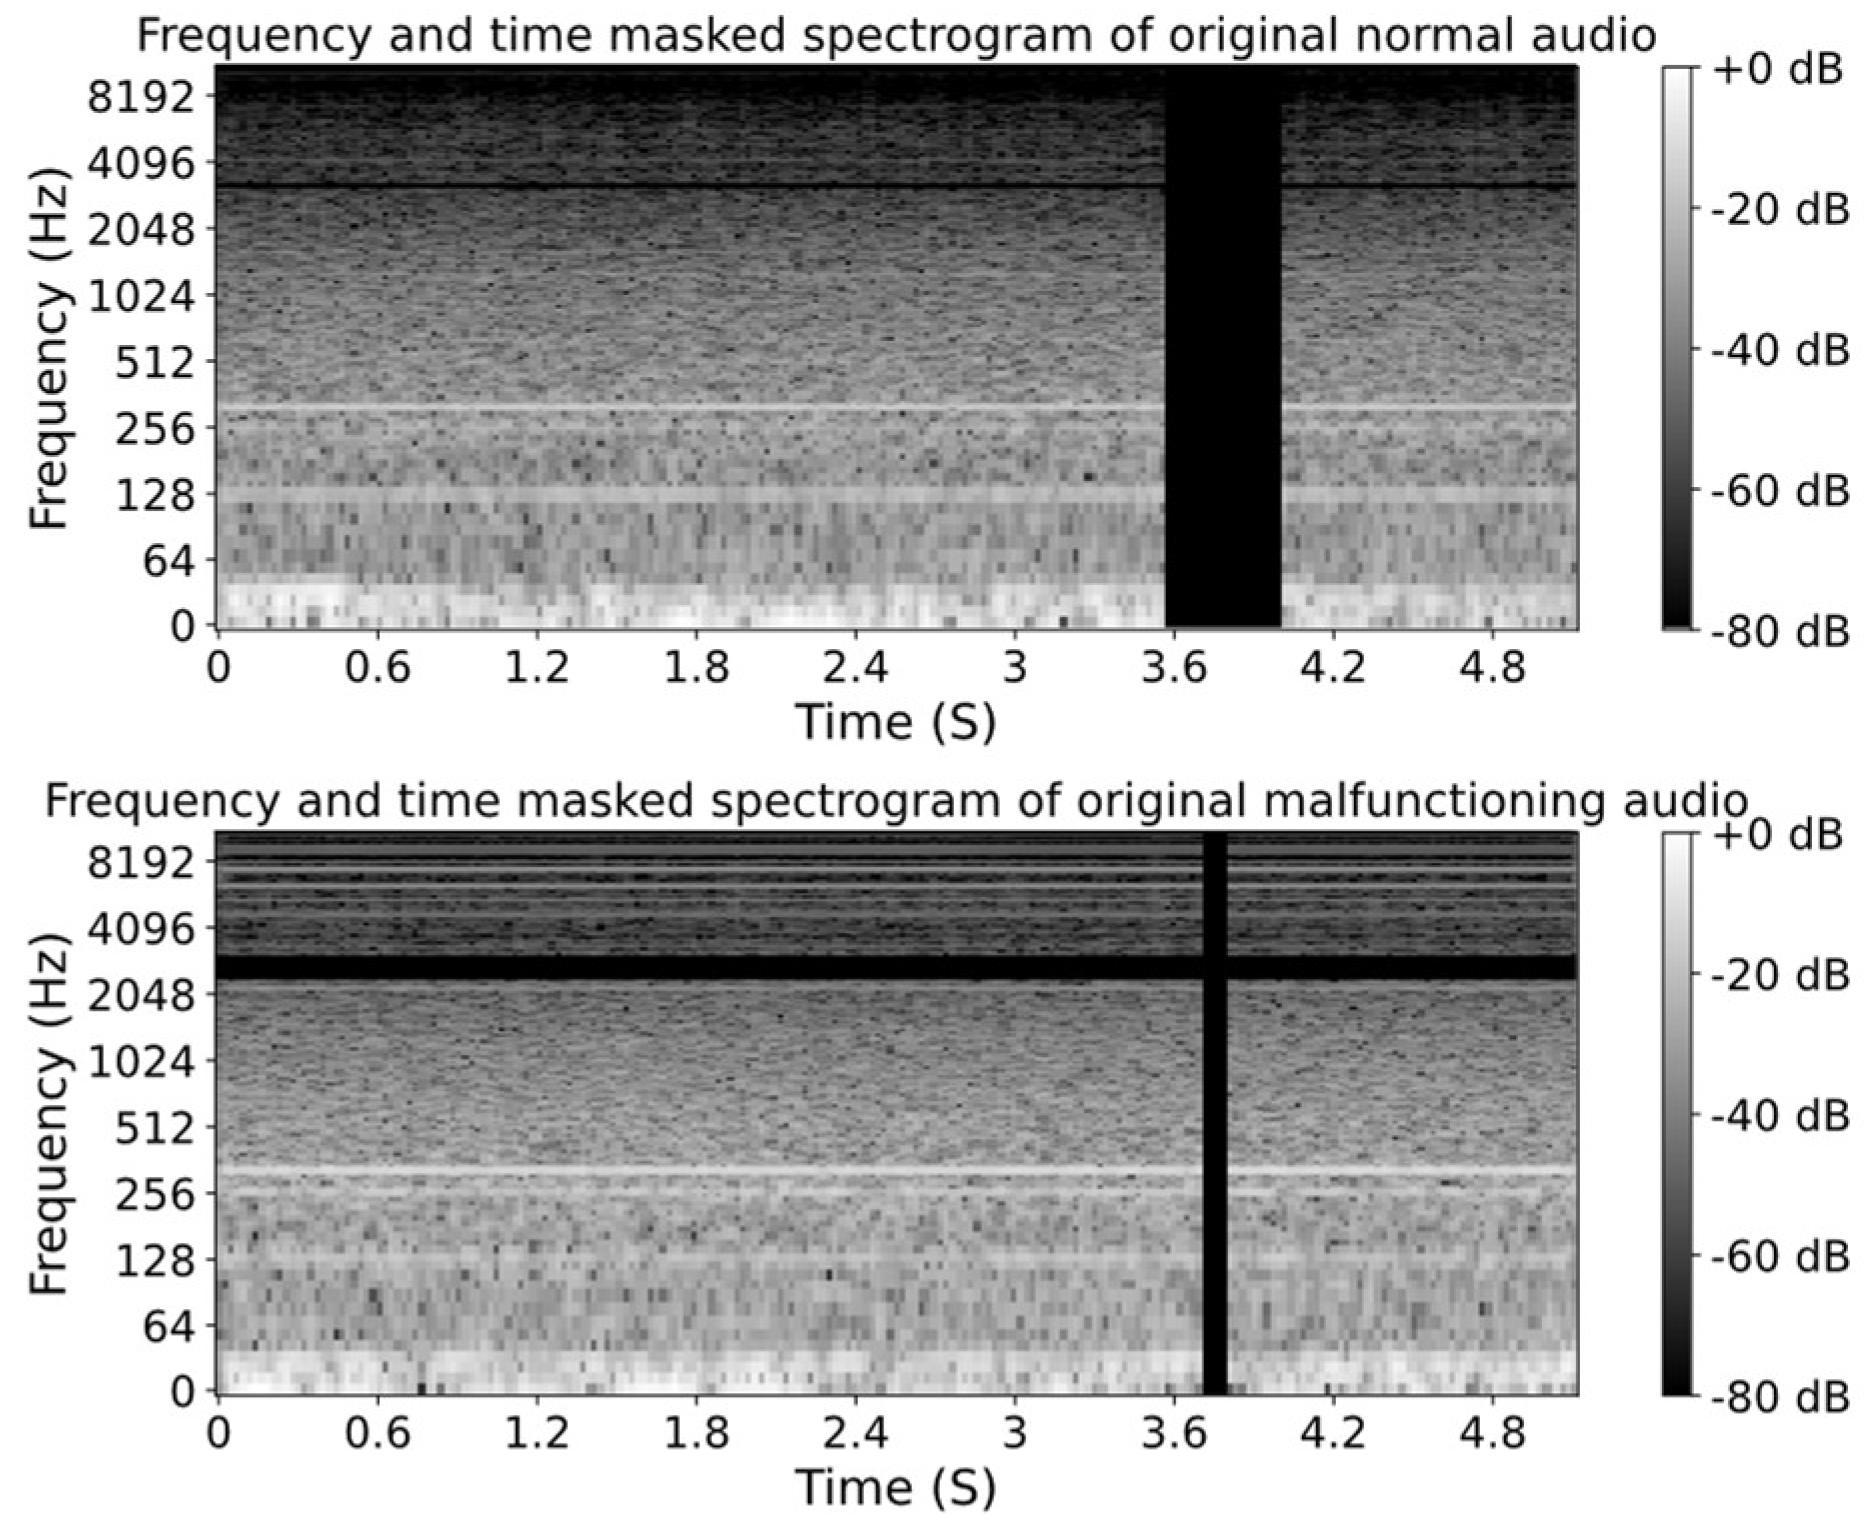
Figure 6.
Learning curve associated with CNN.
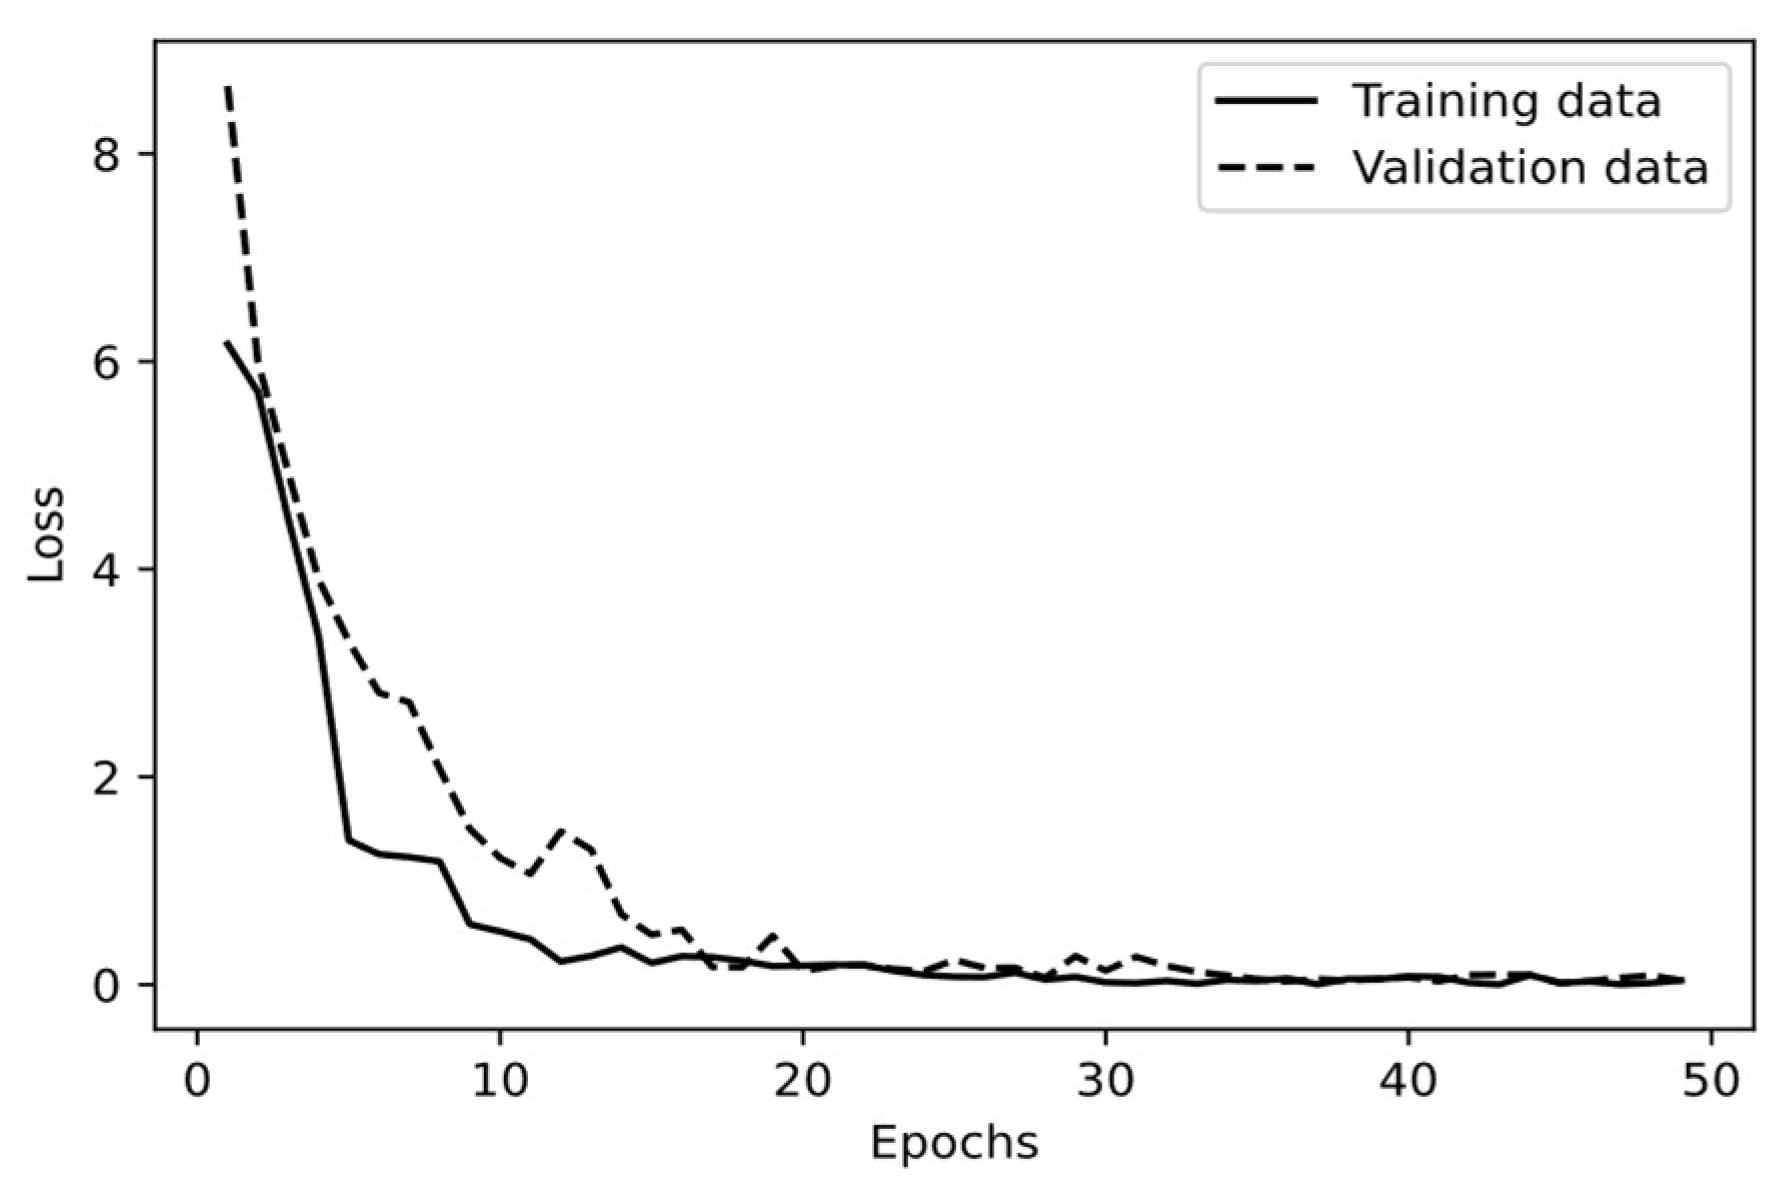
Figure 7.
Receiver operating characteristic curve associated with CNN classifier. .
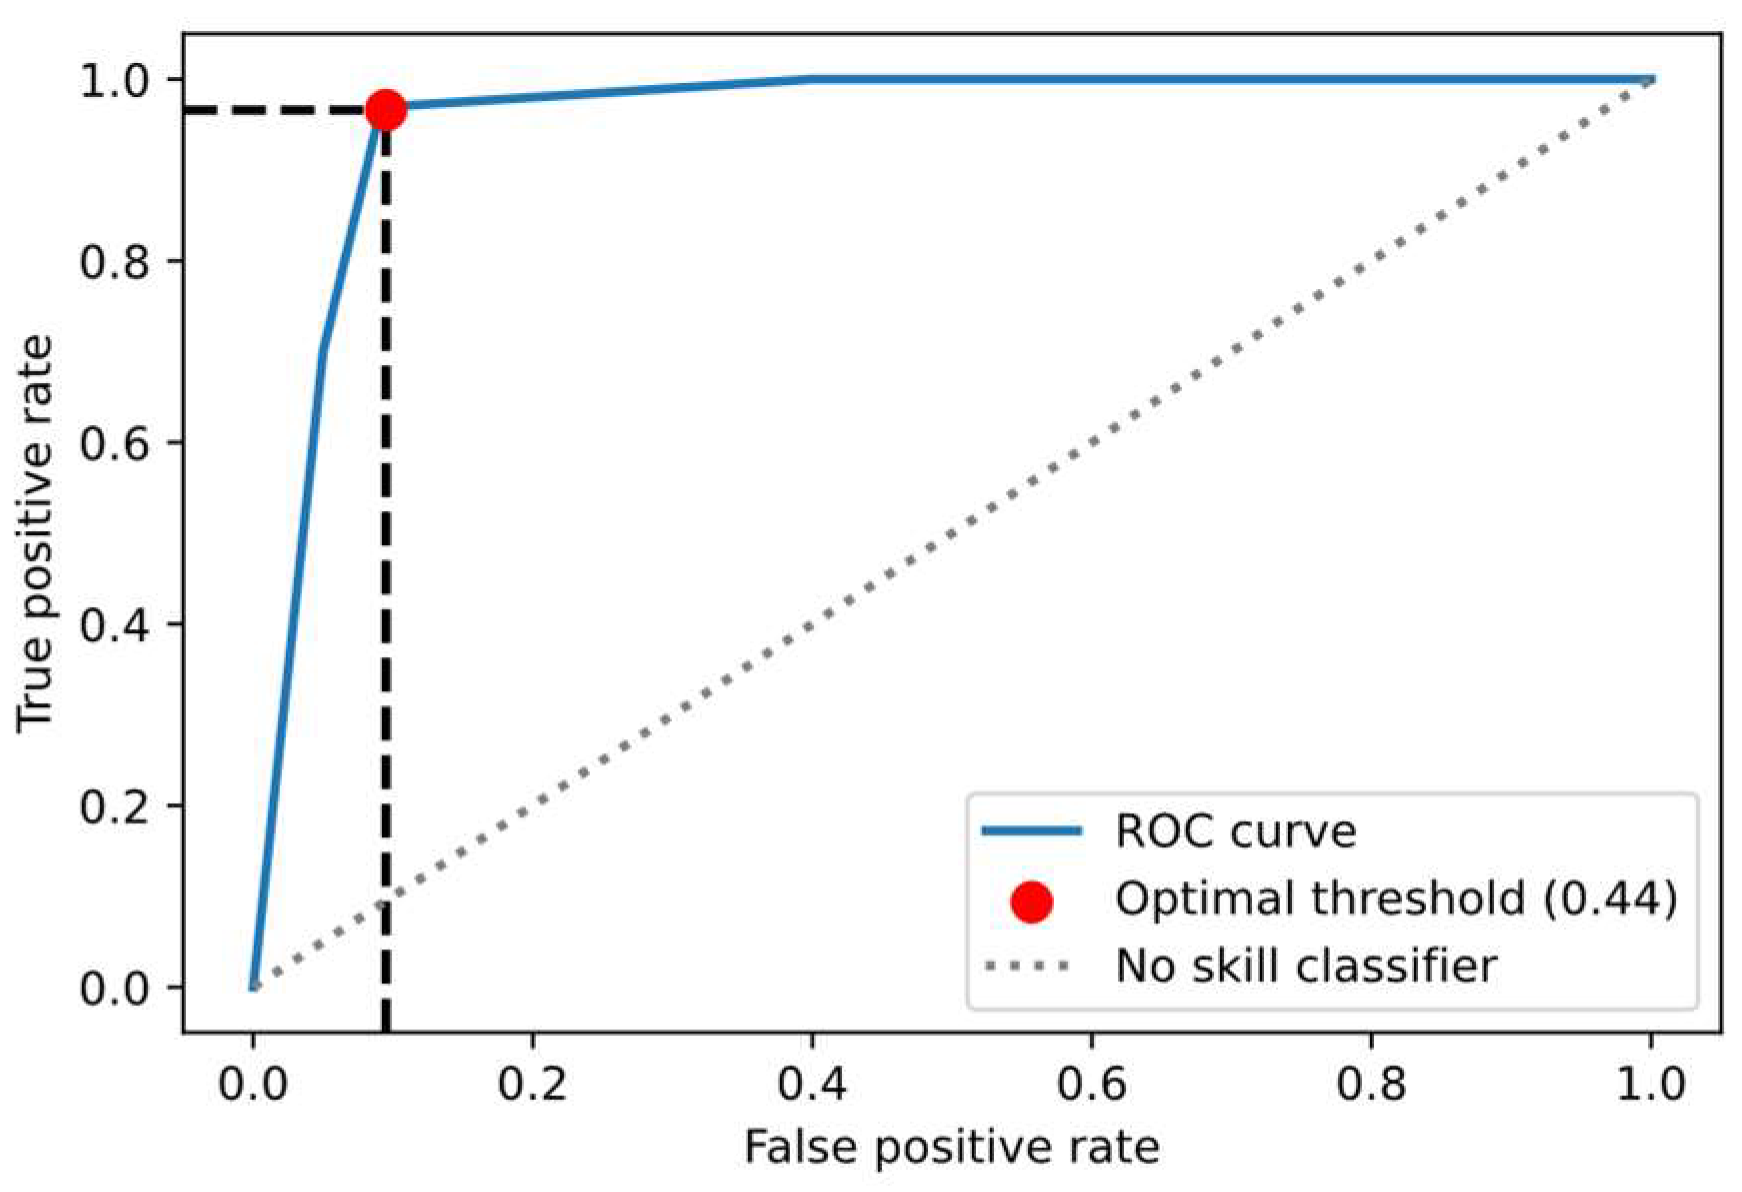
Figure 8.
Learning curve of the random forests.
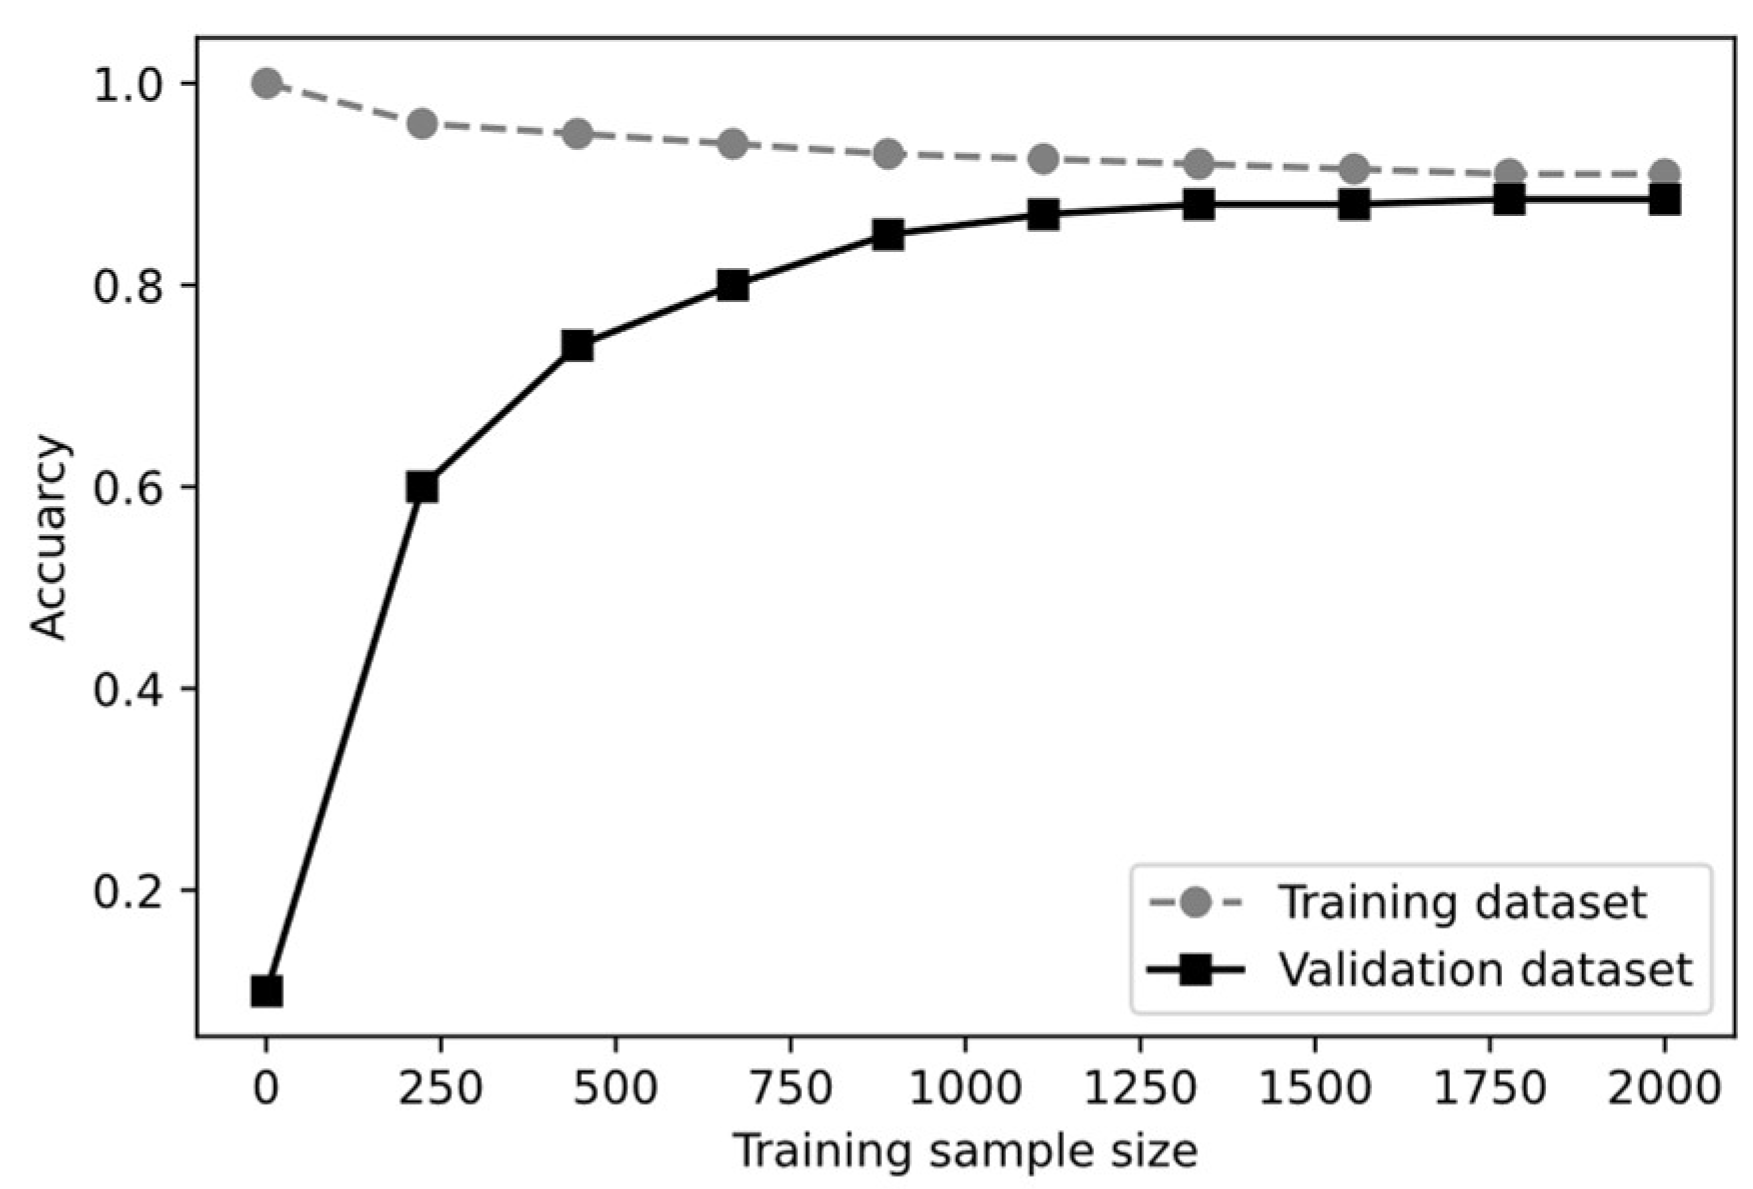
Figure 9.
Receiver operating characteristic curve associated with random forest classifier. .
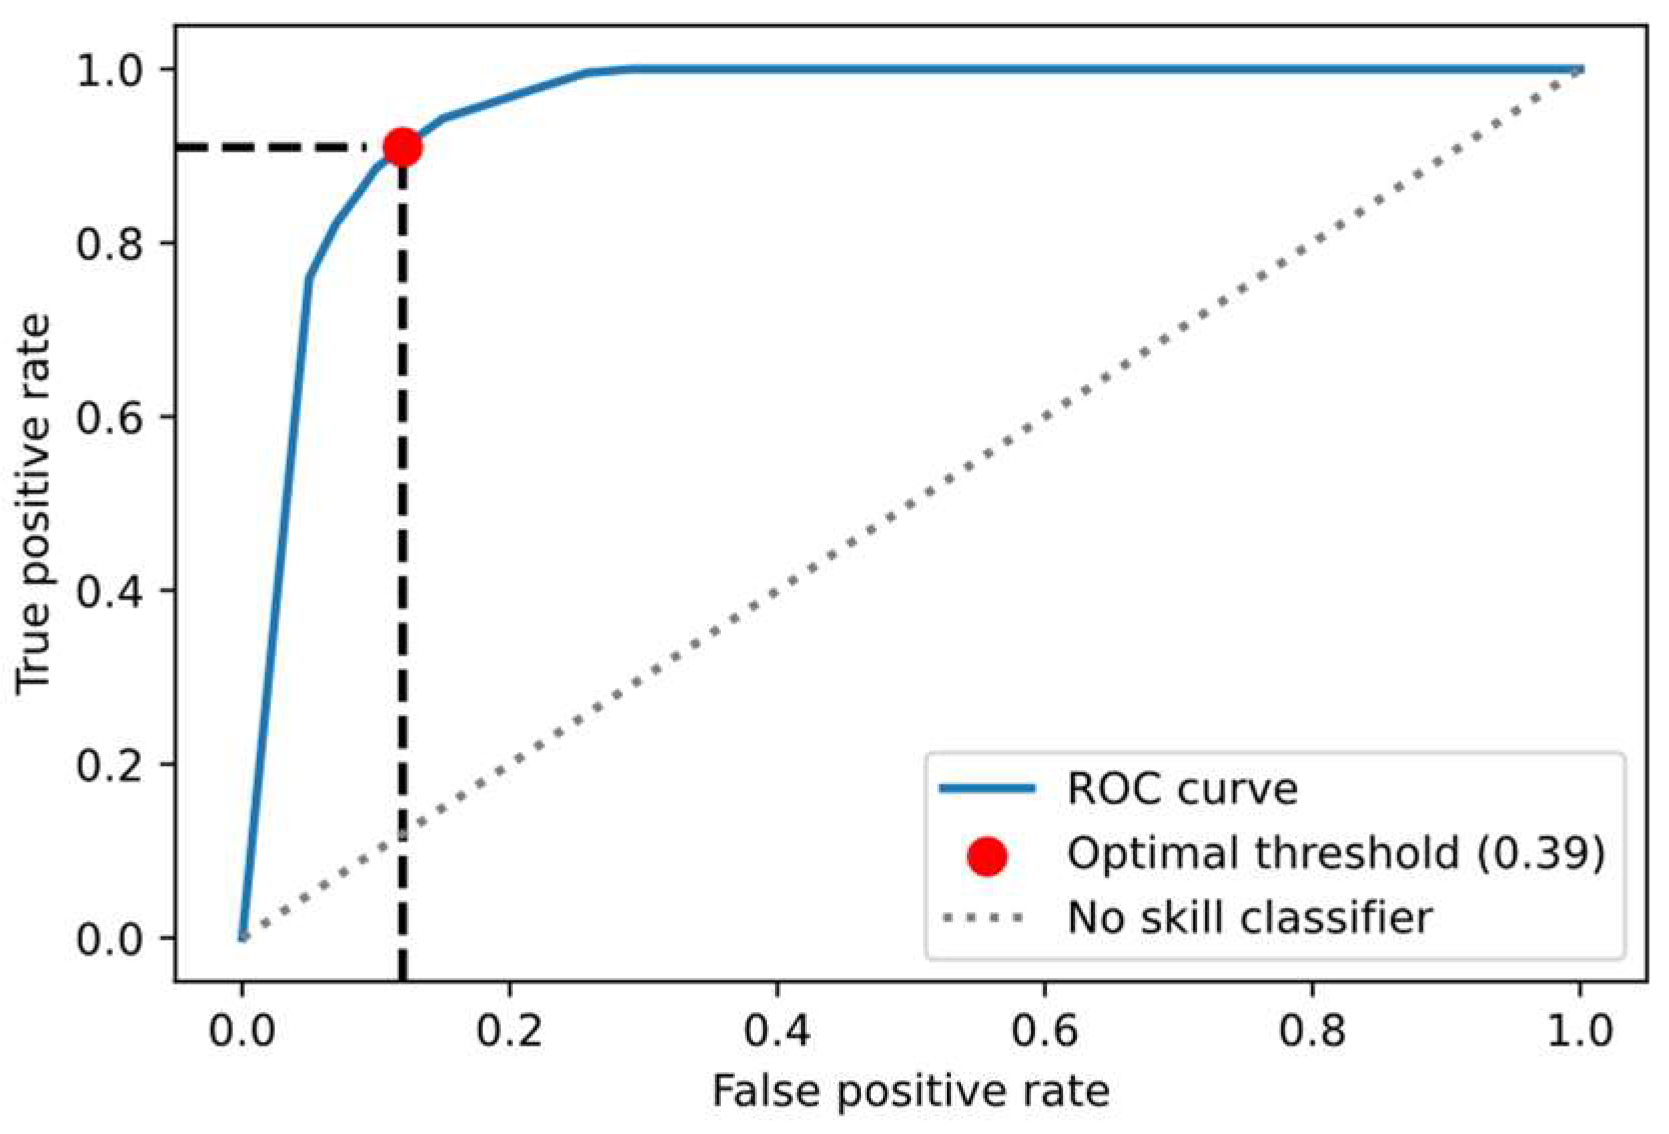
Figure 10.
Mean absolute SHAP values of the extracted features.
Disclaimer/Publisher’s Note: The statements, opinions and data contained in all publications are solely those of the individual author(s) and contributor(s) and not of MDPI and/or the editor(s). MDPI and/or the editor(s) disclaim responsibility for any injury to people or property resulting from any ideas, methods, instructions or products referred to in the content. |
© 2024 by the authors. Licensee MDPI, Basel, Switzerland. This article is an open access article distributed under the terms and conditions of the Creative Commons Attribution (CC BY) license (http://creativecommons.org/licenses/by/4.0/).
Copyright: This open access article is published under a Creative Commons CC BY 4.0 license, which permit the free download, distribution, and reuse, provided that the author and preprint are cited in any reuse.


