
Submitted:
16 January 2024
Posted:
16 January 2024
You are already at the latest version
Abstract
The solar heat pump system based on photovoltaic photothermal (PV/T) modules is a new technology that integrates photovoltaics and heat reutilization. It can improve the efficiency of photovoltaic conversion and recovery the remaining heat generated during the photoelectric conversion process, thereby improving the comprehensive efficiency of the whole system. Simulink software is a visual simulation tool, which has the advantages of strong applicability, clear simulation structure and calculation process. The design of its graphical programming greatly simplifies the user modeling process and allows for direct viewing of results, therefore improving the simulation efficiency. At present, there is little research on simulation of solar heat pump systems with PV/T modules based on Simulink software. In this paper, the mathematical models of each component contained in the PV/T solar heat pump system were established based on the system working principle, energy conservation equations and some empirical formulas, and then the operation of the system was simulated by the Simulink software. Due to the operation characteristic of PV/T modules is the key influencing factor for the whole system performance, the model and simulation process for PV/T modules were introduced in detail. The results showed that the surface temperature of PV/T modules under different operating conditions was significantly lower than that of ordinary photovoltaic panels, and the temperature change amplitude was lower. As results, the power generation and photovoltaic conversion efficiency were significantly improved.
Keywords:
PV/T Modules
; Solar Heat Pump
; Systems
; Simulink
1. Introduction
Recently the PV/T modules have become the key component in solar heat pump system development [1]. PV/T modules can achieve the combination of photoelectric and photothermal conversion, effectively reducing the surface temperature of photovoltaic modules and improving photovoltaic conversion efficiency as the remaining heat was transferred. Furthermore, the PV/T modules can collect the remaining heat as a low-temperature heat source for the connected heat pump [2]. Scholars have conducted much research on PV/T heat pump system. Kern [3] proposed the concept of PV/T (photovoltaic thermal) solar energy system, through installing the heat collection equipment on the back of the cells to recover the heat. Ito [4] conducted experimental research on photovoltaic modules as the evaporator of heat pump and found t he system performance coefficient increased with the increasing irradiance. Gang [5] studied a solar heat pump system with PV/T modules installed and the results showed the COP of the heat pump could reach up to 6.3 and the performance coefficient even reached up to 9.0. Ji [6] and Zhang [7] proposed that the solar photovoltaic thermal heat pump system was a combination of PV/T and heat pump. Solanki [8] developed a thermal model based on the energy balance equations. Shyam [9] studied a series combination of N PVT water collectors with different configurations covered with photovoltaic modules. Jouhara [10] designed a novel flat heat pipe based thermal and PV/T (photovoltaic and thermal systems) solar collector that can be used as an energy⁃active building envelope material. Li Hong [11] studied a new type of solar photovoltaic loop heat pipe/heat pump and analyzed the system performance under various operating modes. Chen [12] constructed a PV/T heat pump system with a micro heat pipe array and analyzed the increasing thermoelectric efficiency of the system. Chu [13] proposed a photovoltaic direct-driven PV/T dual-source heat pump system with hot water and studied the performance of the system.
With the improvement of computer computing power, the numerical simulation technology has also been applied to the research of PV/T solar heat pump system [14]. Mastrullo [15] studied the model of a heat pump whose evaporator operates as a photovoltaic collector and the energy balance equations have been used for some heat pump components. Khelifa [16] used ANSYS to conduct thermodynamic analysis of PV/T modules, and the results showed that the temperature of photovoltaic modules decreased by 15% to 20%. Chen [17] established a three-dimensional physical model of flat plate PV/T modules in CFD software, and studied the effects of different pipe heights, flow rates, inlet temperatures, wind speed, and ambient temperatures on the PV/T modules performance. Zhou [18] investigated the effects of different tube arrangement on the performance of the system with tube flat PV/T module through numerical simulation. Kavian [19] used TRNSYS to construct photovoltaic ground source heat pump hybrid systems in different scenarios, using the optimization tool developed by MATLAB software, the data exchange between TRNSYS and MATLAB is achieved. Dannemand [20] studied the performance of a new system consisting of a heat pump, PV/T collector, and two heat storage tanks and established a simulation model of the system in the transient simulation software TRNSYS to provide domestic hot water for buildings. Yerdesh [21] developed a numerical simulation model for predicting the performance of a solar collector and two stage cascade heat pump combi water heating systems under Kazakhstan climatic conditions. Hamid [22] studied PV/T collectors with four different channel configurations, established numerical models and evaluated their energy and thermal efficiency. Heinz [23] used TRNSYS to simulate heat pumps, photovoltaics, and heat storage tanks combined with intelligent control systems to reduce the proportion of grid power supply. Ma [24] designed a PV/T heat pump system with four operating modes, established a system model using TRNSYS software, and analyzed the annual operation of typical rural residences.
At present, there are mainly two types of modeling and simulation research for heat pump system, dynamic and quasi steady state to obtain the transient response and dynamic operating rules [25]. In the current simulation research, many researchers have conducted simulation for PV/T solar heat pump systems based on the TRNSYS software, while the modeling and simulation research based on Simulink software is still in the initial stage. Simulink software is a visual simulation tool, which has the advantages of strong applicability, clear simulation structure and operation process, close to reality, high efficiency and flexibility, which is very suitable for the simulation of dynamic and embedded systems. Simulink software also supports continuous sampling, discrete time sampling, and mixed sampling time modeling.
In this article the entire solar heat pump system was modeled and simulated based on Simulink software. The PV/T modules not only affect the photovoltaic conversion efficiency, but also determine the starting temperature of the evaporator connected with the modules, which will affect the performance of the entire solar heat pump system, so the modeling process of PV/T modules was mainly focused and the simulated operating characteristics was analyzed in detail.
2. Establishment of Mathematical Model for PV/T Module
The principle of a solar heat pump system is shown in Figure 1. During operation, all components within the system work simultaneously, and the working medium flows among them. The characteristics of each component will affect the operational performance of the whole system. Therefore, it is necessary to consider the coupling impact among different parts. All components contained in the heat pump system have been modeled, included the compressor, condenser, evaporator, expansion valve, heat storage tanks and solar radiation. As analyzed above, a key factor limiting thermal performance is the temperature of PV/T modules. This article focuses on the modeling process of PV/T modules.
2.1. Mathematical Modeling of PV/T Module
The structure of one PV/T module is shown in Figure 2. (a), which consists of glass cover plate, EVA adhesive, photovoltaic panel, EVA adhesive, collector channel, and insulation back plate from top to bottom. EVA is copolymerized from ethylene and acetic acid, which is widely used as a photovoltaic material. It plays multiple roles in bonding the inside PV/T photovoltaic thermal module, fixing the internal structure of the collector, and insulating to protect the photovoltaic panel.
The purpose of simulation is to obtain the energy transfer process inside PV/T photovoltaic thermal module. Therefore, the following assumptions are made to simplify the model and reduce computational complexity:
1. The temperature of each layer of PV/T photovoltaic thermal module is uniform, and there is no temperature gradient within the same horizontal layer;
2. The heat transfer process only occurs in the direction perpendicular to the PV/T module;
3. The contact between different layers inside the module is good, without thermal conductivity or contact resistance;
4. Neglecting the absorption and transmittance of EVA adhesive to solar radiation;
5. The thermal properties of each layer of material are stable and do not change with temperature;
6. The insulation material has good insulation performance, without the heat dissipation of the frame and back panel.
The energy conservation of PV/T photovoltaic thermal module is shown in the Figure 2. (b). For the entire PV/T photovoltaic thermal module, its energy conservation equation can be written as:
In the formula:
- Solar radiation energy absorbed by PV/T photovoltaic thermal module per unit area, W·m-2;
- Power generation of photovoltaic cells per unit area, W·m-2;
- The heat absorbed by the cooling working fluid per unit heat exchange area in the collector, W·m-2;
- Average density of collector [10], kg·m-3;
- Specific heat capacity of the collector, J·kg-1·K-1;
- Thickness of PV/T module, m;
- Convective heat transfer of air per unit area of glass cover plate, W·m-2;
- Radiant heat transfer per unit area of glass cover plate to the sky, W·m-2.
In the formula:
- Heat transfer coefficient between glass and air, W·m-2·K-1;
, - Glass cover plate and ambient temperature, K.
In the formula:
- The emissivity of the glass cover plate;
-Stefan Boltzmann constant, 5.67 × 10⁻⁸, W·m-2·K-4;
- Sky background temperature.
There is an energy conservation equation for the glass cover plate:
In the formula:
- The absorption rate of solar radiation by the glass cover plate;
- The solar radiation intensity projected onto the surface of PV/T photovoltaic thermal module, W·m-2;
- Heat transfer coefficient between the upper EVA adhesive and the glass cover plate, W·m-2·K-1;
- Temperature of the upper EVA adhesive, K.
For the upper EVA adhesive, the energy conservation equation is:
In the formula:
- Heat transfer coefficient between photovoltaic panel and upper EVA adhesive, W·m-2·K-1;
- The temperature of the photovoltaic panel, K.
For photovoltaic panel, the energy conservation equation is:
In the formula:
- The transmittance of the glass cover plate to solar radiation;
- Heat transfer coefficient between photovoltaic panel and lower EVA adhesive, W·m-2·K-1;
- The temperature of the lower EVA adhesive, K.
For the lower EVA adhesive, the energy conservation equation is:
In the formula:
- The heat transfer coefficient between the lower EVA adhesive and the collector aluminum plate, W·m-2·K-1;
- Temperature of the collector aluminum plate, K.
For collector aluminum plates, there is an energy conservation equation:
In the formula:
- Heat transfer coefficient between the collector aluminum plate and the cooling medium, W·m-2·K-1;
- The temperature of the cooling working fluid inside the PV/T photovoltaic thermal module, K.
For the cooling medium inside the collector, there is an energy conservation equation:
In the formula:
- Mass of cooling working fluid inside the collector, kg;
,- The temperature of the cooling medium enters and exits the collector, K;
- Area of collector aluminum plate, m2;
- The average heat transfer temperature difference between the collector aluminum plate and the cooling working fluid of the collector, K;
- Mass flow rate of cooling working fluid inside PV/T photovoltaic thermal module, kg·s-1.
2.2. Optoelectronic Effect Model
For the establishment of photovoltaic power generation models, empirical formula method is often used in engineering applications, and the key factor is the temperature of the photovoltaic cell. The empirical formula for the efficiency of photovoltaic power generation and the temperature of photovoltaic cells is:
In the formula:
- Actual photovoltaic conversion efficiency of photovoltaic cells;
- The photoelectric conversion efficiency of photovoltaic cells under laboratory standard environment;
- Temperature coefficient, for monocrystalline silicon and polycrystalline silicon photovoltaic cells, its value is generally taken as 0.0045 K-1;
-The testing temperature under standard conditions for photovoltaic cells is generally 25 °C, which is 298.15 K.
- The absorption rate of solar radiation by the glass cover plate of PV/T module.
3. Dynamic Simulation Model of PV/T Modules
The dynamic simulation model of PV/T photovoltaic thermal modules is shown in Figure 3. At the beginning of the simulation, the instantaneous power generation and photoelectric efficiency per unit area are calculated based on the initial temperature of the inlet cooling water of the PV/T photovoltaic thermal modules set in the evaporator, the outlet water temperature of the cooling water set in the PV/T modules, the initial temperature of the glass cover plate, and the PV plate and PV/T aluminum plate in the first time step. The PV/T modules calls the solar radiation intensity function, environmental temperature function, daily average wind speed, and initial temperature values of various components of the PV/T modules. By solving the energy equation of each part of the PV/T modules, the outlet temperature of the cooling water and the temperature of each component of the PV/T modules in the second time step are obtained.
The dynamic simulation model of the whole system is shown in Figure 4. The simulated variable of the system is time, measured in seconds. At the beginning of the simulation, the system calls the initial values of each modules set, calculates the corresponding working fluid parameters based on these initial values and the data entering different modules of system for subsequent simulation calculations. Considering the long simulation time and the continuous and slow changing trend of the parameters involved, a variable step solver is used to improve the solving efficiency. The solving method adopts ode15s for simulation calculation.
4. Analysis of Simulation Results
Based on the PV/T photovoltaic thermal modules model and the dynamic simulation model of the entire heat pump system established in the previous part, simulation research is conducted on the photovoltaic and photothermal integration demonstration project for Building 24 Power Station of the China Institute of Metrology. According to the results the operating characteristics of PV/T modules are predicted and analyzed under different summer and winter heating conditions. In order to meet the requirements of solar radiation intensity for the operation of the heat pump system, the simulation time is set at 8:00-18:00 in summer and 9:00-17:00 in winter.
4.1. Simulation Analysis under Summer Heating Conditions
The simulation starts from 8:00 and ends at 18:00 of Beijing time. The solar radiation intensity increases with system operating time, reaches its maximum at 13:00, and then continues to decrease until the end of the simulation. The meteorological parameters are fit and imported into the simulation model for calculation.
The temperature comparison between PV/T photovoltaic thermal modules and ordinary photovoltaic cell modules is shown in Figure 5. (a). It can be seen from that the temperature change trend of the two different modules is same, both increasing and decreasing with the change of solar irradiance. But there are significant differences in the temperature changes between the two modules. From the beginning of simulation, the temperature of ordinary photovoltaic modules panel raises from 22.5 °C and continues to increase to the highest 63.4 °C after about 5.5 hours with the increase of solar radiation intensity, and then it decreases with the weakening of solar radiation intensity, finally reduced to 36.2 °C at the end of simulation. The average temperature of the ordinary photovoltaic modules throughout the entire operation cycle is 35.4 °C. While the temperature of PV/T modules first decreases at the initial simulation stage. It rapidly drops from the initial 22.5 °C to around 2.8 °C after about 0.6 hours. Then, as the solar radiation intensity increases, the temperature of the PV/T modules increases to around 21.9 °C after about 5.5 hours, and then begins to decrease again. The average temperature throughout the entire operation cycle is only about 15.2 °C, which is 20.2 °C lower than the average temperature of the ordinary photovoltaic panel.
The reason for the temperature decreasing of PV/T modules during the initial stage of operation is due to the circulating effect of internal medium, which can cool the PV/T modules and take away the generated heat quickly. Furthermore, at initial stage the solar radiation intensity is low, and the temperature of the whole heat pump system is also low. As the solar radiation intensity increased, the remaining heat from photoelectric conversion increases and it can not be taken away by the medium in time. Therefore, the surface temperature of the components gradually increases and reaches its maximum value after 5.5 hours and then decreases with the weakening of solar radiation intensity afterwards. During the entire operation period, the temperature of PV/T modules was lower than that of ordinary photovoltaic panel for the cooling medium inside the panel continuously circulates and transfers the remaining heat from photovoltaic conversion to the evaporator of the heat pump system. Finally, the heat is transferred by the refrigerant to the condenser to release, achieving a continuous cooling effect for PV/T modules, meanwhile providing heat for thermal users.
The operating results also indicates that the difference between the highest and lowest operating temperatures of the PV/T modules is 19.1 °C, while the temperature difference in the ordinary photovoltaic panel is 40.9 °C. This is because the circulating working fluid in the PV/T modules has a certain heat capacity, which reduces the temperature change amplitude and weakens the temperature fluctuation. Therefore, the conversion efficiency of photovoltaic power generation further increases, and the photovoltaic power generation is significantly improved simultaneously.
The comparison of the photovoltaic conversion characteristics between the PV/T modules and ordinary photovoltaic panel is shown in Figure 5. (b) .The results show that there is not much difference in power generation and photovoltaic efficiency between the two modules at the beginning of the simulation. As the solar radiation intensity increases, the photovoltaic power generation of the two modules both increases. At around 1:00 pm, when the solar radiation intensity reaches its maximum value, the photovoltaic power generation of the two modules both reach their maximum values. But the maximum values are different. The power generation of ordinary panel is 69 W·m-2, while the power generation of PV/T module is 84 W·m-2, which is about 21% higher than that of ordinary panel. During the simulation period, the photoelectric efficiency of ordinary panel is 13.6%, and the average photoelectric efficiency of PV/T module is 15.7% which is 15.4% higher. This is because in the early stages of operation, the solar radiation intensity is relatively low, and the temperatures of PV/T module and ordinary panel is similar, so the photoelectric efficiency is similar. Subsequently, due to the operation of the heat pump system, the cooling medium inside the PV/T module continuously carries away the waste heat generated by the photovoltaic conversion, making its temperature rise more slowly, and the photoelectric conversion efficiency is significantly improved compared to the ordinary panel, resulting in an increase in power generation.
4.2. Simulation Analysis under Winter Heating Conditions
The simulation starts from 9:00 and ends at 17:00 of Beijing time, and the changes in meteorological parameters over time are similar to those in summer. The solar radiation intensity first increases, reaches its maximum value at 13:00, and then continuously decreases until the simulation ends.
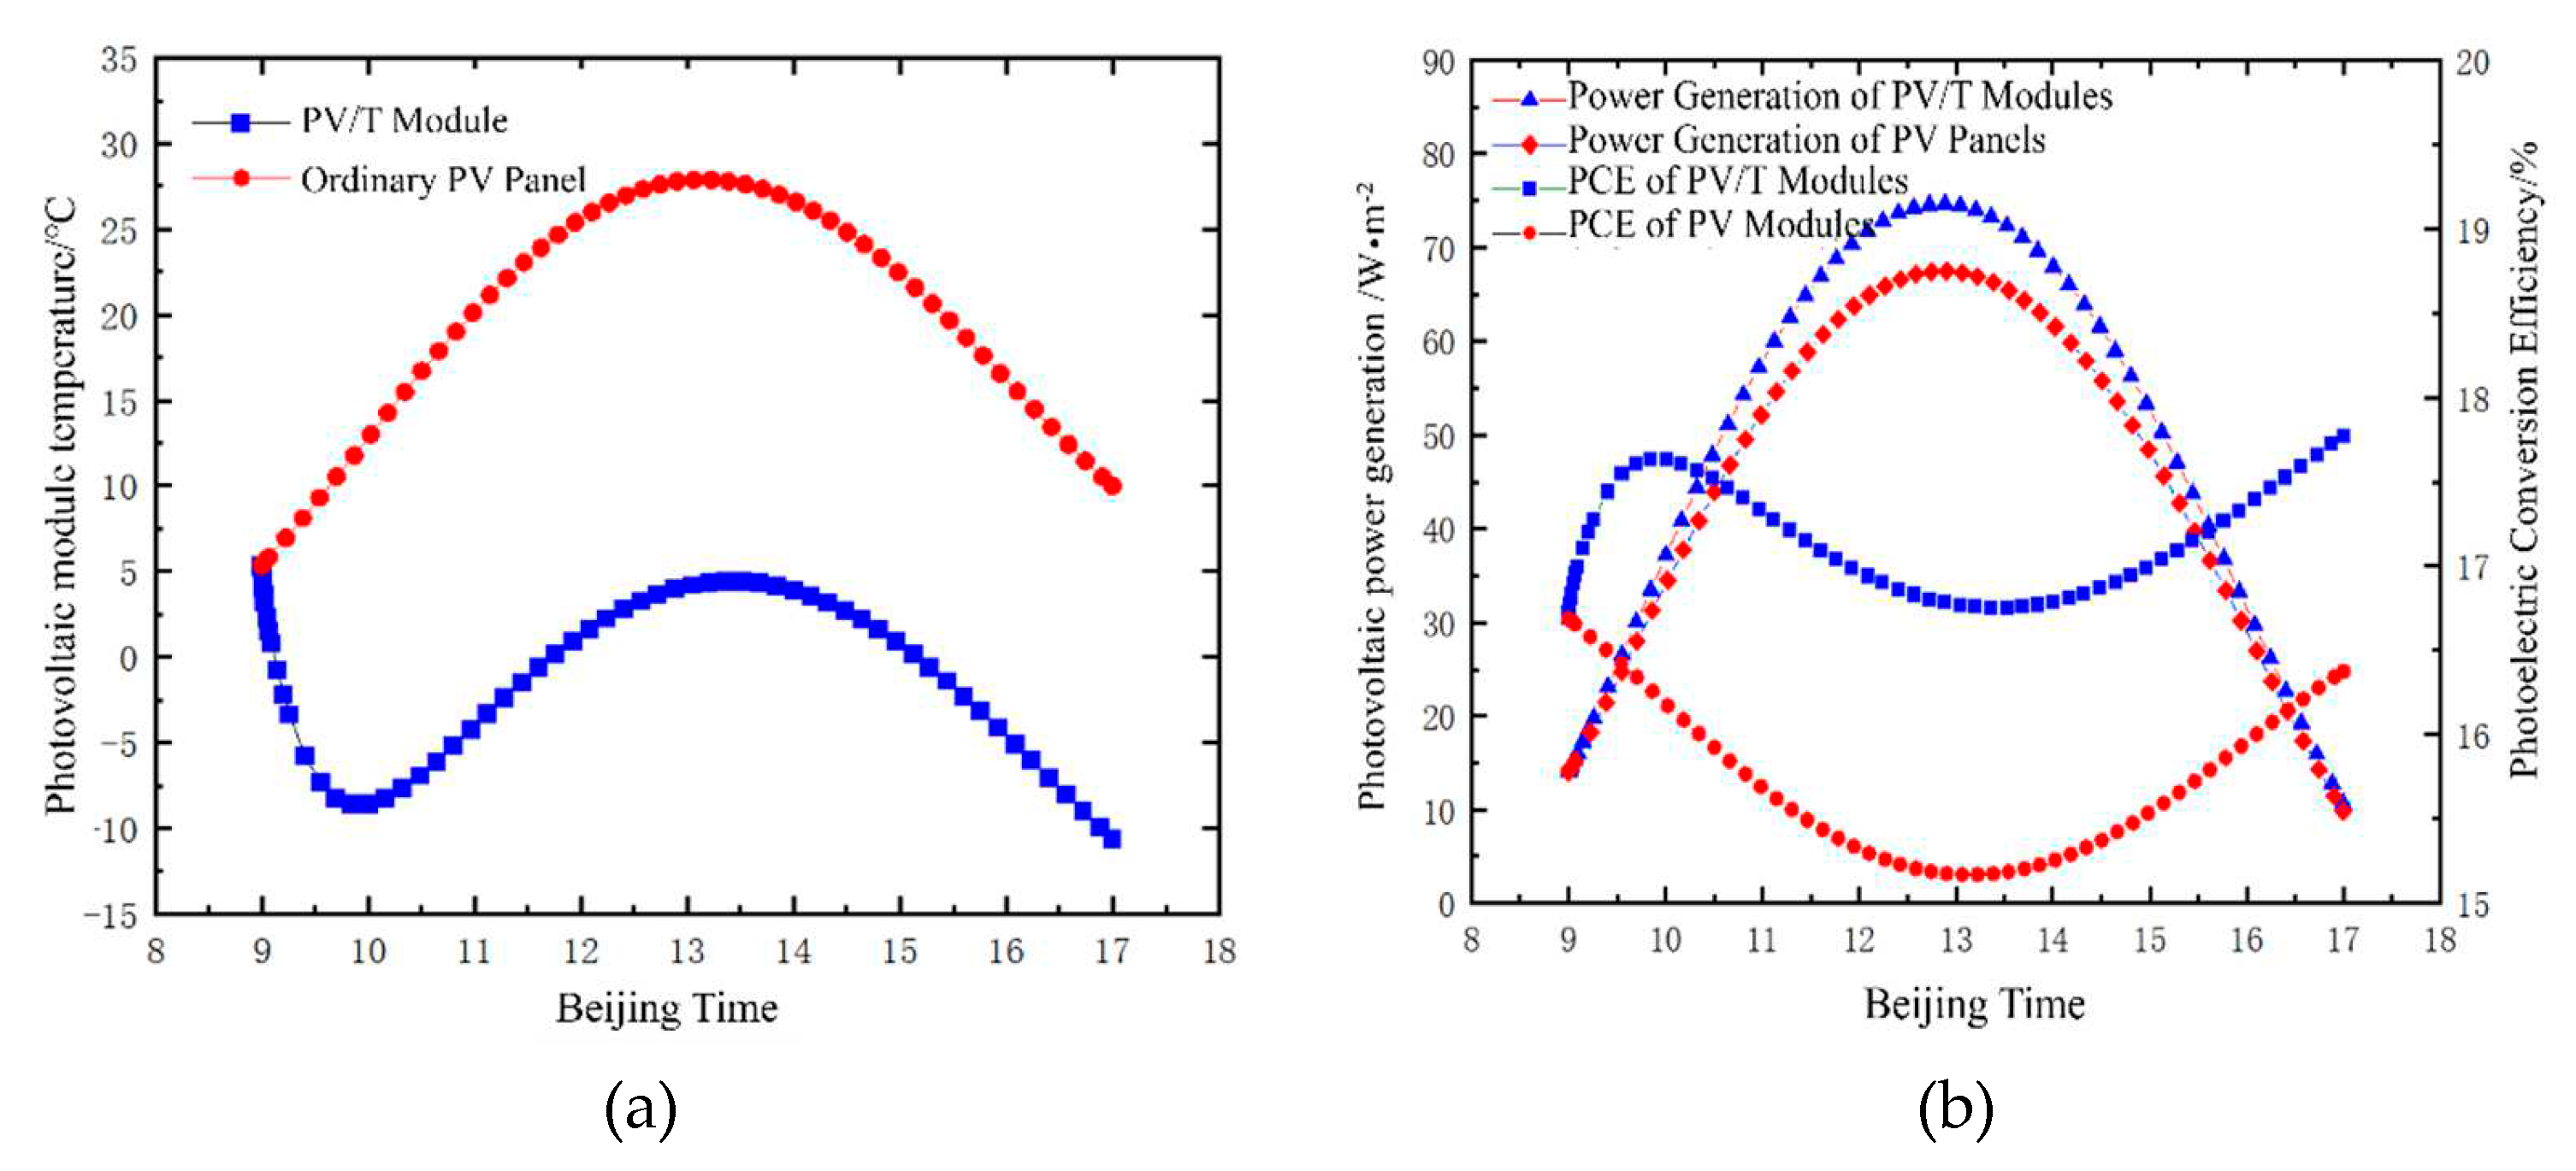
The temperature comparison between PV/T module and ordinary photovoltaic panel under winter heating conditions is shown in Figure 6. (a). At the beginning of the simulation, the temperature of ordinary panel gradually increases with the increase of solar radiation intensity. After 4.2 hours, it rises from the initial 5.0 °C to 27.9 °C and then begins to decrease. At the end of the simulation, it drops to 10.1 °C. The average surface temperature of the panel is 18.3 °C. While the temperature of PV/T modules rapidly decreased from 5.0 °C at the beginning of operation to -8.6 °C for the initial 0.6 hour, and then increases with the increase of solar radiation intensity. Influenced by the operation of the heat pump system, after about 4.5 hours, the temperature of PV/T module just increased to 4.4 °C, and then gradually decreased. During the simulation period, the average temperature of the collector is 0.5 °C, which was 17.8 °C lower than that of ordinary panel.
The comparison of photovoltaic conversion characteristics between the PV/T module and ordinary photovoltaic panel is shown in Figure 6. (b). The photovoltaic conversion characteristics of both modules are similar to those of summer operating conditions. The power generation and photovoltaic conversion efficiency of PV/T modules are higher than ordinary panel. The maximum power generation of PV/T modules is 74.6 W·m-2, which is 10.5% higher than the 67.5 W·m-2 of ordinary panel. The average photovoltaic conversion efficiency of PV/T modules is 17.2%, which has been increased by 8.9% compared with the 15.8% of ordinary panel. However, due to the weakening of solar radiation intensity in winter compared with summer conditions, the ambient temperature is lower, and the surface temperature of PV/T module and ordinary panel both decreases. Therefore, the photoelectric conversion efficiency of the two modules has both been improved compared with summer conditions, both reaching over 15%. The photovoltaic conversion efficiency of PV/T module is significantly improved compared to ordinary photovoltaic panel, but the improvement effect is smaller than that of summer conditions.
5. Conclusions
In this article dynamic models of components contained in a PV/T heat pump system are established using energy conservation formulas. Also the simulation is conducted based on the Simulink software for the PV/T modules and the whole system applied in Photovoltaic Photothermal Integration Demonstration Project for Building 24 Power Station of the China Institute of Metrology. The working characteristics of the system are simulated under two typical summer and winter working conditions. The results show that under summer conditions, the average temperature of PV/T modules is 20.2 °C lower than that of ordinary photovoltaic panel and the average photoelectric conversion efficiency increases by 15.4%. Under winter operating conditions, the average temperature of PV/T module is 17.8 °C lower than that of photovoltaic panel, and the average photoelectric efficiency is 8.9% higher. The results show that under different operating conditions, the surface temperature of PV/T modules is significantly lower than that of ordinary panel, and the photoelectric conversion efficiency and power generation are both significantly improved.
Author Contributions
Conceptualization, T.S., Z.L. and Y.G.; writing—original draft preparation, G.G.; writ-ing—review and editing, Y.A. and Y.F.; supervision, Q.L. and X.Z. All authors have read and agreed to the published version of the manuscript.
Funding
This research received no external funding.
Conflicts of Interest
The authors declare no conflicts of interest.
References
- Dubey, S.; Sarvaiya, J.N.; Seshadri, B. Temperature Dependent Photovoltaic (PV) Efficiency and Its Effect on PV Production in the World—A Review. Energy Procedia 2013, 33, 311–321. [Google Scholar] [CrossRef]
- Wolf, M. Performance analyses of combined heating and photovoltaic power systems for residences. Energy Convers. 1976, 16, 79–90. [Google Scholar] [CrossRef]
- Kern, J.E.C.; Russell, M.C. Combined photovoltaic and thermal hybrid collector systems. Conference Record of the IEEE Photovoltaic Specialists, Washington, DC, USA, 1998.
- Ito, S.; Miura, N.; Takano, Y. Studies of Heat Pumps Using Direct Expansion Type Solar Collectors. J. Sol. Energy Eng. 2005, 127, 60–64. [Google Scholar] [CrossRef]
- Gang, P.; Jie, J.; Wei, H.; et al. Performance of photovoltaic solar assisted heat pump system in typical climate zone. J Energy Environ. 2007, 6, 1–9. [Google Scholar]
- Ji, J.; Pei, G.; Chow, T.-T.; Liu, K.; He, H.; Lu, J.; Han, C. Experimental study of photovoltaic solar assisted heat pump system. Sol. Energy 2008, 82, 43–52. [Google Scholar] [CrossRef]
- Zhang, X.; Zhao, X.; Smith, S.; et al. Review of R&D progress and practical application of the solar photovoltaic/thermal (PV/T) technologies. Renew. Sustain. Energy Rev. 2012, 16, 599–617. [Google Scholar]
- Solanki, S.C.; Dubey, S.; Tiwari, A. Indoor simulation and testing of photovoltaic thermal (PV/T) air collectors. Appl. Energy 2009, 86, 2421–2428. [Google Scholar] [CrossRef]
- Shyam; Tiwari, G.; Al-Helal, I. Analytical expression of temperature dependent electrical efficiency of N-PVT water collectors connected in series. Sol. Energy 2015, 114, 61–76. [Google Scholar] [CrossRef]
- Jouhara, H.; Milko, J.; Danielewicz, J.; Sayegh, M.; Szulgowska-Zgrzywa, M.; Ramos, J.; Lester, S. The performance of a novel flat heat pipe based thermal and PV/T (photovoltaic and thermal systems) solar collector that can be used as an energy-active building envelope material. Energy 2016, 108, 148–154. [Google Scholar] [CrossRef]
- Li, H.; Sun, Y.; Fu, X.S. ; A novel solar photovoltaic loop heat pipe/heat pump water heating system. Acta Energiae Solaris Sin. 2020, 41, 59–66. [Google Scholar]
- Chen, H.B.; Zhang, X.K.; Wang, C.C.; et al. An experimental research on energy-saving efficiency of a solar PV/T heat pump system based on micro heat pipe array. Renew. Energy Resour. 2021, 39, 611–617. [Google Scholar]
- Chu, L.C.; Zhao, S.G.; Gao, Y.Z.; et al. Experimental study on performance of photovoltaic direct-driven PV/T dual-source heat pump hot water system. Acta Energiae Solaris Sin. 2023, 44, 188–194. [Google Scholar]
- Fu, L.; Ding, G.L.; Zhang, C.L.; et al. Dynamic Simulation of Air-to-Water Dual-Mode Heat Pumps. J. Eng. Thermophys. 2003, 24, 725–728. [Google Scholar]
- Mastrullo, R.; Renno, C. A thermoeconomic model of a photovoltaic heat pump. Appl. Therm. Eng. 2010, 30, 1959–1966. [Google Scholar] [CrossRef]
- Khelifa, A.; Touafek, K.; Ben Moussa, H.; Tabet, I. Modeling and detailed study of hybrid photovoltaic thermal (PV/T) solar collector. Sol. Energy 2016, 135, 169–176. [Google Scholar] [CrossRef]
- Chen, H.P.; Guo, X.X.; Liang, K.; et al. Research on the Performance of Flat-Box Photovoltaic/ Thermal Collector with Cooling Channels. J. Sol. Energy Eng. 2017, 140, 021002. [Google Scholar]
- Zhou, J.; Ke, H.; Deng, X. Experimental and CFD investigation on temperature distribution of a serpentine tube type photovoltaic/thermal collector. Sol. Energy 2018, 174, 735–742. [Google Scholar] [CrossRef]
- Dannemand, M.; Sifnaios, I.; Tian, Z.; Furbo, S. Simulation and optimization of a hybrid unglazed solar photovoltaic-thermal collector and heat pump system with two storage tanks. Energy Convers. Manag. 2020, 206, 112429. [Google Scholar] [CrossRef]
- Kavian, S.; Aghanajafi, C.; Mosleh, H.J.; Nazari, A.; Nazari, A. Exergy, economic and environmental evaluation of an optimized hybrid photovoltaic-geothermal heat pump system. Appl. Energy 2020, 276, 115469. [Google Scholar] [CrossRef]
- Yerdesh, Y.; Abdulina, Z.; Aliuly, A.; Belyayev, Y.; Mohanraj, M.; Kaltayev, A. Numerical simulation on solar collector and cascade heat pump combi water heating systems in Kazakhstan climates. Renew. Energy 2020, 145, 1222–1234. [Google Scholar] [CrossRef]
- El-Hamid, M.A.; Wei, G.; Sherin, M.; Cui, L.; Du, X. Comparative Study of Different Photovoltaic/Thermal Hybrid Configurations From Energetic and Exergetic Points of View: A Numerical Analysis. J. Sol. Energy Eng. 2021, 143, 1–28. [Google Scholar] [CrossRef]
- Heinz, A.; Rieberer, R. Energetic and economic analysis of a PV-assisted air-to-water heat pump system for renovated residential buildings with high-temperature heat emission system. Appl. Energy 2021, 293, 116953. [Google Scholar] [CrossRef]
- Ma, X.F. Study on dynamic simulation and optimization of PV/T-heat pump system. Qingdao: Qingdao University of Technological, 2018.
- Guo, G.Z.; Gou, Y.J. Simulation and Experimental Research on Integrated System of Photovoltaic and Photothermal Based on High-Efficiency Collector. Tangshan, North China University of Science and Technology, 2021.
Figure 1.
Schematic diagram of solar heat pump system.
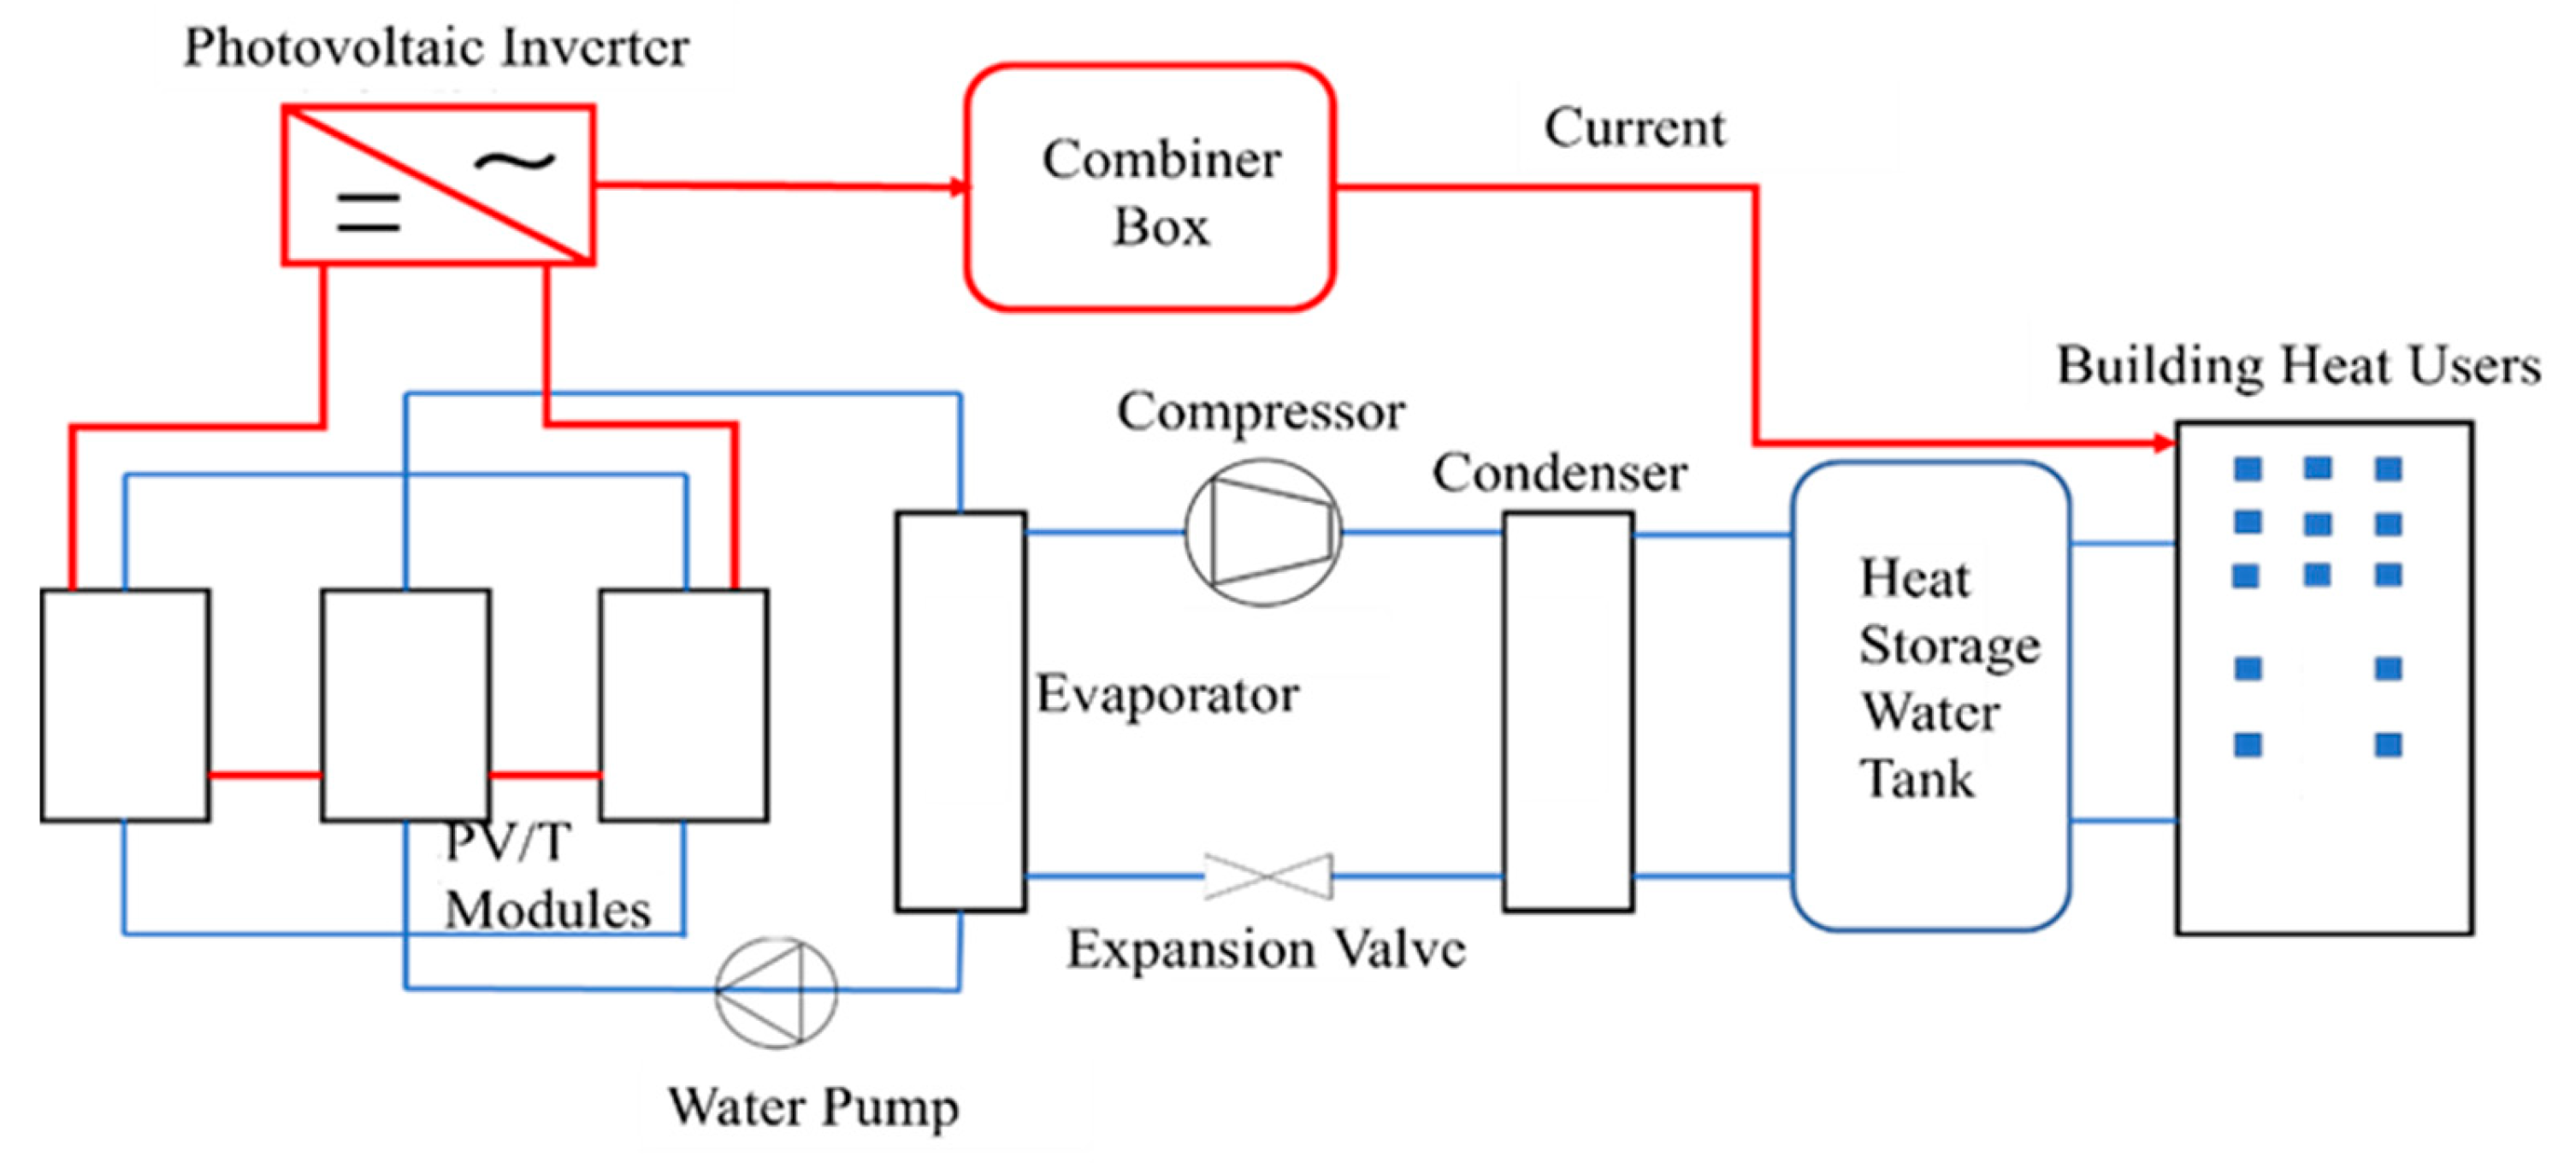
Figure 2.
(a) Structure Diagram of PV/T Photovoltaic Photothermal Module; (b) Energy Conservation Diagram of PV/T Photothermal Module.
Figure 2.
(a) Structure Diagram of PV/T Photovoltaic Photothermal Module; (b) Energy Conservation Diagram of PV/T Photothermal Module.
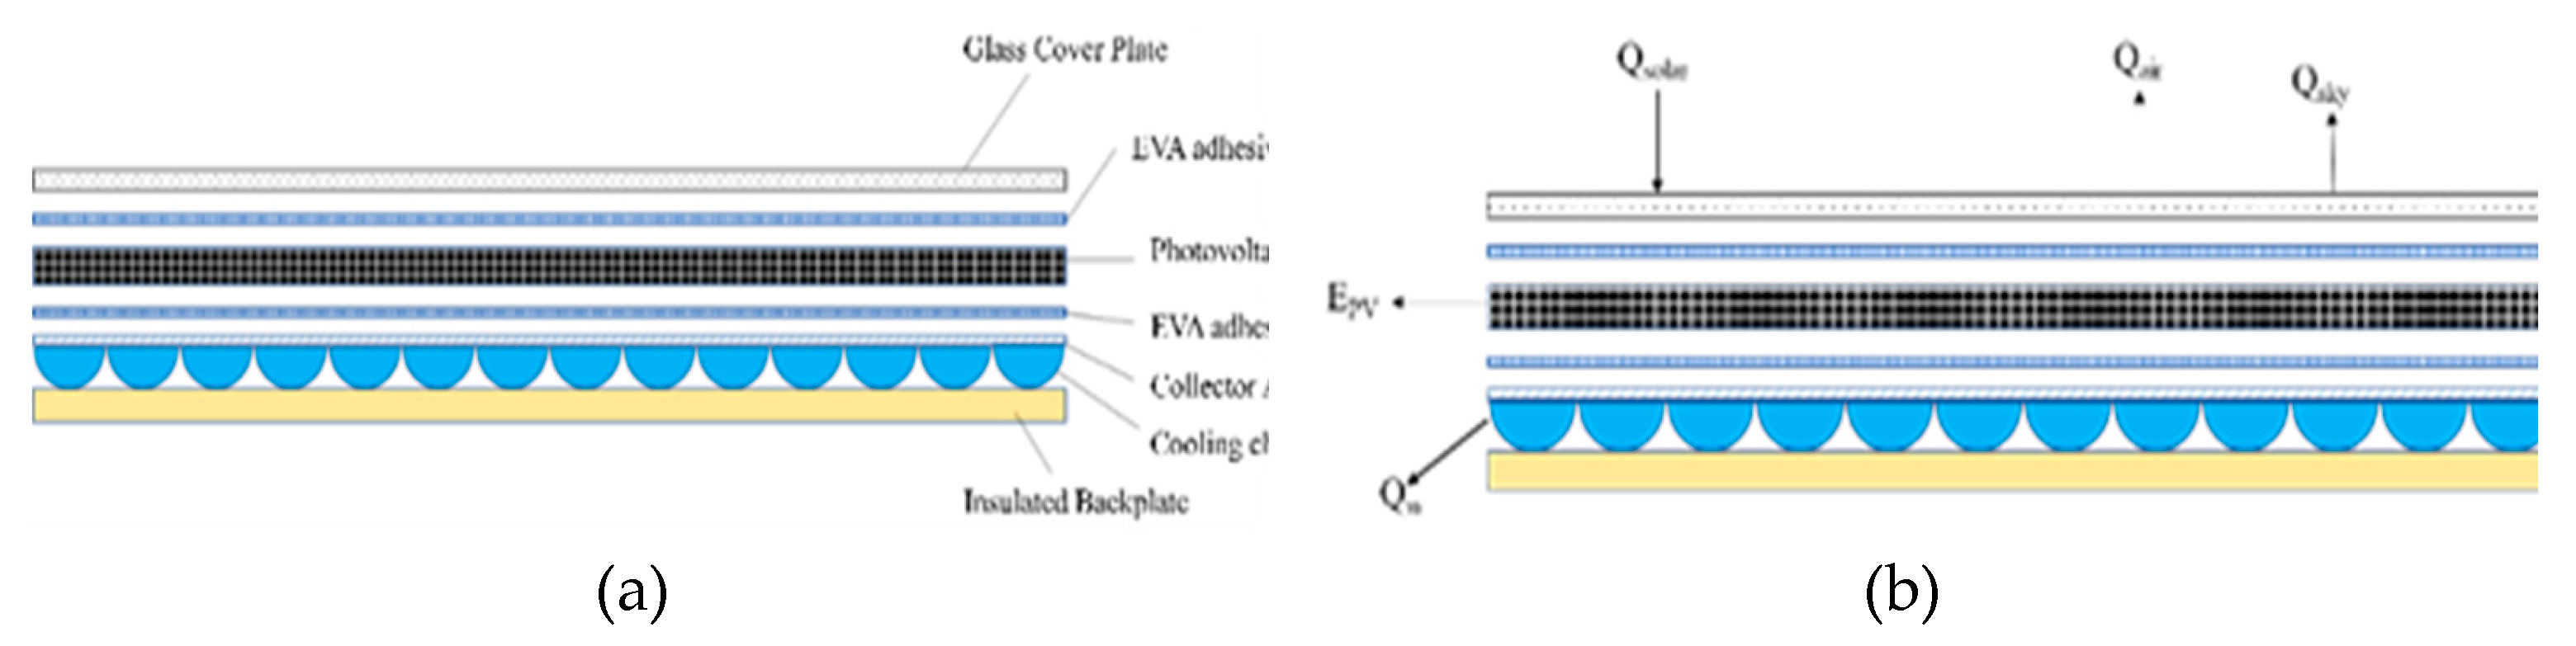
Figure 3.
PV/T Photothermal Modules Model of Heat Pump System.
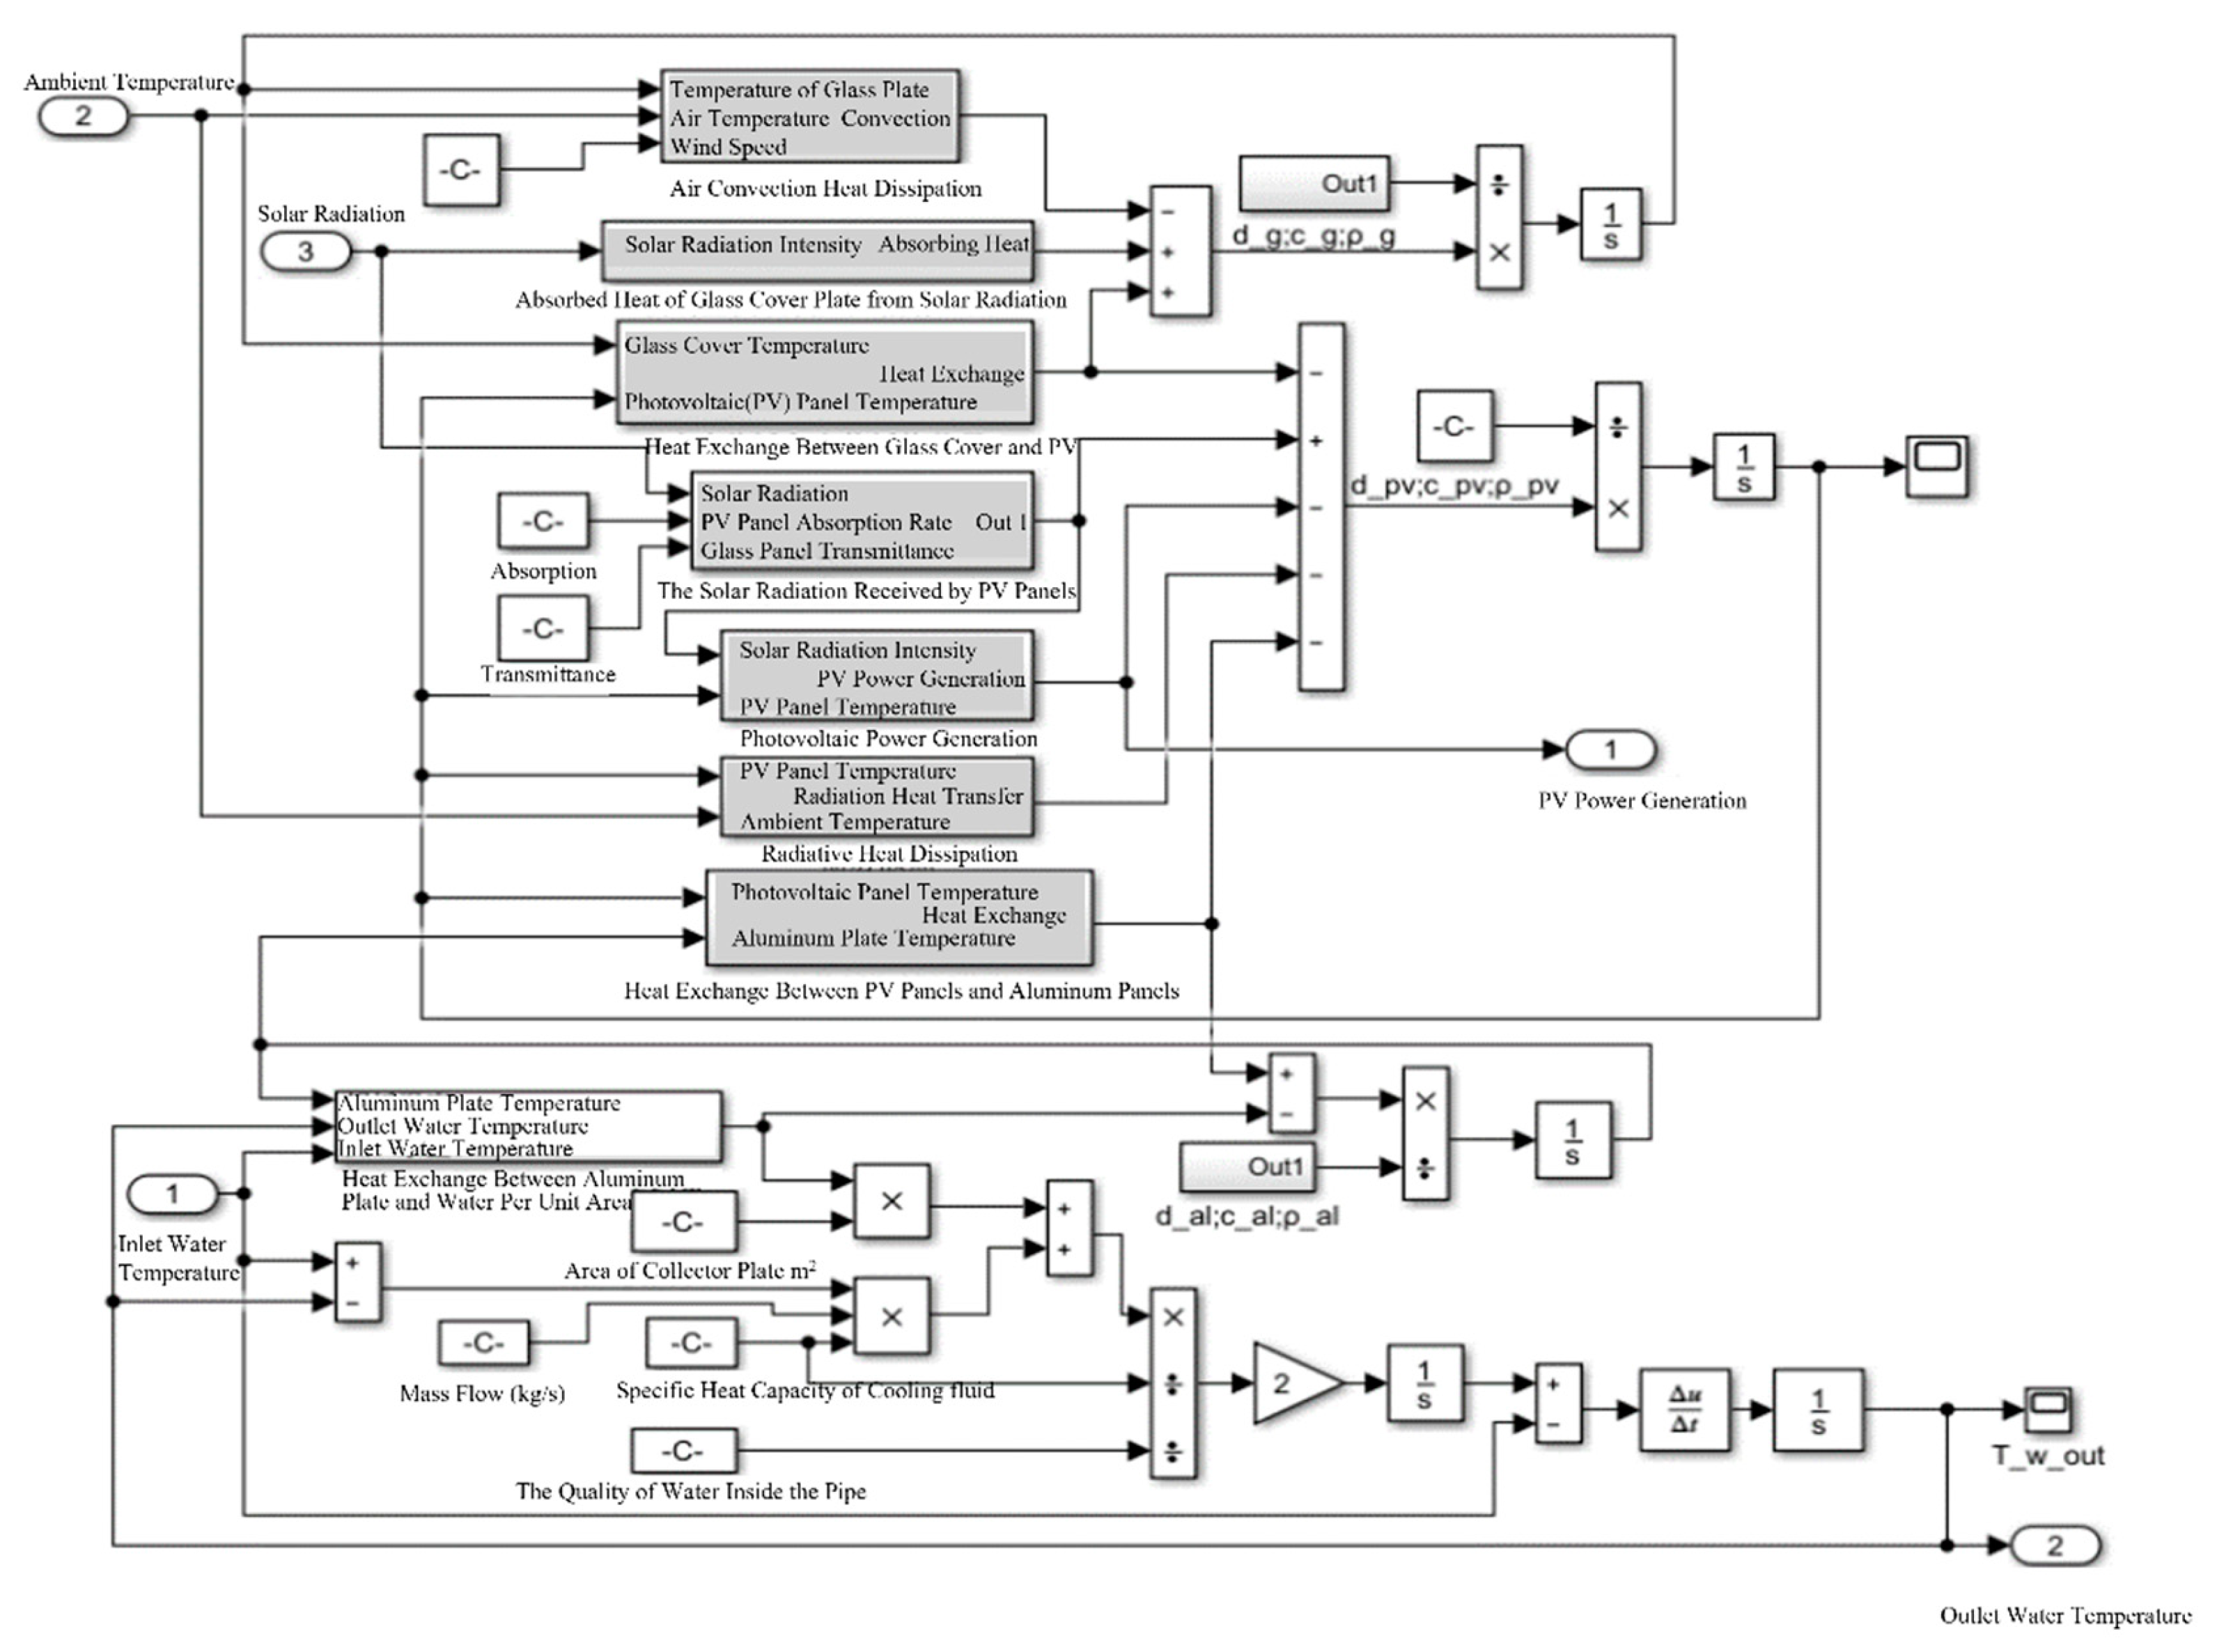
Figure 4.
PV/T Heat Pump System Model.
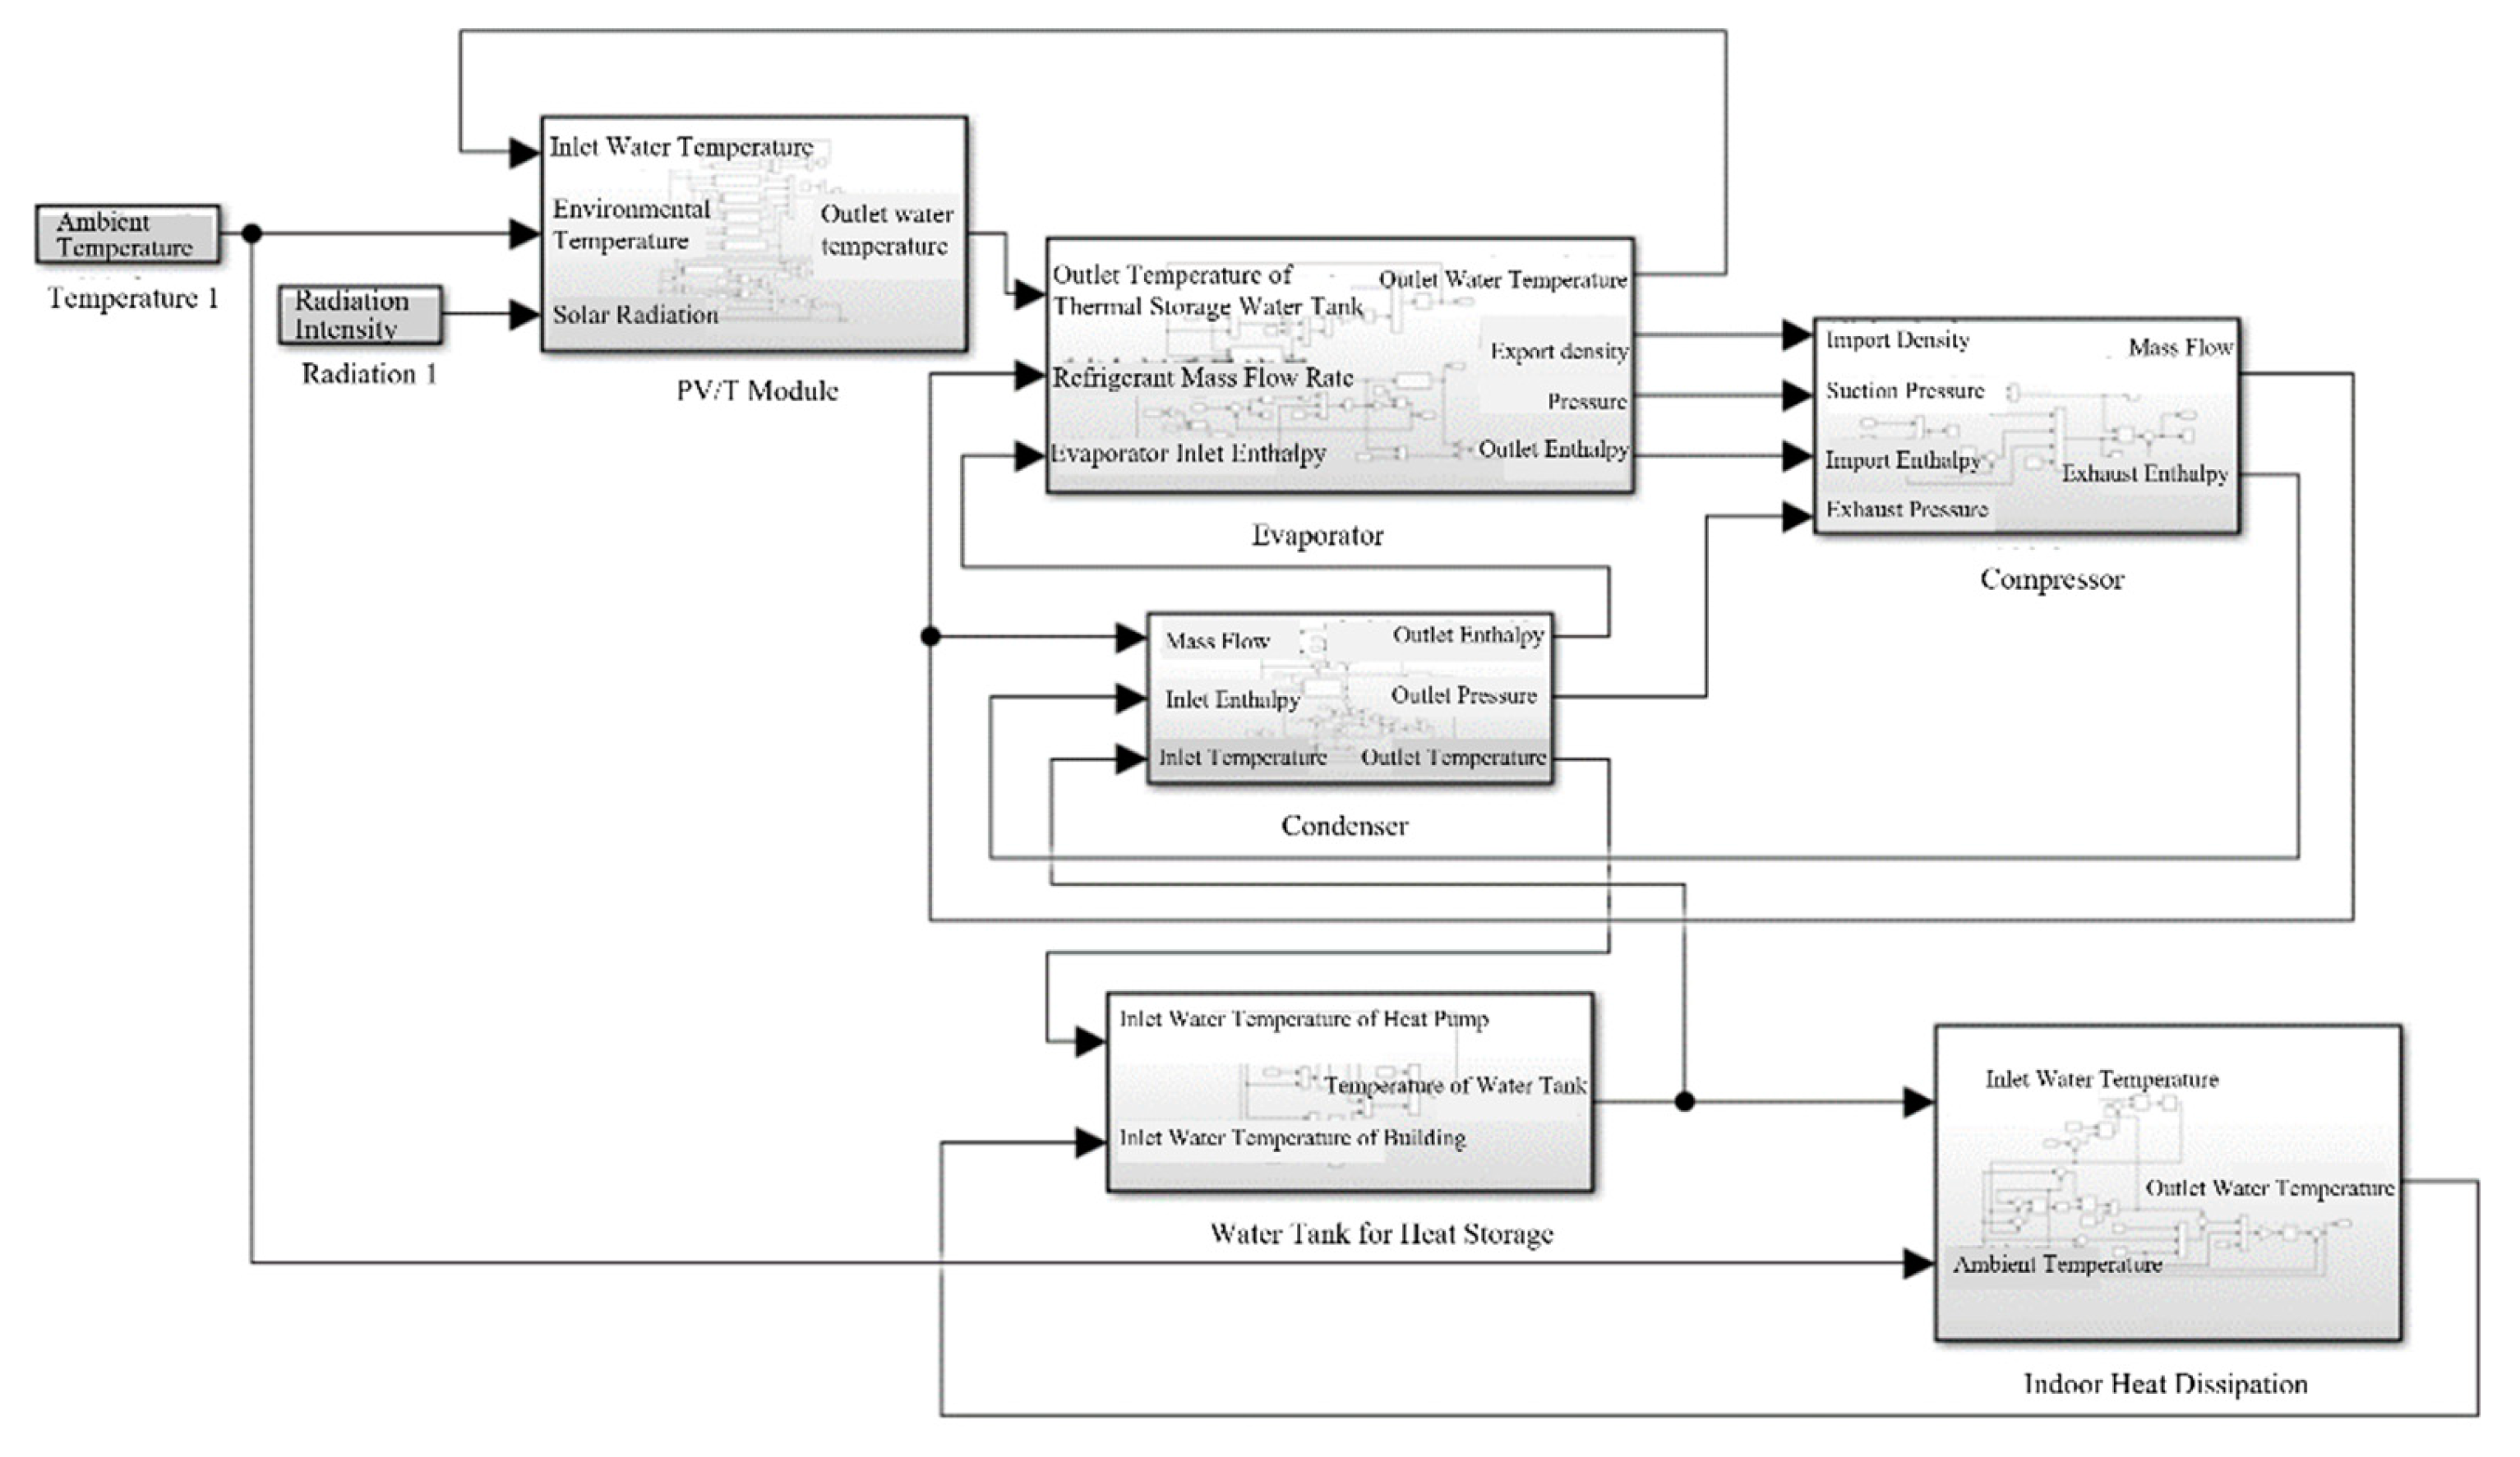
Figure 5.
(a) Temperature Comparison between PV/T Modules and Ordinary Photovoltaic Panel (Summer Conditions) ;(b) Comparison of Photovoltaic Conversion Characteristics between PV/T Modules and Ordinary Panel (Summer Conditions).
Figure 5.
(a) Temperature Comparison between PV/T Modules and Ordinary Photovoltaic Panel (Summer Conditions) ;(b) Comparison of Photovoltaic Conversion Characteristics between PV/T Modules and Ordinary Panel (Summer Conditions).
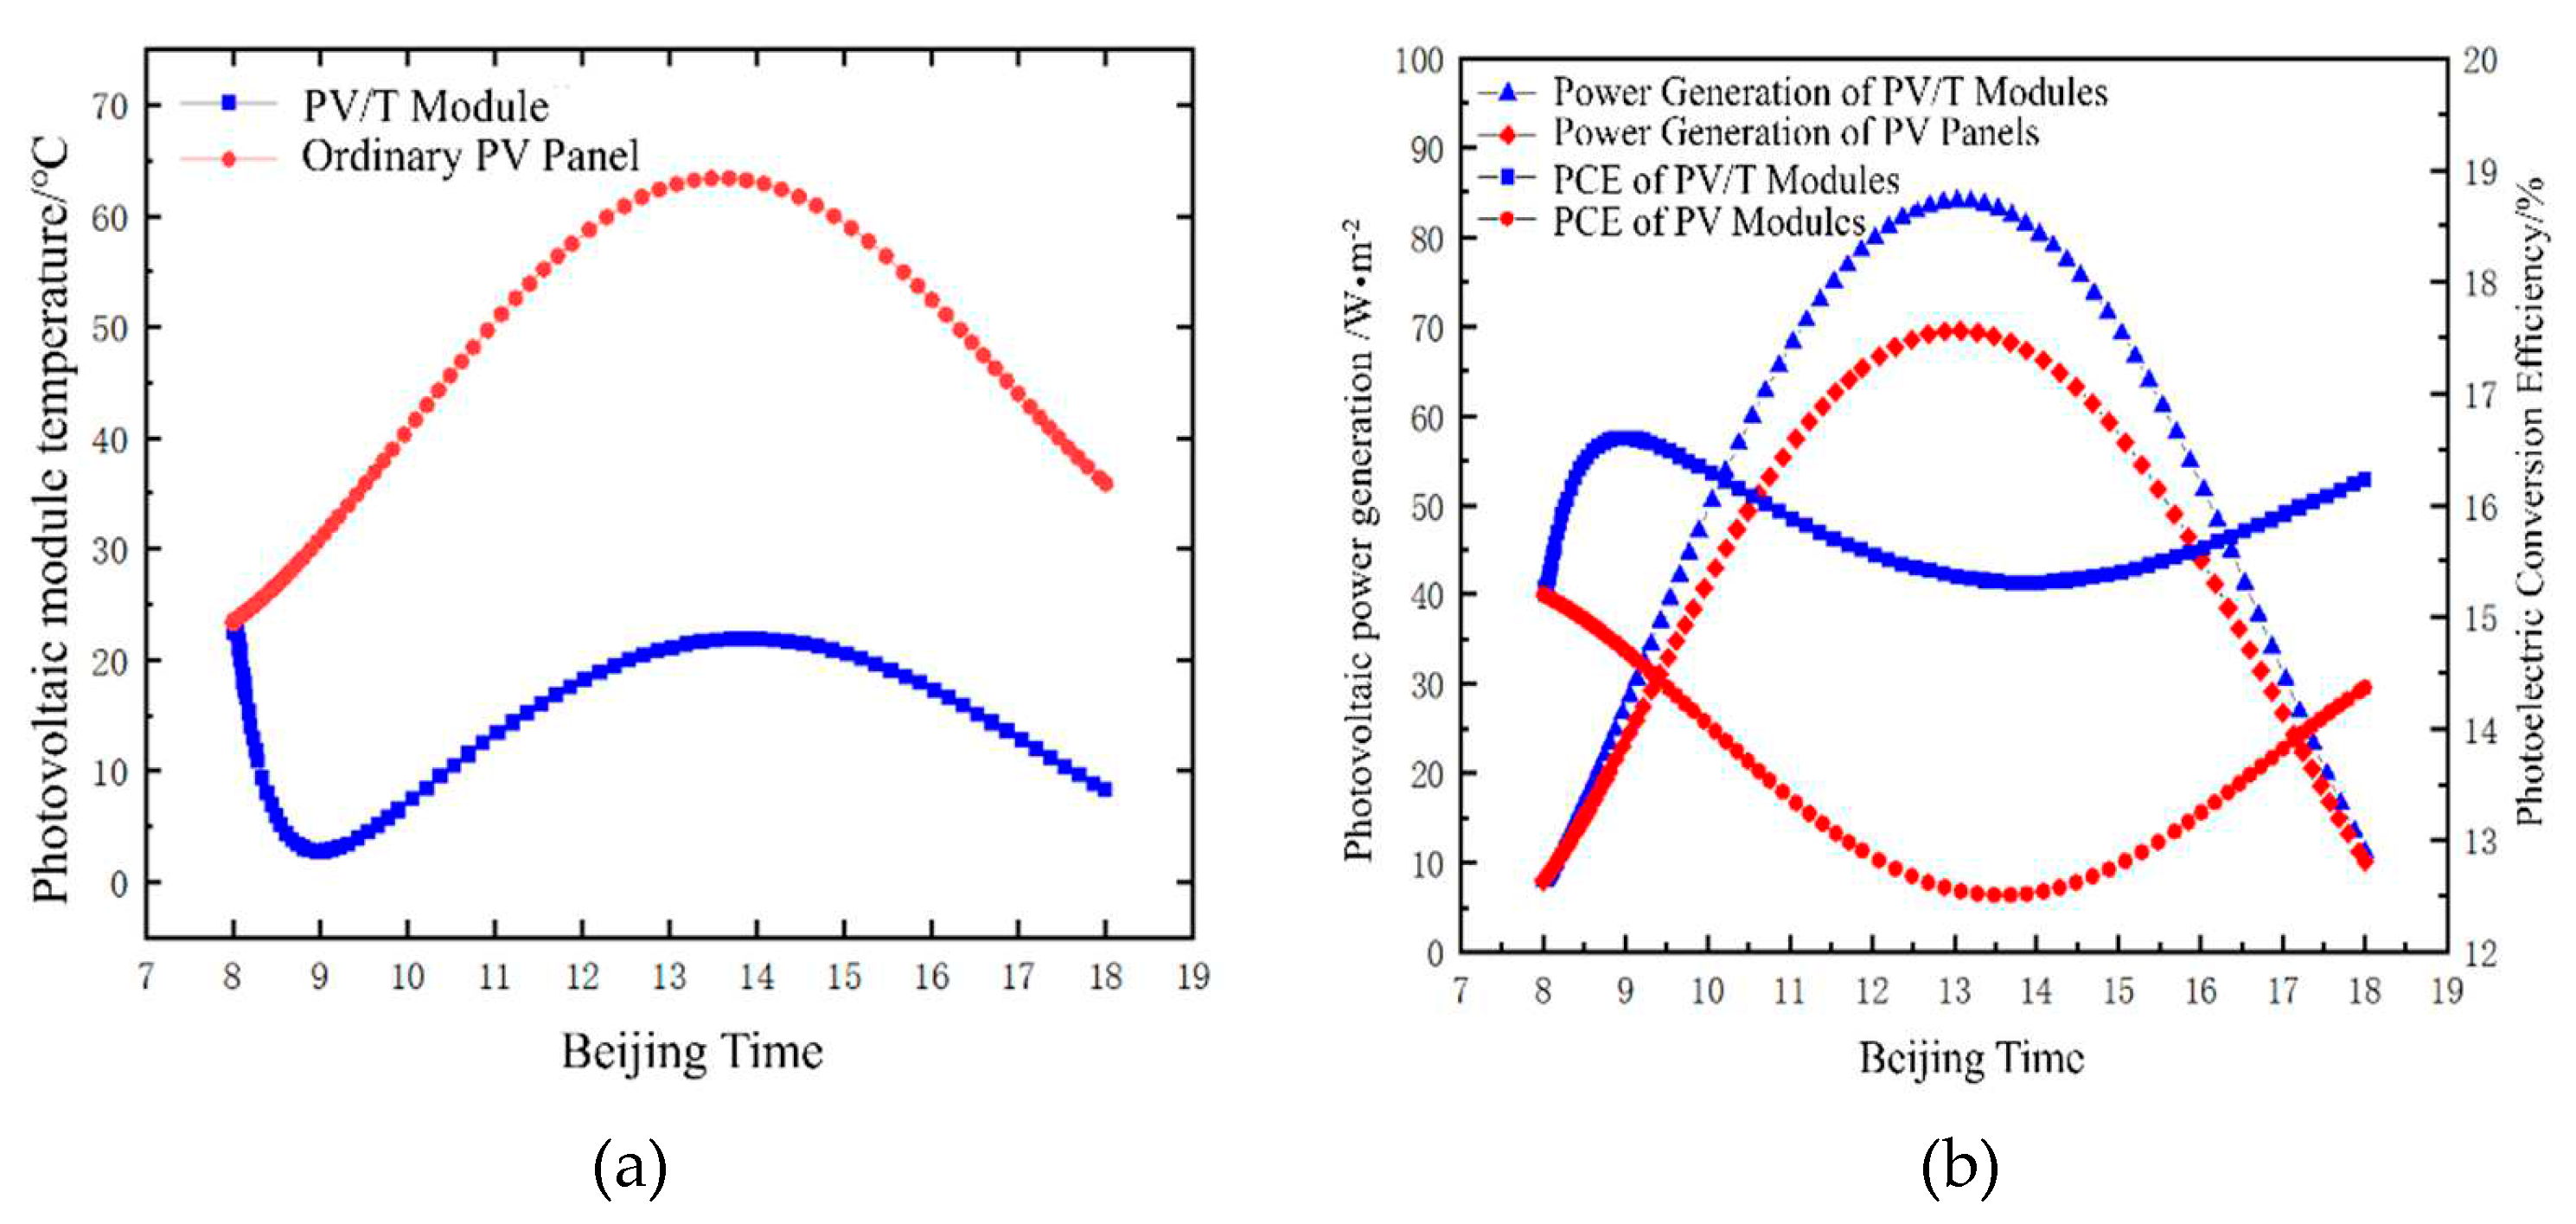
Figure 6.
(a) Temperature Comparison between PV/T Modules and Ordinary PV Panel (Winter Conditions);(b) Comparison of Photovoltaic Conversion Characteristics between PV/T Module and Ordinary PV Panel (Winter Conditions).
Figure 6.
(a) Temperature Comparison between PV/T Modules and Ordinary PV Panel (Winter Conditions);(b) Comparison of Photovoltaic Conversion Characteristics between PV/T Module and Ordinary PV Panel (Winter Conditions).
Disclaimer/Publisher’s Note: The statements, opinions and data contained in all publications are solely those of the individual author(s) and contributor(s) and not of MDPI and/or the editor(s). MDPI and/or the editor(s) disclaim responsibility for any injury to people or property resulting from any ideas, methods, instructions or products referred to in the content. |
© 2024 by the authors. Licensee MDPI, Basel, Switzerland. This article is an open access article distributed under the terms and conditions of the Creative Commons Attribution (CC BY) license (http://creativecommons.org/licenses/by/4.0/).
Copyright: This open access article is published under a Creative Commons CC BY 4.0 license, which permit the free download, distribution, and reuse, provided that the author and preprint are cited in any reuse.


