
Submitted:
22 March 2024
Posted:
03 April 2024
You are already at the latest version
Abstract
Research has shown that the consumption of herbal teas is linked with positive effects on the regulation of postprandial blood glucose level. In this study, a comparative analysis of aqueous and ethanol extractions is performed on four herbal teas (Mallotus, Cyclocarya, Rubus, Vine) to evaluate their phytochemical profiles and functional activities. Investigations of phytochemical contents, antioxidant activities, α-glucosidase inhibitory activities and chemical compositions are carried out through colorimetric analyses and UPLC-Q-Orbitrap HRMS/MS, respectively. Results showed that among the studied herbal teas, Vine exhibited the highest glucose re-gulating abilities under both aqueous and ethanol extractions. Overall, ethanol extracted samples yielded higher phytochemicals content, but the compositions of the phytochemicals varied. Meanwhile, aqueous extracts showed surprisingly strong antioxidant activities and comparable α-glucosidase inhibitory activities with ethanol extracts. Phytochemicals contents presented a positive correlation with antioxidant activities and α-glucosidase inhibitory activities. Nevertheless, antioxidant activities displayed a weak positive correlation with α-glucosidase inhibitory activities. Results from this study provided evidence that aqueous extracts from herbal teas possessed valuable phytochemicals composition for antioxidants and the hyperglycemic populations, and are promising candidates for potential applications as functional ingredients with health promoting effects and as natural additives to boost the nutritional value of herbal food products.
Keywords:
herbal tea
; phytochemicals
; antioxidant
; α-glucosidase
1. Introduction
Diabetes mellitus is a type of metabolic disorders with hyperglycemia which could induce disruptions of insulin secretion [1]. Meanwhile, postprandial hyperglycemia is a symptom of diabetes mellitus, and the regulation of postprandial hyperglycemia indeed plays vital roles for the treatments of diabetic patients. For instance, studies have found that regardless of diabetics or unaffected individuals, α-glucosidase played crucial parts in the adjustment of postprandial hyperglycemia [2]. With increasing research interests regarding α-glucosidase, presences of α-glucosidase were found within the epithelium of the human intestines, and the inhibitions of such α-glucosidase could serve as potential targets of postprandial hyperglycemia regulations for diabetic patients. As a result, inhibition of α-glucosidase enzyme activities has become a promising strategy to regulate blood glucose levels [3], and therefore triggered great significances of natural α-glucosidase inhibitors for the well-being of diabetic patients.
In recent years, health benefits from the consumption of plant-based products have attracted increasing consumer and research attentions. These are partly due to the rich content of healthy active ingredients from plants and plant-based products, such as dietary phytochemicals, considered as active ingredients with numerous health beneficial effects [4]. Meanwhile, several epidemiological and preclinical studies have reported that the consumptions of herbal tea could lower the risk of chronic diseases, such as cancer, cardiovascular disease [5], diabetes mellitus [6], and more. China is a major country of tea productions with high quality and wide variety of teas existed around the world. Traditionally speaking, tea was produced from the leaves and/or leaf buds of Camellia sinensis. In practice, the leaves, flowers, fruits, roots and other components from herbs or plants were processed for drink infusion worldwide and regarded as herbal tea, such as male papaya flower [7], Eucommia ulmoides [8], magnolia flower. Herbal tea with antioxidative and antidiabetic potentials is also consumed as health promoting goods in different regions of the world with low side effects, which has demonstrated important industrial values [9]. More importantly, consumptions of herbal teas and the provided benefits have been advised as alternatives to pharmacology for improving health and reducing pain toward certain diseases [10]. Therefore, there have been increasing demands for research studies to analyze the mechanisms of herbal tea and its phytochemicals’ physiological activities, which would be applicable across a mass of research and practical applications for pharmaceutical, plantation and food industry. According to previous studies, aqueous and organic solvent extractions for phytochemical compound were the most commonly performed extraction methods [11, 12], which could be applied to extract a certain content of phytochemicals from plants [13]. Previous researches have pointed out that the ethanol extracts of phytochemicals tend to possess strong bioactivities [14, 15]. However, aqueous extraction is more commonly employed in daily consumption and the extracts present health effects on human body.
In general, phenolics could interact with metabolic enzymes in the human body, and could affect the activities of these metabolic enzymes [16]. For instance, research has revealed that the interactions between phenolics from diet and metabolic enzymes could result in impacts toward human health [17], and the mechanisms of such interactions are worth exploring. Though there have been reports regarding the interactions between flavonoids and α-glucosidase, there have been a lack of study in regard to the interactions of phytochemical contents from non-camellia herbal teas with α-glucosidase. Therefore, further investigations on the interactions between non-camellia herbal teas with α-glucosidase are crucial to promote their health benefits as well as practical applications. Mallotus, Cyclocarya, Rubus and Vine (Table 1) are common herbal tea drinks consumed among China and several southeast Asian countries due to their taste profiles, and are believed to have beneficial effects on human body such as antioxidant and anti-diabetic activities [18, 19]. However, the hypoglycemic activity of the four herbal teas extracted with different extraction methods remained relatively unclear, and especially the correlation between antioxidant and hypoglycemic effect is in need for further exploration to better understand herbal teas’ health beneficial functionalities.
In light of the above reasonings, this study was aimed to evaluate the total phenolics, total flavonoids, and total flavonol contents of phytochemicals, as well as the respective antioxidant activities and inhibitions of ɑ-glucosidase activity of the four herbal tea extracts extracted with hot-water and ethanol methods (Table 1). Moreover, the phytochemical profiles of the four herbal tea extracts were further investigated through in depth HPLC-DAD-Q-Orbitrap HRMS/MS analyses.
2. Materials and Methods
2.1. Chemicals
Gallic acid was obtained from Sigma-Aldrich (Saint Louis, MO, USA). Rutin was bought from Shanghai Macklin Biochemical Co., Ltd. (Shanghai, China). Catechin and 2,2′-azinobis(3-ethyl-benzothiazoline-6-sulfonic acid) diammonium salt (ABTS) were acquired from Aladdin Biochemical Technology Co., Ltd., (Shanghai, China). 1,1-Diphenyl-2-picrylhydrazyl (DPPH) was obtained from Shanghai Yuanye Biotechnology Co., Ltd., (Shanghai, China). The other reagents were analytically pure.
2.2. Sample Preparation
Four herbal teas were bought from local market (Table 1). Specifically, Mallotus tea (Mallotus oblongifolius (Miq.) Müll.Arg.) was yielded from Baoting, Hainan Province, China; Rubus tea (Rubus savissimus S. Lee) was planted in Jinxiu, Guangxi Province, China; Cyclocarya tea (Cyclocarya paliurus) was produced in Xiangxi, Hunan Province, China; Vine tea (Ampelopsis grossedentata) was obtained from Zhangjiajie, Hunan Province, China. All herbal teas were crushed at room temperature and passed through a screen with 60-mesh sieve, the powders were stored at -25 ℃ until further analysis.
Aqueous extraction: herbal teas powder (1 g, 60 mesh) was blended with 50 mL boiling distilled water in a 95 ℃ water bath for 6 min before vacuum filtration, and the residue was repeated twice. All collected perfiltration fluid was transferred to volumetric flask (200 mL) with distilled water to 200 mL tick mark and stored under -20 ℃ until analysis. Organic extraction: herbal teas powder (1 g, 60 mesh) was blended with 50 mL ethyl alcohol in 60 ℃ for 30 min before vacuum filtration, and the residue was repeated twice. All collected perfiltration fluid was transferred to volumetric flask (200 mL) with distilled water to 200 mL tick mark and stored under -20 ℃ until analysis.
2.3. Determination of Total Phenolic Content (TPC)
The TPC was determined using the Folin-Ciocalteu reagent method following previous report[20]. Briefly, tested extracts or gallic acid solution were mixed with Folin-Ciocalteu reagent and kept for 6 min at ambient temperature; then blended with Na2CO3 (7%) solution and purified water, respectively; After 90 min at ambient temperature, the final mixture would be measured at 760 nm. With gallic acid employed as a standard, the total phenolic content was shown as milligrams of gallic acid equivalent (GAE) per gram of dry weight (DW).
2.4. Determination of Total Flavonoid Content
The total flavonoid content was analyzed through NaNO2-AlCl3 colorimetric assay according to the previous report [21]. Briefly, samples and standard solution were mixed with NaNO2 (5%, w/v) and purified water, respectively. Keeping for 5 min at ambient temperature, AlCl3 (10%, w/v) solution was blended with mixture. More 6 min, NaOH (1 M) solution and purified water were added to colorimetric tube, respectively, and the resulting mixture was read at 510 nm. With catechin as the reference, the total flavonoid content was shown as milligrams of catechin equivalent (CE) per gram of DW.
2.5. Determination of Total Flavonols Content
The total flavonols content was measured using NaOAc-AlCl3 colorimetric method [22]. Briefly, extracts and standard solution were blended with AlCl3 (20 mg/mL) and sodium acetate solution (50 mg/mL), respectively. Keeping for 150 min, the absorbance of the mixture was immediately measured at 440 nm. Rutin was employed as the standard, and the flavonols content was expressed as mg rutin equivalent (RE)/g DW.
2.6. Determination of 2,2-Diphenyl-1-Picrylhydrazyl Radical (DPPH) Scavenging
The DPPH scavenging assay was carried out according to previous report [23]. Briefly, extracts and standard solution were mixed with DPPH working solution (1:1, v/v) kept in dark for 30 min. The absorbance was analyzed at 515 nm. Results were compared against the standard curve prepared with quercetin and were expressed as mg quercetin equivalents (QE)/g DW.
2.7. Determination of 2,2′-Azino-bis(3-ethylbezothiazoline-6-sulfonic acid) Radical Cation (ABTS•+) Scavenging
The ABTS assay was performed referring to a previous study [24]. The radical cation working solution was prepared through ABTS [2,2′-azinobis-(3-ethylbenzothiazoline-6-sulfonic acid) diammonium salt] (7 mM) and K2S2O8 (140 mM). The absorbance of ABTS working solution was diluted to 0.70 ± 0.02 using phosphate (50 mM). Extracts and standard solution were blended with ABTS working solution in the dark for 10 min, and the resulting mixtures’ absorbance was analyzed at 734 nm. Inhibition values were obtained according to the equation:
where = absorbance of the samples, = absorbance of the control. Results were calculated using a standard curve of Trolox and expressed as mmol TE/g DW.
2.8. Determination of α-Glucosidase in Hibition In Vitro
Analysis of α-glucosidase inhibition was performed with the previously described method [2]. In brief, α-glucosidase was prepared with phosphate buffer saline (0.1M, pH 6.8), and 4-nitrophenyl-α-D-glucopyranoside (p-NPG) was applied as the substrate. Pre-diluted tea infusion was mixed with α-glucosidase solution for 10 min under 37 ℃. The reaction was started with the addition of the substrate, and the mixture was maintained for 20 min under 37 ℃. In the end, 1 mL absolute ethanol was added into the mixture as enzyme inhibitor for p-nitrophenyl release, and the absorbance was measured at 405 nm. Blank and positive control was established with absolute ethanol and acarbose, respectively. The rate of inhibition (%) toward α-glucosidase was calculated as below:
where and represent the absorbance of the control and sample, respectively. Substrate was present in all these groups. Inhibitory activity is expressed as efficient concentration EC50: the sample concentration (μg/mL) required to obtain 50% activity.
2.9. Determination of Enzyme Kinetics Assays for α-Glucosidase
The reversible assays of herbal tea extracts against α-glucosidase were established through a concentration gradient of p-NPG with varying concentrations of herbal tea extract, respectively. For determination of the specific inhibition kinetic, the velocity of the reaction was carried out at different concentrations of substrate and herbal tea extract. In the mode of α-glucosidase inhibition assay, a gradient of 0.2, 0.4, 0.6, 0.8and 1 mM p-NPG was applied as the substrate. Lineweaver-Burk plots were employed to determine the inhibition kinetics, including the plot of 1/ν versus 1/[S].
2.10. UPLC-Q-Orbitrap HRMS/MS Analysis
UPLC analysis was performed with the Dionex 3000 Ultimate UPLC system equipped with auto-sampler, and was coupled with a Q-Exactive Orbitrap HRMS/MS (Thermo Fisher, MA, USA). Acquity UPLC BEH C18 column (2.1 mm×100 mm, 1.8 μm) was applied and operated at 35 ℃. Mobile phase composition followed (A) 0.1% formic acid in water, and (B) acetonitrile with a flow rate of 0.3 mL/min.
MS analysis was carried out with a heated electrospray ionization source under negative ionization mode. The mass parameters were established as follows: auxiliary gas flow, 10 arb; sheath gas flow, 45 arb; spray voltage, 3500 V; mass scan range, m/z 100-1000; auxiliary gas heater temperature, 100 ℃; capillary temperature, 350 ℃. A data-dependent program was picked for tandem mass spectrometry data acquisition, and the most affluent precursor ions were chosen for MS/MS analysis. The collision energy of collision-induced dissociation and high-collision energy dissociation mode was limited to 35% of the maximum.
2.10.1. Cyclocarya Tea
The elution parameters were: 0-5 min, 5%-18% B; 5-8 min, 18%-20% B; 8-13 min, 20%-25% B; 13-18 min, 25%-80% B; 18-20 min, 80%-80% B; followed by 5 min of re-equilibration.
2.10.2. Mallotus Tea
The elution parameters were: 0-7 min, 5%-10% B; 7-21 min, 10%-20% B; 21-24 min, 20%-50% B; followed by 5 min of re-equilibration.
2.10.3. Rubs Tea
The elution parameters were: 0-6 min, 5%-10% B; 6-20 min, 10%-15% B; 20-30 min, 15%-20% B; 30-34 min, 20%-50% B; followed by 5 min of re-equilibration.
2.10.4. Vine Tea
The elution parameters were: 0-3 min, 5%-12% B; 3-11 min, 12%-15% B; 11-16 min, 15%-30% B; 16-20 min, 30%-80% B; followed by 5 min of re-equilibration.
2.11. Statistical Analysis
Statistical analyses were performed using SPSS software (SPSS Inc., Chicago, IL, USA). The significance was fixed at P < 0.05. All data were presented as the mean ± SD from at least three replications.
3. Results and Discussion
3.1. Phytochemicals in Herbal Extract
3.1.1. Total Phenolic Content
Exploration of the phytochemical compositions of herbal teas would provide useful information for their application potentials, while phenolic is one of the common phytochemicals within herbal teas. Phenolic compounds have received increasing consumer and research attention because of their exhibited health effects [25]. The detected total phenolic content in aqueous extracts and ethanol extracts are displayed in Figure 1. The results showed that the four herbal tea extracts, extracted by either the aqueous or ethanol methods, exhibited significant differences in the content of active ingredients (P < 0.05). The TPC values of four herbal tea extracts varied from 3.86 ± 0.79 to 66.12 ± 2.98 mg GAE/g DW (Figure 1). Among which, Vine possesses the highest phenolic content. In detail, by aqueous extraction, Vine has the highest TPC value (35.77 ± 1.31 mg GAE/g DW, P< 0.05), followed by Mallotus > Cyclocarya > Rubus, respectively. Similarly, with ethanol extraction, Vine has the highest TPC value (66.12 ± 2.98 mg GAE/g DW), followed by Mallotus > Cyclocarya > Rubus, respectively. The differences of total phenolic content were significant among the four herbal tea varieties (P < 0.05). Total phenolic contents from the two extracts are similar with that of Nettle (Urtica dioica) Leaves using methanol, water and ethanol extractions [26]. The total phenolic contents of Mallotus and Vine are lower than that of the young leaves of M. toringoides [27], which could be due to the testing method used. The total phenolic contents of Rubus leaf are lower than that of the Rubus fruit, which are about one tenth [28]; In which, factors such as the origin, variety, harvest time, parts, extraction method, and analytic method could have resulted in variations the phenolic content of the tested samples. Overall, results from the phenolic content assay demonstrated that ethanol extraction displayed higher phenolic content. Therefore, ethanol extraction method could be a preferred method for extracting phenolic from herbal teas.
3.1.2. Total Flavonoid Content
Flavonoids are common dietary phytochemicals found in plant origin foods, such as tea [20], fruits [29], and vegetables [30]. Previous epidemiological studies have pointed out flavonoids intake could lower the risk of chronic diseases [31]. The analyzed values of total flavonoid content from the herbal tea extracts are presented in Figure 2, and by comparison higher total flavonoid contents were obtained by ethanol extraction method. Across different varieties, the flavonoid content value varied from 0.26 ± 0.02 mg CE/ g DW to 1.89 ± 0.06 mg CE/ g DW. The differences in flavonoid content of four herbal tea extracts yielded a pattern different from that of the phenolic content. Vine from ethanol extraction has the highest total flavonoid content (1.89 ± 0.06 mg CE/ g DW, P < 0.05) in all samples, followed by Mallotus > Rubus > Cyclocarya. Meanwhile, it is interesting that Rubus possesses the highest total flavonoid content (0.79 ± 0.01 mg CE/ g DW, P < 0.05) from aqueous extraction, followed by Mallotus > Vine > Cyclocarya. The total flavonoid contents from most of the tested sample are higher than that of Lemon Balm (Melissa officinalis L.) herbal tea in hot and/or cold extracts [32]. However, the total flavonoid contents from most tested sample are similar with that of highly consumed leaf teas and herbal infusions in Spain [33], which indicated that there was little difference in leaf samples from different origin. For extraction, these results again confirmed that ethanol extraction method could be a preferred method for extracting flavonoids from herbal teas.
3.1.3. Total flavonol content
Flavonols, belonged to flavonoid [34], are widely present in plant products, such as tea, grape, onions, and more. It has been confirmed that flavonols exhibited strong antioxidant and anti-inflammatory activities from in vitro studies [35]. The determined total flavonol content from four herbal tea extracts acquired from ethanol and aqueous methods are shown in Figure 3. The total flavonol content values of different herbal tea extracts varied from 2.09 ± 0.33 RE/ g DW to 24.98 ± 0.49 mg RE/ g DW. With ethanol extraction, Vine displayed the highest total flavonol content (24.98 ± 0.50 mg RE/ g DW, P< 0.05), while the lowest total flavonol content was obtained from Cyclocarya through aqueous extraction (2.09 ± 0.33 RE/ g DW, P < 0.05). More specifically, with ethanol extraction, Vine had the highest value of total flavonol content (P < 0.05), followed by Cyclocarya > Mallotus > Rubus. While with aqueous extraction, Vine also had the highest value of total flavonol content, followed by Mallotus > Rubus > Cyclocarya. The recommended flavonol intake is about 29 mg per day for adults [36], and results from the total flavonol content analysis suggested that Vine tea could serve as one of the best dietary supplement for flavonol intake among the four herbal teas. At the same time, the flavonol contents from most of the ethanol extracts were similar with that of Camellia tea leaf [37], which revealed that ethanol extraction method would provide valuable dietary flavonol.
3.2. Percentage Contribution of Flavonoid/Flavonol to Phenolics
On a molar basis, the percentage contribution of flavonoids/flavonol to phenolics was estimated and demonstrated in Figure 4. The contributions of total flavonoids to total phenolics ranged from 1.12 to 12.05 %, indicating flavonoids composed of only a samll part of phenolics for the four herbal teas. At the same time, the contribution of flavonoids to phenolics was the highest in aqueous extraction of Rubus (12.05 ± 0.14 %), followed by ethanol extraction of Rubus (9.96 ± 0.10 %), then ethanol extract of Cyclocarya (3.13 ± 0.10 %), and was lowest in aqueous extractof Vine (1.12 ± 0.04 %). However, the percentage contribution of flavonoid to phenolics of the four tested herbal teas was lower than that of Adinandra leaves [20]. The factors affecting the phenolic and flavonoid levels within herbal teas could be season, location, climate, variety, species, the age of the leaf plucked, manufacturing conditions and processes, as well as particle sizes [38]. Gao et al. [39] also pointed out that flavonoids tend to be unstable when exposed to high temperature and light for long period of times, which could result in inactivation and/or degradation. However, tea processings almost always involve light and heat, which may cause different degrees of flavonoids loss in tea, and leads to variedtesting results. Besides flavonoids, the contributions of total flavonols to total phenolics ranged from 7.25 to 33.20%, indicating that flavonol made up of larger part of phenolics in the four herbal teas. The contribution of flavonol to phenolics was the highest in aqueous extracted Rubus (33.20 ± 0.30 %) and the lowest in aqueous extracted Mallotus (7.25 ± 0.34 %). Nevertheless, there were no significant differences among the three samples: Cyclocarya ≈ Vine ≈ Mallotus, indicating flavonols were one of the major phenolics within Euphorbiaceae. With ethanol extract, the contribution of flavonol to phenolics was the highest in Rubus (27.67 ± 0.30 %), followed by Cyclocarya > Vine ≈ Mallotus. The percentage contribution of flavonol to phenolics was higher than that of flavonoid to phenolics, which showed that the four tested herbal teas were good the potential sources of dietary flavonol, especially Rubus aqueous extract. Overall, the results demonstrated that the ethanol extraction was beneficial for obtaining phytochemicals from the herbal teas.
3.3. Antioxidant Activity
Research have shown that supplemental antioxidants can lower the overproduction of free radicals and could play critical roles for promoting good health [40]. It is therefore important to study the antioxidants activities of natural plant products for the development of plant-based functional foods [41]. Herbal tea phytochemicals are known to be potent antioxidants, in addition to numerous other beneficial effects on human health [42]. In vitro antioxidant activities were determined using DPPH radical scavenging assay and ABTS•+ radical cation scavenging assay. The DPPH radical scavenging ability of different extracts is displayed as EC50 value in Figure 5A. As a rule, the lower value of EC50, the higher radical scavenging ability. Ethanol extract of Vine had the lowest EC50 value (0.045 ± 0.002 mg/mL, P< 0.05), and ethanol extract of Rubus had the highest EC50 value (1.76 ± 0.04 mg/mL, P < 0.05) among all samples, indicating highest and lowest DPPH radical scavenging ability in Vine and Rubus with ethanol extraction, respectively. The general trend of DPPH radical scavenging ability with ethanol extraction was followed by Rubus < Cyclocarya < Mallotus < Vine. Meanwhile, through aqueous extraction the DPPH radical scavenging ability was followed by Cyclocarya < Rubus < Vine < Mallotus. Interestingly, the DPPH EC50 values of the four tested herbal teas were lower than that of the green and black tea originated from Indonesia [43], which indicated that the four herbal teas possessed stronger DPPH radical scavenging activity. As shown in Figure 5B, the ABTS•+ radical cation scavenging activity was similar to that of DPPH radical scavenging ability: in ethanol extracts, the ABTS•+ radical cation scavenging activity is ranked as Rubus < Cyclocarya < Mallotus < Vine, and in aqueous extracts, the ABTS•+ radical cation scavenging activity is ranked as Cyclocarya < Rubus < Mallotus < Vine. Overall, it is an interesting finding that most of the aqueous extracts displayed stronger antioxidant activity than that of ethanol extracts. Such results suggested that the aqueous extract could provide more benefits on the antioxidant aspect toward human health, inconsistent with the previous analysis results regarding phytochemical contents. Therefore, there may be interactions among the bioactive substances of herbal teas from the aqueous extracts.
3.3. α-Glucosidase Inhibitory Activity
ɑ-Glucosidase is one of the effective carbohydrate hydrolyzing enzymes, in which the ɑ-glucosidase inhibitors can regulate the postprandial carbohydrates hydrolysis and to lower postprandial glucose levels. Studies have reported that ɑ-glucosidase inhibitors from diet can be beneficial for long-term glycemic controls [44]. As shown in Figure 6, the EC50 of ɑ-glucosidase inhibitions of four herbal tea extracts varied significantly, from 0.02 ± 0.001 to 2.31 ± 0.07 mg/mL. Besides aqueous extract of Cyclocarya, other herbal tea extracts showed strong inhibitory activities. The inhibitory effect of aqueous extracts on α-glucosidase activity followed as Mallotus > Rubus ≈ Vine > Cyclocarya. While the inhibitory effect of ethanol extracts on α-glucosidase activity followed as Mallotus ≈ Vine ≈ Cyclocarya > Rubus. Similar to the antioxidant activity, most of the ethanol extracts presnted similar ɑ-glucosidase inhibition activity with that of aqueous extracts, with no significant difference. These results indicated the components that inhibit ɑ-glucosidase were similar with that of the antioxidants. Previous studies have found that although phytochemicals can be extracted easily with ethanol solvents [45], high photochemical conents may not directly resulted in high antioxidant activity. Since herbal tea is soaked in hot water in daily consumptions and phytochemicals are extracted into aqueous solvents, results from these analyses suggested that aqueous extraction methods of the herbal tea could indeed provide active substances for health benefits.
3.4. Inhibitory Types
To further analyze the inhibition types of the four herbal tea extracts on α-glucosidase, the sample concentration and substrate concentration were first fixed, and the enzymatic reaction was carried out in the same reaction system. According to the Lineweaver-Burk and Dixon double reciprocal curve mapping method, the double reciprocal curve was drawn to determine the type of enzymatic reaction competition. The double reciprocal curves were displayed in the Figure 7. The point of intersection of the straight line with the y-axis represents, and the point of intersection of the straight line with the x-axis represents. The slope of this line is K. As shown in Figure 7, the enzymatic reaction rate V changes with the substrate concentration [S]. For instance, during the enzymatic reaction, with the increase of sample concentration, the apparent Michaelis constant remained unchanged and the initial velocity of the maximum catalytic reaction decreased, indicating that the inhibition type of the four herbal tea extracts on α-glucosidase was non-competitive reversible inhibition. The inhibition types of the four herbal teas were different with that of green tea leaves from Nigeria [46], which indicated that herbal teas and green tea had different bioactive constituents on α-glucosidase inhibition.
3.5. Correlation between Phytochemical and Activities
Since the stronger the activity of four herbal tea extracts, the smaller the EC50 value, 1/EC50 is used to represent the activities of the samples when analyzing the correlation between the active ingredients and the antioxidant and hypoglycemic activities. In view of the fact that thousands of phytochemicals contribute to the biological activites [22, 47], it is not yet clear which substance is more responsible for the tested activity. The results of Pearson correlation coefficient between the active components of herbal teas and the antioxidant and hypoglycemic activities are shown in Table 2. The total phenolics content was significantly and positively correlated with DPPH radical scavenging and ABTS•+ radical scavenging abilities (P < 0.01), the results were consistent with previous findings [47]. And the correlation coefficients were 0.903** and 0.756**, respectively, indicating that tea phenolics were important factors influencing the antioxidant activity of the herbal teas. More importantly, the contents of total phenolics exhibited positive correlation with the inhibition of α-glucosidase, indicating that the in vitro hypoglycemic activity was related to the total polyphenol contents, and the results agree with our previous report [22]. At the same time, the DPPH free radical scavenging effect was significantly and positively correlated with the ABTS value (0.750, P < 0.01), indicating that these two methods of evaluating antioxidant activity can be mutually corroborated. The DPPH free radical scavenging ability and ABTS scavenging ability also displayed positive correlation with that of α-glucosidase inhibition. The stable usage of herbal plant antioxidants to improve the endogenous antioxidant self-defense could be one promising way to relieve oxidative stress in diabetic patients through reductions of free radicals, and by increasing intake of herbal plant antioxidants could lead to increasing activity of endogenous antioxidant enzymes [48, 49]. However, it is confusing that the total flavonoids and total flavonols contents showed negative correlation with ABTS scavenging ability and α-glucosidase inhibition. The correlation results suggested that flavonoid and flavonol inhibited ABTS scavenging ability and α-glucosidase inhibition. Inversely, the correlation demonstrated that the α-glucosidase inhibition and antioxidant activity of the herbal teas seemed to be greatly affected by polyphenols, in agreement with previous reports [22, 47].
3.6. UPLC-Q-Orbitrap HRMS/MS Analysis
Besides the previous investigations, rapid UPLC-Q-Orbitrap HRMS/MS analytical coupling technique was further applied to provide additional information on the chemical compositions of the phytochemicals extracted by water and/or ethanol from the four herbal teas. Specifically, UPLC-Q-Orbitrap HRMS/MS could provide comprehensive insights regarding the chemical structures and compositions of complex natural compounds with high specificity and sensitivity. In which, the precursor and product ions of the compounds present in the four herbal teas, as well as their corresponding mass and composition were thoroughly analyzed with chromatogram results presented in Figure 8. For instance, representative compounds in the four herbal teas were tentatively identified by comparison between the analyzed retention behavior, HRMS/MS data, and mass fragment characteristics with respective reference compounds present in previous studies and/or available literatures. The characterizations of the compounds are presented in Table 3-10, and the results suggested that the chemical constituents of the extracts from the four herbal teas are different. Seventeen phytochemicals were identified from Cyclocarya aqueous and ethanol extracts, where most of the identified substances were classified as glycosides, suggesting that glycosides were the main bioactive compounds, which was consistent with finding from previous studies [50]. Meanwhile, thirteen and fourteen phytochemicals were identified from Mallotus aqueous and ethanol extract, respectively. Similarly, for the case of Mallotus, the majority of the identified compounds were also glycosides, which were also consistent with previous studies [51, 52]. For Rubus, nineteen and eighteen phytochemicals were identified from the aqueous and ethanol extracts, respectively. The results could explain why Rubus possessed higher percentage contribution of flavonoid to phenolic, stronger antioxidant activities, and stronger ɑ-glucosidase inhibition. Previous data showed that the content of total phenolics constituents of Vine was the highest among four herbal teas with the strongest activity. However, only ten compounds in Vine were identified. It is possible that synergistic effects, which could enhance the biological activity [41, 42], might have been present within the chemical constituents of Vine. Dihydromyricetin was identified from Vine and has been shown to contribute to ɑ-glucosidase inhibition [53], suggesting that dihydromyricetin and others substances could have potential synergistic effect in Vine.

Table 3.
Chemical constituents in aqueous extract of Cyclocarya.
| No. | Compound | RT | Expected | Measured | Adduct ion | Formula | Delta | MS2 ion |
| (min) | (m/z) | (m/z) | (ppm) | (m/z) | ||||
| 1 | Gallic acid | 1.68 | 153.0184 | 170.0215 | [M-H]- | C7H6O5 | 1.077 | 124.0155, 79.0177 |
| 2 | Neochlorogenic acid | 3.25 | 353.0882 | 354.0951 | [M-H]- | C16H18O9 | 4.224 | 191.0557, 179.0344, 135.0442 |
| 3 | 4-caffeoylquinic acid | 4.26 | 353.0883 | 354.0951 | [M-H]- | C16H18O9 | 4.649 | 191.0557, 179.0344, 135.0442 |
| 4 | Catechin | 4.30 | 289.0723 | 290.0790 | [M-H]- | C15H14O6 | 5.761 | NA |
| 5 | 5-caffeoylquinic acid | 4.53 | 353.0882 | 354.0951 | [M-H]- | C16H18O9 | 4.309 | 191.0557, 161.0233 |
| 6 | Epicatechin | 5.23 | 289.0723 | 290.0790 | [M-H]- | C15H14O6 | 5.554 | NA |
| 7 | Hyperin | 6.68 | 463.0888 | 464.0955 | [M-H]- | C21H20O12 | 3.752 | 301.0338, 271.0252 |
| 8 | Quercetin-3-O-glucuronide | 6.74 | 477.0678 | 478.0747 | [M-H]- | C21H18O13 | 3.088 | 301.0347, 151.0028 |
| 9 | Isoquercitrin | 6.81 | 463.0888 | 464.0955 | [M-H]- | C21H20O12 | 3.687 | 301.0338, 271.0252 |
| 10 | Kaempferol-3-O-glucuronide | 7.48 | 461.0732 | 462.0798 | [M-H]- | C21H18O12 | 3.747 | 285.0409, 229.0508, 113.0231 |
| 11 | 4,5-O-dicaffeoylquinic acid | 8.03 | 515.1201 | 516.1268 | [M-H]- | C25H24O12 | 3.218 | 353.0883, 179.0344, 173.0449 |
| 12 | Afzelin | 8.65 | 431.0988 | 432.1056 | [M-H]- | C21H20O10 | 3.519 | 285,0402, 255.0301, 227.0348 |
| 13 | Quercetin | 10.88 | 301.0361 | 302.0427 | [M-H]- | C15H10O7 | 4.521 | 121.0029, 107.0127 |
| 14 | Cyclocaric acid B | 17.48 | 485.3279 | 486.3345 | [M-H]- | C30H46O5 | 3.501 | NA |
| 15 | Cyclocarioside I | 17.84 | 621.4016 | 622.4080 | [M-H]- | C35H58O9 | 3.058 | 621.4023, 471.3488 |
| 16 | Cyclocarioside III | 18.27 | 635.4177 | 636.4237 | [M-H]- | C36H60O9 | 3.714 | 635.4179, 489.3565 |
| 17 | Cyclocaroside II | 19.37 | 603.3919 | 604.3975 | [M-H]- | C35H56O8 | 4.582 | NA |
Table 4.
Chemical constituents in ethanol extract of Cyclocarya.
| No. | Compound | RT | Expected | Measured | Adduct ion | Formula | Delta | MS2 ion |
| (min) | (m/z) | (m/z) | (ppm) | (m/z) | ||||
| 1 | Gallic acid | 1.68 | 169.0135 | 170.0215 | [M-H]- | C7H6O5 | 0.380 | 125.0234, 97.0283, 79.0176 |
| 2 | Neochlorogenic acid | 3.22 | 353.0883 | 354.0951 | [M-H]- | C16H18O9 | 4.479 | 191.0556, 179.0344, 135.0442 |
| 3 | 4-caffeoylquinic acid | 4.25 | 353.0882 | 354.0951 | [M-H]- | C16H18O9 | 4.139 | 191.0556, 179.0344, 135.0442 |
| 4 | Catechin | 4.25 | 289.0722 | 290.0790 | [M-H]- | C15H14O6 | 5.208 | NA |
| 5 | 5-caffeoylquinic acid | 4.52 | 353.0882 | 354.0951 | [M-H]- | C16H18O9 | 4.309 | 191.0557, 179.0344, 135.0442 |
| 6 | Epicatechin | 5.23 | 289.0723 | 290.0790 | [M-H]- | C15H14O6 | 5.208 | NA |
| 7 | Hyperin | 6.68 | 463.0889 | 464.0955 | [M-H]- | C21H20O12 | 3947 | 301.0339, 271.0252 |
| 8 | Quercetin-3-O-glucuronide | 6.74 | 477.0679 | 478.0747 | [M-H]- | C21H18O13 | 3.151 | 301.0347 |
| 9 | Isoquercitrin | 6.81 | 463.0890 | 464.0955 | [M-H]- | C21H20O12 | 4.141 | 301.0339, 271.0252 |
| 10 | Kaempferol-3-O-glucuronide | 7.48 | 461.0732 | 462.0798 | [M-H]- | C21H18O12 | 3.812 | 285.0409, 229.0508, 113.0231 |
| 11 | 4,5-O-dicaffeoylquinic acid | 8.02 | 515.1201 | 516.1268 | [M-H]- | C25H24O12 | 3.334 | 353.0883, 179.0344, 173.0449 |
| 12 | Afzelin | 8.66 | 431.0987 | 432.1056 | [M-H]- | C21H20O10 | 3.287 | 285,0402, 255.0301, 227.0348 |
| 13 | Quercetin | 10.86 | 301.037 | 302.0427 | [M-H]- | C15H9O7 | 4.853 | 121.0029, 107.0127 |
| 14 | Cyclocaric acid B | 17.48 | 485.3276 | 486.3345 | [M-H]- | C30H46O5 | 3.068 | NA |
| 15 | Cyclocarioside I | 17.84 | 621.4015 | 622.4080 | [M-H]- | C35H58O9 | 2.865 | 471.3485 |
| 16 | Cyclocarioside III | 18.27 | 635.4169 | 636.4237 | [M-H]- | C35H60O9 | 2.377 | 489.3584 |
| 17 | Cyclocaroside II | 19.38 | 603.3911 | 604.3975 | [M-H]- | C35H56O8 | 3.257 | NA |
Table 5.
Chemical constituents in aqueous extract of Mallotus.
| No. | Compound | RT | Expected | Measured | Adduct ion | Formula | Delta | MS2 ion |
| (min) | (m/z) | (m/z) | (ppm) | (m/z) | ||||
| 1 | Gallic acid | 1.71 | 169.0134 | 170.0215 | [M-H]- | C7H6O5 | 1.303 | 125.0233, 97.0283, 79.0176 |
| 2 | Caffeic acid 3-beta-d-glucuronide | 3.49 | 355.0673 | 356.0743 | [M-H]- | C15H16O10 | 3.878 | 209.0305, 191.2879, 85.0282 |
| 3 | Catechin | 5.27 | 289.0721 | 290.0790 | [M-H]- | C15H14O6 | 4.793 | NA |
| 4 | Epicatechin | 5.39 | 289.0721 | 290.0790 | [M-H]- | C15H14O6 | 5.104 | NA |
| 5 | Phyllanthusiin A | 6.00 | 291.0149 | 292.0219 | [M-H]- | C13H8O8 | 4.523 | 247.0246 |
| 6 | Caffeic acid | 6.41 | 179.0343 | 180.0422 | [M-H]- | C9H8O4 | 2.093 | 135.0444. |
| 7 | Repandusinic acid A | 6.73 | 969.0856 | 970.0924 | [M-H]- | C41H30O28 | 1.696 | 633.0741, 463.0522, 247.0249 |
| 8 | Geraniin | 7.97 | 951.0747 | 952.0818 | [M-H]- | C41H28O27 | 1.288 | 933.0649, 463.0527, 445.0410 |
| 9 | Corilagin | 8.24 | 633.0737 | 634.0806 | [M-H]- | C27H22O18 | 2.259 | 463.0520, 169.0138 |
| 10 | Phyllanthusiin C | 10.58 | 925.0957 | 926.1025 | [M-H]- | C40H30O26 | 1.668 | 605.0793, 453.0683, 247.0253, 169.0133 |
| 11 | Ellagic acid | 11.78 | 300.9990 | 302.0063 | [M-H]- | C14H6O8 | 3.742 | 257.0089, 245.0085, 201.0188 |
| 12 | Kaempferol-3-O-sophoroside | 11.98 | 593.1517 | 594.1585 | [M-H]- | C27H30O15 | 2.754 | NA |
| 13 | Rutin | 12.83 | 609.1464 | 610.1534 | [M-H]- | C27H30O16 | 2.214 | NA |
Table 6.
Chemical constituents in ethanol extract of Mallotus.
| No. | Compound | Rt | Expected | Measured | Adduct ion | Formula | Delta | Ms2 ion |
| (min) | (m/z) | (m/z) | (ppm) | (m/z) | ||||
| 1 | Gallic acid | 1.68 | 169.0133 | 170.0215 | [m-h]- | C7h6o5 | 1.126 | 125.0234, 97.0283, 79.0176 |
| 2 | Cyanidin | 2.34 | 371.0622 | 372.0693 | [m-h]- | C15h16o11 | 3.429 | |
| 3 | Caffeic acid 3-beta-d-glucuronide | 3.47 | 355.0674 | 356.0743 | [m-h]- | C15h16o10 | 3.962 | 209.0298, 191.0194, 85.0282 |
| 4 | Catechin | 5.21 | 289.0721 | 290.0790 | [m-h]- | C15h14o6 | 5.000 | Na |
| 5 | Epicatechin | 5.27 | 289.0721 | 290.0790 | [m-h]- | C15h14o6 | 4.793 | Na |
| 6 | Phyllanthusiin E | 6.00 | 291.0147 | 292.0219 | [m-h]- | C13h8o8 | 3.905 | 247.0246 |
| 7 | Caffeic acid | 6.38 | 179.0342 | 180.0422 | [m-h]- | C9h8o4 | 1.926 | 135.0443. |
| 8 | Repandusinic acid A | 6.80 | 969.0858 | 970.0924 | [m-h]- | C41h30o28 | 1.820 | 633.0747, 463.0519, 247.0246 |
| 9 | Geraniin | 7.97 | 951.0746 | 952.0818 | [m-h]- | C41h28o27 | 1.218 | 933.0633, 463.0529, 445.0432 |
| 10 | Corilagin | 8.28 | 633.0736 | 634.0806 | [m-h]- | C27h22o18 | 2.164 | 463.0523, 169.0132 |
| 11 | Phyllanthusiin C | 10.58 | 925.0957 | 926.1025 | [m-h]- | C40h30o26 | 1.668 | 605.0793, 453.0699, 247.0247, 169.0135 |
| 12 | Ellagic acid | 11.86 | 300.9991 | 302.0063 | [m-h]- | C14h6o8 | 4.041 | 257.0091, 245.0091, 201.0189 |
| 13 | Kaempferol-3-O-sophoroside | 12.08 | 593.1516 | 594.1585 | [m-h]- | C27h30o15 | 2.451 | Na |
| 14 | Rutin | 12.49 | 609.1469 | 610.1534 | [m-h]- | C27h30o16 | 3.117 | Na |
Table 7.
Chemical constituents in aqueous extract of Rubus.
| NO. | Compound | RT | Expected | Measured | Adduct ion | Formula | Delta | MS2 ion |
| (min) | (m/z) | (m/z) | (ppm) | (m/z) | ||||
| 1 | Gallic acid | 1.67 | 169.0134 | 170.0215 | [M-H]- | C7H6O5 | 1.717 | NA |
| 2 | Brevifolincarboxylic acid | 5.83 | 291.0149 | 292.0219 | [M-H]- | C13H8O8 | 4.317 | 247.0246, 191.0343, 173.0236 |
| 3 | Caffeic acid | 6.19 | 179.0343 | 180.0423 | [M-H]- | C9H8O4 | 2.149 | 117.0331 |
| 4 | Ferulic acid hexoside | 8.76 | 355.1036 | 356.1107 | [M-H]- | C16H20O9 | 3.609 | 161.0235, 133.0285 |
| 5 | Ellagic acid | 11.74 | 300.9991 | 302.0063 | [M-H]- | C14H6O8 | 4.174 | NA |
| 6 | Rutin | 12.51 | 609.0898 | 610.1534 | [M-H]- | C27H30O16 | 2.822 | 301.0349, 300.0280, 271.0258 |
| 7 | Quercetin | 12.83 | 301.0357 | 302.0427 | [M-H]- | C15H10O7 | 4.654 | NA |
| 8 | Quercetin-O-hexoside | 13.04 | 463.0888 | 464.0955 | [M-H]- | C21H20O12 | 3.623 | 271.0248, 151.0028 |
| 9 | Isoquercitrin | 13.07 | 463.0887 | 464.0955 | [M-H]- | C21H20O12 | 3.472 | NA |
| 10 | Quercitrin | 13.78 | 463.0889 | 464.0955 | [M-H]- | C21H20O12 | 3.947 | NA |
| 11 | Kaempferol-3-O-rutinoside | 14.78 | 593.1517 | 594.1585 | [M-H]- | C27H30O15 | 2.754 | 285.0395, 257.0467, 151.0030 |
| 12 | Quercetin-3-O-α-d-ribofuranoside | 15.51 | 433.0780 | 434.0849 | [M-H]- | C20H18O11 | 3.377 | NA |
| 13 | Kaempferol-O-hexoside | 15.56 | 447.0940 | 448.1006 | [M-H]- | C21H20O11 | 3.964 | 284,0329, 255.0200, 227.0348, 151.0025 |
| 14 | Kaempferol-O-pentoside | 18.27 | 417.0831 | 417.0822 | [M-H]- | C20H17O10 | 3.469 | 284,0329, 255.0300, 227.0347, |
| 15 | Caffeic acid-O-dihexoside | 21.02 | 503.1202 | 504.1268 | [M-H]- | C24H24O12 | 3.642 | 341.0881, 281.0671, 251.0560, 221.0454, 179.0344, 161.0236, 135.0442 |
| 16 | Quercetin-O-caffeyl-hexoside | 21.74 | 625.1207 | 626.1272 | [M-H]- | C30H26O15 | 2.997 | 463.0888, 301.0356, 161.0237 |
| 17 | Kaempferol-O-caffeoyl-hexoside | 24.33 | 609.1258 | 610.1323 | [M-H]- | C30H26O14 | 3.133 | 447.0947, 323.0778, 285.0408, 161.0237 |
| 18 | Kaempferol | 32.76 | 285.0409 | 334.0325 | [M-H]- | C15H10O9 | 5.352 | 285.0409, 151.0023 |
| 19 | Rubusoside | 33.87 | 641,3178 | 642.3251 | [M-H]- | C32H50O13 | 1.625 | 479.2658, 317.2126 |
Table 8.
Chemical constituents in ethanol extract of Rubus.
| NO. | Compound | RT | Expected | Measured | Adduct ion | Formula | Delta | MS2 ion |
| (min) | (m/z) | (m/z) | (ppm) | (m/z) | ||||
| 1 | Gallic acid | 1.66 | 169.0134 | 170.0215 | [M-H]- | C7H6O5 | 1.658 | 125.0233, |
| 2 | Brevifolincarboxylic acid | 5.83 | 291.01498 | 292.0219 | [M-H]- | C13H8O8 | 4.317 | 247.0246, 191.0343, 173.0236 |
| 3 | Caffeic acid | 6.24 | 179.0342 | 180.0423 | [M-H]- | C9H7O4 | 1.647 | 135.0442, 117.0334 |
| 4 | Ferulic acid hexoside | 8.76 | 355.1036 | 356.1107 | [M-H]- | C16H20O9 | 3.440 | 161.0235, 133.0285 |
| 5 | Ellagic acid | 11.74 | 300.9991 | 302.0063 | [M-H]- | C14H6O8 | 3.842 | NA |
| 6 | Rutin | 12.44 | 609.1465 | 610.1534 | [M-H]- | C27H30O16 | 2.411 | 301.0349, 300.0280, 271.0258 |
| 7 | Quercetin | 12.83 | 301.0357 | 302.0427 | [M-H]- | C15H10O7 | 4.654 | NA |
| 8 | Quercetin-O-hexoside | 13.06 | 463.0886 | 464.0955 | [M-H]- | C21H20O12 | 3.148 | 271.0248, 151.0028 |
| 9 | Isoquercitrin | 13.07 | 463.0887 | 464.0955 | [M-H]- | C21H19O12 | 3.472 | NA |
| 10 | Quercitrin | 13.78 | 463.0889 | 464.0955 | [M-H]- | C21H20O12 | 3.947 | NA |
| 11 | Kaempferol-3-O-rutinoside | 14.74 | 593.1516 | 594.1585 | [M-H]- | C27H30O15 | 2.451 | 285.0395, 257.0467, 151.0030 |
| 12 | Quercetin-3-O-α-D-ribofuranoside | 15.51 | 433.0778 | 434.0849 | [M-H]- | C20H18O11 | 2.961 | NA |
| 13 | Kaempferol-O-hexoside | 15.56 | 447.0940 | 448.1006 | [M-H]- | C21H20O11 | 3.964 | 284,0329, 255.0200, 227.0348, 151.0025 |
| 14 | Caffeic acid-O-dihexoside | 21.01 | 503.1200 | 504.1268 | [M-H]- | C24H24O12 | 3.235 | 341.0881, 281.0671, 251.0560, 221.0454, 179.0344, 161.0236, 135.0442 |
| 15 | Quercetin-O-caffeyl-hexoside | 21.67 | 625.1205 | 626.1272 | [M-H]- | C30H25O15 | 2.789 | 463.0888, 301.0356, 161.0237 |
| 16 | Kaempferol-O-caffeoyl-hexoside | 24.27 | 609.1255 | 610.1323 | [M-H]- | C30H25O14 | 2.739 | 447.0947, 323.0778, 285.0408, 161.0237 |
| 17 | Kaempferol | 32.74 | 285.0410 | 334.0325 | [M-H]- | C15H10O9 | 5.562 | 285.0409, 151.0023 |
| 18 | Rubusoside | 33.95 | 641.3186 | 642.3251 | [M-H]- | C32H50O13 | 2.857 | 479.2658, 317.2126 |
Table 9.
Chemical constituents in aqueous extract of Vine.
| NO. | Compound | RT | Expected | Measured | Adduct ion | Formula | Delta | MS2 ion |
| (min) | (m/z) | (m/z) | (ppm) | (m/z) | ||||
| 1 | Catechin | 4.38 | 289.0721 | 290.0790 | [M-H]- | C15H14O6 | 4.896 | 203.0712, 125.0223 |
| 2 | Dihydromyricetin | 5.53 | 319.0461 | 320.0532 | [M-H]- | C15H12O8 | 3.875 | 257.0477, 193.0137 |
| 3 | Epigallocatechin 3,5,-di-O-gallate | 5.95 | 609.0898 | 610.0958 | [M-H]- | C29H22O15 | 3.848 | 259.0616, 215.0359, 193.0138 |
| 4 | Dihydromyricetin isomer | 6.10 | 319.0462 | 320.0532 | [M-H]- | C15H12O8 | 4.345 | 257.0477, 193.0137 |
| 5 | Hesperetin | 7.32 | 607.0737 | 608.0802 | [M-H]- | C29H20O15 | 3.103 | 259.0249 |
| 6 | Myricetin-3 ' -O-β-d-xylopyranoside | 7.37 | 449.0732 | 450.0798 | [M-H]- | C20H18O12 | 3.780 | NA |
| 7 | Myricetrin | 7.72 | 463.0887 | 464.0955 | [M-H]- | C21H20O12 | 3.472 | 287.0548, 151.0392 |
| 8 | Quercetin-3-O-α-l-rhamnopyranoside | 10.64 | 447.0963 | 448.1006 | [M-H]- | C21H20O11 | 3.226 | 193.0135 |
| 9 | Myricetin | 11.72 | 317.0304 | 318.0376 | [M-H]- | C15H10O8 | 3.905 | 191.0340 |
| 10 | Quercetin | 12.83 | 301.0357 | 302.0427 | [M-H]- | C15H10O7 | 4.654 | NA |
Table 10.
Chemical constituents in ethanol extract of Vine.
| NO. | Compound | RT | Expected | Measured | Adduction | Formula | Delta | MS2 ion |
| (min) | (m/z) | (m/z) | (ppm) | (m/z) | ||||
| 1 | Dihydromyricetin | 4.34 | 289.0721 | 290.0790 | [M-H]- | C15H14O6 | 5.104 | 203.0706, 125.0233 |
| 2 | Epigallocatechin 3,5,-di-O-gallate | 5.52 | 319.0460 | 320.0532 | [M-H]- | C15H11O8 | 3.593 | 257.0477, 193.0137 |
| 3 | Dihydromyricetin isomer | 5.93 | 609.0895 | 610.0958 | [M-H]- | C29H22O15 | 3.257 | 259.0616, 215.0359, 193.0138 |
| 4 | Hesperetin | 6.13 | 319.0461 | 320.0532 | [M-H]- | C15H11O8 | 4.063 | 257.0477, 193.0137 |
| 5 | Myricetin-3 ' -O-β-d-xylopyranoside | 7.30 | 307.0737 | 608.0802 | [M-H]- | C20H20O15 | 3.103 | 259.0249 |
| 6 | Myricetrin | 7.32 | 449.0730 | 450.0798 | [M-H]- | C20H18O12 | 3.513 | NA |
| 7 | Quercetin-3-O-α-l-rhamnopyranoside | 7.71 | 463.0887 | 464.0955 | [M-H]- | C21H20O12 | 3.407 | 287.0548, 151.0392 |
| 8 | Myricetin | 10.55 | 447.0936 | 448.1006 | [M-H]- | C21H20011 | 3.159 | 193.0135 |
| 9 | Quercetin | 11.65 | 317.0304 | 318.0376 | [M-H]- | C15H10O8 | 3.679 | 191.0340 |
| 10 | Dihydromyricetin | 12.73 | 401.0357 | 302.0427 | [M-H]- | C15H9O7 | 4.654 | NA |
4. Conclusions
The present study focused on comparative evaluation of aqueous and ethanol extractions from four selected herbal teas. In the case of phytochemicals, ethanol extracts displayed higher content of phenolic, flavonoids and flavonols. The contributions of flavonoids and flavonols to phenolic from ethanol extractions were higher than that of the aqueous extractions. Interestingly, aqueous extraction displayed improved antioxidant activity of most herbal tea samples and showed close α-glucosidase inhibitory activity with ethanol extraction. The correlation results indicated that polyphenols were positively correlated with antioxidant and α-glucosidase inhibitory activities. Broadly speaking, aqueous extraction should be considered as an efficient and economical processing method that could be useful for improving the bioactivities of the four herbal teas in the natural functional food and natural medicine industries. Specifically, results have suggesed that Vine possessed the highest phytochemical contents, antioxidant activity and α-glucosidase inhibitory activity across either aqueous or ethanol extractions. Findings from this study highlighted the vital role of aqueous extractions for herbal teas consumption. In addition, further study would focus on the structure-activity relationship and synergistic effects within the aqueous extracts.
Author Contributions
Conceptualization, Y.S.; methodology, G.D. and Y.S.; software, J.; validation, J., J.L and G.D.; investigation, J., J.L and G.D.; resources, Y.S.; data curation, J., J.L and G.D.; writing—original draft preparation, J., and G.D.; writing—review and editing, J.J., F. and Y.S.; visualization, J.J., F. and Y.S.; supervision, Y.S.; project administration, Y.S.; funding acquisition, Y.S. All authors have read and agreed to the published version of the manuscript.
Funding
This research was funded by the Fundamental Research Funds for the Central Universities, 21622412; Yangxi Country Science and Technology Project, 202101.
Conflicts of Interest
The authors declare no conflicts of interest.
References
- Serra-Navarro, B.; Fernandez-Ruiz, R.; Garcia-Alaman, A.; Pradas-Juni, M.; Fernandez-Rebollo, E.; Esteban, Y.; Mir-Coll, J.; Mathieu, J.; Dalle, S.; Hahn, M.; Ahlgren, U.; Weinstein, L.S.; Vidal, J.; Gomis, R.; Gasa, R. Gsα-dependent signaling is required for postnatal establishment of a functional β-cell mass. Mol. Metab. 2021, 53. [CrossRef]
- Chen, Y.; Geng, S.; Liu, B. Three common caffeoylquinic acids as potential hypoglycemic nutraceuticals: Evaluation of alpha-glucosidase inhibitory activity and glucose consumption in HepG2 cells. J.Food Biochem. 2020, 44(9), e13361. [CrossRef]
- Joshi, S.R.; Standl, E.; Tong, N.; Shah, P.; Kalra, S.; Rathod, R. Therapeutic potential of α-glucosidase inhibitors in type 2 diabetes mellitus: an evidence-based review. Expert Opin. Pharmaco. 2015, 16(13), 1959-1981. [CrossRef]
- Samtiya, M.; Aluko, R.E.; Dhewa, T.; Moreno-Rojas, J.M. Potential health benefits of plant food-derived bioactive components: An overview. Foods. 2021, 10(4), 839. [CrossRef]
- Truong, V.-L. Jeong, W.-S. Antioxidant and anti-inflammatory roles of tea polyphenols in inflammatory bowel diseases. Food Sci. Hum. Well. 2022, 11(3), 502-511. [CrossRef]
- Chen, Y.; Wang, E.; Wei, Z.; Zheng, Y.; Yan, R.; Ma, X. Phytochemical analysis, cellular antioxidant and alpha-glucosidase inhibitory activities of various herb plant organs. Ind. Crop. Prod. 2019, 141.
- Bergonio, K.B. Perez, M.A. The potential of male papaya (Carica papaya, L.) flower as a functional ingredient for herbal tea production. Indian J. Tradit. Know. 2016, 15(1), 41-49.
- Le, X.-N.; Hu, S.-C.; Zheng, J.-L.; Cui, E.-L.; Zhu, Y.-H.; Zhu, M.-Q. The influence of different drying methods on bioactive components of Eucommia ulmoides Oliver male flower and the comprehensive assessment for industrial application. Ind. Crop. Prod. 2022, 177, 114469. [CrossRef]
- Jin, L.; Li, X.-B.; Tian, D.-Q.; Fang, X.-P.; Yu, Y.-M.; Zhu, H.-Q.; Ge, Y.-Y.; Ma, G.-Y.; Wang, W.-Y.; Xiao, W.-F. Antioxidant properties and color parameters of herbal teas in China. Ind. Crop. Prod. 2016, 87, 198-209. [CrossRef]
- Hayat, K.; Iqbal, H.; Malik, U.; Bilal, U.; Mushtaq, S. Tea and its consumption: benefits and risks. Crit. Rev. Food Sci. 2015, 55(7), 939-954. [CrossRef]
- Swaidan, A.; Azakir, B.; Neugart, S.; Kattour, N.; Sokhn, E.S.; Osaili, T.M.; El Darra, N. Evaluation of the Phenolic Composition and Biological Activities of Six Aqueous Date (Phoenix dactylifera L.) Seed Extracts Originating from Different Countries: A Comparative Analysis. Foods. 2024, 13(1).
- Xu, Y.; Zhu, B.P.; Ge, H.W.; Wang, S.L.; Li, B.; Xu, H.F. Microwave-assisted extraction of cellulose and aromatic compounds from rose petals based on deep eutectic solvent. Int. J. Biol. Macromol. 2024, 258. [CrossRef]
- Wang, F.; Zhang, S.; Deng, G.W.; Xu, K.; Xu, H.Y.; Liu, J.L. Extracting Total Anthocyanin from Purple Sweet Potato Using an Effective Ultrasound-Assisted Compound Enzymatic Extraction Technology. Molecules. 2022, 27(14). [CrossRef]
- Ashraf, H.; Iahtisham Ul, H.; Butt, M.S.; Nayik, G.A.; Ramniwas, S.; Damto, T.; Alharbi, S.A.; Ansari, M.J. Phytochemical and antioxidant profile of citrus peel extracts in relation to different extraction parameters. Int. J. Food Prop. 2024, 27(1), 286-299.
- Wen, Y.M.; Zhou, Y.C.; Tian, L.; He, Y.J. Ethanol extracts of Isochrysis zhanjiangensis alleviate acute alcoholic liver injury and modulate intestinal bacteria dysbiosis in mice. J. Sci. Food Agric. 2024. [CrossRef]
- Velderrain-Rodríguez, G.; Palafox-Carlos, H.; Wall-Medrano, A.; Ayala-Zavala, J.; Chen, C.O.; Robles-Sánchez, M.; Astiazaran-García, H.; Alvarez-Parrilla, E.; González-Aguilar, G. Phenolic compounds: their journey after intake. Food Funct. 2014, 5(2), 189-197. [CrossRef]
- Valdés, L.; Cuervo, A.; Salazar, N.; Ruas-Madiedo, P.; Gueimonde, M.; González, S. The relationship between phenolic compounds from diet and microbiota: impact on human health. Food Funct. 2015, 6(8), 2424-2439. [CrossRef]
- Fu, Y.; Yang, J.-c.; Cunningham, A.B.; Towns, A.M.; Zhang, Y.; Yang, H.-y.; Li, J.-w.; Yang, X.-f. A billion cups: The diversity, traditional uses, safety issues and potential of Chinese herbal teas. J. Ethnopharmacol. 2018, 222, 217-228. [CrossRef]
- Alshehri, M.M.; Quispe, C.; Herrera-Bravo, J.; Sharifi-Rad, J.; Tutuncu, S.; Aydar, E.F.; Topkaya, C.; Mertdinc, Z.; Ozcelik, B.; Aital, M. A review of recent studies on the antioxidant and anti-infectious properties of Senna plants. Oxid. Med. Cell. Longev. 2022, 2022. [CrossRef]
- Chen, Y.; Chen, G.; Fu, X.; Liu, R.H. Phytochemical Profiles and Antioxidant Activity of Different Varieties of Adinandra Tea (Adinandra Jack). J. Agric. Food Chem. 2015, 63(1), 169-176. [CrossRef]
- Chen, Y.; Ma, X.; Fu, X.; Yan, R. Phytochemical content, cellular antioxidant activity and antiproliferative activity of Adinandra nitida tea (Shiyacha) infusion subjected to in vitro gastrointestinal digestion. Rsc Adv. 2017, 7(80), 50430-50440. [CrossRef]
- Chen, Y.; Wang, E.; Wei, Z.; Zheng, Y.; Yan, R.; Ma, X. Phytochemical analysis, cellular antioxidant and alpha-glucosidase inhibitory activities of various herb plant organs. Ind. Crop. Prod. 2019, 141, 111771.
- Chen, Y.; Ahmed, A.-G.A.; Elshikh, M.S.; Shah, M.H.; Al-Dosary, M.A.; Abbasi, A.M. Phytochemical profiling, antioxidant and HepG2 cancer cells' antiproliferation potential in the kernels of apricot cultivars. Saudi. J. Biol. Sci. 2020, 27(1), 163-172.
- Chen, Y.; Shan, S.; Cao, D.; Tang, D. Steam flash explosion pretreatment enhances soybean seed coat phenolic profiles and antioxidant activity. Food Chem. 2020, 319, 126552. [CrossRef]
- Augspole, I.; Duma, M.; Cinkmanis, I.; Ozola, B. Herbal teas as a rich source of phenolic compounds. Chemija. 2018, 29(4), 257-261. [CrossRef]
- Flórez, M.; Cazón, P.; Vázquez, M. Antioxidant extracts of nettle (Urtica dioica) leaves: evaluation of extraction techniques and solvents. Molecules. 2022, 27(18), 6015. [CrossRef]
- Fan, Z.; Wang, Y.; Yang, M.; Cao, J.; Khan, A.; Cheng, G. UHPLC-ESI-HRMS/MS analysis on phenolic compositions of different E Se tea extracts and their antioxidant and cytoprotective activities. Food Chem. 2020, 318, 126512. [CrossRef]
- Zhong, J.; Wang, Y.; Li, C.; Yu, Q.; Xie, J.; Dong, R.; Xie, Y.; Li, B.; Tian, J.; Chen, Y. Natural variation on free, esterified, glycosylated and insoluble-bound phenolics of Rubus chingii Hu: Correlation between phenolic constituents and antioxidant activities. Food Res. Int. 2022, 162, 112043. [CrossRef]
- Wojdyło, A. Oszmiański, J. Antioxidant activity modulated by polyphenol contents in apple and leaves during fruit development and ripening. Antioxidants. 2020, 9(7), 567. [CrossRef]
- Martí, R.; Roselló, S.; Cebolla-Cornejo, J. Tomato as a source of carotenoids and polyphenols targeted to cancer prevention. Cancers, 2016, 8(6), 58. [CrossRef]
- Parmenter, B.H.; Croft, K.D.; Hodgson, J.M.; Dalgaard, F.; Bondonno, C.P.; Lewis, J.R.; Cassidy, A.; Scalbert, A.; Bondonno, N.P. An overview and update on the epidemiology of flavonoid intake and cardiovascular disease risk. Food Funct. 2020, 11(8), 6777-6806. [CrossRef]
- Newman, R.G.; Moon, Y.; Tou, J.C.; McManus, T.; Waterland, N.L. Harvest Stage and Brewing Conditions Impact Mineral Content, Phenolic Compounds, and Antioxidant Capacity of Lemon Balm (Melissa officinalis L.) Herbal Tea. Plant Food Hum. Nutr. 2023.
- Herrera, T.; Aguilera, Y.; Rebollo-Hernanz, M.; Bravo, E.; Benítez, V.; Martínez-Sáez, N.; Arribas, S.M.; del Castillo, M.D.; Martín-Cabrejas, M.A. Teas and herbal infusions as sources of melatonin and other bioactive non-nutrient components. LWT. 2018, 89, 65-73.
- Di Lorenzo, C.; Colombo, F.; Biella, S.; Stockley, C.; Restani, P. Polyphenols and human health: The role of bioavailability. Nutrients, 2021, 13(1), 273.
- Rana, A.; Samtiya, M.; Dhewa, T.; Mishra, V.; Aluko, R.E. Health benefits of polyphenols: A consise review. J. Food Biochem. 2022, 46(10), e14264.
- Garro-Aguilar, Y.; Cayssials, V.; Achaintre, D.; Boeing, H.; Mancini, F.R.; Mahamat-Saleh, Y.; Boutron-Ruault, M.C.; Kuehn, T.; Katzke, V.; Trichopoulou, A.; Karakatsani, A.; Thriskos, P.; Masala, G.; Grioni, S.; de Magistris, M.S.; Tumino, R.; Ricceri, F.; Huybrechts, I.; Agudo, A.; Scalbert, A.; Zamora-Ros, R. Correlations between urinary concentrations and dietary intakes of flavonols in the European Prospective Investigation into Cancer and Nutrition (EPIC) study. Eur. J. Nutr. 2020, 59(4), 1481-1492.
- Fang, Z.T.; Song, C.J.; Xu, H.R.; Ye, J.H. Dynamic changes in flavonol glycosides during production of green, yellow, white, oolong and black teas from Camellia sinensis L.(cv. Fudingdabaicha). Int. J. Food Sci. Tech. 2019, 54(2), 490-498.
- Zhao, C.-N.; Tang, G.-Y.; Cao, S.-Y.; Xu, X.-Y.; Gan, R.-Y.; Liu, Q.; Mao, Q.-Q.; Shang, A.; Li, H.-B. Phenolic profiles and antioxidant activities of 30 tea infusions from green, black, oolong, white, yellow and dark teas. Antioxidants. 2019, 8(7), 215.
- Gao, X.; Liu, E.; Zhang, J.; Yang, M.; Chen, S.; Liu, Z.; Ma, H.; Hu, F. Effects of sonication during moromi fermentation on antioxidant activities of compounds in raw soy sauce. Lwt. 2019, 116, 108605. [CrossRef]
- Pisoschi, A.M. Pop, A. The role of antioxidants in the chemistry of oxidative stress: A review. Eur. J. Med. Chem. 2015, 97, 55-74.
- Akbari, B.; Baghaei-Yazdi, N.; Bahmaie, M.; Mahdavi Abhari, F. The role of plant-derived natural antioxidants in reduction of oxidative stress. BioFactors. 2022, 48(3), 611-633.
- Jin, L.; Li, X.B.; Tian, D.Q.; Fang, X.P.; Yu, Y.M.; Zhu, H.Q.; Ge, Y.Y.; Ma, G.Y.; Wang, W.Y.; Xiao, W.F.; Lie, M. Antioxidant properties and color parameters of herbal teas in China. Ind. Crop. Prod. 2016, 87, 198-209.
- Anggraini, T.; Nanda, R.F.; Syukri, D. Effect of processing on green and black tea DPPH radical scavenging activity, IC50 value, total polyphenols, catechin and epigallocatechin gallate content. in IOP Conference Series: Earth and Environmental Science. 2021. IOP Publishing.
- Wu, H.B.; Liu, T.T.; Wang, W.S.; Feng, J.C.; Tian, H.M. Oleanane-Type Saponins from the Roots of Ligulariopsis shichuana and Their α-Glucosidase Inhibitory Activities. Molecules. 2017, 22(11).
- Koop, B.L.; da Silva, M.N.; da Silva, F.D.; Lima, K.T.D.; Soares, L.S.; de Andrade, C.J.; Valencia, G.A.; Monteiro, A.R. Flavonoids, anthocyanins, betalains, curcumin, and carotenoids: Sources, classification and enhanced stabilization by encapsulation and adsorption. Food Res. Int., 2022, 153.
- Lawal, T.A.; Ononamadu, C.J.; Okonkwo, E.K.; Adedoyin, H.J.; Shettima, M.L.; Muhammad, I.U.; Alhassan, A.J. In vitro and in vivo hypoglycaemic effect of Camellia sinensis on alpha glucosidase activity and glycaemic index of white bread. Applied Food Research. 2022, 2(1), 100037. [CrossRef]
- Abbasi, A.M.; Guo, X.; Fu, X.; Zhou, L.; Chen, Y.; Zhu, Y.; Yan, H.; Liu, R.H. Comparative assessment of phenolic content and in vitro antioxidant capacity in the pulp and peel of mango cultivars. Inter. J. Mol. Sci. 2015, 16(6), 13507-13527.
- Oboh, G.; Ademosun, A.O.; Akinleye, M.; Omojokun, O.S.; Boligon, A.A.; Athayde, M.L. Starch composition, glycemic indices, phenolic constituents, and antioxidative and antidiabetic properties of some common tropical fruits. J. Ethnic Foods. 2015, 2(2), 64-73.
- Nimse, S.B. Pal, D. Free radicals, natural antioxidants, and their reaction mechanisms. RSC Adv. 2015, 5(35), 27986-28006.
- Zhu, L.-P.; Fang, S.-Y.; Lu, X.-C.; Wang, Q.-Q.; Wang, J.; Fang, C.-Q.; Zhang, X.-G.; Zhang, J.; Pan, K.; Yin, Z.-Q. Structurally diverse glycosides with α-glucosidase inhibitory properties from water extract of the leaves of Cyclocarya paliurus. Fitoterapia, 2023, 167, 105473.
- Adetunji, T.L.; Adetunji, A.E.; Odebunmi, C.A.; Van der Kooy, F.; Siebert, F. Mallotus oppositifolius (Geiseler) Müll. Arg.: The first review of its botany, ethnomedicinal uses, phytochemistry and biological activities. S. Afr. J. Bot. 2022, 147, 245-262.
- Wang, R.; He, R.; Li, Z.; Li, S.; Li, C.; Wang, L. Tailor-made deep eutectic solvents-based green extraction of natural antioxidants from partridge leaf-tea (Mallotus furetianus L.). Sep. Purif. Technol. 2021, 275, 119159.
- Geng, S.; Chen, Y.; Abbasi, A.M.; Ma, H.; Mo, H.; Liu, B. Tannin fraction from Ampelopsis grossedentata leaves tea (Tengcha) as an antioxidant and α-glucosidase inhibitory nutraceutical. Int. J. Food Sci. Tech. 2016, 51(12), 2692-2700. [CrossRef]
Figure 1.
Total phenolic contents of four herbal tea varieties (mean ± SD, n=3). Bars with different letters of differ significantly at P< 0.05.
Figure 1.
Total phenolic contents of four herbal tea varieties (mean ± SD, n=3). Bars with different letters of differ significantly at P< 0.05.
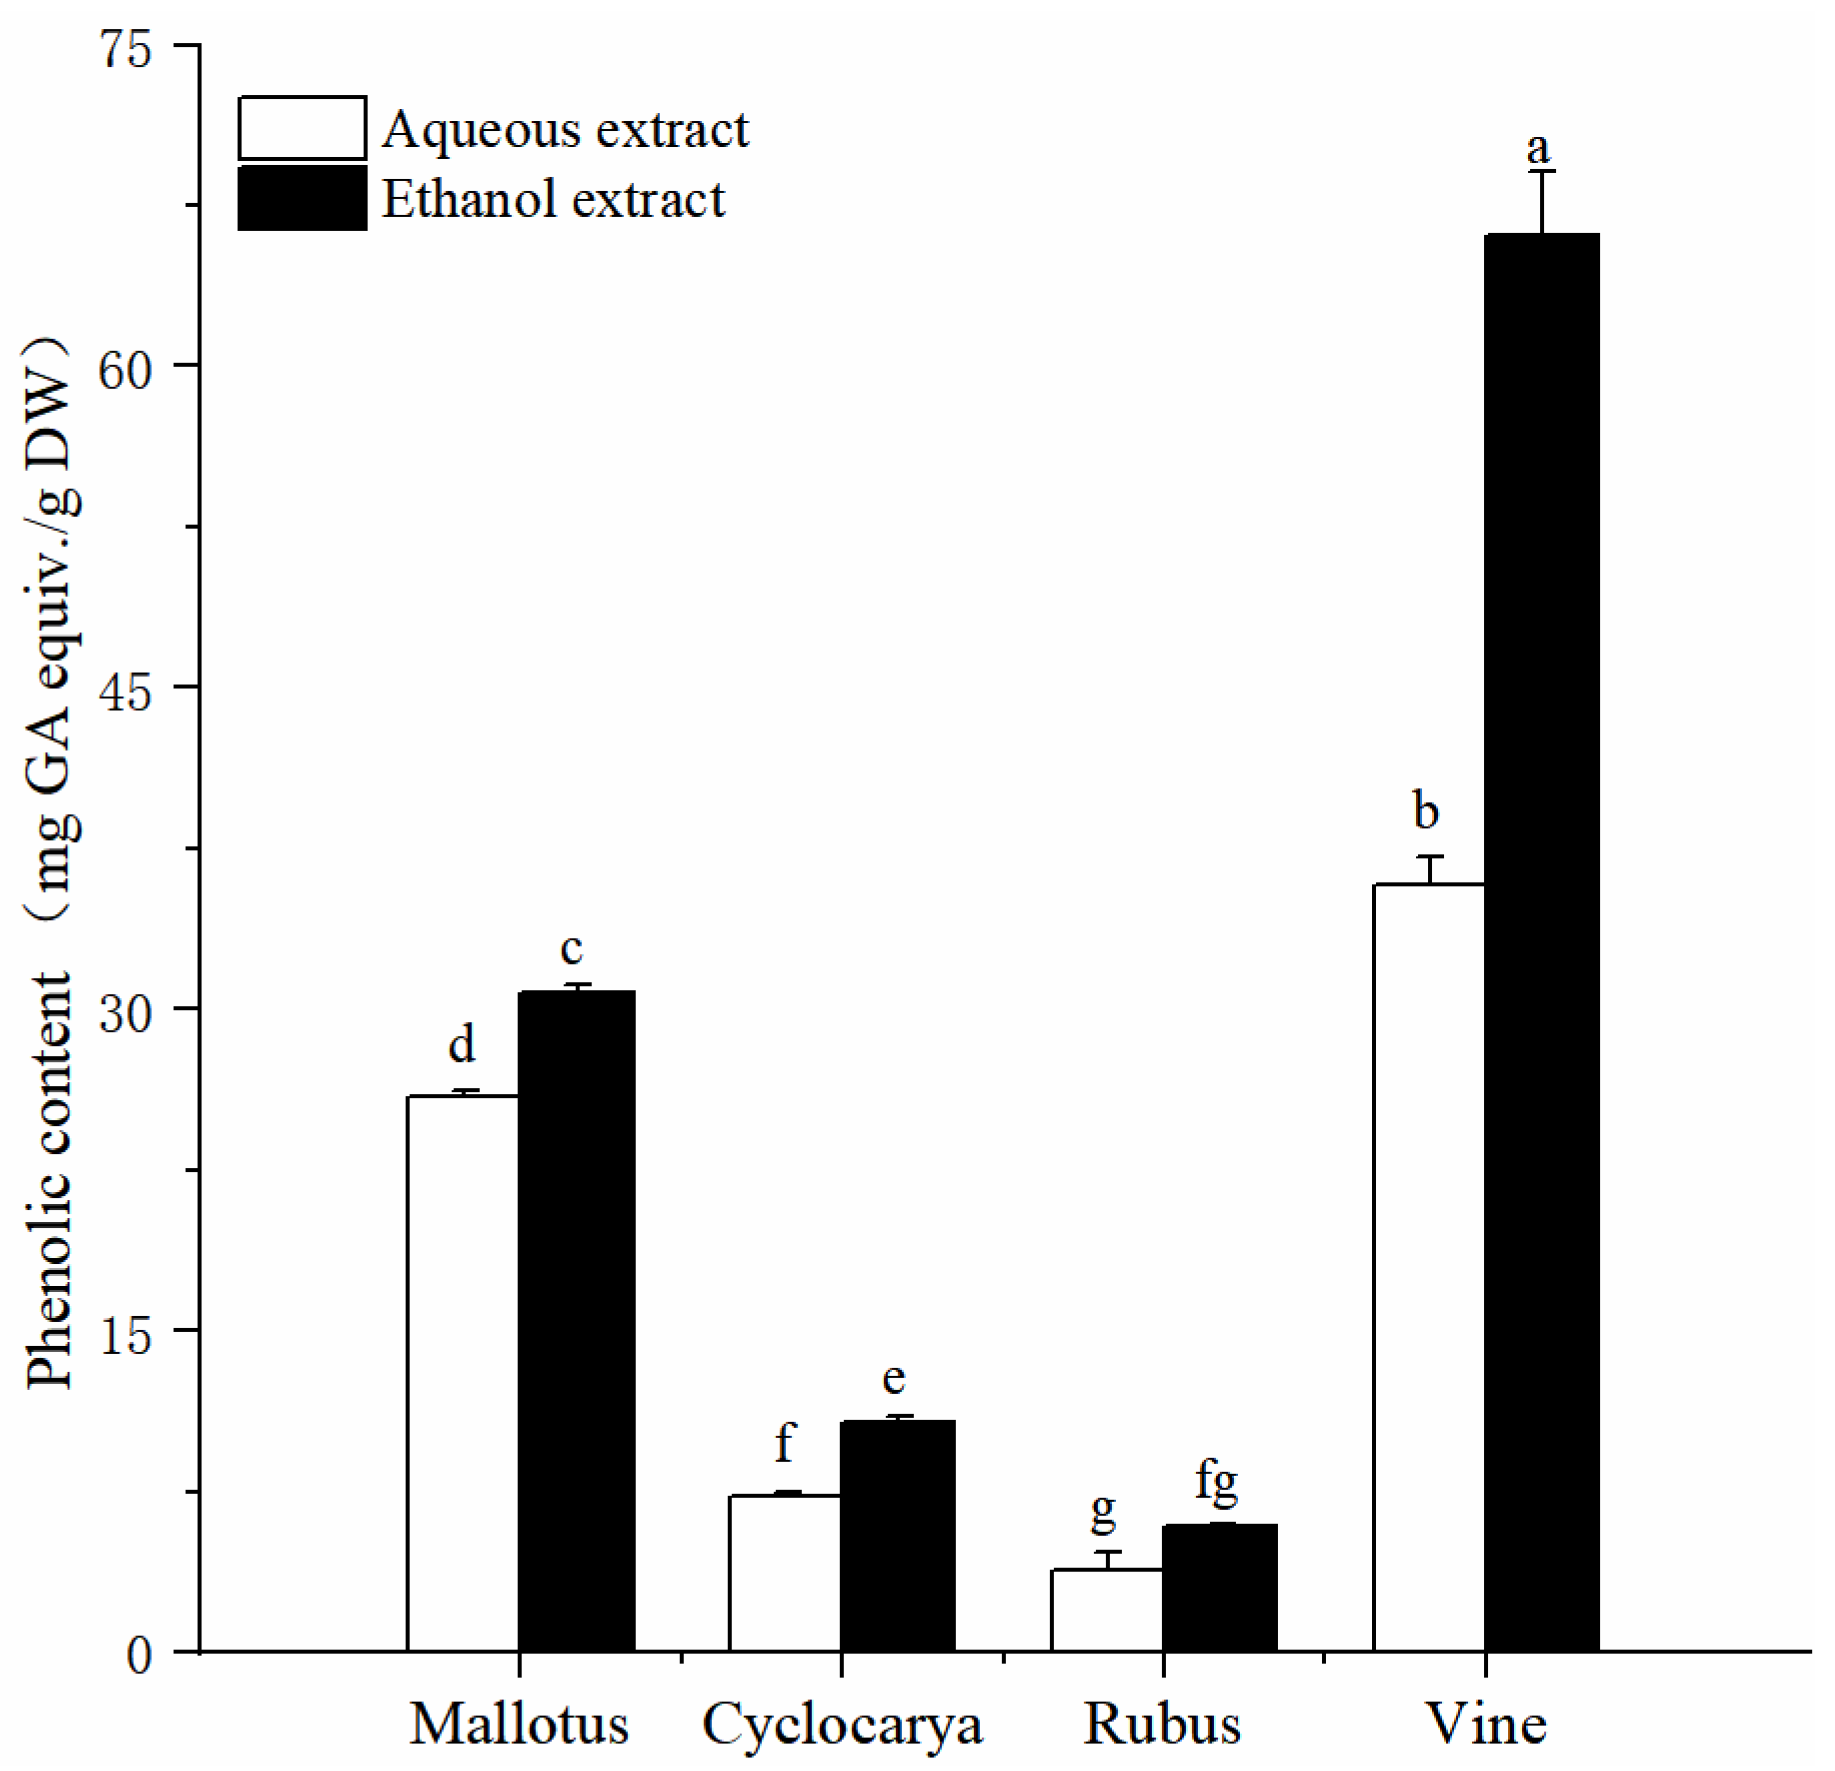
Figure 2.
Total flavonoids contents of four herbal tea varieties (mean ± SD, n=3). Bars with different letters of differ significantly at P < 0.05.
Figure 2.
Total flavonoids contents of four herbal tea varieties (mean ± SD, n=3). Bars with different letters of differ significantly at P < 0.05.
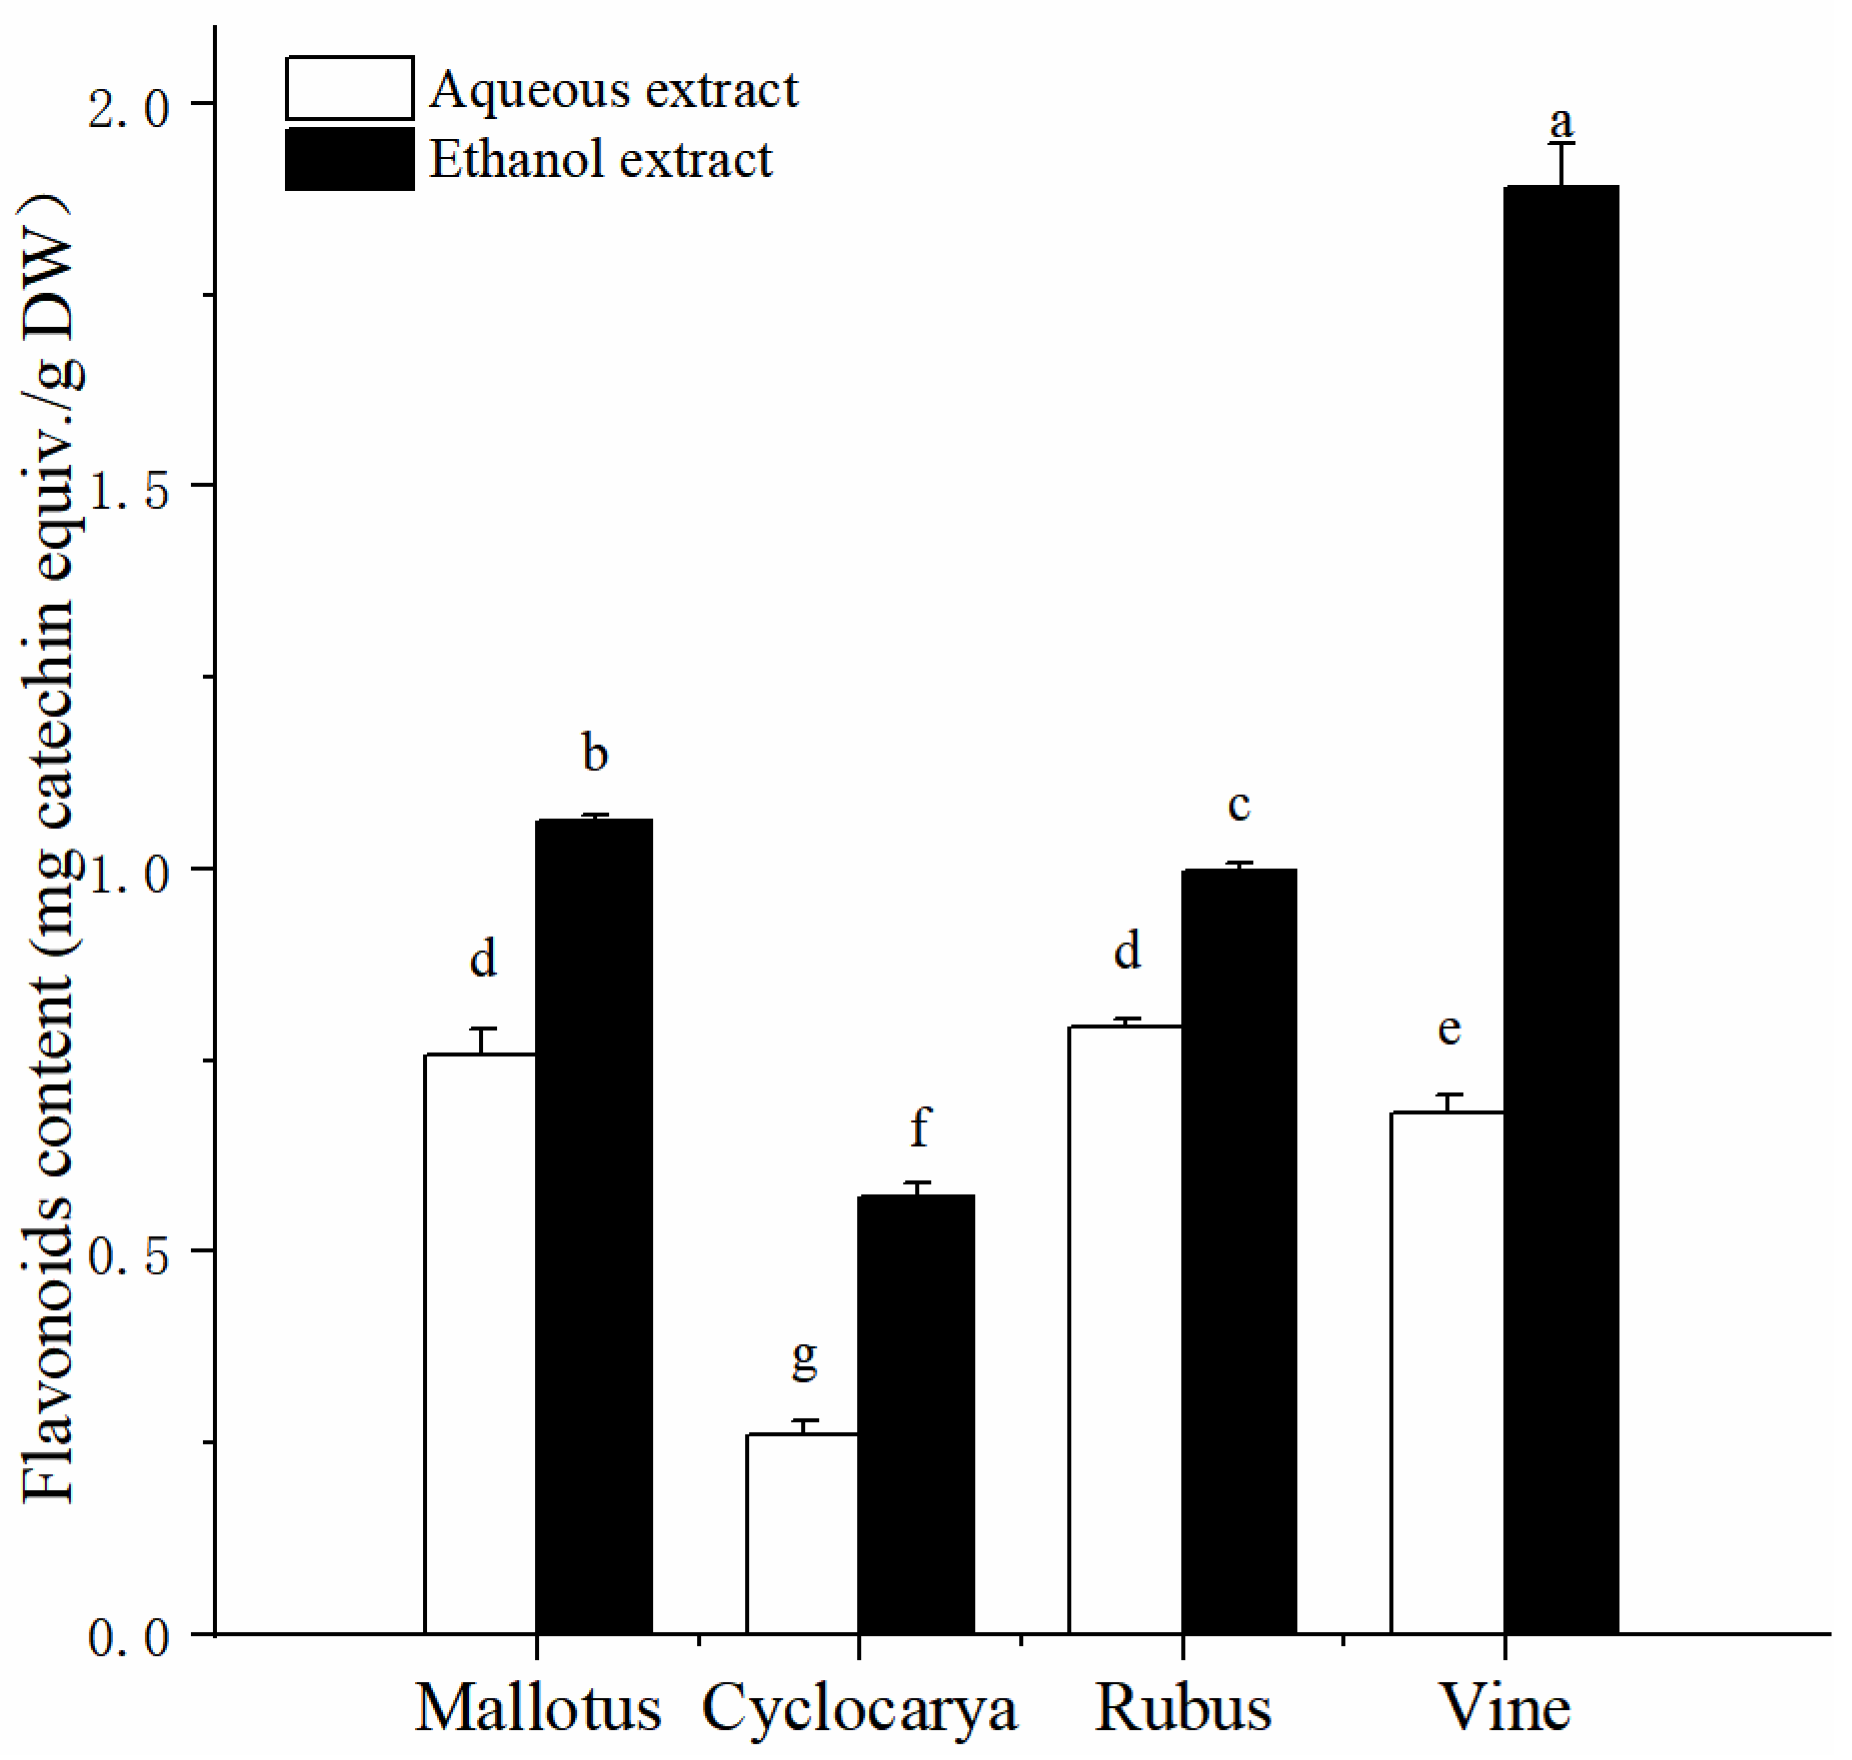
Figure 3.
Total flavonol contents of four herbal tea varieties (mean ± SD, n=3). Bars with different letters of differ significantly at P < 0.05.
Figure 3.
Total flavonol contents of four herbal tea varieties (mean ± SD, n=3). Bars with different letters of differ significantly at P < 0.05.
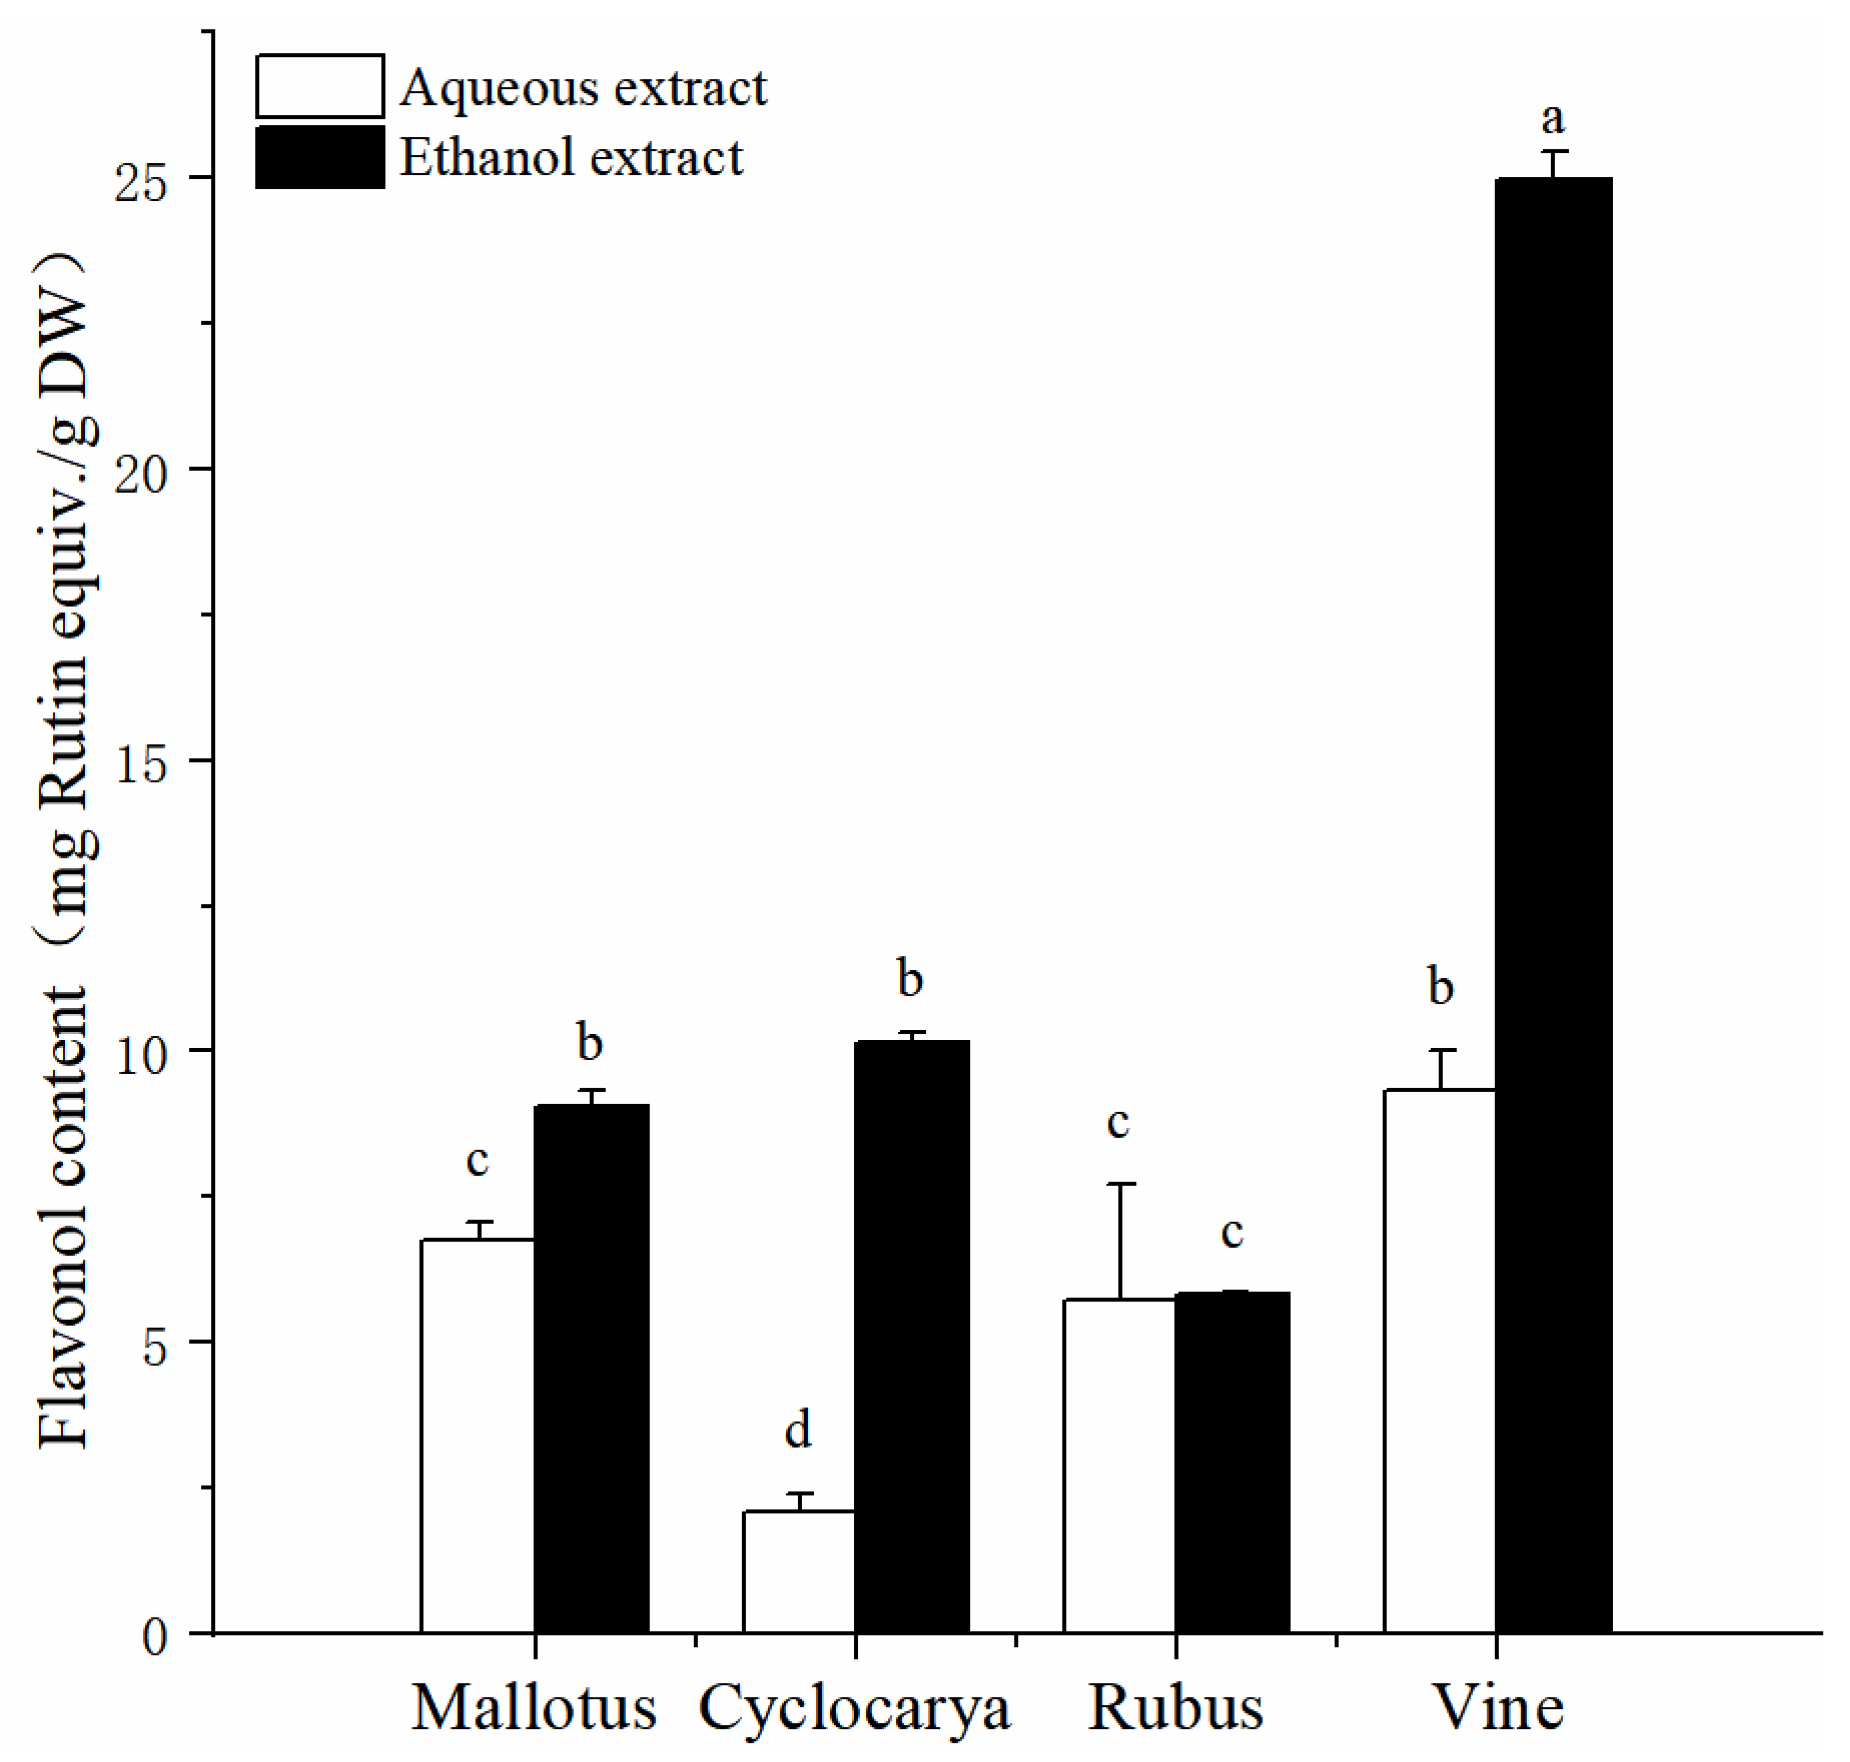
Figure 4.
Percent contribution of flavonoids to phenolics (A), percent contribution of flavonol to phenolics (B) (mean ± SD, n=3). Bars with different letters of differ significantly at P < 0.05.
Figure 4.
Percent contribution of flavonoids to phenolics (A), percent contribution of flavonol to phenolics (B) (mean ± SD, n=3). Bars with different letters of differ significantly at P < 0.05.
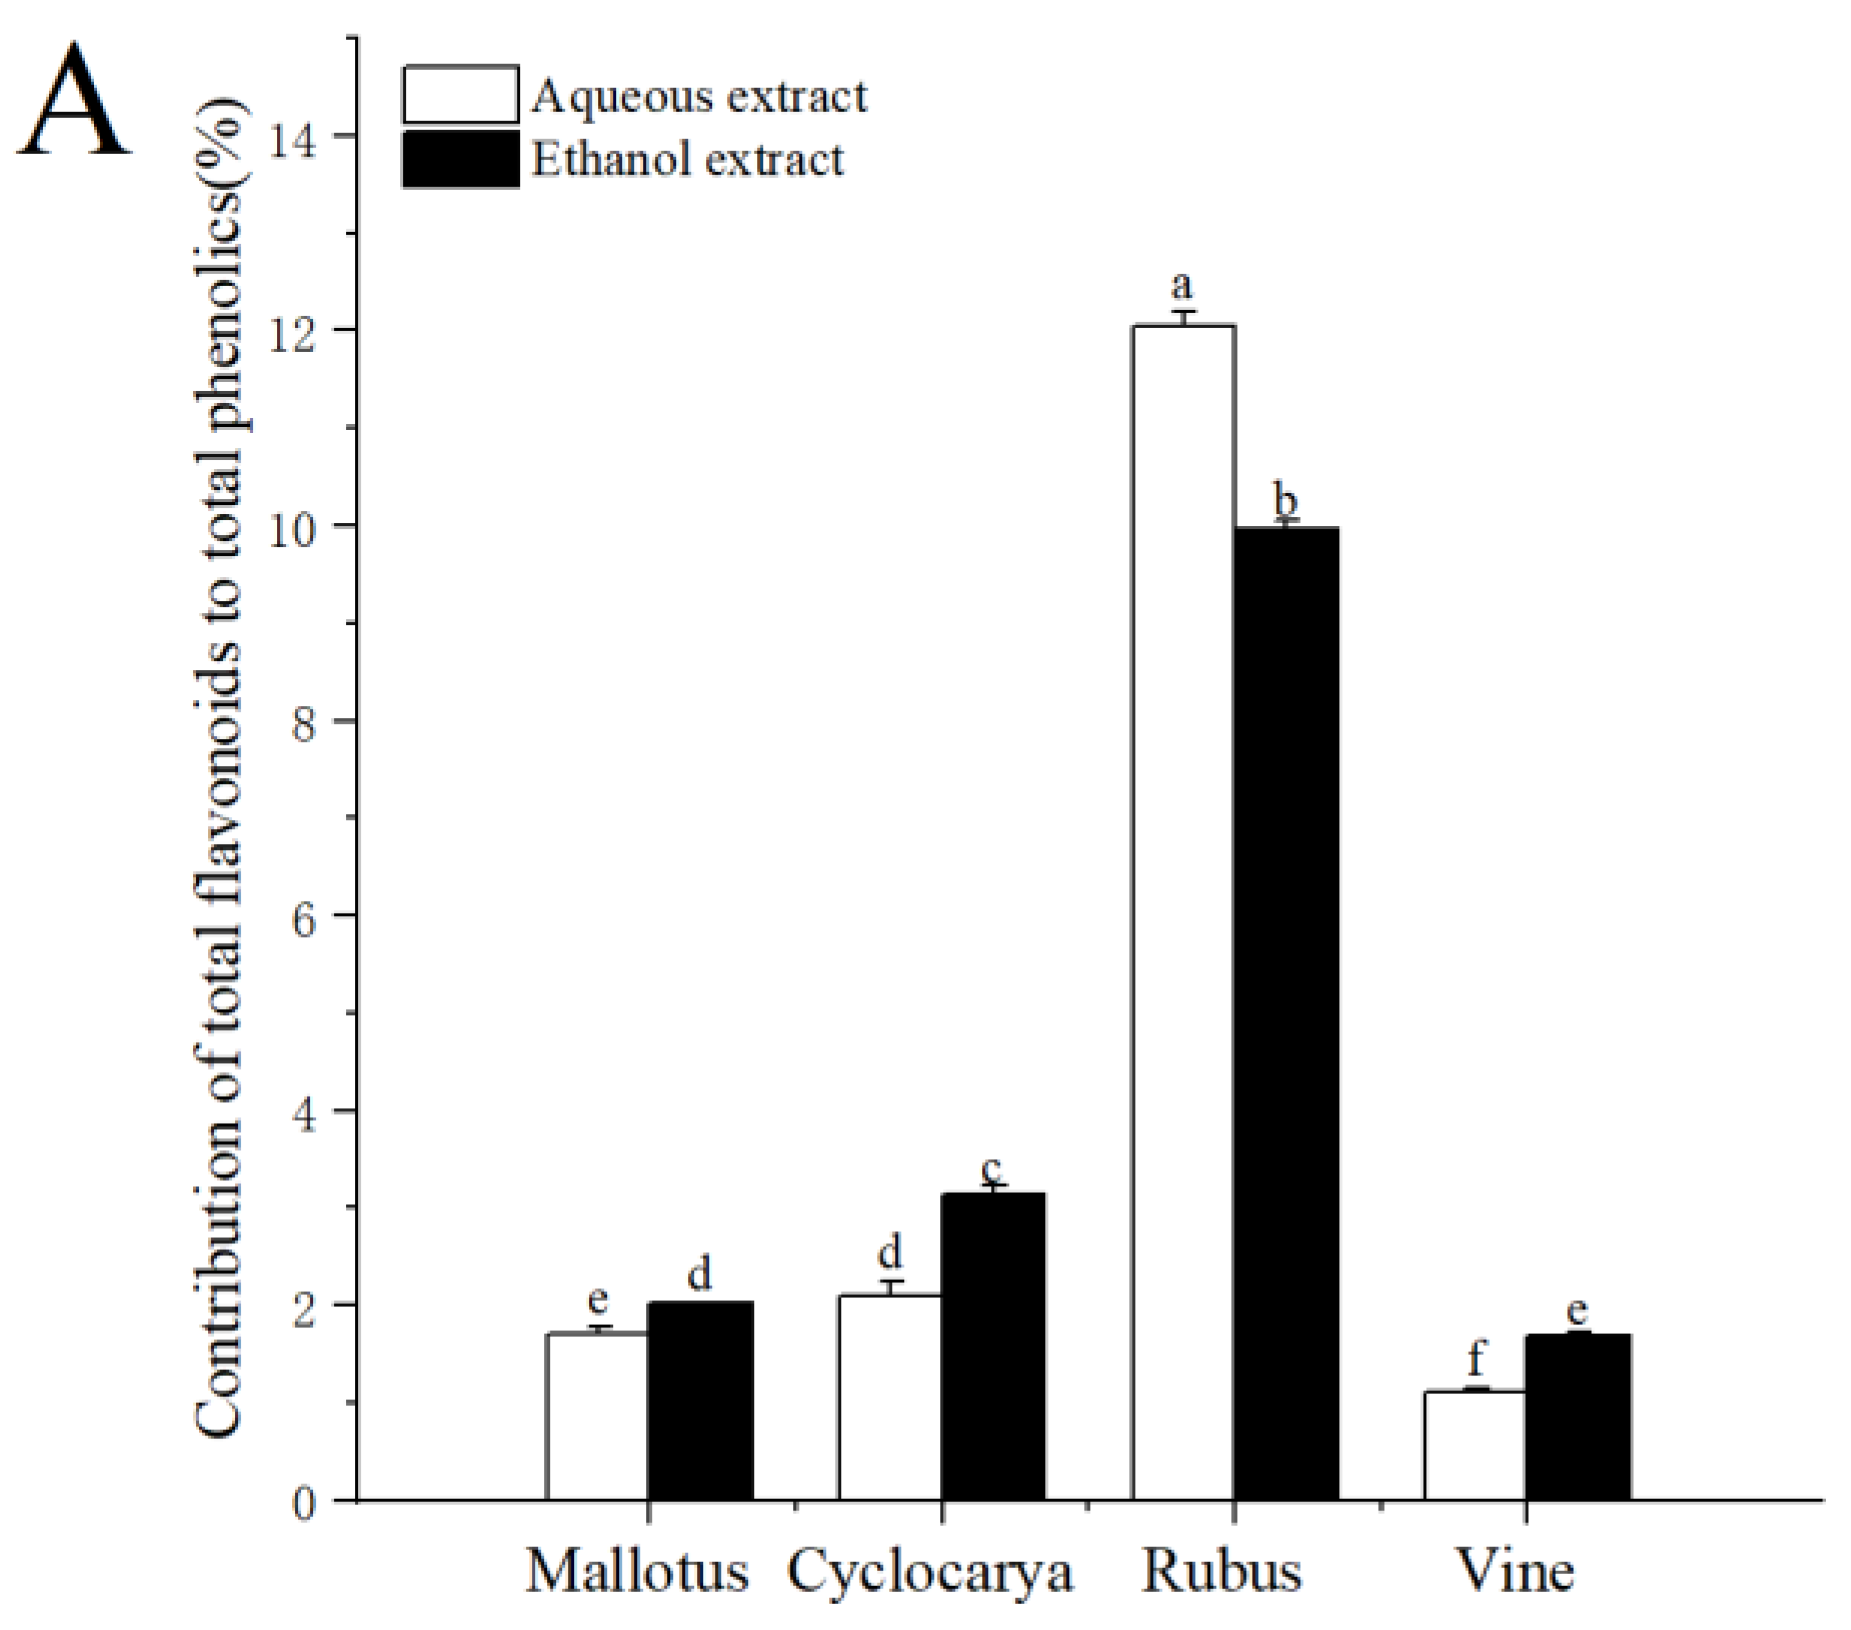
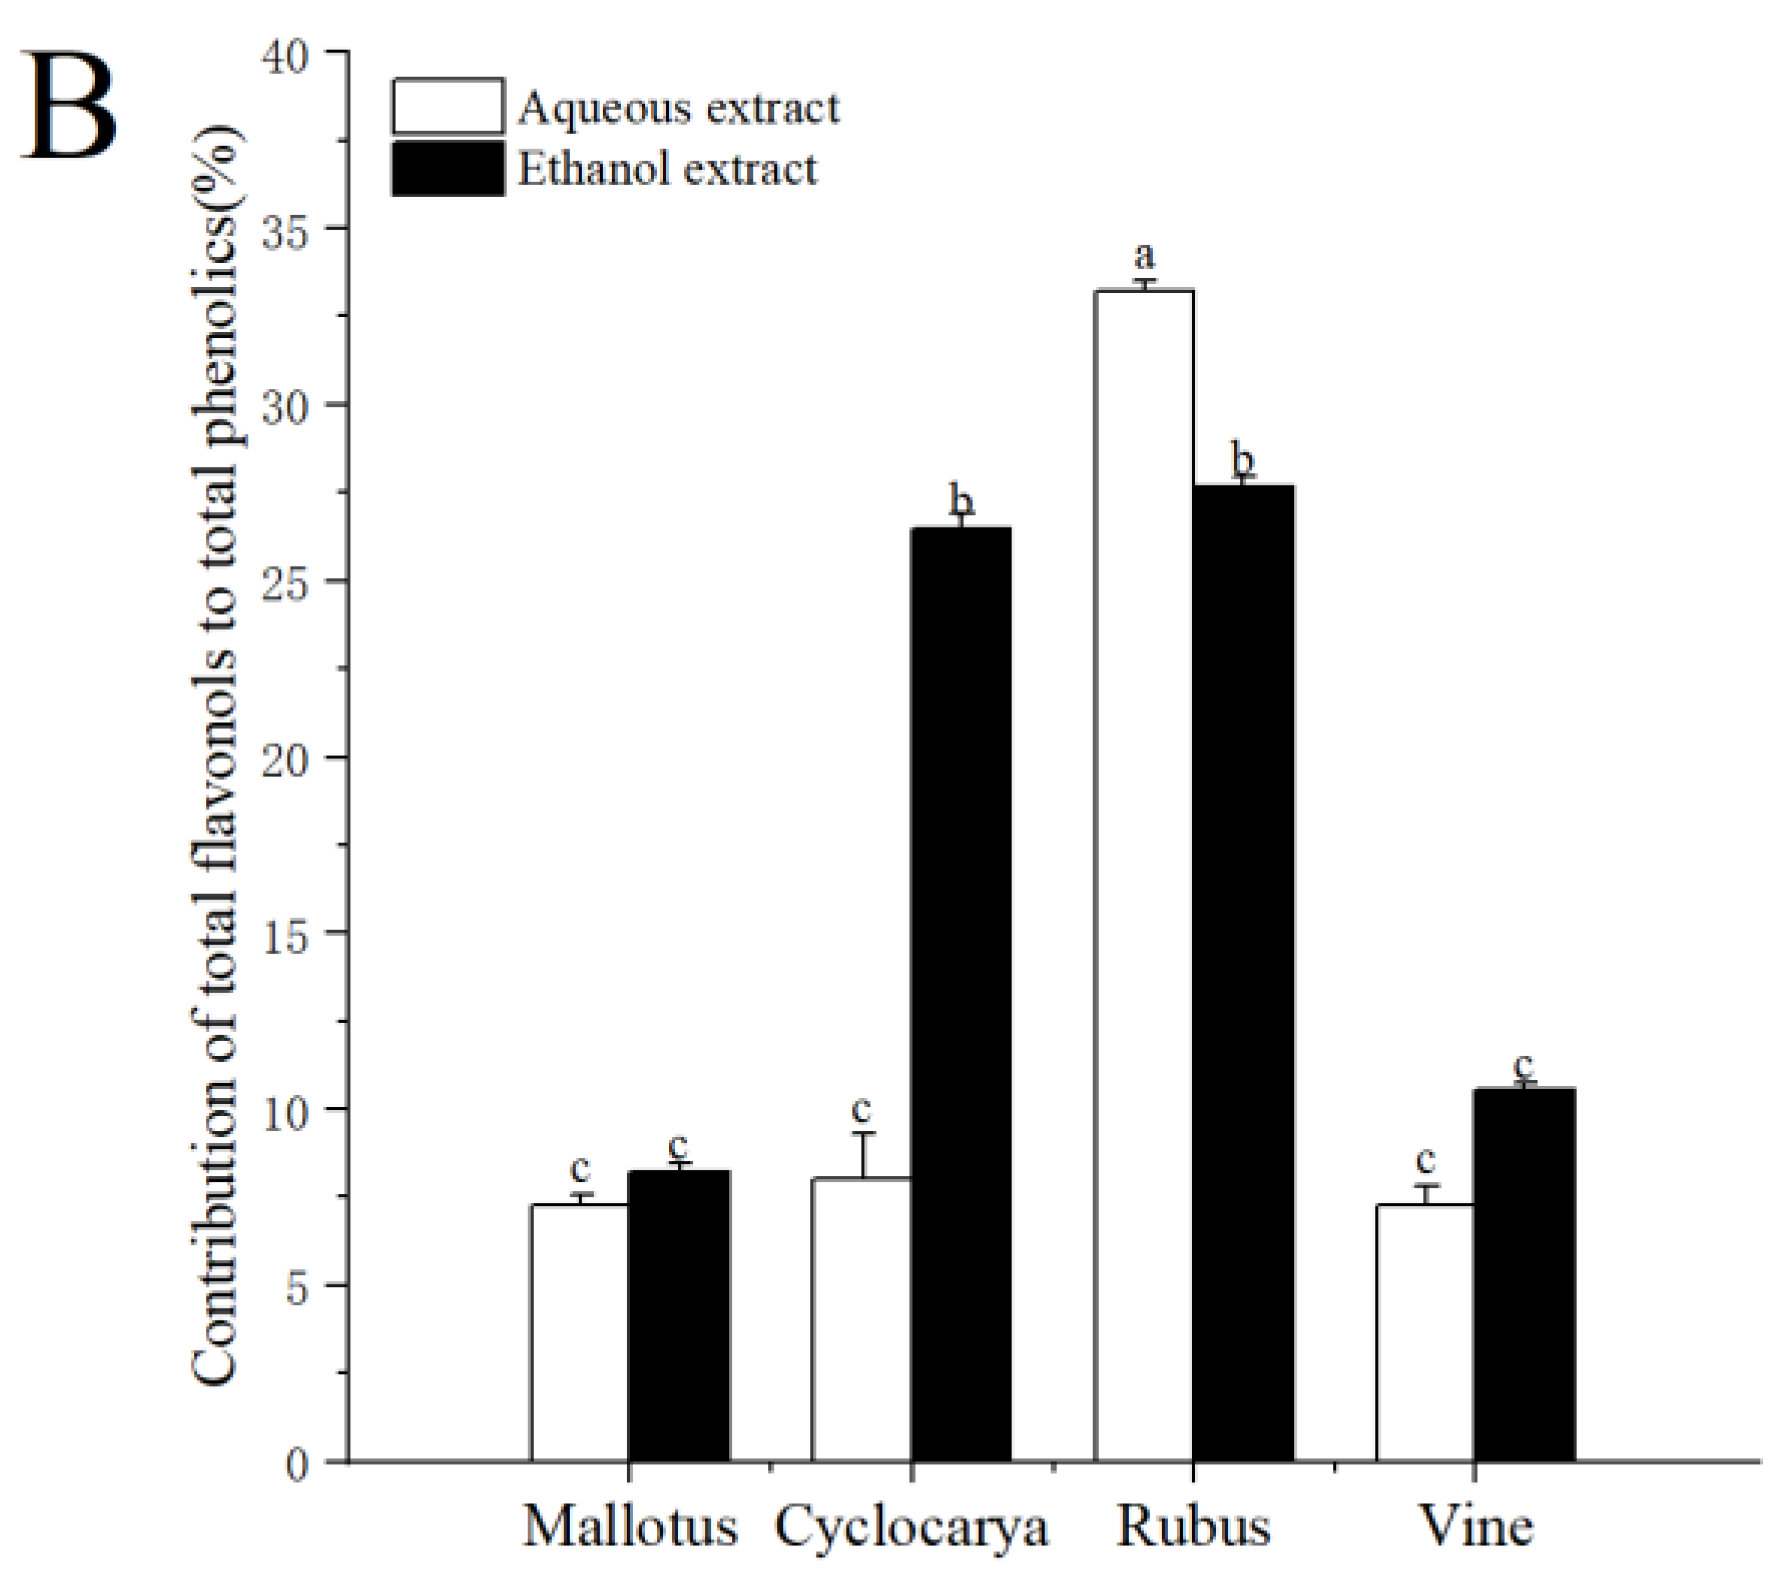
Figure 5.
DPPH (A) and ABTS (B) EC50 value of four herbal tea varieties (mean ± SD, n=3). Bars with different letters of differ significantly at P< 0.05.
Figure 5.
DPPH (A) and ABTS (B) EC50 value of four herbal tea varieties (mean ± SD, n=3). Bars with different letters of differ significantly at P< 0.05.
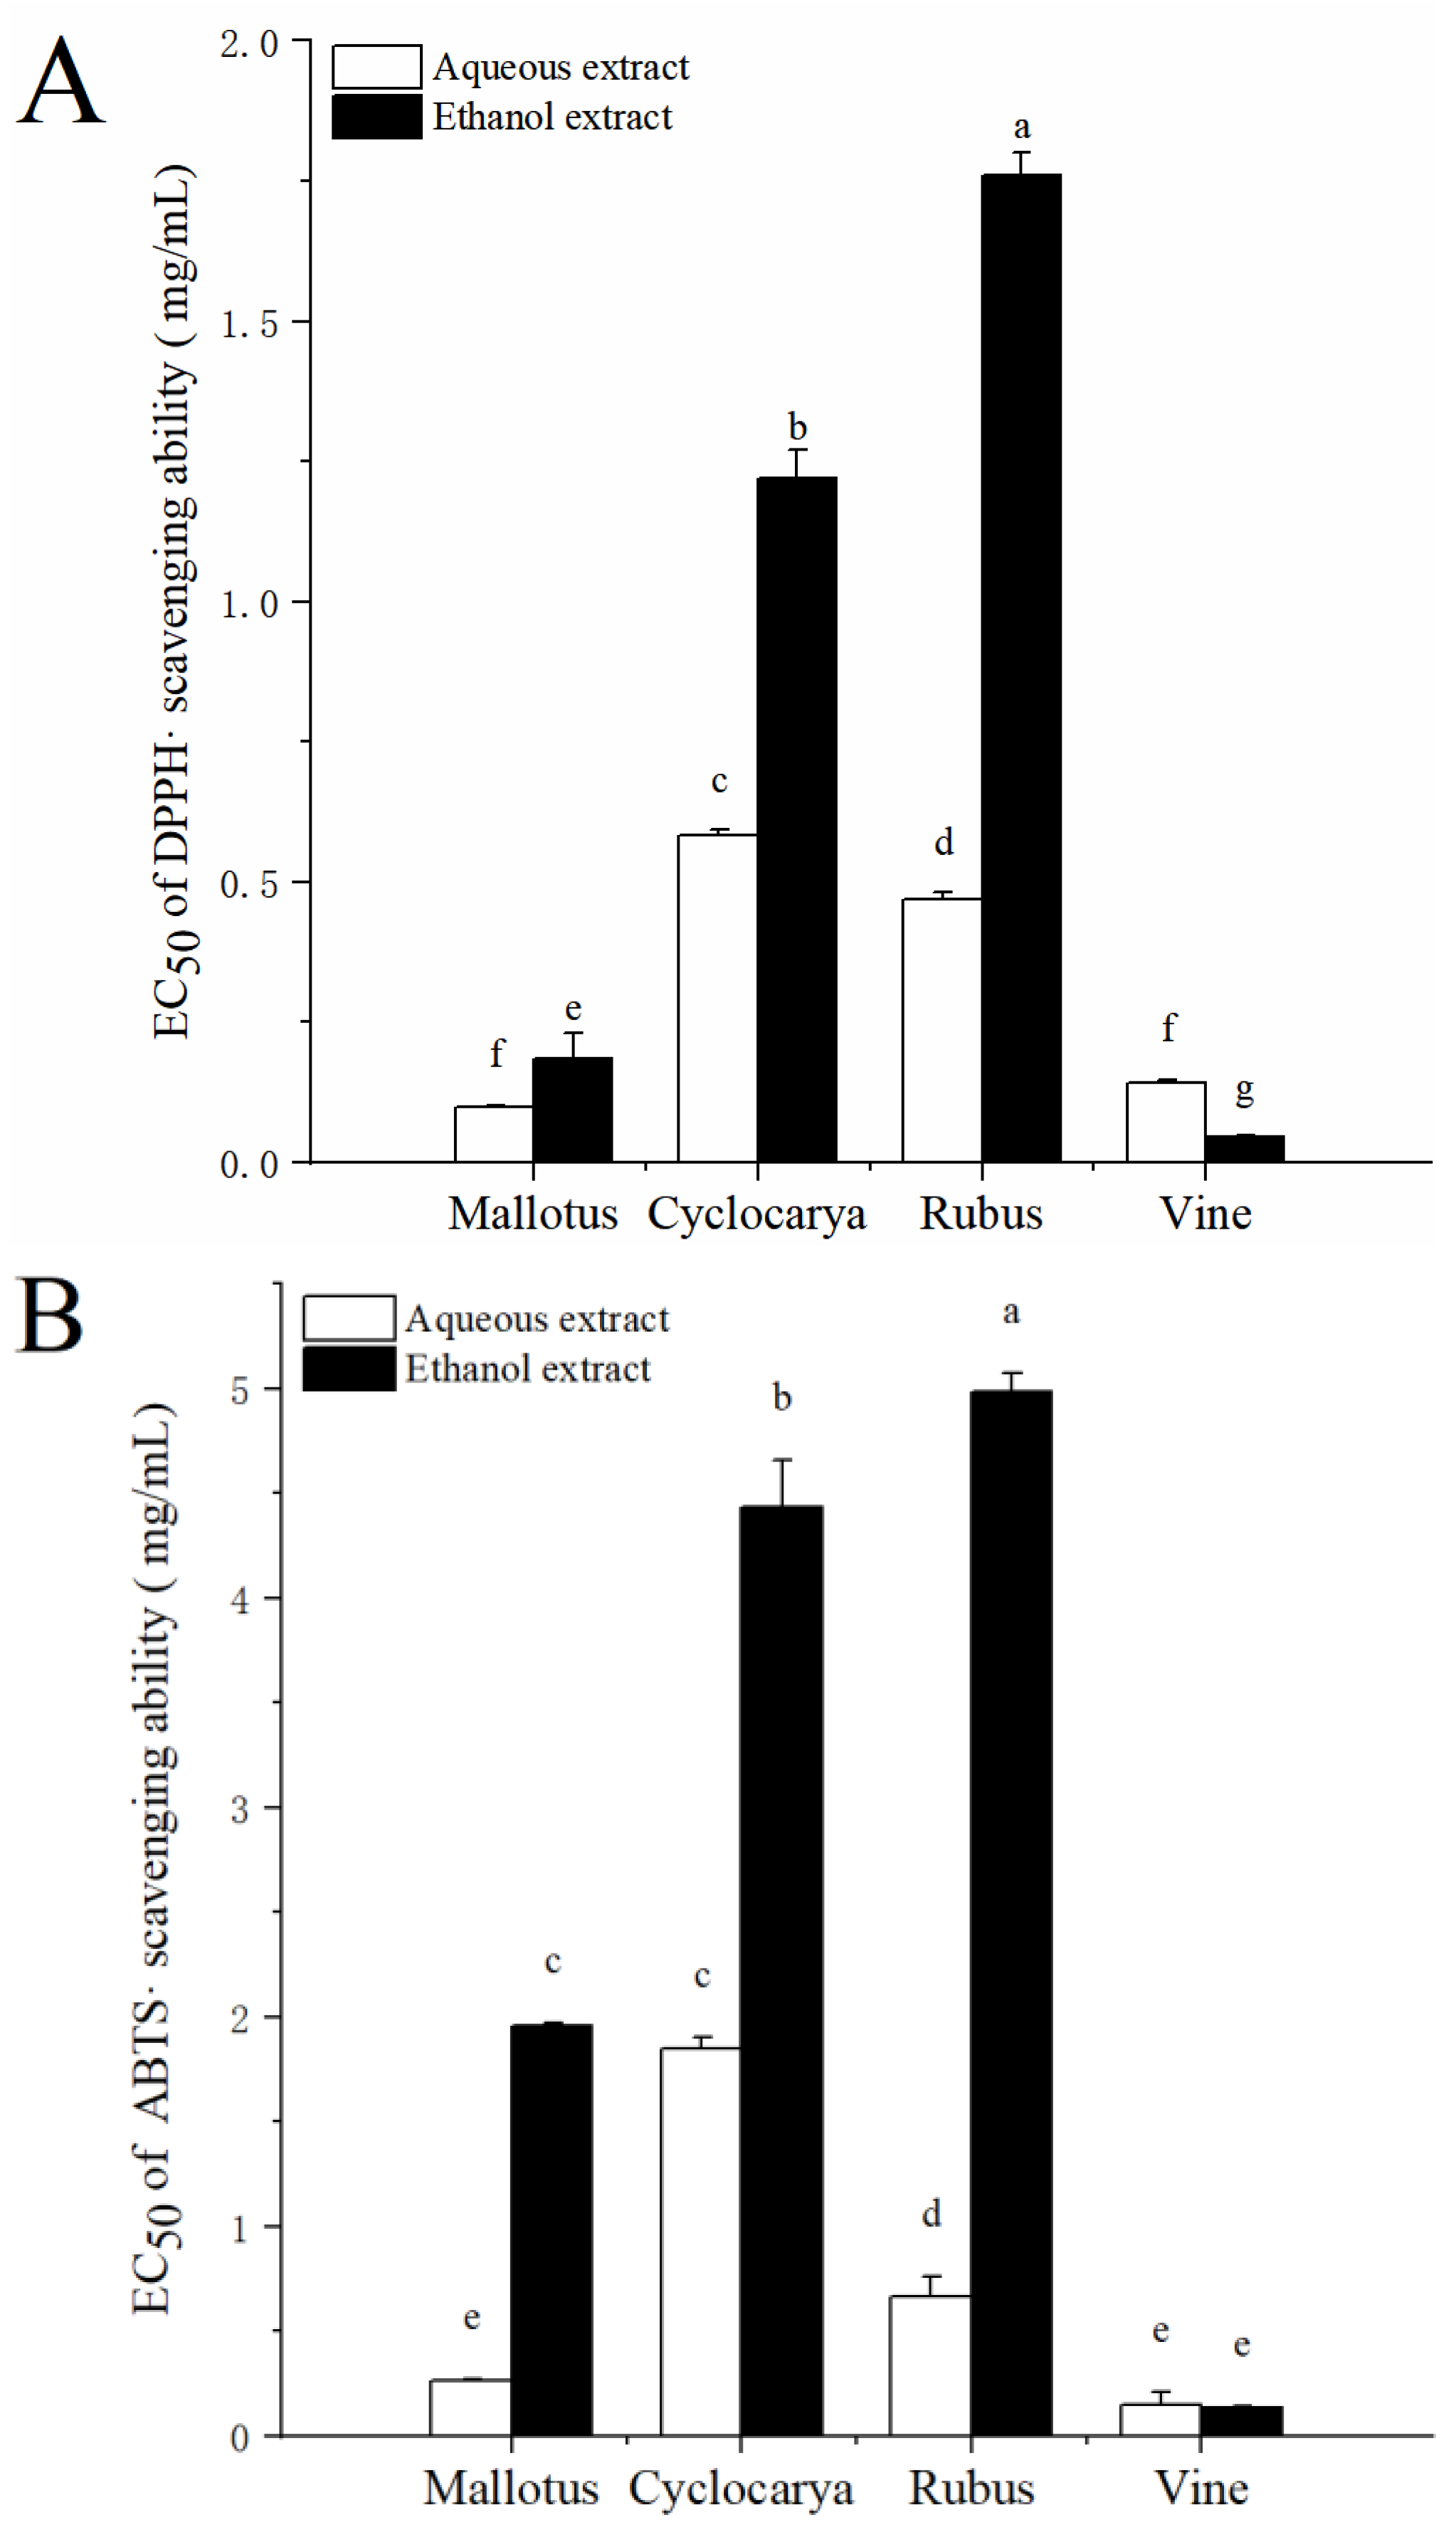
Figure 6.
α-Glucosidase inhibitory activity EC50 value of four herbal tea varieties (mean ± SD, n=3). Bars with different letters of differ significantly at P < 0.05.
Figure 6.
α-Glucosidase inhibitory activity EC50 value of four herbal tea varieties (mean ± SD, n=3). Bars with different letters of differ significantly at P < 0.05.
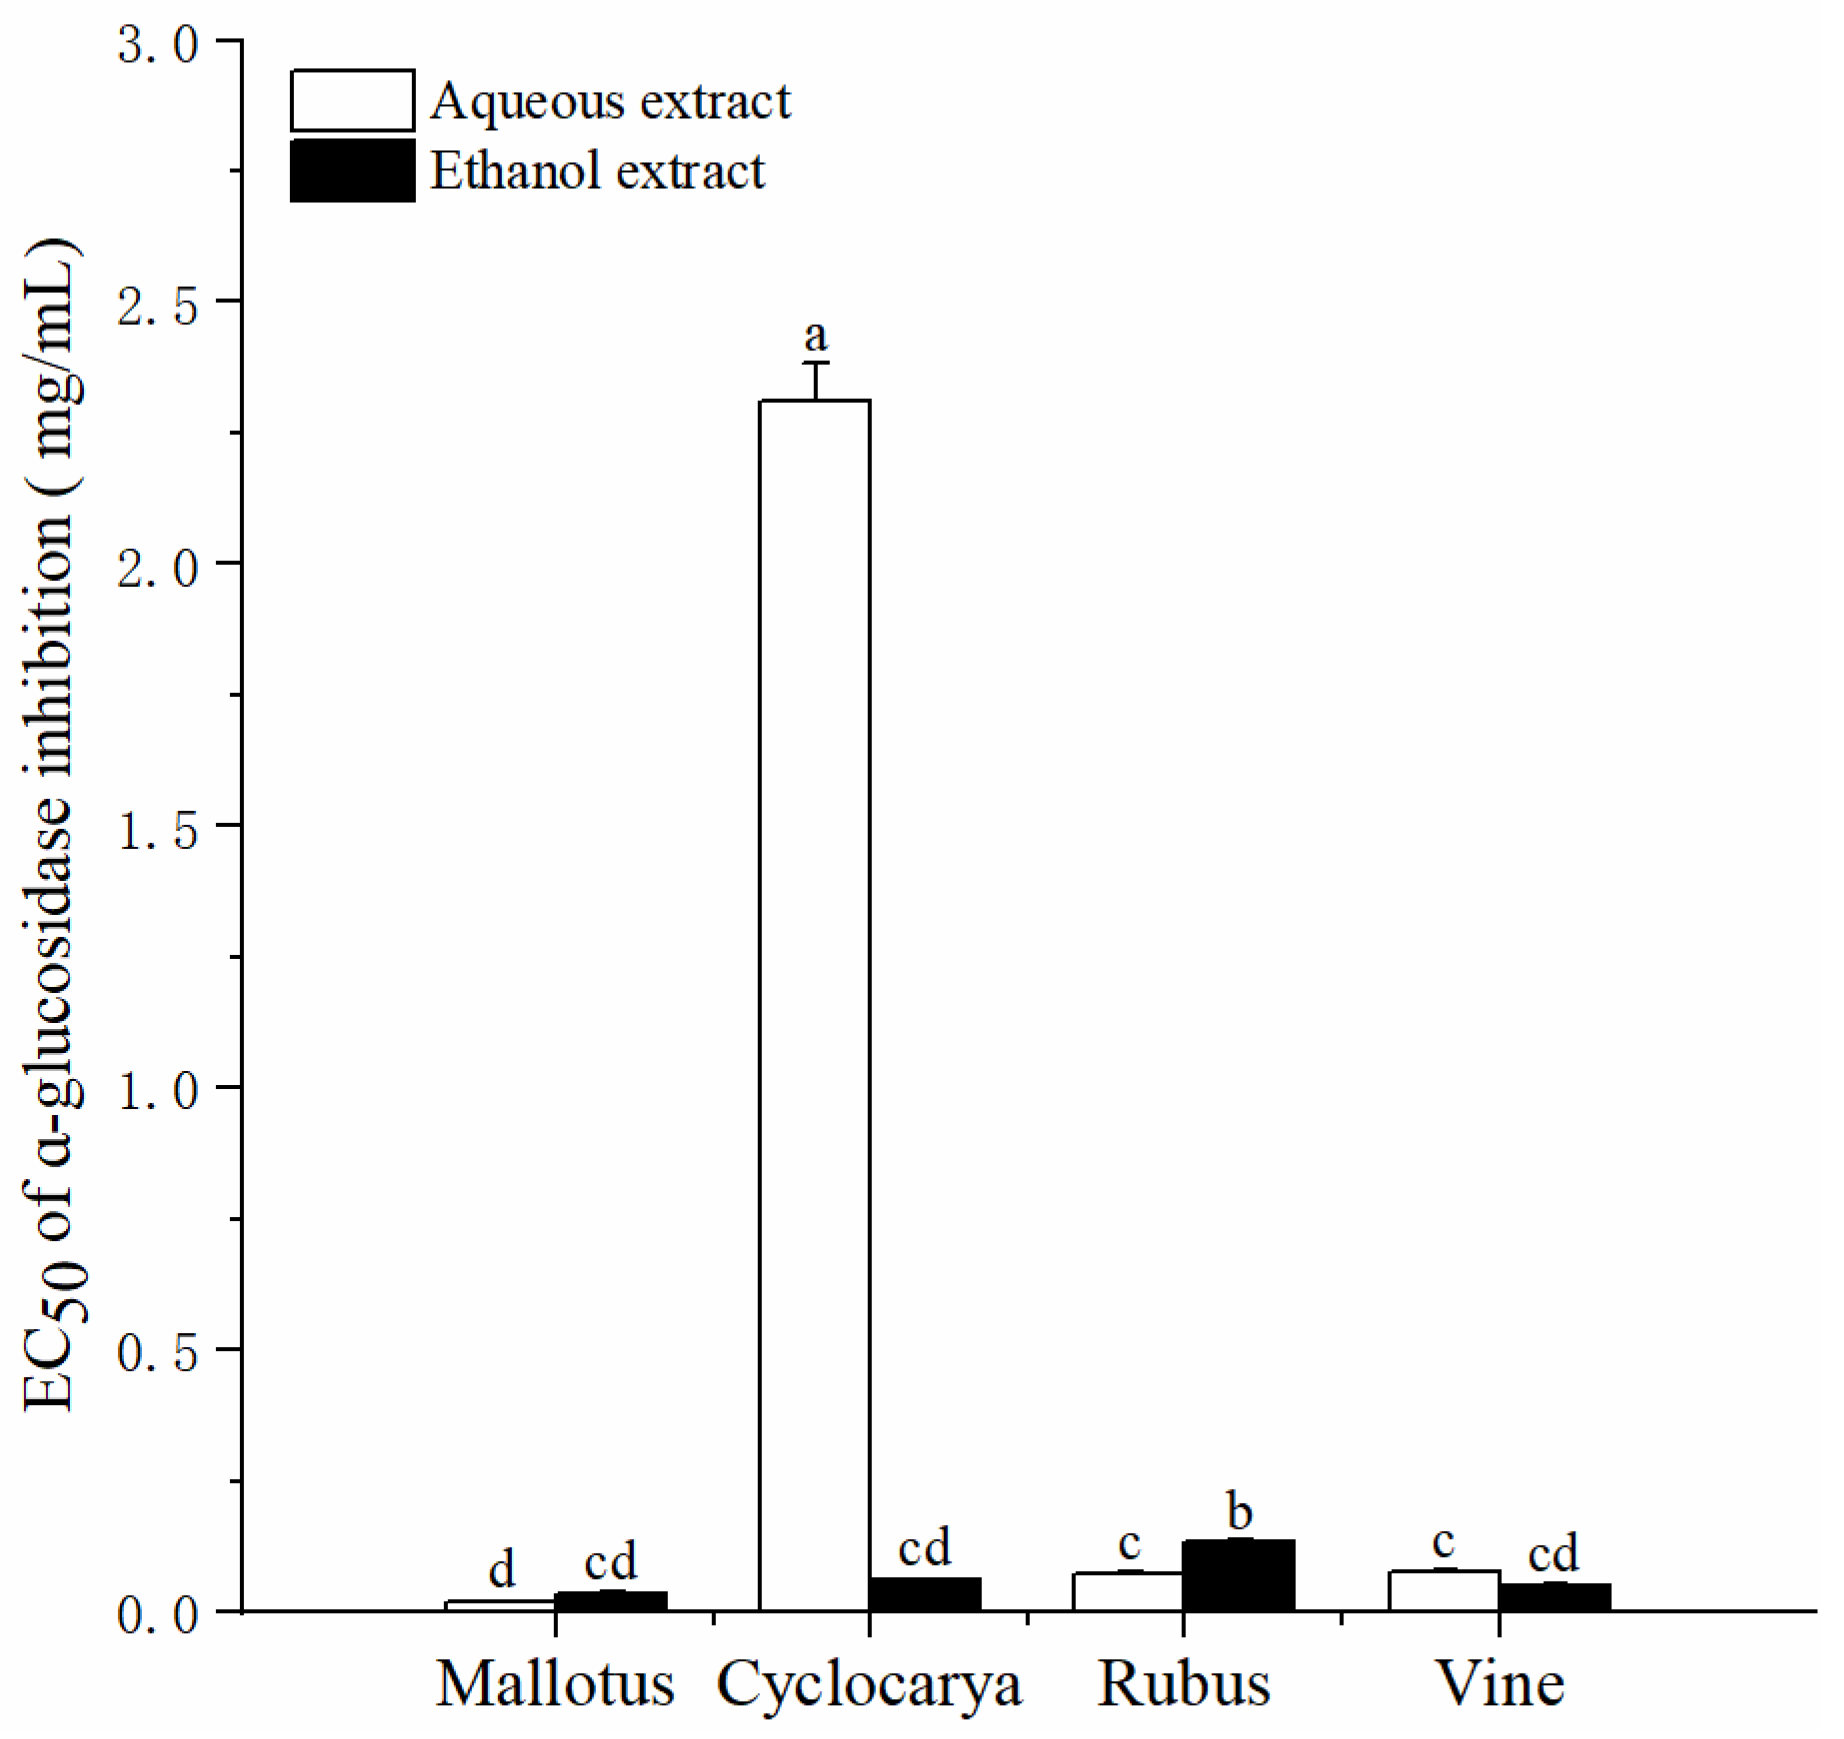
Figure 7.
Lineweaver-Burk plot of four herbal tea varieties extract for determining the inhibitory mode.
Figure 7.
Lineweaver-Burk plot of four herbal tea varieties extract for determining the inhibitory mode.
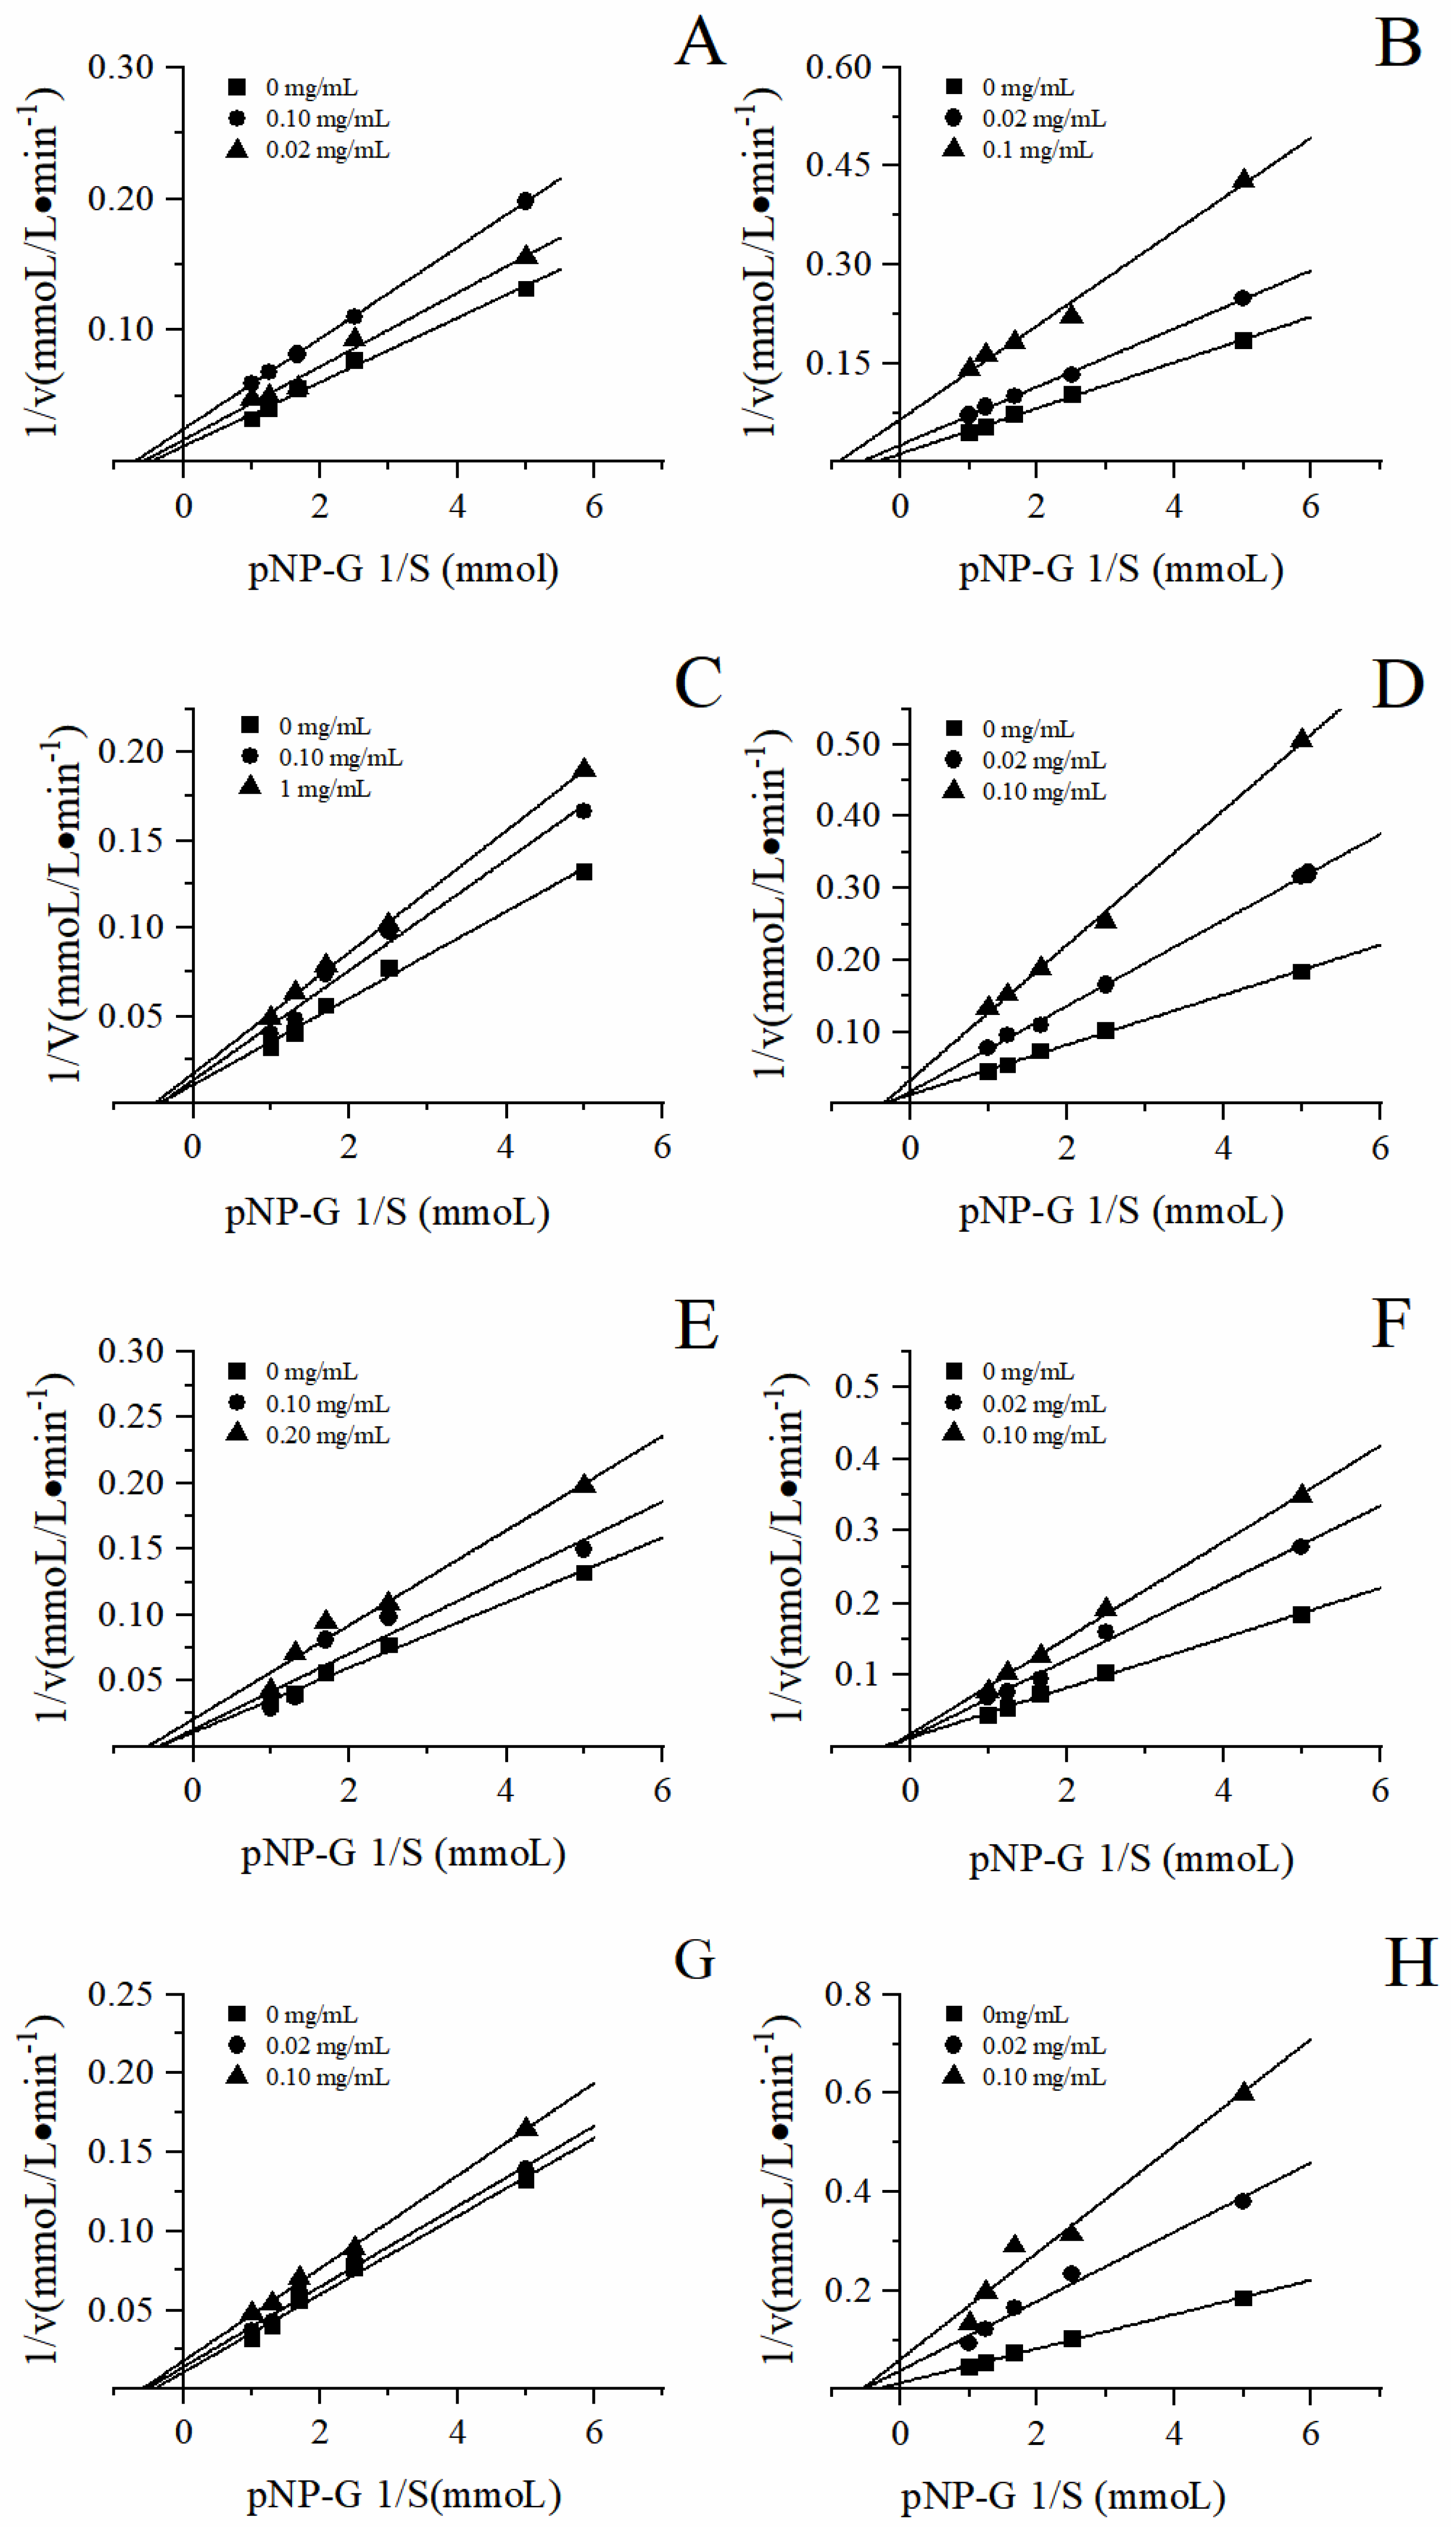
Figure 8.
HPLC-DAD chromatogram of four herbal tea varieties extracts. (A: Cyclnocarya; B: Mallotus; C: Rubus; D: Vine).
Figure 8.
HPLC-DAD chromatogram of four herbal tea varieties extracts. (A: Cyclnocarya; B: Mallotus; C: Rubus; D: Vine).
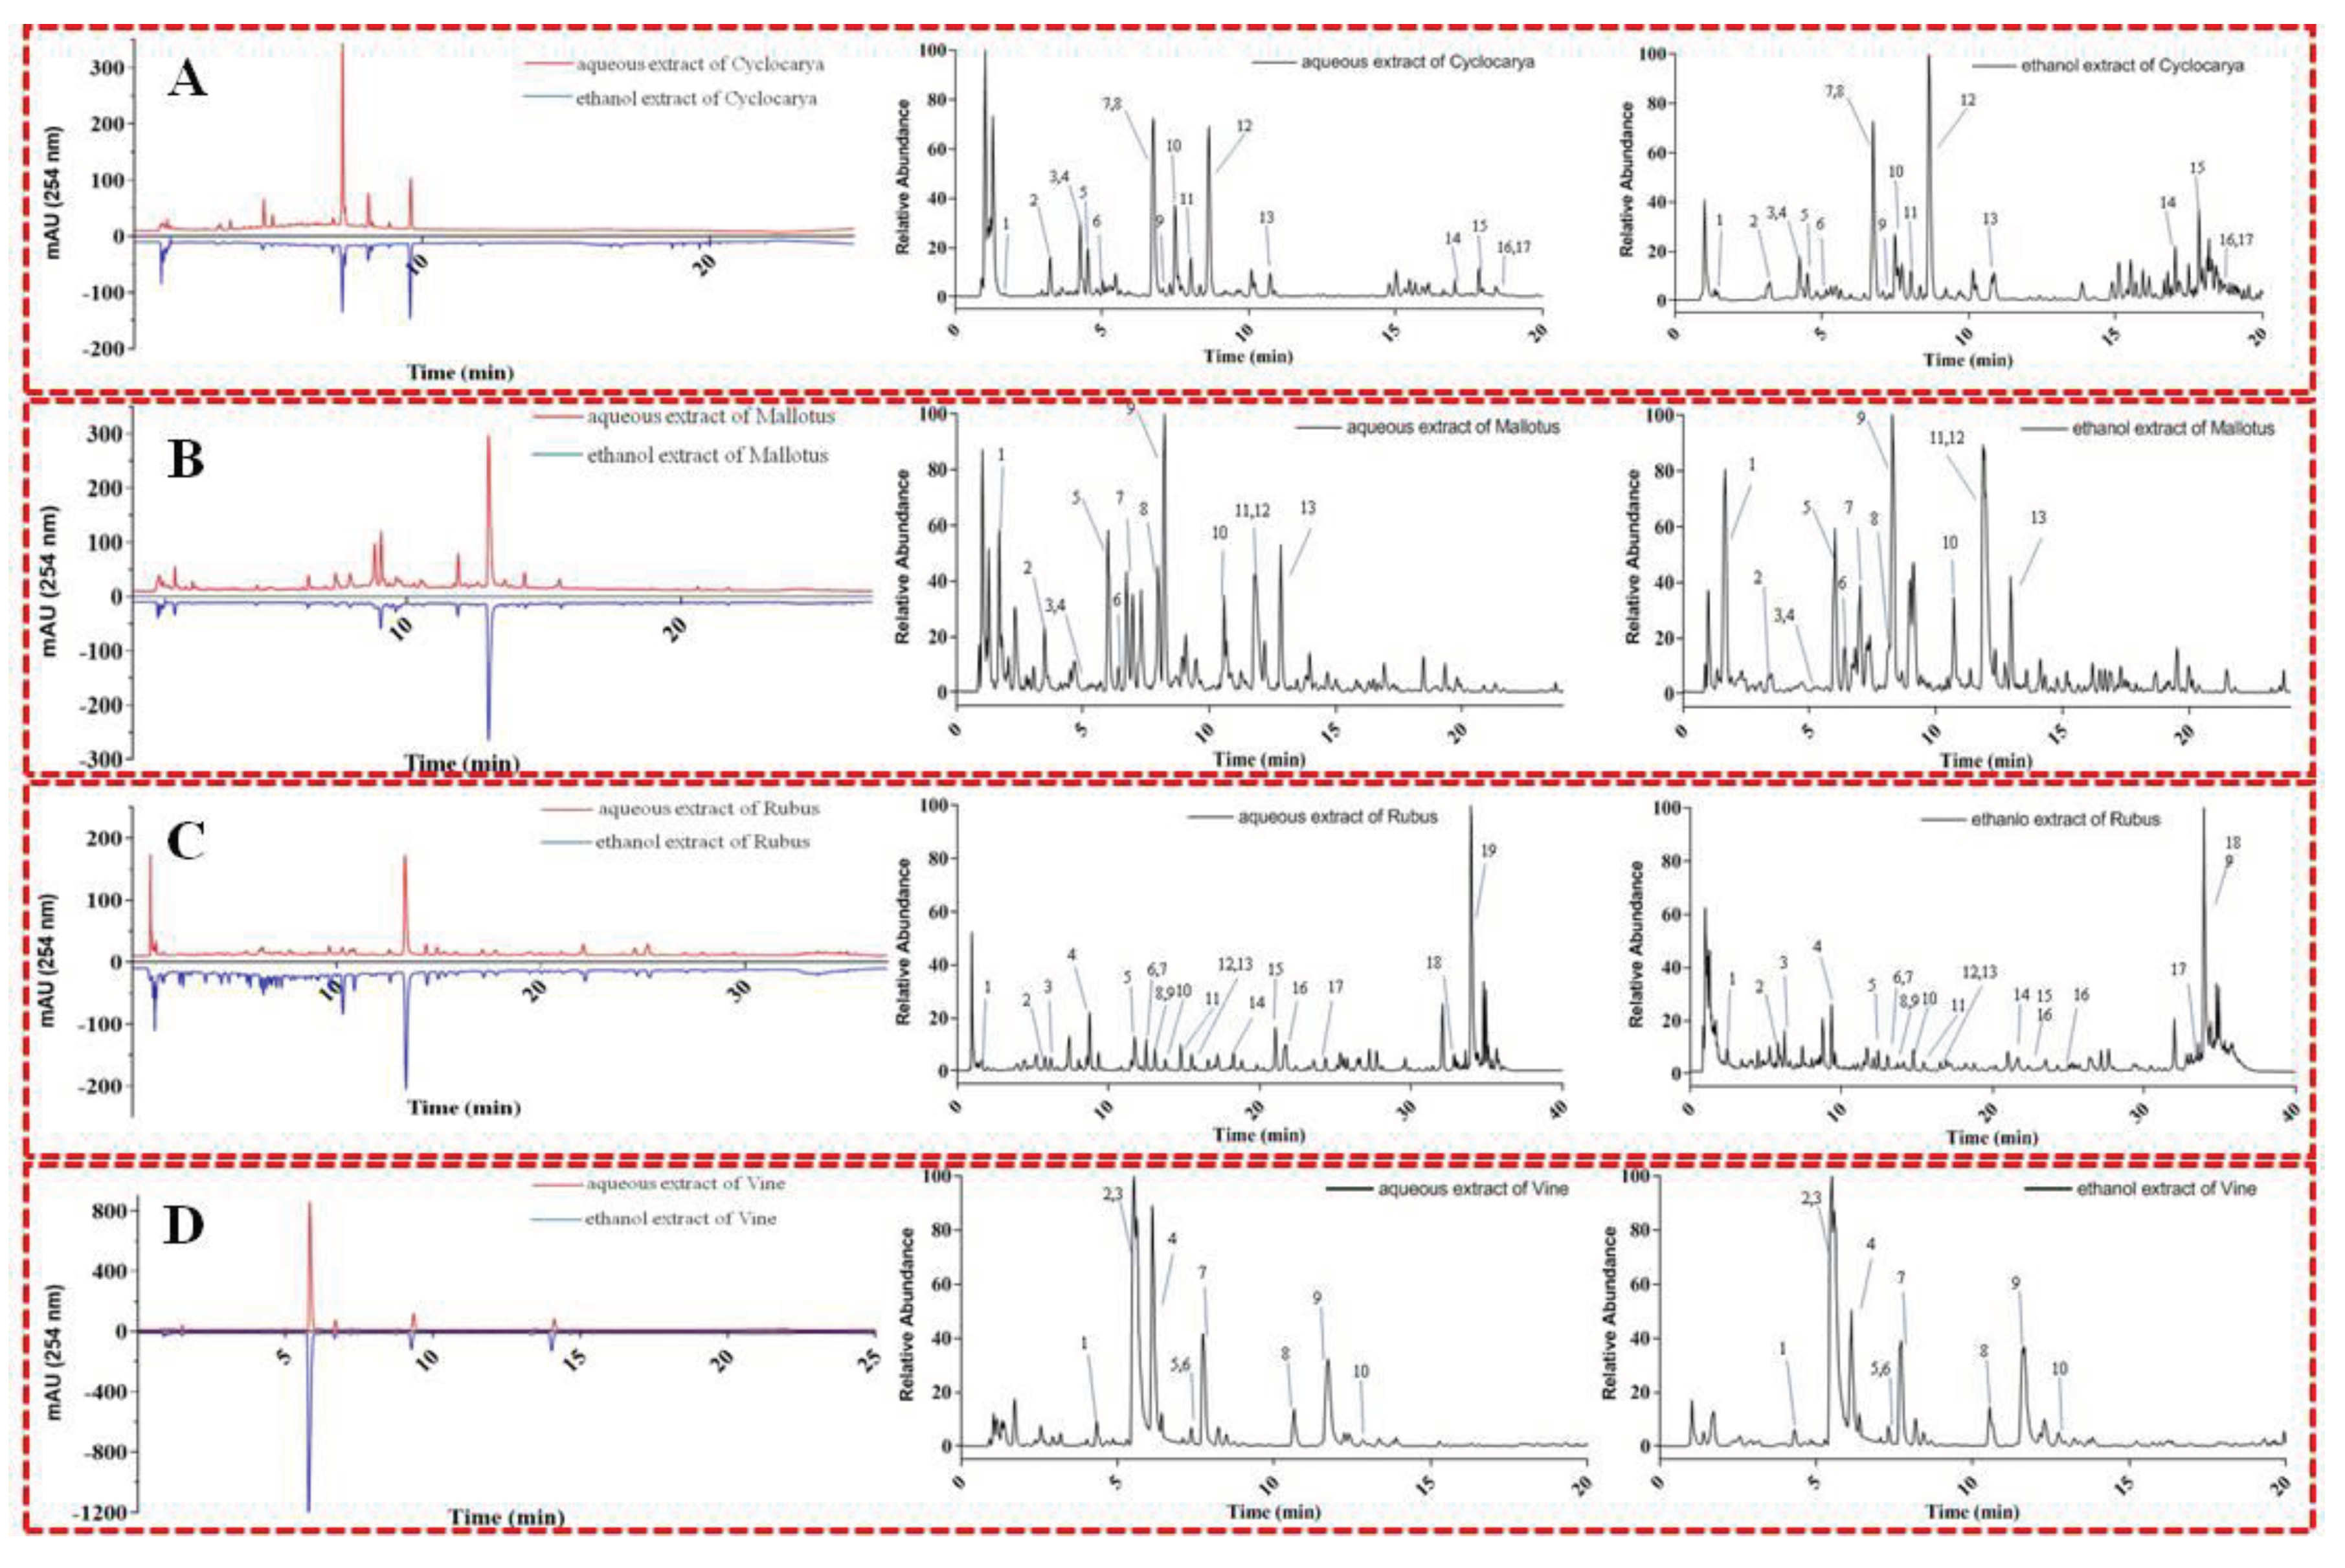
Table 1.
Descriptions of the four herbal teas employed in the study.
| Figure of teas | Common name | Chinese name | Species | Family | Part used and Packaging |
 |
Mallotus | Shankucha | Mallotus peltatus | Euphorbiaceae | Leaf, Loose tea |
 |
Cyclocarya | Qingqianliu | Cyclocarya paliurus | Juglandaceae | Leaf, Loose tea |
 |
Rubus | Tiancha | Rubus chingii | Rosaceae | Leaf, Loose tea |
 |
Vine | Meicha | Ampelopsis grossedentata | Vitaceae | Leaf, Loose tea |
Table 2.
Correlation analysis of 1/EC50 value and various indexes of tea extracts from different varieties.
Table 2.
Correlation analysis of 1/EC50 value and various indexes of tea extracts from different varieties.
| Index | TotalBREAKpolypheols | TotalBREAKflavonoids | TotalBREAKflavonols | DPPH·BREAKscavengingBREAKability | ABTS·BREAKscavengingBREAKability | ɑ-glucosidaseBREAKinhibition |
| Total polyphenols | 1.00 | 0.05 | 0.04 | 0.903** | 0.756** | 0.32 |
| Total flavonoids | 1.00 | 0.872** | 0.06 | -0.15 | -0.12 | |
| Total flavonols | 1.00 | 0.02 | -0.13 | -0.19 | ||
| DPPH·scavenging ability | 1.00 | 0.750** | 0.33 | |||
| ABTS·scavenging ability | 1.00 | 0.17 | ||||
| α-glucosidase inhibition | 1.00 |
* Significant correlation at the P< 0.05 level, ** Very significant correlation at the P < 0.01 level.
Disclaimer/Publisher’s Note: The statements, opinions and data contained in all publications are solely those of the individual author(s) and contributor(s) and not of MDPI and/or the editor(s). MDPI and/or the editor(s) disclaim responsibility for any injury to people or property resulting from any ideas, methods, instructions or products referred to in the content. |
© 2024 by the authors. Licensee MDPI, Basel, Switzerland. This article is an open access article distributed under the terms and conditions of the Creative Commons Attribution (CC BY) license (http://creativecommons.org/licenses/by/4.0/).
Copyright: This open access article is published under a Creative Commons CC BY 4.0 license, which permit the free download, distribution, and reuse, provided that the author and preprint are cited in any reuse.


