Submitted:
16 January 2024
Posted:
16 January 2024
You are already at the latest version
Abstract
Salt stress is one of the most severe environmental stresses limiting the productivity of crops, including rice. However, there is a lack of information on how salt-stress sensitivity varies across different developmental stages in rice. In view of this, a comparative evaluation of contrasting rice varieties CSR36 (salt tolerant) and Jaya (salt sensitive) was conducted, wherein NaCl stress (50 mM) was independently given either at seedling (S-stage), tillering (T-stage), flowering (F-stage), seed-setting (SS-stage) or throughout the plant growth, from seedling till maturity. Except for S-stage, CSR36 exhibited improved NaCl stress tolerance than Jaya, at all other tested stages. Principal component analysis (PCA) revealed that the improved NaCl stress tolerance in CSR36 coincided with enhanced activities/levels of enzymatic/non-enzymatic antioxidants (root ascorbate peroxidase for T- and S+T stages and root catalase for F-, S+T and S+T+F-stages) and higher accumulation of osmolytes (shoot proline for F-stage and S+T+F-stage), indicating better antioxidant capacitance and osmotic adjustment, respectively. In contrast, higher shoot accumulation of Na+ and consequent increase in Na+/K+, Na+/Ca+2 and Na+/Mg+2 ratio in root and shoot, were identified as major variables associated with NaCl stress induced growth reduction in Jaya. In addition, CSR36 exhibited higher levels of Fe3+, Mn2+ and Co3+ and lower Cl- and SO42-, suggesting its potential to discriminate essential and non-essential nutrients, which might contribute to NaCl stress tolerance. Taken together, the findings provided the frame-work for stage-specific salinity responses in rice, which will facilitate crop-improvement programs for specific ecological niches including the coastal regions.
Rice, salt stress, stage-specific salinity, antioxidant defense, ionic homeostasis, salt tolerance
Keywords:
Rice
; Salt Stress
; Stage-specific salinity
; Antioxidant defense
; Ionic homeostasis
; Salt tolerance
1. Introduction
Soil salinization is a global and dynamic problem and is projected to increase in future, under rapidly changing climatic scenarios (Hassani et al. 2020). In India, over 7 million ha land is covered with saline soil, which is expected to further increase to 11.7 million ha by 2025 (Singh, 2018). Increased salinity adversely affects the growth and yield of many staple food crops, including rice (Oryza sativa L.), which feeds more than half of the world population. Rice is the most salt-sensitive cereal crop, which suffers up to 50% yield losses at ECe 7.2 dS/m (Hoang et al. 2016). Salt tolerance in rice depends on the genotype, developmental stage and organ of the plant (Kurotani et al. 2015). Therefore, understanding and improving the salt tolerance of rice at different growth stages, will not only lead to the effective use of the saline land, but it will also support sustainable agriculture and alleviation of the world food crisis in future. The effect of salinity stress is manifested sequentially, beginning with osmotic stress buildup, followed by ionic toxicity and subsequently to severe nutritional deficiencies, eventually leading to growth inhibition and yield losses. Salinity stress impairs photosynthetic activity and overall growth, resulting in reduction in plant height, tiller numbers and biomass and induction of partial sterility (Zeeshan et al. 2020). The toxic effect of salinity is usually associated with increased accumulation of Na+, which disrupt the ionic homeostasis (K+/Na+) of the plant. Intracellular K+ homeostasis is crucial as it regulates the plant’s physiological functions like osmoregulation, chloroplast development, stomatal conductance, cytosolic pH regulation, phloem translocation, and stabilization of membrane potential, ultimately affecting the crop growth and yield (Assaha et al. 2017). Salinity increases the level of lipid peroxidation, as envisaged by higher malondialdehyde (MDA) levels, resulting in higher membrane damage as a consequence of imbalanced redox-management (El Mahi et al. 2019).
Plants deploy a two-pronged system to counter the adverse consequences of salinity-induced production of ROS. First, enzymatic antioxidants [superoxide dismutase (SOD), catalase (CAT), ascorbate peroxidase (APX), glutathione reductase (GR)] and second, non-enzymatic [ascorbate (ASC), glutathione (GSH), tocopherols, phenolics and flavonoids] antioxidant systems (Sofy et al. 2020). Akin to ROS homeostasis, ionic homeostasis also plays an important role towards salinity tolerance in plants. Plants are equipped with ion-exclusion or sequestration mechanisms to avoid the toxic build-up of Na+ or Cl- in the roots and their subsequent transport to young leaves (Amin et al. 2021). Ionic balance is essential to normal functioning and growth of the plant (Kaiwen et al. 2020). Nutrient status of plant is negatively affected under salt stress, as higher concentration of Na+ and Cl- in soil sap, decreases the uptake of various macronutrients (NO3-, PO43-, K+, Mg+2 and Ca+2) and micronutrients (Cu+2, Mn+2, Zn+2, Mo+3, Fe+3 and Co+3) essential for growth and development (Kumar et al. 2021). High Na+ and Cl- concentrations in the soil solution may suppress nutrient uptake and result in undesirable ratios of Na+: Ca2+, Na+: K+, and Na+: Mg2+ (Abdel-Fattah and Asrar, 2012). This can lead to ionic imbalance, thereby affecting plant’s physiological traits (Munns et al. 2006). High salt concentration results in lower N accretion in plants, due to the interaction between Cl− and NO3− and Na+ and NH4+, which subsequently reduces plant growth and crop yield (Kamran et al. 2019). Salinization renders PO43- unavailable to plants due to its precipitation with other cations, such as Ca2+, Mg2+, and Zn2+ depending upon the pH of the soil environment, thereby, inducing salt-induced P deficiency in plants (Dey et al. 2021). Although, the salt-stress induced biochemical and physiological changes are well-demonstrated; however, stage-specific sensitivity and defense mechanisms has not yet been reported in rice. To fill this gap, the present study was conducted to unravel the differential sensitivity, at different developmental stages and also, to identify the closely related biochemical attributes of rice.
2. Material and Methods
2.1. Plant material, growth conditions and stress treatment
The present study was conducted at NA&BTD farm of Bhabha Atomic Research Centre, Trombay, Mumbai, India under poly house conditions. The growth conditions were maintained at 30°C/25°C day/night temperature, 14/10 hours day/night photoperiod, humidity 75%±5%, light intensity: 900-1000 µEm-2s-1. Two rice varieties, namely CSR36 (salt tolerant) and Jaya (salt sensitive), were considered for this study. CSR36 is a commercially grown, widely adapted salt-tolerant variety of India, developed through a three-way cross (CSR13 (inland saline) / Panvel 2 (coastal saline) /IR36) and possess better grain yield under coastal and inland saline conditions (Krishnamurthy et al. 2017). The surface-sterilized seeds of both varieties were germinated for 48 h and hydroponic cultures were established, as per the method described previously (Srivastava et al. 2014). The whole experiment was planted in two treatment sets: 1) stage-specific salinity stress; 2) combined-stages salinity stress (Figure 1). The first set was further divided into 4 treatments namely i) seedling (S), ii) tillering (T), iii) flowering (F) and iv) seed setting (SS) stage salinity. The second set was divided into 3 treatment sets namely i) seedling + tillering (S+T), ii) seeding + tillering + flowering (S+T+F) and iii) seeding + tillering + flowering + seed setting (S+T+F+SS) stage salinity (Figure 1). Planting was done with three replications/ treatment in RBD and three pots per replication. Four healthy, 30 days old (4-leaf stage), hydroponically grown seedlings of both the varieties were transferred to single plastic pot (12kg soil capacity), for each of the seven treatment groups (9 pots/treatment group). Control seedlings were also grown in 9 pots with water application. IC50 NaCl for Jaya was calculated as 50mM NaCl salt concentration under hydroponics (Supplementary Figure S5). The NaCl dose (9.5g NaCl/per pot; equivalent to ~ 50 mM) was calculated considering the total water holding capacity of 12 kg paddy soil to be 3.25 litre, which included soil saturation with water (1.85 litre) and 5cm standing water (1.4 litre) required for inundation. Group-I(S) plants were treated with 9.5g NaCl per pot in 1.4 litre water at 7 days post-transplantation. Group-2 (T), -3 (F) and -4 (SS) seedlings were given NaCl treatment of similar magnitude at 22-, 50- and 75-days post-transplantation. For group 1-4, NaCl treatment was continued for 10 days with intermittent water application to maintain 5 cm standing water. Group-5 (S+T) seedlings were given NaCl treatment at 7 and 22 days, group-6 (S+T+F) seedlings at 7, 22 and 50 days and group-7 (S+T+F+SS) seedlings at 7-, 22-, 50- and 75-days post transplantation. For group 5, 6 and 7, NaCl treatment was continued for 10 days from the last application of saline solution. The crops were harvested at 10 days post the salt treatment. Whole plants (with root attached) were carefully uprooted from the soil (by flooding with water) so that the root system of the plants remained unaffected. For phenotyping analysis, five plants were randomly sampled per replication, with total 15 plants per treatment. For physiological and biochemical analysis, 3 plants were randomly sampled per replication with a total of 9 plants per treatment. For ionomic (cations and anions) analysis, 2nd fully expanded leaf of the main tiller and root samples were collected and dried. For analysis of different osmolytes, anti-oxidant enzymes and substrates, leaf and root samples were collected and snap chilled in liquid N2 and stored at -80°C till further analysis.
2.2. Growth parameters
After ten days of NaCl treatment at individual stage (group-1, -2, -3 and -4) or at the end of each combined-stage salinity stress (group-5, -6 and -7), 5 plants were selected per replication randomly (total 15 plants/ group) and data pertaining to plant height, tiller number and leaf chlorophyll, was recorded. Leaf chlorophyll content was measured using SPAD Chlorophyll Meter (SPAD-502 plus-Konica Minolta). Differential phenotype was recorded for the individual plants in the treatments, along with their respective controls, for fresh weight of root and shoot. Dry weight of root and shoot, were measured after drying the samples to a constant weight in an oven.
2.3. Determination of macro- and micro-cations
For estimation of macro-cations (Na+, K+, Ca+2 and Mg+2) and micro-cations (Fe+3, Mn+2, Zn+2 and Co+3), leaf and root samples were dried in an oven at about 65 °C for 48 h, and then samples were ground in a grinding machine to pass through a 20-mesh sieve. Ground sample (0.5 g) was added to 10 ml di-acid mixture (HNO3:HClO4: 5:1) in a 100 ml digestion vessel. After an overnight incubation, samples were completely digested at 180 °C and finally volume was made up to 50 ml with double distilled water. A Continuum Source Flame Atomic Absorption Spectrometer (CSAAS 300, Analytik Jena, Germany) was used for the determination of Na+, K+, Ca+2, Mg+2 and Fe+3 (O’Halloran et al. 1997). Since the resonant wavelength differs for every element, the elements were quantified sequentially one after the other. A calibration curve was made by plotting absorbance versus certified reference material (CRM) concentration. The concentration of the analyte in the sample was then calculated using the calibration curve as follows:
Concentration (in ppm or mg L-1) = (Absorbance of sample – y intercept)/slope of the calibration plot
Analysis of Mn+2, Co+3 and Zn+2 was done using VG PQ ExCell (Thermo Elemental, UK) Inductively Coupled Plasma Mass Spectrometer (ICP-MS) (Bolann et al. 2007). The instrument was calibrated with a series of certified reference materials (aqueous form) procured from E. Merck Germany, traceable to NIST. A plot of mass to charge ratio (e/m) versus integrated counts per second (ICPS) gave the calibration curve for the reference element, which was used for quantification of the analyte in the sample.
Concentration (in ppb or µg L-1) = (ICPS sample – y intercept)/slope of the calibration plot
2.4. Determination of anions
For extraction of Cl-, SO42-, and PO43-, leaf and root samples were dried in an oven at about 65 °C for 48 h, and then samples were ground in a grinding machine to pass through a 20-mesh sieve. 0.10g of oven-dried plant material was homogenized in porcelain mortar and pestle with deionized distilled water and then kept in water bath at 80 °C for 15 min. The samples were further sonicated for 1 hour in a sonicator (Cole Parmar). The samples were centrifuged at 7500 rpm for 10 mins and supernatants were filtered using Whatman No. 42 filter paper under suction. Ion exchange chromatography with conductometric detection in suppressed mode was used for the separation of different anions and their quantitative determination (Kalbasi and Tabatabai, 1985).
2.5. Estimation of osmolytes accumulation
Proline estimation was done in leaf and root tissues (Bates et al. 1973). In short,100mg of leaf/root sample ground in liquid Nitrogen was mixed with 1ml of aqueous sulfosalicylic acid (3%, w/v) and centrifuged at 10,000×g for 10min. This reaction was set up by mixing 1ml of this supernatant with equal volume of glacial acetic acid and ninhydrin reagent and incubated in boiling water bath for 1h. Termination of reaction was done by snap chilling. After the reaction mixtures warmed to room temperature, phase separation was carried out through vigorous mixing with 2ml toluene. The chromatophore-containing toluene was aspirated from the aqueous phase and absorbance was measured at 520 nm using toluene as blank. A standard curve of proline was generated and proline content was expressed as mg g-1FW.
For total soluble sugars estimation, 100 mg of leaf/ root tissue was homogenized with 10 ml of 80% ethanol. Sample were centrifuged at 10,000×g for 10 min and the reaction was set up by mixing 1ml of the supernatant with 3ml anthrone reagent (150mg anthrone, 100ml of 72% w/w). The reaction mixes were incubated at 100°C in boiling water bath for 15min, followed by termination of the reaction on ice. Absorbance was measured at 625 nm and soluble sugar contents were determined using glucose as standard. Total soluble sugar content was expressed as mg g-1 FW (Watanabe et al. 2000).
2.6. Quantification of malondialdehyde content
For estimation of oxidative damage and lipid peroxidation, malondialdehyde (MDA) equivalents were quantified (Dhindsa et al. 1981). Briefly, 100 mg of leaf/ root tissue was homogenized in liquid N2 and extracted in 1 ml of 0.1% trichloroacetic acid (TCA) solution. Following centrifugation at 12,000×g for 10min, 0.5ml of the supernatant was allowed to react with equal volume of thio-barbituric acid (TBA) solution. The reaction mixes were incubated in boiling water bath for 30 min and the reaction was terminated through snap chilling. Once the reaction mixture was warmed to room temperature, supernatant was collected by centrifugation at 12,000×g for 10 min at 25 °C. Absorbance of the clear supernatant was recorded at 532nm and 600nm and final concentration of MDA was expressed in μmol l-1 of MDA equivalents g-1FW.
2.7. Estimation of enzymatic antioxidants
To assay the activities of antioxidant enzymes, total protein was extracted by homogenization of leaf/root tissue in chilled extraction buffer containing 100 mM potassium phosphate buffer (pH 7.0), 0.1 mM EDTA and 1% polyvinyl pyrrolidone (w/v) and quantified. The activity of superoxide dismutase (SOD), ascorbate peroxidase (APX), catalase (CAT) and glutathione reductase (GR) were estimated from the same extract according to protocol by Negi et al. (2020).
Total SOD (EC 1.15.1.1) activity was measured by the nitro blue tetrazolium (NBT) method at 560 nm. The enzymatic activity was calculated as unit mg−1 protein. One unit of SOD was defined as the amount of sample required to inhibit the rate of reduction of NBT by 50%.
For analysis of APX (EC 1.11.1.11), the extraction buffer also contained 2 mM ascorbate. The suspension was centrifuged (4000 rpm, 30 min, 4 °C) and the supernatant was used for assay of enzymatic activity. Total APX activity was measured by monitoring the decline in absorbance at 290 nm, as ascorbate (ε = 2.8 mM−1 cm−1) was oxidized for 3 min. APX activity was expressed in unit mg−1 of proteins.
For analysis of GPX (EC 1.11.1.7) activity, the reaction mixture contained 25 mmol L-1 phosphate buffer (pH 7.0), 0.05 % guaiacol, 10 mmol L-1 H2O2 and enzyme. Activity was determined by the increase of absorbance at 470 nm due to guaiacol oxidation (ε = 26.6 mM–1cm–1).
The CAT (EC 1.11.1.6) activity was measured using assay mixture of 3 ml consisted of 0.05 ml extract, 1.5 ml phosphate buffer (100 mM buffer, pH 7.0), 0.5 ml H2O2, and 0.95 ml distilled water. A decrease in the absorbance was recorded at 240 nm due to the decomposition of H2O2 (ε = 39.4 mM–1cm–1). The CAT activity was expressed as unit mg−1 of proteins.
2.8. Estimation of non-enzymatic antioxidants
Estimation of oxidized and reduced ascorbate (DHA/ASC) and reduced glutathione (GSH) contents in leaf/root samples were done as per Pandey et al. (2021). For estimation of oxidized and reduced ascorbate (ASC) contents, liquid N2 ground root/ shoot samples (50 mg) were homogenized in 1 ml 6% trichloroacetic acid (TCA) under chilled conditions and centrifuged at 13,000 × g for 5 min at 4°C. To 200 μl of supernatant, 100 μl 75 mM phosphate buffer (pH 7.0) was added. In total ASC, 100 μl DTT (dithiothreitol; 10 mM) was added and incubated for 10 min at room temperature to reduce the pool of oxidized ASC. Then, 100 μl NEM (N-ethylmaleimide; 0.5%) was added to remove excess DTT. Along with this, 500 μl 10% TCA, 400 μl 43% orthophosphoric acid, 400 μl 4% 2,2′-bipyridyl, and 200 μl 3% FeCl3 were added to all the tubes. After incubation at 37°C for 1 h, absorbance was measured at 525 nm. The level of dehydroascorbate (DHA; oxidized ascorbic acid) was calculated by subtracting ASC values from total ASC. The level of reduced glutathione (GSH) was determined fluorometrically using o–phthaldialdehyde (OPT) as a fluorophore. In brief, 0.10g liquid N2 ground root/ shoot sample was mixed with 1ml of 0.1M phosphate EDTA buffer (pH 8.0) and 25% meta phosphoric acid and spin at 20000g for 20 minutes at 4℃. Supernatant was diluted 20-folds with phosphate buffer (pH 8.0). To final assay mixture, 0.05 ml of 0.1% O-phthalaldehyde (OPT) was added. After thorough mixing and incubation at room temperature for 15–20 min, the fluorescence intensity was monitored at 420 nm after excitation at 350 nm (20°C).
2.9. Statistical analysis
The experiments were conducted in randomized block design (RBD) with three experimental replicates. For phenotypic evaluation, data were collected from randomly selected 5 plants/ replication (15 plants/ treatment). For studying the ionomic and biochemical parameters, data were collected from 3 randomly selected plants/ replication. Since all the data readings were of different scales, fold change was calculated for statistical analysis. All fold change data was converted to Log2 scale to have a better representation. One-way analysis of variance (ANOVA) was performed with the whole dataset to confirm the variability of data and validity of results, and Duncan’s multiple range test (DMRT) was performed to determine the significant difference between treatments. Different letters in the graphs indicate significantly different values (DMRT, p ≤ 0.05). Principal component analysis (PCA) was performed with whole datasets which included 7 treatment conditions, using Origin 2016 (Origin Lab, Northampton, MA, USA), and the first two components (PC1 and PC2) explaining the maximum variance in the datasets were used to make biplots.
3. Results
3.1. Phenotypic evaluation of CSR36 and Jaya under stage-specific salinity
The differential phenotyping of rice seedlings revealed significant differences in CSR36 and Jaya under stage-specific as well as combined-stages salinity stress (Figure 2A–D). Jaya exhibited significant reduction at S-stage salinity stress as indicated by reduction to 0.50-, 0.64-, 0.85- and 0.61-fold in shoot fresh and dry biomass, plant height and tiller number, respectively, compared with those of control (Figure 3A–D; Supplementary Table 1). Among adult plant stages (T-, F- or SS-) in Jaya, F-stage showed comparatively higher sensitivity to saline conditions as shoot and root dry biomass and chlorophyll content decreased to 0.73-, 0.57- and 0.90-fold as compared with those of control (Figure 3A,B; Supplementary Table 1). Although, salt-sensitivity was comparable in CSR36 and Jaya at S- and SS-stages (Figure 3A,C), CSR36 showed relatively higher salt-tolerance phenotype at both F- and T-stages, as indicated by 1.63- and 1.12-fold increase in root dry biomass and chlorophyll content, respectively compared with those of Jaya (Figure 3C; Supplementary Table 1). In combined-stage salinity stress, extent of damage was similar in all three treatment groups viz., S+T-, S+T+F- and S+T+F+SS-stages and were non-significant both in CSR36 and Jaya. However, CSR36 exhibited lower sensitivity in all three treatments as compared with Jaya, indicating higher tolerance of CSR36 to multi-stage salinity stress (Figure 3A–D).

Table 1.
Effects of 50mM NaCl stress in rice varieties Jaya and CSR36 on fold change of macro-cations (Na+, K+, Ca+2 and Mg+2) uptake and their ratios (Na+/K+, Na+/Ca+2 and Na+/Mg+2) in root and leaf in stage-specific and combined-stage salinity stress.
Table 1.
Effects of 50mM NaCl stress in rice varieties Jaya and CSR36 on fold change of macro-cations (Na+, K+, Ca+2 and Mg+2) uptake and their ratios (Na+/K+, Na+/Ca+2 and Na+/Mg+2) in root and leaf in stage-specific and combined-stage salinity stress.
| Macro Cations | ||||
|---|---|---|---|---|
| Root | Shoot | |||
| Na+ levels | Jaya | CSR36 | Jaya | CSR36 |
| Treatments | ||||
| S | 2.16±0.131 a | 1.583±0.084 c | 3.844±0.099 a | 0.445±0.188 def |
| T | 1.829±0.124 b | 0.098±0.027 f | 0.349±0.129 fg | 0.087±0.224 ghi |
| F | 1.174±0.006 d | -0.876±0.016 h | 0.42±0.075 efg | 0.062±0.006 ghi |
| SS | 1.027±0.015 d | -1.026±0.057 h | 0.251±0.025 fgh | -0.184±0.023 i |
| S+T | 2.109±0.049 a | 0.327±0.063 e | 3.352±0.182 b | 1.812±0.231 c |
| S+T+F | 1.762±0.02 bc | 0.274±0.032 e | 0.794±0.046 de | 0.903±0.004 d |
| S+T+F+SS | 1.811±0.013 b | -0.218±0.036 g | 0.516±0.116 def | -0.117±0.112 hi |
| K+ levels | ||||
| S | -0.208±0.05 de | -0.193±0.028 cde | -0.025±0.066 de | -0.089±0.027 def |
| T | 0.045±0.051 bcd | 0.093±0.035 bc | -0.551±0.033 i | 0±0.031 cde |
| F | 0.037±0.039 bcd | 0.181±0.024 b | -0.12±0.025 efg | 0.15±0.015 bc |
| SS | -0.431±0.075 ef | -0.573±0.241 f | -0.253±0.027 gh | 0.041±0.102 cd |
| S+T | 0.095±0.054 bc | -0.151±0.106 cde | -0.543±0.037 i | -0.218±0.09 fgh |
| S+T+F | 0.257±0.056 b | 0.689±0.013 a | -0.291±0.023 h | 0.262±0.012 b |
| S+T+F+SS | 0.217±0.116 b | -0.233±0.107 de | 0.136±0.056 bc | 0.441±0.021 a |
| Ca+2 levels | ||||
| S | -0.297±0.121 d | -0.298±0.038 d | 0.768±0.032 a | 0.3±0.015 b |
| T | 0.415±0.06 a | 0.443±0.035 a | -0.15±0.052 fg | 0.252±0.017 bc |
| F | 0.308±0.045 ab | 0.451±0.043 a | -0.304±0.114 gh | 0.189±0.017 bcd |
| SS | 0.345±0.13 a | 0.531±0.059 a | -0.182±0.074 fgh | -0.063±0.061 ef |
| S+T | 0.034±0.052 c | -0.025±0.128 c | 0.121±0.04 bcde | 0.054±0.039 cde |
| S+T+F | 0.065±0.087 bc | 0.021±0.129 c | -0.34±0.076 gh | 0.019±0.048 def |
| S+T+F+SS | 0.374±0.104 a | 0.313±0.101 ab | -0.359±0.115 h | -0.158±0.068 fgh |
| Mg+2 levels | ||||
| S | -0.028±0.037 bcd | 0.15±0.036 a | 0.123±0.055 a | 0.089±0.071 ab |
| T | 0.058±0.042 ab | -0.063±0.048 bcd | -0.368±0.028 efg | -0.137±0.086 cd |
| F | 0.016±0.044 abcd | -0.041±0.026 bcd | -0.361±0.041 efg | -0.093±0.063 bcd |
| SS | 0.012±0.102 abcd | -0.029±0.035 bcd | -0.181±0.106 cde | -0.052±0.024 abc |
| S+T | 0.038±0.017 abc | -0.094±0.059 bcd | -0.383±0.043 fg | -0.261±0.065 def |
| S+T+F | -0.033±0.02 bcd | -0.09±0.079 bcd | -0.483±0.042 g | -0.204±0.082 cdef |
| S+T+F+SS | -0.116±0.054 cd | -0.133±0.025 d | -0.359±0.06 efg | -0.115±0.01 cd |
| Na+/K+ | ||||
| S | 2.368±0.15 a | 1.776±0.092 bc | 3.869±0.158 a | 0.534±0.168 de |
| T | 1.784±0.175 bc | 0.005±0.052 f | 0.9±0.11 cd | 0.087±0.252 fg |
| F | 1.137±0.04 d | -1.057±0.039 h | 0.54±0.063 de | -0.088±0.014 g |
| SS | 1.458±0.06 c | -0.453±0.184 g | 0.505±0.052 def | -0.225±0.112 gh |
| S+T | 2.014±0.103 b | 0.478±0.131 e | 3.895±0.176 a | 2.03±0.205 b |
| S+T+F | 1.505±0.061 c | -0.414±0.044 g | 1.085±0.059 c | 0.641±0.015 de |
| S+T+F+SS | 1.594±0.109 c | 0.015±0.141 f | 0.38±0.168 ef | -0.558±0.122 h |
| Na+/Ca+2 | ||||
| S | 2.457±0.04 a | 1.881±0.048 bc | 3.076±0.073 a | 0.145±0.203 ef |
| T | 1.414±0.102 e | -0.345±0.055 h | 0.499±0.083 de | -0.165±0.241 f |
| F | 0.866±0.051 f | -1.328±0.045 i | 0.724±0.186 cd | -0.127±0.022 f |
| SS | 0.683±0.117 f | -1.557±0.046 i | 0.433±0.066 de | -0.121±0.051 f |
| S+T | 2.075±0.097 bc | 0.352±0.154 g | 3.231±0.222 a | 1.758±0.197 b |
| S+T+F | 1.697±0.068 cd | 0.253±0.097 g | 1.134±0.118 c | 0.884±0.048 cd |
| S+T+F+SS | 1.437±0.112 de | -0.531±0.133 h | 0.875±0.211 cd | 0.04±0.142 ef |
| Na+/Mg+2 | ||||
| S | 2.188±0.096 a | 1.433±0.111 d | 3.721±0.153 a | 0.356±0.175 efg |
| T | 1.771±0.133 c | 0.04±0.062 g | 0.717±0.103 cde | 0.455±0.224 ef |
| F | 1.214±0.021 e | -0.836±0.011 h | 0.514±0.138 ef | 0.156±0.069 fgh |
| SS | 1.056±0.036 e | -0.997±0.069 h | 0.304±0.045 efg | -0.132±0.046 h |
| S+T | 2.071±0.056 ab | 0.289±0.073 f | 3.735±0.212 a | 2.195±0.193 b |
| S+T+F | 1.852±0.078 bc | 0.365±0.109 f | 0.999±0.119 cd | 1.108±0.078 c |
| S+T+F+SS | 1.944±0.013 bc | -0.085±0.017 g | 0.632±0.107 de | -0.002±0.104 gh |
Note; Treatment stages are mentioned as S (Seedling); T (Tillering); F (Flowering); SS (Seed setting); S+T (Seeding + Tillering); S+T+F (Seeding + Tillering + Flowering): S+T+F+SS (Seeding + Tillering + Flowering + Seed Setting). Data is presented as mean of fold change ± SE, n=3. All the data are the mean of three replicates ± SE. Different letters indicate significantly different values based on Duncan test across treatments (DMRT, p ≤ 0.05), considering the fold change in both Jaya and CSR36 together.
3.2. Enhanced antioxidative defense help CSR36 tolerate salinity stress
CSR36 exhibited positive bias for APX activity, as under F-stage salinity it was significantly increased by 1.51- and 2.13-fold in root and shoot, respectively compared with those of Jaya (Figure 4A,E). Similar trend was also seen under combined-stage salinity in CSR36. Among three tested combined-stage treatments, APX activity in roots of CSR36 was increased by 2.12- and 1.41-fold under S+T- and S+T+F-stages, respectively compared to those of control (Figure 4A), which coincided with reduced GPX activity (Figure 4B,F). On the contrary, APX and GPX activities were significantly lower and higher, respectively in Jaya at all tested combined-stage treatments (Figure 4A,B,E,F). In general, the activities of CAT (in root) and SOD (in both root and shoot) were increased in CSR36 under stage-specific salinity. The maximal increase in CAT activity was seen by 5.67-, 2.71-fold at F- and SS-stage and 6.45- and 9.58-fold at S+T+F- and S+T+F+SS-stages, respectively in CSR36 roots, compared with those of Jaya (Figure 4C). At S- and F-stages, SOD activity was increased by 1.83- and 1.43-fold in root respectively, (Figure 4D) and 2.52-fold at F-stage in shoot (Figure 4H) compared with those of Jaya.
Figure 4.
Spatial and temporal response of anti-oxidant enzymes in Jaya and CSR36. The rice seedlings were subjected to 50mM NaCl salinity stress for 10 days at S- (seedling), T- (tillering), F- (flowering), SS- (seed setting) under stage-specific and S+T- (seedling + tillering), S+T+F- (seedling + tillering + flowering), S+T+F+SS- (seedling + tillering + flowering + seed setting), under combined-stage salinity stress. After 10days of treatment, the root and shoot tissues were harvested and analyzed for ascorbate peroxidase (APX; A, E), glutathione peroxidase (GPX; B, F), catalase (CAT; C, G), and superoxide dismutase (SOD; D, H). The data represented in the form of relative change with respect to respective control and are converted to Log2. Refer supplementary Table 2 for statistics of different anti-oxidant enzyme data at different time points. Different letters indicate significantly different values across treatments (DMRT, p ≤ 0.05), considering the fold change in both Jaya and CSR36 together.
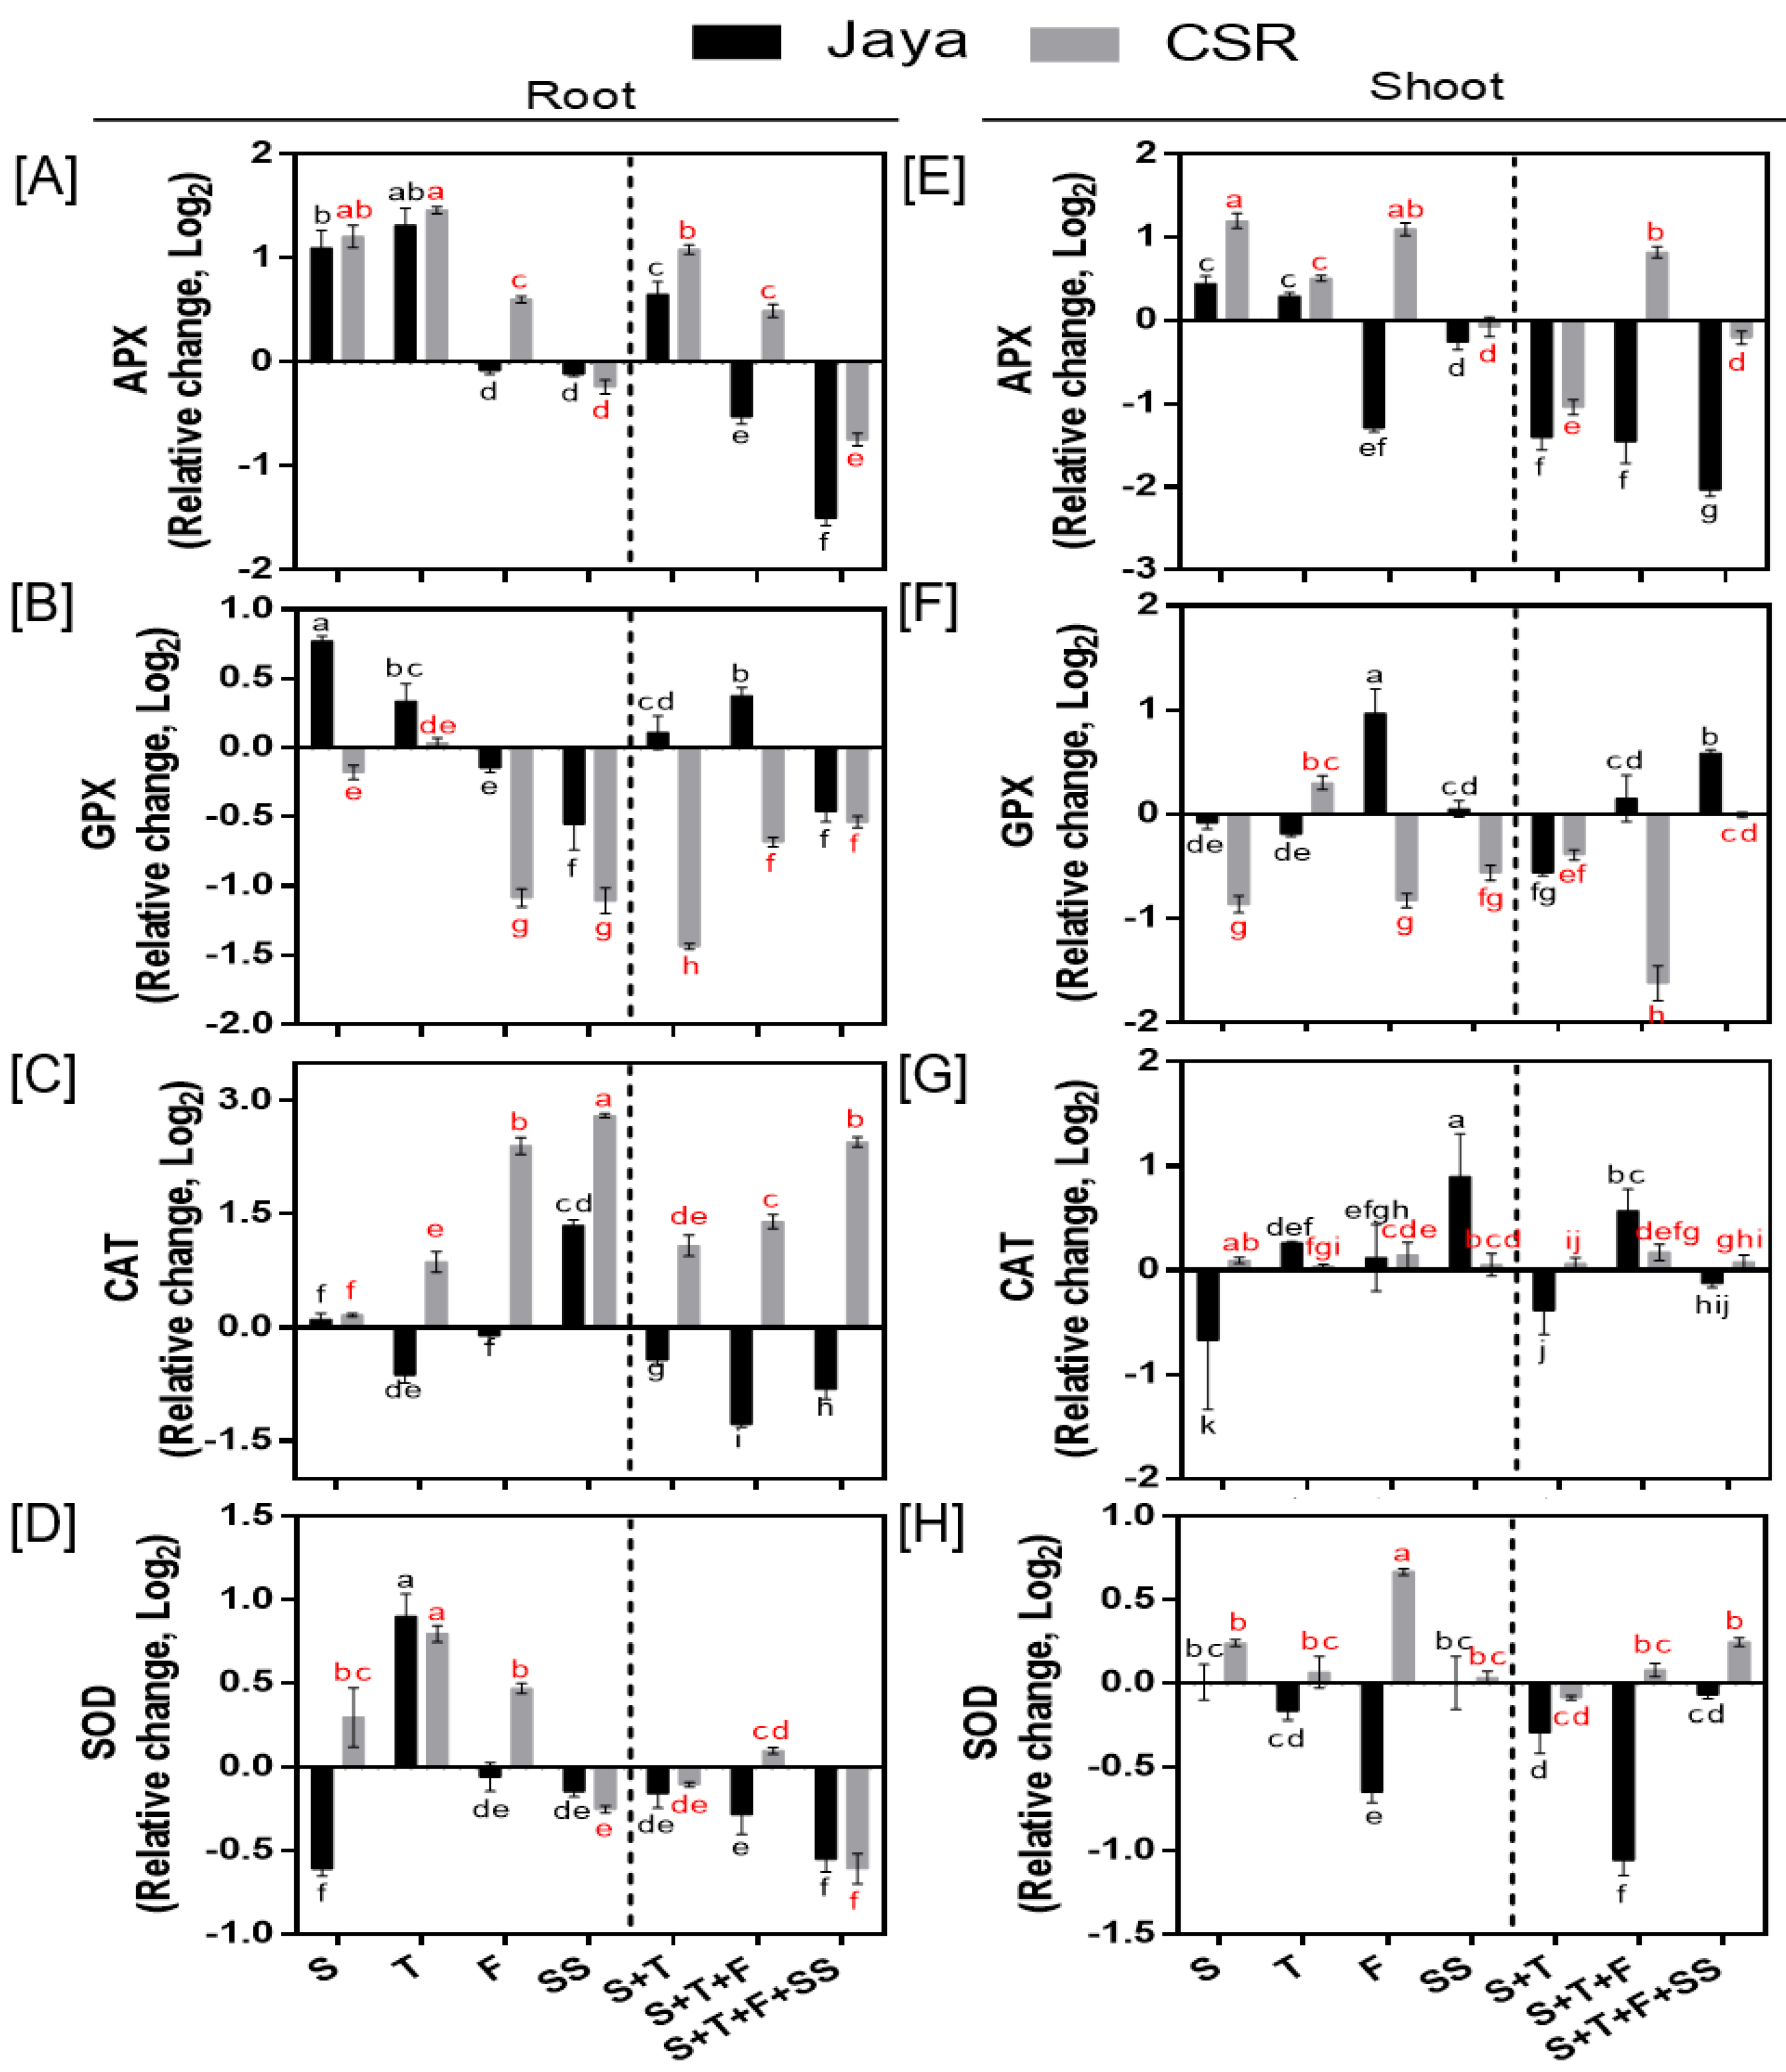
Table 2.
Effects of 50mM NaCl stress on rice varieties Jaya and CSR36 on fold change of micro-cation (Fe+3, Mn+2, Zn+2 and Co+3) uptake in root and leaf in stage-specific and combined-stage salinity stress.
Table 2.
Effects of 50mM NaCl stress on rice varieties Jaya and CSR36 on fold change of micro-cation (Fe+3, Mn+2, Zn+2 and Co+3) uptake in root and leaf in stage-specific and combined-stage salinity stress.
| Micro Cations | ||||
|---|---|---|---|---|
| Root | Shoot | |||
| Fe+3 levels | Jaya | CSR36 | Jaya | CSR36 |
| Treatments | ||||
| S | -0.759±0.405 gh | -0.439±0.079 efg | -0.16±0.074 de | -0.089±0.148 cde |
| T | 0.689±0.104 b | 1.594±0.054 a | 0.24±0.106 abc | 0.558±0.134 a |
| F | 0.616±0.172 bc | 1.366±0.094 a | 0.165±0.127 bcd | 0.322±0.095 ab |
| SS | -0.584±0.126 fgh | 0.256±0.161 bcd | -0.584±0.06 f | -0.081±0.034 cde |
| S+T | -0.123±0.042 de | 0.373±0.026 bc | 0.061±0.084 bcd | 0.382±0.126 ab |
| S+T+F | -0.25±0.057 ef | 0.218±0.008 cd | -0.083±0.064 cde | 0.165±0.044 bcd |
| S+T+F+SS | -0.95±0.15 h | -0.111±0.018 de | -0.968±0.118 g | -0.284±0.163 ef |
| Mn+2 levels | ||||
| S | -1.049±0.356 g | -0.257±0.082 de | -0.641±0.043 e | -0.087±0.062 d |
| T | 0.458±0.196 ab | 0.87±0.057 a | -0.006±0.087 cd | 1±0.095 a |
| F | -0.572±0.101 ef | 0.474±0.086 ab | -0.604±0.052 e | 0.595±0.142 b |
| SS | -0.262±0.132 ef | 0.319±0.078 bc | -0.204±0.075 d | -0.073±0.036 d |
| S+T | 0.264±0.075 bc | 0.478±0.02 ab | -0.281±0.048 d | 0.55±0.086 b |
| S+T+F | -1.103±0.063 g | 0.069±0.057 bcd | -0.964±0.12 f | 0.186±0.125 c |
| S+T+F+SS | -0.793±0.088 fg | -0.06±0.079 cd | -0.897±0.042 f | -0.227±0.078 d |
| Zn+2 levels | ||||
| S | 0.513±0.084 a | 0.129±0.031 bc | -0.142±0.137 ab | -1.449±0.317 e |
| T | -0.163±0.074 de | -0.321±0.045 defg | 0.121±0.115 a | -0.218±0.11 ab |
| F | -0.569±0.155 g | 0.277±0.089 ab | -0.667±0.08 cd | -0.138±0.073 ab |
| SS | -0.377±0.064 efg | -0.087±0.06 cd | -0.439±0.099 bc | -0.104±0.128 ab |
| S+T | -0.276±0.126 def | -0.518±0.096 fg | -0.084±0.042 ab | -0.489±0.074 bc |
| S+T+F | -0.995±0.054 h | -0.05±0.115 cd | -1.029±0.128 d | -0.354±0.032 bc |
| S+T+F+SS | -0.903±0.061 h | -0.216±0.067 de | -1.025±0.121 d | -0.305±0.144 abc |
| Co+3 levels | ||||
| S | -1.622±0.046 f | -2.21±0.102 g | -1.462±0.498 e | -2.138±0.632 e |
| T | 0.49±0.041 b | -0.062±0.061 cd | 0.239±0.08 bcd | 0.948±0.287 ab |
| F | -0.206±0.136 de | 0.902±0.089 a | -0.309±0.203 cd | 0.751±0.108 ab |
| SS | -0.159±0.034 de | 0.38±0.004 b | -0.258±0.095 cd | 0.427±0.077 abc |
| S+T | 1.032±0.011 a | 0.01±0 cd | 1.129±0.202 a | 0.95±0.244 ab |
| S+T+F | 0.122±0.13 c | 0.953±0.042 a | -0.227±0.174 cd | 0.887±0.175 ab |
| S+T+F+SS | -0.361±0.019 e | 0.119±0.025 c | -0.56±0.085 d | 0.219±0.083 bcd |
Note; Treatment stages are mentioned as S (Seedling); T (Tillering); F (Flowering); SS (Seed setting); S+T (Seeding + Tillering); S+T+F (Seeding + Tillering + Flowering): S+T+F+SS (Seeding + Tillering + Flowering + Seed Setting). Data is presented as mean of fold change ± SE, n=3. All the data are the mean of three replicates ± SE. Different letters indicate significantly different values based on Duncan test across treatments (DMRT, p ≤ 0.05), considering the fold change in both Jaya and CSR36 together.
3.3. Modulation of cellular redox state in CSR36
Under NaCl stress, a significant increase in the level of DHA/ASC ratio in both root and shoot tissues of Jaya was observed at all salinity treatment stages indicating oxidative damage (Figure 5A,C). Maximum increase in DHA/ASC ratio was observed in Jaya roots at F- and S+T+F-stages by 10.53- and 12.95-fold, respectively compared with those of controls (Figure 5A). Unlike Jaya, CSR36 maintained a lower DHA/ASC ratio under different salinity treatments in both the tissues (Figure 5A,C). Although, GSH level declined at most of the tested conditions in Jaya, the decrease was more significant at F- and SS- stages to 0.74-fold each in roots, which further decreased at S+T+F and S+T+F+SS salinity to 0.61- and 0.56-fold, in root (Figure 5B) and 0.75-fold each, respectively in shoot (Figure 5D), compared with those of respective controls. The extent of GSH reduction was relatively lower in CSR36 roots, as indicated by reduction to 0.85-fold each at F- and SS-stage and 0.83- and 0.79-fold reduction at combined-salinity stage in roots compared with those of respective controls (Figure 5B). No significant reduction was noticed in GSH level in CSR36 shoot, across any of the tested salinity treatments (Figure 5D).
3.4. Effect of salt induced toxicity on osmotic adjustment and lipid peroxidation
Proline and TSS accumulation decreased in roots of Jaya and CSR36 at all the tested salinity treatments; however, the decrease was more significant in Jaya (Figure 6A,B). In contrary, enhanced accumulation of proline and TSS were seen in CSR36 shoots, particularly, of proline, which increased by 2.30- and 1.58-fold at F-and SS-stage and 1.48-, 2.85- and 1.41-fold at S+T, S+T+F and S+T+F+SS-stages, respectively compared with those of Jaya (Figure 6A). Like roots, TSS levels were affected significantly in Jaya shoots with reduced accumulation at all treatment stages indicating poor osmotic adjustment in shoots as well (Figure 6D). MDA levels were increased by 1.37- and 2.70-fold at F- and S+T+F-stage in roots and a minimum 1.80-fold increase at all treatment stages in shoots of Jaya, compared with their respective controls (Figure 6C,F). No significant change in MDA levels was seen in CSR36, in any of the tested salinity treatments (Figure 6C,F).
3.5. Effect of salt stress on macro- and micro-cations
Under all the tested stages, the Na+ accumulation in Jaya was significantly higher than CSR36. At F-, SS- and S+T+F+SS stages, Jaya accumulated 2.25-, 2.03-, 3.50-fold Na, respectively in root; while, in case of CSR36, these changes were limited to only 0.54-, 0.49-, 0.86-fold, respectively, compared to their respective controls (Table 1, Figure S1A). Similar trend was also seen in case of shoot (Figure S1B), which was in accordance with relatively tolerant phenotypes of CSR36 than Jaya, at these salinity treatment stages (Figure 2 and Figure 3). Root K+ and Ca+2 accumulation exhibited a positive bias; however, no significant differences were observed between the roots of CSR36 and Jaya, at any of the tested salinity treatments (Figure S1A). In contrast, the shoot K+ and Ca+2 showed higher accumulation in CSR36 at all stages, in particular at F-stage with 1.19- and 1.40-fold increase compared with those of Jaya (Table 1, Figure S1B). Mg+2 levels followed a similar trend in both the varieties.
Preferential Na uptake and accumulation in Jaya root led to marked increase in Na+/K+, Na+/Ca+2 and Na+/Mg+2 ratios across all treatment conditions with highest increase by 4.58-, 4.66- and 4.14-fold respectively compared with those of CSR36 at F-stage (Table 1, Figure S2A). CSR36 roots exhibited significantly lower cationic ratios at all treatment stages, except S-stage, at which higher Na+/K+ (1.77-fold), Na+/Ca+2 (1.88-fold) and Na+/Mg+2 (1.43-fold) ratios were observed, compared with those of control (Table 1). Like root tissues, Jaya exhibited preferential transport of Na+ over K+ and Ca+2 leading to significantly higher Na+/K+ and Na+/Ca+2 ratios in shoot at all treatment stages (Table 1). Although, CSR36 had comparable ratios like control across all the stages; however, significant reduction in leaf Na+/K+ and Na+/Ca+2 ratio was observed at S+T-stage by 3.62- and 2.79-fold and at S+T+F+SS-stage by 1.98- and 1.81-fold, respectively compared with those of Jaya (Table 1, Figure S2B).
The accumulation of Fe+3, Mn+2, Zn+2 and Co+3 in roots and shoots were negatively impacted across different stage-specific salinity treatments in Jaya making it susceptible to NaCl induced salt toxicity (Table 2, Figure S3A,B). Except for S-stage salinity, Fe+3, Mn+2 and Co+3 accumulation in roots and shoots of CSR36 were significantly higher at all other treatment stages as compared with Jaya (Table 2). Zn+2 accumulation was poor in both the varieties under different salinity treatments, however, at F-stage Zn+2 accumulation showed significant increase by 1.78- (roots) and 1.44- (shoots) fold in CSR36 compared with those of Jaya (Table 2, Figure S3A,B).
3.6. Effect of salt stress on anions
The accumulation of Cl- and SO42- was significantly lower in CSR36 roots and shoots at most of the treatment stages (Figure S4A,B). In general, Cl- toxicity was more severe in roots than in shoots and combined-stage salinity treatments were found to be more sensitive particularly in Jaya. CSR36 exhibited reduced Cl- accumulation at F- and T-stage by 2.66- and 2.50-fold, respectively in roots alongside, 1.28-fold lower Cl- accumulation at F-stage in leaves, compared with those of Jaya (Figure S4A,B). At S-stage, 3.99- and 1.73-fold higher Cl- accumulation was observed in CSR36 and Jaya root, respectively (Figure S4A). No significant change in shoot Cl- content was seen in CSR36 leaves (Figure S4B). At combined-stage salinity stress specially at S+T+F+SS and S+T, Cl- accumulation was reduced by 4.80- and 2.06-fold in CSR36 roots, respectively compared with those of Jaya (Figure S4A) which further dissipated in leaves at respective stages (Figure S4B). PO43- accumulation did not exhibit any clear trend; however, it was found to be reduced across all the tested treatment conditions (Figure S4A,B).
3.7. Understanding treatment-variable interactions through PCA based clustering
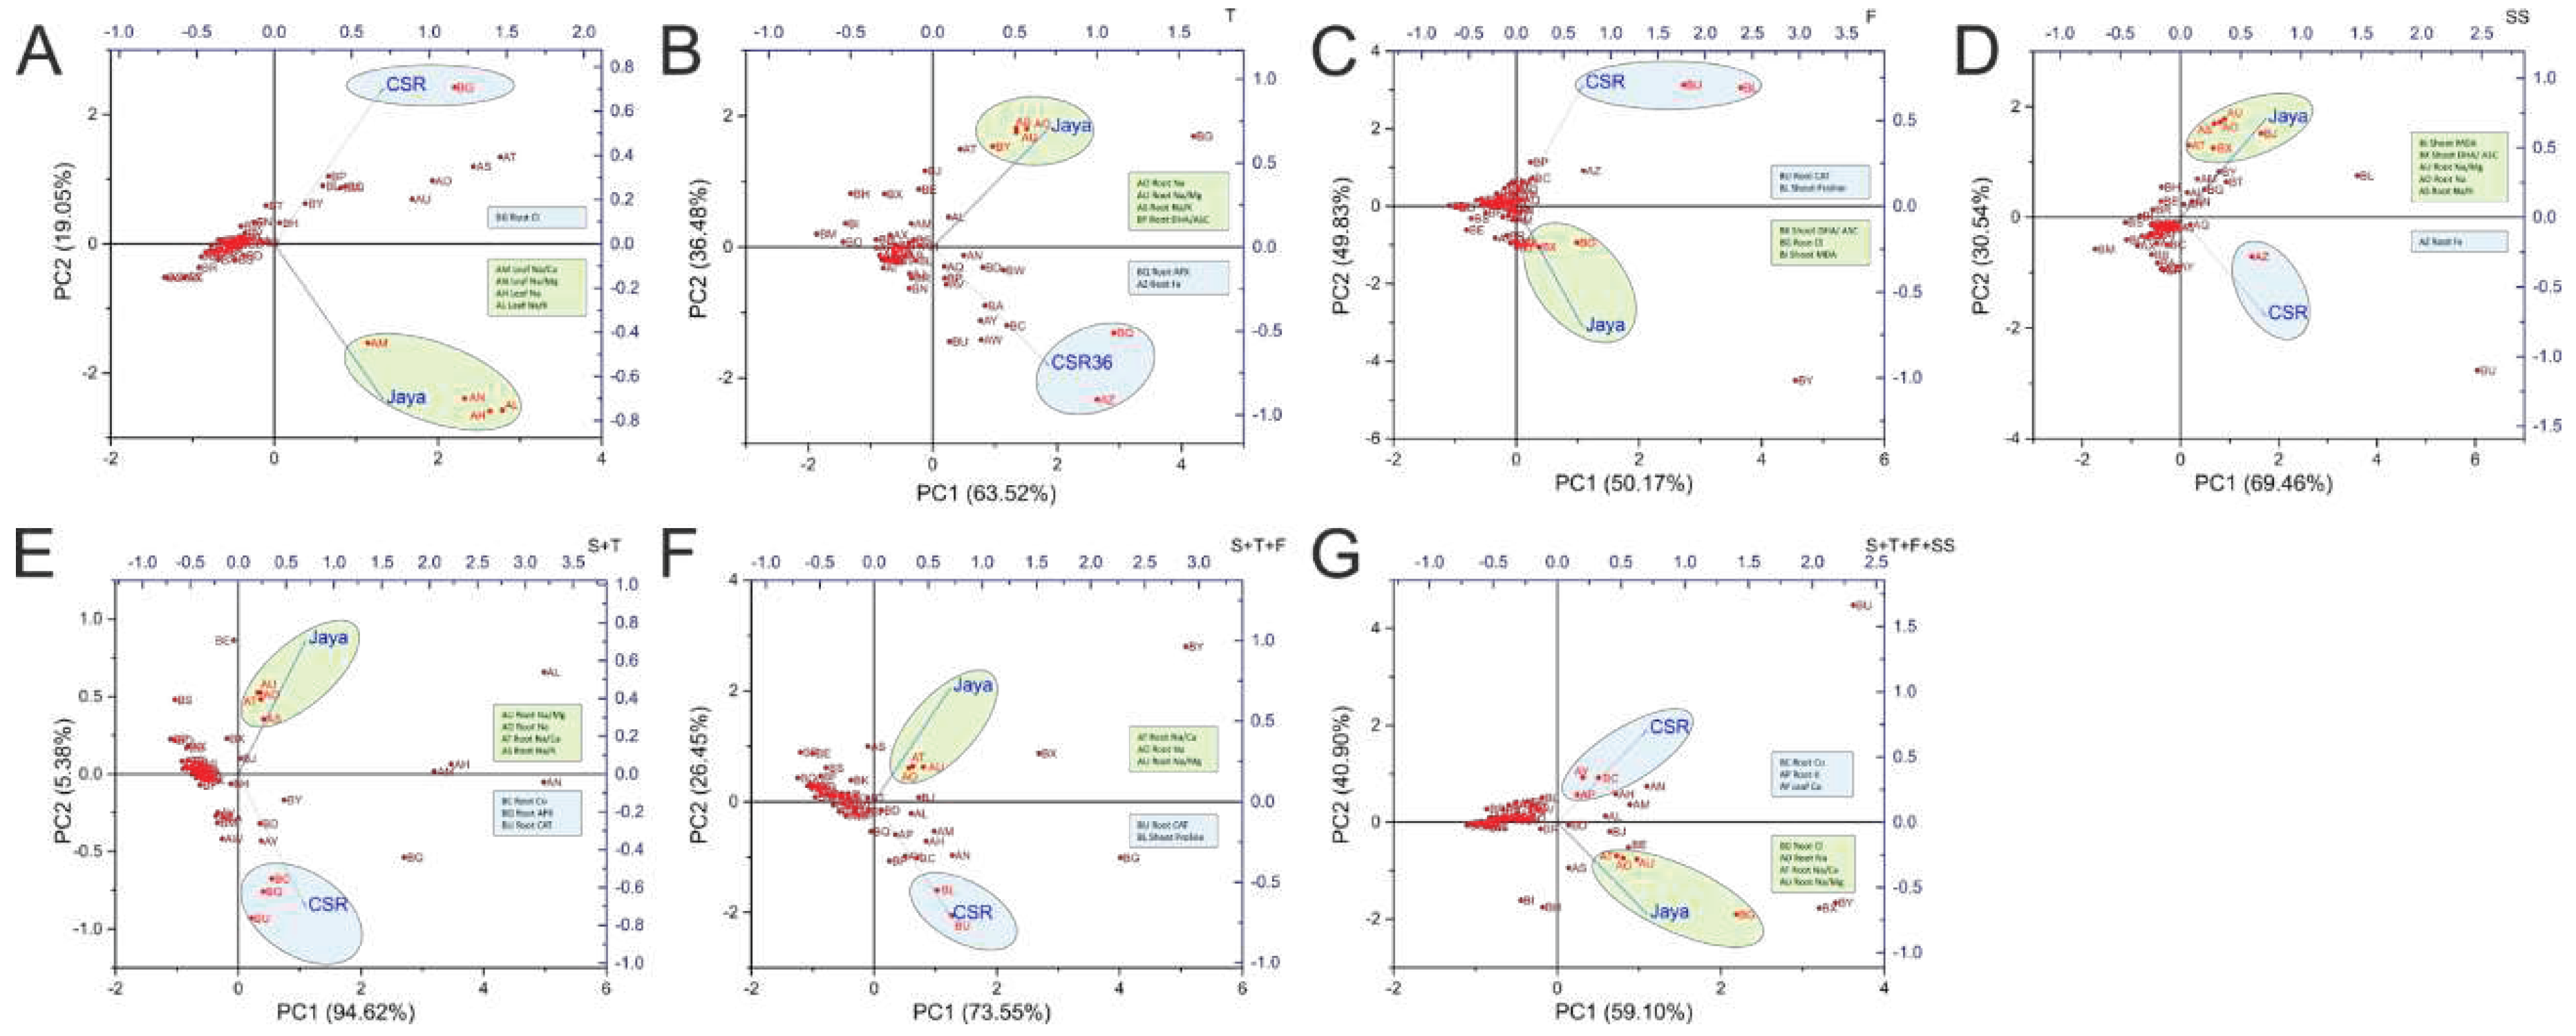
Principal Component Analysis (PCA) allowed easy visualization of complex data by treatment-variable association in a stage-specific manner. Contrasting phenotypes were observed between Jaya and CSR36 at different stages which was best described by PC1 with contributions ranging from 94.62% (S+T-stage) to 50.17% (F-stage). Higher root Na+ and associated cationic ratios such as Na+/Ca+2, Na+/Mg+2 and Na+/K+ were identified as major contributors associated with salt-sensitive nature of Jaya, at most of the treatment stages (Figure 7B–G), except at S-stage, wherein Na+ accumulation in shoots was identified as a major driver for sensitive phenotype (Figure 7A). The reduced salt-toxicity in CSR36 was attributable to efficient management of the redox status by different antioxidant enzymes (T-, F-, S+T-, S+T+F-stages; Figure 7B,C,E,F), maintenance of osmotic balance prominently by proline accumulation (F- and S+T+F-stages; Figure 7C,F) and micro-cation balance with high root Fe (T- and SS-stage; Figure 7B,D) and high root Co (S+T- and S+T+F+SS-stages; Figure 7E,G).
4. Discussion
4.1. NaCl-induced toxicity is developmental stage-specific
Salinity tolerance at seedling stage does not correlate with tolerance at reproductive stages in rice (Ferdose et al. 2009); hence, proper phenotypic analysis at different stages is necessary to achieve higher yield under salt stress. Sensitivity to salt stress was higher at seedling stage as indicated by significant reduction in shoot and root dry biomass (Figure 2 and Figure 3A,B) in both the tested varieties. The poorly developed root and shoot (2-3 leaf stage) system at seedling stage might cause higher degree of osmotic and ionic stress, resulting in water deficit and reduced shoot and root biomass (Radanielson et al. 2018). However, adult plant tolerance is different from seedling stage and is regulated by an independent set of genes (Mohammadi et al. 2014). Based on stage-specific phenotyping data, salt sensitivity in Jaya at different stages was ranked as S>F>T>SS. In contrast, CSR36 exhibited tolerance at all three adult plant stages sequentially as SS≥F>T stage. Combined-stages salinity stress did not exhibit any significant differences in the toxicity induced in CSR36, which confirms the importance of early vegetative and tillering stage in determining the plants’ overall phenotype, till maturity, under salt stress (Figure 3A–D). Hence, CSR36 can be used as a donor for tolerance at adult plant- and combined-stage salinity stress. Root indices appeared to be a better selection parameter for salt tolerance which operates through maintenance of better shoot growth possibly through dilution of salt or salt exclusion by roots, limiting Na+ ion accumulation in the shoots resulting more vigorous shoot growth (Nounjan and Theerakulpisut, 2021).
4.2. Antioxidant defense and osmotic adjustment reduced NaCl-induced toxicity
Salinity stress induces excessive production of ROS including H2O2 and O2.- owing to ionic imbalance and oxidative stresses. Although plants possess an efficient antioxidative defense; however, the lack of coordination results in increased ROS levels and oxidative damage (Farooq et al. 2019). SOD constitutes the first line of enzymatic defense under salt induced oxidative stress (Liu et al. 2021), as superoxide molecule is produced primarily under any kind of stress which converts superoxide molecules to hydrogen peroxides. Further, APX and CAT enzymes are involved in catabolizing hydrogen peroxides into H2O and O2 in plants. Higher activities of SOD, CAT and APX strengthen antioxidant potential at combined-stage salinity in CSR36, which coincides with earlier observation wherein increased SOD, APX and CAT activities have been shown to contribute to enhanced salt tolerance (Nefissi Ouertani et al. 2022; Chung et al. 2020). PCA analysis validated CAT and APX activities in root as the major drivers for salt tolerance in CSR36 (Figure 7C,E,F). GPX activity was relatively lower in tolerant cultivar CSR36 as opposed to CAT and APX. GPX is reported to be localized in various subcellular compartments like cell wall, cytosol, vacuole and extracellular spaces and actively participates in various developmental processes, wound healing, cell wall biosynthesis, ethylene signalling etc. GPX was also reported as an intrinsic defense mechanism to counter oxidative damage in rice plants and correlated with increased release of peroxidises localized in the cell walls (Zandi and Schnug, 2022). Decreased activity of the GPX in CSR36 may be due to a tradeoff with inherent potential of antioxidant defense pool associated with active involvement of CAT and APX to check the peroxides leading to lower lipid peroxidation resulting low MDA levels and better redox management under salt stress. The results are in coherence with earlier reports where GPX activity was found to be unchanged/ decreased in tolerant cultivars under salt stress (Mika and Luthje, 2003; de Azevedo Neto et al. 2006). In addition, the non-enzymatic antioxidant substrates (ASC/DHA and GSH) play important roles in supporting antioxidant defense machinery and maintenance of redox balance in plants (Tabassum et al. 2021). Interestingly, CSR36 maintained higher levels of ASC and GSH as compared with Jaya at most of the developmental stages indicating better redox management (Figure 5A–D). This might have also resulted in lowering the levels of MDA (Figure 6C,F), indicating low oxidative damage. Similar observations were recorded at the reproductive stage in rice (Razzaque et al. 2017) and at seedling stage in maize (AbdElgawad et al. 2016). Cellular osmotic management is utmost important to maintain water balance under different abiotic stresses including salt stress. Higher accumulation of proline and TSS at F- stage and combined-stage salinity was observed in CSR36, which contribute to the alleviation of salt-induced osmotic disturbances. Under hyper-osmotic conditions (e.g., salinity and drought stress), root growth and root-water confluence area are significantly limited thus limiting the water uptake and resulting in sensitivity under salinity stress (Ma et al. 2020). Thus, higher root biomass in CSR36 under salinity at different stages (Figure 3B) could be seen as the manifestation of simultaneous management of osmotic and oxidative stress.
4.3. Ionic homeostasis contributes to salt tolerance in CSR36
Ionic homeostasis is an important strategy, adapted by most of the plants to mitigate salt induced toxicity (Amin et al. 2021). Among different complexities of stress tolerance mechanisms, maintaining an optimal cytosolic Na+/K+, Na+/Mg+2 and Na+/Ca+2 ratio is considered to be the most critical (Chakraborty et al. 2020). Although both the tested genotypes exhibited sensitivity at early seedling stage owing to high Na+ accumulation and thereby resulting toxic levels of Na+/K+, Na+/Mg+2 and Na+/Ca+2 in roots and shoot tissues, CSR36 still maintained relatively higher biomass and tiller number as compared with Jaya (Table 1, Figure S2A,B). In the adult-plant stage, CSR36 either maintained a comparable or lower level of Na+ under combined-stages of salinity as compared to control, resulting into better ionic homeostasis (Supplementary Figure S1, 2A). The inherent Na-tolerance in CSR36 might be associated with efficient Na+ exclusion in roots, however, it demands future investigation. In contrast, shoot accumulated relatively low K+ with higher accumulation Na+ in Jaya as compared with CSR36 which resulted in higher Na+/K+ ratio at all stages (Table 1, Figure S1 and 2B). Higher transport of K+ and Ca+2 over Na+ in CSR36 even with constant K+ and Ca+2 uptake in both the varieties suggested ionic-discrimination as key strategy operating in CSR36 (Table 1,Supplementary Figure 1A,B). In addition to restricted Na+ uptake, CSR36 was also able to minimize the upward movement of Na+ from root to mesophyll tissues. This might be due to superior xylem unloading and/or vacuolar sequestration. Na+-induced chlorosis was also lower in CSR36 at later stages of salinity, indicating better tissue tolerance for Na+ that helps to maintain integrity of the chlorophyll pigment system (Ali et al. 2021). Thus, salt tolerance of CSR36 at adult plant stages and combined-stages was explained on the basis of efficient Na+-exclusion and better ionic discrimination in transporting K+ and Na+ from root to shoot.
4.4. NaCl-induced disequilibrium in micro-cations and anions
The concentration and solubility of micro-nutrients usually changes under saline conditions but it may or may not affect the uptake by plants (Muszyńska and Labudda, 2019). However, the effect of salinity on uptake of micro-nutrients and distribution in roots and shoots are poorly understood. In the present experiment, Fe+3 and Mn+2 content increased significantly in adult plant salinity and remained unaffected during combined-stages in root and shoot tissues of CSR36; however, the translocation of Fe+3 in the shoots was relatively low as compared with Mn+2 which suggest ion selectivity under salt stress in tolerant plants (Table 2, Figure 3A,B). High salinity caused by saline and alkaline stress reduces the solubility of Fe+3 in solution, leading to chlorosis which was visible in Jaya under salt stress (Figure S3B) (Li et al. 2016). Compared to Fe+3 and Mn+2, Zn+2 uptake was significantly reduced in Jaya root and shoot tissues but CSR36 exhibited no significant change in Zn+2 uptake and better translocation in shoots as compared with Jaya, indicating ion selectivity (Table 2, Figure S3A,B.). Low accumulation of Zn+2 under salt stress could be attributed to decreased expression of Zn-transporters involved in zinc uptake (Zhao and Eide, 1996; Wang et al. 2010), zinc translocation (Kavitha et al. 2015) and vacuolar sequestration (Cai et al. 2019), as shown previously. Additionally, active extrusion of essential transition metals was also reported, which imposed salt sensitivity in plants (Frans, 2006). Among all the tested micro cations, Co3+ have been found to be a critical component imparting tolerance to salinity in CSR36 with enhanced uptake both in root and shoot particularly at F-stage and combined-stage salinity stress which was further supported by PCA (Table 2, Figures 7C and S3A,B.). Co3+ is known to regulate plant-water homeostasis (Akeel and Jahan, 2020), hence its higher accumulation in CSR36 could provide the survival benefit under salt stress conditions.
Like cations, anions (Cl-, SO42- and PO43-) can also cause ionic imbalance of essential elements including N, P and S leading to enhanced damage to plants (Kamran et al. 2019). High Cl- uptake and transport to shoots was observed in Jaya resulting in a sensitive phenotype both in stage-specific and combined-stage salinity stress. Barring S- and S+T-stage, CSR36 exhibited significantly low Cl- accumulation in roots and transport low Cl- and high PO43- to the shoots at critical growth stages as compared with Jaya indicating ion selectivity and discrimination (Figure S4A,B). The low shoot Cl- concentration is maintained by restricting xylem-driven root to shoot transport (i) by higher Cl- efflux from the root to soil solution or (ii) by reducing the xylem loading as evident in CSR36. Cl- act as a non-specific osmotic agent and hence is accumulated in higher concentrations over PO43- or SO42- (Franco-Navarro et al. 2016). However, later being assimilated in plant metabolism results in reduced internal concentration in roots and shoots as seen in the case of CSR36 under salt stress. Thus, CSR36 maintained lower levels of Na+ and Cl-, without jeopardizing Fe+3, Mn+2 and Co+3 in root and shoots, indicating its ability to maintain ionic homeostasis between essential and non-essential ions.
5. Conclusion
Taken together, the present study highlighted that salinity tolerance manifests in growth stage-specific manner and tolerance at one stage is controlled independently of tolerance at other stages. Seedling stage was found to be the most sensitive stage for salinity followed by flowering stage; however, phenotypic data suggested no significant changes in case of combined-stage salinity stress. CSR36 exhibited higher tolerance at adult plant stage (SS≥F>T) and combined-stage salinity stress. To the best of our knowledge, this is the first report on the effect of stage-specific salinity stress in rice, which is generally experienced in coastal areas. The greater tolerance of the CSR36 was also supported by higher anti-oxidative potential, improved osmotic adjustment and better homeostasis between essential Vs. non-essential nutrients. Understanding and managing these interrelated processes are crucial for developing strategies to enhance salt tolerance in plants. Additionally, the findings highlight the significance of stage-specific salinity response, which needs to be considered while designing future rice improvement program for enhanced salt tolerance.
Supplementary Materials
The following supporting information can be downloaded at the website of this paper posted on Preprints.org.
Acknowledgments
We thank Central Soil Salinity Research Institute (CSSRI), Karnal (India) for providing CSR36 seeds and guiding salinity related pot experiments.
Data Availability Statement
The datasets presented in this study can be found in the article/Supplementary Material.
Conflicts of Interest
The authors declare that the research was conducted in the absence of any commercial or financial relationships that could be construed as a potential conflict of interest.
References
- Abdel-Fattah, G.M., Asrar, A.-W.A. (2012). Arbuscular mycorrhizal fungal application to improve growth and tolerance of wheat (Triticum aestivum L.) plants grown in saline soil. Acta Physiologiae Plantarum 34, 267–277. [CrossRef]
- AbdElgawad, H., Zinta, G., Hegab, M.M., Pandey, R., Asard, H., Abuelsoud, W. (2016). High salinity induces different oxidative stress and antioxidant responses in maize seedlings organs. Frontiers in plant science, 7, 276. [CrossRef]
- Akeel, A., Jahan, A. (2020). Role of cobalt in plants: its stress and alleviation, in: Contaminants in Agriculture. Springer, pp. 339–357. [CrossRef]
- Ali, A., Raddatz, N., Pardo, J. M., Yun, D. J. (2021). HKT sodium and potassium transporters in Arabidopsis thaliana and related halophyte species. Physiologia plantarum, 171(4), 546–558. [CrossRef]
- Amin, I., Rasool, S., Mir, M.A., Wani, W., Masoodi, K.Z., Ahmad, P. (2021). Ion homeostasis for salinity tolerance in plants: a molecular approach. Physiologia Plantarum, 171, 578–594. [CrossRef]
- Assaha, D. V., Ueda, A., Saneoka, H., Al-Yahyai, R., Yaish, M. W. (2017). The role of Na+ and K+ transporters in salt stress adaptation in glycophytes. Front Physiol. 18(8), 509. [CrossRef]
- Bates, L.S., Waldren, R.P., Teare, I. (1973). Rapid determination of free proline for water-stress studies. Plant and soil, 39, 205–207. [CrossRef]
- Bolann, B., Rahil-Khazen, R., Henriksen, H., Isrenn, R., Ulvik, R. (2007). Evaluation of methods for trace-element determination with emphasis on their usability in the clinical routine laboratory. Scandinavian journal of clinical and laboratory investigation, 67, 353–366. [CrossRef]
- Cai, H., Huang, S., Che, J., Yamaji, N., Ma, J. F. (2019). The tonoplast-localized transporter OsHMA3 plays an important role in maintaining Zn homeostasis in rice. J Exp Bot. 70(10), 2717–2725. [CrossRef]
- Chakraborty, K., Mondal, S., Ray, S., Samal, P., Pradhan, B., Chattopadhyay, K., Kar, M.K., Swain, P., Sarkar, R.K. (2020). Tissue tolerance coupled with ionic discrimination can potentially minimize the energy cost of salinity tolerance in rice. Frontiers in plant science, 11, 265. [CrossRef]
- Chung, Y.S., Kim, K.-S., Hamayun, M., Kim, Y. (2020). Silicon confers soybean resistance to salinity stress through regulation of reactive oxygen and reactive nitrogen species. Frontiers in plant science, 10, 1725. [CrossRef]
- de Azevedo Neto, A. D., Prisco, J. T., Enéas-Filho, J., de Abreu, C. E. B., Gomes-Filho, E. (2006). Effect of salt stress on antioxidative enzymes and lipid peroxidation in leaves and roots of salt-tolerant and salt-sensitive maize genotypes. Environmental and Experimental Botany, 56(1), 87-94. [CrossRef]
- Dey, G., Banerjee, P., Sharma, R. K., Maity, J. P., Etesami, H., Shaw, A.K., Huang, Y. H., Huang, H. B., Chen, C. Y. (2021). Management of phosphorus in salinity-stressed agriculture for sustainable crop production by salt-tolerant phosphate-solubilizing bacteria—A review. Agronomy, 11, 1552. [CrossRef]
- Dhindsa, R.S., Plumb-Dhindsa, P., Thorpe, T.A. (1981). Leaf senescence: correlated with increased levels of membrane permeability and lipid peroxidation, and decreased levels of superoxide dismutase and catalase. Journal of Experimental botany, 32, 93–101. [CrossRef]
- El Mahi, H., Pérez-Hormaeche, J., De Luca, A., Villalta, I., Espartero, J., Gámez-Arjona, F., Fernández, J.L., Bundó, M., Mendoza, I., Mieulet, D. (2019). A critical role of sodium flux via the plasma membrane Na+/H+ exchanger SOS1 in the salt tolerance of rice. Plant Physiology, 180, 1046–1065. [CrossRef]
- Farooq, M.A., Niazi, A.K., Akhtar, J., Farooq, M., Souri, Z., Karimi, N., Rengel, Z. (2019). Acquiring control: The evolution of ROS-Induced oxidative stress and redox signaling pathways in plant stress responses. Plant Physiology and Biochemistry, 141, 353–369. [CrossRef]
- Ferdose, J., Kawasaki, M., Taniguchi, M., Miyake, H. (2009). Differential sensitivity of rice cultivars to salinity and its relation to ion accumulation and root tip structure. Plant Production Science, 12, 453–461. [CrossRef]
- Franco-Navarro, J.D., Brumós, J., Rosales, M.A., Cubero-Font, P., Talón, M., Colmenero-Flores, J.M. (2016). Chloride regulates leaf cell size and water relations in tobacco plants. Journal of Experimental Botany, 67, 873–891. [CrossRef]
- Frans, J. M. M. (2006). The role of monovalent cation transporters in plant responses to salinity, Journal of Experimental Botany, 57(5), 1137–1147. [CrossRef]
- Hassani, A., Azapagic, A., Shokri, N. (2020). Predicting long-term dynamics of soil salinity and sodicity on a global scale. Proceedings of the National Academy of Sciences, 117, 33017–33027. [CrossRef]
- Hoang, T.M.L., Tran, T.N., Nguyen, T.K.T., Williams, B., Wurm, P., Bellairs, S., Mundree, S. (2016). Improvement of salinity stress tolerance in rice: challenges and opportunities. Agronomy, 6, 54. [CrossRef]
- Kaiwen, G., Zisong, X., Yuze, H., Qi, S., Yue, W., Yanhui, C., Jiechen, W., Wei, L., Huihui, Z. (2020). Effects of salt concentration, pH, and their interaction on plant growth, nutrient uptake, and photochemistry of alfalfa (Medicago sativa) leaves. Plant signaling & behavior, 15(12), 1832373. [CrossRef]
- Kalbasi, M., Tabatabai, M.A. (1985). Simultaneous determination of nitrate, chloride, sulfate, and phosphate in plant materials by ion chromatography. Communications in soil science and plant analysis, 16, 787–800. [CrossRef]
- Kamran, M., Parveen, A., Ahmar, S., Malik, Z., Hussain, S., Chattha, M.S., Saleem, M.H., Adil, M., Heidari, P., Chen, J.-T. (2019). An overview of hazardous impacts of soil salinity in crops, tolerance mechanisms, and amelioration through selenium Supplementation. International journal of molecular sciences, 21, 148. [CrossRef]
- Kavitha, P. G., Kuruvilla, S., Mathew, M. K. (2015). Functional characterization of a transition metal ion transporter, OsZIP6 from rice (Oryza sativa L.). Plant Physiol Biochem. 97, 165–174. [CrossRef]
- Krishnamurthy, S., Sharma, P., Sharma, D., Ravikiran, K., Singh, Y., Mishra, V., Burman, D., Maji, B., Mandal, S., Sarangi, S., et al. (2017). Identification of mega-environments and rice genotypes for general and specific adaptation to saline and alkaline stresses in India. Scientific reports, 7, 1–14. [CrossRef]
- Kumar, S., Kumar, S., Mohapatra, T. (2021). Interaction Between Macro- and Micro-Nutrients in Plants. Frontiers in plant science, 12, 665583. [CrossRef]
- Kurotani, K., Yamanaka, K., Toda, Y., Ogawa, D., Tanaka, M., Kozawa, H., Nakamura, H., Hakata, M., Ichikawa, H., Hattori, T. (2015). Stress tolerance profiling of a collection of extant salt-tolerant rice varieties and transgenic plants overexpressing abiotic stress tolerance genes. Plant and cell physiology, 56, 1867–1876. [CrossRef]
- Li, Q., Yang, A., Zhang, W. H. (2016). Efficient acquisition of iron confers greater tolerance to saline-alkaline stress in rice (Oryza sativa L.). Journal of experimental botany, 67(22), 6431–6444. [CrossRef]
- Liu, J., Xu, L., Shang, J., Hu, X., Yu, H., Wu, H., Lv, W., Zhao, Y. (2021). Genome-wide analysis of the maize superoxide dismutase (SOD) gene family reveals important roles in drought and salt responses. Genetics and molecular biology, 44(3). [CrossRef]
- Ma, Y., Dias, M.C., Freitas, H. (2020). Drought and salinity stress responses and microbe-induced tolerance in plants. Frontiers in Plant Science, 11: 591911. [CrossRef]
- Malakar, P., Chattopadhyay, D. (2021). Adaptation of plants to salt stress: the role of the ion transporters. J. Plant Biochem. Biotechnol. 30, 668–683. [CrossRef]
- Mika, A. and Luthje, S. (2003). Properties of guaiacol peroxidase activities isolated from corn root plasma membranes. Plant Physiol. 132, 1489–1498. [CrossRef]
- Mohammadi, R., Mendioro M. S., Diaz, G. Q., Gregorio, G. B., Singh, R. K. (2014). Genetic analysis of salt tolerance at seedling and reproductive stages in rice (Oryza sativa). Plant Breeding, 133(5), 548-559. [CrossRef]
- Munns, R., James, R.A., Läuchli, A. (2006). Approaches to increasing the salt tolerance of wheat and other cereals. Journal of experimental botany, 57, 1025–1043. [CrossRef]
- Muszyńska, E., Labudda, M. (2019). Dual role of metallic trace elements in stress biology—From negative to beneficial impact on plants. International journal of molecular sciences, 20, 3117. [CrossRef]
- Nefissi Ouertani, R., Abid, G., Ben Chikha, M., Boudaya, O., Mejri, S., Karmous, C., Ghorbel, A. (2022). Physiological and biochemical analysis of barley (Hordeum vulgare) genotypes with contrasting salt tolerance. Acta Physiologiae Plantarum, 44, 1–16. [CrossRef]
- Negi, P., Pandey, M., Dorn, K. M., Nikam, A. A., Devarumath, R. M., Srivastava, A. K., Suprasanna, P. (2020). Transcriptional reprogramming and enhanced photosynthesis drive inducible salt tolerance in sugarcane mutant line M4209. Journal of Experimental Botany, 71, 6159–6173. [CrossRef]
- Nounjan, N., Theerakulpisut, P. (2021). Physiological evaluation for salt tolerance in green and purple leaf color rice cultivars at seedling stage. Physiology and Molecular Biology of Plants, 27, 2819–2832. [CrossRef]
- O’Halloran, J., Walsh, A. R., Fitzpatrick, P. J. (1997). The determination of trace elements in biological and environmental samples using atomic absorption spectroscopy, in: Bioremediation Protocols, Springer. 2, 201–211. [CrossRef]
- Pandey, M., Paladi, R. K., Srivastava, A. K., Suprasanna, P. (2021). Thiourea and hydrogen peroxide priming improved K+ retention and source-sink relationship for mitigating salt stress in rice. Scientific reports, 11, 1–15. [CrossRef]
- Radanielson, A. M., Angeles, O., Li, T., Ismail, A. M., Gaydon, D. S. (2018). Describing the physiological responses of different rice genotypes to salt stress using sigmoid and piecewise linear functions. Field Crops Research, 220, 46–56. [CrossRef]
- Razzaque, S., Haque, T., Elias, S. M., Rahman, M., Biswas, S., Schwartz, S., Ismail, A. M., Walia, H., Juenger, T. E., Seraj, Z. I., et al. (2017). Reproductive stage physiological and transcriptional responses to salinity stress in reciprocal populations derived from tolerant (Horkuch) and susceptible (IR29) rice. Scientific Reports, 7, 1–16. [CrossRef]
- Shah, Z.H., Rehman, H.M., Akhtar, T., Daur, I., Nawaz, M. A., Ahmad, M. Q., Rana, I. A., Atif, R. M., Yang, S. H., Chung, G. (2017) Redox and Ionic Homeostasis Regulations against Oxidative, Salinity and Drought Stress in Wheat (A Systems Biology Approach). Front. Genet. 8, 141. [CrossRef]
- Singh, G. (2018). Climate change and sustainable management of salinity in agriculture. Res Med Eng Sci. 6, 1–7. [CrossRef]
- Sofy, A. R., Dawoud, R. A., Sofy, M. R., Mohamed, H. I., Hmed, A. A., El-Dougdoug, N. K. (2020). Improving regulation of enzymatic and non-enzymatic antioxidants and stress-related gene stimulation in Cucumber mosaic cucumovirus-infected cucumber plants treated with glycine betaine, chitosan and combination. Molecules, 25, 2341. [CrossRef]
- Srivastava, A. K., Srivastava, S., Mishra, S., D'Souza, S. F, Suprasanna, P. (2014). Identification of redox-regulated components of arsenate (AsV) tolerance through thiourea Supplementation in rice. Metallomics, 6(9), 1718–1730. [CrossRef]
- Tabassum, R., Tahjib-Ul-Arif, M., Hasanuzzaman, M., Sohag, A. A. M., Islam, M. S., Shafi, S. S. H., Islam, M. M., Hassan, L. (2021). Screening salt-tolerant rice at the seedling and reproductive stages: An effective and reliable approach. Environmental and Experimental Botany, 192, 104629. [CrossRef]
- Wang, M., Xu, Q., Yu, J., Yuan, M. (2010). The putative Arabidopsis zinc transporter ZTP29 is involved in the response to salt stress. Plant Mol Biol. 73, 467–479. [CrossRef]
- Watanabe, S., Kojima, K., Ide, Y., Sasaki, S., 2000. Effects of saline and osmotic stress on proline and sugar accumulation in Populus euphratica in vitro. Plant Cell, Tissue and Organ Culture, 63, 199–206. [CrossRef]
- Xiao, F. Zhou, H. (2023). Plant salt response: Perception, signaling, and tolerance. Front. Plant Sci. 13:1053699. [CrossRef]
- Zandi, P., Schnug, E. (2022). Reactive Oxygen Species, Antioxidant Responses and Implications from a Microbial Modulation Perspective. Biology, 11(2), 155. [CrossRef]
- Zhao, H., Eide, D. (1996) The yeast ZRT1 gene encodes the zinc transporter of a high affinity uptake system induced by zinc limitation. Proc Natl Acad Sci. USA, 93, 2454–2458. [CrossRef]
- Zeeshan, M., Lu, M., Sehar, S., Holford, P., Wu, F. (2020). Comparison of biochemical, anatomical, morphological, and physiological responses to salinity stress in wheat and barley genotypes deferring in salinity tolerance. Agronomy, 10, 127. [CrossRef]
Figure 1.
A schematic illustration of the experimental layout.
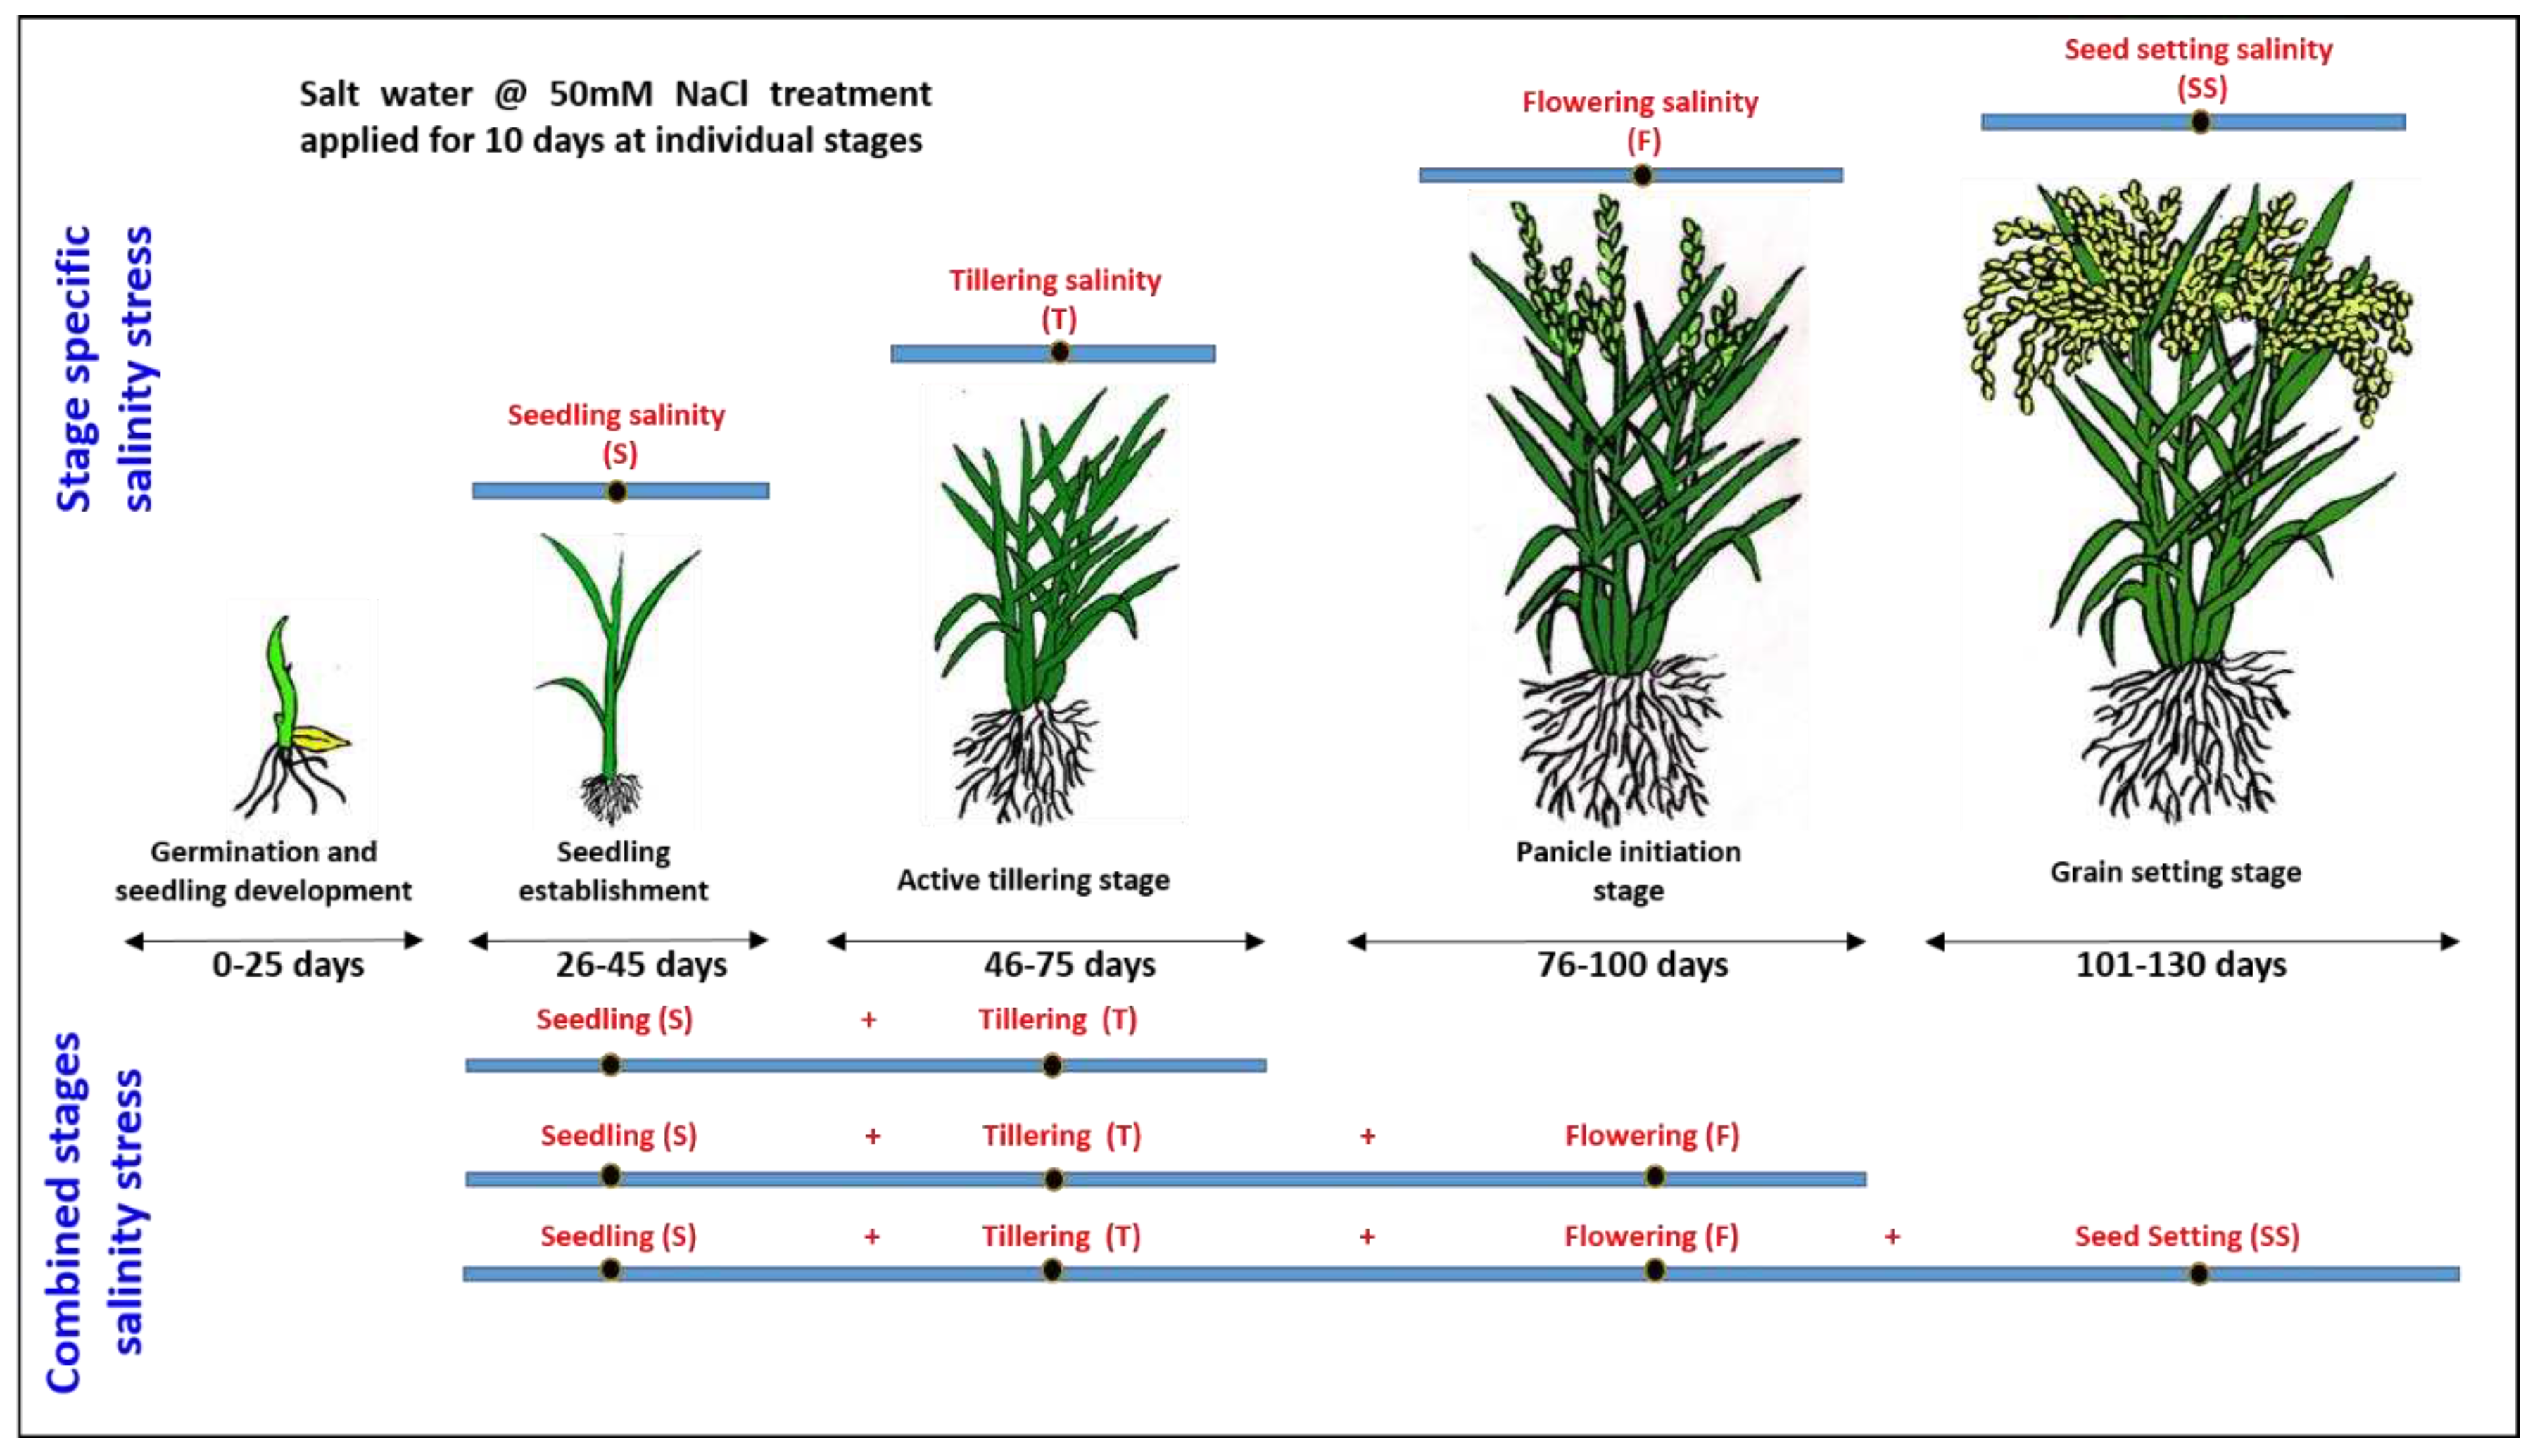
Figure 2.
Shoot and root phenotypes of CSR 36 and Jaya under stage-specific and combined-stage salinity stress 10 days post salt treatment. Rice seedlings were grown in polyhouse under control condition and subjected to 50mM NaCl salinity stress at stage-specific; seedling (S), tillering (T), flowering (F), seed setting (SS), and combined-stages; seedling + tillering (S+T), seedling + tillering + flowering (S+T+F), seedling + tillering + flowering + seed setting (S+T+F+SS), for 10 days. Qualitative shoot and root images were taken at (A) seedling stage, (B) tillering stage, (C) flowering stage and (D) seed setting stage 10 days post salt treatment.
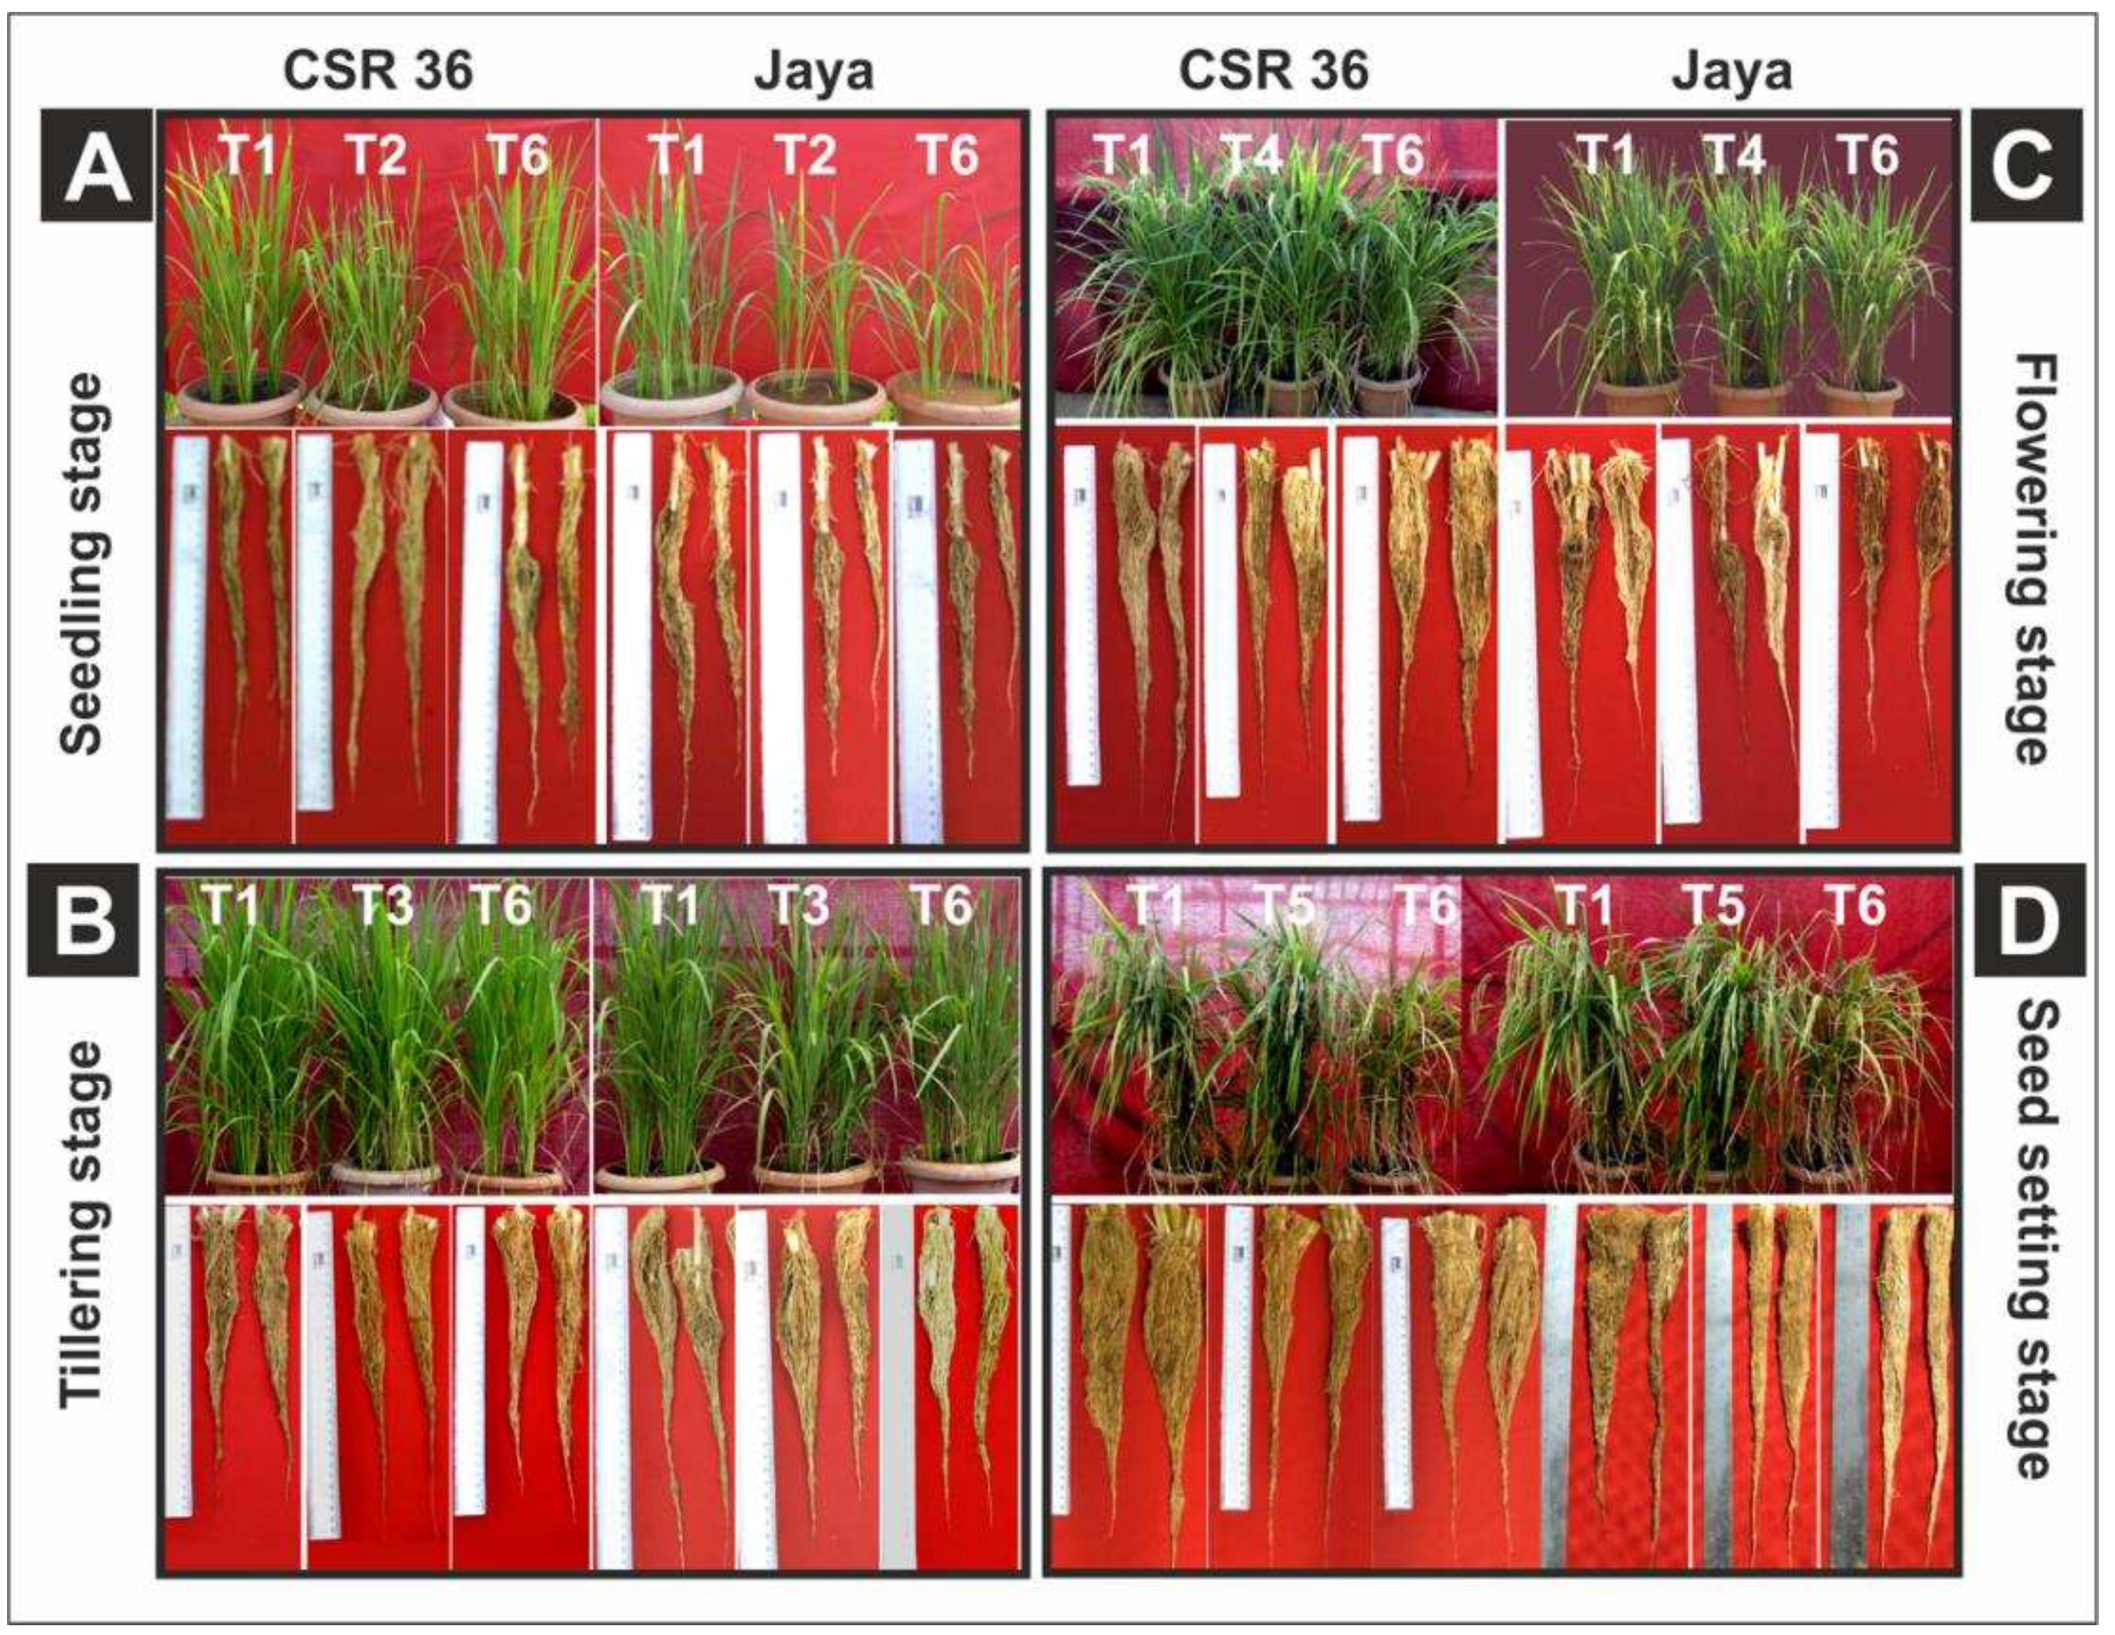
Figure 3.
10 Days post treatment phenotyping of rice varieties Jaya and CSR36 under stage-specific and combined-stage salinity stress. Rice seedlings were grown in polyhouse under control condition and subjected to 50mM NaCl salinity stress at stage-specific; seedling (S), tillering (T), flowering (F), seed setting (SS), and combined-stages; seedling + tillering (S+T), seedling + tillering + flowering (S+T+F), seedling + tillering + flowering + seed setting (S+T+F+SS), for 10 days. Differential phenotyping was quantified in terms of shoot dry biomass (A), root dry biomass (B), plant height (C) and tiller number (D). Refer supplementary Table 1 for statistics of different plant phenotype data at different time points. All the values are mean of triplicates ± SD. Different letters indicate significantly different values across treatments (DMRT, p ≤ 0.05), considering the fold change in both Jaya and CSR36 together.
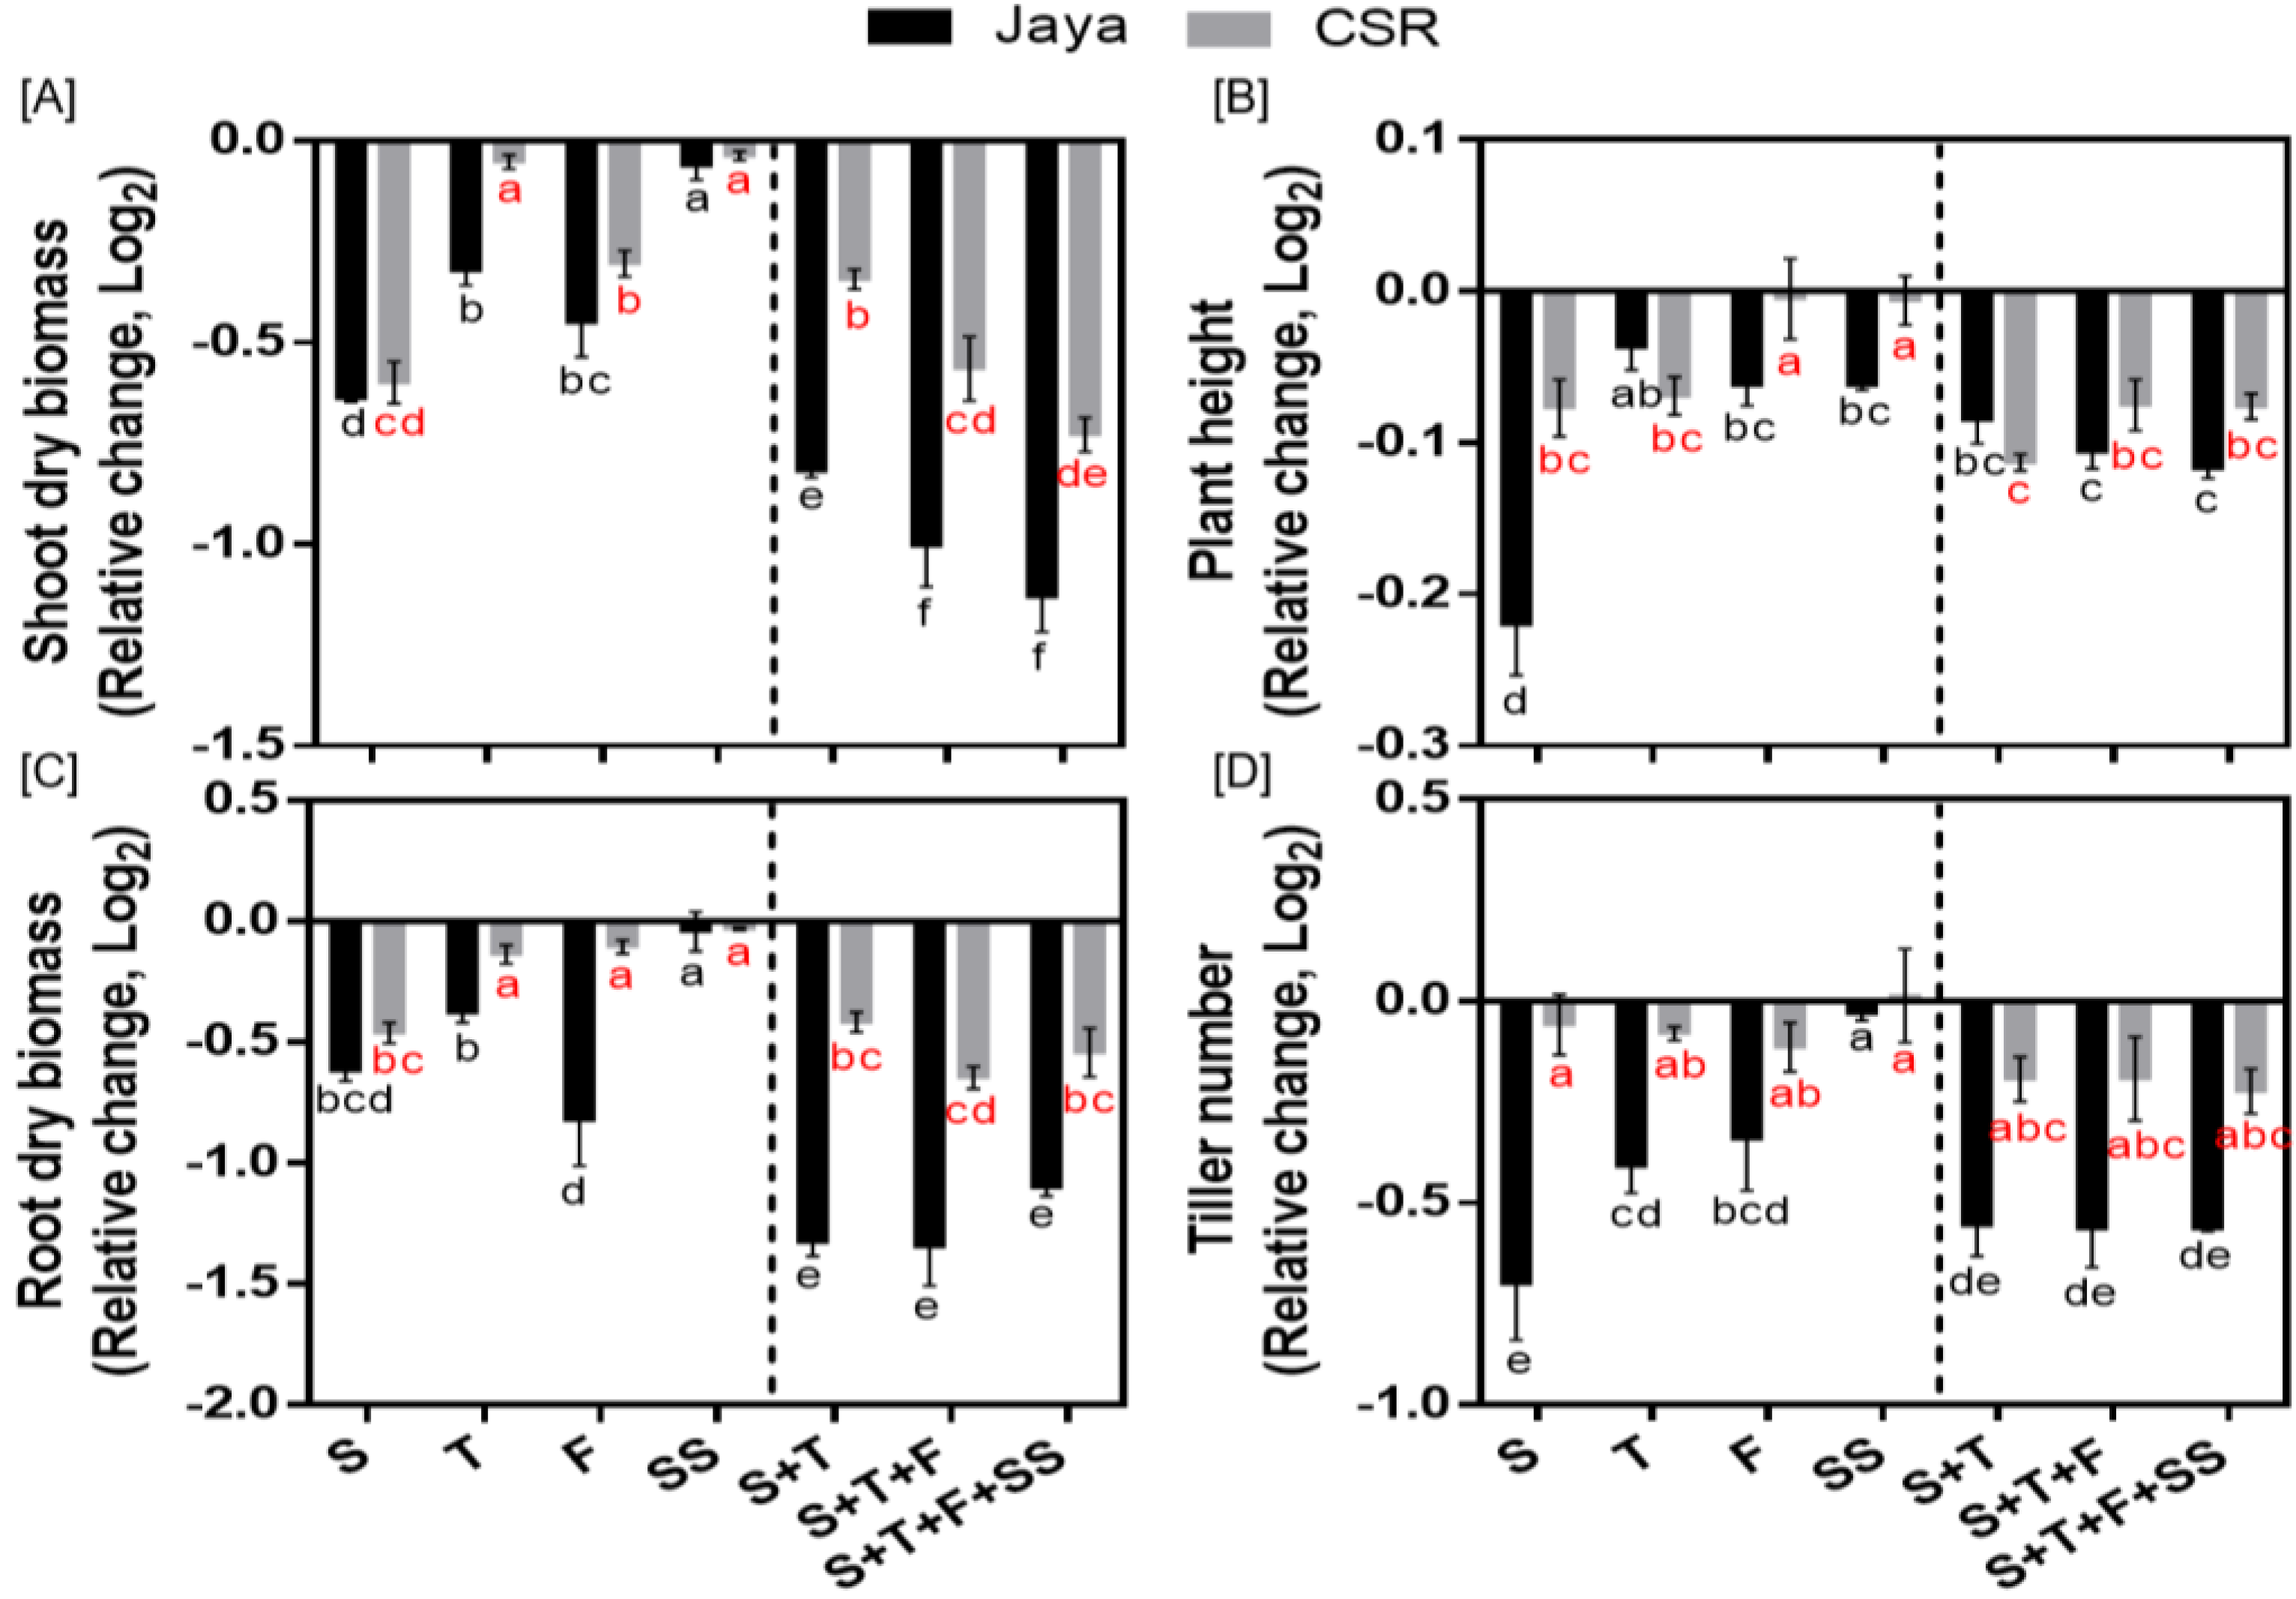
Figure 5.
Spatial and temporal response of anti-oxidant substrates in Jaya and CSR36. The rice seedlings were subjected to 50mM NaCl salinity stress for 10 days at S- (seedling), T- (tillering), F- (flowering), SS- (seed setting) under stage-specific and S+T- (seedling + tillering), S+T+F- (seedling + tillering + flowering), S+T+F+SS- (seedling + tillering + flowering + seed setting), under combined-stage salinity stress. After 10days of treatment, the root and shoot tissues were harvested and analyzed for ascorbate oxidized/reduced (DHA/ASC; A, C), and reduced glutathione (GSH; B, D). The data is represented in the form of relative change with respect to respective control and are converted to Log2. Refer supplementary Table 2 for statistics of different anti-oxidant substrate data at different time points. Different letters indicate significantly different values across treatments (DMRT, p ≤ 0.05), considering the fold change in both Jaya and CSR36 together.
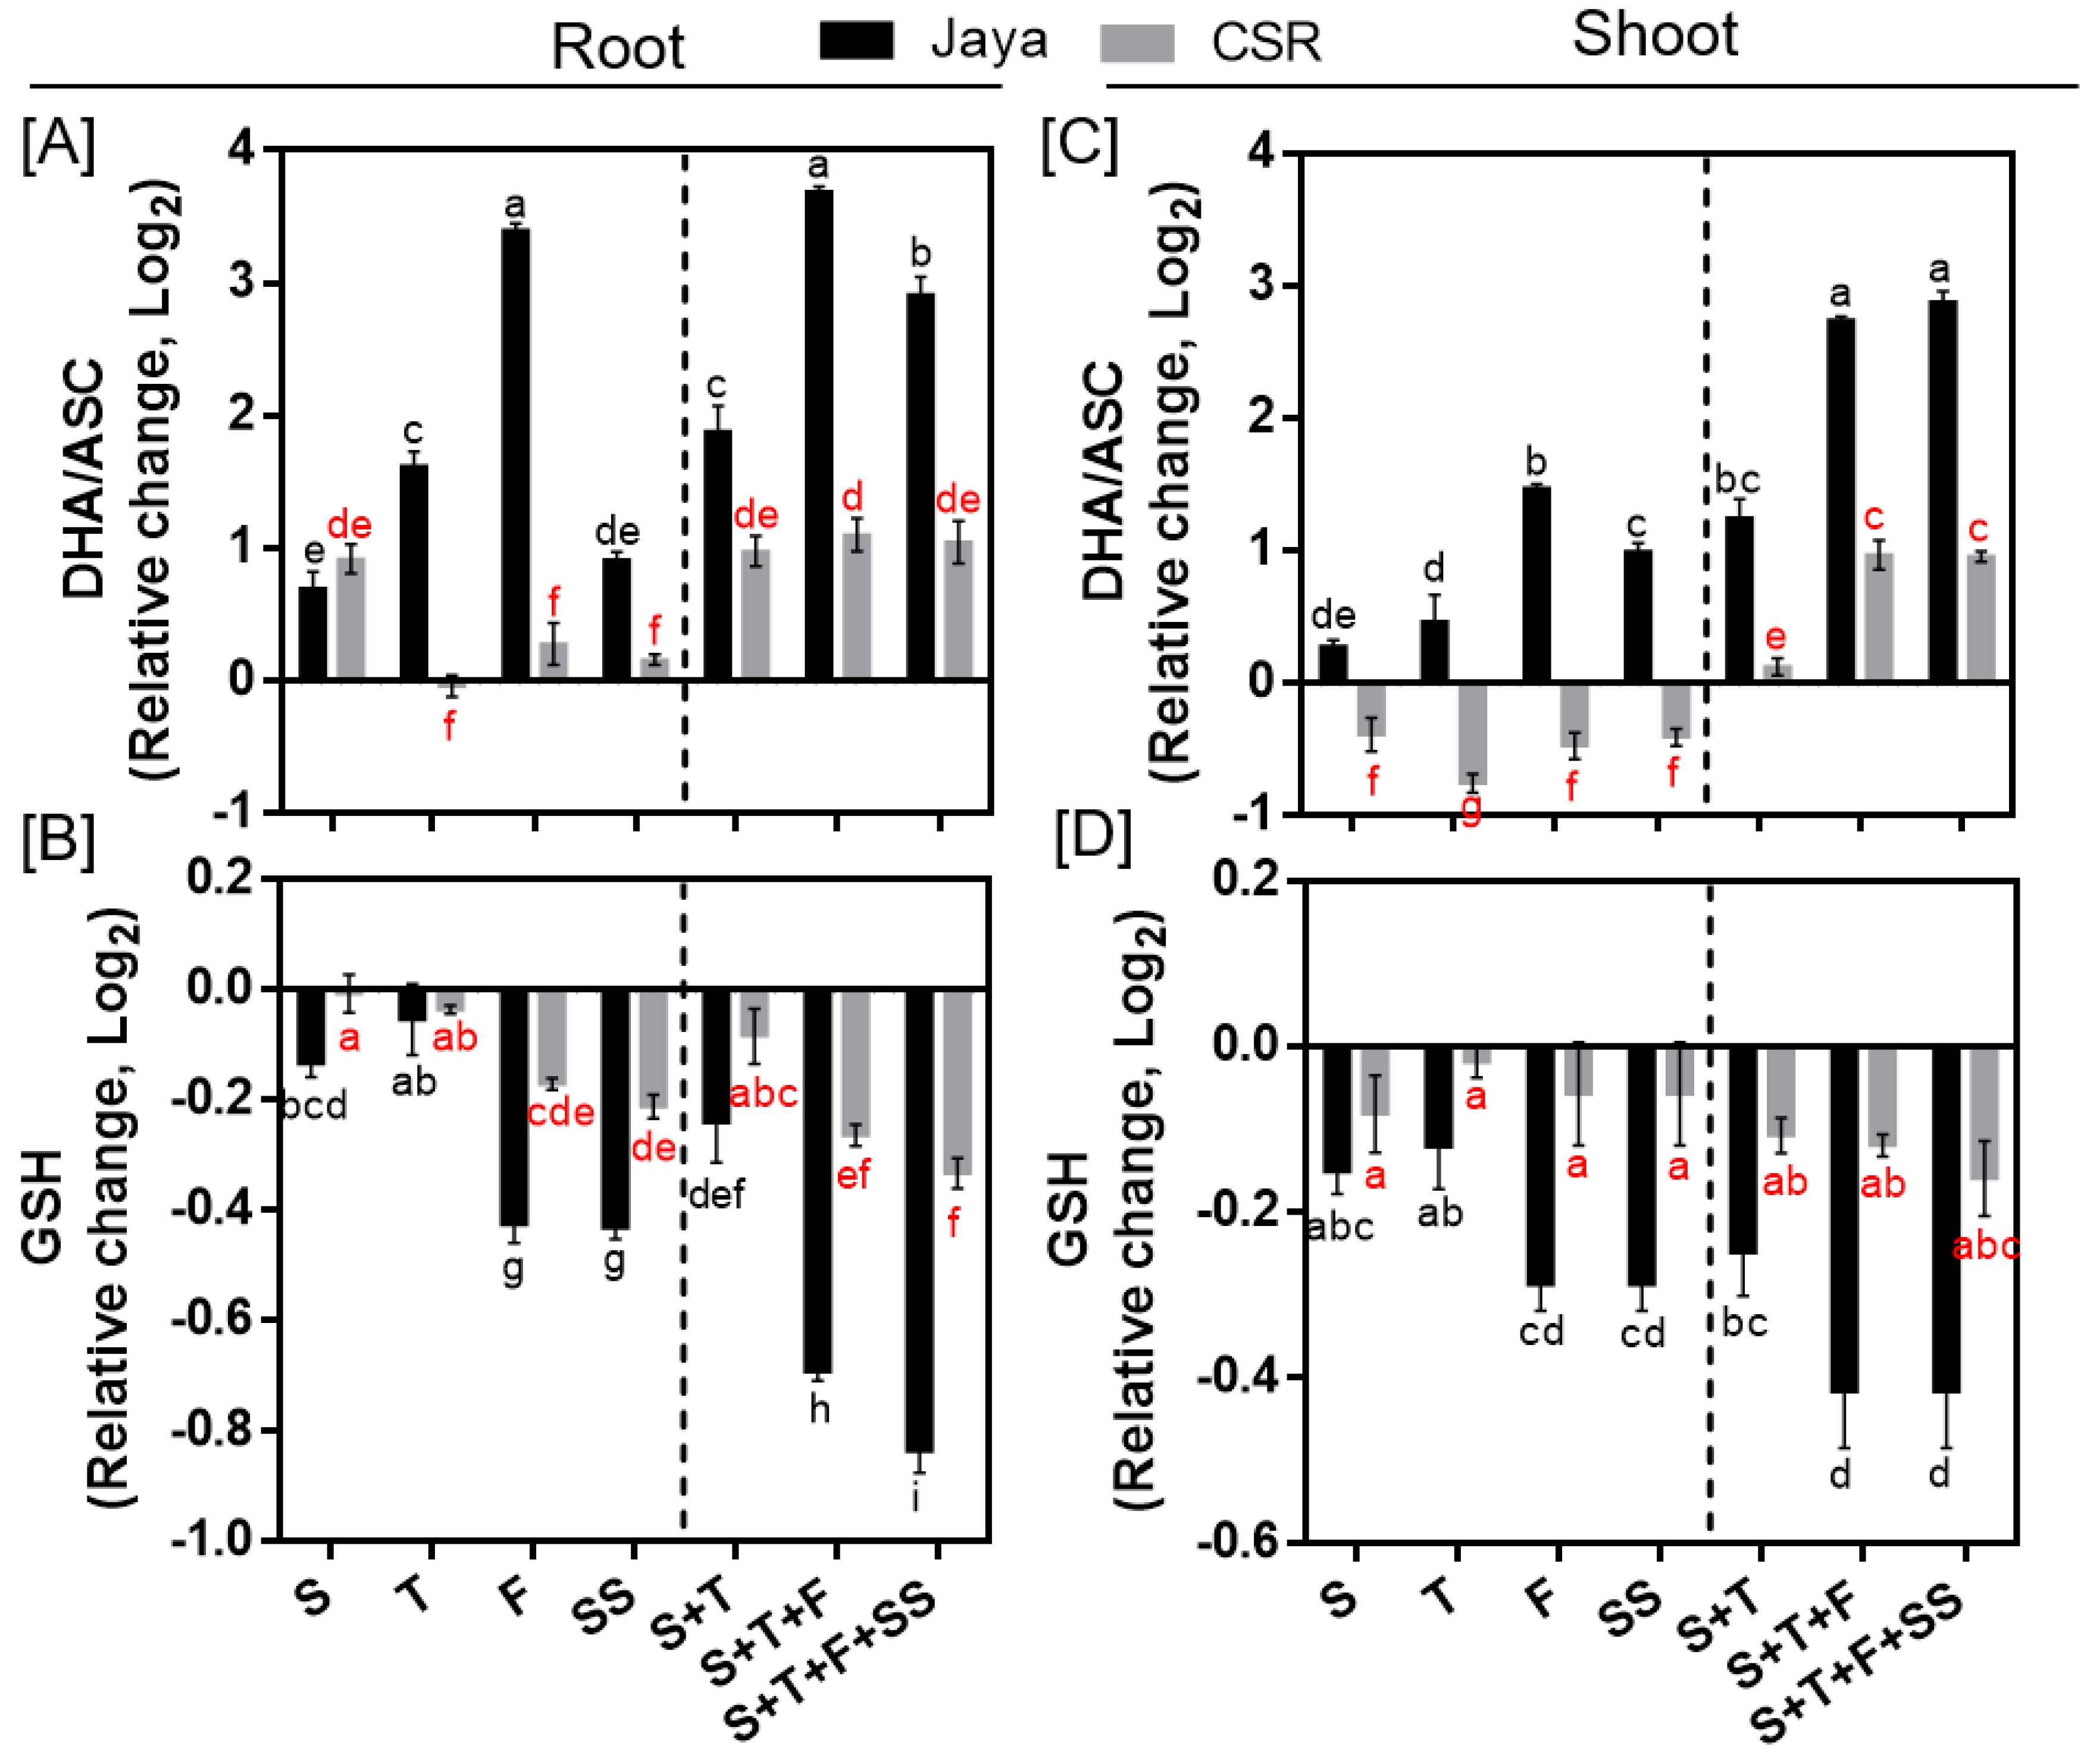
Figure 6.
Spatial and temporal response of osmolytes and lipid peroxidation in Jaya and CSR36. The rice seedlings were subjected to 50mM NaCl salinity stress for 10 days at S- (seedling), T- (tillering), F- (flowering), SS- (seed setting) under stage-specific and S+T- (seedling + tillering), S+T+F- (seedling + tillering + flowering), S+T+F+SS- (seedling + tillering + flowering + seed setting), under combined-stage salinity stress. After 10days of treatment, the root and shoot tissues were harvested and analyzed for Proline (A, C), total soluble sugar (TSS; B, E) and malonaldehyde (MDA; C, F). The data is represented in the form of relative change with respect to respective control and are converted to Log2. Refer supplementary Table 3 for statistics of different osmolytes and MDA data at different time points. Different letters indicate significantly different values across treatments (DMRT, p ≤ 0.05), considering the fold change in both Jaya and CSR36 together.
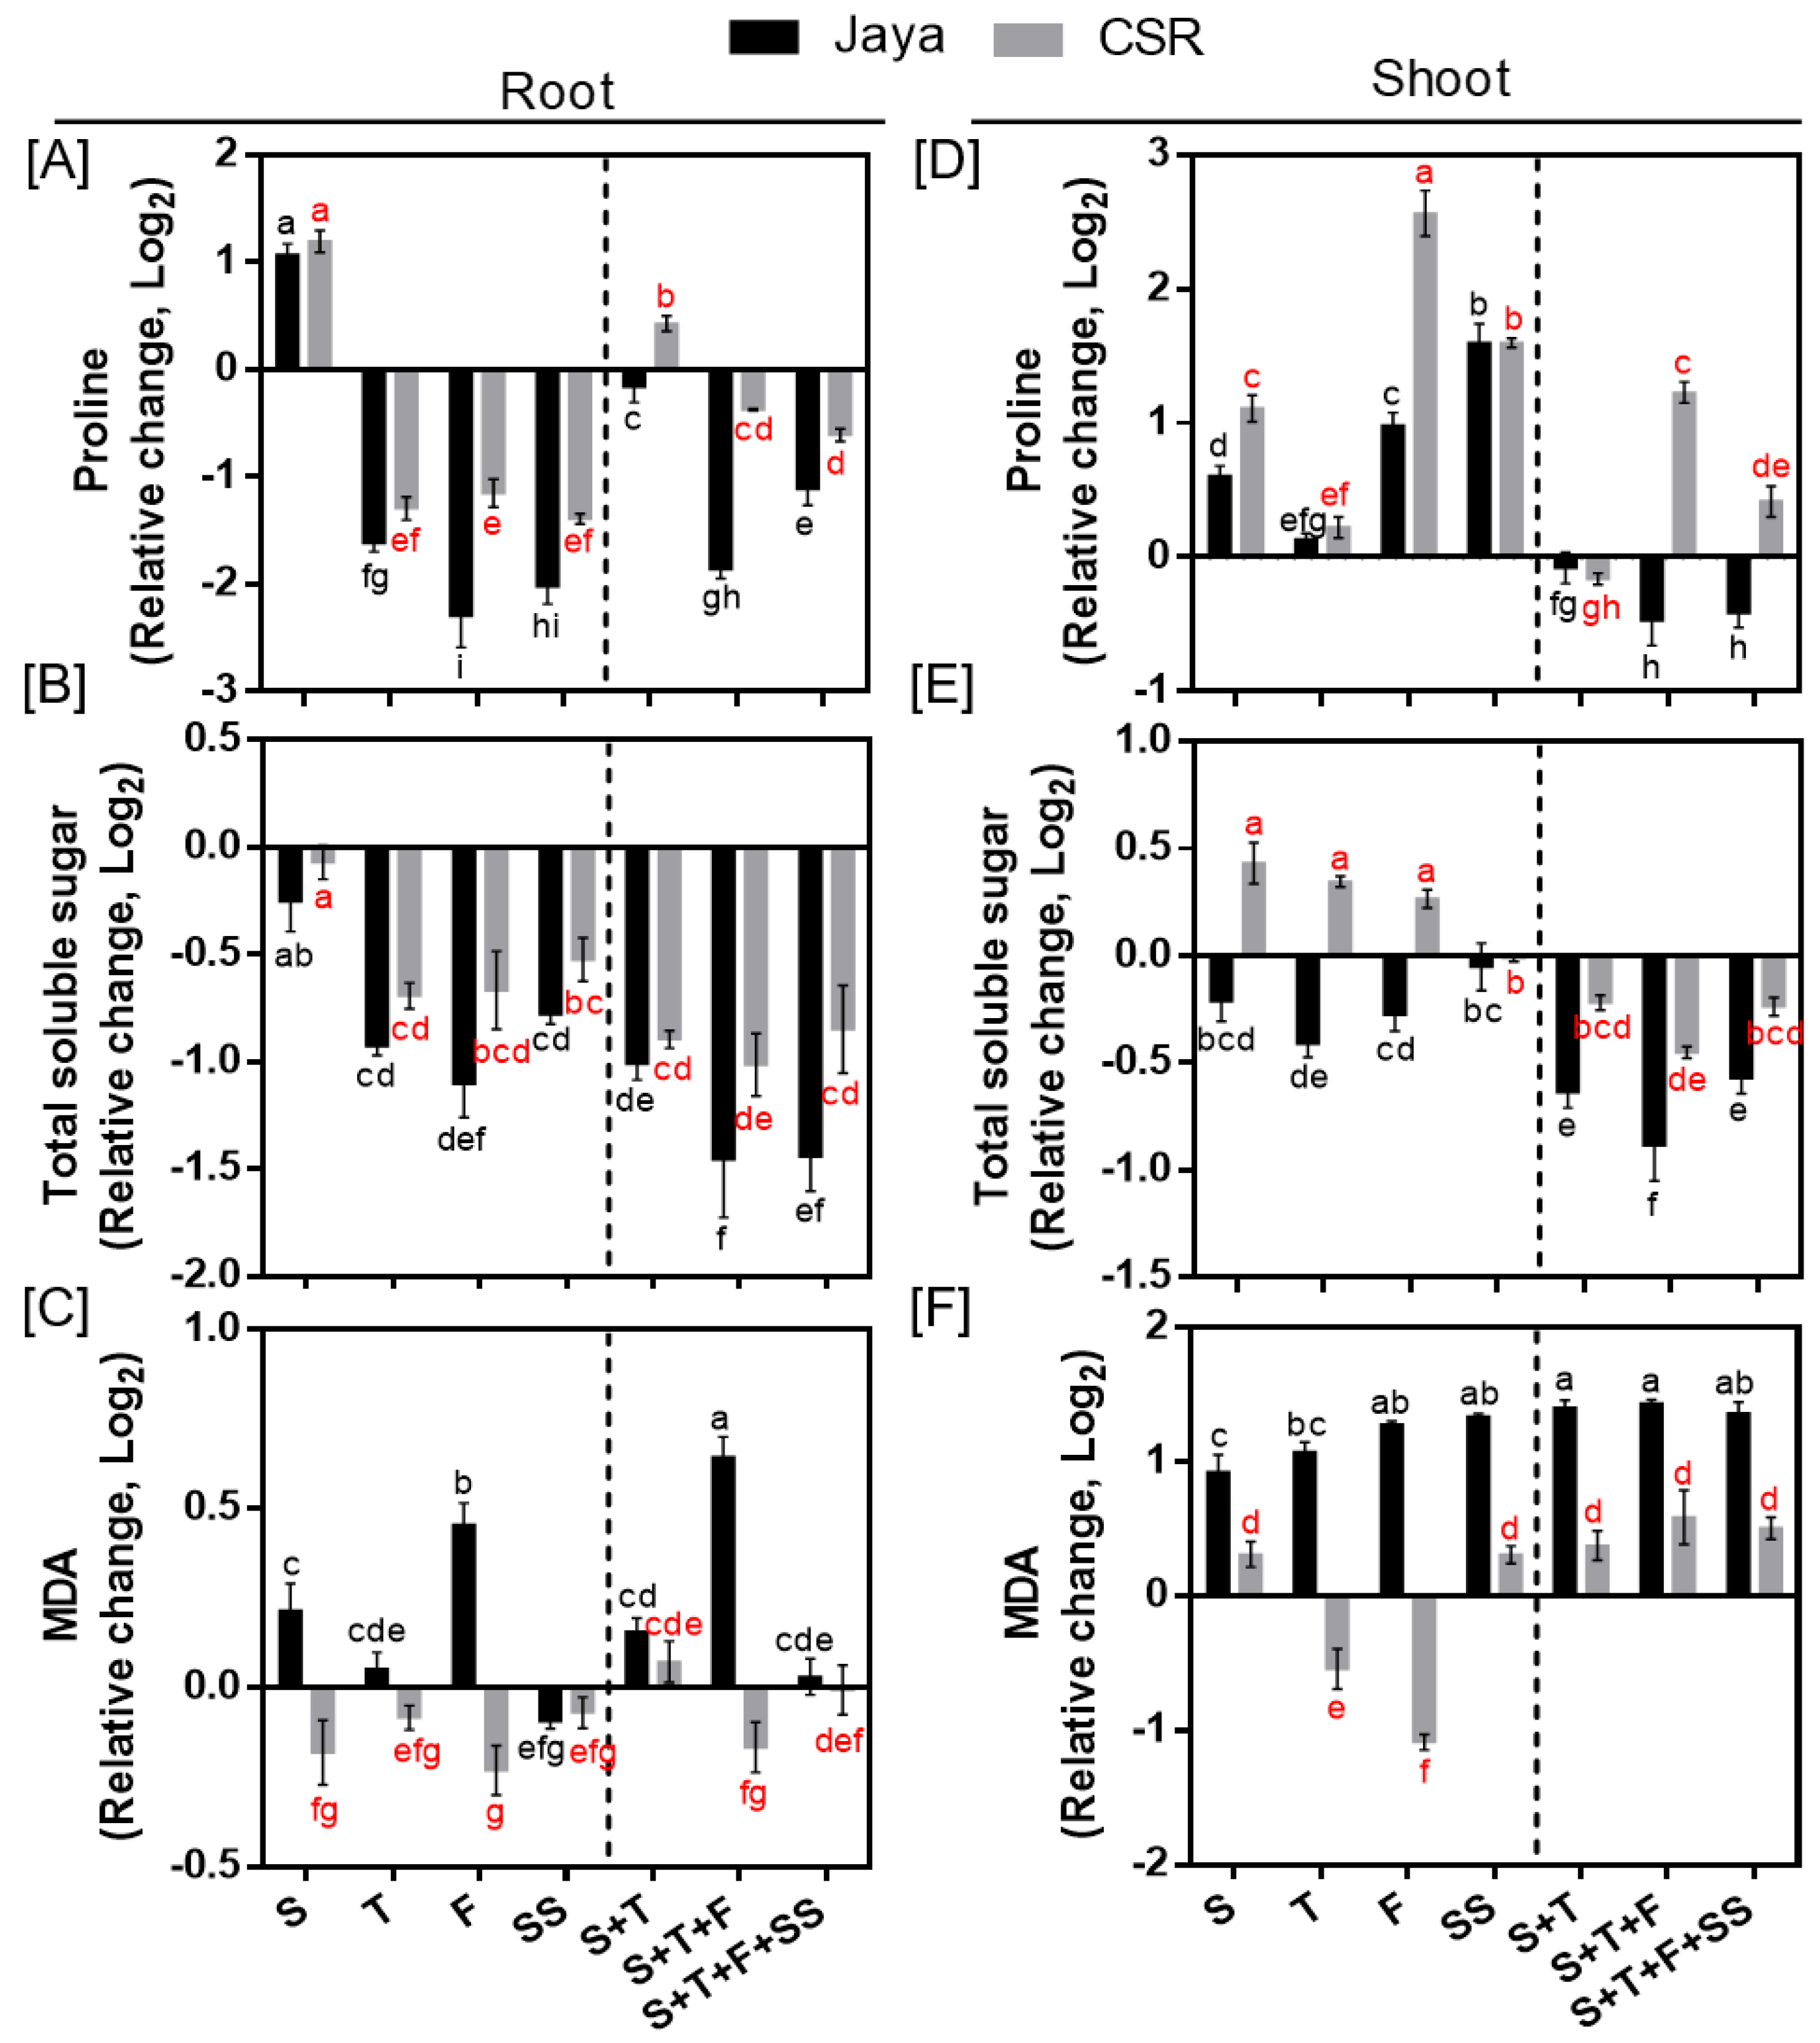
Figure 7.
Principal component analysis on field grown plants to understand treatment-variable interaction. The principal component analysis (PCA) was performed to identify the variables associated with different treatments including Jaya (50mM NaCl per pot) and CSR36 (50mM NaCl per pot). The biplots were generated independently for stage-specific salinity i.e., S-stage (A), T-stage (B), F-stage (C), SS-stage (D) and combined-stage salinity i.e., S+T-stage (E), S+T+F-stage (F), S+T+F+SS-stage (G). Individual PCA plots helps in identifying key variables responsible for salinity phenotype in Jaya and CSR36. (Refer Supplementary Figure S6 for key variables regulating salinity response in rice varieties Jaya and CSR36 at stage-specific and combined-stage salinity).
Disclaimer/Publisher’s Note: The statements, opinions and data contained in all publications are solely those of the individual author(s) and contributor(s) and not of MDPI and/or the editor(s). MDPI and/or the editor(s) disclaim responsibility for any injury to people or property resulting from any ideas, methods, instructions or products referred to in the content. |
© 2024 by the authors. Licensee MDPI, Basel, Switzerland. This article is an open access article distributed under the terms and conditions of the Creative Commons Attribution (CC BY) license (http://creativecommons.org/licenses/by/4.0/).
Copyright: This open access article is published under a Creative Commons CC BY 4.0 license, which permit the free download, distribution, and reuse, provided that the author and preprint are cited in any reuse.


