Submitted:
15 January 2024
Posted:
16 January 2024
You are already at the latest version
Abstract
We use COMSOL Multiphysics software to model optical processes in media and the effects of light propagation in whispering gallery mode resonators (WGMRs). Although plane wave irradiating on resonator does not create resonances, it was shown that they can be obtained when focused tangentially on the perimeter of the resonator. We demonstrate that resonances can be excited in resonators by prism coupling when the incident angle of the light is larger than the angle of total internal reflection. We determined the optimal distance between the prism and the resonator to get the strongest resonances. Bio-sensing principle of WGMRs is shown by demonstrating that the shift of resonances increases with a larger number of "bio-molecules" attached to the surface of WGMR. Surface functionalization and surface roughness were explored.
Keywords:
whispering gallery mode resonators
; COMSOL
; microresonator
; resonance
; modelling
; bio-sensing
; surface functionalization
1. Introduction
Whispering gallery mode resonators (WGMRs) are curved shape optical structures, like spheres [1], microdisks [2], microrings [3], and toroids [4] that confine light due to the total internal reflection [5]. WGMRs are interesting objects because they can form optical resonances with ultra-high quality (Q) factors of [6,7]. Additionally, they concentrate light to such an extent that nonlinear optical phenomena appear. Microresonator frequency comb generation is one of the derived effects [8]. Applications of WGMRs include frequency filtering, lasing, temperature, force, and displacement sensing, electric- and magnetic-field sensing, and bio-sensing [9,10,11,12].
WGMRs are tested experimentally mainly by monitoring light intensity that is transmitted through them via prism or tapered fiber coupling [13,14]. Linewidth scan of laser emission accompanied by time-domain plot of transmitted signal reveal the shape and the behavior of resonance signals of the WGMRs [15,16]. The full width at half maximum (FWHM) of the resonance peaks and their frequency positions are parameters that describe the interrelation between pumping laser light and the surrounding environment through these resonators. The shift in the observable resonance data reflects the changes of the resonator or the external environment, thus becoming a tool of sensing.
Coating the WGMRs with a functionalizing layer to enhance optical proprieties impacts both the Q factor and the resonance peak location describes the ability to store energy inside a microcavity [16,17].
COMSOL Multiphysics with Wave Optics Module is a popular finite element software that is used to model light propagation in WGMRs [18,19,20]. COMSOL provides neat visualization of light field in optical structures as color-map values of its electric and magnetic components and energy density. Numerical simulations allow easier to understand effects of light propagation in WGMRs, provide additional details on the field structure in addition to resonance positions of WGMRs and are easier to comprehend than advanced analytical theory of WGMRs based on Maxwell’s equations [21].
COMSOL simulations provided in this paper show the basic and advanced effects of WGMRs: light can be coupled in them by prism and tapered fiber structures, resonance positions and Q factors of resonances depend on the coupling parameters, "biomolecules" attached to the resonator shift resonance positions, surface functionalization, and surface roughness affect both resonance position and Q factor, and others. Basic theory is provided to be comparable to simulation data.
2. Basic Theory of WGMRs
2.1. Resonances and free spectral range
When the length L of the light path loop in an optical structure with the refraction index n is equal to the positive natural number m of wavelength in this media , a resonance condition is formed:
which gives resonance wavelengths:
Corresponding resonance frequencies are:
If light path loop L is a circle with radius a then
If resonances are searched in a circular resonator with radius r, then (2) and (3) can be used with a condition only as a rough approximation. Advanced theory based on Maxwell’s equations [22,23] show that for a first radial mode of spherical WGMRs placed in air resonances are observed for corresponding TE and TM modes:
Similarity between equations (4), (6), (8) is seen. Let us explore the situation when a resonator with (fused silica, 780 nm region) is used. Then m = 5 gives and , and m = 500 gives and . This shows that if is used in (4) then the number m of wavelengths in some resonance differs from actual numbers significantly. Resonances for fused silica WGMR sphere can be determined near 780 nm spectral position. According to equation (6) - (9) the parameters , and m for resonators with radius r = 2 µm, r = 20 µm and r = 200 µm are given in Table 1. These values give orientation for the search for resonances in COMSOL models.
The distance between two closest resonances is called the Free Spectral Range (FSR). For wavelength scale, FSR is:
which means that peaks are not equidistant. We assumed that , which is valid for large resonators.
In frequency scale, FSR is:
which means that resonances are equidistant.
2.2. Quality factor, finesse and intensity distribution of resonances
The quality factor of the resonator system is defined as the ability to store the energy inside the cavity [24,25]:
If amplitude of the optical signal oscillates and decays as , then
The full width at half maximum (FWHM) of resonances for , , and are:
And Q factor can be expressed as:
In case of various processes with corresponding Q-factors that influence the system, the final Q-factor of the system is calculated as:
For typical WGMRs these sub-processes are [6]: is formed by intrinsic radiative (curvature) losses, – scattering losses on residual surface inhomogeneities, – losses introduced by surface contaminants, – material losses.
Finesse describes the resonator and is defined as FSR divided by FWHM:
Taking into account formulas (11), (13), (15), and (19), we get:
Here we will describe a model of a waveguide coupled to a circular resonator taking into consideration the field decay in the system. This system is called an optical all-pass filter. The coupling of waveguide and resonator is described by reflection coefficient u, transmission coefficient , and one loop path length in the resonator L. This gives phase shift per loop , and the field intensity decay rate per loop is with , where is the decay period, is the time needed for the light to travel one loop in the resonator, and c is the speed of light. Incident light intensity is .
Transmitted field intensity of all-pass filter is [26]:
where
Using (17) and (20) we get analytical values for:
Minimal and maximal value of a transmitted field (21) is:
giving a resonance depth:
Close to resonances and intensity (21) can be approximated as:
with K as a coefficient. Absorption resonance according to (29) is a Lorentzian function.
3. Modelling of WGMRs
COMSOL Multiphysics is finite element numerical calculation software that allows one to model various physical processes like light propagation in optical systems, heat propagation, mechanical stress distribution, etc. Wave Optics module has to be activated to describe light in optical systems as waves. WGMRs can be modeled in 2D, 2D axisymmetric, or 3D mode. Resonance frequencies are obtained in "Eigenfrequencies" study selection or by scanning the frequency of the incident field and monitoring the outcome port or value of the Energy density time average of the resonator.
Finite element numerical calculation software derives values of parameters in various spatial structures and computing time for this depends on the number of mesh points. For exploration of wave optics processes mesh size has to be smaller than the fraction of wavelength of the field. This limits the application of these calculations to 2D and 3D structures that are much larger than the wavelength of the field. Large structures can be modeled relatively fast only in 2D axisymmetric modes. Therefore 3D mode was used to model WGMRs radius of up to 2 µm, 2D mode was used to model WGMRs radius of up to 20 µm, and 2D axisymmetric mode was used to model WGMRs radius up to 200 µm. When circle resonators are explored in 2D mode they represent cylindrical structures. Spherical resonators can be modeled only in 2D axisymmetric and 3D modes.
Refraction coefficients for the resonator, prism, and fibers were selected to be equal (n=1.4537, fused silica) and resonances were explored in the spectral region around 780 nm.
3.1. Free space, prism and tapered fiber coupling of cylindrical resonator
When a wide plane wave is irradiated on a cylindrical resonator (2D mode) then no resonances are observed and we find that the resonator works only as a focusing lens. When we irradiate spatially limited plane wave on a cylindrical resonator and it touches only tangentially its perimeter then WGM resonances are formed (Figure 1a). Plane wave moves from left to right. Colors in the Figure represent values of component of the intensity of the electric field of a light wave. This is known as free space coupling, which is an inefficient way of coupling light. The efficiency is less than [27], where a is the beam cross-section radius (comparable with sphere radius). This approach is used experimentally to couple light inside a liquid spherical resonators, for example, glycerol droplet [28].
Prism-type structure can be used to introduce light in the resonator (Figure 1b). When scanning incident wavelength and measuring energy density time average integrated across resonator, we get resonance spectra in the resonator. Experimental studies have shown that prism coupling has approximately 80% efficiency [29,30]. This coupling method is robust. Additionally, the surface of the prism can be cleaned, which is advantageous for different bio-sensing applications in liquids because the molecules may attach to both the surface of the WGMR and the prism.
Experimentally it is easier to couple light inside the WGMR using a tapered optical fiber – a single-mode optical fiber that is significantly thinned with a waist less than 10 µm in diameter (Figure 1c). It has 98-99% coupling efficiency [30]. Optical transmittance of tapered fiber degrades due to particle adhesion on the surface. However, cleaning tapered fiber is more challenging than a prism because it is very fragile. Therefore, this coupling method has severe limitations in bio-sensing applications.
Besides the coupling method, various coupling conditions can be modeled. When changing the gap between the resonator and prism as gap with = 780 nm and g changing in the region 0 – 0.5 we get that resonance peak position almost does not change (Figure 2a), but the intensity of resonance peak at first increases and then decreases with largest intensity to be achieved when parameter g ≈ 0.1 (Figure 2b). The simulation results conform with the experimental results when varying the gap between prism and WGMR [31]. An optimal gap allows critical coupling when intrinsic and extrinsic losses match.
Resonance intensities also change when the incident angle of the light field changes (Figure 2c). Maximum intensity in this case is dependent on the gap between the resonator and prism and is achieved when the incident angle of the light is slightly larger than the angle of total internal reflection which is 0.76 rad for fused silica. In case of a larger gap, the coupling appears to be achieved just before reaching the boundary , which could be explored further. Otherwise, maximums in Figure 2c below do not belong to WGM resonances.
For tapered fiber coupling, the fiber width () was changed to monitor intensities of resonance peaks (Figure 2d). It was found that the largest peak of energy density time average in the resonator appears when the width of the fiber is below the wavelength. This explains the need for tapered fibers (< 2µm in diameter) for effective coupling of light into the WGMRs [32,33].
3.2. Resonances and bio-sensing using WGMRs
WGMRs can be used as bio-sensors [10,34]. The sensing principle explored in this paper is the shift of the resonances due to changes on the surface of the resonator.
The process of bio-molecules attaching to the surface can be modeled by small elements that attach to the surface of the resonator. Figure 3a–c gives modeling examples of this process when multiple small "items" touch the surface. In Figure 3a five small items (R = 0.1 µm) are attached to the surface of the resonator (R = 2.0 µm). WGMR is coupled using the coupling prism. In Figure 3b four particles (R = 0.5 µm) are attached to the surface of the resonator (R = 6.0 µm). WGMR is coupled using the tapered fiber. In Figure 3c four different irregularly shaped particles are attached to the surface of the resonator. In all three cases, particles act as surface defects and scatter light. For small particles, when irradiation wavelength is comparable with the particle size R scattering dominates over absorption [35]. For large particles, where , the absorption dominates over scattering [35].
Figure 3d–f shows the shift of WGM resonance and degradation of the Q factor due to attachment of spherical (as shown in Figure 3b) and irregularly shaped (as shown in Figure 3c) particles. For Figure 3d, round dust like particles are modelled using R = 0.5 µm, = 1.5 and = -0.0007, and, for Figure 3f round gold particles are modelled using R = 0.5 µm, = 0.14891, = 4.783. WGMR size in all three cases is R = 6.0 µm. As each addition particle attaches to the surface (in simulations particles are attached from right to left as illustrated in Figure 3b-c), the electric field norm of the WGM resonance decreases. The shift of the resonance wavelength depends on the parameters n and k. For round dust particles, the resonance wavelength increases with the number of particles attached to the surface (see Figure 3d inset). Particle shape and size have some impact as well. In the case of four round identical dust particles WGM resonance position shifted 0.72 nm. In the case of four irregularly shaped and sized particles WGM position shifted 0.63 nm. For gold particles, the resonance wavelength decreases with the number of particles attached to the surface. WGM resonance shifted -0.50 nm. In all cases, the Q factor of the WGMR decreases with attached particles, which acts as a surface defect and increases surface scattering losses.
For bio-sensing applications, WGMRs need to be functionalized with a bio-sensitive layer by introducing a binding material to the surface that attracts only specific molecules. The surface functionalization layer can be modeled by adding a thin layer of material with different optical parameters [36,37]. We demonstrate examples with Polymethyl methacrylate (PMMA) (=1.4860, k=1.4000 [38]) and ZnO (=1.7588, k=0.030390 [39]) layers, which influence the degree of WGM confinement inside the resonator. PMMA layer has a lower refraction index than silica and it makes the WGMR more sensitive to the surrounding environment. ZnO layer has a higher refraction index than silica and it ensures the stability of the whispering gallery mode.
A more realistic rough surface can be generated by using built-in random functions generating a random polar curve [40]:
where , is the radius of the random polar curve, (roughness parameter) is an amplitude multiplier for the random part of the equation, b is a spectral exponent, is a normal distribution random function, is a uniform distribution random function, and F is a spatial frequency resolution. We take the absolute value of the random function so the curve wouldn’t cross the smooth resonator line and would only go outwards of the resonator as a functionalized surface would. The resulting jagged line better approximates a real resonator with an imperfect surface. Figure 4a–c shows the distribution of electric field norm in fused silica spherical WGMR with radius 5 µm coated with 100 nm PMMA and roughness parameter 3.7 nm, 9.1 nm and 17.3 nm respectively. A rough surface contributes to the surface scattering losses. The shapes of the electric field norm of the resonance become less regular. Additionally, the rough surface affects the effective refraction index of the WGMR and WGM resonances shift as can be seen in Figure 4d,e for both fused silica WGMR and fused silica WGMR coated with 100 nm PMMA layer. Initially, WGM resonance is shifted by 0.91 nm with the PMMA layer (see Figure 4f). When increasing the roughness the WGM resonance shifts more for WGMR with the PMMA layer than for pure silica WGMR. For 20 nm roughness, the shift difference increased to 1.96 nm. As the roughness increases, the WGMR Q factor gradually decreases for resonators both with and without PMMA layer (see Figure 4g).
For a ZnO layer, the surface roughness plays a more important role as shown in Figure 4h. As the WGM resonance moves into the coating [17] it is more sensitive to surface roughness and affected by surface scattering losses.
COMSOL 2D axisymmetric mode can be used to find resonances of WGMRs, it is suitable for large resonators. The advantage of 2D axisymmetric mode is that we can investigate various side modes the effective mode area and the effective mode radius. It is also used to calculate the dispersion of the resonator. However 2D axisymmetric mode can’t be used to investigate the coupling efficiency with a light source and effects of attached bio-molecules or rough surface.
4. Conclusions
The description of the main effects of WGMRs was given with corresponding COMSOL simulations. Although plane wave irradiating on a resonator does not create resonances, it was shown that they can be obtained when focused tangentially on the perimeter of the resonator. It was shown that resonances can be excited in resonators by prism coupling when the incident angle of the light is slightly larger than the angle of total internal reflection. There was the optimal distance of the fraction of wavelength between the prism and resonator to get the strongest resonances. The width of fiber coupled to the resonator has to be comparable to the wavelength of the light to achieve the strongest resonances thus providing theoretical ground for fiber tapering. Bio-sensing principle of WGMRs was shown with the demonstration that the resonance shift increases with a larger number of "bio-molecules" and particles attached to the surface of WGMR. The roughness surface functionalization layer was more important for layers with a higher index of refraction. The provided results form an understanding of the main effects of WGMRs and surface functionalization. In the future modeling results could be used to explain and accompany experimental results of WGMR surface functionalization or molecule attachment. Some aspects of coupling parameters and surface roughness also could benefit from a more detailed modeling and a more thorough results analysis.
Author Contributions
Conceptualization, A.A.; methodology, A.A., I.B.; software, A.A., K.D. and H. B.; validation, A.A.; formal analysis, A.A., K.D. and H.B.; investigation, A.A., K.D., H.B. and I.B.; resources, A.A., J.A.; data curation, I.B., J.A.; writing—original draft preparation, A.A.; writing—review and editing, A.A, K.D., I. B. and J.A.; visualization, A.A., K.D. and I.B.; supervision, A.A., J.A.; project administration, A.A., I.B. and J.A.; funding acquisition, A.A., J.A. All authors have read and agreed to the published version of the manuscript.
Funding
This research was funded by ERDF grant number 1.1.1.1/16/A/259 and ERDF grant number 1.1.1.5/19/A/003.
Data Availability Statement
The data presented in this study are openly available in Zenodo at https://doi.org/10.5281/zenodo.7380199.
Acknowledgments
Authors are thankful to R. A. Ganeev for useful comments on the manuscript.
Conflicts of Interest
The authors declare no conflicts of interest.
Abbreviations
The following abbreviations are used in this manuscript:
| WGMR | Whispering Gallery Mode Resonator |
| Q | Quality factor |
| COMSOL | COMSOL Multiphysics software |
| FSR | Free Spectral Range |
| FWHM | Full Width at Half Maximum |
| PMMA | Polymethyl methacrylate |
References
- Chiasera, A.; Dumeige, Y.; Féron, P.; Ferrari, M.; Jestin, Y.; Conti, G.; Pelli, S.; Soria, S.; Righini, G. Spherical whispering-gallery-mode microresonators. Laser and Photonics Reviews 2010, 4, 457–482. [Google Scholar] [CrossRef]
- Zhang, L.; Zheng, D.; Li, W.; Bo, F.; Gao, F.; Kong, Y.; Zhang, G.; Xu, J. Microdisk resonators with lithium-niobate film on silicon substrate. Optics Express 2019, 27, 33662. [Google Scholar] [CrossRef] [PubMed]
- Bogaerts, W.; De Heyn, P.; Van Vaerenbergh, T.; De Vos, K.; Kumar Selvaraja, S.; Claes, T.; Dumon, P.; Bienstman, P.; Van Thourhout, D.; Baets, R. Silicon microring resonators. Laser & Photonics Reviews 2012, 6, 47–73. [Google Scholar] [CrossRef]
- Armani, D.K.; Kippenberg, T.J.; Spillane, S.M.; Vahala, K.J. Ultra-high-Q toroid microcavity on a chip. Nature 2003, 421, 925–928. [Google Scholar] [CrossRef] [PubMed]
- Yang, S.; Wang, Y.; Sun, H. Advances and Prospects for Whispering Gallery Mode Microcavities. Advanced Optical Materials 2015, 3, 1136–1162. [Google Scholar] [CrossRef]
- Gorodetsky, M.L.; Savchenkov, A.A.; Ilchenko, V.S. Ultimate Q of optical microsphere resonators. Optics Letters 1996, 21, 453. [Google Scholar] [CrossRef] [PubMed]
- Savchenkov, A.; Matsko, A.; Ilchenko, V.; Maleki, L. Optical resonators with ten million finesse. Optics Express 2007, 15, 6768–6773. [Google Scholar] [CrossRef] [PubMed]
- Suh, M.G.; Vahala, K.J. Soliton microcomb range measurement. Science 2018, 359, 884–887, [1705.06697]. [Google Scholar] [CrossRef]
- Ilchenko, V.S.; Matsko, A.B. Optical resonators with whispering-gallery modes - Part II: Applications. IEEE Journal on Selected Topics in Quantum Electronics 2006, 12, 15–32. [Google Scholar] [CrossRef]
- Foreman, M.R.; Swaim, J.D.; Vollmer, F. Whispering gallery mode sensors. Advances in Optics and Photonics 2015, 7, 168–240. [Google Scholar] [CrossRef]
- Su, J.; Goldberg, A.F.; Stoltz, B.M. Label-free detection of single nanoparticles and biological molecules using microtoroid optical resonators. Light: Science and Applications 2016, 5, 2–7. [Google Scholar] [CrossRef] [PubMed]
- Brice, I.; Grundsteins, K.; Atvars, A.; Alnis, J.; Viter, R.; Ramanavicius, A. Whispering gallery mode resonator and glucose oxidase based glucose biosensor. Sensors and Actuators B: Chemical 2020, 318, 128004. [Google Scholar] [CrossRef]
- Griffel, G.; Connolly, J.; Morris, N.; Arnold, S.; Taskent, D.; Serpengüzel, A. Morphology-dependent resonances of a microsphere–optical fiber system. Optics Letters 1996, 21, 695. [Google Scholar] [CrossRef] [PubMed]
- Knight, J.C.; Cheung, G.; Jacques, F.; Birks, T.A. Phase-matched excitation of whispering-gallery-mode resonances by a fiber taper. Optics Letters 1997, 22, 1129. [Google Scholar] [CrossRef] [PubMed]
- Brice, I.; Pirktina, A.; Ubele, A.; Grundsteins, K.; Atvars, A.; Viter, R.; Alnis, J. Development of optical WGM resonators for biosensors. In Proceedings of the Progress in Biomedical Optics and Imaging - Proceedings of SPIE, 2017, Vol. 10592. [CrossRef]
- Brice, I.; Grundsteins, K.; Draguns, K.; Atvars, A.; Alnis, J. Whispering Gallery Mode Resonator Temperature Compensation and Refractive Index Sensing in Glucose Droplets. Sensors 2021, 21, 7184. [Google Scholar] [CrossRef] [PubMed]
- Brice, I.; Viter, R.; Draguns, K.; Atvars, A.; Alnis, A.; Coy, E.; Iatsunskyi, I. Whispering gallery mode resonators covered by a ZnO nanolayer. Optik 2020, 219, 165296. [Google Scholar] [CrossRef]
- Oxborrow, M. Traceable 2-D Finite-Element Simulation of the Whispering-Gallery Modes of Axisymmetric Electromagnetic Resonators. IEEE Transactions on Microwave Theory and Techniques 2007, 55, 1209–1218. [Google Scholar] [CrossRef]
- Milanović, B.; Radjenović, B.; Radmilović-Radjenović, M. Three-dimensional finite-element modeling of optical microring resonators. Physica Scripta 2012, T149, 014026. [Google Scholar] [CrossRef]
- Kaplan, A.; Tomes, M.; Carmon, T.; Kozlov, M.; Cohen, O.; Bartal, G.; Schwefel, H.G.L. Finite element simulation of a perturbed axial-symmetric whispering-gallery mode and its use for intensity enhancement with a nanoparticle coupled to a microtoroid. Optics Express 2013, 21, 14169–80, [1305.0555]. [Google Scholar] [CrossRef]
- Oraevsky, A.N. Whispering-gallery waves. Quantum Electronics 2002, 32, 377–400. [Google Scholar] [CrossRef]
- Lam, C.C.; Leung, P.T.; Young, K. Explicit asymptotic formulas for the positions, widths, and strengths of resonances in Mie scattering. Journal of the Optical Society of America B 1992, 9, 1585. [Google Scholar] [CrossRef]
- Yang, S.; Wang, Y.; Sun, H. Advances and Prospects for Whispering Gallery Mode Microcavities. Advanced Optical Materials 2015, 3, 1136–1162. [Google Scholar] [CrossRef]
- Saleh, B.E.A.; Teich, M.C. Fundamentals of Photonics, 2nd ed.; John Wiley & Sons, Inc., 2007.
- Demtroder, W. Atoms, Molecules and Photons. An introduction to Atomic-, Molecular- and Quantum Physics; Springer, 2010.
- Atvars, A. Analytical description of resonances in Fabry–Perot and whispering gallery mode resonators. Journal of the Optical Society of America B 2021, 38, 3116. [Google Scholar] [CrossRef]
- Matsko, A.B.; Savchenkov, A.A.; Strekalov, D.; Ilchenko, V.S.; Maleki, L. Review of Applications of Whispering-Gallery Mode Resonators in Photonics and Nonlinear Optics. IPN Progress Report 2005, 42, 1–51. [Google Scholar]
- Reinis, P.K.; Milgrave, L.; Draguns, K.; Brice, I.; Alnis, J.; Atvars, A. High-Sensitivity Whispering Gallery Mode Humidity Sensor Based on Glycerol Microdroplet Volumetric Expansion. Sensors 2021, 21, 1746. [Google Scholar] [CrossRef] [PubMed]
- Gorodetsky, M.L.; Ilchenko, V.S. Optical microsphere resonators: optimal coupling to high-Q whispering gallery modes. Journal of the Optical Society of America B 1999, 16, 147. [Google Scholar] [CrossRef]
- Pongruengkiat, W.; Pechprasarn, S. Whispering-Gallery Mode Resonators for Detecting Cancer. Sensors 2017, 17, 2095. [Google Scholar] [CrossRef] [PubMed]
- Braunfelds, J.; Murnieks, R.; Salgals, T.; Brice, I.; Sharashidze, T.; Lyashuk, I.; Ostrovskis, A.; Spolitis, S.; Alnis, J.; Porins, J.; et al. Frequency comb generation in WGM microsphere based generators for telecommunication applications. Quantum Electronics 2020, 50, 1043–1049. [Google Scholar] [CrossRef]
- Wang, Y.; Li, H.; Zhao, L.; Liu, Y.; Liu, S.; Yang, J. Tapered optical fiber waveguide coupling to whispering gallery modes of liquid crystal microdroplet for thermal sensing application. Optics Express 2017, 25, 918. [Google Scholar] [CrossRef]
- Cai, M.; Painter, O.; Vahala, K.J. Observation of Critical Coupling in a Fiber Taper to a Silica-Microsphere Whispering-Gallery Mode System. Physical Review Letters 2000, 85, 74–77. [Google Scholar] [CrossRef]
- Arnold, S.; Khoshsima, M.; Teraoka, I.; Holler, S.; Vollmer, F. Shift of whispering-gallery modes in microspheres by protein adsorption. Optics Letters 2003, 28, 272. [Google Scholar] [CrossRef] [PubMed]
- Amendola, V.; Pilot, R.; Frasconi, M.; Maragò, O.M.; Iatì, M.A. Surface plasmon resonance in gold nanoparticles: a review. Journal of Physics: Condensed Matter 2017, 29, 203002. [Google Scholar] [CrossRef] [PubMed]
- Gaathon, O.; Culic-Viskota, J.; Mihnev, M.; Teraoka, I.; Arnold, S. Enhancing sensitivity of a whispering gallery mode biosensor by subwavelength confinement. Applied Physics Letters 2006, 89, 87–90. [Google Scholar] [CrossRef]
- Teraoka, I.; Arnold, S. Enhancing the sensitivity of a whispering-gallery mode microsphere sensor by a high-refractive-index surface layer. Journal of the Optical Society of America B 2006, 23, 1434. [Google Scholar] [CrossRef]
- Zhang, X.; Qiu, J.; Li, X.; Zhao, J.; Liu, L. Complex refractive indices measurements of polymers in visible and near-infrared bands. Applied Optics 2020, 59, 2337. [Google Scholar] [CrossRef]
- Aguilar, O.; de Castro, S.; Godoy, M.P.F.; Rebello Sousa Dias, M. Optoelectronic characterization of Zn 1-x Cd x O thin films as an alternative to photonic crystals in organic solar cells. Optical Materials Express 2019, 9, 3638. [Google Scholar] [CrossRef]
- Sjodin, B. How to Generate Random Surfaces in COMSOL Multiphysics. https://www.comsol.com/blogs/how-to-generate-random-surfaces-in-comsol-multiphysics/, 2017.
Figure 1.
Coupling light inside WGMR: (a) Free space coupling of light and resonator when the wave touches the side of the WGMR. (b) Prism coupled resonator, WGMR is located at the region where the wave is reflected due to total internal reflection from the surface of the prism. (c) Tapered fiber coupled WGMR.
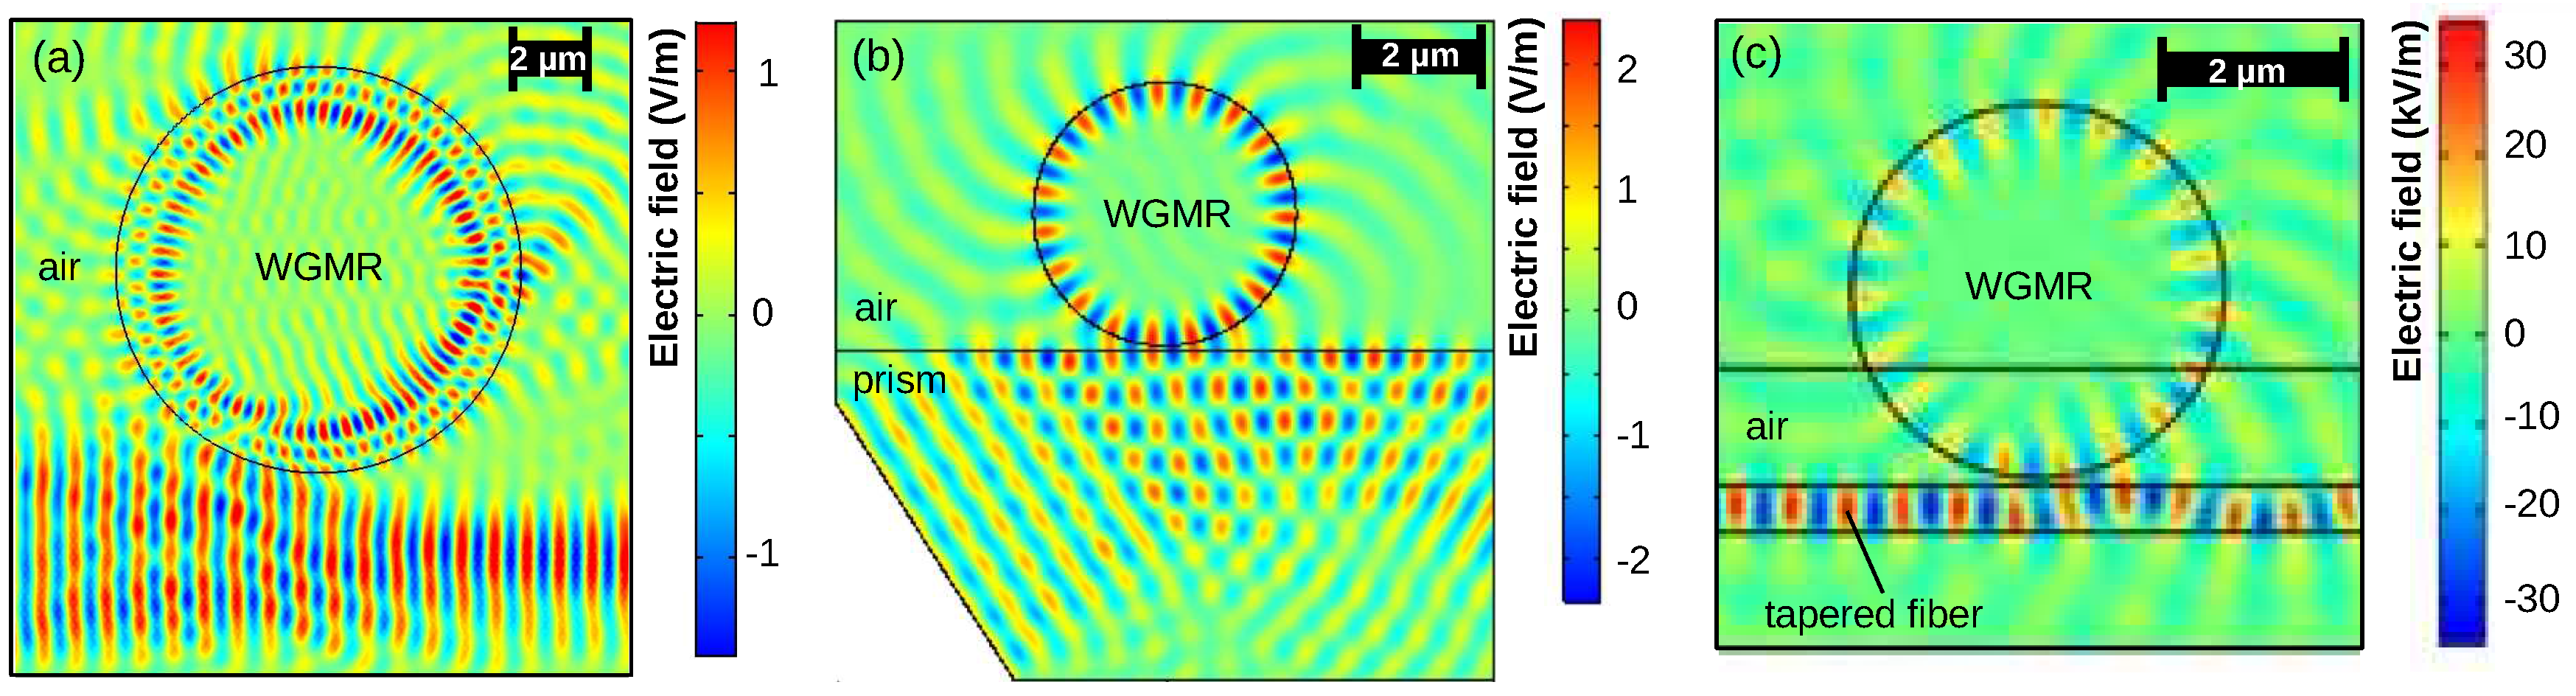
Figure 2.
Coupling parameters: (a) Resonances spectra of prism coupled cylindrical resonators for various gap values between prism and resonator. The gap is determined as , g values are given in the label of figure, and = 780 nm. (b) The energy density time average of a resonance is dependent on the gap between the prism and the resonator. The critical coupling is achieved when . (c) The resonance peak is when the incident angle of the irradiated light is changed (), and the gap between the prism and resonator is changed. (d) Resonance peaks as dependent on the width of the fiber. Curve 1 (Blue line) – energy density time average of the resonator. Curve 2 (Green line) – transmitted energy density through the fiber.
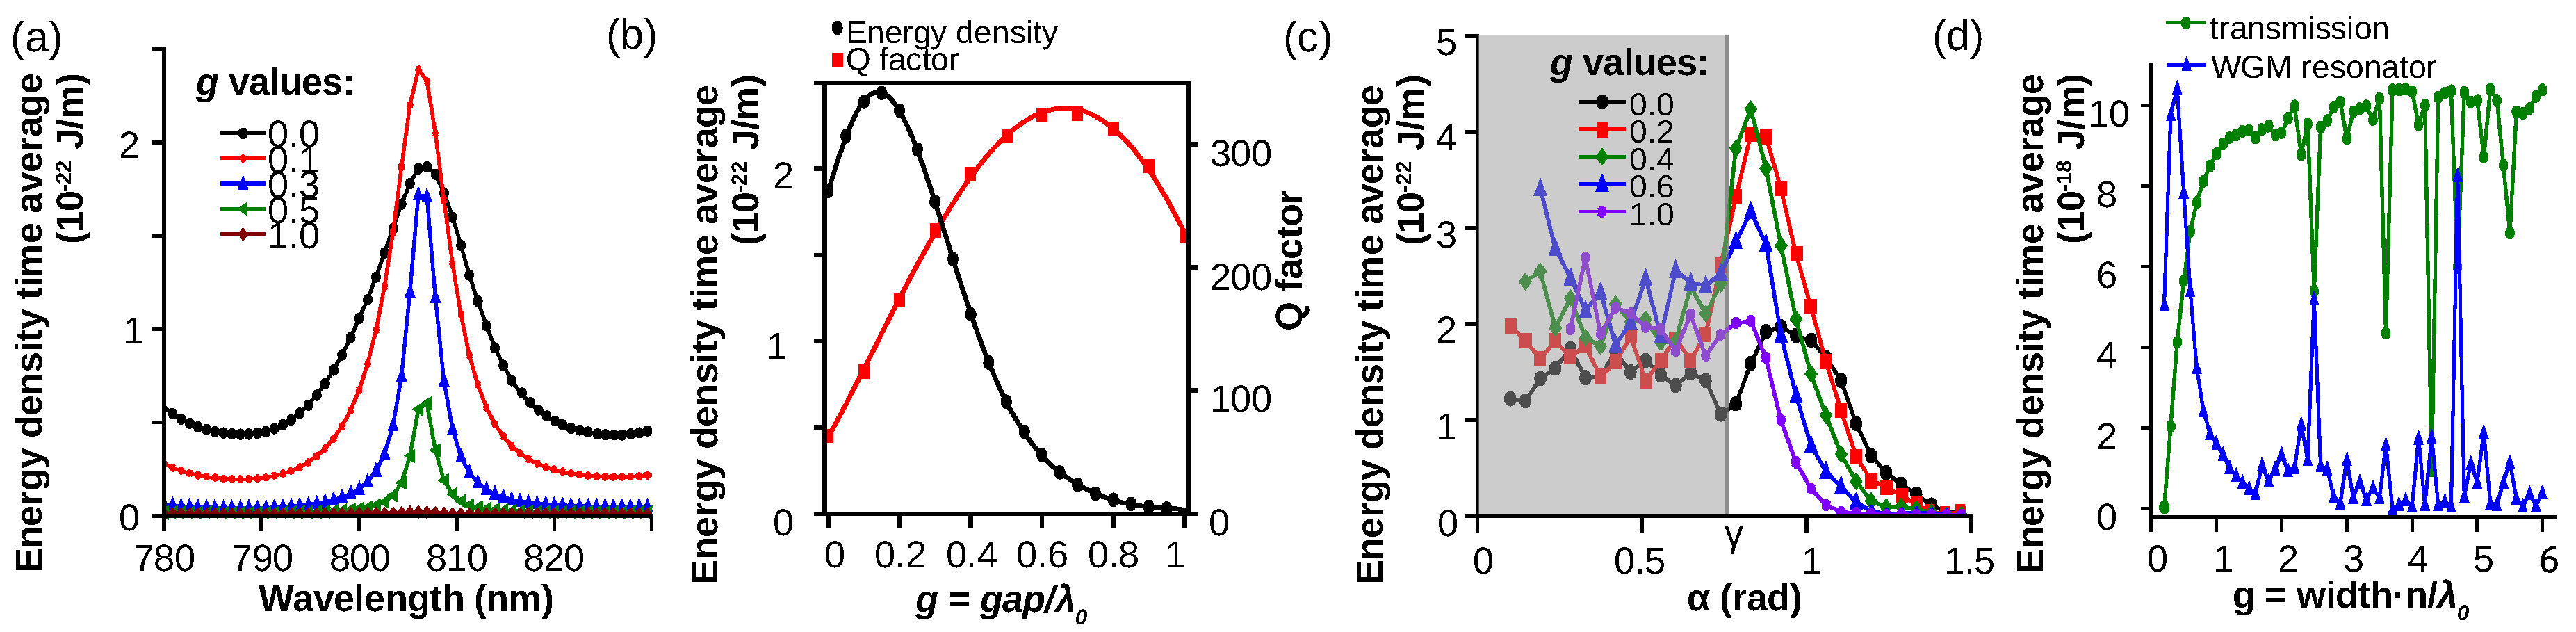
Figure 3.
Modelling bio-sensing using WGMRs: Small elements attached to the surface of the WGMR to model bio-molecules and other particles attaching to the surface: (a) Field distribution in prism coupled resonator (R = 2.0 µm) with five "bio-molecules" (R = 0.1 µm) attached to the surface. (b) Field distribution in tapered fiber coupled resonator (R = 6.0 µm) with four "particles" (R = 0.5 µm) attached to the surface. (c) Field distribution in tapered fiber coupled resonator (R = 6.0 µm) with four different sizes irregularly shaped "particles". Comparison of WGM resonance spectra for 0–4 (d) round dust (e) irregularly shaped dust and (f) round gold particles attaching to the surface of the resonator. Insets show the corresponding WGM resonance position red-shift for dust and blue-shift for gold as more particles attach to the surface, while the Q factor decreases similarly for all particles.
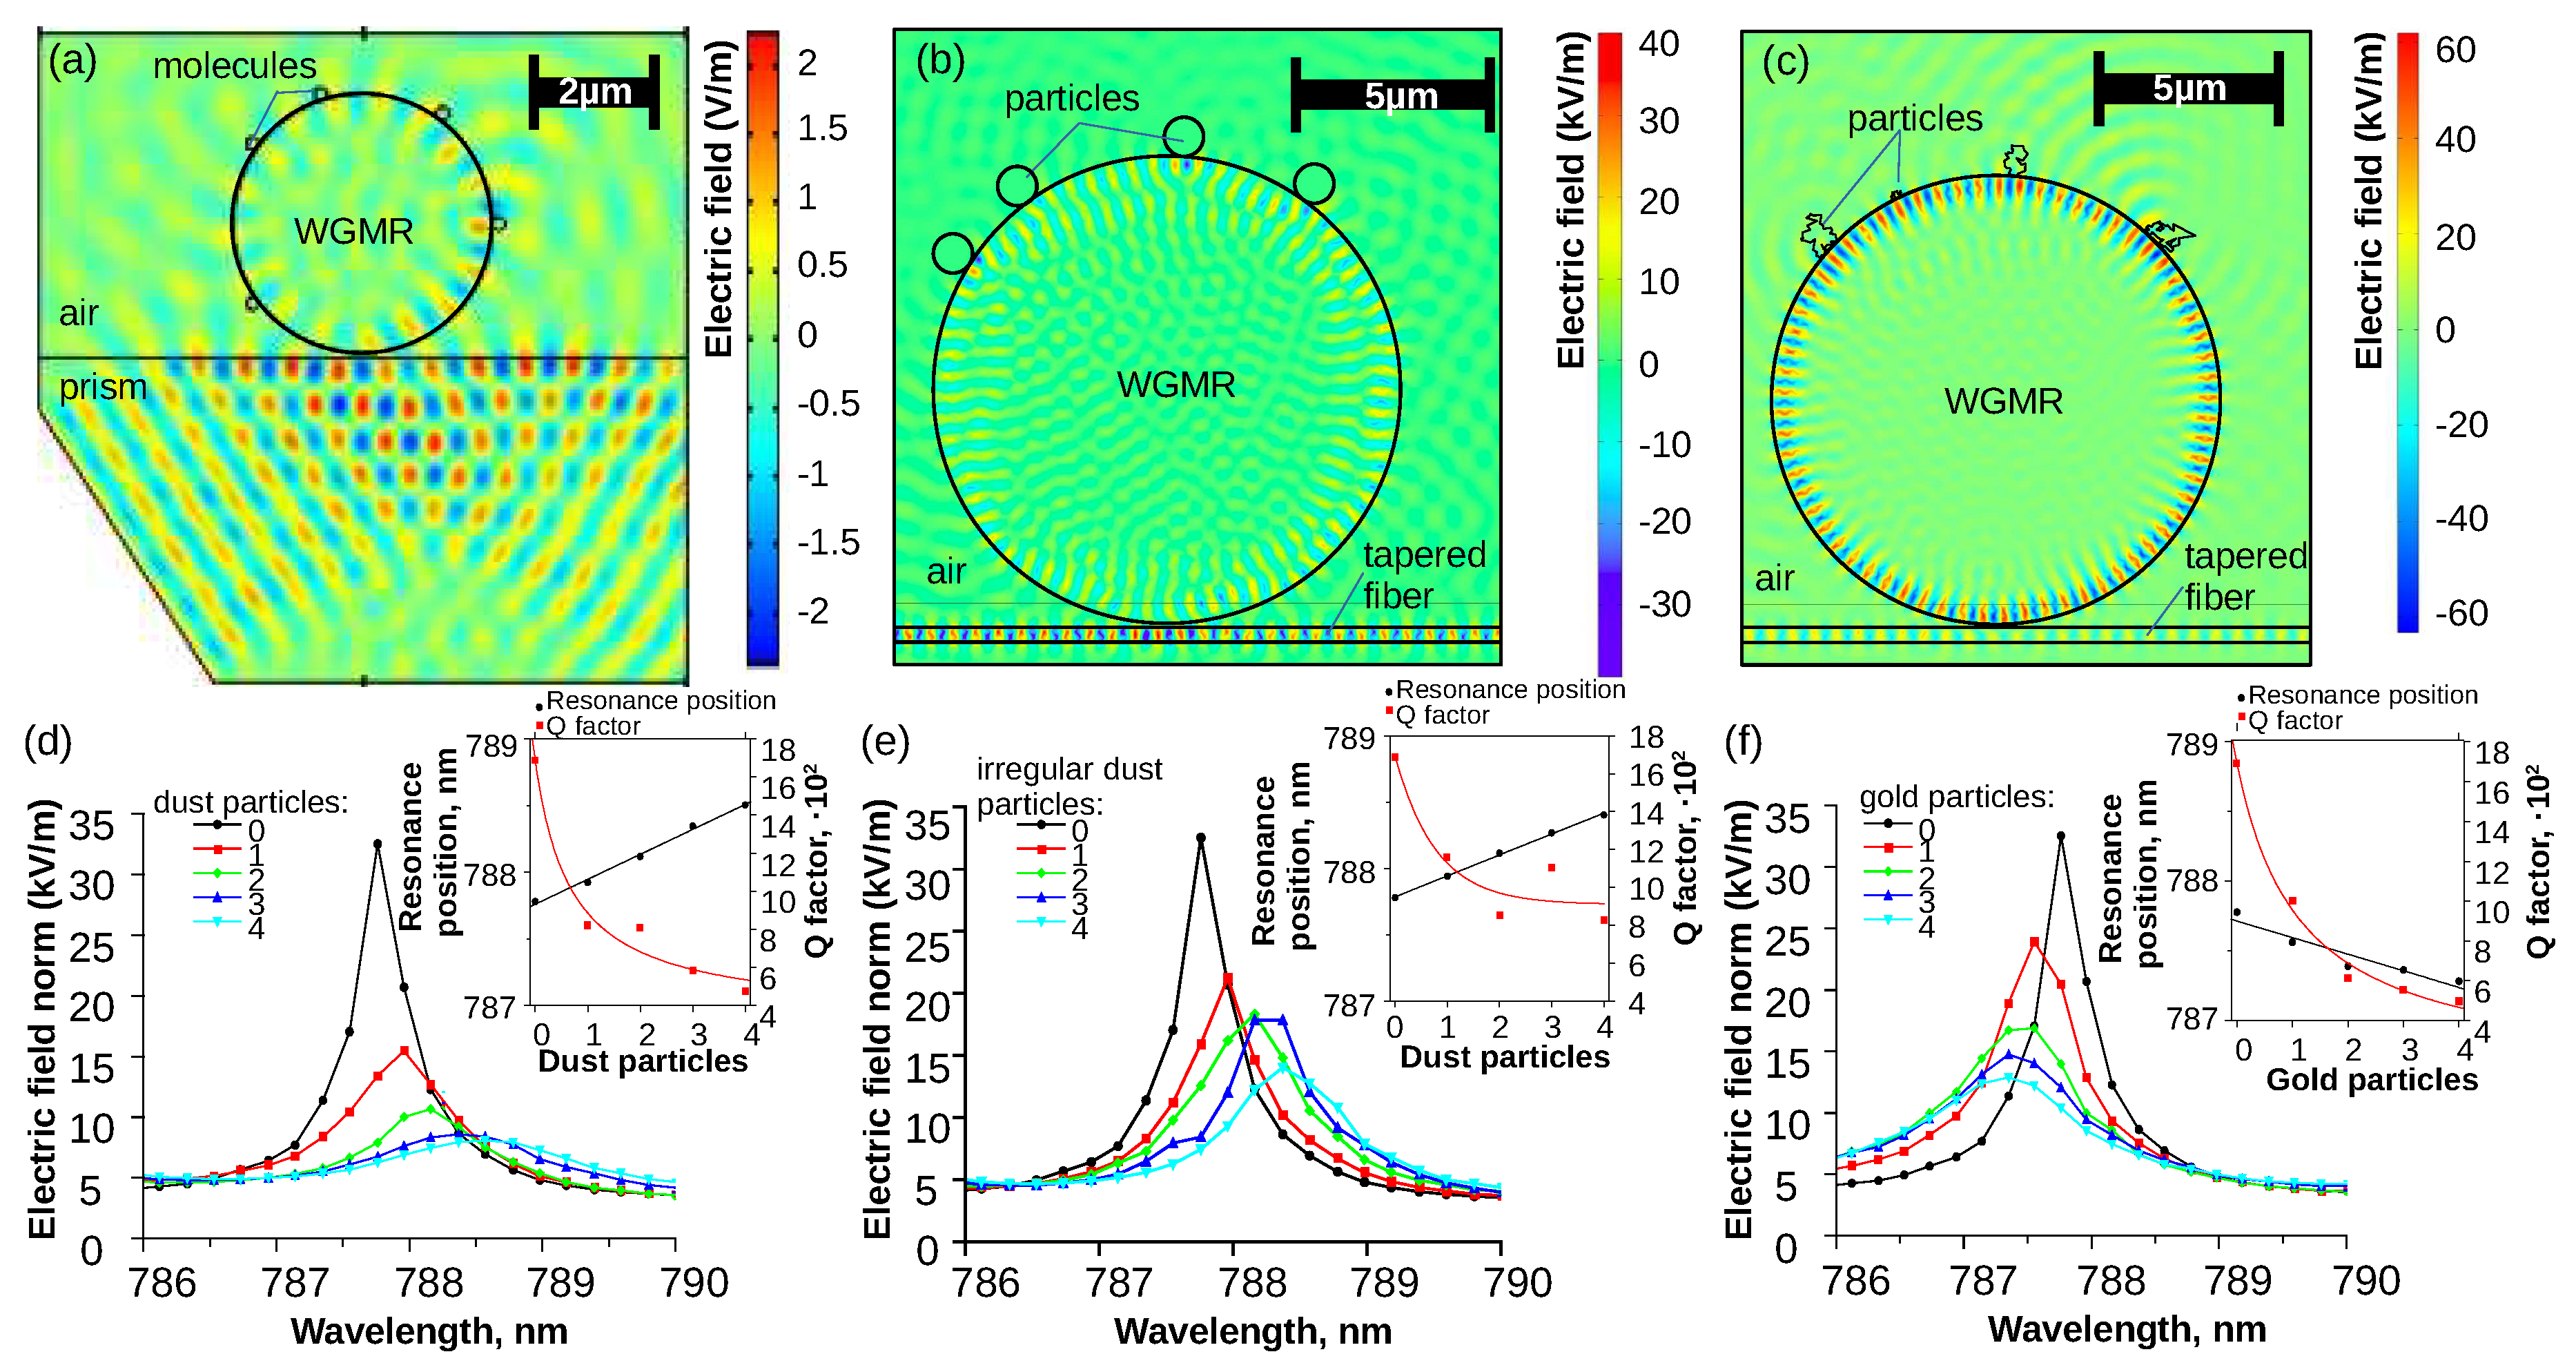
Figure 4.
Modelling surface functionalization of the WGMRs: Electric field norm in R = 5 µm resonator coated with rough 100 nm PMMA layer with roughness parameter (a) = 3.7 nm, (b) = 9.1 nm, (c) = 17.3 nm. Comparison of electric field norm in (d) bare fused silica resonator with rough surface and (e) coated with 100 nm rough PMMA layer, their comparison of (f) resonance position shift and (g) Q factor degradation from roughness. (h) Electric field norm in resonator coated with 100 nm rough ZnO layer.
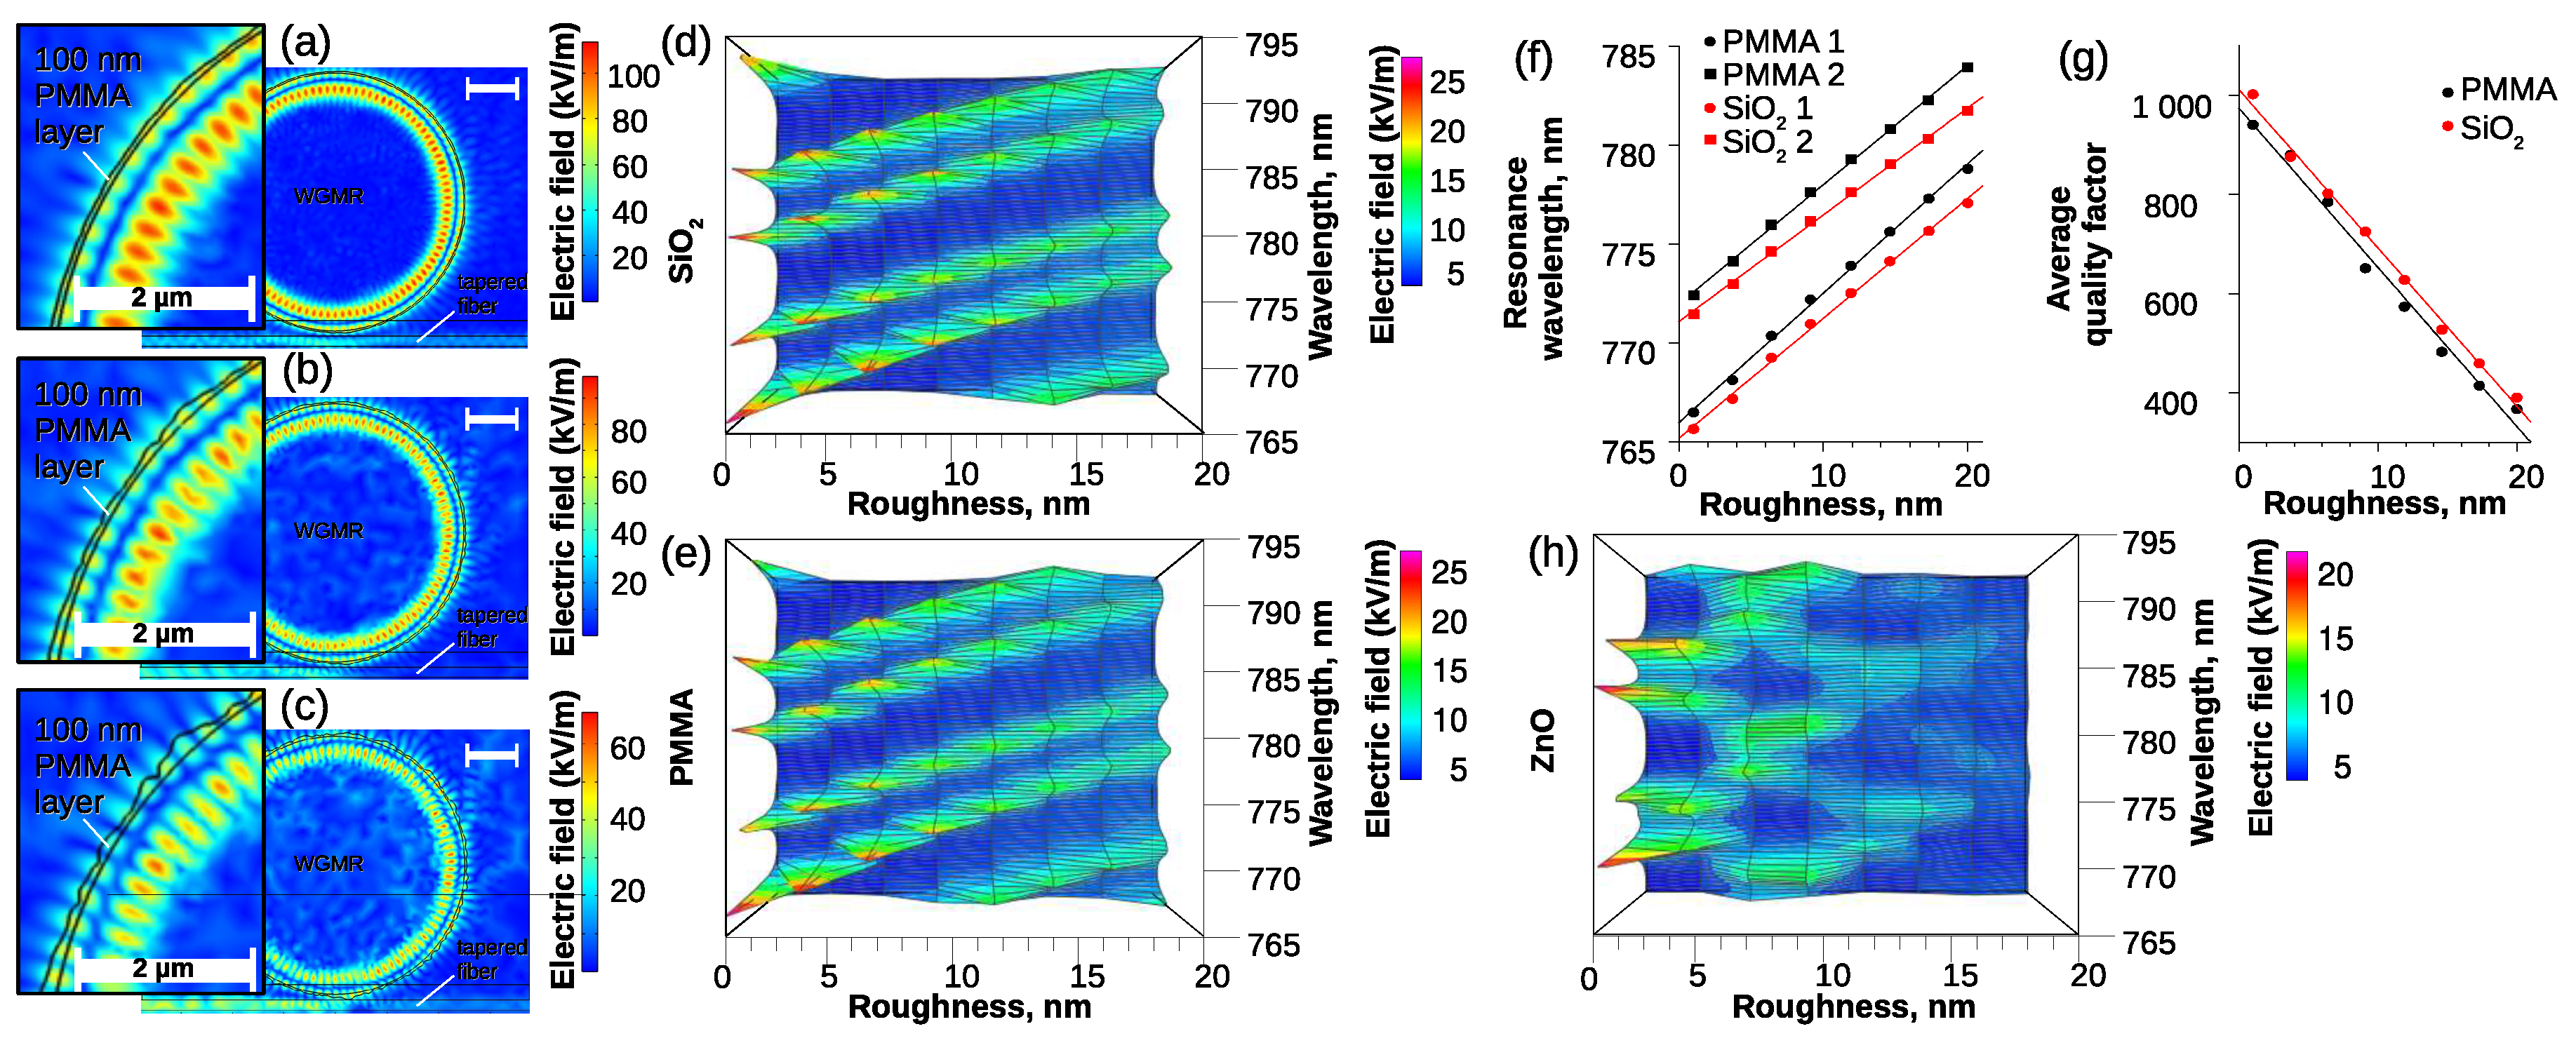

Table 1.
Parameter values for fused silica WGMR sphere with n = 1.4537 for the mode search in 780 nm region for COMSOL.
Table 1.
Parameter values for fused silica WGMR sphere with n = 1.4537 for the mode search in 780 nm region for COMSOL.
| r, µm | Mode | , nm | , THz | m |
|---|---|---|---|---|
| 2 | TE | 791.7 | 378.7 | 19 |
| 2 | TE | 756.1 | 396.5 | 20 |
| 2 | TM | 804.3 | 372.7 | 18 |
| 2 | TM | 767.5 | 390.6 | 19 |
| 20 | TE | 782.8 | 383.0 | 223 |
| 20 | TE | 779.4 | 384.7 | 224 |
| 20 | TM | 780.3 | 384.2 | 223 |
| 20 | TM | 777.0 | 385.9 | 224 |
| 200 | TE | 780.1 | 384.3 | 2318 |
| 200 | TE | 779.8 | 384.5 | 2319 |
| 200 | TM | 780.2 | 384.3 | 2317 |
| 200 | TM | 779.9 | 384.4 | 2318 |
Disclaimer/Publisher’s Note: The statements, opinions and data contained in all publications are solely those of the individual author(s) and contributor(s) and not of MDPI and/or the editor(s). MDPI and/or the editor(s) disclaim responsibility for any injury to people or property resulting from any ideas, methods, instructions or products referred to in the content. |
© 2024 by the authors. Licensee MDPI, Basel, Switzerland. This article is an open access article distributed under the terms and conditions of the Creative Commons Attribution (CC BY) license (http://creativecommons.org/licenses/by/4.0/).
Copyright: This open access article is published under a Creative Commons CC BY 4.0 license, which permit the free download, distribution, and reuse, provided that the author and preprint are cited in any reuse.


