Submitted:
13 January 2024
Posted:
15 January 2024
You are already at the latest version
Abstract
Background: the Investigator ESSplex SE QS Kit (Qiagen) is a next generation PCR kit that, in 60 minutes, amplifies 17 STRs markers, including the 5 European Standard Set (ESS) loci, the SE33 marker and the locus Amelogenin for sex determination. Two Quality Sensors (QS1 and QS2) are co-amplified to check PCR performance. Since forensic laboratories carry out annually hundreds of DNA typing, we verified the kit performance using half reaction volumes with the aim to improve the number of samples that may amplified with a kit, reducing consequently the laboratory costs.
Methods: in the study, that is intended as a technical note and not an internal validation, were analyzed control samples (oral swabs) with known DNA profiles and 40 real caseworks samples.
Results: we observed that reducing the total reaction volume, while keeping unaltered all components ratio’s, yields DNA profiles comparable to the ones obtained using standard reaction volumes and with alleles peaks higher than with standard volumes..
Conclusions: the use of half volumes for PCR amplification allows the analysis of a wider number of samples than the standard protocol, reducing laboratory costs while maintaining unaltered the quality level of the analysis.
Keywords:
ESSplexQS
; STR multiplex
; half reaction volumes
1. Introduction
STRs are the first-choice markers for human identification and paternity tests because of their features and the good polymorphism degree. The ability to amplify multiple STR markers using fluorescent-labelled PCR primers together with automated laser detection increases the amount of information collected from a sample, reduces the DNA quantity necessary to obtain results and labour-time and costs, because multiple loci are analyzed simultaneously in the same assay. [1]
Over the years, commercial multiplexes were initially designed to amplify only a few STR loci, and later, they expanded to include all 13 markers from the CODIS database. [2,3]
After the Treaty of Prüm (2009), it was decided to expand the 12 European Standard Set (ESS) markers including 5 new core loci in order to favor the amplification of degraded DNA sample.
In 2012, in the USA, the FBI proposed the expansion of CODIS core loci to 20 markers to increase international compatibility and discrimination power. [4] In order to simultaneously amplify European and USA core loci, new commercial multiplexes able to amplify up to 27 markers were introduced. These PCR kits are now commonly used in forensic laboratories due to their high discriminatory power and ease of use, facilitated by the inclusion of all reagents required for PCR amplifications (reaction buffer with Polymerase, Primer Mix, Positive Controls, Allelic Ladder). Additionally, they have improved chemistry capable of overcoming inhibitors generally found in forensic samples. [5,6]
As forensic laboratories conduct hundreds of DNA tests annually, it has become common to use reduced PCR reaction volumes, which are verified in-house, as demonstrated by several publications [7,8,9,10,11]. In our previous papers, we focused on testing the suitability of other commonly used forensic multiplexes for PCR amplification of forensic samples using half reaction volumes. [12,13] In the present study, intended as a technical note and not as internal validation, we verified the performance of the Investigator ESSplex QS on control samples and casework samples, using half of the standard prescribed reaction volumes. The aim was to improve the number of samples that may be amplified with a kit, consequently reducing analysis costs. The QIAGEN Kit is one of the new generation PCR kits designed for forensic and paternity applications. It utilizes fast-cycling technology that allows simultaneous amplification of the following 16 STR markers in just 1 hour: D1S1656, D2S1338, D2S441, D3S1358, D10S1248, D8S1179, D12S391, D18S51, D16S539, D19S433, D21S11, FGA, D22S1045, TH01, vWA, SE33, and the locus Amelogenin for sex determination. [14,15] The kit co-amplifies two Quality Sensors named QS1 (71bp) and QS2 (435bp), which act as internal PCR controls providing information about PCR efficiency, the presence of PCR inhibitors, and the DNA degradation status.
2. Materials and Methods
2.1. Male Control DNA 9948 analysis
According to the Manufacturer protocol, a DNA input of 0,5 ng is recommended for the amplification at regular volumes. To evaluate if this is the right quantity also using half PCR volumes, we amplified, with regular and half PCR reaction volumes, 0.1ng, 0,5ng, 1 ng. of the Male Control DNA 9948 (0.1 ng/µL), available in the kit.
2.2. Samples analysis
2.2.1. Control samples
Saliva samples were collected using sterile oral swabs (FLOQSwabs, Copan) from four unrelated volunteers (2 men + 2 women) with known DNA profiles. Collection was performed at controlled environmental conditions (25°C), and then oral swabs were stored at 4°C for 1 day until their use.
2.2.2. Forensic samples
Forty forensic samples were selected to represent a wide range of forensic samples:10 bloodstains (white cotton, blue denim, white paper, black wool, wooden stick, plastic cover, knife blade, leather, marble floor, FTA card), 5 semen stains (pink cotton, blue denim, beige cotton, toilet paper, condom), 8 saliva stains (water bottle neck, black balaclava, white plastic cup, white tissue, FTA card, cigarette butt, chewing gum, toothbrush), 7 contact traces (laptop keyboard, car wheel, knife handle, gun trigger, bullet, eyeglass temples, door handle),3 femurs (time elapsed between death and sample collection: 1 year, 5 years, and 10 years), 2 teeth (1 year and 5 years molars), 1 paraffin-embedded tissue, 2 anagen hairs with roots, and 2 vaginal swabs. After collection, all samples were stored at 4°C for 1 week.
2.2.2.1. Forensic samples pre-processing
Biological stains on porous surfaces: a fragment of the stain (3x3 mm) was cut.
Biological stains on non-porous surfaces: the stain was collected using a sterile swab.
Bones and teeth were washed with distilled water, 80% ethanol, 5% hypochlorite, and, after drying, powdered in liquid nitrogen using a using a cryogenic mill. They were then decalcified in 0.5 mol/L ethylenediaminetetraacetic acid (EDTA) for 5 days. [17] Remains collected after 10 years were interred in coffins within the cemetery grounds, and femurs gathered after 1 and 5 years were placed in a burial niche wall.
2.2.2. Informed consent and ethical aspects
Control samples and forensic samples were taken with previously obtained informed consent signed by the donor’s or by strict authorized relatives, according to Italian Law D.Lgs. 196/2003, and approved by SIMEF laboratory procedures. By signing the informed consent, the person authorized that laboratory, when finished the requested analysis, to use a part of the remaining sample for research studies, unless otherwise indicated. According to the internal laboratory procedures, each sample was classified by a unique alpha-numeric code “00-N that was used in all analytical steps for identifying the sample. This allowed to guarantee the anonymity, safeguarding the donors’ privacy.
2.3. DNA extraction
All samples were extracted using the EZ1 Advanced XL (QIAGEN) according to the Manufacturer protocol, using the Trace protocol. Bones were extracted using the modified protocol developed by the Authors and previously published [17] Positive (known sample) and negative controls were included.
2.4. DNA quantification
DNA extracted from oral swabs and casework samples was quantified with the QIAGEN Kit which also allows estimating the presence of inhibitors eventually co-extracted in the sample and the DNA degradation status. Data obtained were analyzed by the Q-Rex software together with the Quant Assay Data Handling Tool according to the Manufacturer protocol. Positive (DNA sample at a known quantity) and negative quantification controls were included to verify the efficiency of the method.
2.5. DNA amplification and typing
PCR amplification of all samples was carried out using either the standard protocol recommended by the Manufacturer (PCR total reaction volume of 25 μL containing 7.5 μL Master Mix, 2.5 μL Primer Mix, variable volume Grade Water, and template DNA) or half reaction volume, maintaining unaltered the volume ratio of each PCR component (PCR total reaction volume of 12.5 μL containing 3.75 μL Master Mix, 1.25 μL Primer Mix, variable volume Grade Water, and template DNA). The amount of DNA used for PCR amplification (with regular and half volumes) of oral swabs and casework samples, was 0.5 ng, according to the Manufacturer protocol [20] and sensitivity test results (see 3.1). The amplification wasperformed using a GeneAmp® PCR System 9700 thermal cycler (Applied Biosystems - Life Technologies), at the following conditions: 3 cycles (98°C for 30s + 64°C for 55s, 72°C for 5s) + 27 cycles (96°C for 10s, 61°C for 55s, 72°C for 5s) + 1 hold (68°C for 120s). [21] In addition, a negative control and the positive male Control DNA 9948 (0.1 ng/µL) were amplified. All samples were amplified in duplicate, according to the laboratory internal procedures, PCR products were detected by capillary electrophoresis using the sequencer ABI3130 Genetic Analyzer (Applied Biosystems – Life Technologies): the internal lane DNA standard BTO 550 was used for calibration. Allele assignment was done by comparison with the ESSplex SE QS Ladder using the GeneMapper ID 3.2 software (Applied Biosystems - Life Technologies). According to the internal laboratory guidelines, amplification was considered successful when DNA profiles showed the following characteristics: peaks height >100 relative fluorescence units (RFU), intra-locus peaks height ratio >70%, absence of extra peaks or artifacts (drop-in), absence of locus drop out or allelic drop-out.
3. Results and Discussion
3.1. Male Control DNA 9948 analysis
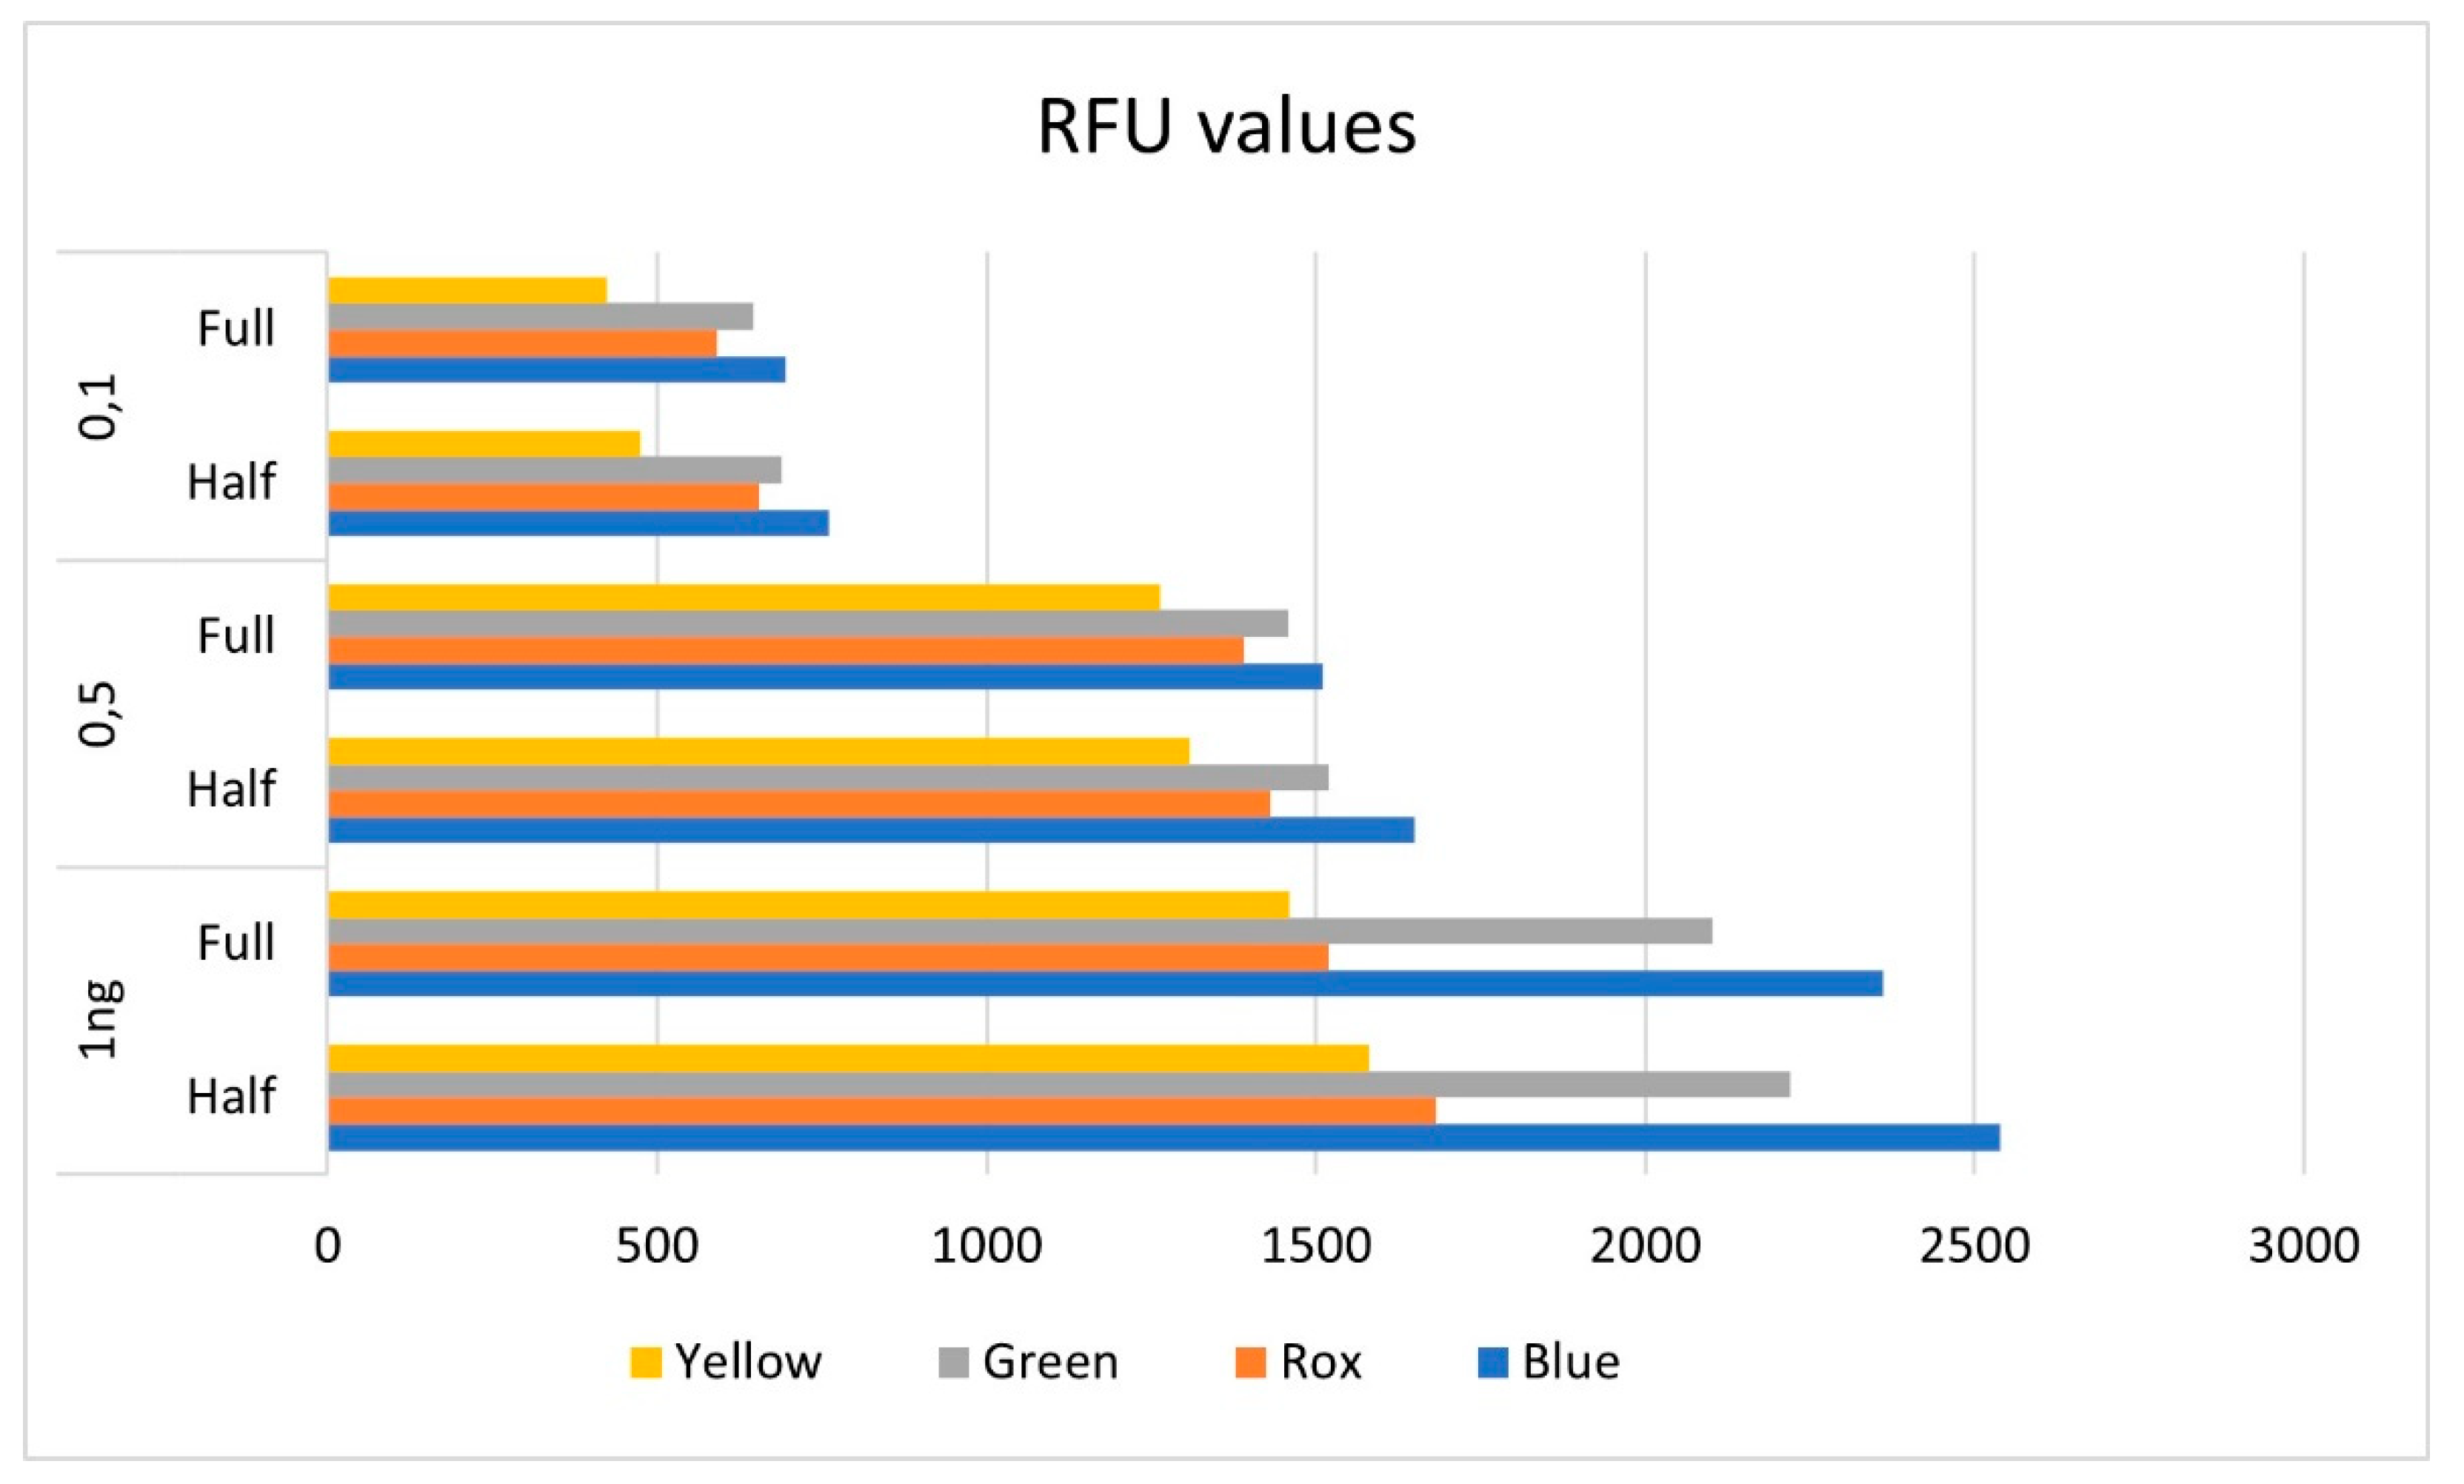
It’s well known that using too much DNA for PCR amplification may produce off-scale data and incomplete A-nucleotide addition, while extremely low quantity may result in unbalanced amplification According to Manufacturer developmental validation of the Investigator SE ESSplex, robust and balanced results may be obtained up to to 2 ng DNA using standard protocol. The DNA quantity recommended for PCR amplification is 0.5ng. [21]. In a first step of the present study the optimal DNA input amounts for PCR amplification at half volumes, was established using different quantity of Male Control DNA 9948 (0,1 ng, 0,5ng,1 ng).
Peak heights obtained with full and reduced PCR volumes were compared for each locus using the 100 RFU analytical threshold (Figure 1) Variation in RFU has been observed in the 4 dye channels depending on the DNA quantity. In general, it was observed amplification using reduced volumes produced higher peak heights for all loci.
Graf. 1: Average RFU values for each dye channel for different DNA quantity.
Graf.2: Average standard deviation (SD ±) for each dye channel for different DNA quantity.
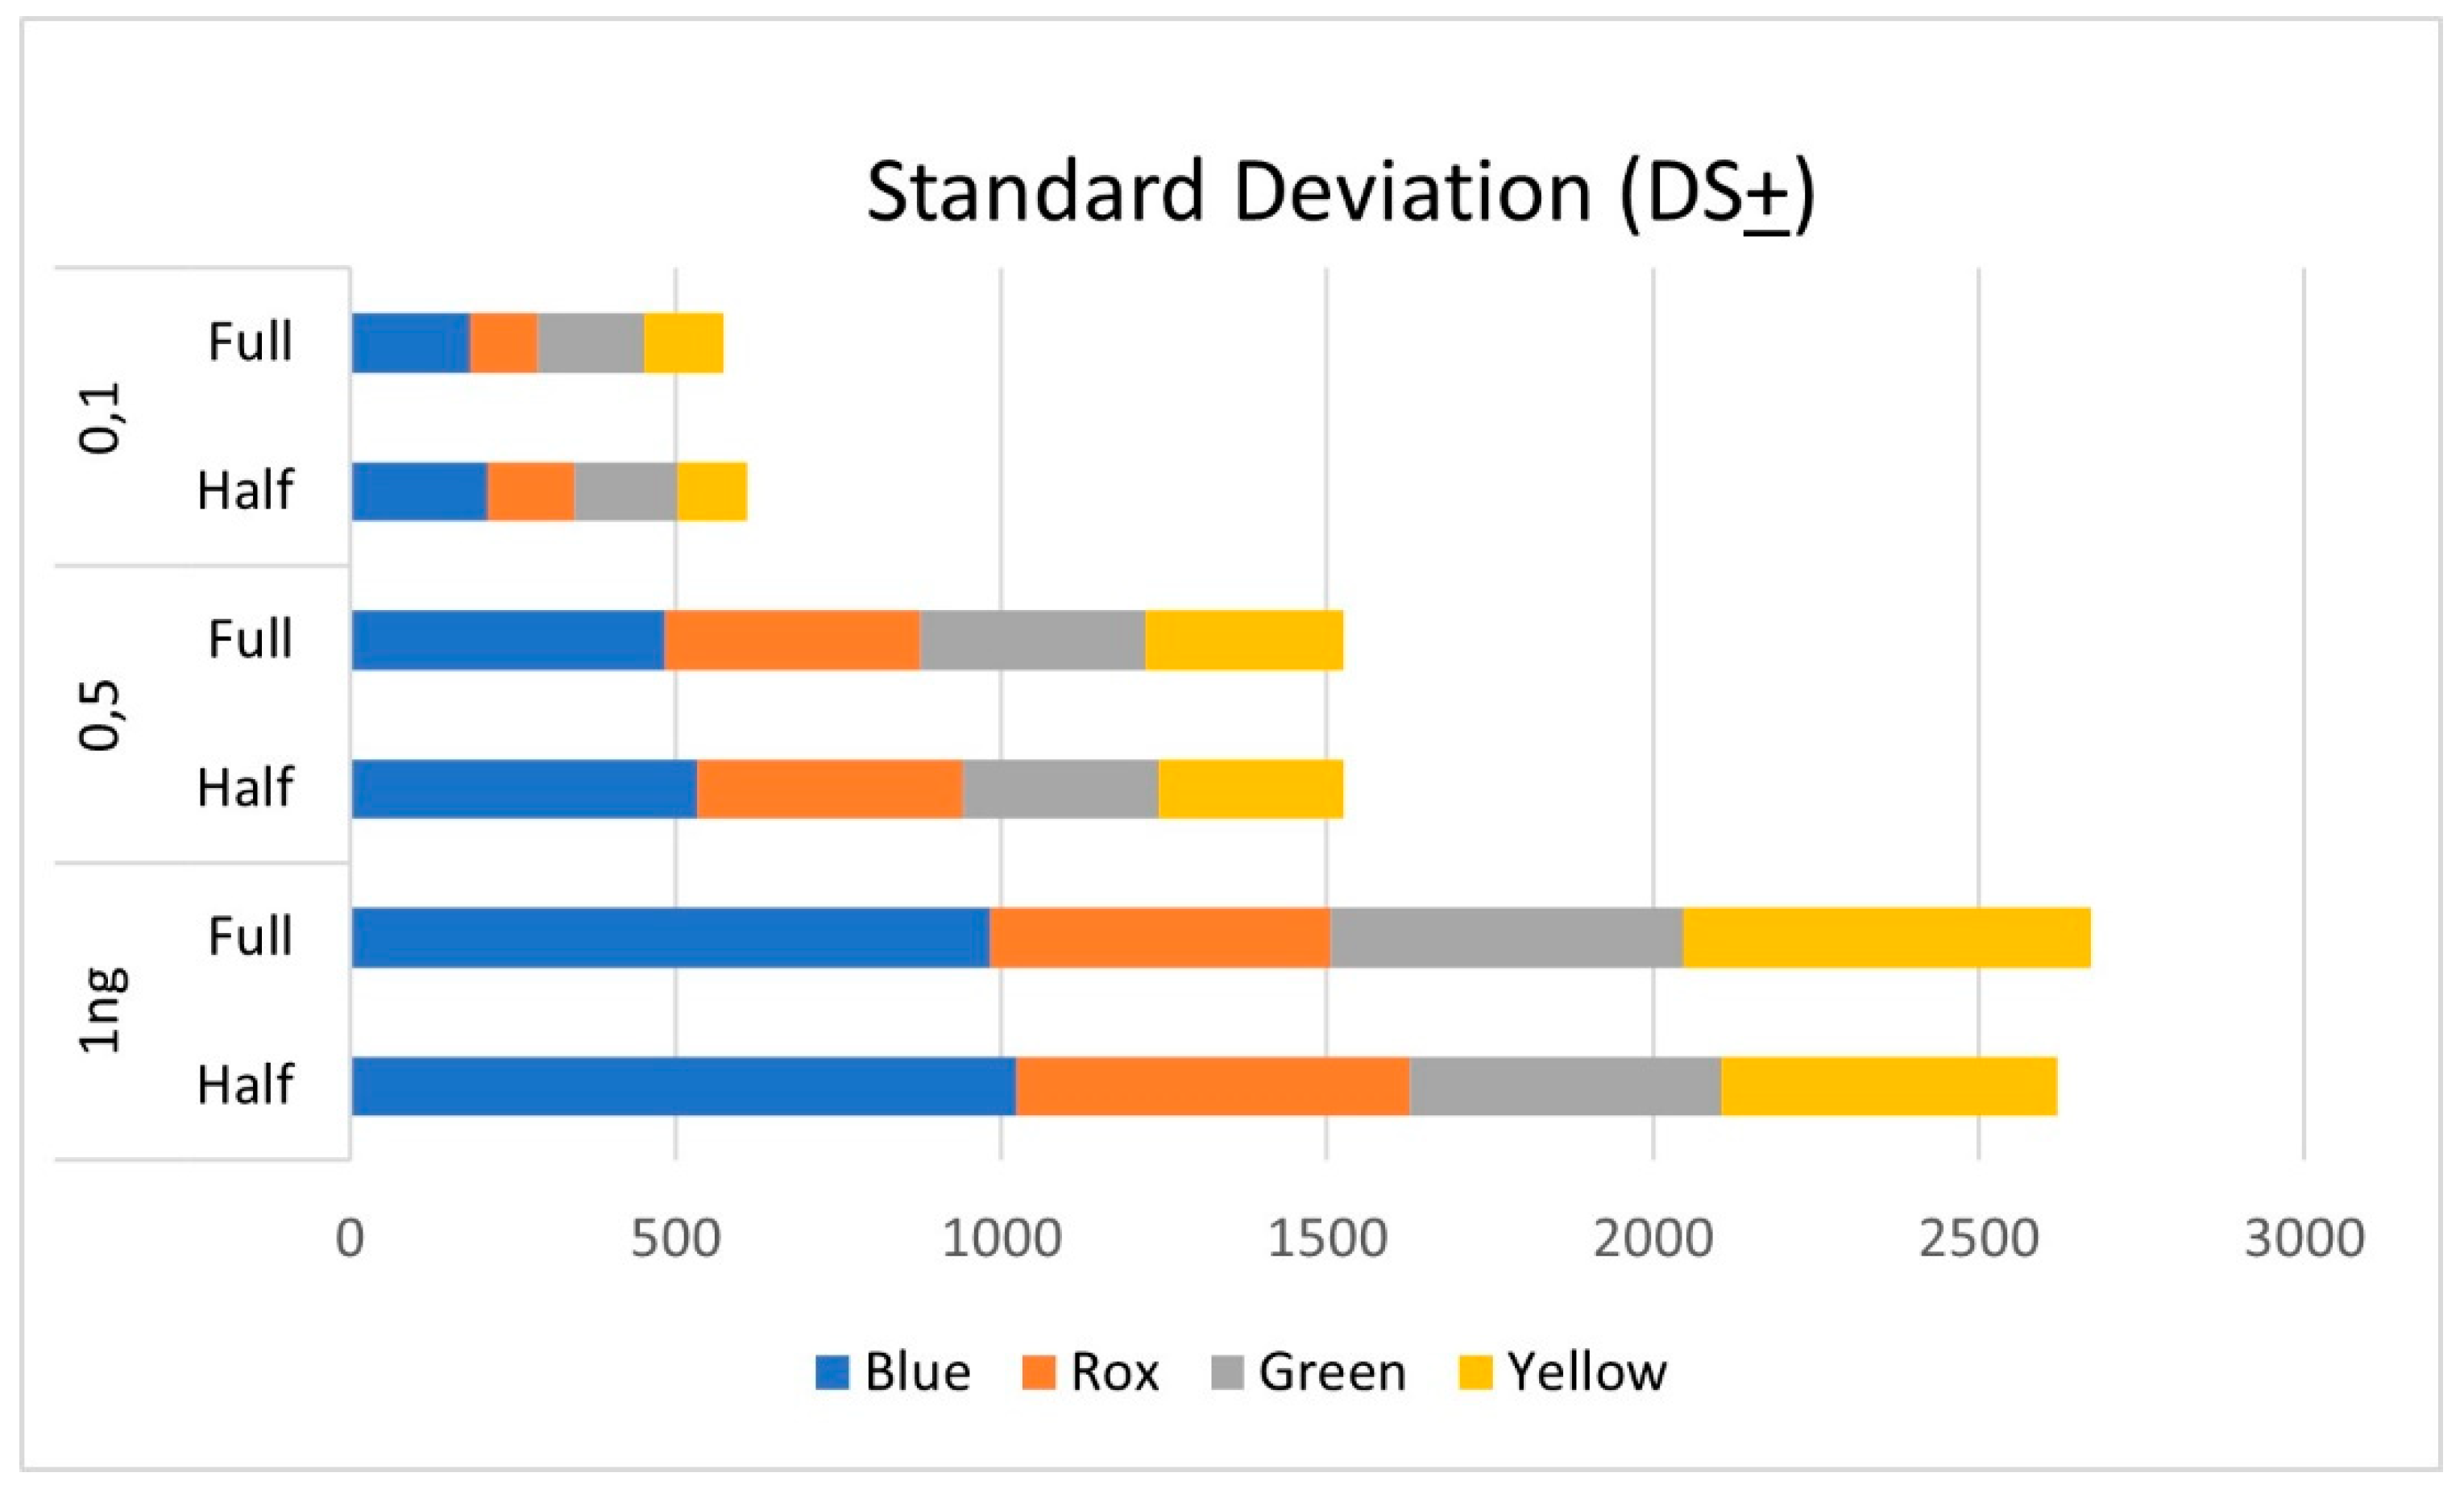
In our opinion and in accordance with the manufacturer developmental validation of the Investigator SE ESSplex, also using half reaction volumes, the DNA quantity of 0,5 ng represents the optimal amount to be used in terms of peaks heights, balance, low signal noise, this is accordance with the manufacturer developmental validation of the Investigator SE ESSplex kit [22].
In DNA analysis, concordance between duplicate samples is required for quality assurance of results.[23] In this case, alleles assignment by Genemapper software was identical in all duplicates, obtained either using regular than half volumes. (Figure 2). Per each locus, alleles calls were the same that the ones reported in the reference table included in the Investigator® ESSplex SE QS Handbook.[20]
3.2. Control samples
To evaluate the kit performance on good samples 4 oral swabs belonging to volunteers, with known DNA profiles, were analyzed. Real-time quantification using the DNA extracted from oral swabs showed that the DNA extraction protocol allowed for the recovery of DNA in high quantity/quality. Robust amplifications and full profiles were obtained using both standard PCR reaction volumes and half volumes. Balanced peaks were observed across all 17 loci. Amplification with half volumes resulted in higher peak heights. Alleles assignment, using a 100 RFU threshold, was identical and correct in both reactions and across all replicates (Figure 2). In all cases, DNA profiles matched the reference profile of the donor.
3.3. Forensic caseworks samples
Challenges in the analysis of casework samples arise from the wide array of biological samples, variations in sample amounts, the high heterogeneity of substrates containing samples, exposure to factors favoring DNA degradation (such as environmental conditions and microorganisms), and the presence of PCR inhibitors. All these factors may impact the quantity and quality of DNA recovered from forensic samples [21,24]. In the present study, 40 casework samples (bloodstains, vaginal swabs, semen stains, cigarette butts, saliva stains, contact traces, bones and teeth, hairs, tissues) were selected to represent real forensic samples found in different conditions.
Various strategies are employed in dealing with forensic samples: the selection of an effective DNA extraction method is crucial to remove inhibitors and maximize DNA recovery [25]. The use of new-generation Real-Time quantification kits and PCR multiplexes with robust chemistry and resistance to inhibitors allows for the accurate evaluation of DNA quantity/quality and STR detection, even in challenging samples [26,27]. In this study, to alleviate issues related to the DNA extraction step, we utilized the EZ1 automated DNA extraction protocols, known for their high efficiency in DNA extractions from a diverse range of casework samples [28,29].
Quantification is a crucial step in forensic sample analysis, providing essential information about the DNA available in unknown samples exposed to various conditions that may damage DNA. In this study, DNA extracted from casework samples was quantified in real-time using an alternative quantification kit: the EZ1 Quantiplex Pro RGQ Kit. In all samples, DNA extraction efficiently recovered enough DNA and removed PCR inhibitors. Quantification data analysis, using the Q-Rex software along with the Quant Assay Data Handling Tool, revealed a Mixture Index (MI)>2, indicating a Female/Male mixture for specific samples like bloodstain on white cotton, contact trace onto a laptop keyboard, door handle, vaginal swab, saliva onto a bottle neck, and a cigarette butt [5].
The quality of the DNA profile obtained using half PCR reaction volumes was evaluated in comparison with that resulting from regular volumes, considering the number of alleles detected (drop-in or drop-out), peak height, stutter ratio, intra/inter locus balance, and inhibitor tolerance.
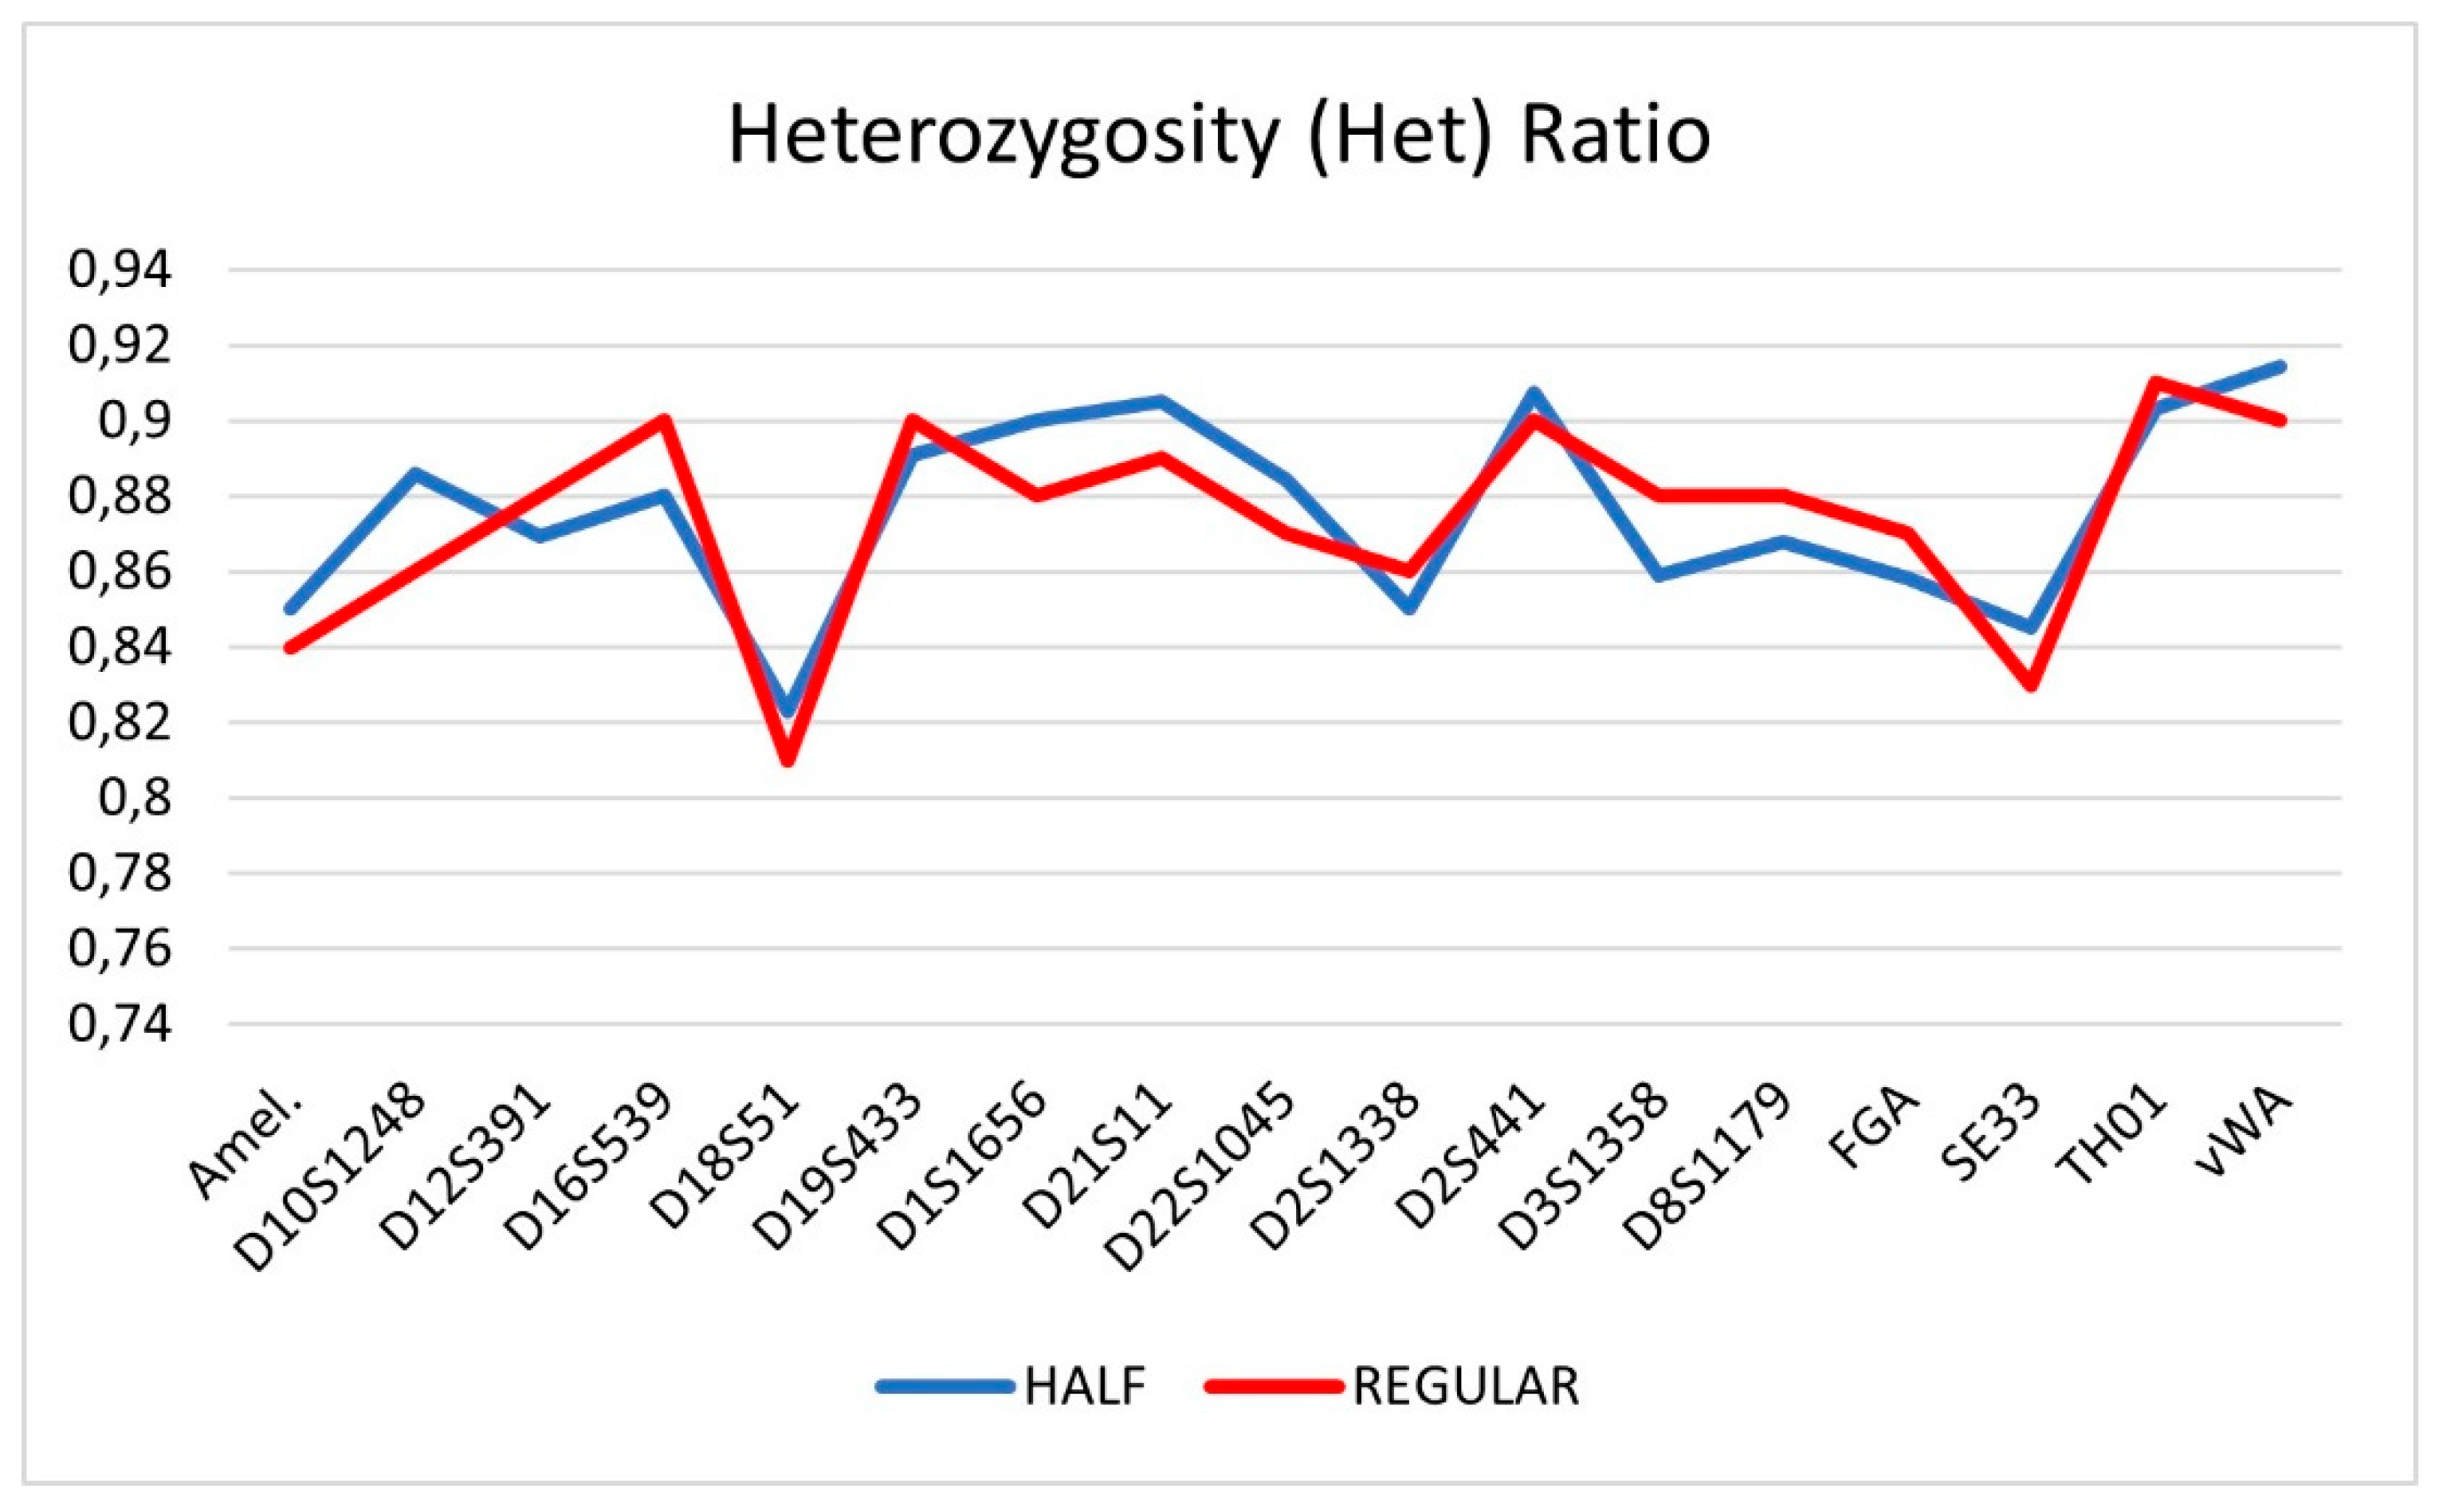
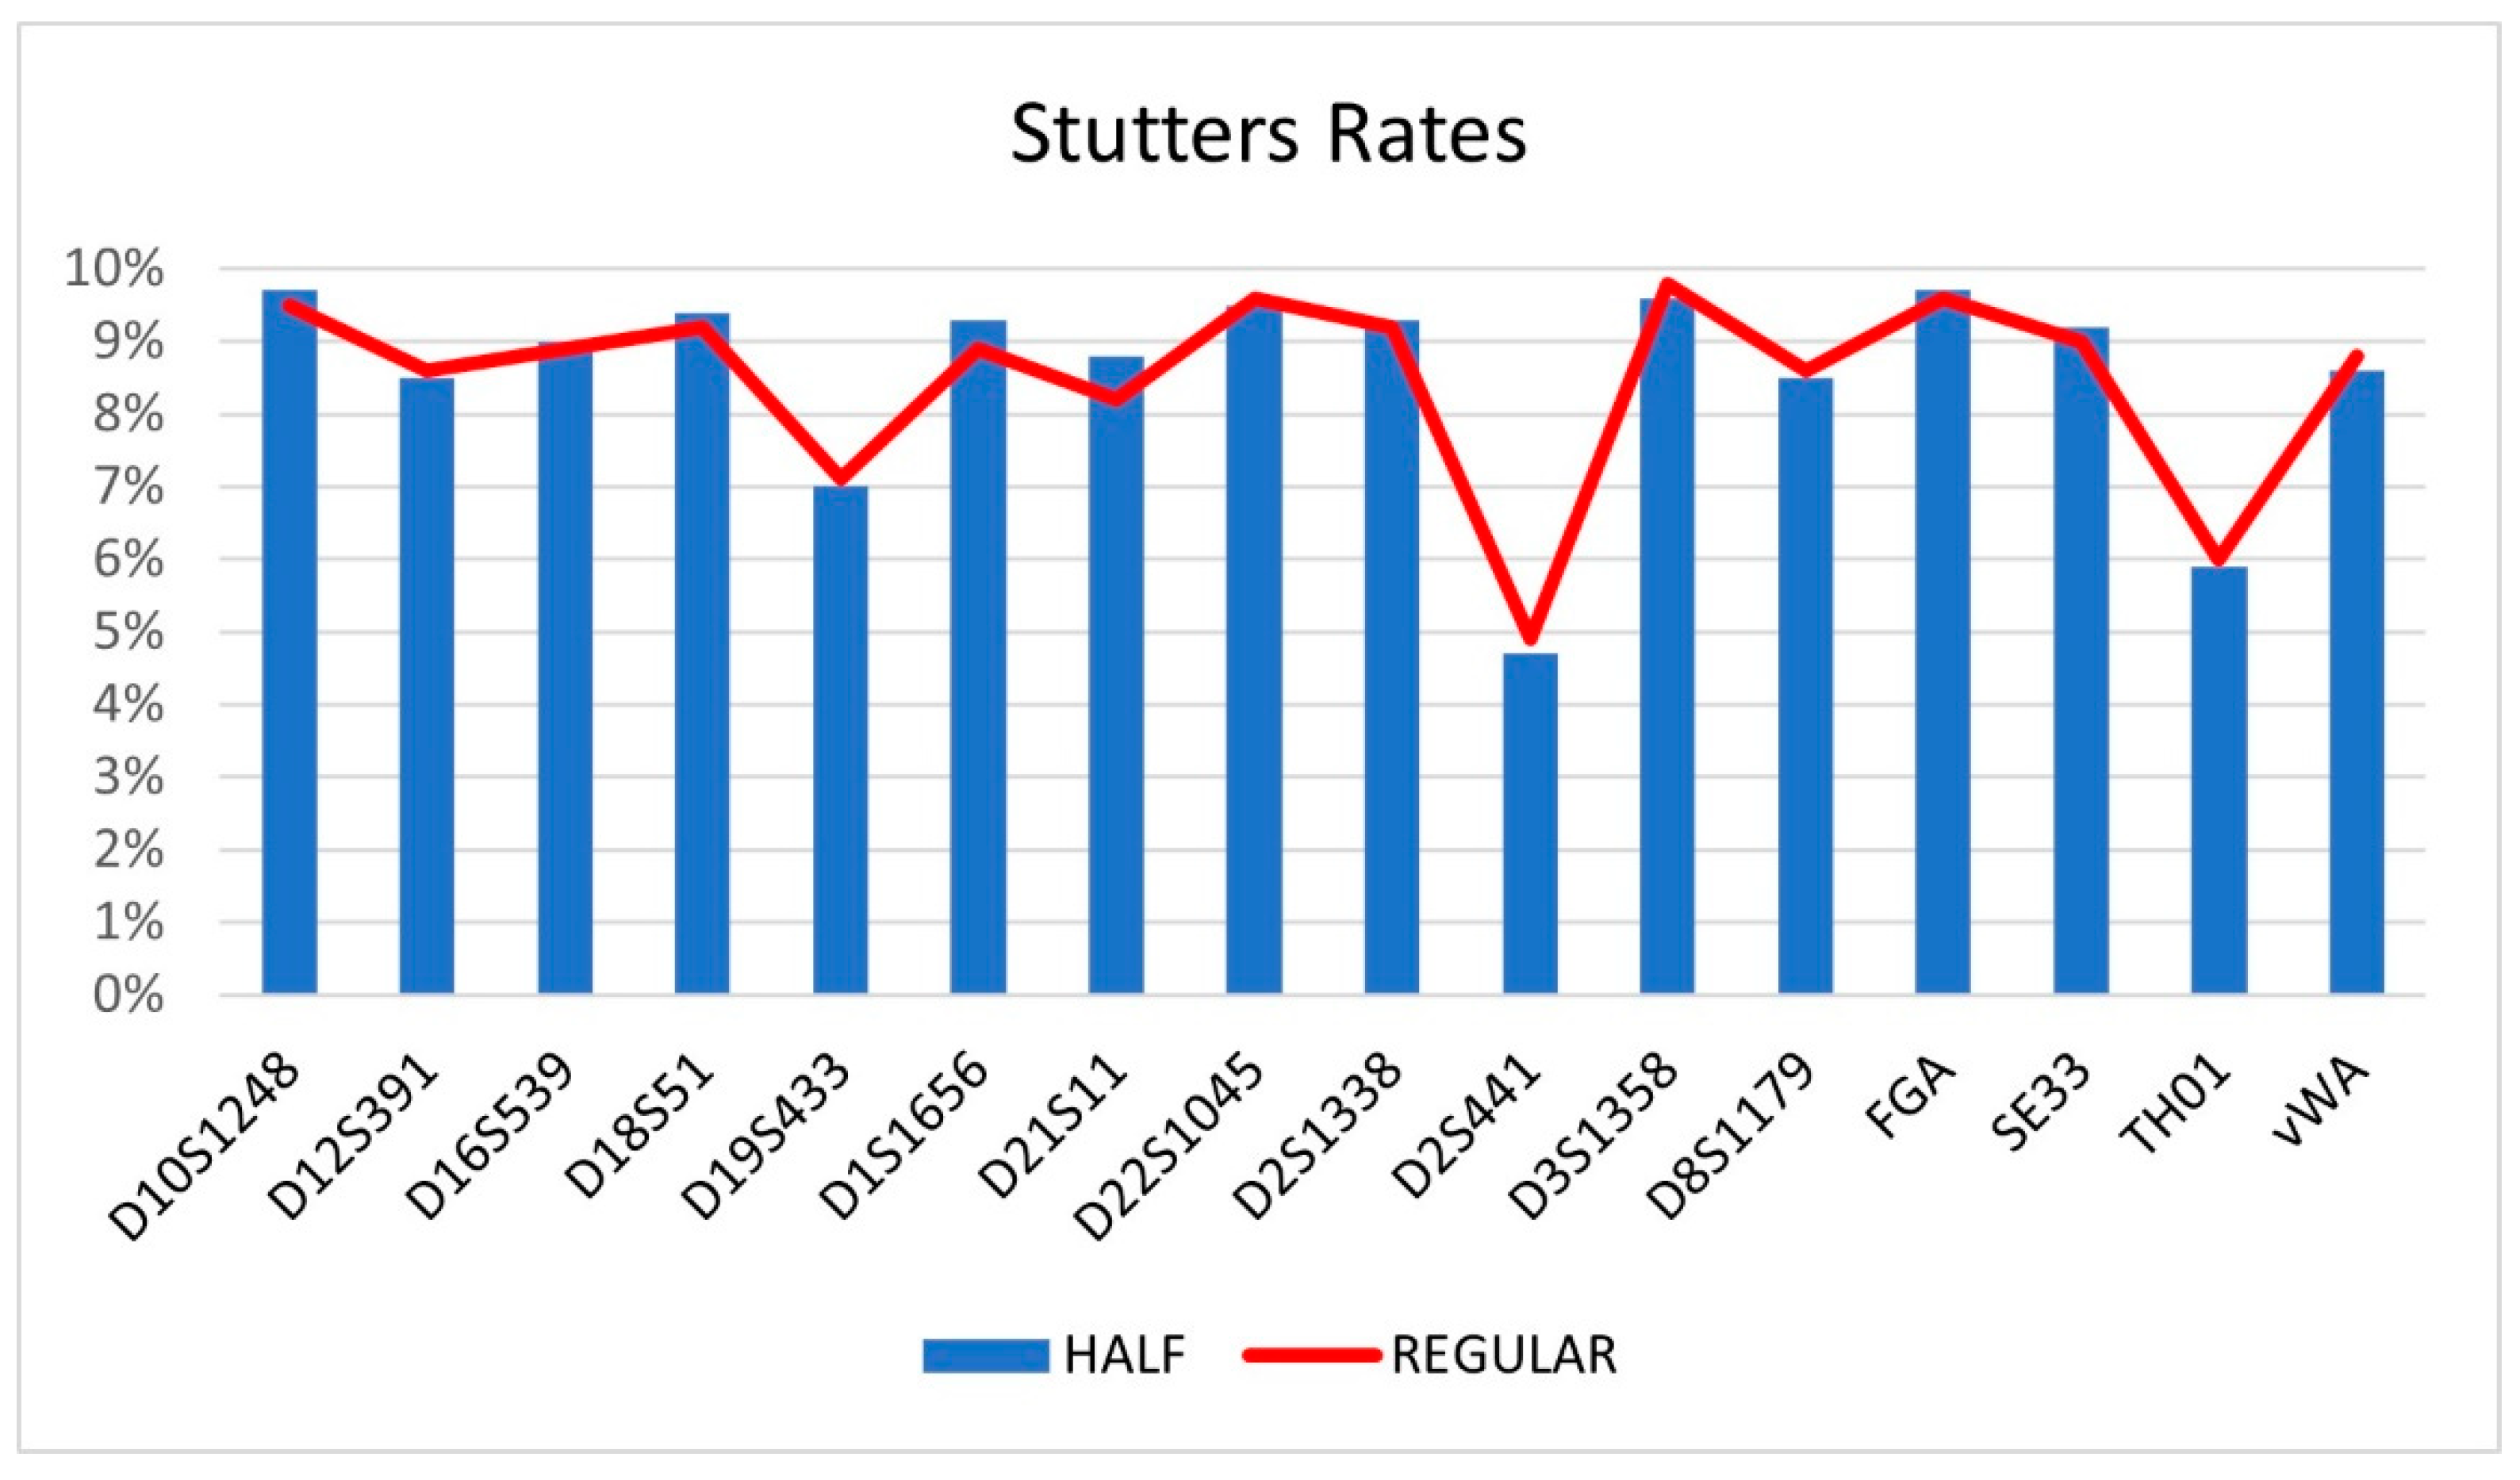
DNA profiles obtained from caseworks samples using half-reaction volumes were reliable in the two replicates and comparable to those produced using standard reaction volumes. In all samples, all 17 loci of the Investigator ESSplex SE QS Kit were successfully amplified. No significant differences in terms of peaks balance, preferential amplification or allelic drop-out, neither PCR inhibition, have been observed. However, reduced volume produced higher peak heights, likely due to increased signal intensities (Figure 3). Heterozygous (Het) locus ratio was > 0,7 (Table 1, Graf.3,) and stutter ratio < 10%, using standard and half reaction volumes. (Table 2, Graf.4,)
Graf 3: Heterozygosity Ratio– Average values for each locus.
Graf.4: Stutter % -Average values for each locus.
Concordance was evaluated between duplicates of the same sample using regular and half volumes, and allele assignment by Genemapper software was identical for each locus in each duplicate. Furthermore, we compared allele calls for each sample obtained using regular volumes with those obtained with half volumes. DNA profiles obtained using the Manufacturer's protocol were considered as reference profiles, and genotypes obtained were identical with both protocols.
Regarding mixed samples (bloodstain on white cotton, contact trace onto a laptop keyboard, door handle, vaginal swab, saliva onto a bottle neck, a cigarette butt), detection of full profiles for the minor contributor was possible in all analyzed samples with both PCR volumes, using an analytical threshold of 100 RFU, in accordance with the laboratory internal guidelines.
Full concordance was observed in the allele assignment by the GeneMapper software for every sample analyzed with standard and half-reaction volumes and in all its replicates. In all cases, the quality of DNA profiles obtained varied due to the different types of samples, the nature of the substrates, exposure to different environmental conditions, and sample aging.
The efficiency of Quality Sensors (QS1 and QS2) amplifications was evaluated in all analyzed samples. According to the kit manual, the successful amplification of QS1 indicates that the PCR reaction was performed correctly, regardless of the DNA presence, while the absence of detection indicates that the PCR did not work correctly. DNA inhibitors can interfere with PCR amplification, causing dropouts of long loci and artefacts. This is in accordance with the longer quality sensor being the most inhibitor-sensitive of the two-quality sensor fragments: a drop down of the QS2 signal below 20% of the QS1 signal indicates inhibition of the PCR reaction. In the case of DNA degradation, longer STR fragments may fail to amplify, or they may show decreasing peak heights (Sky-slope profile). In this case the amplification of QS1 is more efficient than the amplification of QS2 larger target fragment, and dropouts of QS2 may be observed [20].
In all analyzed samples, the quality sensors were successfully amplified in control and casework samples, even if the peak heights varied slightly between different samples. This observation aligns with the manufacturer's indications [20]. We observed that the use of half-reaction volumes had no impact on the detection of quality sensors, and the QS1-QS2 ratio was comparable in both PCR reactions (regular and half volumes) of the same samples (regular volumes: minimal value 0,89 (DS 0,25+) - maximum value 2,24 ((DS 0,33+)- average 1,25 (DS + 0,15) ; half volumes: minimal 0,93(DS 0,27+) – maximum 2,25 (DS 0,31+) ; average 1,26 (DS + 0,17).
4. Conclusion
The present study confirms that the ESS Kit is a robust PCR multiplex capable of delivering reliable results across a wide variety of forensic samples. It enables the recovery of information, even when dealing with challenging samples. Additionally, the presence of the two quality sensors proves useful in providing information about PCR efficiency, the presence of PCR inhibitors, and DNA degradation status. We observed that by reducing the total reaction volumes while maintaining all components' ratios unaltered, it is possible to obtain reliable DNA profiles from both control and real casework samples, comparable to those obtained using standard reaction volumes.
Although both reaction volumes require the same optimal DNA quantity, reduced volumes produce peaks with higher signal intensities.
Finally, the use of half volumes for PCR amplification allows the analysis of a larger number of samples than the standard protocol, thereby reducing laboratory costs while maintaining the quality level of the analysis unchanged.
References
- Gill, P.; Kimpton, C.P.; Urquhart, A.; Oldroyd, N.; Millican, E.S.; Watson, S.K.; Downes, T.J. Automated short tandem repeats (STR) analysis in forensic casework - a strategy for the future. Electrophoresis 1995, 16, 1543–1552. [Google Scholar] [CrossRef]
- Kimpton, C.; Fisher, D.; Watson, S.; Adams, M.; Urquhart, A.; Lygo, J.; Gill, P. Evaluation of an automated DNA profiling system employing multiplex amplification of four tetrameric STR loci. Int. J. Legal Med. 1994, 106, 302–311. [Google Scholar] [CrossRef]
- Butler, J.M.; Hill, C.R. Biology and genetics of new autosomal STR loci useful for forensic DNA analysis. Forensic Sci Rev 2012, 24, 15. [Google Scholar]
- Hares, D.R. Expanding the CODIS Core Loci in the United States,, Forensic Sci. Int. Genet. 2012, 6, e52–e54. [Google Scholar]
- Schumm, J.W.; Gutierrez-Mateo, C.; Tan, E.; Selden, R. A 27-locus STR assay to meet all United States and European law enforcement agency standards. J Forensic Sci. 2013, 58, 1584–1592. [Google Scholar] [CrossRef]
- Barbaro, A. 2020 STR Typing and Available Multiplex Kits Including Validation Methods. In: Shrivastava P, Dash HR, Lorente JA, Imam, J. , Forensic DNA Typing: Principles, Applications and Advancements. Springer, Singapore.
- Gaines, M.L.; Wojtkiewicz, P.W.; Valentine, J.A.; Brown, C.L. Reduced Volume PCR Amplification Reactions Using the AmpFlSTR Profiler Plus Kit. Journal of Forensic Sciences 2002, 47, 1224–1237. [Google Scholar] [CrossRef] [PubMed]
- Bessekri, M.W.; Aggoune, A.; Lazreg, S.; Bucht, R.; Fuller, V. Comparative study on the effects of reduced PCR reaction volumes and increased cycle number, on the sensitivity and the stochastic threshold of the AmpFlSTR Identifiler® Plus kit. Forensic Science International: Genetics Supplement Series 2013, 4, e306–e307. [Google Scholar] [CrossRef]
- Almheiri, R. Alghafri. Reduced volume for direct PCR amplification of blood reference samples using Identifiler® Direct and Globalfiler™ Express assays. Forensic Science International: Genetics Supplement Series, 2017, 6, e340–e341. [Google Scholar]
- Mahmood, H.K.; Salman, F.N.; Hasan, D.H.; Salih, K.M.; Sadiq, M.A.; Mohammad, B.T.; Mohammed, M.K.; Nahi, S.M.; Baqir, S.S. Validation of Half-Reaction Volumes of the Promega PowerPlex® Forensic Amplification Kits (PowerPlex® 18D Systems, PowerPlex ® 21System, PowerPlex® Fusion System and PowerPlex® Y23 System) in STR Analysis”. Arab Journal of Forensic Sciences & Forensic Medicine 2020, 2, 152–158. [Google Scholar]
- Perry, J.; Munshi, T.; Haizel, T.; Iyavoo, S. Validation of reduced volume VeriFiler™ Express PCR Amplification Kit for buccal swab samples extracted using Prep-n-Go™ Buffer. J Forensic Sci., 2022, 67, 1971–1978. [Google Scholar] [CrossRef] [PubMed]
- Barbaro, A.; Cormaci, P. Validation of PowerPlex® Y23 System (Promega) using reduced reaction volume. Forensic Science International: Genetics Supplement Series 2015, 5, e373–e374. [Google Scholar] [CrossRef]
- Barbaro, A.; Falcone, G. Validation of SureID® 21G Human STR Identification Kit Using Alternative Reaction Protocols. Biometrics And Biostatistics Journal. 2021, 3, 114. [Google Scholar]
- Coble, M.D.; Butler, J.M. Characterization of new miniSTR loci to aid analysis of degraded DNA, J. Forensic Sci. 2009, 50, 43–53. [Google Scholar] [CrossRef]
- Mogensen, H.S.; Frank-Hansen, R.; Morling, N. Test of Investigator ESSPLEX SE QS with quality sensors, For. Sci. Int. Genet. Suppl. Series 2015, 5, e490–e491. [Google Scholar] [CrossRef]
- EZ1 DNA Investigator Handbook – QIAGEN – Rev. 7,2014 Available at: https://www.qiagen.com/us/resources/download.aspx?id=46064856-1b88-4b27-a825d3f616e06c08&lang=en.
- Barbaro, A.; Samar, S.; Falcone, G.; La Marca, A. Highly efficient and automated extraction of DNA from human remains using a modified EZ1 protocol. Forensic Sci Res. 2021, 18, 59–66. [Google Scholar] [CrossRef]
- Investigator Quantiplex Pro RGQ Kit Handbook – QIAGEN – Rev. 1, 2018 Available at: https://www.qiagen.com/us/resources/download.aspx?id=57497d59-7a43-4eaf-8c94086e88742e86&lang=en.
- Vraneš, M.; Scherer, M.; Elliott, K. Development and validation of the Investigator® Quantiplex Pro Kit for qPCR-based examination of the quantity and quality of human DNA in forensic samples. FSI: Genetics Supplement Series, 2017, 6, e518–e519. [Google Scholar] [CrossRef]
- Investigator® ESSplex SE QS Handbook, June 2021 – QIAGEN – Rev.2, 2021. Available at https://www.qiagen.com/us/resources/resourcedetail?id=1fce64fd-9cf1-4750-a4d0-e7aa64113d7b&lang=en. 20 June.
- Butler JM (2012) Advanced Topics in Forensic DNA Typing: Methodology. Elsevier Academic Press, San Diego (USA).
- Developmental validation of the Investigator® ESSplex SE QS Kit, QIAGEN- October 2015. Available at https://www.qiagen.com/th/resources/download.aspx?id=9761730e-def1-4011-bd8a-852b4849dd6d&lang=en. 20 October.
- Coyle, H. Quality Control and Duplication for Concordance in Forensic DNA Samples: Implications for Interpretation in Mixtures. IRJCS:International Research Journal of Computer Science 2015, II, 16–18. [Google Scholar]
- Verdon, T.J.; Mitchell, R.J.; van Oorschot, R.A. The influence of substrate on DNA transfer and extraction efficiency. Forensic Sci Int Genet. 2013, 7, 167–75. [Google Scholar] [CrossRef]
- Lee S.B et al. (2017) DNA Extraction Methods In Forensic Analysis, Encyclopedia of Analytical Chemistry, Wiley & Sons (USA).
- Martins, C.; Lima, G.; Carvalho, M.R.; Cainé, L.; Porto, M.J. DNA quantification by real-time PCR in different forensic samples. Forensic Science International: Genetics Supplement Series 2015, 5, e545–e546. [Google Scholar] [CrossRef]
- Mulero, J.J.; Hennessy, L.K. Next-Generation STR Genotyping Kits for Forensic Applications. Forensic Sci Rev. 2012, 24, 1–13. [Google Scholar] [PubMed]
- Davis, C.P.; King, J.L.; Budowle, B.; Eisenberg, A.J.; Turnbough, M.A. Extraction platform evaluations: A comparison of Automate Express™, EZ1® Advanced XL, and Maxwell® 16 Bench-top DNA extraction systems. Legal Medicine 2012, 14, 36–39. [Google Scholar] [CrossRef] [PubMed]
- Francez, P.A.C.; Penidoa, C.A.F.O.; Costa, G.S.M.B.; de Almeida, R.M.; Pena, E.E.S.; Funabashi, K.; Resque, L.R. Comparison between automated DNA extraction employing the EZ1platform and manual methods using real forensic samples, Rev. Bras. Crimin. 2021, 10, 44–56. [Google Scholar] [CrossRef]
Figure 1.
Electropherograms of 0,5 ng of Control DNA 9948 using half (A) and standard (B) reaction volumes. Example of concordance for the blue channel.
Figure 1.
Electropherograms of 0,5 ng of Control DNA 9948 using half (A) and standard (B) reaction volumes. Example of concordance for the blue channel.
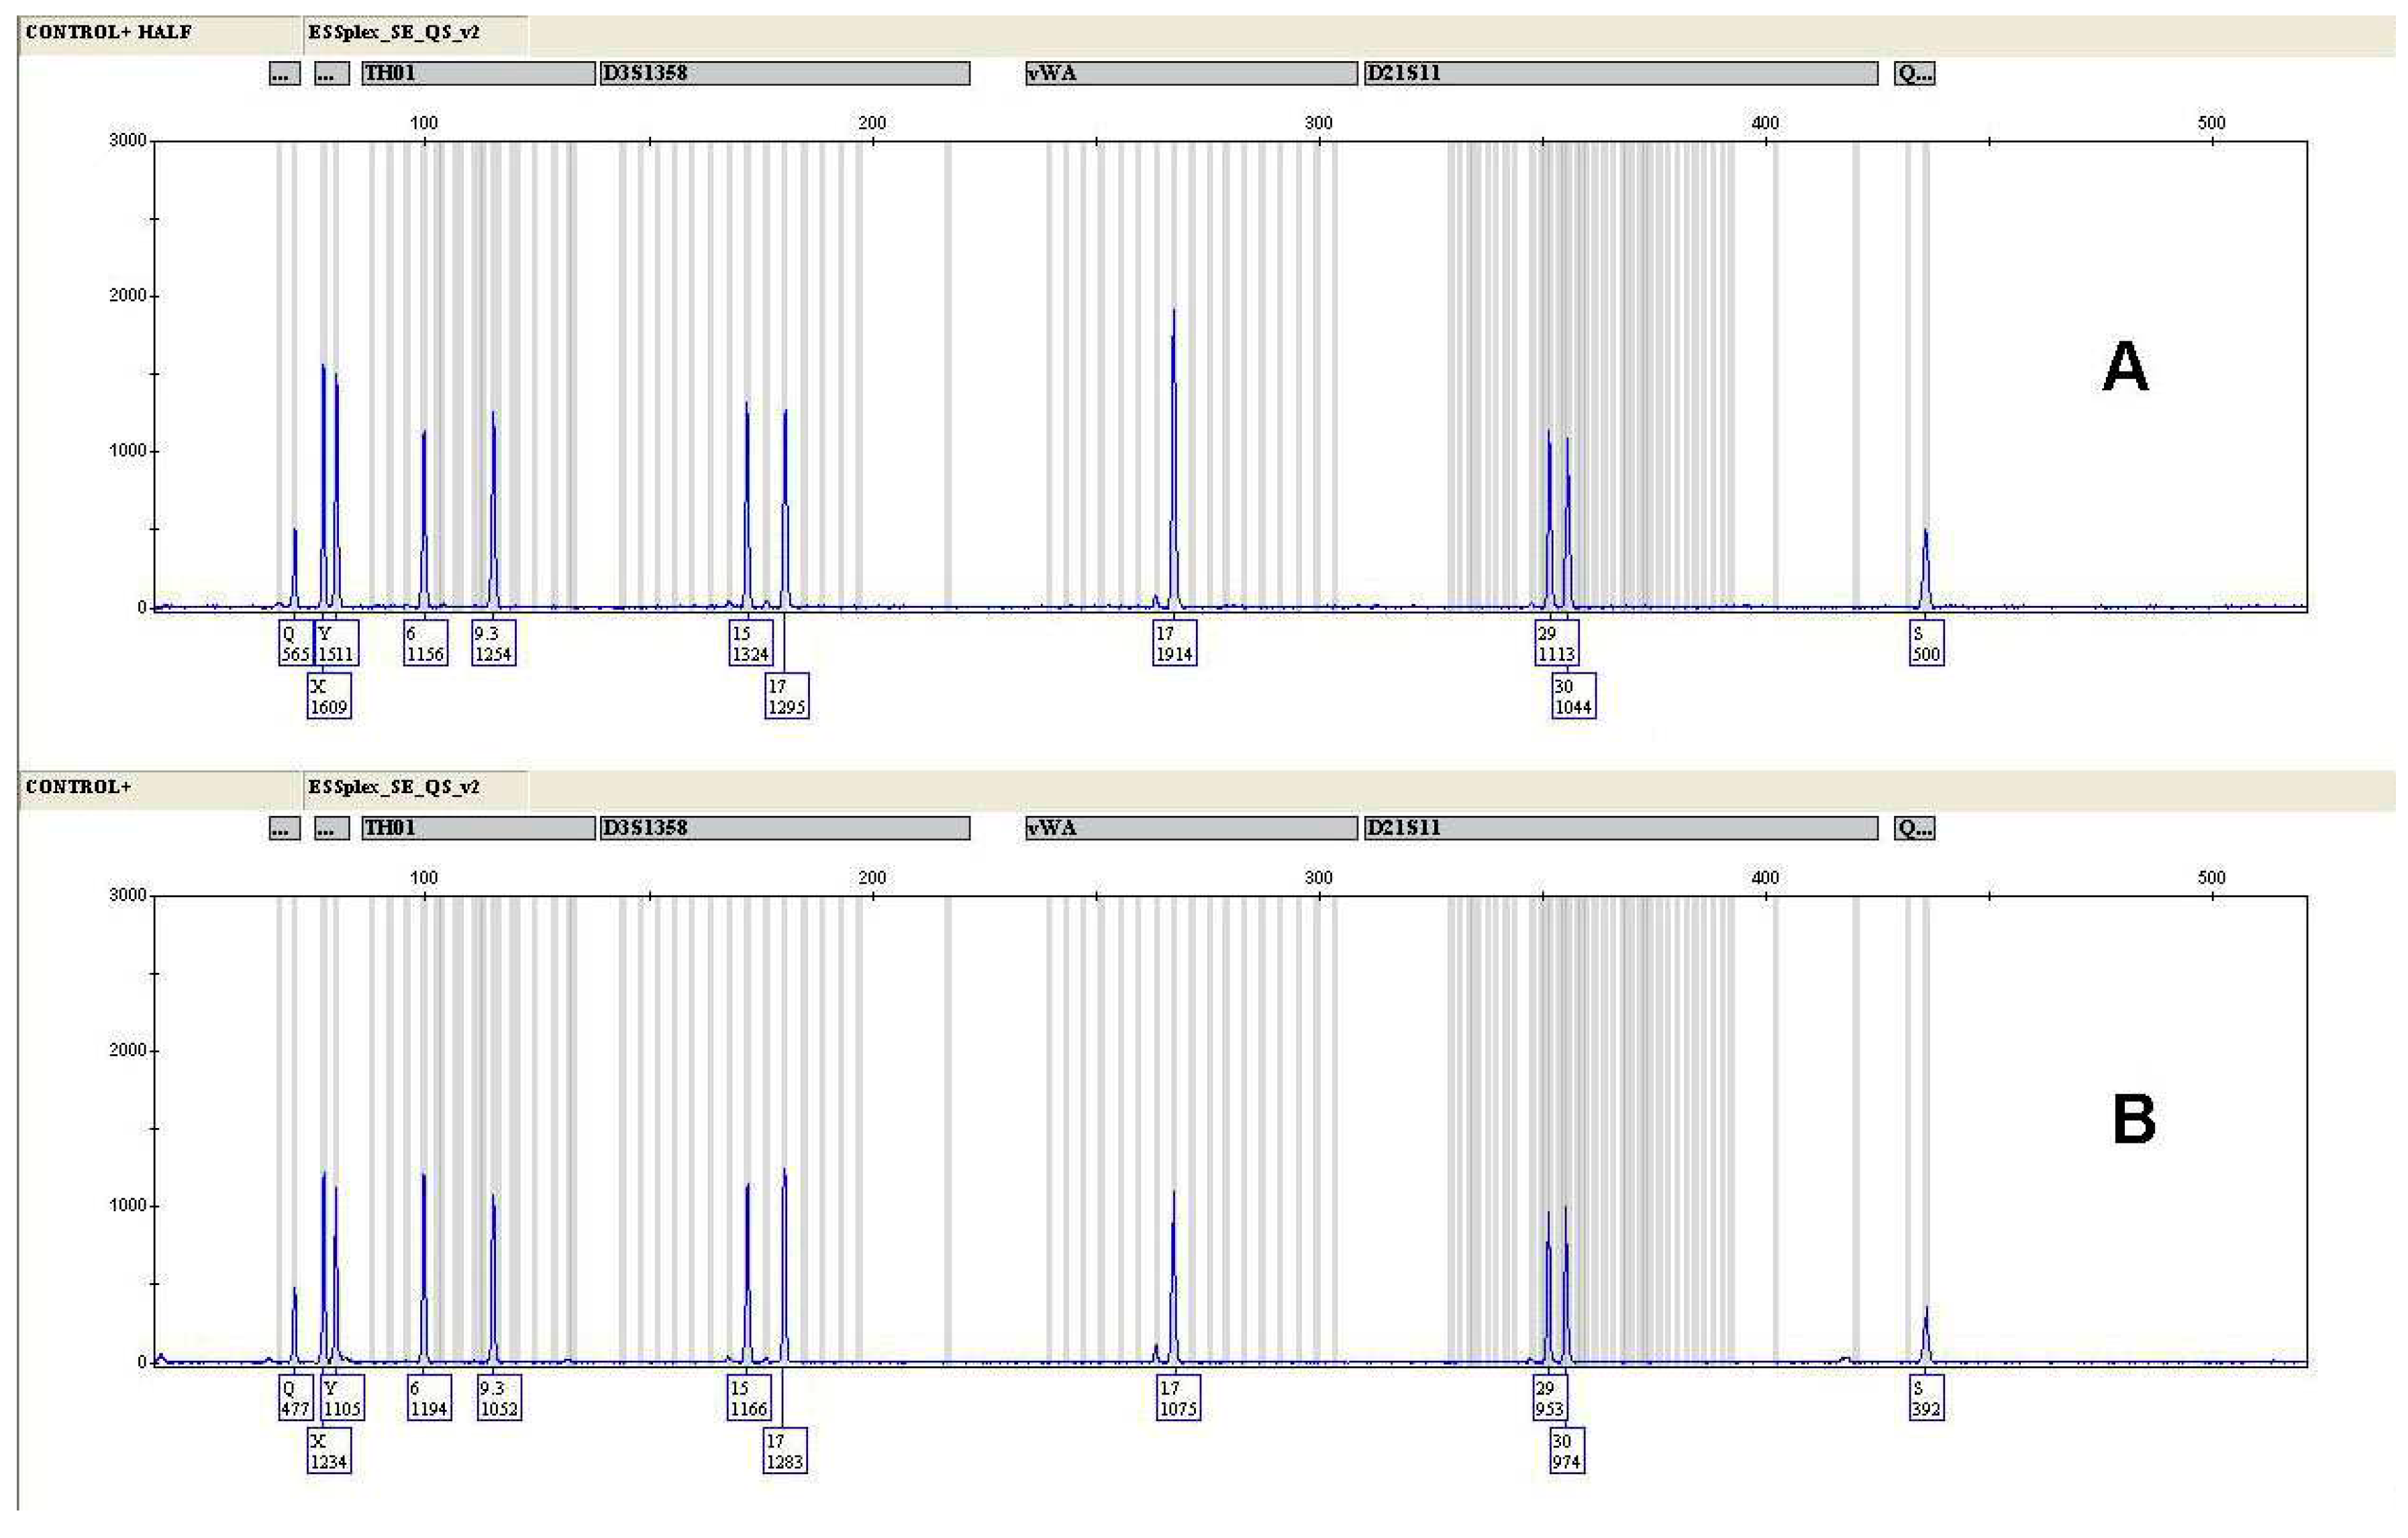
Figure 2.
Electropherograms of 0,5 ng DNA extracted from an oral swab belonging to a female donor and amplified using half (A) and standard (B) PCR volumes. Example of concordance for the yellow channel.
Figure 2.
Electropherograms of 0,5 ng DNA extracted from an oral swab belonging to a female donor and amplified using half (A) and standard (B) PCR volumes. Example of concordance for the yellow channel.
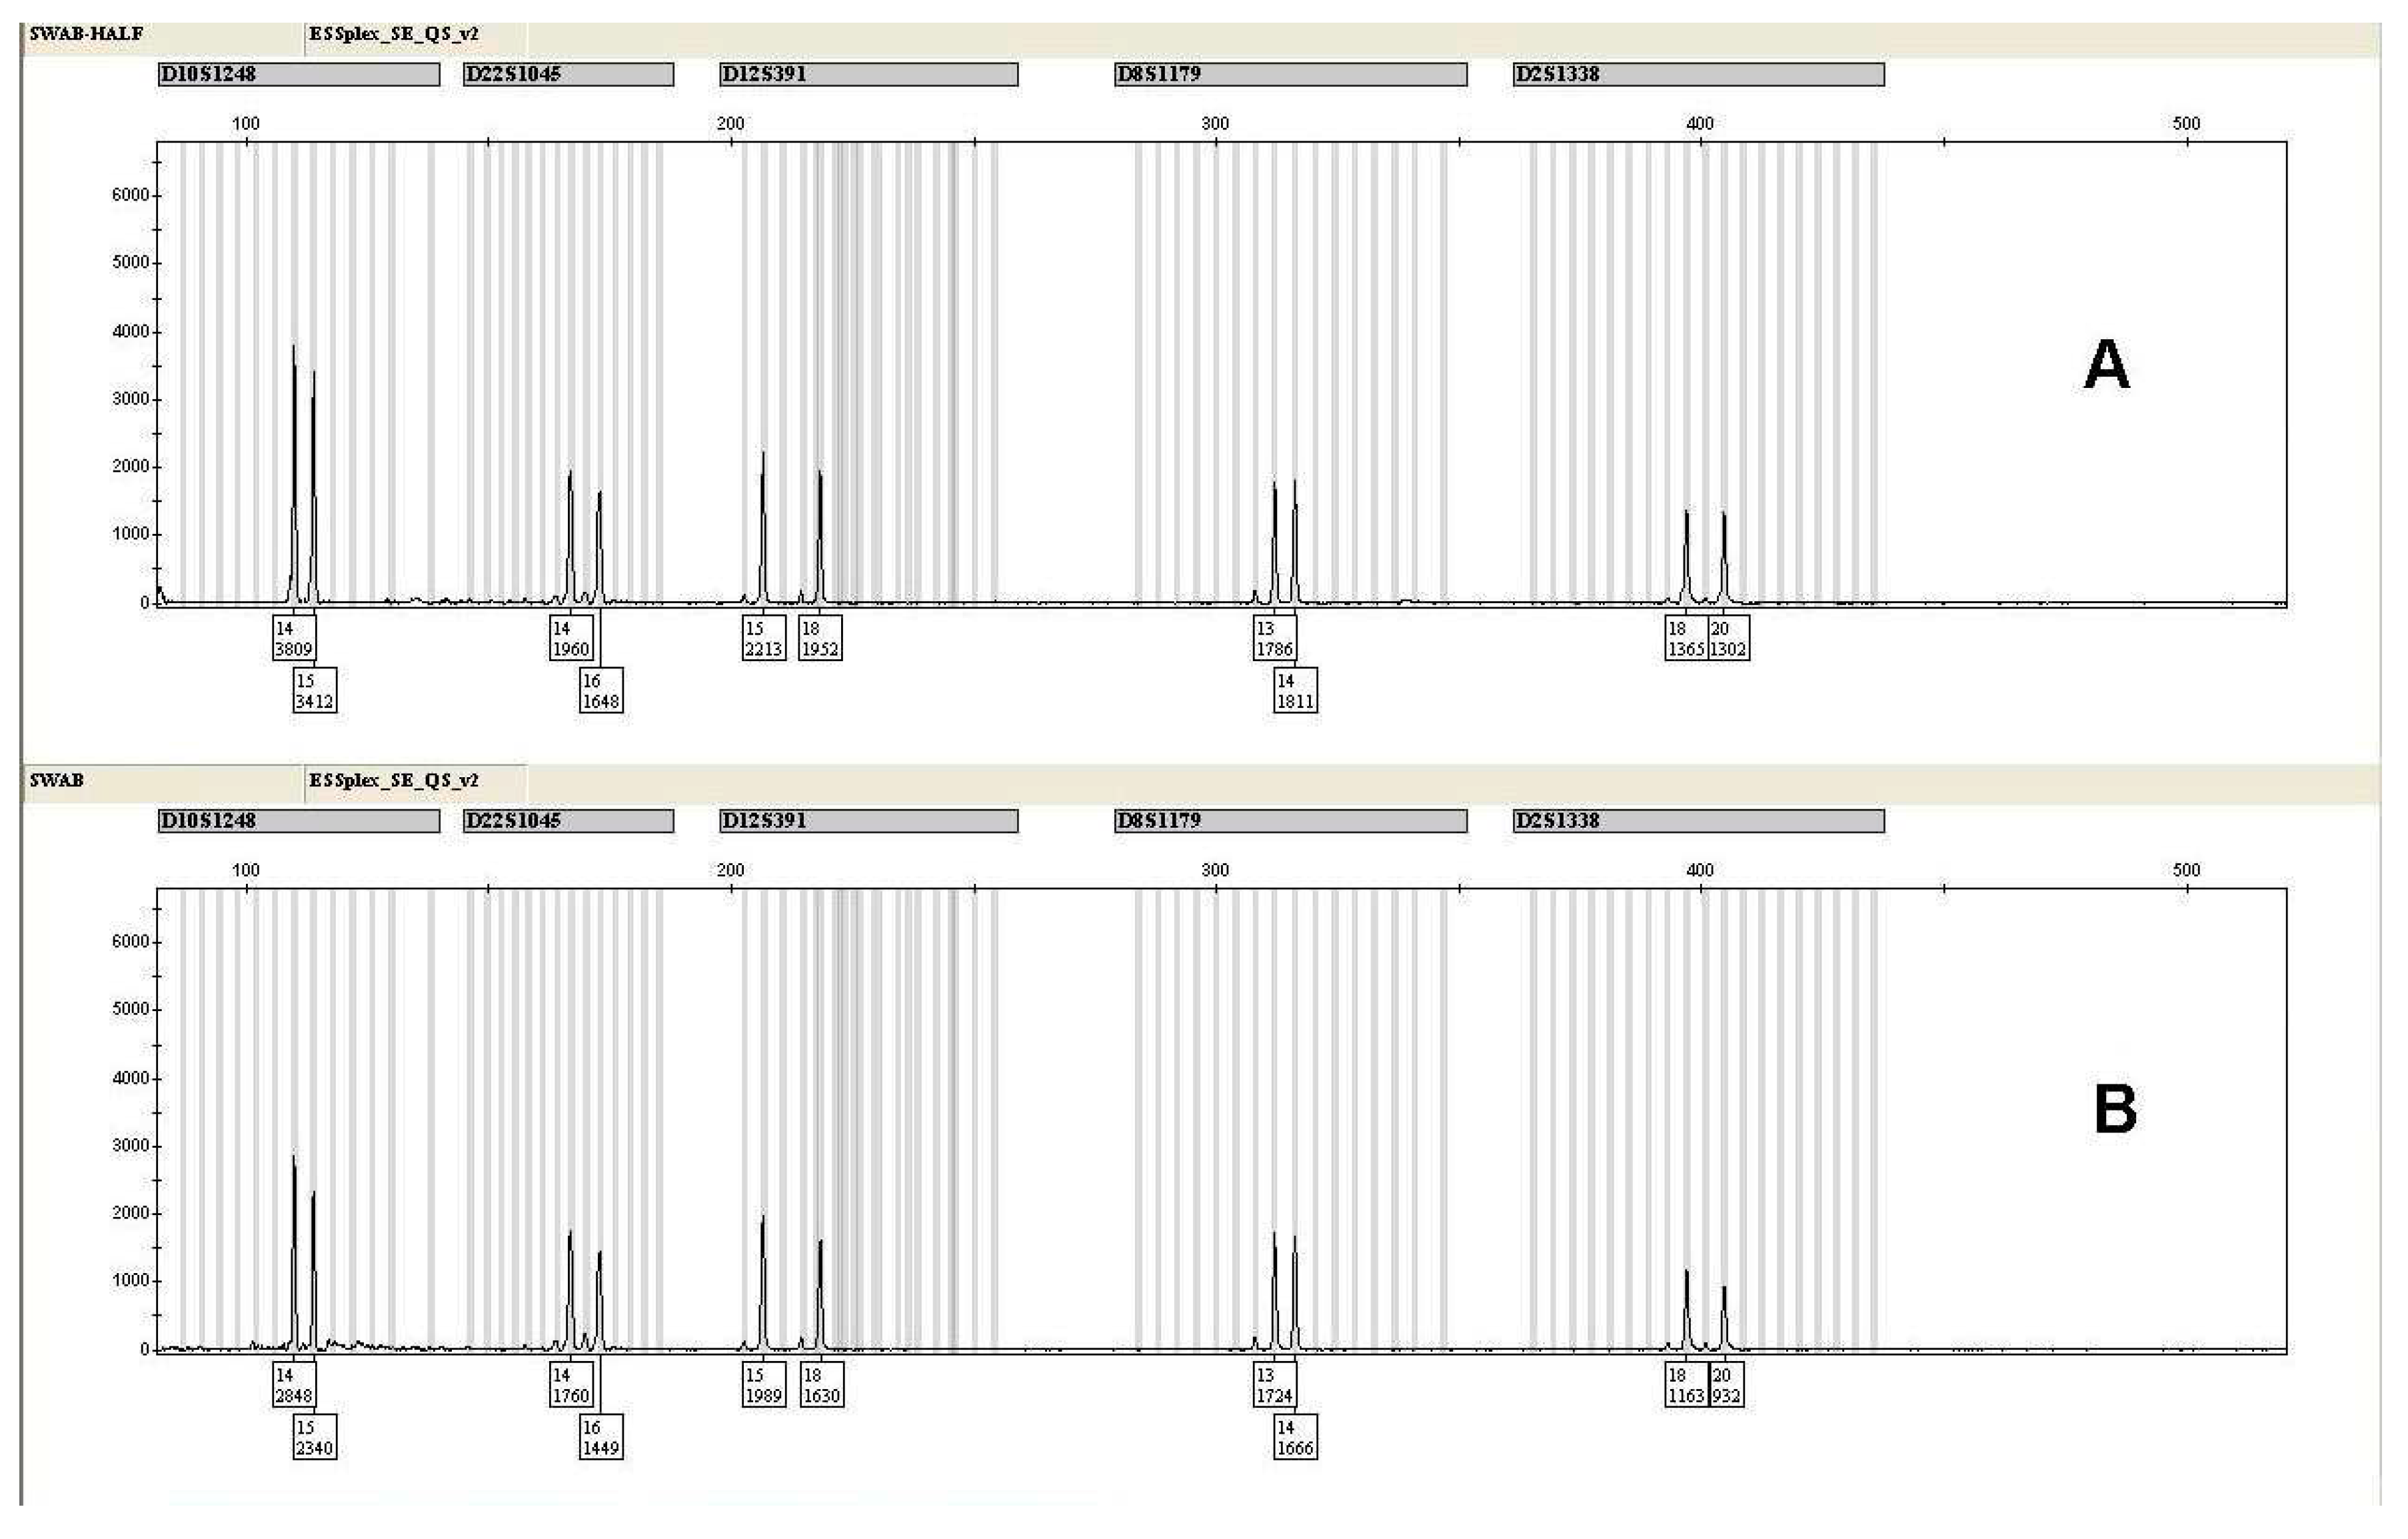
Figure 3.
Electropherograms of 0,5 ng DNA extracted from a vaginal swab and amplified using half (A) and standard (B) PCR volumes. Example of concordance for the yellow channel.
Figure 3.
Electropherograms of 0,5 ng DNA extracted from a vaginal swab and amplified using half (A) and standard (B) PCR volumes. Example of concordance for the yellow channel.
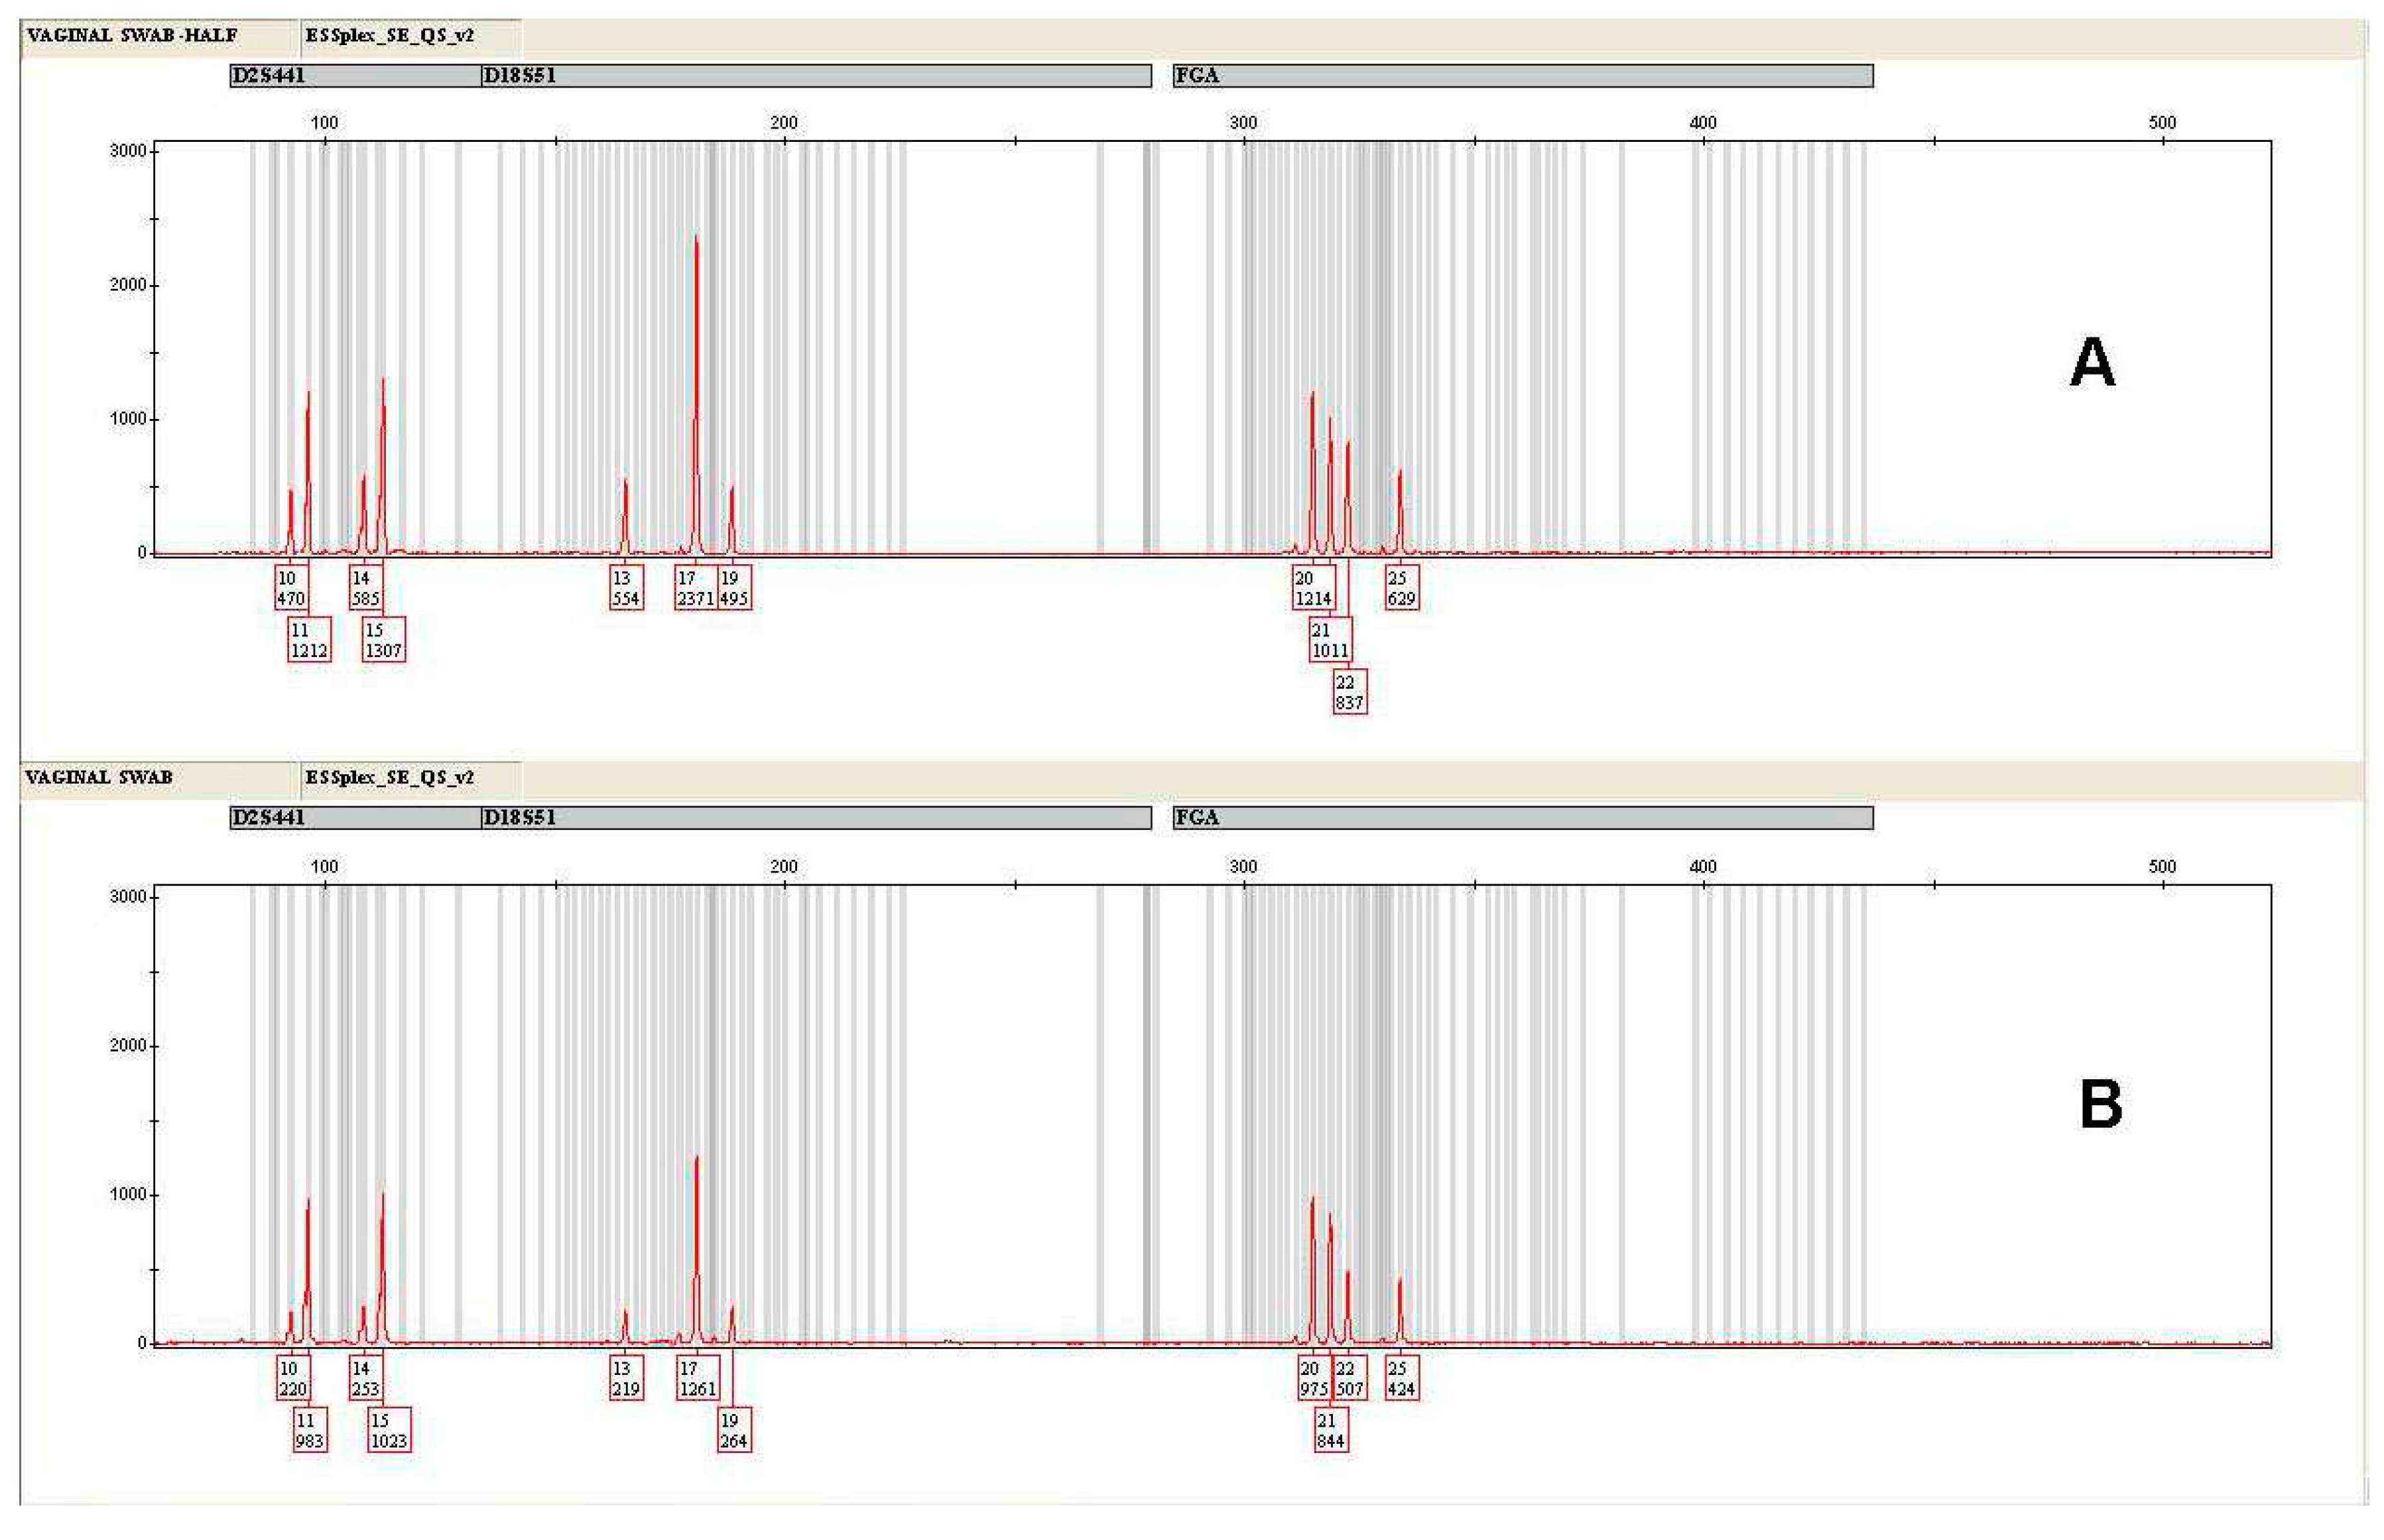

Table 1.
Heterozygosity (Het.) Ratio and DS (+) – Average values for each locus.
| Locus | HALF | DS (+) | REGULAR | DS (+) |
|---|---|---|---|---|
| Amel. | 0.85 | 0.10 | 0.84 | 0.11 |
| D10S1248 | 0.89 | 0.07 | 0.86 | 0.07 |
| D12S391 | 0.87 | 0.09 | 0.88 | 0.08 |
| D16S539 | 0.88 | 0.10 | 0.9 | 0.11 |
| D18S51 | 0.82 | 0.12 | 0.81 | 0.11 |
| D19S433 | 0.89 | 0.07 | 0.9 | 0.07 |
| D1S1656 | 0.90 | 0.07 | 0.88 | 0.06 |
| D21S11 | 0.91 | 0.11 | 0.89 | 0.12 |
| D22S1045 | 0.88 | 0.08 | 0.87 | 0.07 |
| D2S1338 | 0.85 | 0.12 | 0.86 | 0.11 |
| D2S441 | 0.91 | 0.08 | 0.9 | 0.09 |
| D3S1358 | 0.86 | 0.09 | 0.88 | 0.10 |
| D8S1179 | 0.87 | 0.09 | 0.88 | 0.09 |
| FGA | 0.86 | 0.11 | 0.87 | 0.10 |
| SE33 | 0.85 | 0.09 | 0.83 | 0.08 |
| TH01 | 0.90 | 0.05 | 0.91 | 0.06 |
| vWA | 0.91 | 0.09 | 0.9 | 0.10 |
Table 2.
Stutter % and DS (+) - Average Values for each locus.
| Locus | HALF | DS (+) | REGULAR | DS (+) |
|---|---|---|---|---|
| D10S1248 | 9.7 | 0.01 | 9.5 | 0.01 |
| D12S391 | 8.5 | 0.02 | 8.6 | 0.02 |
| D16S539 | 9 | 0.02 | 8.9 | 0.03 |
| D18S51 | 9.4 | 0.03 | 9.2 | 0.02 |
| D19S433 | 7 | 0.01 | 7.1 | 0.01 |
| D1S1656 | 9.3 | 0.02 | 8.9 | 0.02 |
| D21S11 | 8.8 | 0.01 | 8.2 | 0.01 |
| D22S1045 | 9.5 | 0.01 | 9.6 | 0.02 |
| D2S1338 | 9.3 | 0.02 | 9.2 | 0.02 |
| D2S441 | 4.7 | 0.01 | 4.9 | 0.01 |
| D3S1358 | 9.6 | 0.02 | 9.8 | 0.01 |
| D8S1179 | 8.5 | 0.02 | 8.6 | 0.02 |
| FGA | 9.7 | 0.01 | 9.6 | 0.01 |
| SE33 | 9.2 | 0.04 | 9 | 0.03 |
| TH01 | 5.9 | 0.008 | 6 | 0.009 |
| vWA | 8.6 | 0.02 | 8.8 | 0.02 |
Disclaimer/Publisher’s Note: The statements, opinions and data contained in all publications are solely those of the individual author(s) and contributor(s) and not of MDPI and/or the editor(s). MDPI and/or the editor(s) disclaim responsibility for any injury to people or property resulting from any ideas, methods, instructions or products referred to in the content. |
© 2024 by the authors. Licensee MDPI, Basel, Switzerland. This article is an open access article distributed under the terms and conditions of the Creative Commons Attribution (CC BY) license (http://creativecommons.org/licenses/by/4.0/).
Copyright: This open access article is published under a Creative Commons CC BY 4.0 license, which permit the free download, distribution, and reuse, provided that the author and preprint are cited in any reuse.


