Submitted:
09 January 2024
Posted:
11 January 2024
You are already at the latest version
Abstract
The detrimental consequences of soil pollution caused by crude oil or petroleum products are immense, leading to land degradation, property damage, and rendering agricultural practices ineffective. Extensive research has been conducted in the field of soil remediation, but further studies are still required to explore additional details of the remedial process. As a result, this study focuses on evaluating the effectiveness of Vernonia Galamensis and Vernonia Amygdalina, commonly known as bitter leaf, in remediating hydrocarbon-contaminated soil. In the analysis of micro-organisms, it was found that the bitter leaf extracts contained three types of bacteria: Pseudomonas aeruginosa, Staphylococcus aureus, and Escherichia coli. The leaf extracts were prepared using different methods, including sun drying, room drying, and using them in their wet form, which were then blended into the contaminated soil. The study also took into consideration three different types of soil: sandy-loamy soil, clay soil, and swamp soil. These advanced techniques and considerations are relevant to the topic of revolutionizing soil remediation, as they explore the potential of bitter leaf extracts and different soil types in effectively mitigating the effects of hydrocarbon contamination.The findings revealed that the wet blended extracts of Vernonia performed exceptionally well in the remediation process, surpassing a 50% reduction in the initial contamination levels. The study involved utilizing a quantity of bitter leaf ranging from 10g to 40g, which was added to the contaminated soils and monitored for a duration of 40 days. Remarkably, this approach led to a significant decrease in the concentration of contaminants within the soil, indicating the effectiveness of the bitter leaf extracts in the remediation process. Towards the conclusion of the study, predictive models were constructed to forecast the impact of hydrocarbon content, as well as the levels of lead, zinc, and chromium in the soil. These variables served as the dependent variables in the models, while the mass of bitter leaf, the duration of treatment, and the pH of the soil were considered as independent variables. Significantly, the models achieved a level of significance of less than 0.05, indicating their statistical validity. Furthermore, the r2 value, which represents the goodness of fit, demonstrated an appreciable level of accuracy in predicting the remediation effects. These results highlight the potential of the developed models in assessing and predicting the remedial outcomes of hydrocarbon contamination using bitter leaf extract.
Keywords:
bioremediation
; model
; vernonia
; galamensis amydalina
; performance
; analysis
; variance
CHAPTER 1: INTRODUCTION
background of the Study
Bioremediation is a waste management technique that involves the use of organisms to remove or neutralize pollutants from a contaminated site. (Environmental Inquiry, 2017). According to the United States EPA, bioremediation is a “treatment that uses naturally occurring organisms to break down hazardous substances into less toxic or non-toxic substances”. Technologies can be generally classified as in situ or ex situ. In situ bioremediation involves treating the contaminated material at the site, while ex situ involves the removal of the contaminated material to be treated elsewhere. Some examples of bioremediation related technologies are phytoremediation, bioventing, bioleaching, land farming, bioreactor, composting, bioaugmentation, rhizofiltration, and biostimulation.
Bioremediation may occur on its own (natural attenuation or intrinsic bioremediation) or may only effectively occur through the addition of fertilizers, oxygen, leaves, etc.,that help in enhancing the growth of the pollution-eating microbes within the medium (biostimulation).
Depleted soil nitrogen status may encourage biodegradation of some nitrogenous organic chemicals, (Sims, 2006) and soil materials with a high capacity to adsorb pollutants may slow down biodegradation owing to limited bioavailability of the chemicals to microbes (O’Loughlin et al., 2000). Recent advancements have also proven successful via the addition of matched microbe strains to the medium to enhance the resident microbe population’s ability to break down contaminants. Microorganisms used to perform the function of bioremediation are known as bioremediators.
A recent experiment, however, suggests that fish bones have some success absorbing lead from contaminated soil (Kris, 2012). Bone char has been shown to bio-remediate small amounts of cadmium, copper, and zinc. (Huan Jing, 2007). The assimilation of metals such as mercury into the food chain may worsen matters. phytoremediation is useful in these circumstances because natural plants or transgenic plants are able to bio accumulate these toxins in their above-ground parts, which are then harvested for removal (Meagher, 2000). In contrast to this situation, other contaminants, such as aromatic hydrocarbons as are common in petroleum, are relatively simple targets for microbial degradation, and some soils may even have some capacity to auto remediate, as it were, owing to the presence of autochthonous microbial communities capable of degrading these compounds. (Olapade, 2014).
The elimination of a wide range of pollutants and wastes from the environment requires increasing our understanding of the relative importance of different pathways and regulatory networks to carbon flux in particular environments and for particular compounds, and they will certainly accelerate the development of bioremediation technologies and biotransformation processes.
Problem Statement
The problem statement of this research topic revolves around the detrimental impact of hydrocarbon contamination, particularly in Ogoni land. Ogoni land, located in Nigeria, has experienced severe soil pollution due to crude oil and petroleum products, resulting in significant land degradation, property loss, and the disruption of agricultural practices. Although various studies have been conducted on soil remediation, there is still a need for more comprehensive investigations to understand the specific requirements and effectiveness of remedial processes. Therefore, this research aims to address this problem by exploring the potential of Vernonia Galamensis and Vernonia Amygdalina, commonly known as bitter leaf, as a means of revolutionizing soil remediation in Ogoni land and similar hydrocarbon-contaminated regions.
In addition to the mentioned problem, the research also aims to address several other pressing issues. One of the challenges is the lack of effective and sustainable methods for remediating hydrocarbon-contaminated soils in Ogoni land. The traditional approaches have shown limited success, and there is a need for innovative and environmentally friendly solutions. Furthermore, the long-term consequences of soil pollution caused by crude oil and petroleum products in Ogoni land are yet to be fully understood. It is crucial to assess the extent of the contamination, the persistence of pollutants, and their potential impacts on human health, ecosystems, and agricultural productivity. Moreover, there is a lack of comprehensive studies focusing specifically on the potential of bitter leaf species, Vernonia Galamensis and Vernonia Amygdalina, in remediating hydrocarbon-contaminated soil. Understanding their effectiveness, optimal dosage, treatment duration, and the influence of soil characteristics can provide valuable insights for developing sustainable and efficient remediation strategies. Overall, the research addresses the need for novel, effective, and sustainable solutions to combat hydrocarbon contamination in Ogoni land, as well as the broader implications of soil pollution on human well-being, environmental sustainability, and agricultural productivity.
SIGNIFICANCE OF THE STUDY
- Enhanced Soil Remediation: The study’s findings will provide valuable insights into optimizing the use of bitter-leaf and other bio-remediators in effectively restoring hydrocarbon-contaminated soils. This knowledge can contribute to the development of more efficient and sustainable soil remediation techniques, benefiting not only Ogoni land but also other regions grappling with similar soil pollution challenges.
- Restoration of Hope: By offering promising solutions for remediating polluted soils, the study brings hope to the Ogoni people and other affected areas. It provides a glimmer of optimism for communities that have experienced the devastating consequences of hydrocarbon contamination, assuring them that there are potential ways to reclaim their lands and restore environmental balance.
- Stimulating Further Research and Development: The study’s outcomes will serve as a catalyst for additional research and development efforts in the field of soil remediation. By contributing to knowledge and highlighting the effectiveness of bitter-leaf and other bio-remediators, it will inspire researchers to delve deeper into this area, leading to advancements in bio-remediation techniques and expanding the range of available options.
- Environmental Sustainability: The successful utilization of bitter-leaf and other bio-remediators can contribute to environment socioeconomic benefits for affected communities. As the study provides insights into effective soil remediation techniques, it opens up opportunities for improved agricultural productivity, land utilization, and economic development in regions struggling with the consequences of hydrocarbon contamination. Overall, the significance of the study lies in its potential to optimize soil remediation practices, restore hope to affected communities, stimulate further research, promote environmental sustainability, and generate socioeconomic benefits in areas impacted by soil pollution.
AIM OF THE STUDY
The aim of the study is to revolutionize soil remediation in hydrocarbon-contaminated areas, specifically focusing on the evaluation of Vernonia Galamensis and Vernonia Amygdalina (bitter leaf) as potential bio-remediators. The study aims to assess the effectiveness of Vernonia leaf extracts in remediating hydrocarbon-contaminated soil and to explore the optimal dosage, treatment duration, and influence of soil characteristics for achieving successful remediation. Ultimately, the aim is to provide valuable insights and information to optimize the bio-remedial activity using bitter leaf and other bio-remediators, bringing hope to communities affected by soil pollution and contributing to the advancement of knowledge in the field of soil remediation.
THE OBJECTIVES OF THE RESEARCH STUDY
1. To conduct a small-scale laboratory test to assess the performance of Vernonia leaf in remediating oil-contaminated soil. This objective aims to provide empirical evidence of the effectiveness and potential of bitter leaf in the remediation process.
2. To evaluate and compare the remediation effectiveness of different Vernonia -leaf species, primarily Vernonia Galamensis and Vernonia Amygdalina. The objective is to determine which species shows higher efficacy in remediating hydrocarbon-contaminated soil, providing valuable insights for selecting the most effective bio-remediator.
3. To explore the relationship between the concentration of Vernonia leaf and its remediation effect in different soil types. This objective aims to investigate the optimal dosage of bitter leaf required for effective soil remediation, taking into account variations in soil composition and characteristics.
4. To develop a statistical model that describes the bio-remediation process using bitter leaf. This objective involves establishing a robust statistical model that incorporates variables such as bitter leaf concentration, treatment duration, and soil pH. The model will provide a quantitative understanding of the factors influencing the remediation process, enabling better prediction and optimization of remediation outcomes.,s The research aims to provide empirical data on the performance of bitter leaf in remediating oil-contaminated soil, compare different bitter-leaf species, understand the relationship between bitter leaf concentration and remediation effect, and establish a statistical model to enhance the bio-remediation process…
SCOPES OF STUDY
The scope of the research includes the following:
- Focus on Bitter Leaf Extracts: The study primarily focuses on evaluating the performance of bitter leaf extracts, specifically Vernonia Galamensis and Vernonia Amygdalina, in remediating hydrocarbon-contaminated soil. It explores the potential of these extracts as bio-remediators.
- Laboratory Testing: The research involves conducting small-scale laboratory tests to assess the effectiveness of bitter leaf in remediating oil-contaminated soil. The testing will be carried out under controlled conditions to obtain empirical data.
- Evaluation of Different Soil Types: The study considers the remediation effectiveness of bitter leaf in different soil types, including sandy-loamy, clay, and swamp soil. By examining multiple soil types, the research aims to understand how bitter leaf performs in diverse soil compositions.
- Concentration-Effect Relationship: The research aims to establish a relationship between the concentration of bitter leaf and its remediation effect. It seeks to identify the optimal dosage of bitter leaf extract required to achieve efficient soil remediation.
- Statistical Modeling: The study aims to develop a statistical model that describes the bio-remediation process using bitter leaf. This model may incorporate variables such as bitter leaf concentration, treatment duration, and soil pH to enhance the understanding and prediction of remediation outcomes. It’s important to note that the scope of the study may also include any specific limitations or constraints, such as time, resources, or geographical boundaries, which should be acknowledged and considered during the research process.
THE DELIVERABLES OF THE RESEARCH STUDY CAN ALIGN WITH VARIOUS SUSTAINABLE DEVELOPMENT GOALS (SDGS) SET BY THE UNITED NATIONS
Here are some potential deliverables and their corresponding alignment with the SDGs:
- Research Report: The primary deliverable would be a comprehensive research report outlining the findings, methodologies, and recommendations. This aligns with SDG 9 (Industry, Innovation, and Infrastructure) as it contributes to the advancement of knowledge and innovation in the field of soil remediation.
- Recommendations for Sustainable Soil Remediation: The research study can provide practical recommendation for the use of bitter leaf and other bio-remediators in soil remediation practices. These recommendations can contribute to SDG 12 (Responsible Consumption and Production) by promoting sustainable and environmentally friendly approaches to address soil pollution.
- Knowledge Sharing and Awareness: Disseminating the research findings through publications, conferences, and workshops can help raise awareness about the potential of bitter leaf and bio-remediation techniques. This aligns with SDG 4 (Quality Education) and SDG 13 (Climate Action), as it promotes scientific knowledge sharing and sustainability practices.
- Policy Recommendations: Based on the research outcomes, the study can provide policy recommendations to relevant stakeholders, such as governmental agencies and environmental organizations. These recommendations can contribute to SDG 15 (Life on Land) by supporting efforts to restore and protect ecosystems affected by soil pollution.
- Capacity Building: The research study can also contribute to capacity building initiatives by providing guidance and training materials for professionals in the field of soil remediation. This aligns with SDG 8 (Decent Work and Economic Growth) and SDG 17 (Partnerships for the Goals) by promoting skill development and collaboration to address environmental challenges. By considering the SDGs in the selection and implementation of deliverables, the research study can have a broader impact on sustainable development, environmental conservation, and socio-economic well-being.
CHAPTER 2: LITERATURE REVIEW
2.1. Review of Previous Works in Bio-Remediation
Since the 1970s, bioaugmentation, or the addition of oil degrading microorganisms to supplement the indigenous populations, has been proposed as an alternate strategy for the bioremediation of oil contaminated environments. The rationale for this approach is that indigenous microbial populations may not be capable of degrading the wide range of potential substrates present in complex mixtures such as petroleum (Leahy and Colwell, 1990) or that they may be in a stressed state as a result of the recent exposure to the spill. Other conditions under which bioaugmentation may be considered are when the indigenous hydrocarbon-degrading population is low, the speed of decontamination is the primary factor, and when seeding may reduce the lag period to start the bioremediation process (Forsyth et al., 1995). For this approach to be successful in the field, the seed microorganisms must be able to degrade most petroleum components, maintain genetic stability and viability during storage, survive in foreign and hostile environments, effectively compete with indigenous microorganisms, and move through the pores of the sediment to the contaminants (Atlas, 1977; Goldstein et al., 1985). Methods involving the addition of selected oil-degrading microorganisms into spilled oil have been patented and marketed since early 1970s (Azarowick, 1973; Linn, 1971; and Mohan et al., 1975). However, before the Exxon Valdez spill in 1989, little information on the performance of commercial bioaugmentation products was available in the peer-reviewed literature. Atlas and Bartha (1973) conducted one of the first laboratory tests on the effectiveness of commercial mixed bacterial cultures. Two commercial petroleum-degrading bacterial inocula, Ekolo-Gest (also marketed as Petrobac, National Chem. Corp.) and DBC bacteria (Gerald Bauer Corp.), were tested using shake flasks to compare the degradation of Sweden crude oil. The study found that none of the commercial mixtures was superior to the indigenous microorganisms in coastal marine waters.
One of first field trials on oil bioremediation using a microbial product in a marine environment was reported by Lee and Levy (1987). The study involved seeding a mixed culture of marine oil-degrading bacteria (strains of Pseudomonas aeruginosa, Pseudomonas stutzeri, and Bacillus subtilis grown on bran) in a Scotian Shelf Condensate (SSC) contaminated sandy beach.
The extent of biodegradation was measured by the decline in the n-C17/pristane ratio in this study. The results showed that the n C17/pristane ratio in the seeded plots did decrease slightly.
However, due to high inter-and intra-plot variability, no significant difference in the rate of oil loss was observed among the treatments. This study also observed that the number of oildegrading bacteria did not increase until 10 to 15 days after the addition of oil. However, the addition of the microbial product did not reduce this lag period, suggesting that the toxic volatile components in the oil, which evaporated mostly during the first week, was the main cause of the lag period.
Since the application of nutrient amendments for the clean-up of the Exxon Valdez spill in 1989, bioremediation has received increased attention, and several field tests and applications of bio augmentation have been reported. Venosa et al. (1992) conducted a field test in Prince William Sound following the Exxon Valdez spill to investigate the effectiveness of two commercial microbial products vis-à-vis natural attenuation and nutrient addition alone. These products were selected based on a previous laboratory study (Venosa et al., 1991). This field trial failed to demonstrate enhanced oil biodegradation by these products. No bio stimulation occurred in the nutrient control plots either. There were no significant differences between any of the treatment and control plots during the 27-day trial period. However, the site where the project took place (Disk Island) was characterized as having highly weathered (degraded) oil and very calm waters, so dissolved oxygen may have been limiting, thus precluding effective biodegradation by any means.
One approach in overcoming the competition problem was proposed by Rosenberg et al. (1992). They developed a product that combined a polymerized urea formaldehyde fertilizer, which they called F-1, with a selected oil-degrading culture capable of using this fertilizer as a nitrogen source. Thus, the culture had a selective advantage over the indigenous population unable to utilize F-1 as nutrient source. A field trial conducted at an Israeli beach showed that this approach seemed to be successful in enhancing oil biodegradation. However, conclusions were confounded by the lack of adequate controls in the study (Swannell et al., 1996; Venosa, 1998). To evaluate the effectiveness of two commercial bio augmentation products in an estuarine environment, a field trial was carried out in a Texas coastal wetland by a research group from Texas A&M University (Simon et al., 1999; Townsend et al., 1999). The two products were selected based on a previous laboratory efficacy test, in which four out of twelve products showed an enhancement of oil biodegradation with significantly higher degradation rates of alkanes and aromatics when compared to a nutrient control (Aldrett et al., 1997). The 21- plot site, named San Jacinto Wetland Research Facility (SJWRF) has been used for a series of studies on oil spills and their countermeasures. In this study, four treatment strategies were examined: an oiled control, biostimulation with inorganic nutrient addition (diammonium phosphate), and commercial bioaugmentation with 2 different products. Arabian medium crude oil was selected in this test and the 21 plots each measuring 5 x 5 m were arranged in a balanced, incomplete block experimental design. Oil constituents were determined using gas chromatography/mass spectrometry (GC/MS) and were normalized to 17α(H), 21β(H)-hopane to reduce the effects of sample heterogeneity and physical losses. The results showed that the addition of microbial products could not significantly enhance oil biodegradation rates. No differences were observed between treatments when comparing the first order biodegradation rate coefficients for the total target saturates, total target aromatics, and individual hydrocarbon target analysts. The authors also pointed out that one of the products (BP8) “did show consistently higher biodegradation rates, though the rates were not significantly different from the control.” Because this microbial product was applied with vendor supplied inorganic nutrients (Townsend et al., 1999), it is difficult to conclude whether the “consistently but insignificantly” higher rates resulted from the additions of the microbial components or the nutrient components. The fact that neither addition of bioaugmentation agents nor application of inorganic nutrients significantly enhanced oil biodegradation suggested that other factors, such as oxygen, could have been limiting oil degradation in that environment. Studies comparing the performance of bioaugmentation and biostimulation have suggested that nutrient addition alone had a greater effect on oil biodegradation than did the addition of microbial products when oxygen supply was not limited (Jobson et al., 1974; Lee etal., 1997; Venosa et al., 1996). This is probably because the hydrocarbon-degrading population is rarely a limiting factor as compared to the nutrients since the size of the hydrocarbondegrading bacterial population usually increases rapidly in response to oil contamination. One of the first comprehensive field tests evaluating various bioremediation approaches to enhance oil biodegradation was carried out in a soil environment in northwest area of Canada in early 1970s (Jobson et al., 1974). A randomized block design was used to examine the effects of four treatments (control, inorganic fertilizer application, addition of a microbial culture alone , and combined fertilizer and microbial culture addition) over a 308-day time period. The microbial culture was grown in the laboratory and consisted of several genera of oil-degrading bacteria (Flavobacterium and Cytophoga sp., Pseudomonas sp., Xanthomonas sp., Alcaligenes sp., and Arthrobacter sp.). The study showed that the nutrient application resulted in a significant stimulation of bacterial numbers and in the degradation rate of n-alkane components of the crude oil. The application of the microbial agent, however, resulted in only a slightly enhanced degradation rate of n-alkane components of chain lengths C20 to C25.
A field study conducted on a sandy beach in Delaware also showed that addition of a microbial inoculum did not enhance oil biodegradation more than addition of inorganic nutrients alone (Venosa et al., 1996). A randomized block design was used in this study to assess the effects of three treatments: a no-nutrient control (natural attenuation), addition of water-soluble nutrients, and addition of water-soluble nutrients supplemented with a natural microbial inoculum from the site. No significant differences were observed between plots treated with nutrients alone and plots treated with nutrients and the indigenous inoculum, suggesting that supplementation of the natural population with indigenous cultures from the same site still did not result in further enhancement over simple nutrient addition on marine shorelines. The authors also indicated that this conclusion could be extended to include exogenous microbial inocula or commercial microbial agents because “if indigenous cultures do not accelerate the degradation rates, organisms enriched from different environments, grown in the laboratory, and not acclimated to a particular climatic or geographic location should be even less able to compete with the natural population.”
Lee et al. (1997) conducted a 129-day field trial to compare the effect of four treatments on biodegradation of weathered Venture Condensate on a sandy beach in Nova Scotia, Canada. The four treatments (control, inorganic nutrient addition, a commercial bioremediation product, and addition of inorganic nutrients along with bioremediation product) as well as an uncoiled control were replicated in a complete block design using 20 enclosures or plots. C2-chrysene was used as the normalizing biomarker due to the low concentration of hopane in the condensate.
PRP (PetrolRem, Inc.) was selected to be the representative commercial bioremediation agent in this study. This product is no longer listed in the current NCP Product Schedule. According to Lee et al. (1997), PRP contains mineral nutrients and nonpathogenic bacteria within spherical particles made from plant derived natural products (beeswax) and exhibits both bioaugmentation and biostimulation properties. The agricultural fertilizer used in this study was a mixture of granular forms of ammonium nitrate (N:P:K: 33-0-0) and triple super phosphate (N:P:K: 0-46-0).
2.2. Limitations and Environmental Issues of Bioremediation in the Niger Delta
The delta covers 20,000 km² within wetlands of 70,000 km² formed primarily by sediment deposition. Home to 20 million people and 40 different ethnic groups, this floodplain makes up 7.5% of Nigeria’s total land mass. It is the largest wetland and maintains the third-largest drainage basin in Africa. The Delta’s environment can be broken down into four ecological zones: coastal barrier islands, mangrove swamp forests, freshwater swamps, and lowland rainforests.
This incredibly well-endowed ecosystem contains one of the highest concentrations of biodiversity on the planet, in addition to supporting abundant flora and fauna, arable terrain that can sustain a wide variety of crops, lumber or agricultural trees, and more species of freshwater fish than any ecosystem in West Africa. The region could experience a loss of 40% of its inhabitable terrain in the next thirty years as a result of extensive dam construction in the region. The carelessness of the oil industry has also precipitated this situation, which can perhaps be best encapsulated by a 1983 report issued by the NNPC, long before popular unrest surfaced:
Since then, there has been the slow poisoning of the waters of this country and the destruction of vegetation and agricultural land by oil spills which occur during petroleum operations. But since the inception of the oil industry in Nigeria, more than twenty-five years ago, there has been no concerned and effective effort on the part of the government, let alone the oil operators, to control environmental problems associated with the industry. (Bogumil, 2014).
Reports on the extent of the oil spills vary. The Department of Petroleum Resources (DPR) estimated 1.89 million barrels of petroleum were spilled into the Niger Delta between 1976 and 1996 out of a total of 2.4 million barrels (Vidal, 2010) spilled in 4,835 incidents. (The Daily Independent,2010) (approximately 220 thousand cubic metres). A UNDP report states that there have been a total of 6,817 oil spills between 1976 and 2001, which account for a loss of three million barrels of oil, of which more than 70% was not recovered.(UNDP,2006) 69% of these spills occurred off-shore, a quarter was in swamps and 6% spilled on land.
The Nigerian National Petroleum Corporation places the quantity of petroleum jettisoned into the environment yearly at 2,300 cubic metres with an average of 300 individual spills annually (Bronwen,2007). However, because this amount does not take into account “minor” spills, the World Bank argues that the true quantity of petroleum spilled into the environment could be as much as ten times the officially claimed amount. (Moffat and Linden, 2009). The largest individual spills include the blowout of a Texaco offshore station which in 1980 dumped an estimated 400,000 barrels (64,000 m3) of crude oil into the Gulf of Guinea and Royal Dutch Shell’s Forcados Terminal tank failure which produced a spillage estimated at 580,000 barrels (92,000 m3). (Nwilo,2001) In 2010 Baird reported that between 9 million and 13 million barrels have been spilled in the Niger Delta since 1958. (Baird, 2010) One source even calculates that the total amount of petroleum in barrels spilled between 1960 and 1997 is upwards of 100 million barrels (16,000,000 m3). (Bronwen,2007)
During bioremediation activities, it has been discovered that some of the constituents remains in the soil after the spills are treated. Studies by several scholars show the effects as thus described in the analysis done by Mauro and Wynne.
The study showed that an average of 11.0% of the n-alkanes remained in the oiled control plots, and only 0.1% of the oil remained in the enclosures treated with inorganic nutrients alone; 5.4% of the alkanes were found in the plots treated with inorganic nutrients and PRP, and 25.3% remained in the plots treated with PRP alone. The results indicate that periodic addition of inorganic nutrients was the most effective strategy for enhancing oil degradation and that the full potential of the bioremediation product was limited by nutrient availability. This field trial demonstrated that adding the bioremediation product did not perform better in terms of enhancing alkane degradation than applying inorganic agricultural fertilizers alone.
Several other possible reasons for the failure of inocula in degrading contaminants in nature were summarized by Goldstein et al. (1985), which include: (1) the concentration of the contaminant may be too low to support the growth of the inoculated species, (2) the natural environment may contain substances inhibiting growth or activity of the inocula, (3) the growth rate of the inoculated species may be limited by predation such as protozoa, (4) the added species may use other substrates in nature rather than the targeted contaminants, and (5) the seeded microorganisms may be unable to move through the pores of the sediment to the contaminants.
A few field trials did claim success in demonstrating the effectiveness of oil bioaugmentation, such as using Alpha BioSeaTM (Alpha Environmental, Inc.) to treat the Angolan Palanca crude oil spilled from Mega Borg off Texas coast (Mauro and Wynne, 1990; Swannell et al., 1996) and using TerraZymeTM (Oppenheimer Biotechnology) in enhancing biodegradation of a heavy oil spilled from Nakhodka in Japan (Tsutsumi et al., 2000). However, the success of these studies was based on either visual observation (i.e., the Mega Borg study) or digital photographic image analysis (i.e., the Nakhodka study). No comprehensive monitoring program was used to verify the oil was indeed removed through enhanced biodegradation. The two products basically contain the same bacterial cultures and nutrients (Hozumi et al., 2000). The observed visual effects might have been due to physical or chemical processes such as surfactant action associated with the products (Swannell et al., 1996) or sinking.
All these peer-reviewed journal articles show that even though the addition of microorganisms may be able to enhance oil biodegradation in the laboratory, the effectiveness of bio augmentation has not been convincingly demonstrated in the field. Actually, most field studies indicated that bio augmentation is not effective in enhancing oil biodegradation in inland, estuarine, and marine environments. It appears that in most environments, indigenous oil degrading microorganisms are more than sufficient to carry out oil biodegradation if nutrient levels and other adverse environmental conditions do not limit them.
2.3. Current Bioremediation Technologies for Crude Oil Contaminated Sites
Bioremediation is a technology that exploits the abilities of microorganisms and other natural habitat of the biosphere to improve environmental quality for all species, including man. The development of innovative bioremediation technology as a functional tool in clean-up of crude oil polluted environment has depended so much on the basic knowledge of the physiology and ecology of the natural bacterial populations found in such polluted sites. Many advances in biochemistry and molecular biology are now applied in various bioremediation efforts (Olson and Tsai, 1992; Bouwer, 1992). According to some investigators (Barbee, et al., 1996; Ritter and Scarborough, 1995), bioremediation does not always result in complete mineralization of organic compounds. Many of these compounds are naturally transformed to metabolites of unknown persistence and toxicity. Therefore, some basic steps that may be necessary for a successful bioremediation project will include compliance analysis, site characterization, method selection / feasibility studies, remediation proper and end for project analysis (Bonaventura, et al., 1995). Compliance analysis requires examination of the contaminated site in the light of the governing regulation and the action plan. Examination of the site will lead to its characterization and this is a very challenging and difficult aspect of a bioremediation efforts. Knowledge of soil parameters such as cation exchange capacity, relevant nutrient availability, acidity (soil pH), aeration or oxygen level, hydraulic properties etc are paramount and this requires the assistance of specialists in these areas. The last stage of any bioremediation project should include bioassay of the treated site. This confirms complete or near complete removal of the PHC contaminant. According to Lovely (2003), combining models (including mathematical models) that can predict the activity of microorganisms involved in bioremediation with existing geochemical and hydrological models should transform bioremediation technology.
Some necessary process variables involved in bioremediation of petroleum hydrocarbon polluted environments that need to be known include the characteristics of the polluting crude oil, its biodegradability and the characteristics of the polluted site (physical and chemical) Logistic problems with respect to accessibility to the polluted site (e.g., swamps) must be known, together with the impact of the clean-up operation. The last point is very important because it is known from several studies that in some natural detoxification processes, cellular mechanisms of hydrocarbon compound metabolism can create compounds or metabolites that are more toxic than the parent hydrocarbons, especially when the end products are not only carbon dioxide and water. The situation is even complicated by the fact that biochemical reactions rarely proceed by a single pathway. Hence one of the greatest difficulties in assessing the success of bioremediation of crude oil-contaminated environment is having knowledge of the fate of the metabolites after uncontained in situ treatment (Jenkin and Sanders, 1992).
In full-scale bioremediation technologies of crude oil polluted ecosystems, many rate-limiting factors are known (Atlas, 1991; Prince, 1992), and they include presence of other toxic compounds other than crude oil pollutant, the level of available oxygen and nutrients (particularly nitrogen and phosphorus), temperature and pH. Other factors are moisture content or water availability, biodiversity of hydrocarbon clastic and co-metabolising bacteria at the site. The adsorptive capacity of the hydrocarbons to the soil and sediment, and rate of mixing and mass transfer are also important factors. In terrestrial ecosystem, spilled oil adsorbs to the soil particles, forming a cohesive, toxic mixture that is deleterious to the indigenous microorganisms. These events or soil characteristics reduce or increase the bioavailability of petroleum hydrocarbons, the inherent toxicity and hence biodegradability. These factors are responsible for the long delays in the mineralization of the petroleum hydrocarbons (PHC) by the indigenous or applied microbial populations. Effective metabolism of crude oil requires adequate oxygen supply as electron acceptor. Under low oxygen tension as in the mangrove ecosystem, the use of biologically active absorbent (Gregorio, 1996) to fix the oil and effect medium term biodegradation is desired. It should be noted that the extent of crude oil impact on the soil equally depends on the concentration spilled, ease of dissociation from the soil matrix, particle size of the soil, porosity, or permeability. To facilitate bioremediation requires methods that can dissociate the PHC and create conditions for mass transfer process (Onwurah, 2000).
Bioremediation of crude oil contaminated environment may require some engineering process, so as to facilitate recovery efforts. Engineering may include construction of booms, trenches, and barriers for contaminant containment, boreholes, bio-cells and using engineered microbial systems. Increasing bioavailability of the PHC can be achieved by physically processing the crude oil-polluted soil or sediment by excavation, pulverising and mixing. The above processes maximize aeration and surface area for microbial activity. Some specific bioremediation processes that may require engineering are summarized below.
2.3.1. In Situ Land Treatment
The simplest method of bioremediation of oil polluted soil is in situ land treatment. This technology utilizes standard farming procedures such as plugging the oil-polluted soil with a tractor, periodical irrigation and aeration. This technology embraces the use of aerobic microorganisms to degrade the PHC and other derivatives to carbon dioxide and water, or other less toxic intermediates. Experience has shown that when land-farming technology is properly executed for PHC contaminated soil, non-volatile components of petroleum and other related products are rapidly immobilized, so may not be leached out. This technology may involve nutrient enrichment in the form of fertilizer application or further manipulation of site conditions such as inoculations with selected or adopted microbial population, mixing and aeration of the soil surface, pH adjustment and irrigation. Using this technology an enhancement in the decontamination of 50cm topsoil of an area previously polluted with crude oil was achieved (Compeau, et al., 1991). Possible enhanced soil fertility recovery for such oil polluted agriculture soil has been demonstrated in soil microcosm experiments where germination and growth of sorghum grains were improved after treatment with adapted Azotobacter inoculum (Onwurah, 1999a).
2.3.2. Composting Technology
Composting technology is becoming important in the treatment of oil polluted coastal area. It involves the mechanized mixing of contaminated soil or sediment with compost-containing hydrocarbonoclastic bacteria, under aerobic and warm conditions. Through the addition of corn slash (post-harvest leaves and stems), microbial nitrogen fixation has been co-optimized with petroleum hydrocarbon degradation (Paerl, et al., 1996).
2.3.3. Bioreactors
A bioreactor is essentially an engineered system in which biochemical transformation of materials is promoted by optimizing the activity of microorganisms, or by “in vitro” cellular components of the microbial cells (enzymes). Bioreactors for the remediation of oil-polluted soil utilize an aqueous slurry phase system. Slurry bioreactor is considered as one of the fastest bioremediation technologies because contaminants can be effectively transported to the microbial cells. Some limiting factors affecting the slurry phase bioreactor process during decontamination of oil-contaminated soil and how they can be controlled are listed in Table 2.1. An attractive alternative to the slurry bioreactors for treating oil-contaminated soils are the rotating drum bioreactors since they can handle soils with high concentrations of petroleum hydrocarbons (Gray et al., 1994; Banerjee et al., 1995). The fluid phase enhances transport of nutrients and “solublized” or dispersed PHC contaminants to the degrading bacteria. With a bioreactor, temperature, pH and other parameters are optimized for degradation. The rotating drum bioreactor incorporated with blade impellers inside was demonstrated to be effective in decontaminating hydrocarbon-polluted soil (Hupe et al., 1995). The contaminated soil must be excavated, mixed with water and introduced into the reactor. Generally, the rate-limiting factors in any bioreactor system used for crude oil degradation are, the degree of PCH solubilisation through bio-surfactant production and the level or concentration of active biomass of hydrocarbon clastic bacteria maintained in the system (Stroo, 1992). Degradation products in bioreactors are easily monitored and input regulated. Bioreactors are however intrinsically more expensive than in situ or land treatment technologies because they are specialized.
2.3.4. Biodegradation
Biodegradation, especially by microbes, is one of the primary mechanisms of ultimate removal of petroleum hydrocarbons from polluted environments (Atlas, 1988; NRC, 1985). The acceleration of this natural process is the objective of bioremediation efforts. Seeding a contaminated environment with strains of bacteria that are tolerant and capable of degrading a high percentage of the contaminating petroleum hydrocarbons, and thus supplementing the natural resident microbial population has proven to be useful in bioremediation. The relative success of such adapted (oxotic) bacteria when added to crude oil polluted site will depend on a number of factors including competitive interactions with the native bacteria, their rate of growth in the system as well as their tolerance to the physio-chemical environment (Leahy and Colwell, 1990). The advent of high-throughput methods for DNA sequencing and analysis of genomes as well as modelling of microbial processes have revolutionized environmental biotechnology (Lovely, 2003). Genetically altered or engineered microorganisms
2.4. Sources and Effects of polluted soils in the Niger Delta
2.4.1. Sources
Oil spills are a common event in Nigeria [Baird, 2010]. Half of all spills occur due to pipeline and tanker accidents (50%), other causes include sabotage (28%) and oil production operations (21%), with 1% of the spills being accounted for by inadequate or non-functional production equipment. Corrosion of pipelines and tankers is the rupturing or leaking of old production infrastructures that often do not receive inspection and maintenance. (Nwilo, 2001)
A reason that corrosion accounts for such a high percentage of all spills is that as a result of the small size of the oilfields in the Niger Delta, there is an extensive network of pipelines between the fields, as well as numerous small networks of flow lines—the narrow diameter pipes that carry oil from wellheads to flow stations—allowing many opportunities for leaks. In onshore areas most pipelines and flow lines are laid above ground. Pipelines, which have an estimate life span of about fifteen years, are old and susceptible to corrosion. Many of the pipelines are as old as twenty to twenty-five years. (Bronwen, 1999)
Shell admits that “most of the facilities were constructed between the 1960s and early 1980s to the then prevailing standards. SPDC (Shell Petroleum and Development Company) would not build them that way today.”(SPDC, 1999) Sabotage is performed primarily through what is known as “bunkering”, whereby the saboteur attempts to tap the pipeline. In the process of extraction sometimes the pipeline is damaged or destroyed. Oil extracted in this manner can often be sold.
Sabotage and theft through oil siphoning has become a major issue in the Niger River Delta states as well, contributing to further environmental degradation. (Anderson, 2005) Damaged lines may go unnoticed for days, and repair of the damaged pipes takes even longer. Oil siphoning has become a big business, with the stolen oil quickly making its way onto the black market.(Bronwen, 1999).
While the popularity of selling stolen oil increases, the number of deaths are increasing. In late December 2006 more than 200 people were killed in the Lagos region of Nigeria in an oil line explosion. (CNN, 2016).
2.4.2. Effects of Oil Spillage on the Environment
Oil spillage has a major impact on the ecosystem into which it is released and may constitute ecocide. Immense tracts of the mangrove forests, which are especially susceptible to oil (mainly because it is stored in the soil and re-released annually during inundations), have been destroyed. An estimated 5 to 10% of Nigerian mangrove ecosystems have been wiped out either by settlement or oil. The rainforest which previously occupied some 7,400 km² of land has disappeared as well.
Spills in populated areas often spread out over a wide area, destroying crops and aquacultures through contamination of the groundwater and soils. The consumption of dissolved oxygen by bacteria feeding on the spilled hydrocarbons also contributes to the death of fish. In agricultural communities, often a year’s supply of food can be destroyed instantaneously. Because of the careless nature of oil operations in the Delta, the environment is growing increasingly uninhabitable.
People in the affected areas complain about health issues including breathing problems and skin lesions; many have lost basic human rights such as health, access to food, clean water, and an ability to work. [Baird, 2010] other socio-related effects are as follows:
- a. Human Health Risk
As much as it is sad to say or admit, a lot of people have suffered as a result of oil spillage in many different ways. Particularly people that live near the banks of Niger Delta are prone to these risks than any other. Oil definitely poisons the water and considering that people living there are mostly farmers that depend on it for their daily livelihood, it ends up affecting them health wise. As much as Oil brings many benefits, the risk it poses to human life is devastating.
- b. Damage to The Ecosystem
The impacts of oil pollution on marine ecosystem can be categorized into long term and short term effects. Suffocation cause by oil spills and oil poisoning are among the first group.Oil spills reduce oxygen absorption of the water, causing oxygen dissolution under oil spills to be even less than the deep sea levels. The oil penetrates and opens up the structure of the plumage of birds, reducing its insulating ability, and so making the birds more vulnerable to temperature fluctuations and much less buoyant in the water. It also impairs birds’ flight abilities, making it difficult or impossible to forage and escape from predators.
- c. Health Hazard to The Aquatic Animals
We all understand what the marine nature offers to our society. Oil spillage causes so much damage to the aquatic animals. The spillage poisons the water and eventually leads to death of the animals that come to contact with the area affected by it.
- d. Risk to Food Security
With poverty looming in some parts of the country, the oil spillage is making the situation even more critical. The spillages that occur on lands cause damage to the plants, it poisons the soil and leads to poor farm produce which should be among the major source of food stuff in the country.
- e. Loss of Aquatic Plants
There are several plants that play very important role in the water bodies. The Oil spillages sometimes get to the bottom and cause more harm to the aqua life. Some of the plants act as food to other species of aquatic animals. This generally leads to other poisoning that affects the entire ecosystem.
- f. Depletion of Fish Population
Fish has a special place in the nature’s food chain especially to humans. Considering the nutritional value of fish to the humans, playing a role in their depletion in a wasteful manner is the most unfortunate thing. Fishing is also one of the most profitable industries; taking good care not to destroy them has much more benefits to the society.
- g. A Danger to The Wildlife in General
Wildlife is one of the major tourist attractions of the country, the wildlife should always be protected at all cost. Unfortunately, oil spillage plays a big role in destroying the wildlife. As the oil spillage poisons the water, most of the wildlife is affected as they all depend on it.
- h. Pollutes The Air Leading to Other Illness.
It is known that oil has chemical gas that can get mixed up with the air we breathe, there are several cases reported that link to these chemicals. This effect can be fatal to individuals who are exposed to these chemicals.
- i. Acid Rain
Acid rain is also another factor as the rain water becomes corrosive and also pollutes the remaining water sources. This also affects the plants and soil in general. Acidic soil affects the plants negatively; plants don’t get enough nutrients leading to poor produce.
- j. Poverty
Poverty is a state that exists to be fought at all times, it can only be achieved with concentration. The major problem is that the oil spillage diverts money that would have been used to help eradicate poverty to other use like treating the affected areas.
It is unfortunate to say that most of these spillages which are sometimes termed as accidents are due to human error. Companies in such matters should always treat this matter as very important and make an important step to deal with it. It is important to ensure that the future of the next generation is safe guarded, we should all take this as a challenge and deal with this issue on a personal level or else it will come to haunt us in the near future.
2.5. Mechanisms for Phytoremediation of Hydrocarbons
Phytoremediation is the use of plants and their associated microorganisms to remove, sequester or degrade contaminants in soil (Cunningham et al., 1996). Phytoremediation is a proposed technique to remediate both inorganic contaminants like heavy metals (Brown et aI., 1994; Pilon-Smits et al., 1999), and organic like pesticides (Siciliano and Germida, 1998b) and petroleum hydrocarbons (Aprill and Sims, 1990). Plants useful for remediation of inorganics are species that hyperaccumulate the element of concern (Banuelos et al., 1997). The plants are eventually harvested, removing the metals from the soil; this is called phytoextraction (Ebbs et al., 1997). Some plants can also volatilize (i.e., transfer the contaminant to the atmosphere) heavy metals (Zieve and Peterson, 1984, Pilon-Smits and Pilon, 2002).There are three mechanisms by which organic contaminant phytoremediation can occur: degradation, stabilization, and volatilization (Sims and Overcash, 1983; Cunningham et al., 1996; Siciliano and Germida, 1998b). While stabilization or volatilization is acceptable in some situations, degradation of the contaminant into nontoxic compounds is the most desirable outcome.
2.5.1. Degradation
Degradation occurs when hydrocarbons are broken down into simpler and usually less toxic compounds (Eweis et al., 1998). Plants and microorganisms in isolation, and in association, degrade hydrocarbons. However, the ability to degrade hydrocarbons is much less common in plants than in microorganisms.
2.5.2. Stabilization
Stabilization occurs when a plant reduces the bioavailability of a contaminant; the contaminant is not, however, degraded. This method of phytoremediation is useful in situations where prevention of ground water contamination is desired, or where the contaminant is not mobile or toxic to humans (Cunningham et al., 1996).
2.1.3. Volatilization
In some cases, chemicals are neither degraded nor stabilized; they are volatilized into the atmosphere. Plants absorb some chemicals through their roots and then release them into the atmosphere through stomata (Wiltse et al., 1998). Naphthalene volatilization is enhanced by the presence of bell rhodesgrass (Chloris Gayana Kunth). Nitrobenzene volatilization is a major route of chemical loss when soybean, barley (Hordeum vulgare L.), hybrid poplar (Populus x robusta Schneid.) and honeysuckle (Lonicera tatarica L.) are grown in soil contaminated with this chemical. About 10% of diesel range hydrocarbons (C11- C16) in soil are volatilized over 150 days when planted with grasses. Diesel volatilization over 360 days is 580/0 when white clover (Trifolium repens L.) and ryegrass (Lolium perenne L.) are grown together. Larger hydrocarbons may be less likely to volatilize: less than 2% of benzo(a) Yrene (a five-ring hydrocarbon) loss from silty loam soil planted with tall fescue is due to volatilization. Concerns regarding volatilization arise when the chemical is potentially dangerous in its gaseous form. (Robson, 2003).
CHAPTER 3: MATERIALS AND METHODS
STUDY SITE
In the southeastern part of the Niger Delta basin, Ogoniland stretches across an area of approximately 1,000 km². According to the 2006 National Census, the region is home to a population of nearly 832,000 individuals, predominantly belonging to the Ogoni ethnic group. Throughout the past few decades, Ogoniland has experienced repeated episodes of social unrest, primarily driven by concerns regarding the activities of the oil industry and the equitable sharing of its profits. Despite over £30bn worth of oil extracted from the region, a significant portion of the local population finds themselves in a more challenging socio-economic situation compared to before the arrival of these companies. The research was conducted in the Ogoni community, specifically focusing on areas near decommissioned oil wells. The study examined both surface spills and buried flare pits, which are excavated soil pits used for depositing petroleum waste and burning off natural gas. Given that contamination with unrefined petroleum hydrocarbons took place over several years at certain sites, and the precise age of the spill(s) was not always known, the contamination age was classified as “Nil.” The degree of human disturbance varied across different plots within the study area.
In certain plots, cultivation had taken place the previous year, indicating recent agricultural activity. In other plots, soil had been excavated and mechanically removed as part of ongoing site reclamation efforts. The contaminated plots had soil that was compacted using pickup cans, which served as the soil substrate for the study. The spills in the study area were larger than 1 hectare, with the buried flare pits being the largest in size. None of the contaminated plots had been grazed by cattle, as there was no available data on the intensity and duration of grazing at these specific sites.
FOR SOIL SAMPLING PURPOSES,
two separate plots measuring 1 square meter each were designated at every site. One plot was located on contaminated soil, while the other was set on uncontaminated soil. To ensure a sufficient distance between the two types of plots, a minimum gap of 20 meters was maintained. This approach allowed a comprehensive comparison between the contaminated and uncontaminated soil conditions at each site.
To collect soil samples from the contaminated plots, soil from the depth of 0 to 15 cm was collected using a hand shovel. The collection was done at the center of each subplot. The collected soil, which consisted mainly of sandy-loamy soils, clay soils, and swampy soil, was mixed in a plastic bucket. Subsequently, 125 mL samples were taken from the mixture and placed in sealed glass containers. The containers used for this purpose complied with the guidelines provided by the EPA in Edmonton, AB (#JCOI25-24NC, CA63450-006). The soil samples were then stored at ambient temperature, approximately 25°C.
Before analysis, the collected soils underwent a process of sieving through a 5 mm sieve to remove rocks and tar clumps. This sieving step was carried out to ensure that only the desired soil particles were included in the analysis. The analysis took place within one month of the initial soil collection to maintain the integrity of the samples. For the analysis, the soil samples from each plot were examined for the percentage of carbon (%C) and nitrogen (%N) content. This analysis was conducted using a LECO CNS-2000 Analyzer, manufactured by LECO Corporation in Mississauga, ON. In addition to %C and %N analysis, petroleum hydrocarbons in a 1g soil sample from each subplot were extracted using a mechanical shaking extraction method. This extraction process was performed three times in sequence, using acetone as the solvent. The methodology used for this extraction follows the approach described by Schwab et al. in 1999.
To analyze the soil extract samples, a 1 milliliter portion from each subplot was used. The analysis was performed using a Hewlett-Packard 5890 gas chromatograph (GC) equipped with a flame-ionization detector and an HP1 capillary GC column. During the analysis, a helium carrier gas was used at a flow rate of 35 cc/minute. The column temperature was initially set at 40°C for a duration of two minutes. Following this, the temperature was ramped up at a rate of 17 °C/minute until reaching a final temperature of 275 °C. This analytical setup allowed for the detection and quantification of various components present in the soil extracts, providing valuable information about the composition and concentration of substances of interest in the samples…
Indeed, studying the different soil samples in their unpolluted, polluted, and during the remediation process is crucial for gaining a comprehensive understanding of the soil dynamics and the effectiveness of the remediation efforts. By comparing unpolluted soil samples with polluted ones, we can identify the extent and nature of contamination, as well as assess any changes in soil properties and composition caused by the pollution. Furthermore, monitoring the soil during the remediation process allows us to evaluate the effectiveness of the remediation methods being employed. This includes assessing the degree of pollutant removal, any changes in soil quality and fertility, and the overall progress of the restoration efforts. Analyzing these different soil conditions provides valuable insights into the impacts of pollution, the potential risks to ecosystems and human health, and the success of remediation strategies. It enables informed decision-making and the implementation of appropriate measures to restore and protect the soil environment.
FOR THE VERNONIA LEAF SAMPLE COLLECTION AND EXTRACT PREPARATION
Vernonia leaves were obtained from Rumuokoro and Mile 1 markets in Obio-Akpor Local Government of Rivers State. To extract the Vernonia leaf juices, a juice extractor was utilized immediately after harvesting the leaves. The Vernonia juice or extract, as well as the remaining chaff, were collected and used for further analysis. The Vernonia chaff, or leftover plant material, underwent post-treatment in three distinct ways. Unfortunately, the specific details of these post-treatment methods are not provided in the given information. However, different post-treatment techniques can include drying, grinding, chemical treatment, or other processes that modify or enhance the properties of the Vernonia chaff for subsequent analysis. These post-treatment methods are typically employed to ensure optimal conditions for the desired analysis or to prepare the chaff for specific experiments or investigations.
THE POST-TREATMENT METHODS FOR THE VERNONIA CHAFF/REMAINS
Here’s a summary of the information:
- The Vernonia chaff/remains were placed in the sun to dry. This method involves exposing the chaff to sunlight, allowing the moisture to evaporate naturally and facilitating the drying process.
- The Vernonia chaff/remains were placed to dry in room conditions. In this method, the chaff is left in a room with normal environmental conditions, allowing air circulation to aid in the drying process.
- The Vernonia chaff/remains were left wet. This indicates that no specific drying method was employed, and the chaff was kept in its wet condition for further analysis. These different post-treatment techniques provide variations in the moisture content and physical properties of the Vernonia chaff, which may impact subsequent analysis or experimentation.
REGARDING THE ANALYSIS OF THE VERNONIA EXTRACTS, TWO DIFFERENT TYPES OF ANALYSIS WERE CONDUCTED:
- Physio-chemical analysis: This analysis aims to determine the composition of specific chemical species present in the Vernonia extract. It includes assessing factors such as pH, presence of certain compounds, elemental composition, or other physicochemical properties of the extract.
- Microbial analysis: This analysis is performed to investigate whether the Vernonia extract can support the presence and stability of microorganisms. It helps determine if the extract provides a favorable environment for microbial growth, colonization, or inhibition. By conducting these analyses, valuable insights can be gained regarding the chemical composition and microbial properties of the Vernonia extract, contributing to a better understanding of its potential applications and effects.
3.3.2. TO CONDUCT THE MICROBIAL ANALYSIS, THE FOLLOWING MATERIALS ARE REQUIRED:
- Conical flask: Used for holding and mixing liquids during the analysis.
- One 5 ml syringe: Used for precise measurement and transfer of liquids.
- One 1 ml syringe: Used for more accurate and smaller volume measurements.
- Distilled water: Used as a solvent or diluent for various solutions.
- Nutrient agar: A solid growth medium used for culturing and isolating microorganisms.
- Vernonia leaf extract from the four species of bitter leaf (Vernonia amygdalina and Vernonia galamensis bitter leaf): The extract obtained from the Vernonia leaves, which will be used for microbial analysis.
- 30 Petri dishes: Used as containers for the agar medium and microbial cultures.
- Masking tape: Used for labeling and identification purposes.
- Cotton wool: Used for sterilization and plugging of test tubes
- Aluminium foil: Used for covering the Petri dishes to protect the cultures.
- Test tubes: Used for preparation and storage of samples or media.
- Nutrient broth: A liquid growth medium used for cultivating microorganisms.
- Autoclave: A device used for sterilizing equipment and media through high-pressure steam.
- Weighing balance: Used for accurately measuring the weight of substances. These materials are essential for conducting the microbial analysis and ensuring the proper cultivation, identification, and characterization of microorganisms present in the Vernonia leaf extracts.
THE PROCEDURES FOR THE MICROBIAL ANALYSIS ARE AS FOLLOWS:
- Wash the conical flask, test tubes, and petri dishes with distilled water. This step ensures cleanliness and reduces the risk of contamination during the analysis.
- Prepare the nutrient agar culture: a. Dissolve 28 grams of nutrient agar in 1 liter of distilled water to prepare the standard culture. This forms the base for the nutrient agar medium. b. Using a spatula, carefully place the powdered nutrient agar on the foil. c. In a conical flask, dissolve 3 grams of the weighed nutrient agar powder in 100 ml of distilled water. d. Cover the conical flask with cotton wool to prevent contamination. After completing these steps, you can proceed with further analysis and experimentation. It is important to maintain a sterile environment throughout the process to ensure accurate results and prevent unwanted microbial growth.
TO PREPARE THE NUTRIENT BROTH CULTURE, FOLLOW THESE STEPS:
- Place a small piece of aluminum foil on the digital weighing balance and zero the scale to ensure accurate measurements.
- Using a spatula, carefully place the pellets of nutrient broth on the foil until the weighing balance reads 5 grams. This ensures the correct amount of nutrient broth for the culture.
- In a conical flask, dissolve the weighed 5 grams of nutrient broth in 500 ml of distilled water. Stir or swirl the flask gently to aid in the dissolution process. By following these steps, you will have prepared the nutrient broth culture. This liquid medium is commonly used for cultivating and growing a wide range of microorganisms. It provides necessary nutrients to support microbial growth and can be used for various purposes in microbial analysis, such as culturing and studying specific bacteria or fungi strains.
- Using the 1 ml syringe, collect 20 milliliters of the nutrient broth water
- Carefully transfer the collected nutrient broth water into 6 test tubes, distributing approximately 20 milliliters in each test tube.
- Cover each test tube with cotton wool. This acts as a barrier to prevent contamination from external microorganisms.
- 4 Wrap aluminum foil around each test tube to further protect them and maintain their sterility.
- Once the test tubes are properly covered and wrapped, they are ready for sterilization using an autoclave. Autoclaving is a process that effectively kills microorganisms and ensures the sterility of the samples. Follow the manufacturer’s instructions or standard laboratory protocols for autoclaving to properly sterilize the test tubes. By following these steps, you will have prepared the nutrient broth culture in the test tubes, ensuring their sterility and readiness for further analysis or experimentation.
- 1 ml syringe: Used for precise measurement and transfer of liquids during the dilution process.
- 6 sterilized test tubes with nutrient broth: These test tubes containing nutrient broth are pre-sterilized and ready for use in the dilution process. They provide a growth medium for the microorganisms present in the Vernonia leaf extract.
- Vernonia leaf extract: The Vernonia leaf extract obtained previously, which will be diluted for further analysis. 4.
- Bunsen burner: A gas burner used for sterilization purposes. It provides a high-temperature flame to sterilize the syringe and other equipment by passing them through the flame. These materials are essential for performing a serial dilution, a technique used to decrease the concentration of a substance, in this case, the Vernonia leaf extract, to a level suitable for microbial analysis. The dilution process allows for the isolation and enumeration of microorganisms present in the extract by reducing their initial concentration.
TO PERFORM A TENFOLD SERIAL DILUTION, FOLLOW THESE STEPS:
- Collect 1 ml of Vernonia leaf extract from each different species and place it in a separate test tube containing nutrient broth. This step ensures that each species extract is diluted individually.
- Shake each test tube vigorously to ensure thorough mixing of the Vernonia leaf extract with the nutrient broth.
- From the first test tube, take 5 ml of the mixture and transfer it to a new test tube.
- Shake the second test tube vigorously to mix the 5 ml of the mixture with the nutrient broth.
- From the second test tube, take 1 ml of the mixture and transfer it to another new test tube.
- Repeat this process by taking 1 ml from the previous test tube and adding it to a new test tube until you obtain about 20 test tubes that have been serially diluted.
By following these steps, you will have successfully performed a tenfold serial dilution of the Vernonia leaf extract. Each subsequent dilution reduces the concentration of the extract, allowing for the isolation and enumeration of microorganisms present in the initial sample. This process provides a range of diluted samples for further analysis and microbial counting.
TO CONTINUE WITH THE PREPARATION OF THE CULTURE, FOLLOW THESE STEPS:
- Pour approximately 20 ml of nutrient agar into each sterilized petri dish. Make sure to distribute the agar evenly across the dish.
- Invert the petri dishes so that the nutrient agar hangs from the top of each dish. This is done to allow the agar to solidify and adhere to the bottom surface of the dish.
- Wait until the nutrient agar has completely solidified and sticks to the top of the petri dishes. This ensures a stable surface for the subsequent steps.
- Take 1 ml from each of the serially diluted broth cultures and place it in a separate petri dish. This step involves transferring the diluted broth culture onto the solidified nutrient agar.
- Carefully spread the 1 ml of diluted broth culture across the surface of each petri dish using a sterile spreader or an appropriate technique, ensuring an even distribution.
- Once the diluted broth culture has been spread, cover the petri dishes and place them into an incubator or a temperature-controlled environment where the temperature is maintained at 37°C (not 370°C, as that would be extremely high). By following these steps, you will have prepared the culture by inoculating the serially diluted broth cultures onto nutrient agar plates. The incubation at 37°C promotes the growth of microorganisms, allowing for their visual observation and further analysis.
For the preparation of plant material and plant extracts, a total of four different extraction solvents were employed, namely cold ethanol, hot ethanol (at a temperature of 80°C), cold water, and hot water (also at a temperature of 80°C). These solvents were utilized for the extraction of the desired constituents from the plants.
FOR THE HOT ETHANOLIC AND HOT AQUEOUS EXTRACTION METHODS, 50 grams of finely ground powder from V. amygdalina and V. galamensis were separately placed in two conical flasks. Subsequently, 200 ml of absolute ethanol was added to the ground V. amygdalina, while distilled water was added to the ground V. galamensis. The mixture in each flask was then heated to a temperature of 80°C using a water bath and allowed to stay at this temperature for 1 hour. Afterward, the mixture was cooled down, passed through a muslin cloth, and filtered using a Whatman No.1 filter paper with a diameter of 110 mm
The filtrate obtained from the extraction process was subjected to evaporation at a controlled temperature of 45°C until it completely dried out. The resulting residue was carefully stored inside aluminum foil to maintain its integrity. Later on, the residue was reconstituted in 95% ethanol to create a stock solution with a concentration of 250 mg/ml, which was stored at a temperature of 4°C.
FOR THE COLD ETHANOIC AND COLD AQUEOUS EXTRACTION METHODS,
50 grams of finely ground powder from V. amygdalina and V. galamensis were separately placed in a conical flask. Subsequently, 200 ml of absolute ethanol was added to the ground V. amygdalina, while distilled water was added to the ground V. galamensis. The mixture in each flask was left undisturbed for a period of 48 hours. Afterward, the extract was carefully decanted and passed through a muslin cloth, followed by filtration using a Whatman No.1 filter paper with a diameter of 110 mm.., The obtained filtrate underwent a process of evaporation at a controlled temperature of 45°C until it reached a state of complete dryness. The resulting residue was then reconstituted in a solution of 95% ethanol, resulting in a stock concentration of 250 mg/ml.
FOR THE TESTS, THREE CLINICAL ISOLATES OF BACTERIA WERE COLLECTED. The bacterial species included Pseudomonas aeruginosa, Staphylococcus aureus, and Escherichia coli. All of these bacterial species were maintained on nutrient agar slopes and stored in a refrigerator. To ensure consistency, the inoculums of each bacterial species were standardized using the method described by Bauer et al. (1966).
TO ASSESS THE ANTIBACTERIAL ACTIVITY OF THE PLANT EXTRACTS, THE AGAR DILUTION METHOD WAS EMPLOYED
The bacterial isolates were inoculated onto Mueller Hinton Agar (MHA) plates and incubated at a temperature of 37°C for a period of 18 to 24 hours. The minimum inhibitory concentration (MIC) of the plant extracts was determined using the method described by Oyagade et al. (1999)
IN ORDER TO IDENTIFY THE PRESENCE OF VARIOUS PLANT CONSTITUENTS, A PHYTOCHEMICAL SCREENING OF THE LEAVES EXTRACTS WAS CONDUCTED. This screening aimed to detect the presence of constituents such as alkaloids, tannins, saponins, phenols, glycosides, phlobatannins, flavonoids, and glycosides. The screening was performed using specific methods that are described below ..
TO TEST FOR THE PRESENCE OF SAPONINS, TWO MILLILITERS OF THE AQUEOUS AND ETHANOLIC EXTRACTS WERE PLACED IN SEPARATE TEST TUBES.
The contents of each test tube were shaken vigorously for a duration of two minutes. The presence of persistent frothing upon shaking was considered as evidence for the presence of saponins.
TO TEST FOR THE PRESENCE OF ALKALOIDS,
Three milliliters of the ethanolic and aqueous extracts were separately stirred with 5 ml of 1% hydrochloric acid (HCl) on a steam bath for a duration of twenty minutes. The resulting solution was then allowed to cool and filtered. A few drops of Mayer’s reagent or picric acid were added to the filtrate. The formation of a cream precipitate indicated the presence of alkaloids
TO TEST FOR THE PRESENCE OF PHENOLICS.
Two drops of 5% ferric chloride were added to 5 ml of both the ethanolic and aqueous extracts in separate test tubes. The formation of a greenish precipitate upon the addition of ferric chloride was taken as an indication of the presence of phenolics
TO TEST FOR THE PRESENCE OF TANNINS.
1 ml of freshly prepared 10% potassium hydroxide was added to both the ethanolic and aqueous extracts in separate test tubes. The formation of a dirty white precipitate upon the addition of potassium hydroxide was taken as an indication of the presence of tannins
TEST FOR STEROIDS
To a volume of 1 ml of the extracts, five drops of concentrate tetra-oxoiosulphate VI acid was added. Red coloration indicated the presence of steroids
BIOREMEDIATION EXPERIMENT
Materials: 30 plastic bottles cut open used as reactors, the soil samples, Crude oil (bonny Light) And Vernonia leaf extracts
PRE-ANALYSIS TEST
The pre-analysis test consists of test before the contamination of the soil. This is to be used as a set point for the bio-remedial process. The soil samples of sandy-loamy, clay and swamp are tested from BGI laboratory limited. The crude is also analysed using the Gas chromatograph to ascertain the properties of the crude. Lastly, the Microbial and Phytochemical screening is done on the leaf extracts. This is to determine the micro-organisms present in the leafs that is to act in the bio remedial process.
PROCEDURES
50ml of crude oil was introduced into the soil to pollute the soil, the soil samples were then well mixed and stirred to obtain uniform concentration, Vernonia extract was then added into the reactors. The extracts were added in varying grams starting from 10g -40g to see the effects on the soil from 1-30days. The readings of the soil were taken before and after the application of the pollution reagent (bonny light). This is to see the remediation effect of the leaves on the different soil types. Most importantly, the remediant application was of great importance. Two different application was considered. The first is the sun dried leaves and secondly the room dried leaves.
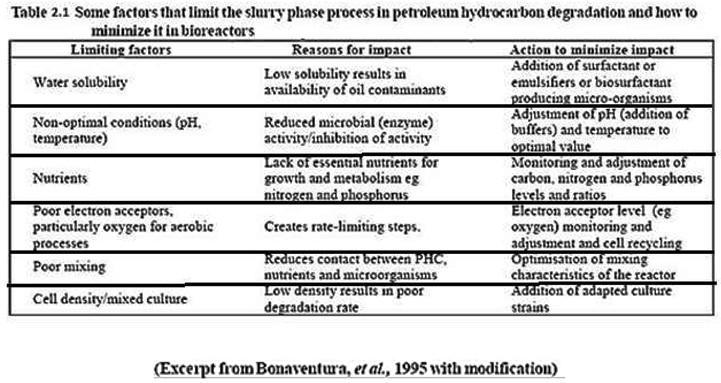
In the reactors operated under moist conditions 5ml of water was added to them every 5 days to replenish their moisture content. The pH, hydrocarbon content, metal concentrations and microbial activity was measured every five days starting from day zero when the experiment was set-up up to day 30 when the bioremediation experiment was halted.
INTERMEDIATE TESTING.
The intermediate testing is the analysis done on the mixture after two weeks of experimenting. This will involve all the tests that were done in the pre-analysis test. The essence is to see the bio remediating process going on through the addition of the leaf extracts in the soil-crude mixture.
CHAPTER 4: RESULTS AND DISCUSSIONS
BIO REMEDIAL ANALYSIS
During the measurement intervals of the crude oil polluted soil samples, the remedial activities are documented based on the specific methodology employed prior to the application of Vernonia extract. These remedial activities capture the steps and processes involved in treating the polluted soil, which can vary depending on the nature of the methodology adopted. By recording these activities at different intervals, researchers can track the progress of the soil remediation process and evaluate the effectiveness of the applied Vernonia extract in mitigating the crude oil pollution. This information helps in understanding the dynamics of the remediation process and determining the optimal application techniques for Vernonia extract in achieving successful soil restoration.The study involves several key subdivisions that play a significant role in the remediation process of the contaminated soil using Vernonia extracts. Firstly, the bitter-leaf preparations are categorized into three different methods: room drying before application, sun drying before application, and wetting, which involves blending the bitter-leaf with the contaminated soil. These different preparation methods may have varying effects on the overall remediation process. Secondly, the study takes into account the influence of three different soil types on the remediation process. Each soil type may have distinct characteristics that can impact the effectiveness of the Vernonia extracts in reducing contamination levels. Furthermore, the study examines the impact of two different Vernonia extracts: Vernonia galamensis and Vernonia amygdalina. These two extracts may possess unique properties and compositions that can affect their remedial capabilities. Lastly, the time for the remedial processes is a crucial factor in understanding the efficiency and effectiveness of the remediation activities. By observing and analyzing the remediation progress at different time intervals, researchers can evaluate the rate of contaminant reduction and the overall efficacy of the remediation process. By considering these major subdivisions, the study aims to comprehensively investigate and understand the complex dynamics of using Vernonia extracts in remediating contaminated soil.
4.1.1. Swampy Soil Bio Remedial Analysis
In the study, swampy soil samples were collected and mixed with Bonny Light crude oil to simulate the conditions of the Ogini pollution scenario. The soil samples were measured before and after the crude oil was mixed to assess the impact of the contamination. Additionally, the study focused on measuring the response factors that are central to our investigation. Table 4.1 presents the initial and final conditions of these response factors. These recorded measurements provide valuable insights into the changes that occurred as a result of the crude oil contamination. By comparing the initial and final conditions, researchers can analyze the extent of the impact on the response factors and evaluate the effectiveness of the remediation methods employed. This data plays a crucial role in understanding the effects of the contamination and the potential efficacy of the remedial measures implemented in the study.
Table - Initial and Final readings of the Response factors for swampy soil
| pH and HC readings for samples before contaminant | |||||
| Initial Content sample | pH | HC | Pb (ug/ml) | Zn (ug/ml) | Cr(ug/ml) |
| Sandy Loam Soil, SLSi | 6.76 | 2.59 | 0.018 | 0.022 | 0.015 |
| pH and HC readings for samples after contaminant | |||||
| Final Content sample | pH | HC | Pb (ug/ml) | Zn (ug/ml) | Cr(ug/ml) |
| swamp soil, SSf | 6.81 | 4.7 | 1.24 | 0.921 | 1.107 |
pH Analysis
In the experimental set-up, a total of 30 reactors were utilized to conduct various observations. Specifically, in the case of the room dried Vernonia extracts, Figure 4.1 illustrates the pH behavior as the number of days increases, considering different applications of leaf extracts. Figure 4.1 captures the trends and changes in pH levels over time for the room dried Vernonia extracts. The different leaf extract applications are likely to have varying effects on the pH of the soil samples. By visually representing this data, researchers can analyze how the pH values evolve and potentially identify any patterns or trends that emerge as the days progress. This information provides valuable insights into the impact of the room dried Vernonia extracts on the soil’s pH, helping researchers understand the effectiveness of this particular application method in altering the soil’s acidity levels.
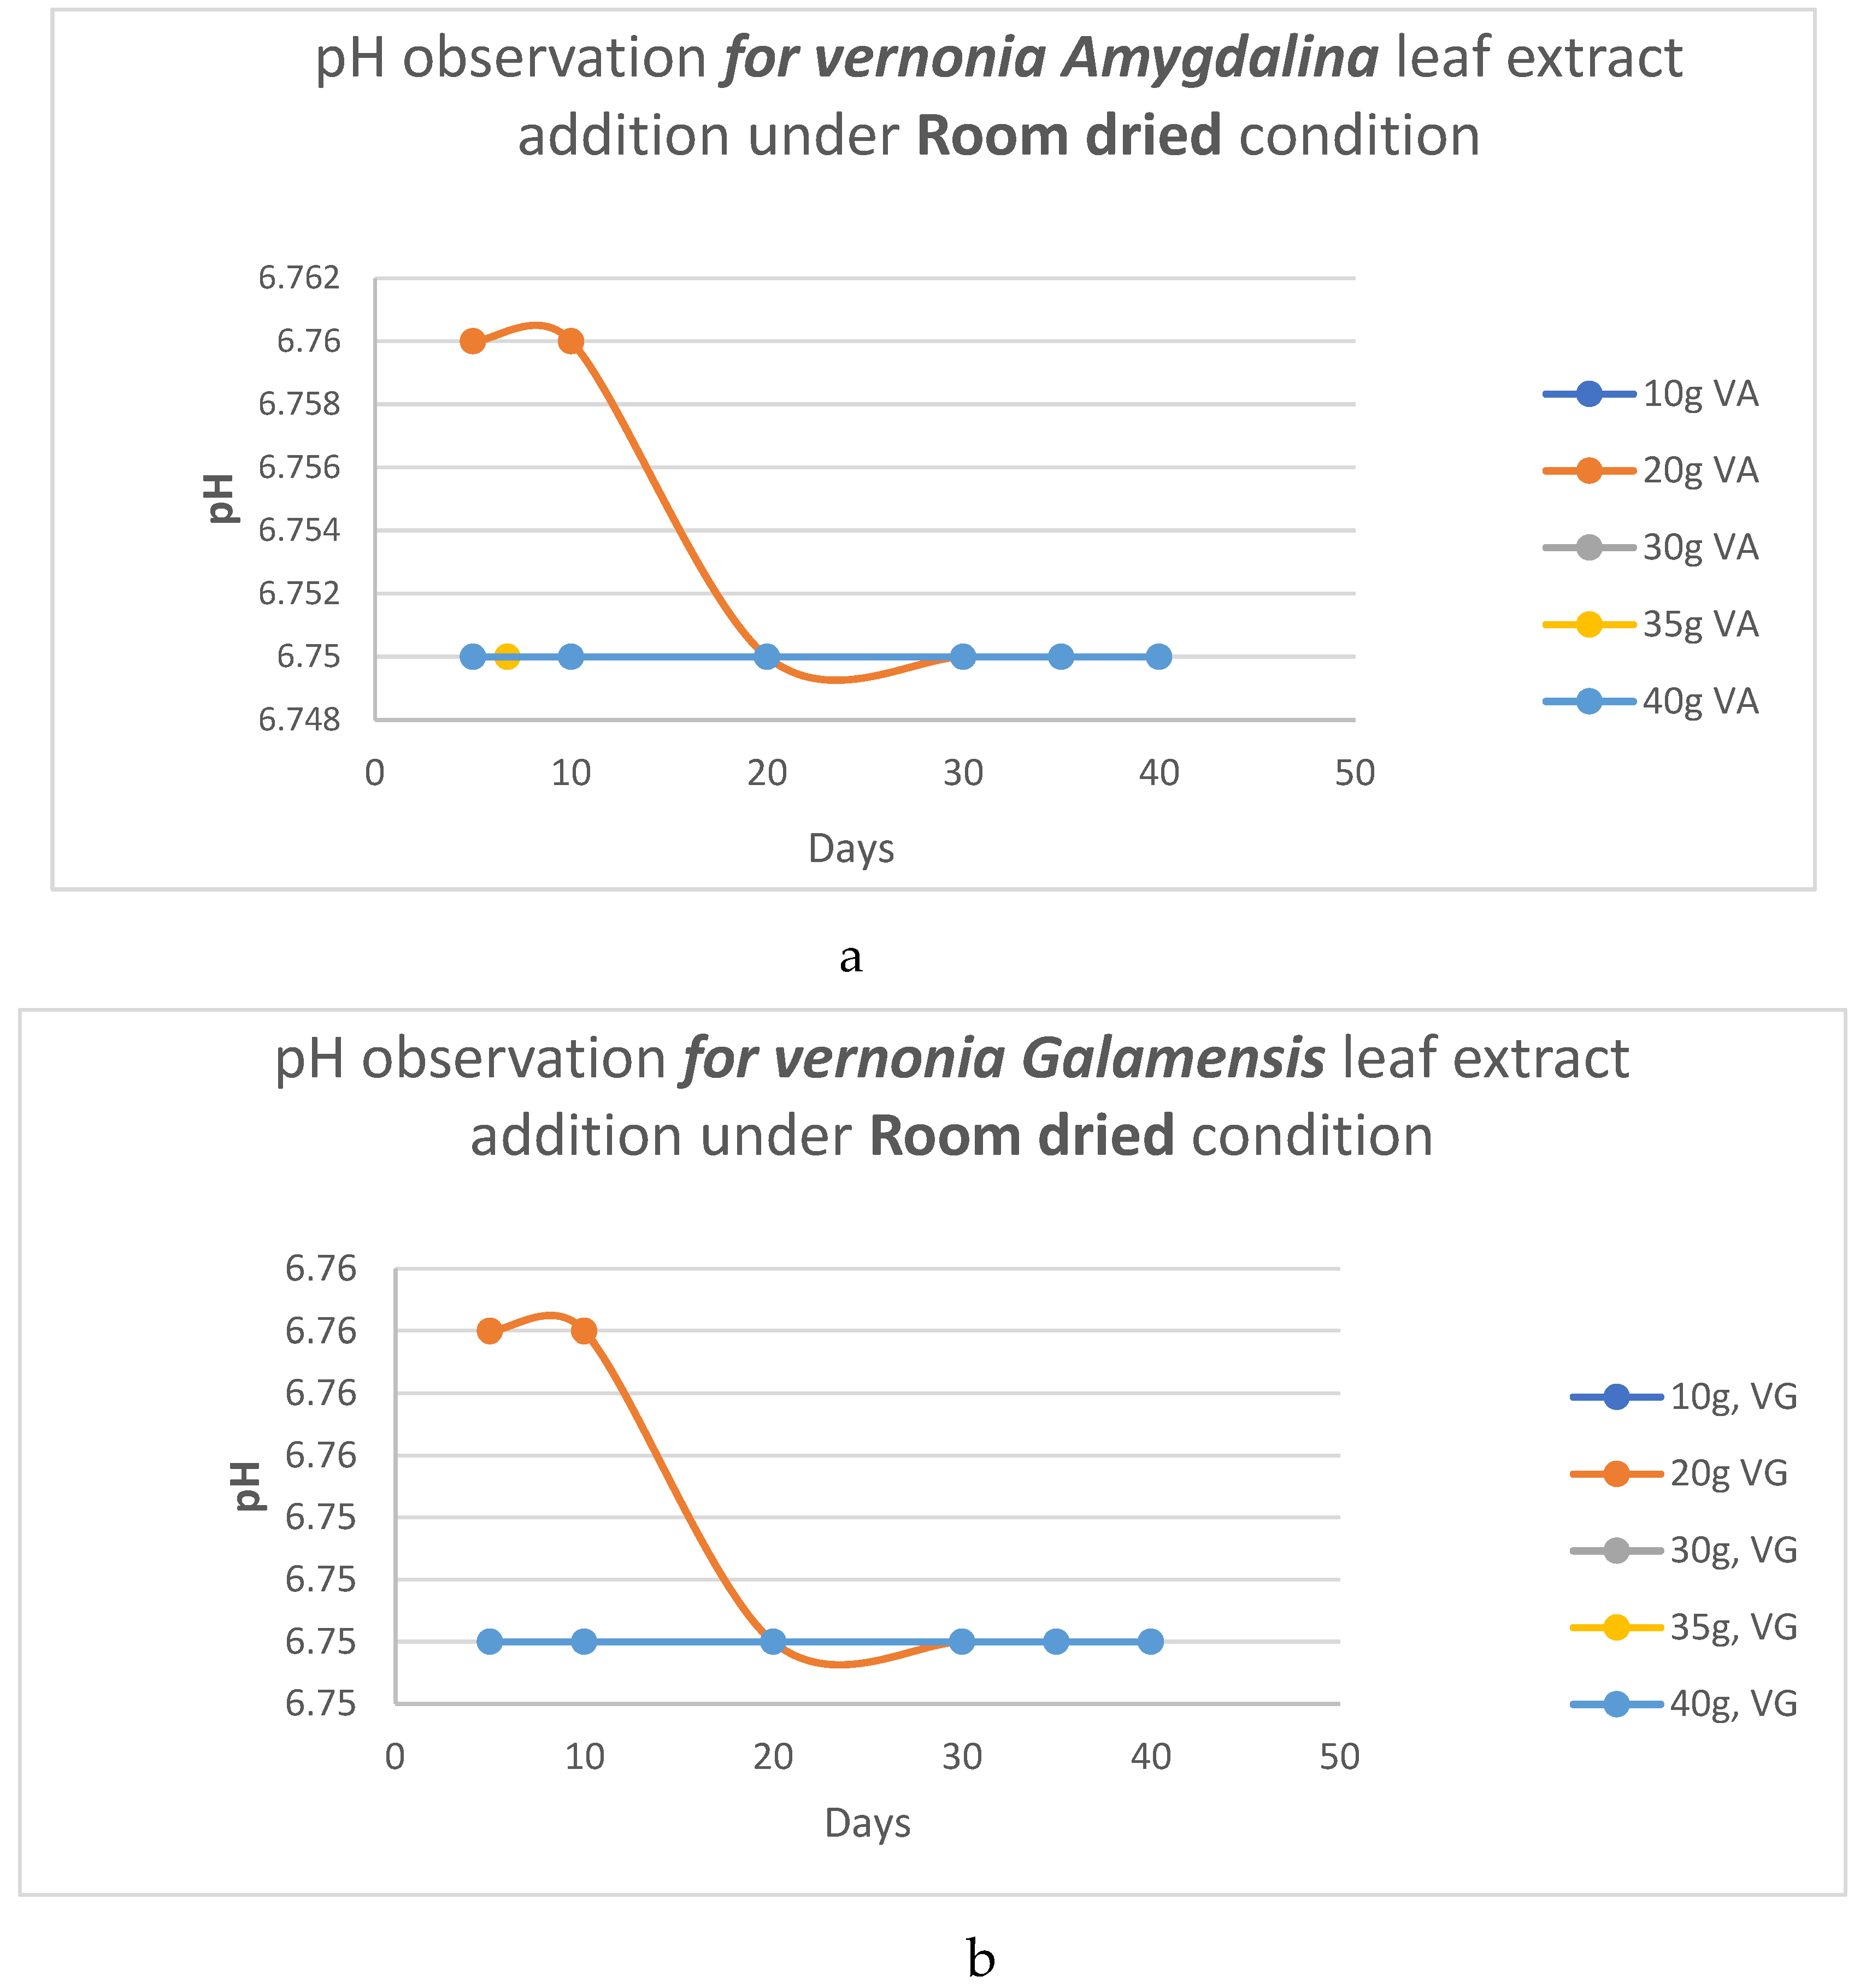
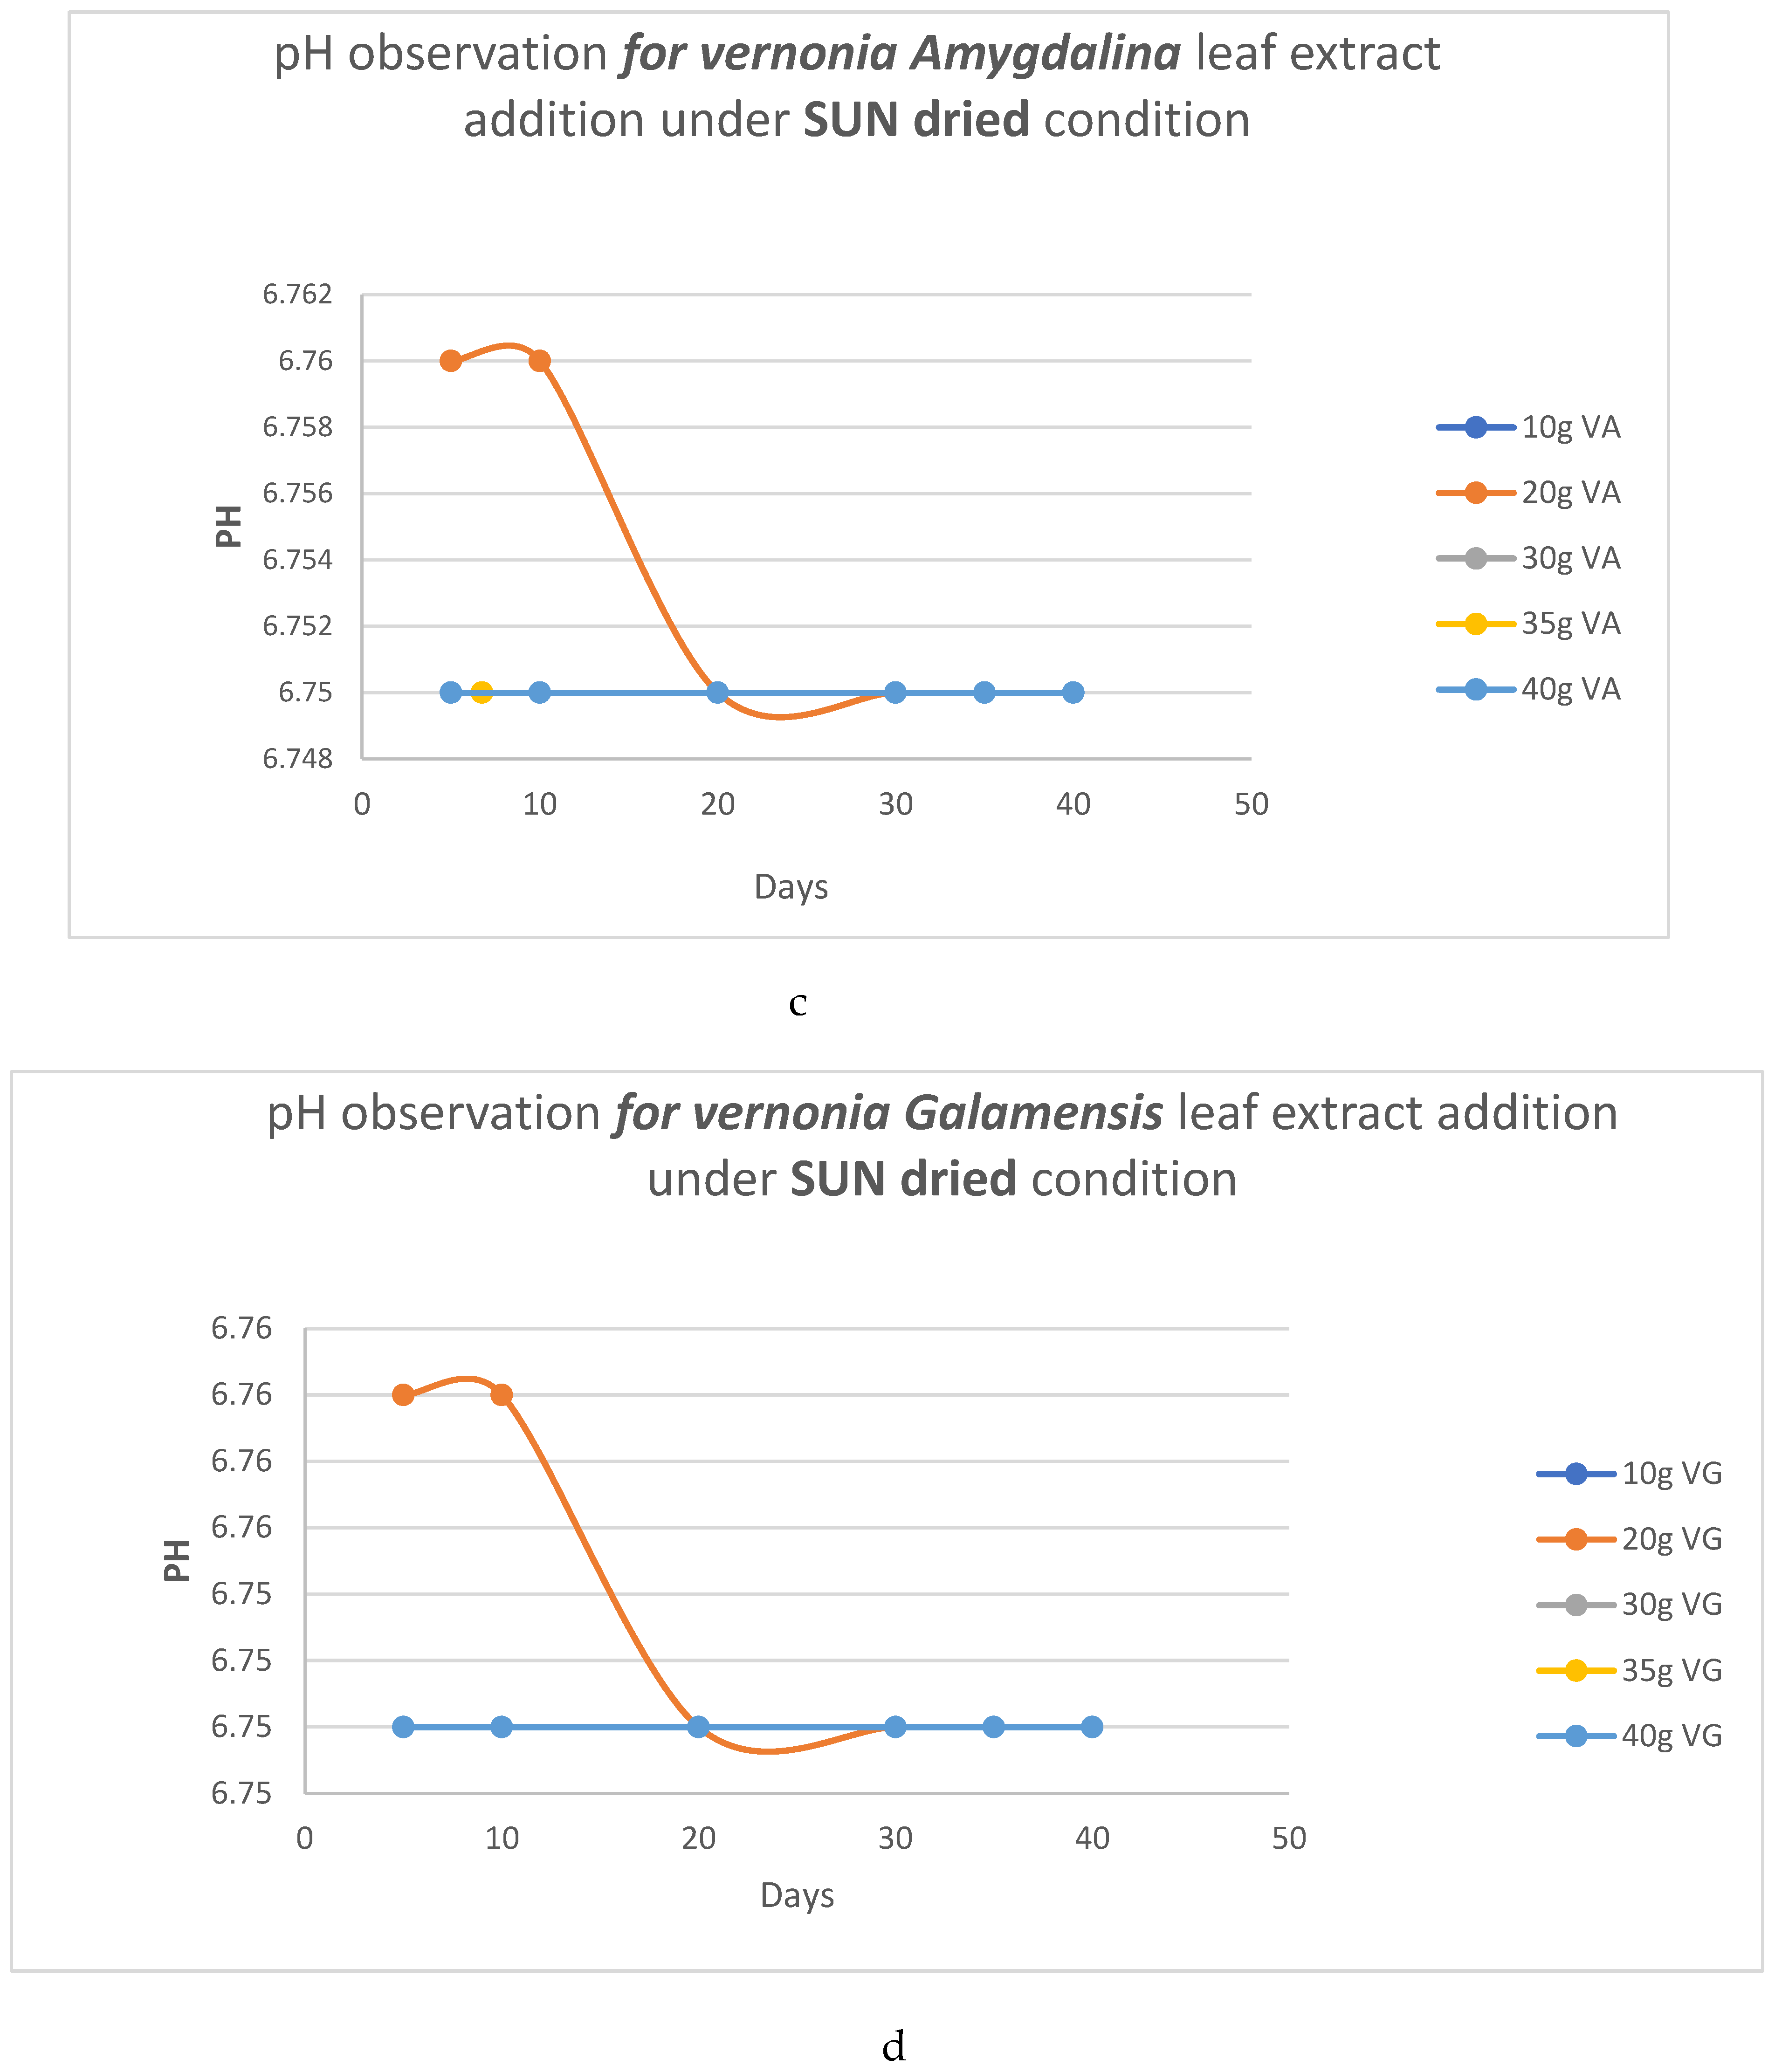
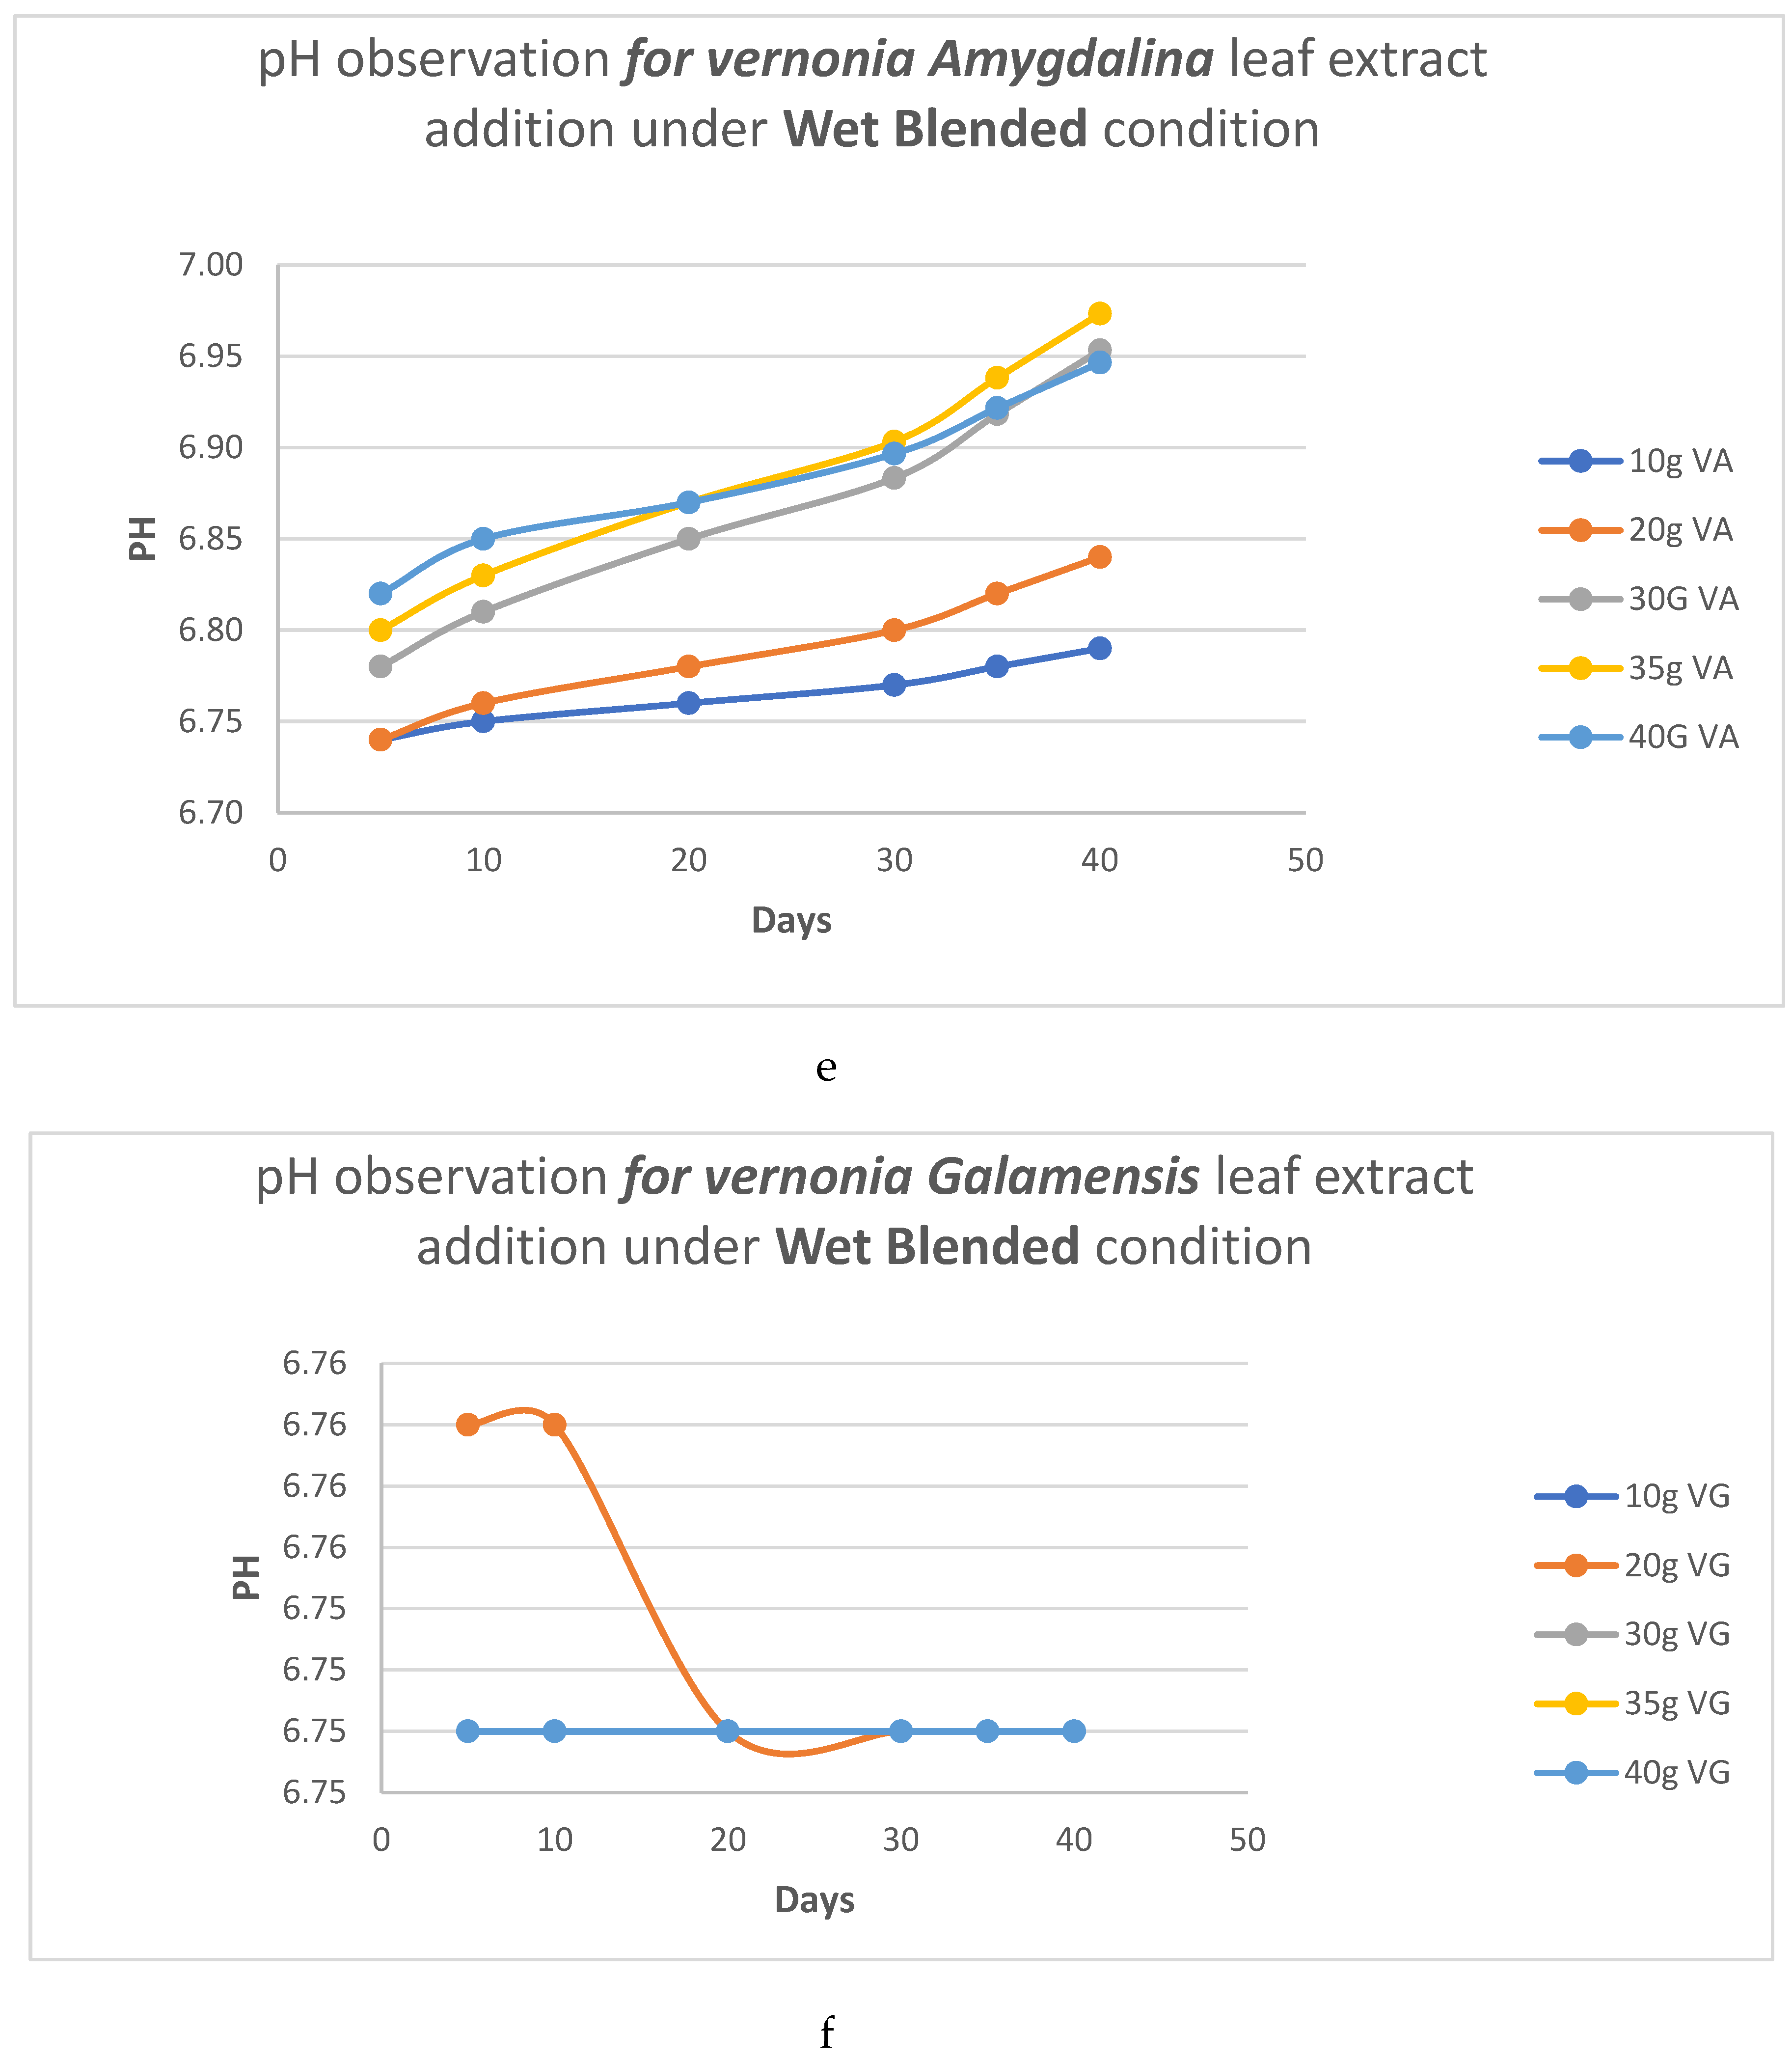
Figure 4.
1,a,b,c,d,e,f: pH behavioural characteristics of the vernonia extracts using different application methods on swampy soil.
Figure 4.
1,a,b,c,d,e,f: pH behavioural characteristics of the vernonia extracts using different application methods on swampy soil.
The study reveals that for low applications of Vernonia extract, specifically within the range of 10-20g for Vernonia amygdalina and around 10-35g for Vernonia galamensis, the pH of 6.76 is consistently maintained. However, over a longer period of remediation time, the pH gradually decreases to approximately 6.75. This decrease in pH indicates a slight shift towards a lower acidity level. Interestingly, the same pattern is observed for both the room-dry and sun-dry methods of Vernonia extract preparations. Regardless of the drying method used, the pH tends to decrease as more masses of Vernonia extracts are added to the contaminated soil. This suggests that the addition of higher quantities of Vernonia extracts has a more pronounced effect on lowering the soil’s pH. These findings highlight the influence of Vernonia extract application and the duration of the remediation process on the pH level of the contaminated soil. The study suggests that higher quantities of Vernonia extracts, regardless of the preparation method, can contribute to a decrease in pH over time, indicating a potential shift towards a less acidic environment.
In contrast to the wet-dry extract applications of Vernonia galamensis, where similar results are observed as with the room dry and sun-dry applications, there are distinct findings for the wet-dry application of Vernonia amygdalina. With the wet-dry application method using Vernonia amygdalina, an interesting trend emerges. As the mass of the Vernonia amygdalina extract is increased by blending wetted extracts onto the contaminated swampy soil, there is an observed increase in pH values over time. This indicates a gradual shift towards higher acidity levels in the soil. These findings suggest that the wet-dry application of Vernonia amygdalina may have a unique impact on the pH of the contaminated soil when compared to other application methods or Vernonia galamensis. The increase in pH over time with the increased mass of Vernonia amygdalina extract implies a potential alkalizing effect on the soil. These insights contribute to a deeper understanding of the behavior and effectiveness of different Vernonia extract applications in relation to pH levels, specifically highlighting the distinctive behavior of wet-dry application with Vernonia amygdalina.
- b. HC analysis.
The remediation of hydrocarbon content from the soil involved the consumption of hydrocarbon molecules by the active microorganisms found in the leaves. It is evident that the remediation of hydrocarbons increases with the addition of the remediant to the contaminated soil. In a 40-day period, the addition of 40g of Vernonia galamensis resulted in the removal of approximately 0.35 ug/ml of hydrocarbons. Similarly, under the same preparation conditions (room dry), time, and quantity, Vernonia amydalina remediated approximately 0.40 ug/ml of hydrocarbons.”
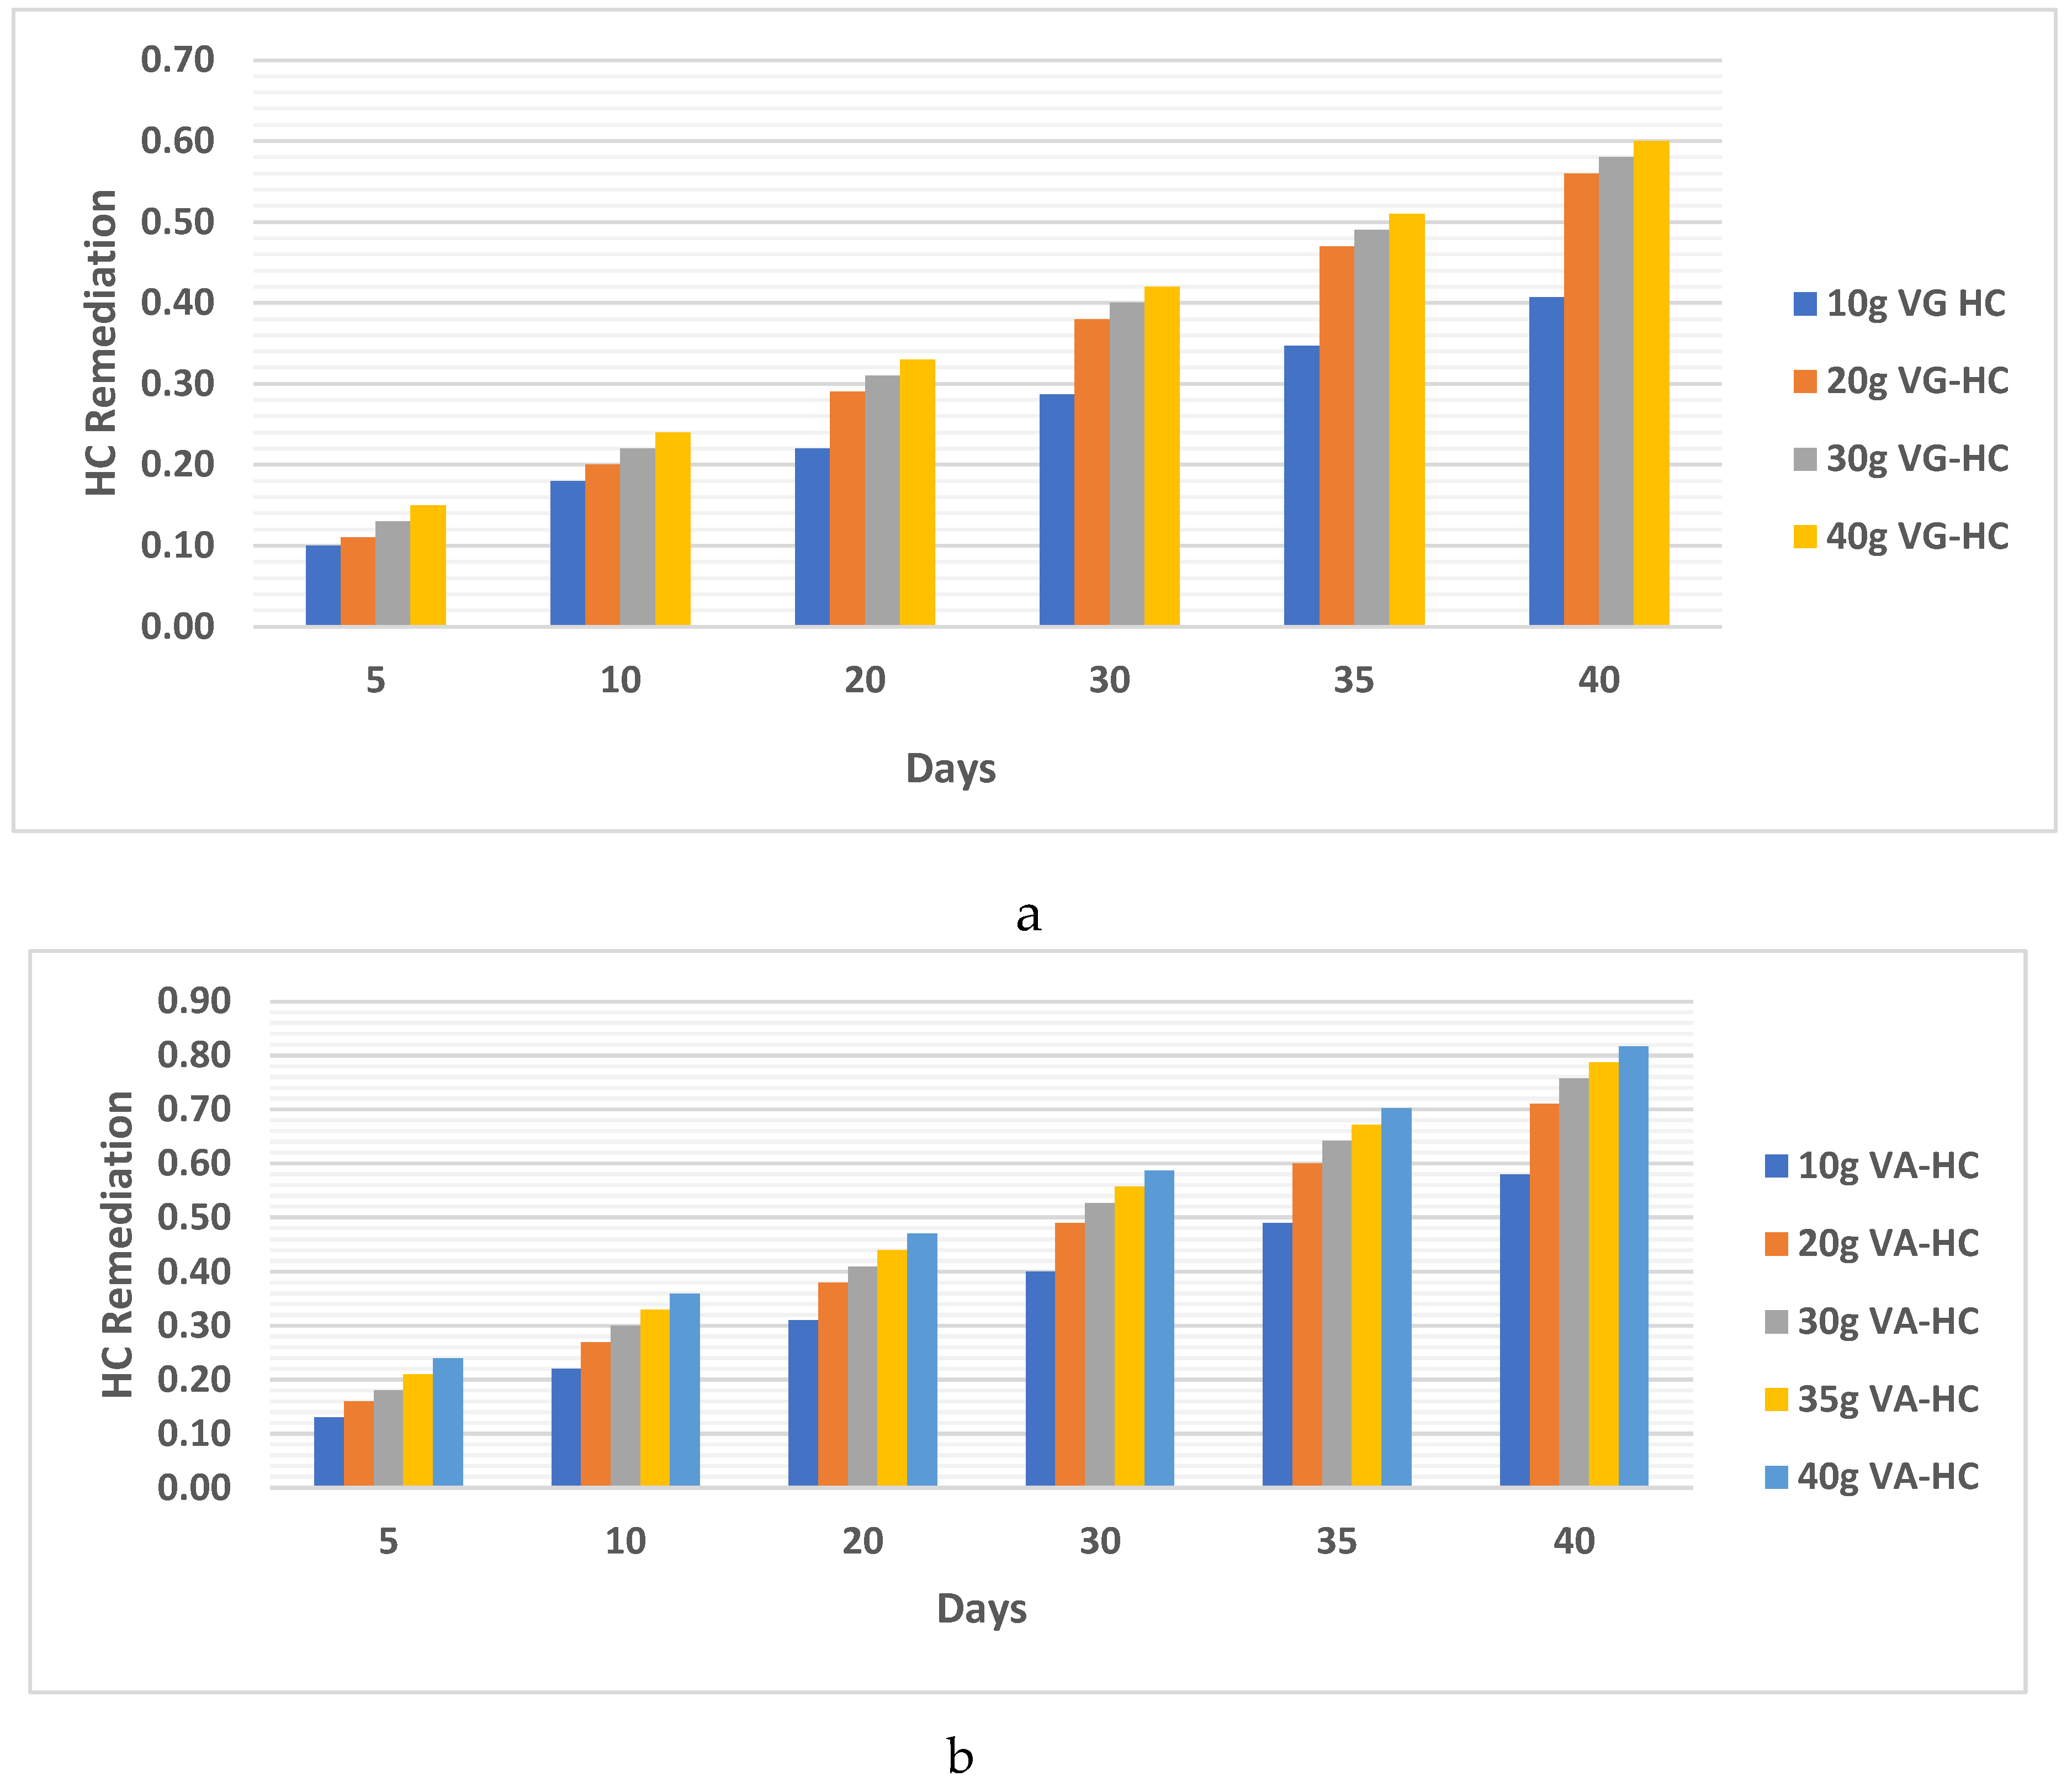
Figure 4.
2, a, b: Hydrocarbon content remediation using vernonia extracts of different masses in different days in swamp soil.
Figure 4.
2, a, b: Hydrocarbon content remediation using vernonia extracts of different masses in different days in swamp soil.
Based on the figure provided, it is evident that Vernonia amydalina demonstrated a higher effectiveness in hydrocarbon remediation compared to Vernonia galamensis. Consequently, it becomes crucial to examine the impact of different preparation methods on the remediation effect. Figure 4.3 provides a detailed explanation of the hydrocarbon remediation effect, taking into account the various methods employed for preparing the extracts.
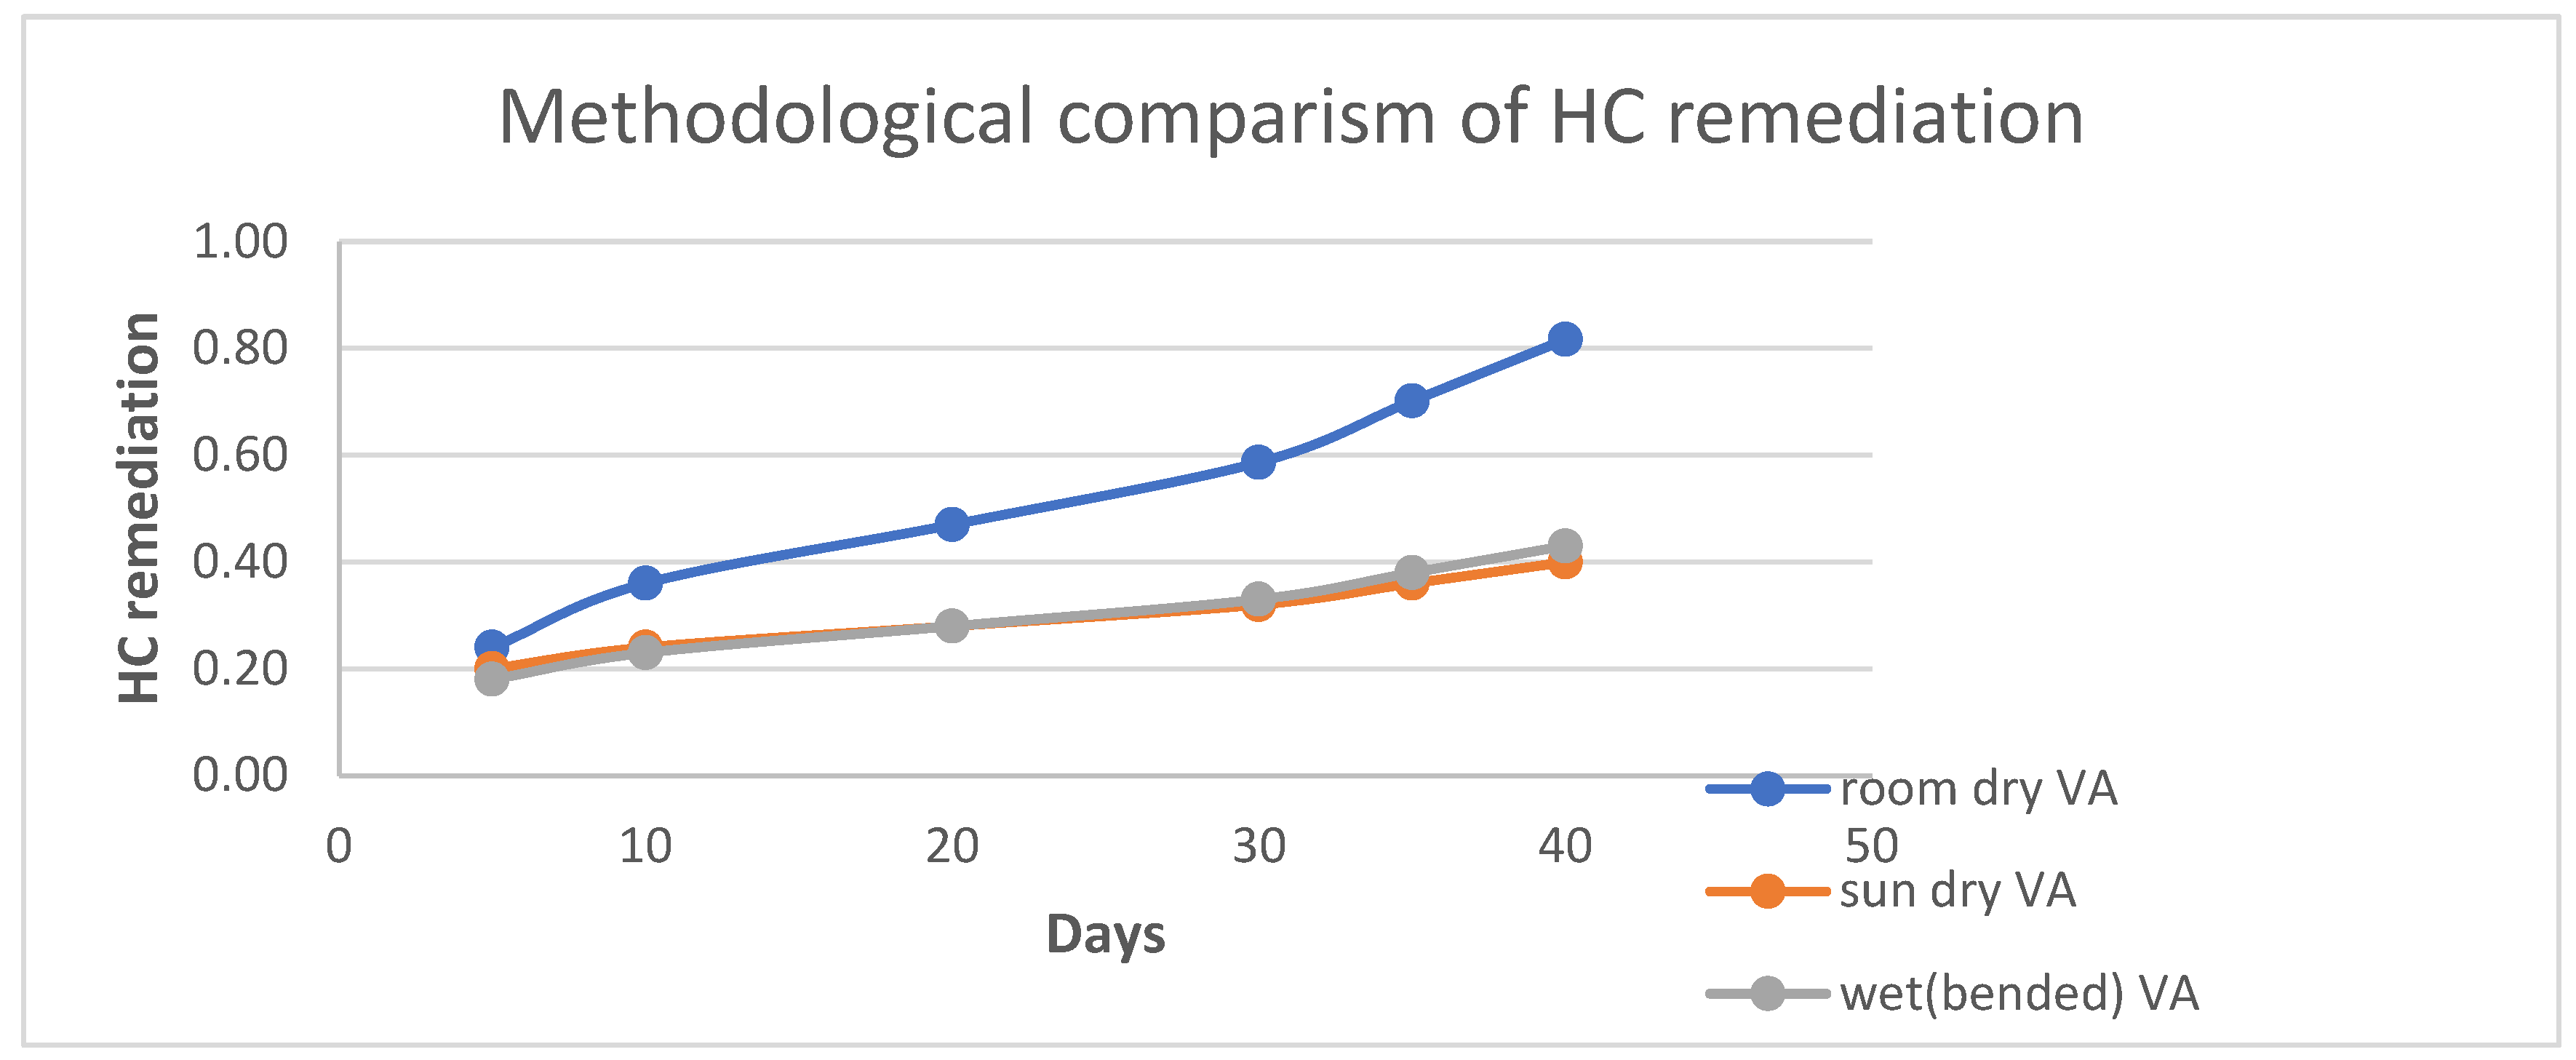
Figure 4.
3: HC-remediation response on vernonia amygdilina preparation effect.
the room dry preparation of Vernonia amydalina extract has shown to be the most effective method for hydrocarbon remediation in swampy soil. Within a 40-day period, it successfully remediated approximately 0.8 ug/ml of hydrocarbons, which is roughly twice the amount compared to the extracts prepared by sun drying or wet blending methods. Additionally, there was a noticeable significant increase in remediation after 30 days of the study, suggesting that even more remediation is expected after a complete 40-day inspectionre
Metal analyses
Furthermore, the impact on the metal content of the soil is also noticeable, as evidenced by the decrease in metal concentrations. Although the study focused specifically on three metals (Pd, Zn, and Cr), it is important to acknowledge that there may be other metals present in the soil. The analysis of metal concentrations was conducted at the conclusion of the 40-day investigation, taking into account the effects of the various leaf extracts.
Based on the findings illustrated in Figure 4.4, it is evident that the wet and blended Vernonia galamensis leaf extracts exhibit the highest effectiveness in remediating Pb (lead). This method demonstrates a remediation action of approximately 0.47 ug/ml, compared to the room dry and sun-dry methods which resulted in remediation levels of 0.31 ug/ml and 0.23 ug/ml, respectively. Initially, both the wet and room dry approaches exhibit similar levels of microbial activity, albeit minimal, which is still significantly higher than the microbial activity observed in the sun-dry method.Over time, it is observed that the microbial activity in the wet and blended approach gradually increases, leading to a higher level of Pb (lead) remediation in the swamp soil compared to other methods. The sustained microbial activity in the wet and blended approach contributes to a more efficient and effective remediation process for Pb in the soil
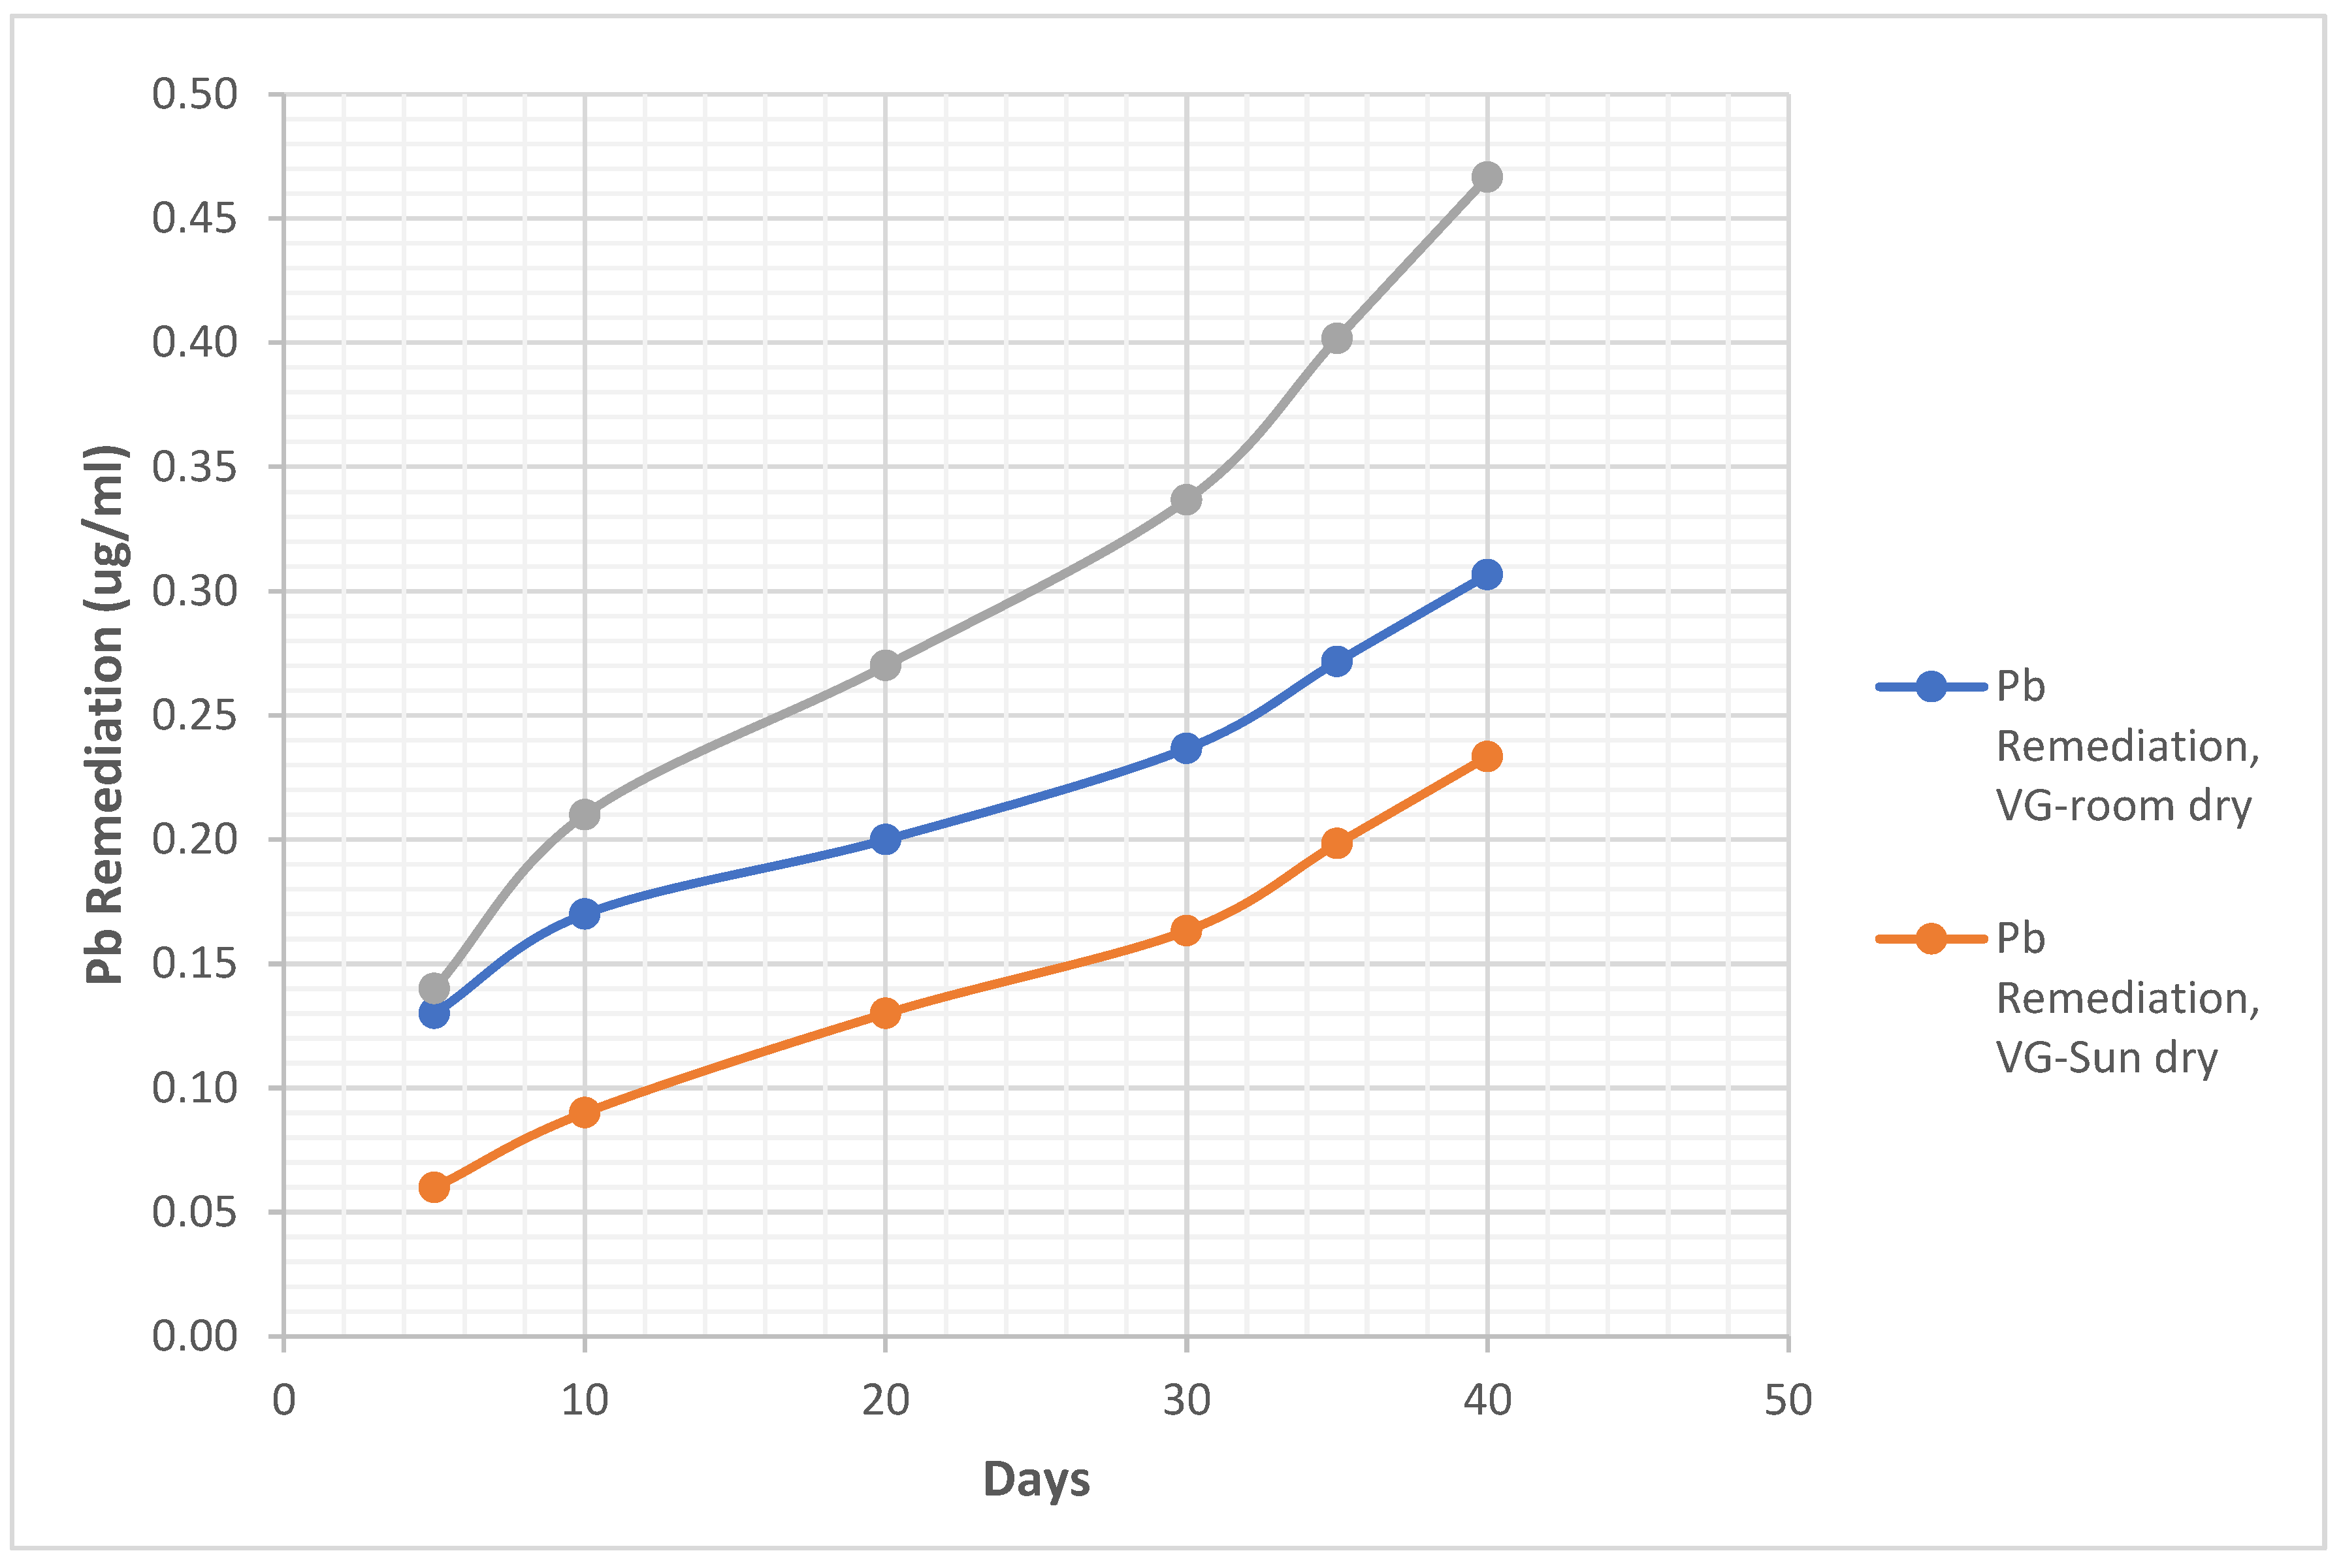
Figure 4.
4: Pb remediation using vernonia Galamensis and considering the three preparation methods.
Figure 4.
4: Pb remediation using vernonia Galamensis and considering the three preparation methods.
In Figure 4.5, the focus is on Pb (lead) remediation using Vernonia amydalina. Similar to the previous findings, the wet blended approach using Vernonia amydalina demonstrates a higher level of Pb remediation compared to the room dry and sun-dry methods. The wet blended method achieves a remediation rate of approximately 0.47 ug/ml, while the room dry and sun-dry methods yielded remediation rates of 0.35 ug/ml and 0.26 ug/ml, respectively. These results highlight the potential effectiveness of the wet blended approach using Vernonia amydalina in remediating Pb in the soil
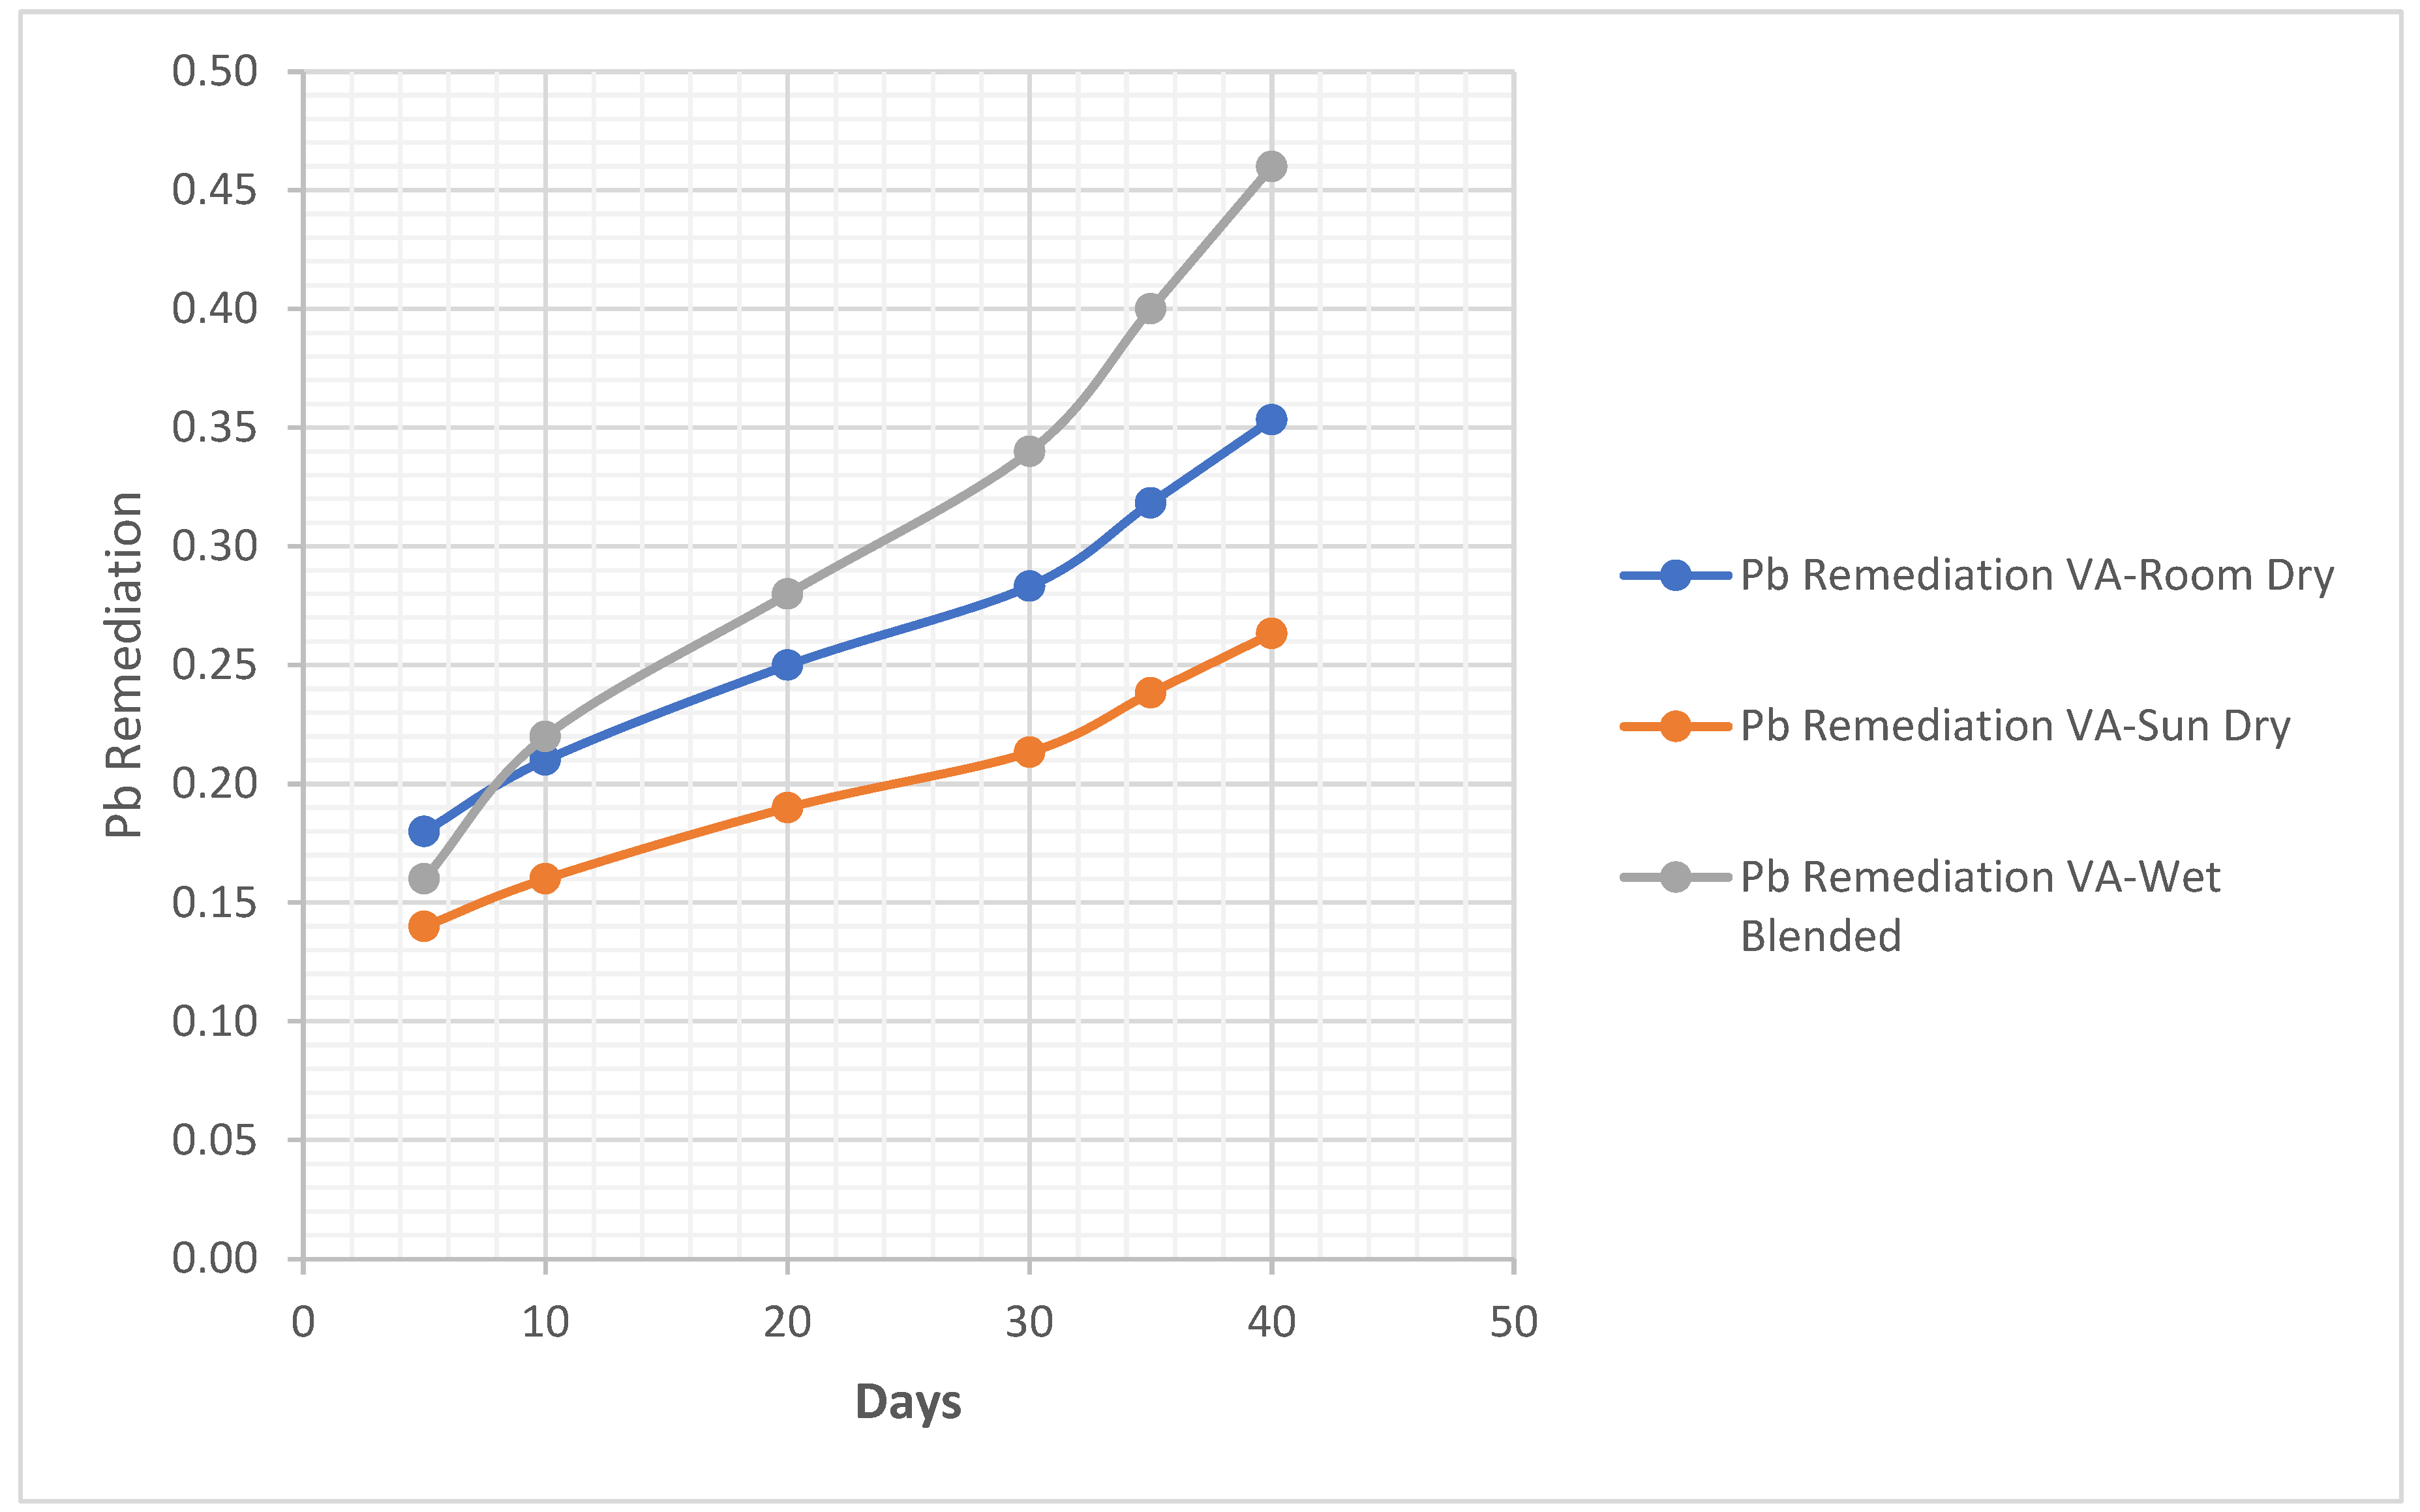
Figure 4.
4: Pb remediation using vernonia Galamensis and considering the three preparation methods.
Figure 4.
4: Pb remediation using vernonia Galamensis and considering the three preparation methods.
“In order to evaluate the performance of Vernonia galamensis and Vernonia amydalina spices in remediating hydrocarbon-contaminated soil, we will also incorporate a measurement scheme for Zinc (Zn) analysis. “At the conclusion of the experimentation, we will conduct measurements to compare the effectiveness of the two different leaf species (Vernonia galamensis and Vernonia amydalina) and the three approaches in remediating Zn metal. This comparison will help us assess the potential of each method in soil remediation.
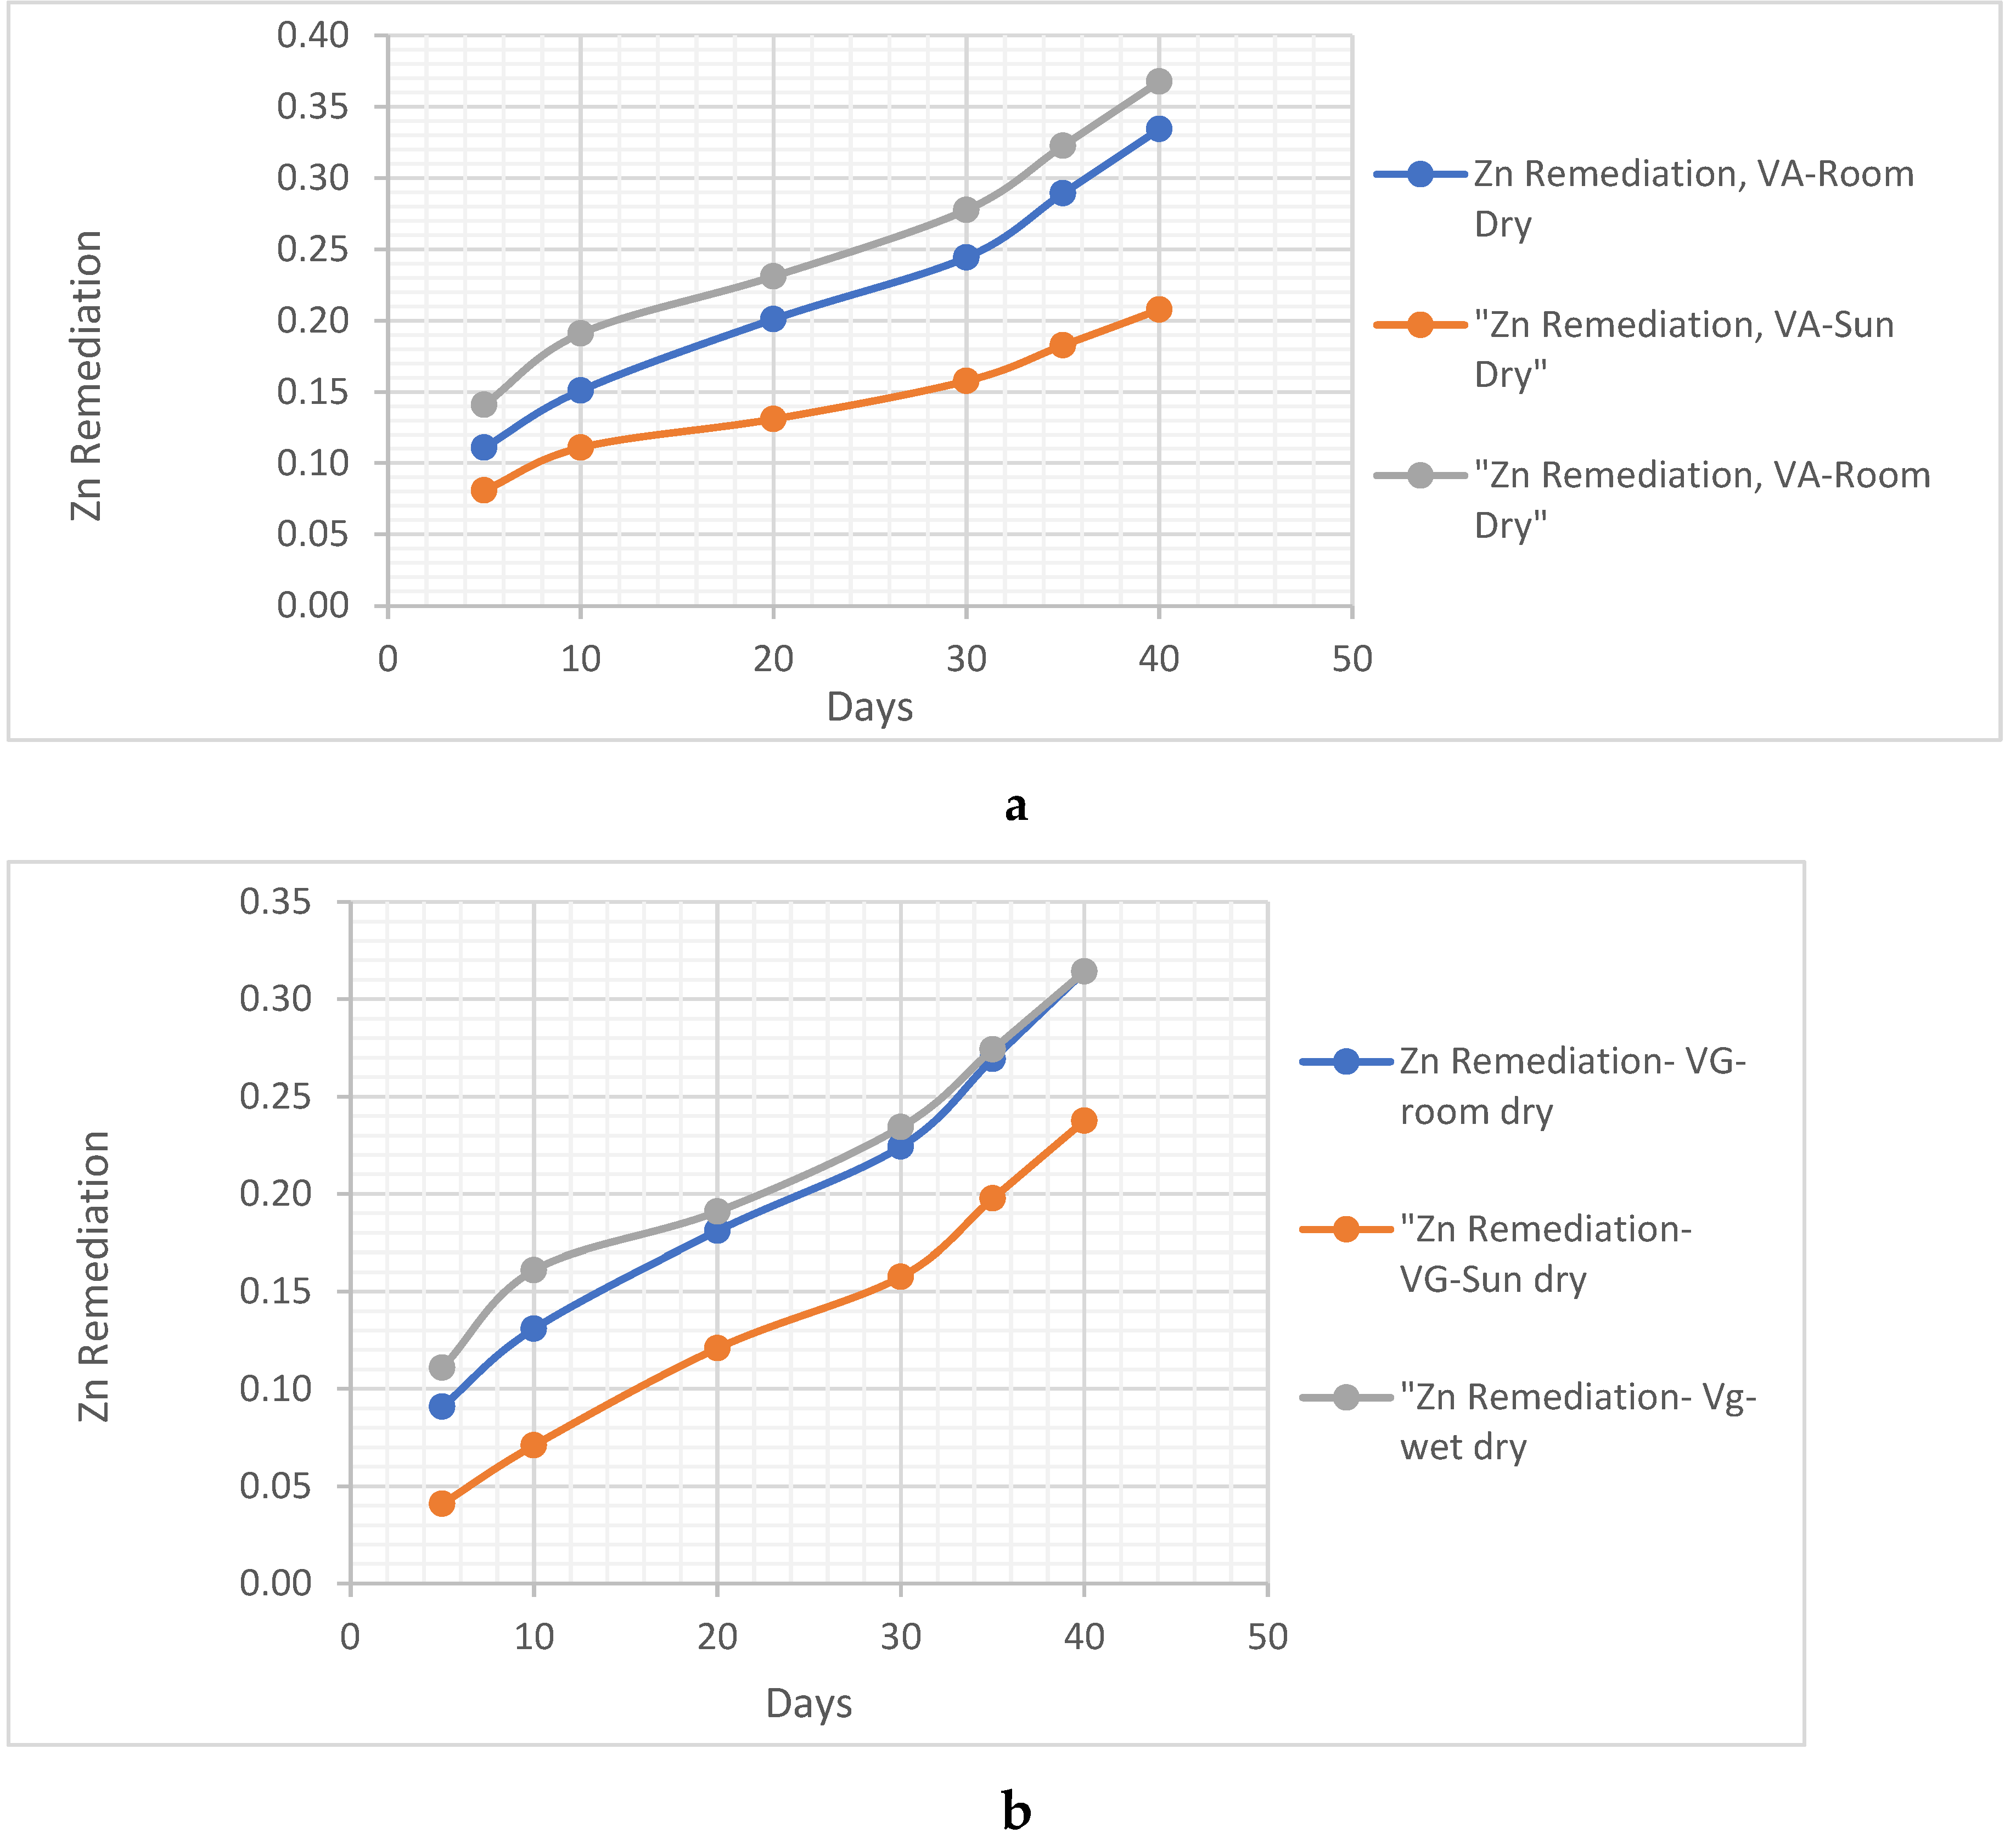
Figure 4.
5, a, b: Zn remediation using vernonia Galamensis and vernonia Amygdalina considering the three preparation methods.
Figure 4.
5, a, b: Zn remediation using vernonia Galamensis and vernonia Amygdalina considering the three preparation methods.
“The wet blended vernonia species, specifically vernonia Amygdalina, demonstrates a higher Zn remediation effect, reaching approximately 0.37 ug/ml, compared to vernonia Galamensis with 0.33 ug/ml. Interestingly, both the wet and room-dried vernonia Galamensis species exhibit similar remediation effects after 40 days. However, the sun-dried leaves of both species show minimal Zn remediation effects.” During the bioremediation process performed by the two Vernonia species, not only do they exhibit their remediation action on various contaminants, but they also effectively reduce chromium levels in the contaminated soil. This crucial finding further supports the potentiality of the remediating action of Vernonia galamensis and Vernonia amydalina in hydrocarbon-contaminated soil. Figure 4.6
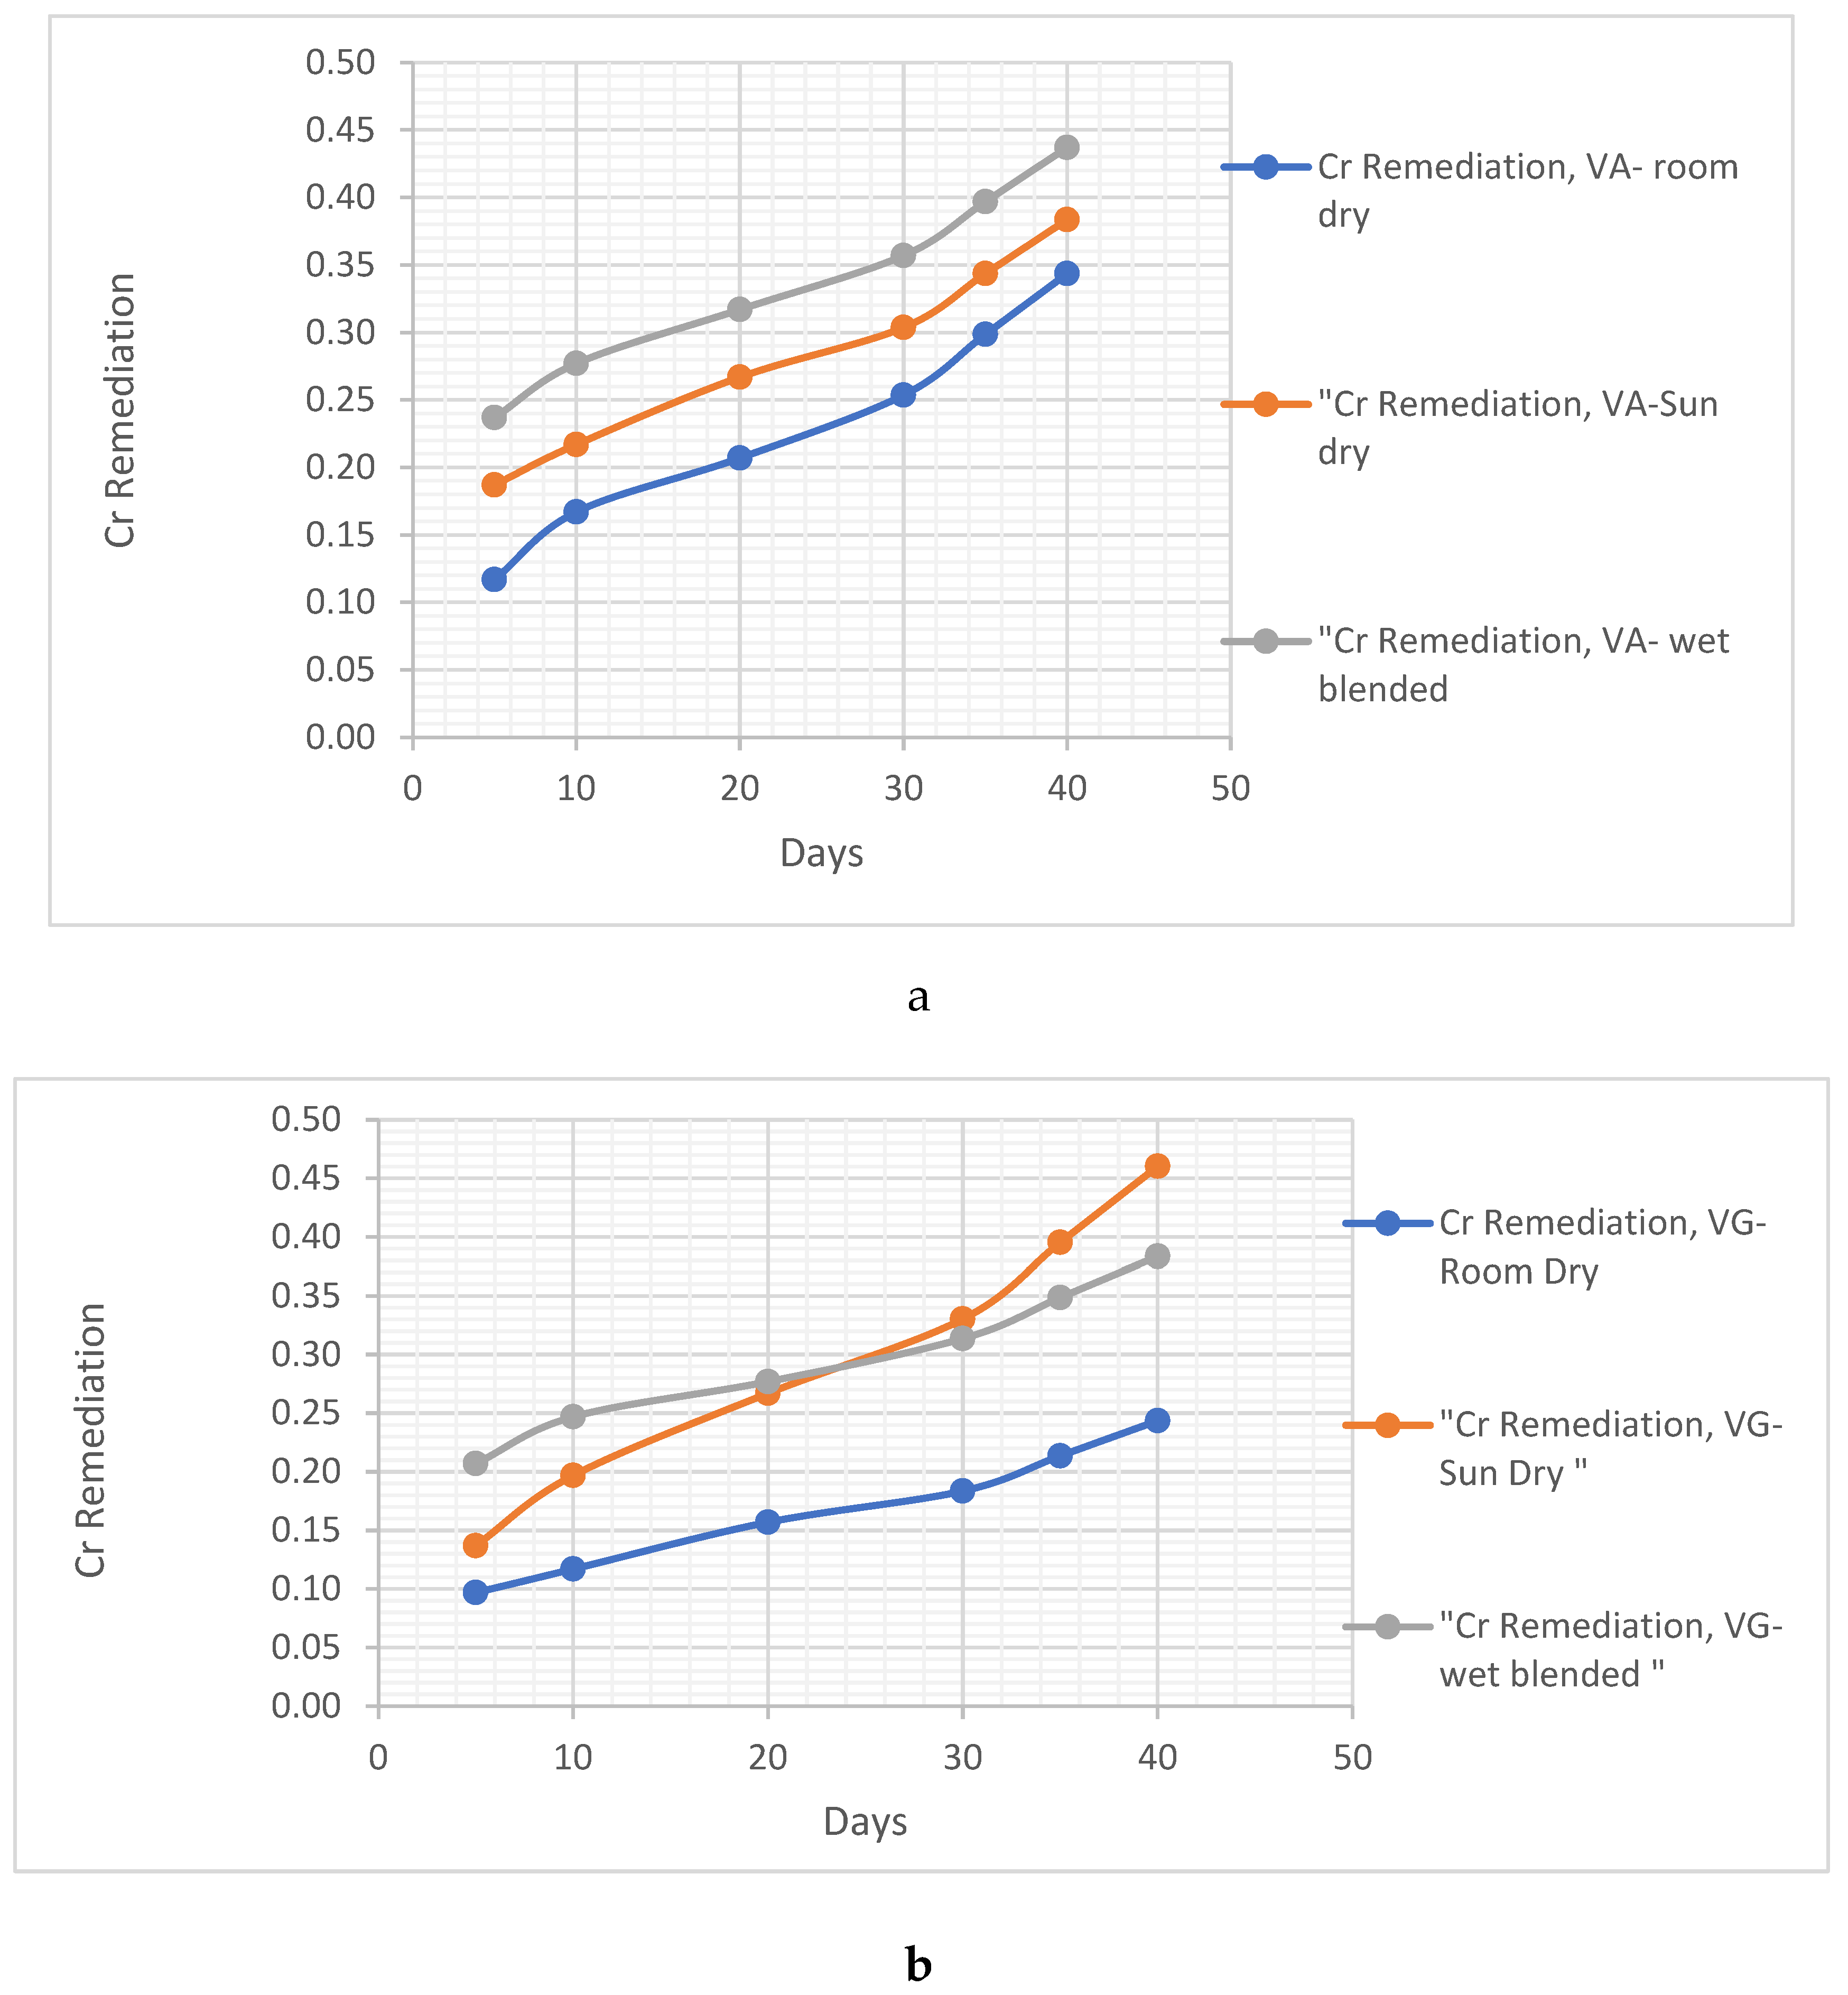
Figure 4.
5, a, b: Cr remediation using vernonia Galamensis and vernonia Amygdalina considering the three preparation methods.
Figure 4.
5, a, b: Cr remediation using vernonia Galamensis and vernonia Amygdalina considering the three preparation methods.
visually presents the data, showcasing the significant impact of their remediation action on chromium in swamp soil, reinforcing the importance and effectiveness of these species in the overall soil remediation process.”
In a surprising turn of events, the sun-dried vernonia Galamensis exhibited the highest remediation effect for chromium metal in the contaminated swamp soil, reaching an impressive 0.47 ug/ml. Comparatively, the wet blended specimen showed a remediation action of approximately 0.38 ug/ml, while the room-dried specimen demonstrated a lower effect at just 0.25 ug/ml. Similarly, in the vernonia Amygdalina experiment, the wet blended specimen showcased the highest remediating effect at about 0.43 ug/ml, followed closely by the sun-dried specimen at approximately 0.38 ug/ml, and the room-dried specimen at 0.35 ug/ml.” These results highlight the unexpected findings and emphasize the role of different drying methods in the remediation potential of Vernonia galamensis and Vernonia amydalina for chromium in swamp soil
4.1.1. Clay Soil Bio Remedial Analysis
“To accurately simulate the environmental conditions present in the study area, a series of clay soil samples were carefully collected and meticulously mixed with bonny light crude oil. This meticulous replication allowed for a comprehensive analysis of the responses of various factors, including pH levels, hydrocarbon contents, and the presence of metals. The measurements of these responses were taken with great consideration given to their initial values (prior to the addition of crude oil) and their corresponding final values (after the crude oil was introduced). These initial and final conditions, depicting the fluctuations and changes resulting from the crude oil addition scenario, have been diligently recorded and are presented in Table 4.2.

Table 4.
2- Initial and Final readings of the Response factors for clay soil.
| pH and HC readings for samples before contaminant | |||||
| Initial Content sample | pH | HC | Pb (ug/ml) | Zn (ug/ml) | Cr(ug/ml) |
| Clay soil, Csi | 6.47 | 1.3 | 0.005 | 0.000 | 0.002 |
| pH and HC readings for samples after contaminant | |||||
| Final Content sample | pH | HC | Pb (ug/ml) | Zn (ug/ml) | Cr(ug/ml) |
| Clay soil, Csf | 6.64 | 4.69 | 1.21 | 0.924 | 1.105 |
The experimental setup involves the utilization of 30 batch reactors, each serving as a distinct observation point. These reactors provide the necessary environment for conducting the various observations and measurements.
- a. pH Analysis
In order to determine the stability or instability of pH in the clay soil, it is necessary to analyze each scenario and assess whether varying masses of species have an impact on the pH value’s stability.
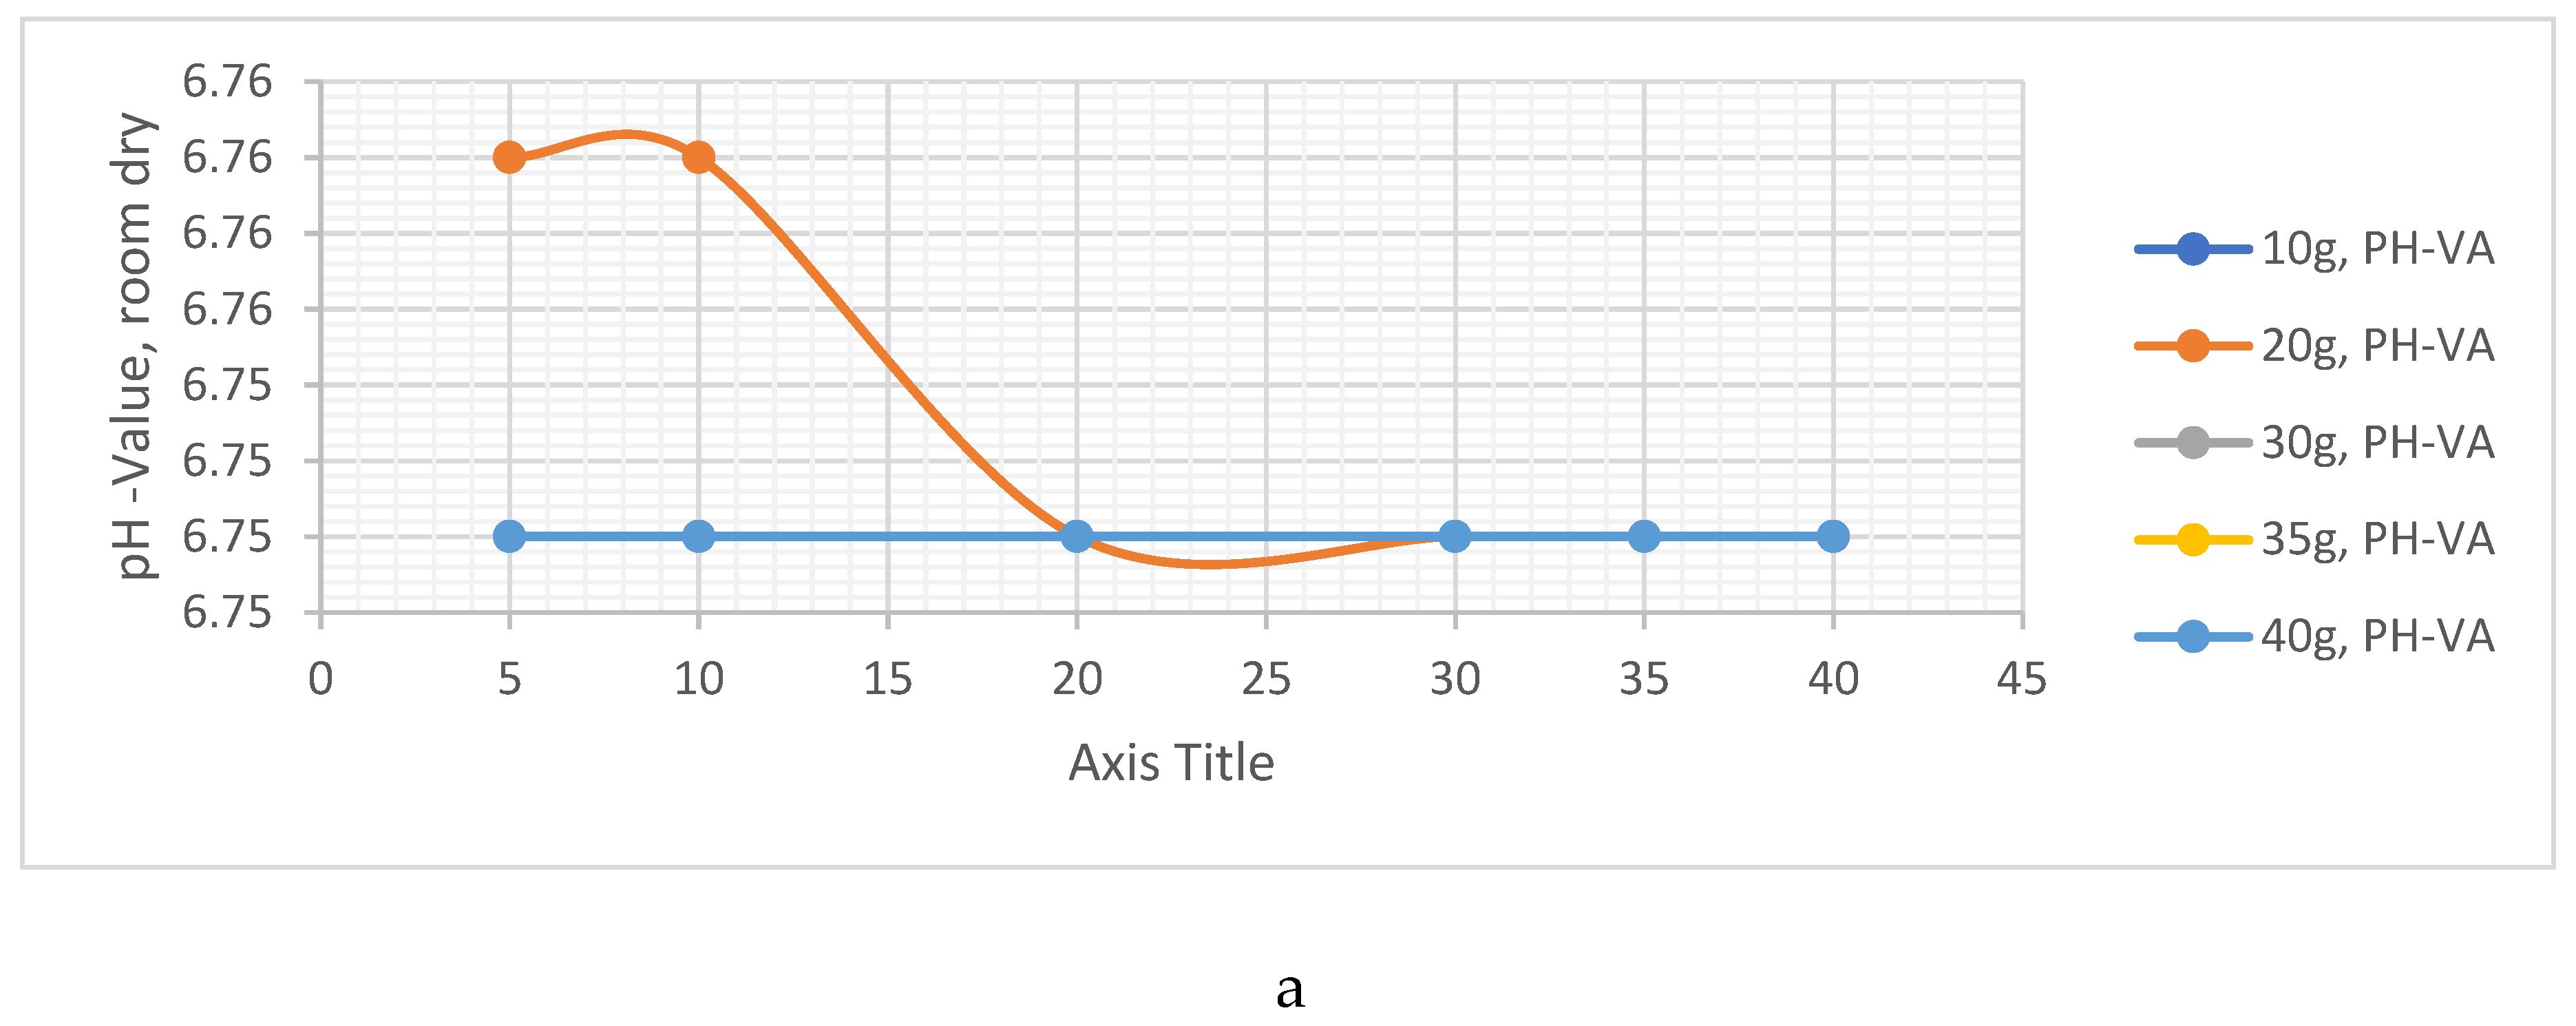
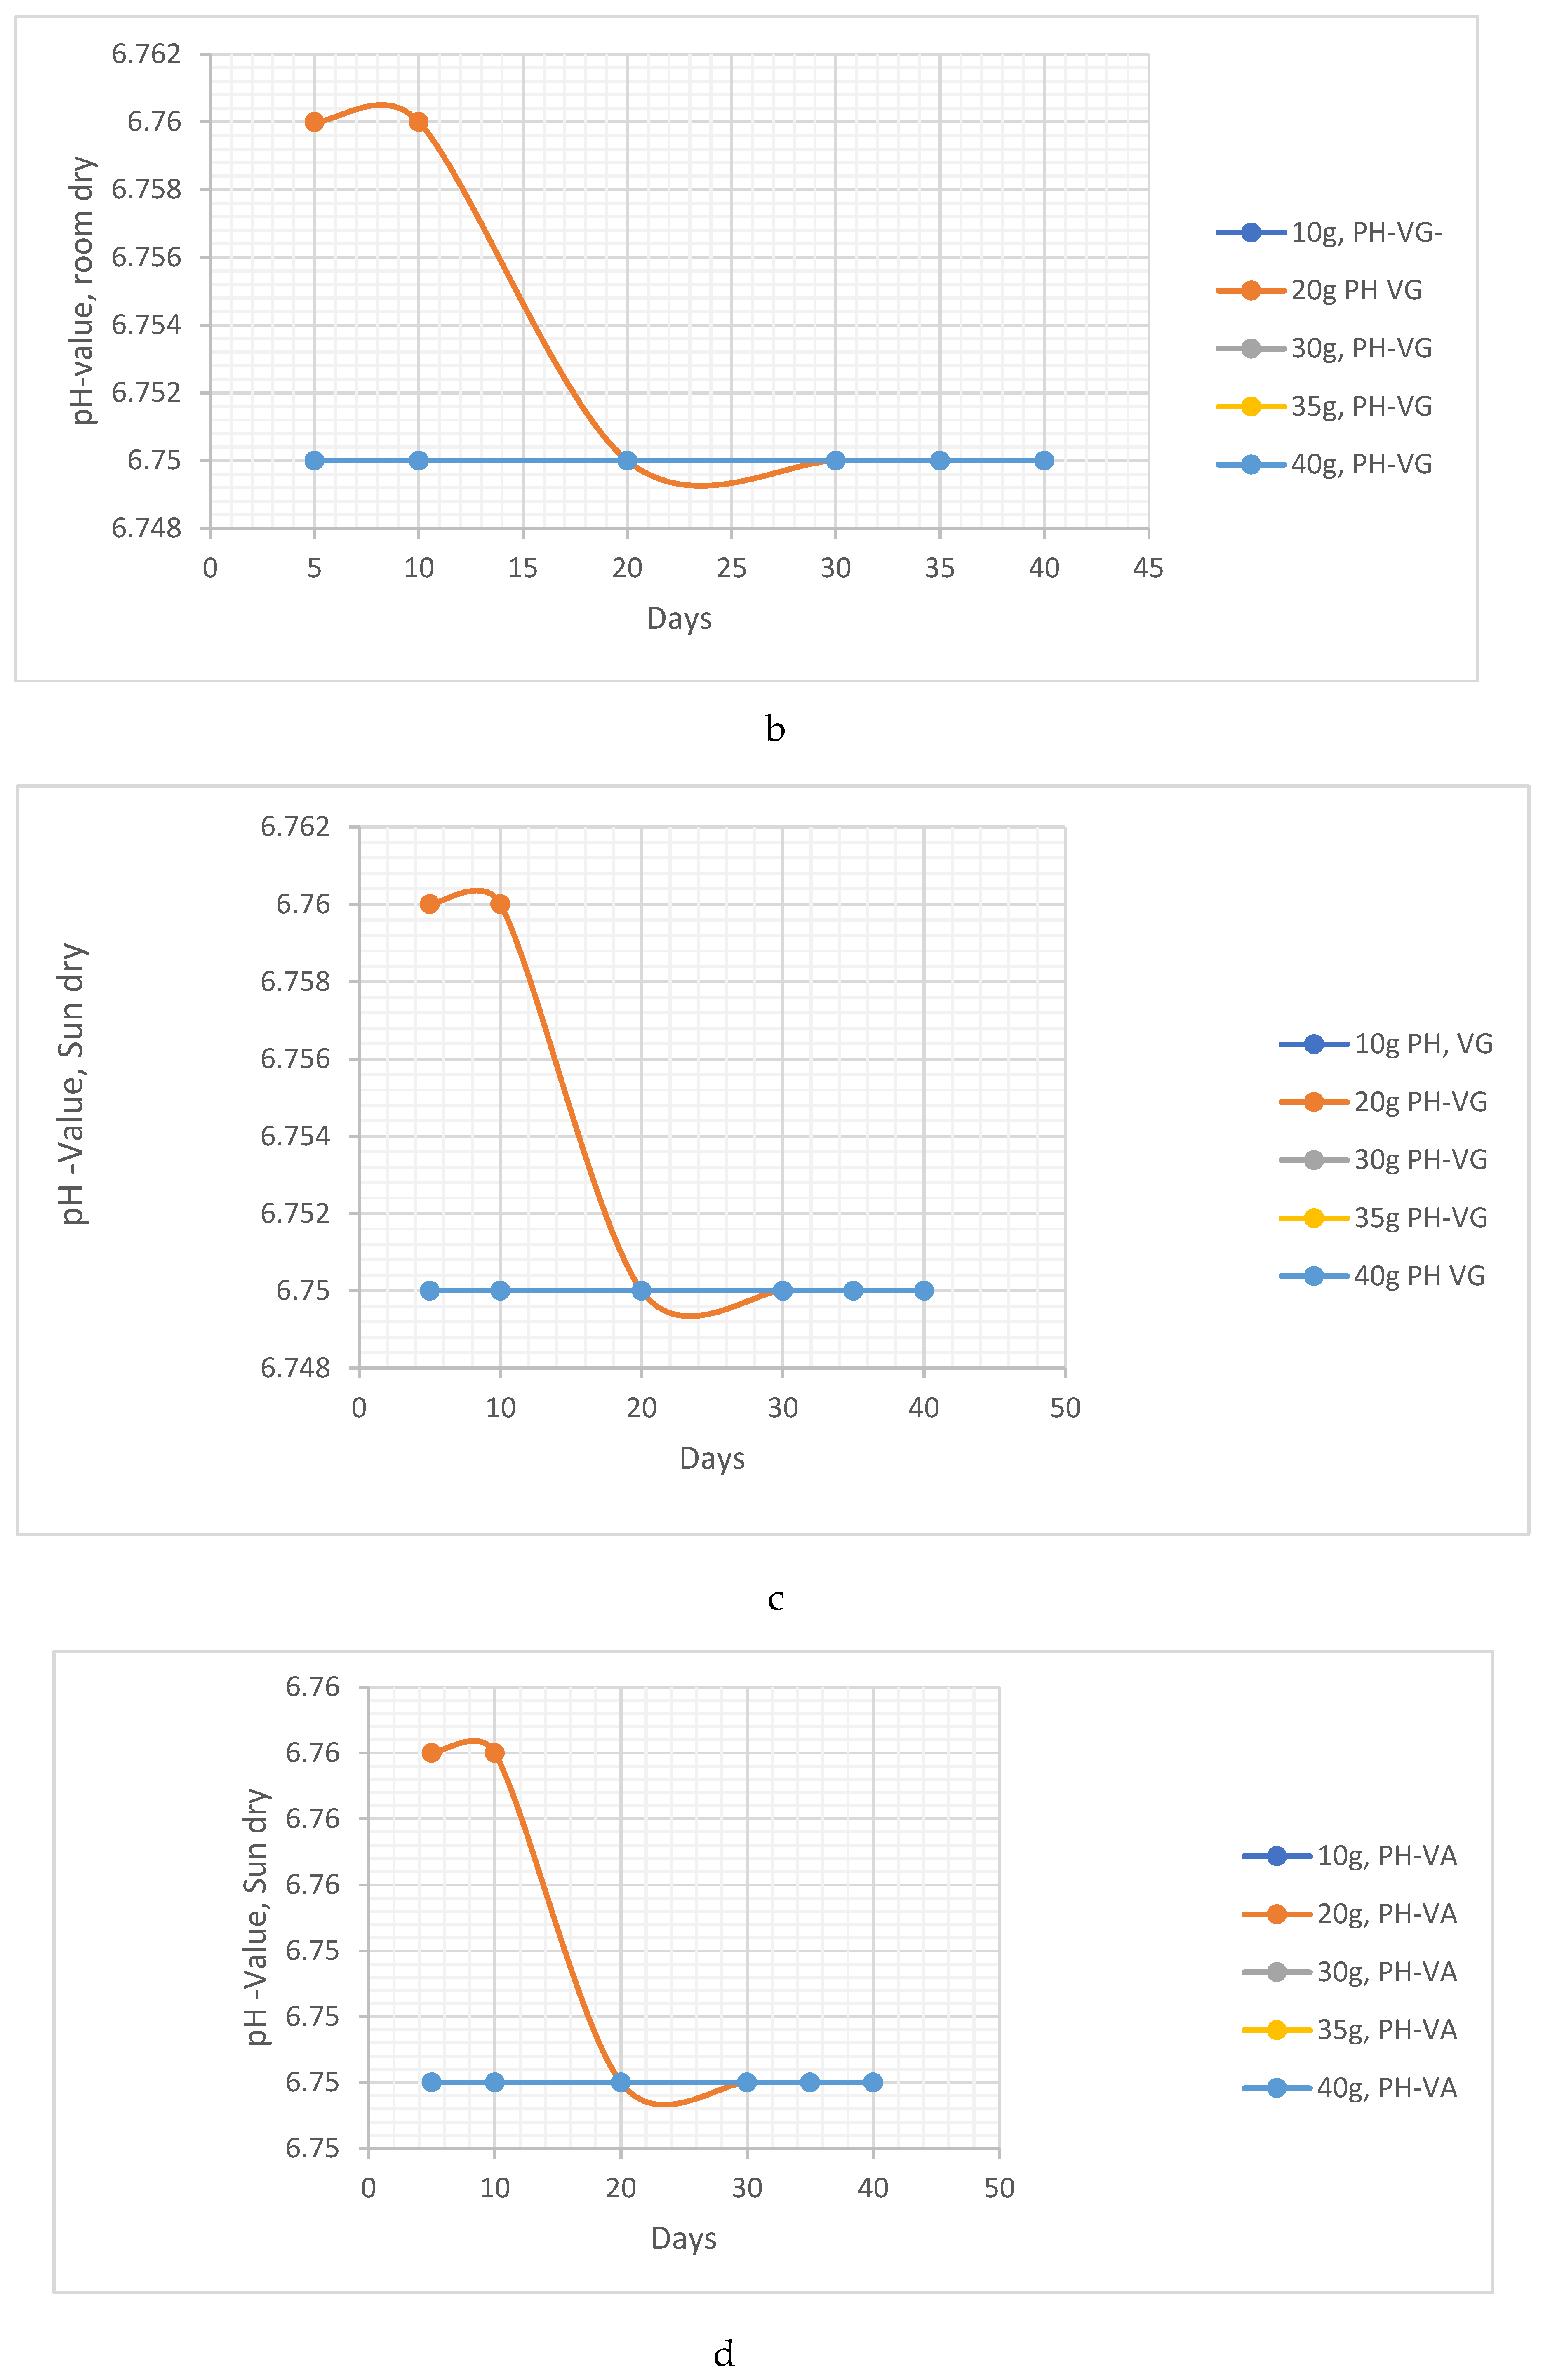
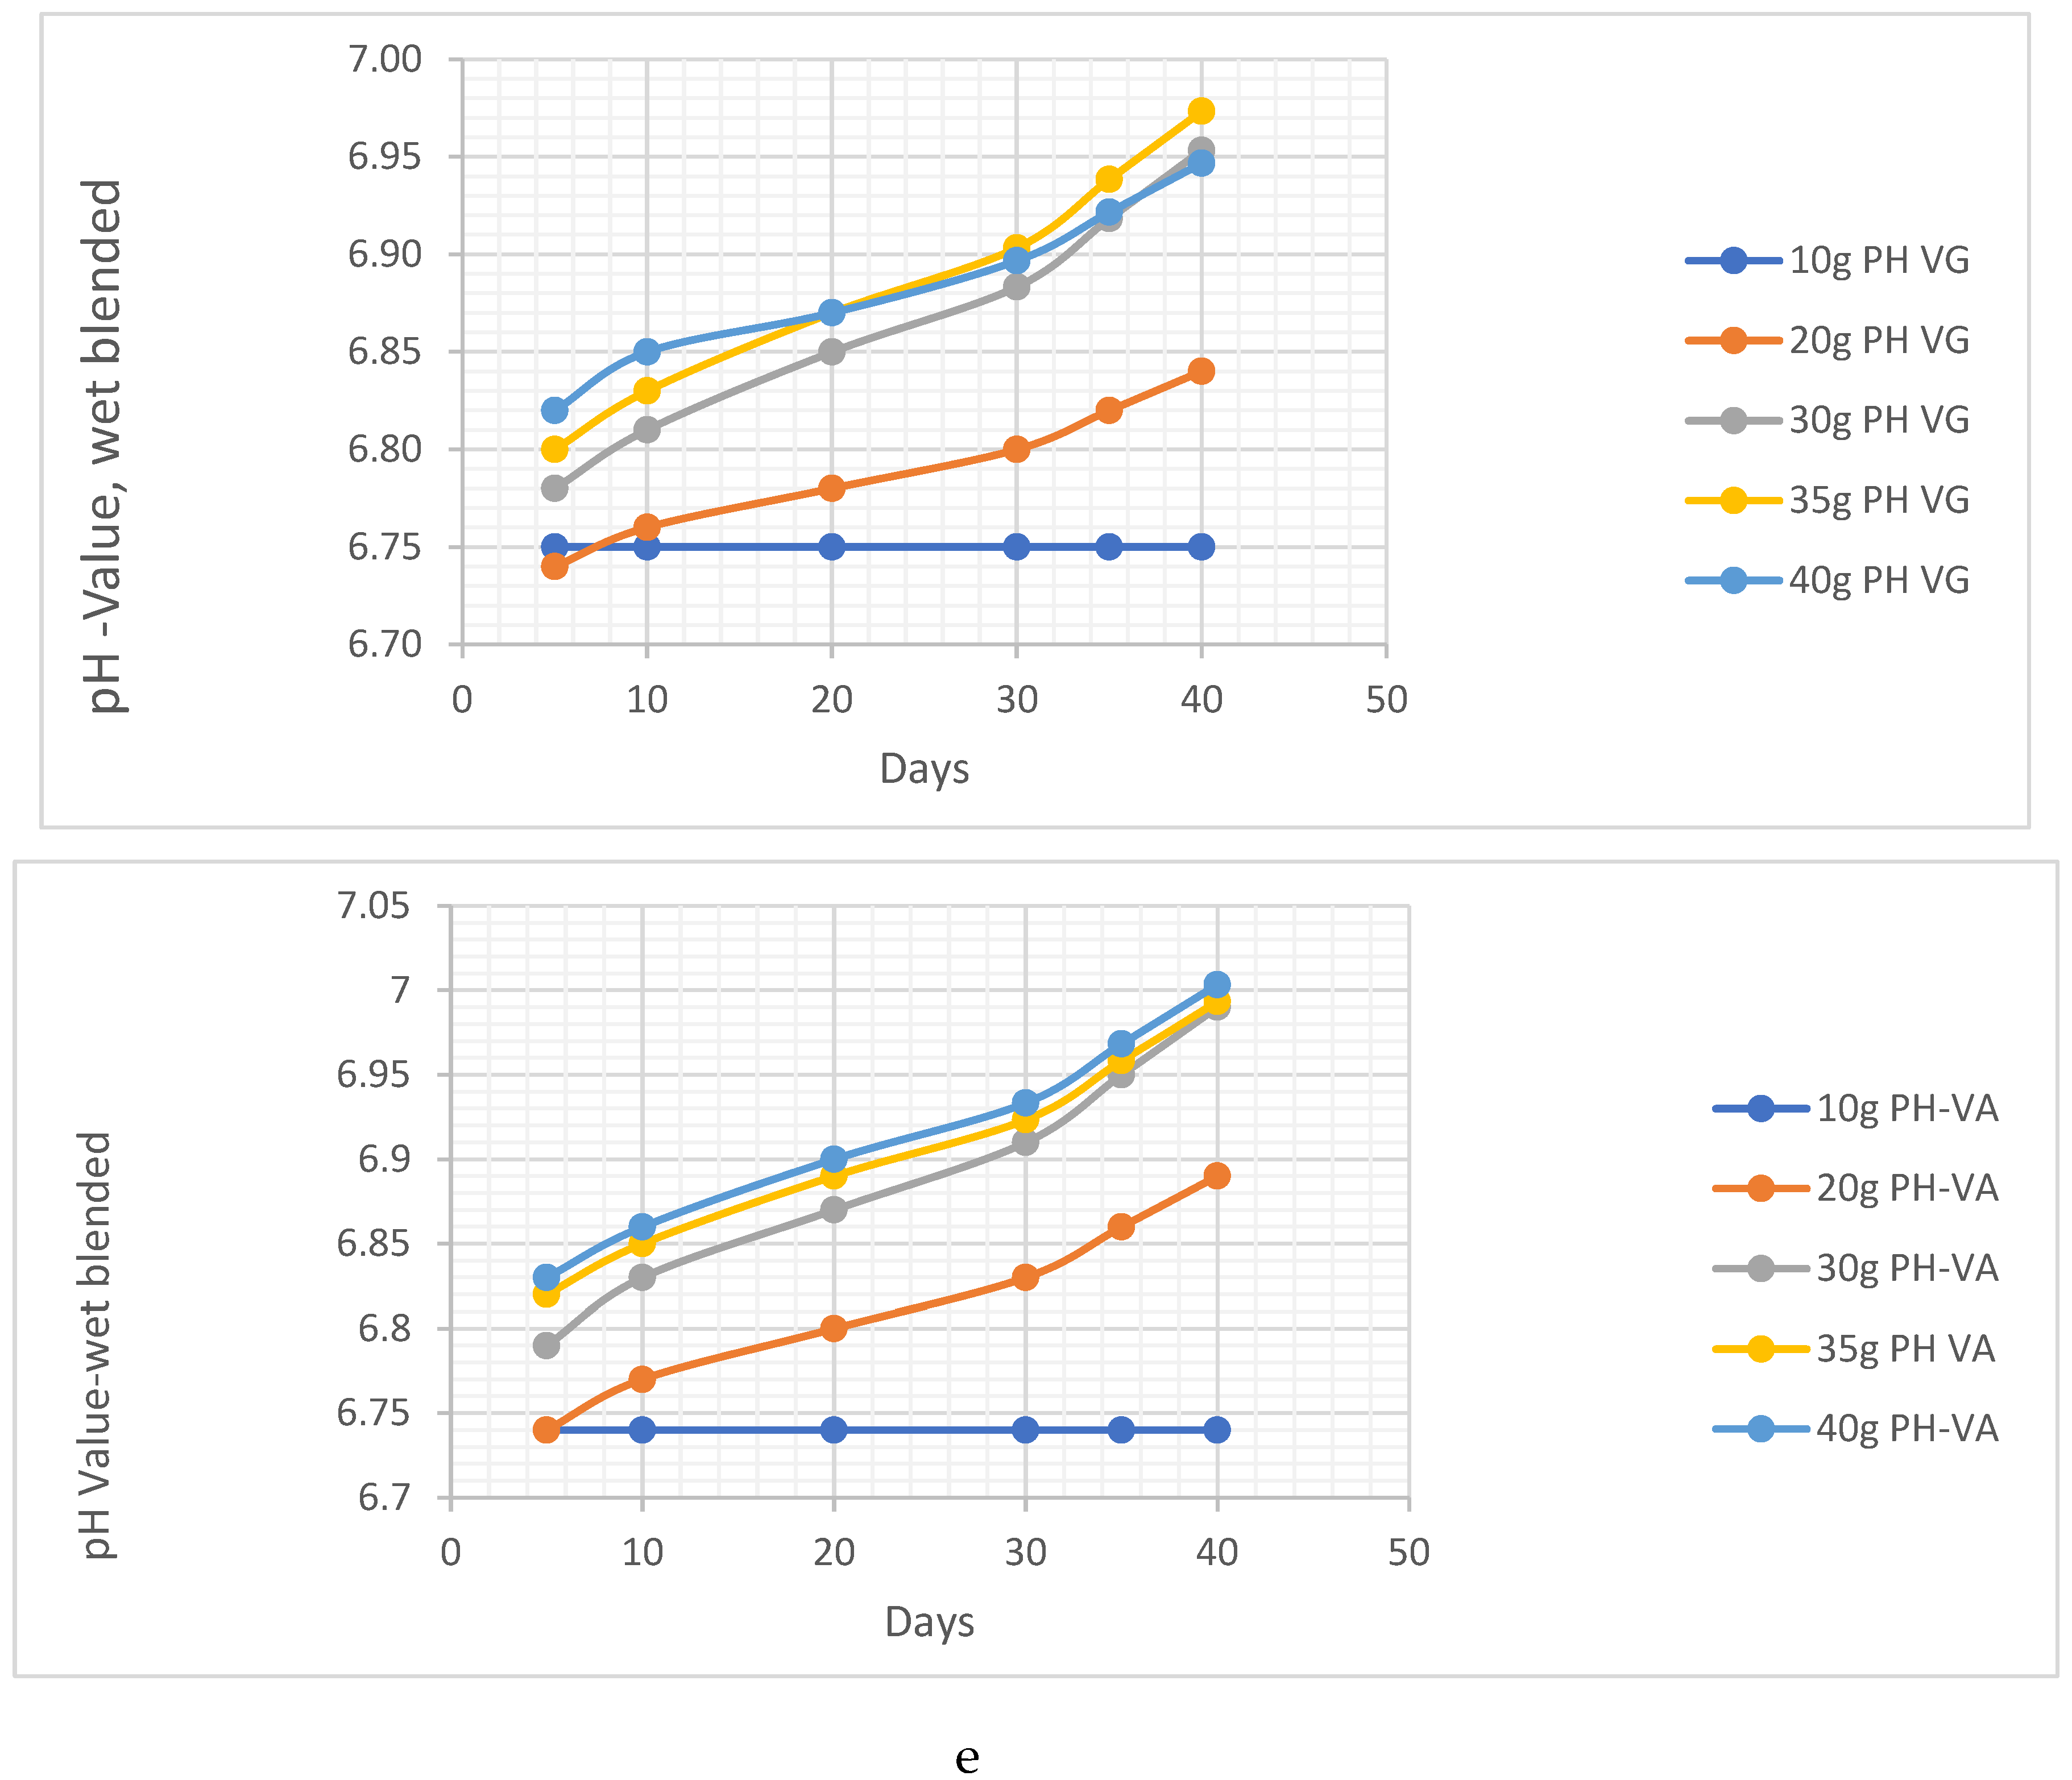
Figure 4.
6, a, b, c, d, e, f:pH behavioural characteristics of the vernonia extracts using different application methods in clay soil.
Figure 4.
6, a, b, c, d, e, f:pH behavioural characteristics of the vernonia extracts using different application methods in clay soil.
We can see that the pH of the other methods of preparation except the wet blended were stable and had very minor shift in their pH value. For the wet blended vernonia species, the pH tends to increase moving from acidic to normal to alkaline due to the remediation of the excess metals contained in the soil. At 40 days, the pH of the clay soil attained 6.97 and 7.00 for 40 grams of the vernonia Galamensis and vernonia amygdalina respectively. More grams of the vernonia species will ultimately lead to the alkalinity of the clay soil.
- a. HC analysis
A clear indication also showed the hydrocarbon content were remediated to a lower limit. As the mass of the vernonia species increase, so the hydro content reduces. It is seen that from the 35th day, the remediation effects stop increasing and remains constant. The vernonia Galamensis experienced a decrease in the HC remediation as an addition mass was added while an increase was still experienced using vernonia Amygdalina. Figure 4.7 shows the limiting values of the hydrocarbon content remediation. The highest values of remediation were at 35g and 40g representing vernonia Galamensis and vernonia Amygdalina. It is therefore necessary that we discover at what approach will we attain the best remediation effects.
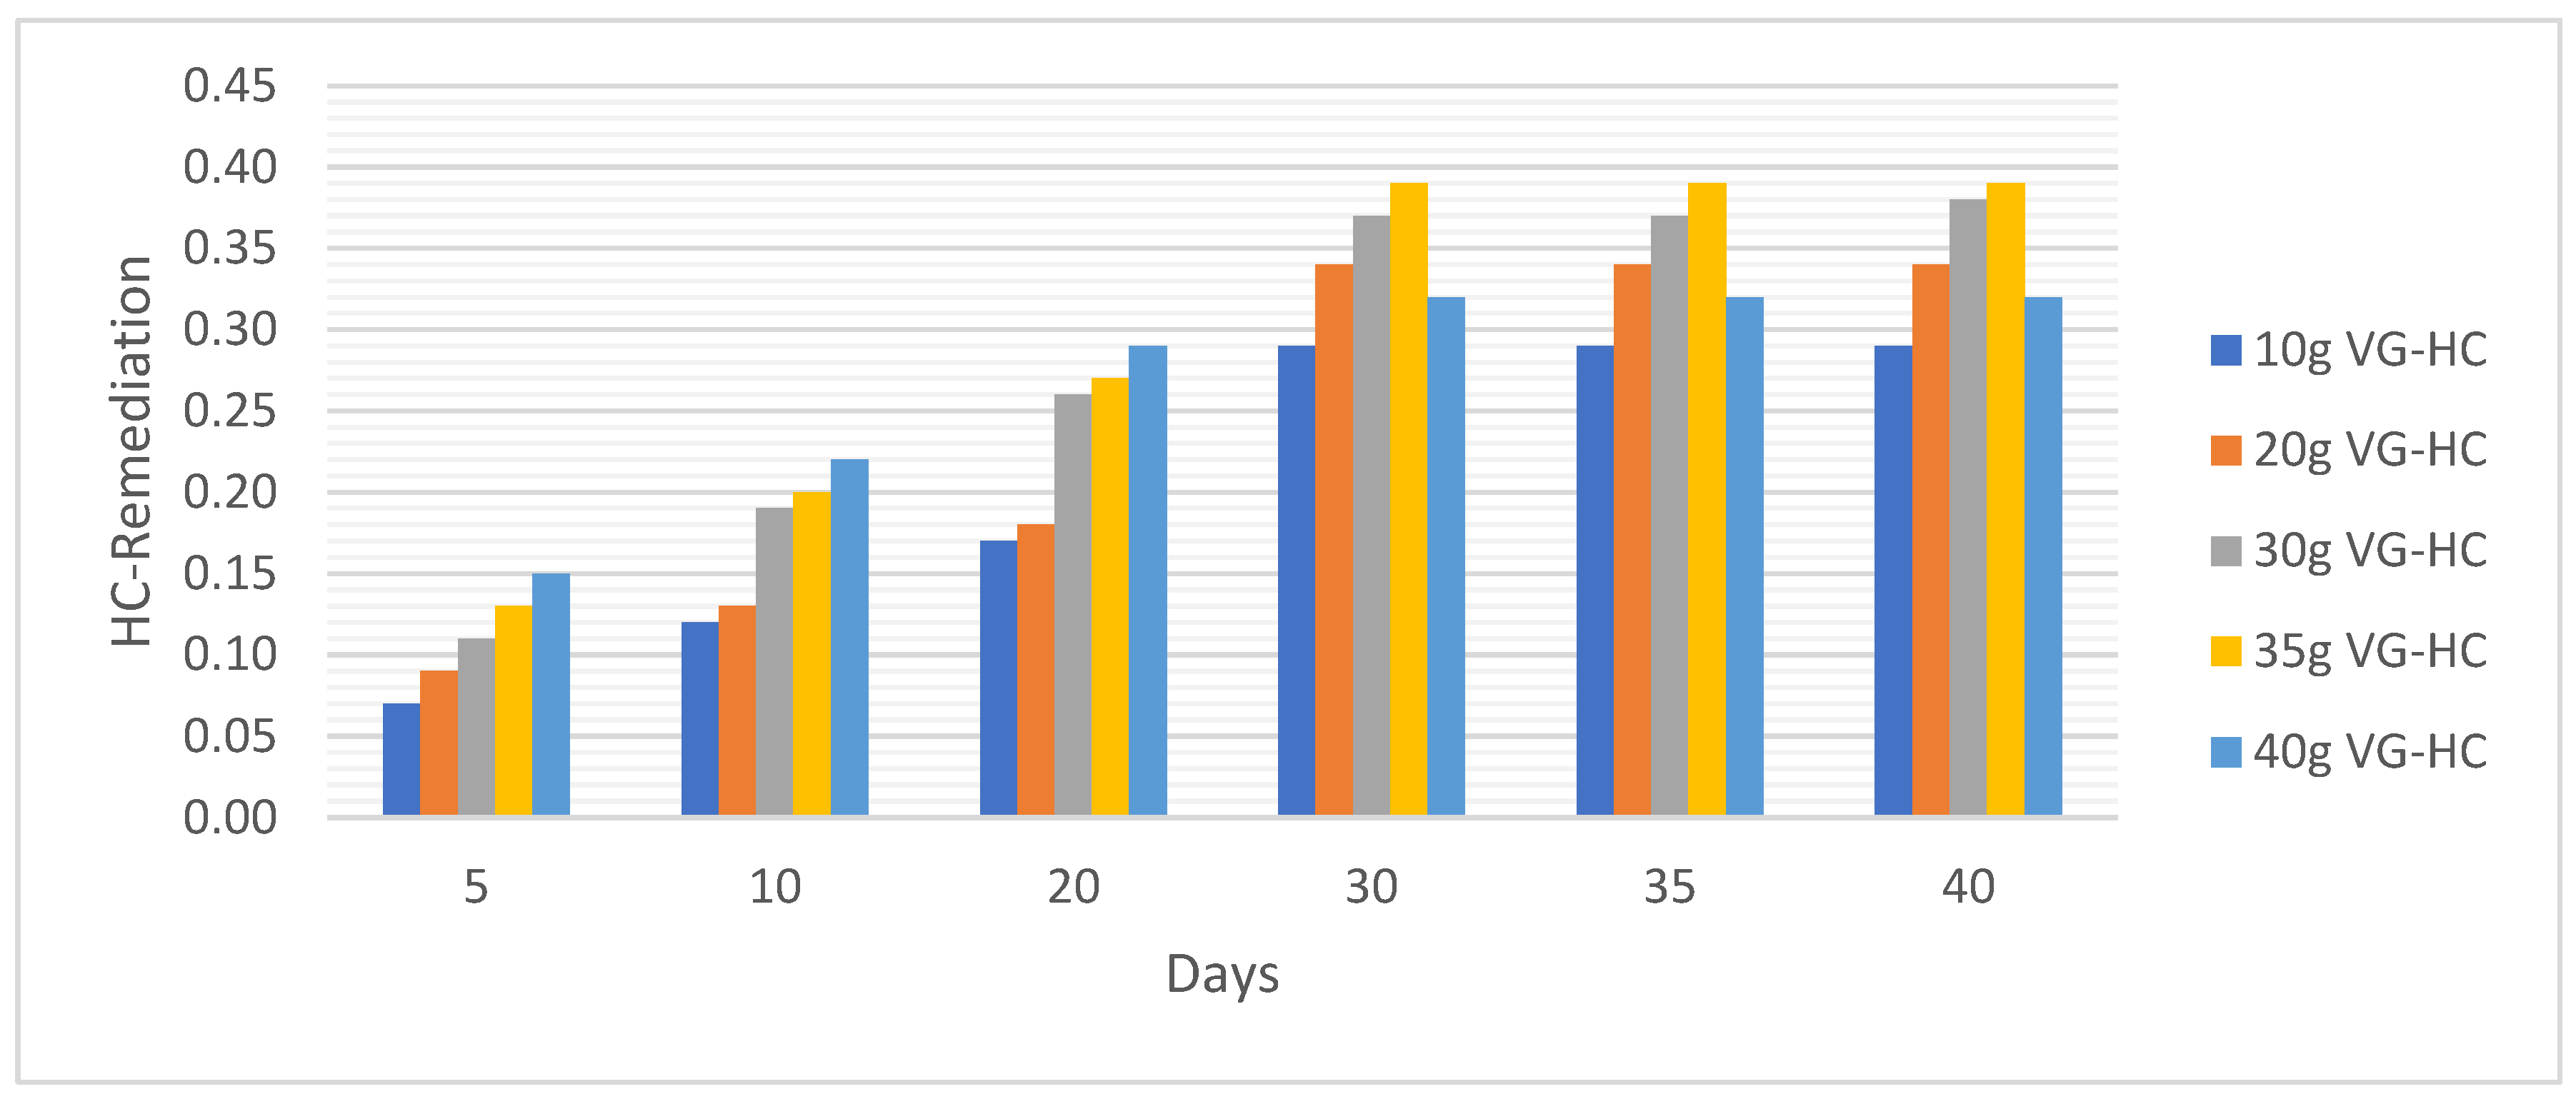
Figure 4.
7, a, b: Hydrocarbon content remediation using vernonia extracts of different masses in different days in clay soil.
Figure 4.
7, a, b: Hydrocarbon content remediation using vernonia extracts of different masses in different days in clay soil.
We can see that from Figure 4.8, that the room dry and the wet blended did a real deal in bio-remediating the hydro carbon in the clay soil. As high as 0.55 ug/ml was attained using vernonia Galamensis while as high as 0.67 ug/ml was attained using vernonia Amygdalina at 35g and 40 g respectively on the wet blended basis.
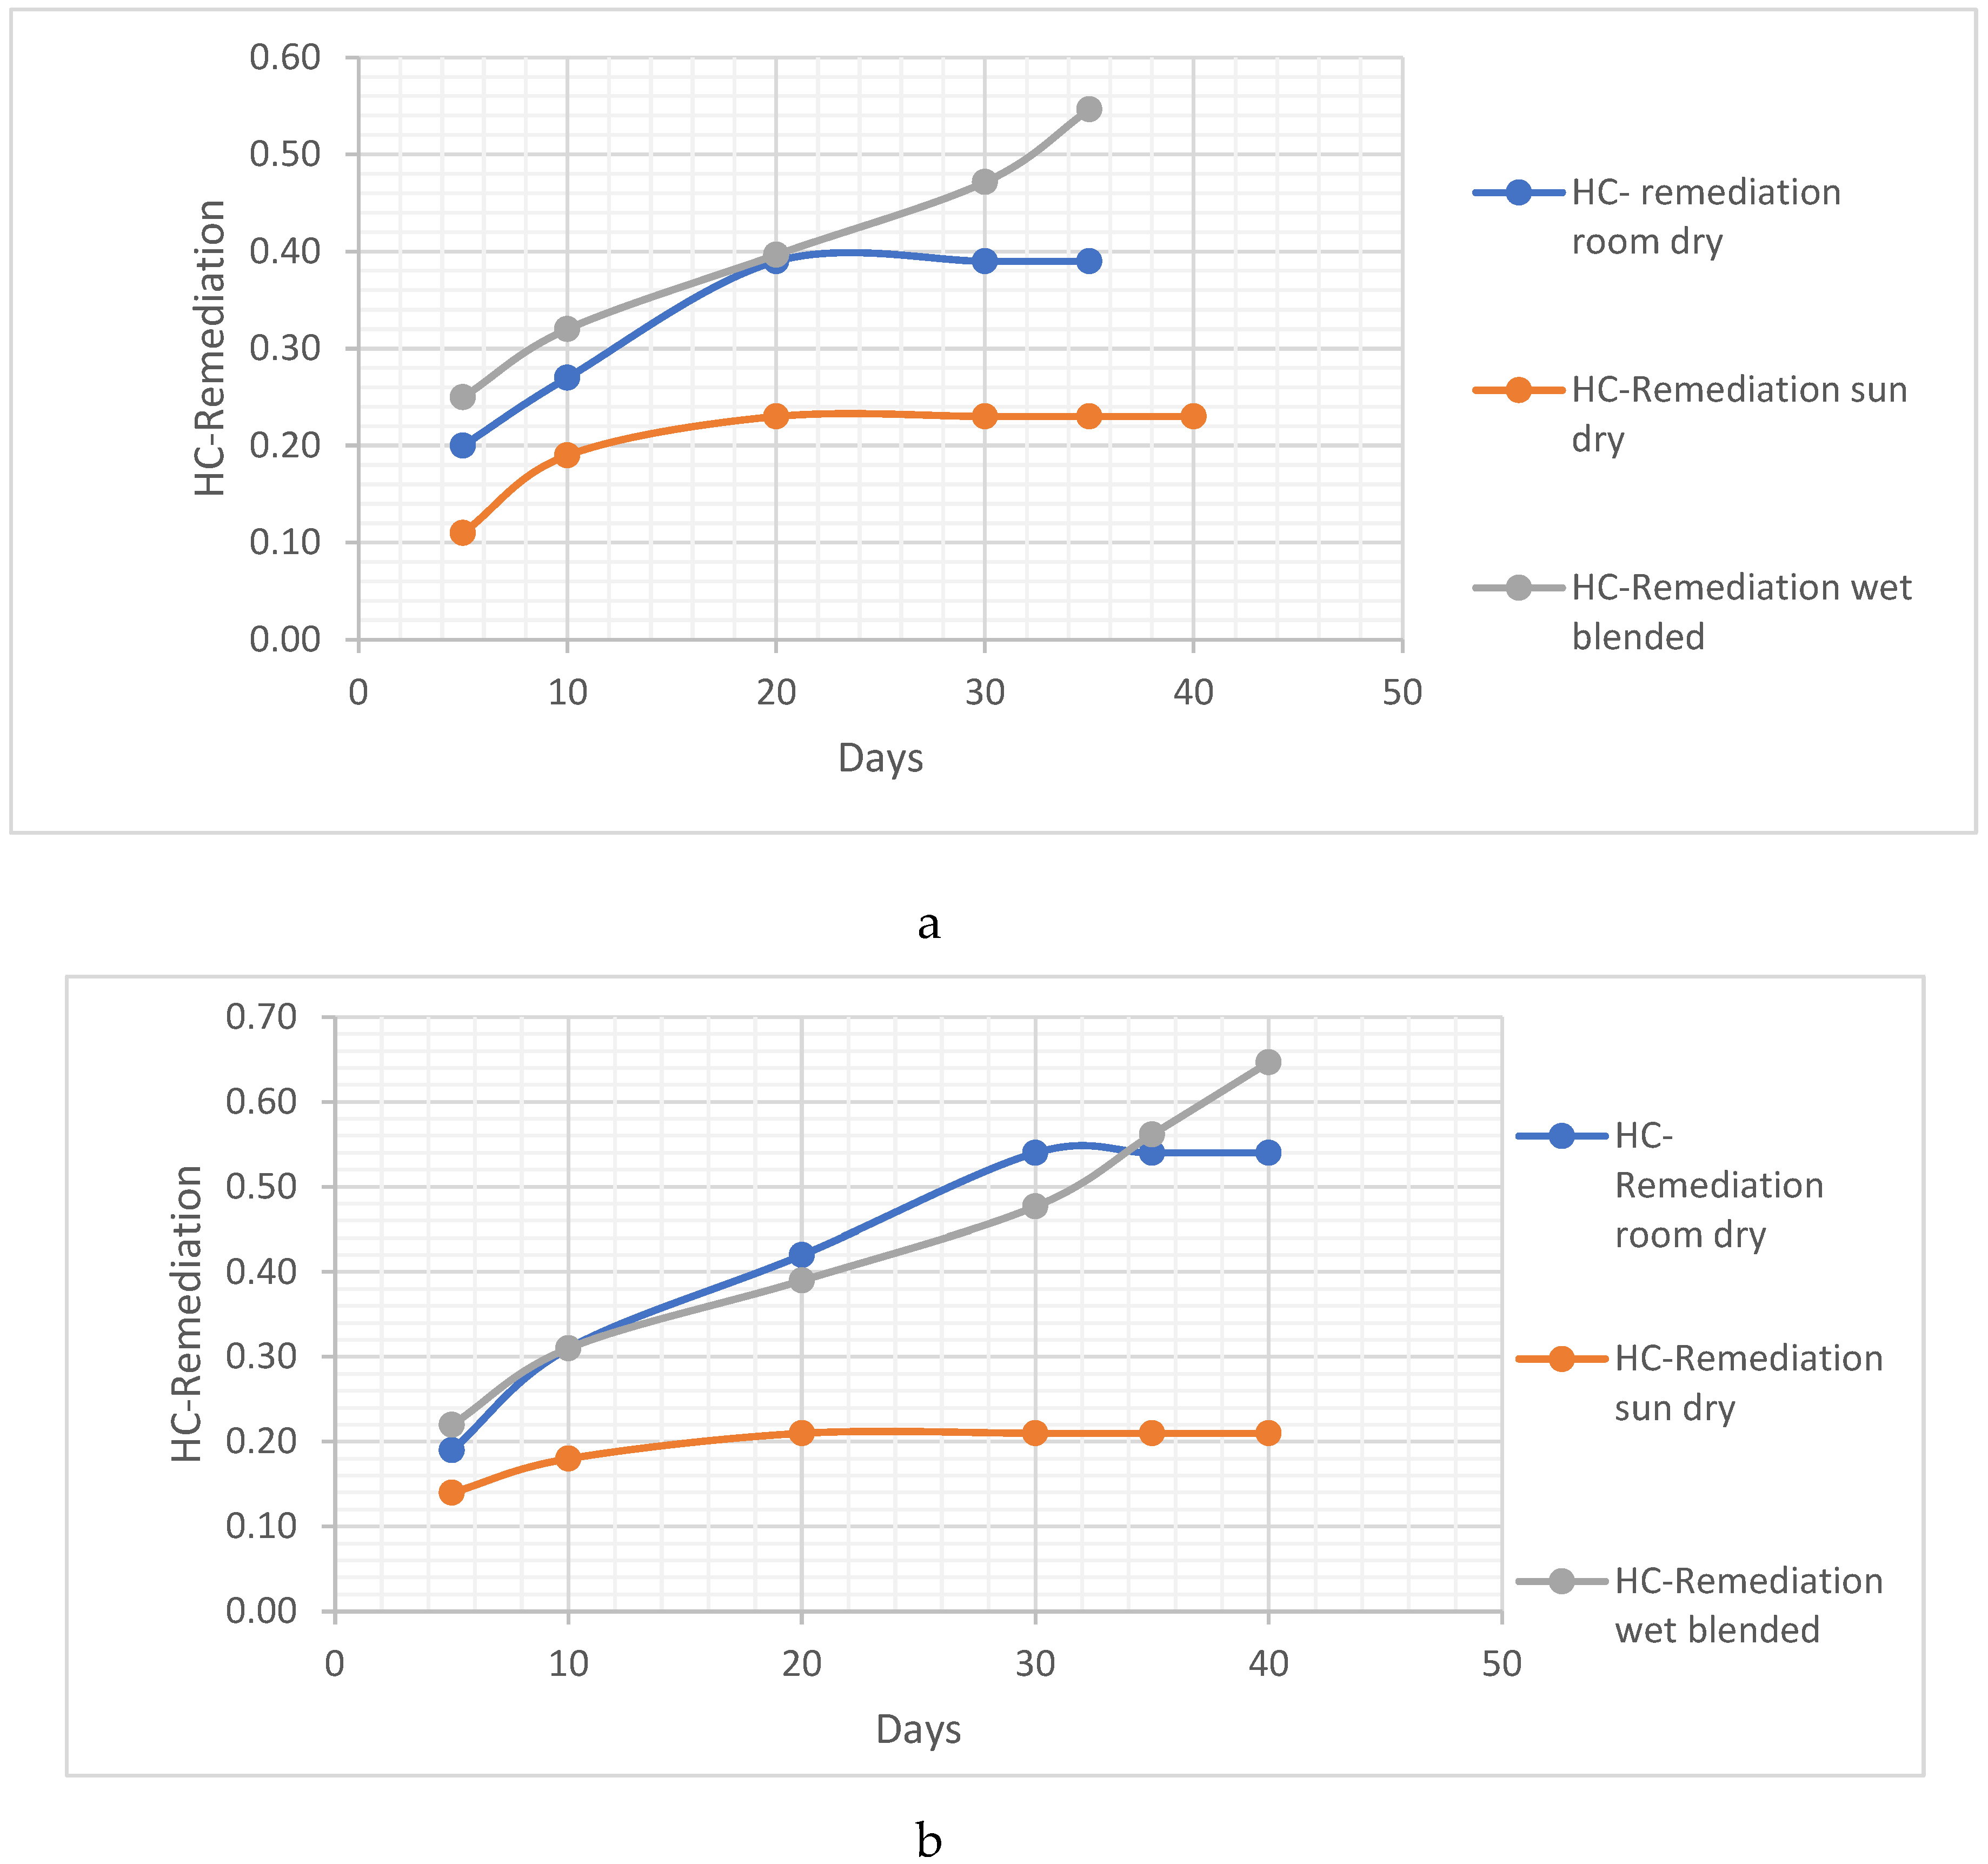
Figure 4.
8, a, b: Hydrocarbon content remediation method comparism using vernonia Galamensis and vernonia Amygdalina in clay soil.
Figure 4.
8, a, b: Hydrocarbon content remediation method comparism using vernonia Galamensis and vernonia Amygdalina in clay soil.
Metal Analysis
The reduction of the metals in the clay soil was responsible for the increase in the pH value towards the alkaline state. It is best we determine the potentiality of the metal reduction in the clay soil. From the data generated, more metals were remediated as the mass of the vernonia species increased.
- i. Pb Remediating Response
The increased remediating effect on the soil by the reduction of the pH concentration in the soil can be seen appreciative with more Pb reduction as the mass of the vernonia species increases.
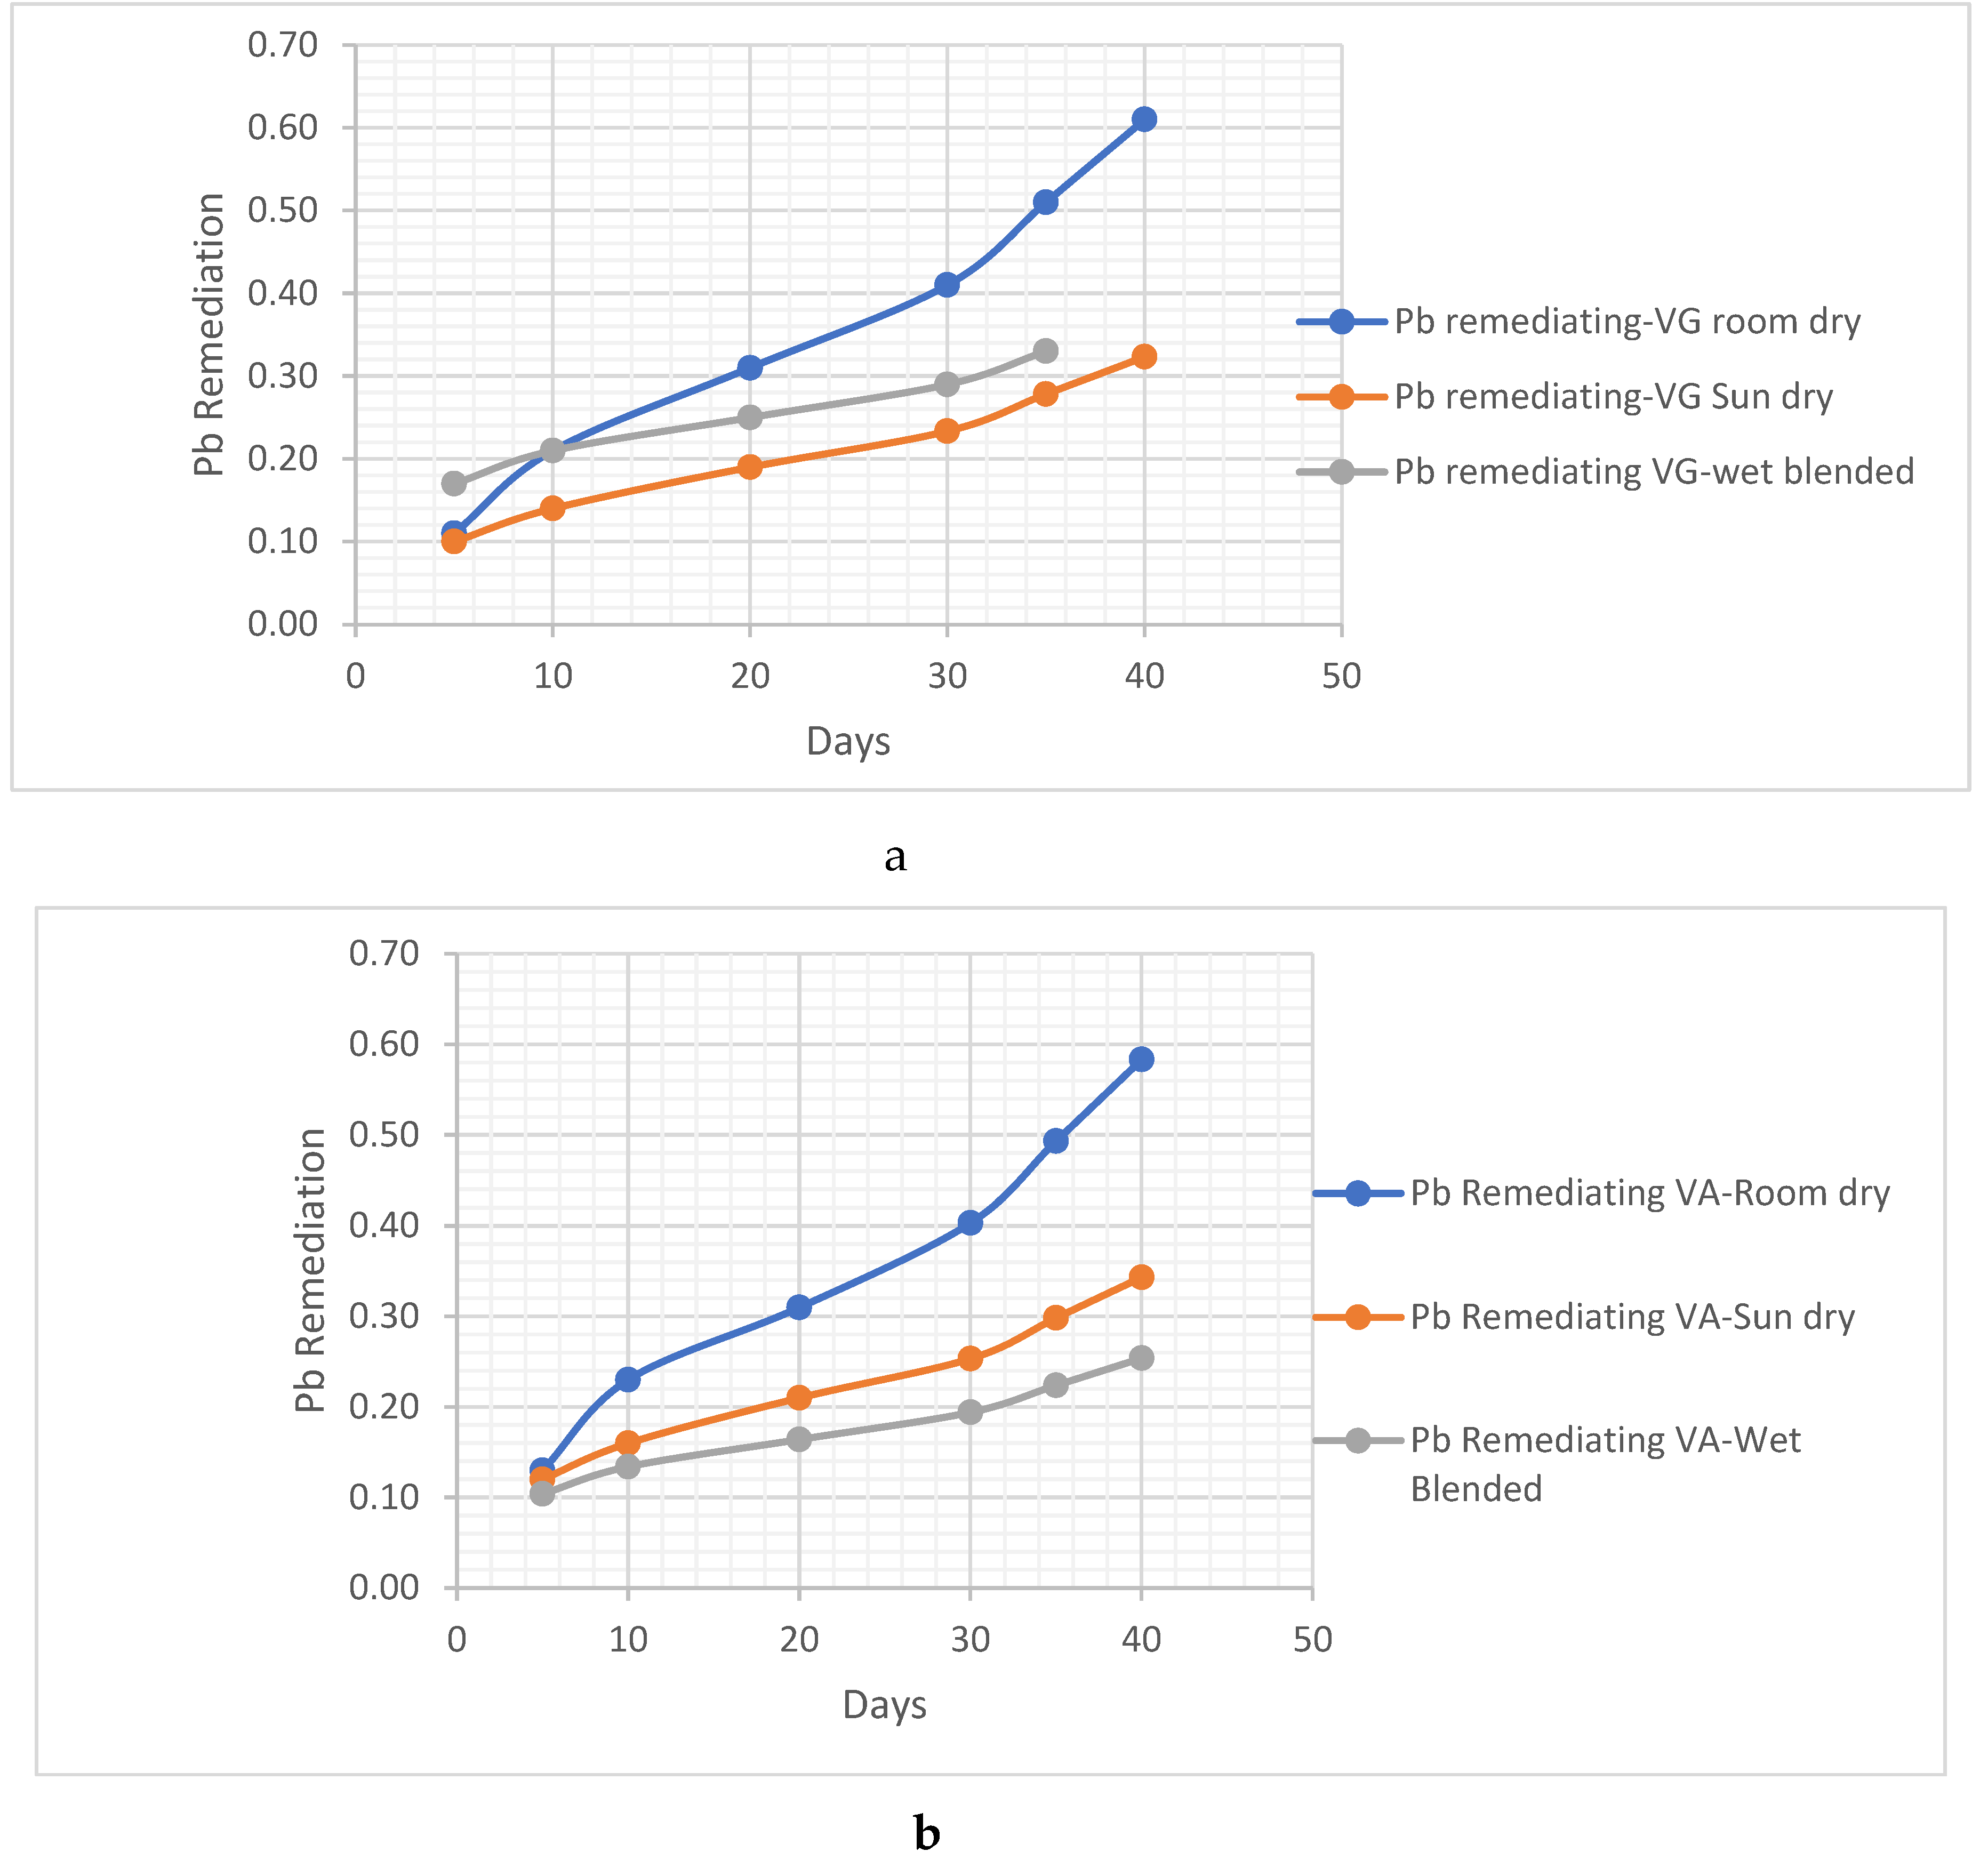
Figure 4.
9, a, b:Pb remediation method comparism using vernonia Galamensis and vernonia Amygdalina in clay soil.
Figure 4.
9, a, b:Pb remediation method comparism using vernonia Galamensis and vernonia Amygdalina in clay soil.
From Figure 4.9, it shows that the room dried vernonia species perform more Pb remediation activity. The wet basis vernonia species has poor Pb remediating effects. This can be attributed to the inactivity of the micro-organisms and the Phytochemicals responsible for Pb remediation in that condition. Both species of vernonia leaf achieved about 0.60 ug/ml of Pb remediation.
Zn Remediating Response
Just like the Pb remediation, Zn in the clay soil is also remediated and reduced. Looking at Figure 4.10, we see tha6t the remediating effects compared to other metals is lower as just about 0.25 ug/ml of Zn was remediated which was attributed to the wet blended prepared vernonia species. The room dried vernonia species performed the lowest in remediating the soil from Zn metal removing about 0.17 ug/ml and 0.10 ug/ml for Galamensis and Amygdalina respectively.
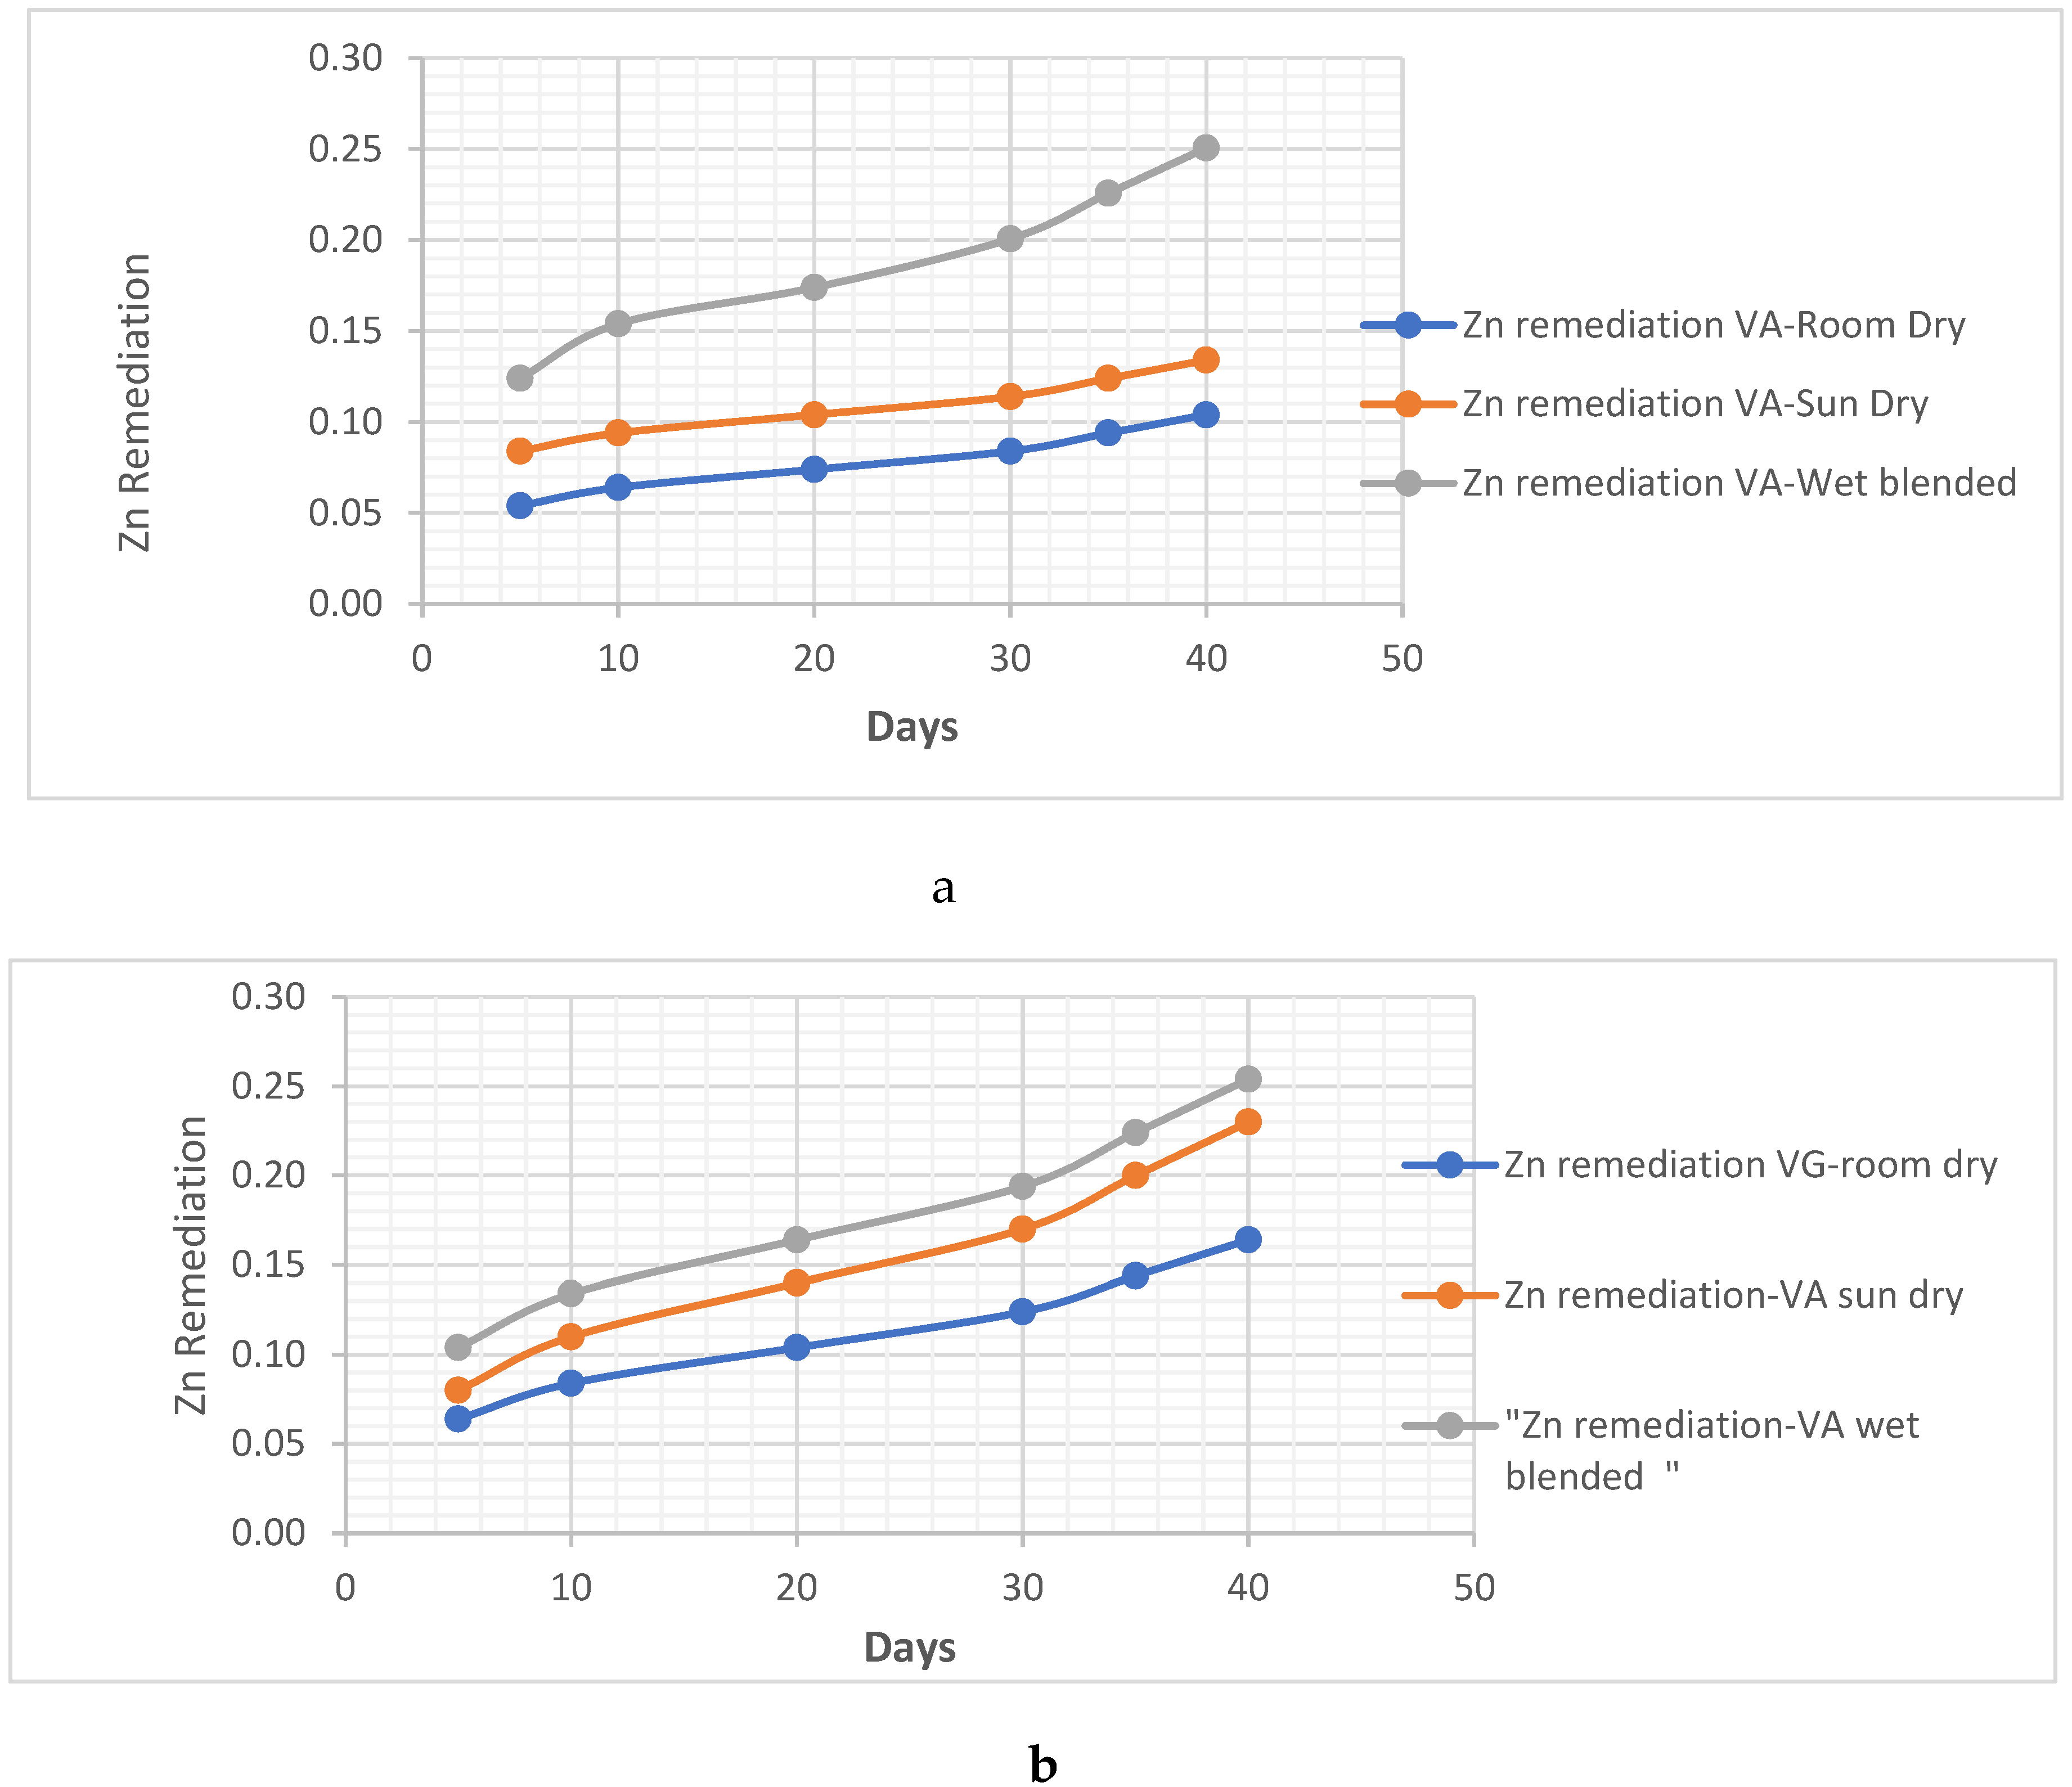
Figure 4.
10, a, b:Zn remediation method comparism using vernonia Galamensis and vernonia Amygdalina in clay soiL.
Figure 4.
10, a, b:Zn remediation method comparism using vernonia Galamensis and vernonia Amygdalina in clay soiL.
Cr remediating Response
In terms of Chromium (Cr) remediation, the wet blended method exhibits slightly higher potential compared to other preparation methods, although the difference is not significant. Both Vernonia leaf extracts achieved a remediation rate of 0.5 ug/ml for chromium. Additionally, the sun-dried and room-dried methods also demonstrated a considerable remediation potential of above 0.4 ug/ml.
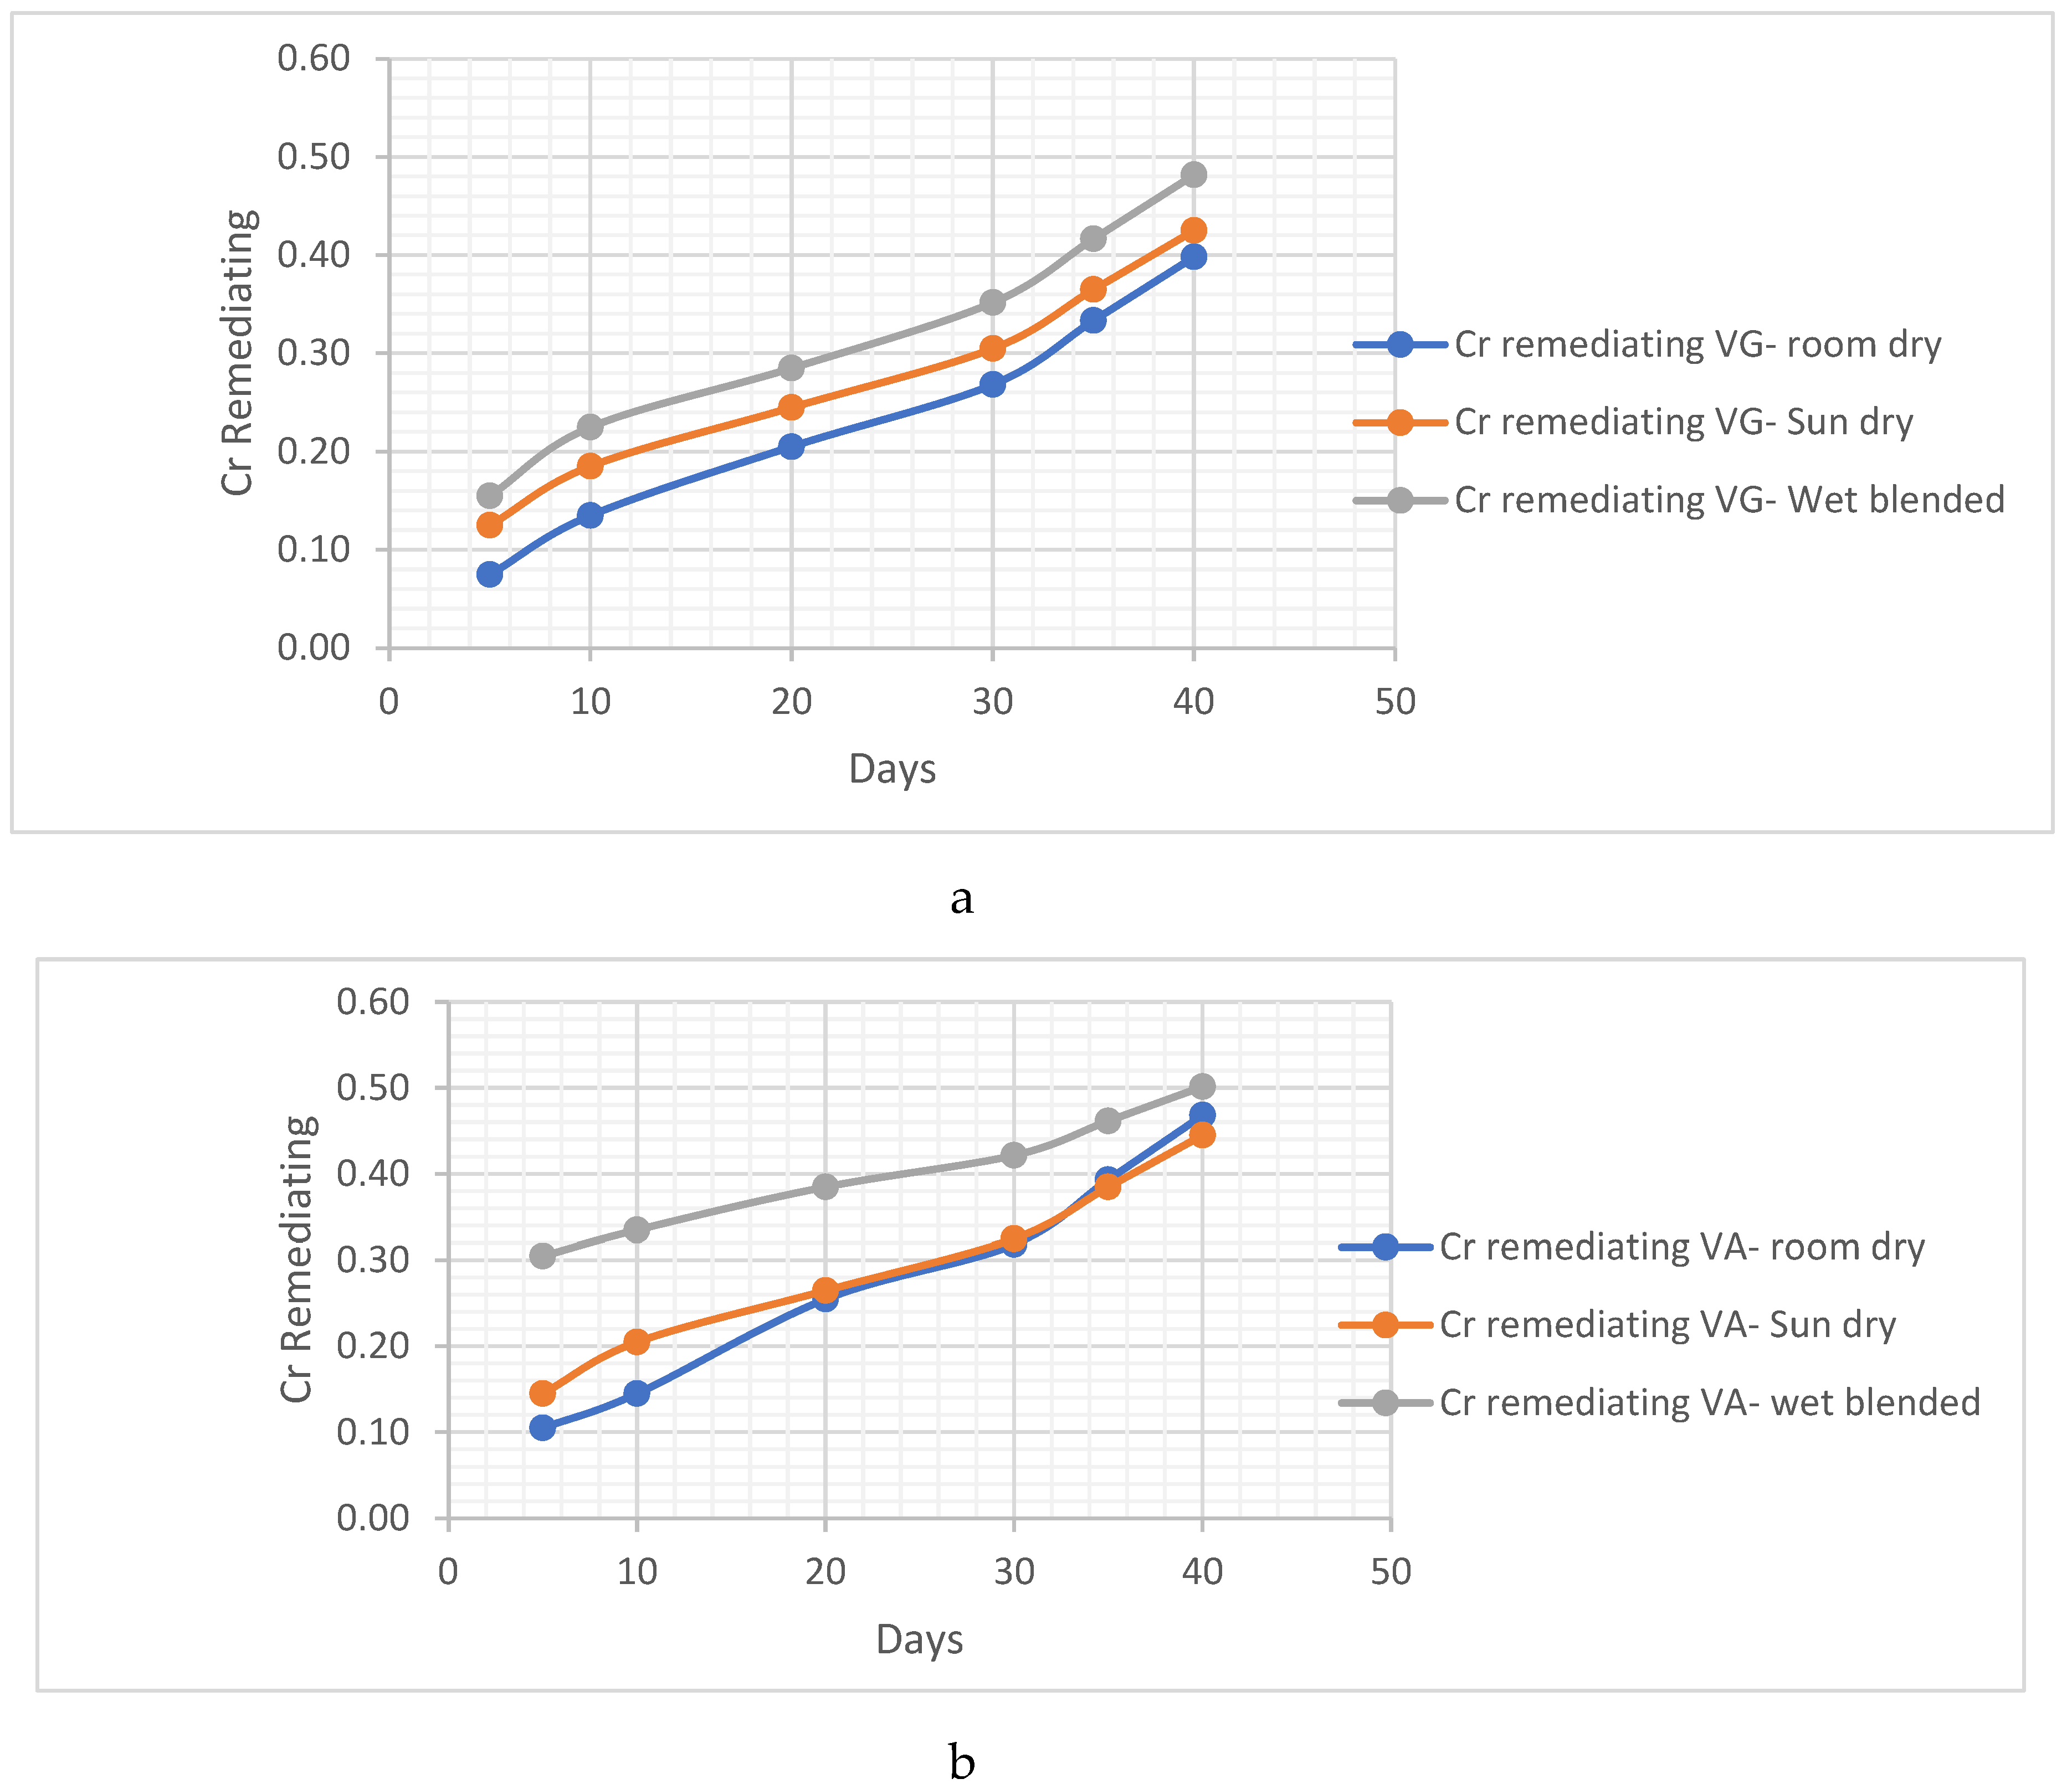
Figure 4.
11, a, b: Cr remediation method comparism using vernonia Galamensis and vernonia Amygdalina in clay soil.
Figure 4.
11, a, b: Cr remediation method comparism using vernonia Galamensis and vernonia Amygdalina in clay soil.
4.1.3. Sandy-Loamy Soil Bio Remedial Analysis
To replicate the conditions found in the Ogoni land, sandy-loamy soil samples were collected and mixed with Bonny Light crude oil. The pH levels, hydrocarbon contents, and metal concentrations were carefully measured by comparing the initial and final values before and after the addition of crude oil. Table 4.3 presents the recorded initial and final conditions of the response factors.
Table 4.
3- Initial and Final readings of the Response factors for clay soil.
| pH and HC readings for samples before contaminant | |||||
| Initial Content sample | pH | HC | Pb (ug/ml) | Zn (ug/ml) | Cr(ug/ml) |
| Sandy Loam Soil, SLSi | 6.76 | 2.59 | 0.018 | 0.022 | 0.015 |
| pH and HC readings for samples after contaminant | |||||
| Final Content sample | pH | HC | Pb (ug/ml) | Zn (ug/ml) | Cr(ug/ml) |
| Sandy Loam Soil, SLSf | 6.75 | 4.67 | 1.22 | 0.923 | 1.103 |
PH Analysis
In order to assess the stability of pH in the contaminated soil, we will investigate the variations in pH levels as different species of Vernonia are introduced. This examination will encompass all the methods used to prepare the Vernonia species, the varying masses added to the contaminated soil, and the duration of time required for the experiment to be observed. By cross-examining these factors, we aim to gain a comprehensive understanding of how the pH levels in the soil respond to the introduction of different Vernonia species. This analysis will provide valuable insights into the effectiveness of each preparation method, the influence of different mass additions, and the time required for observable changes in pH.
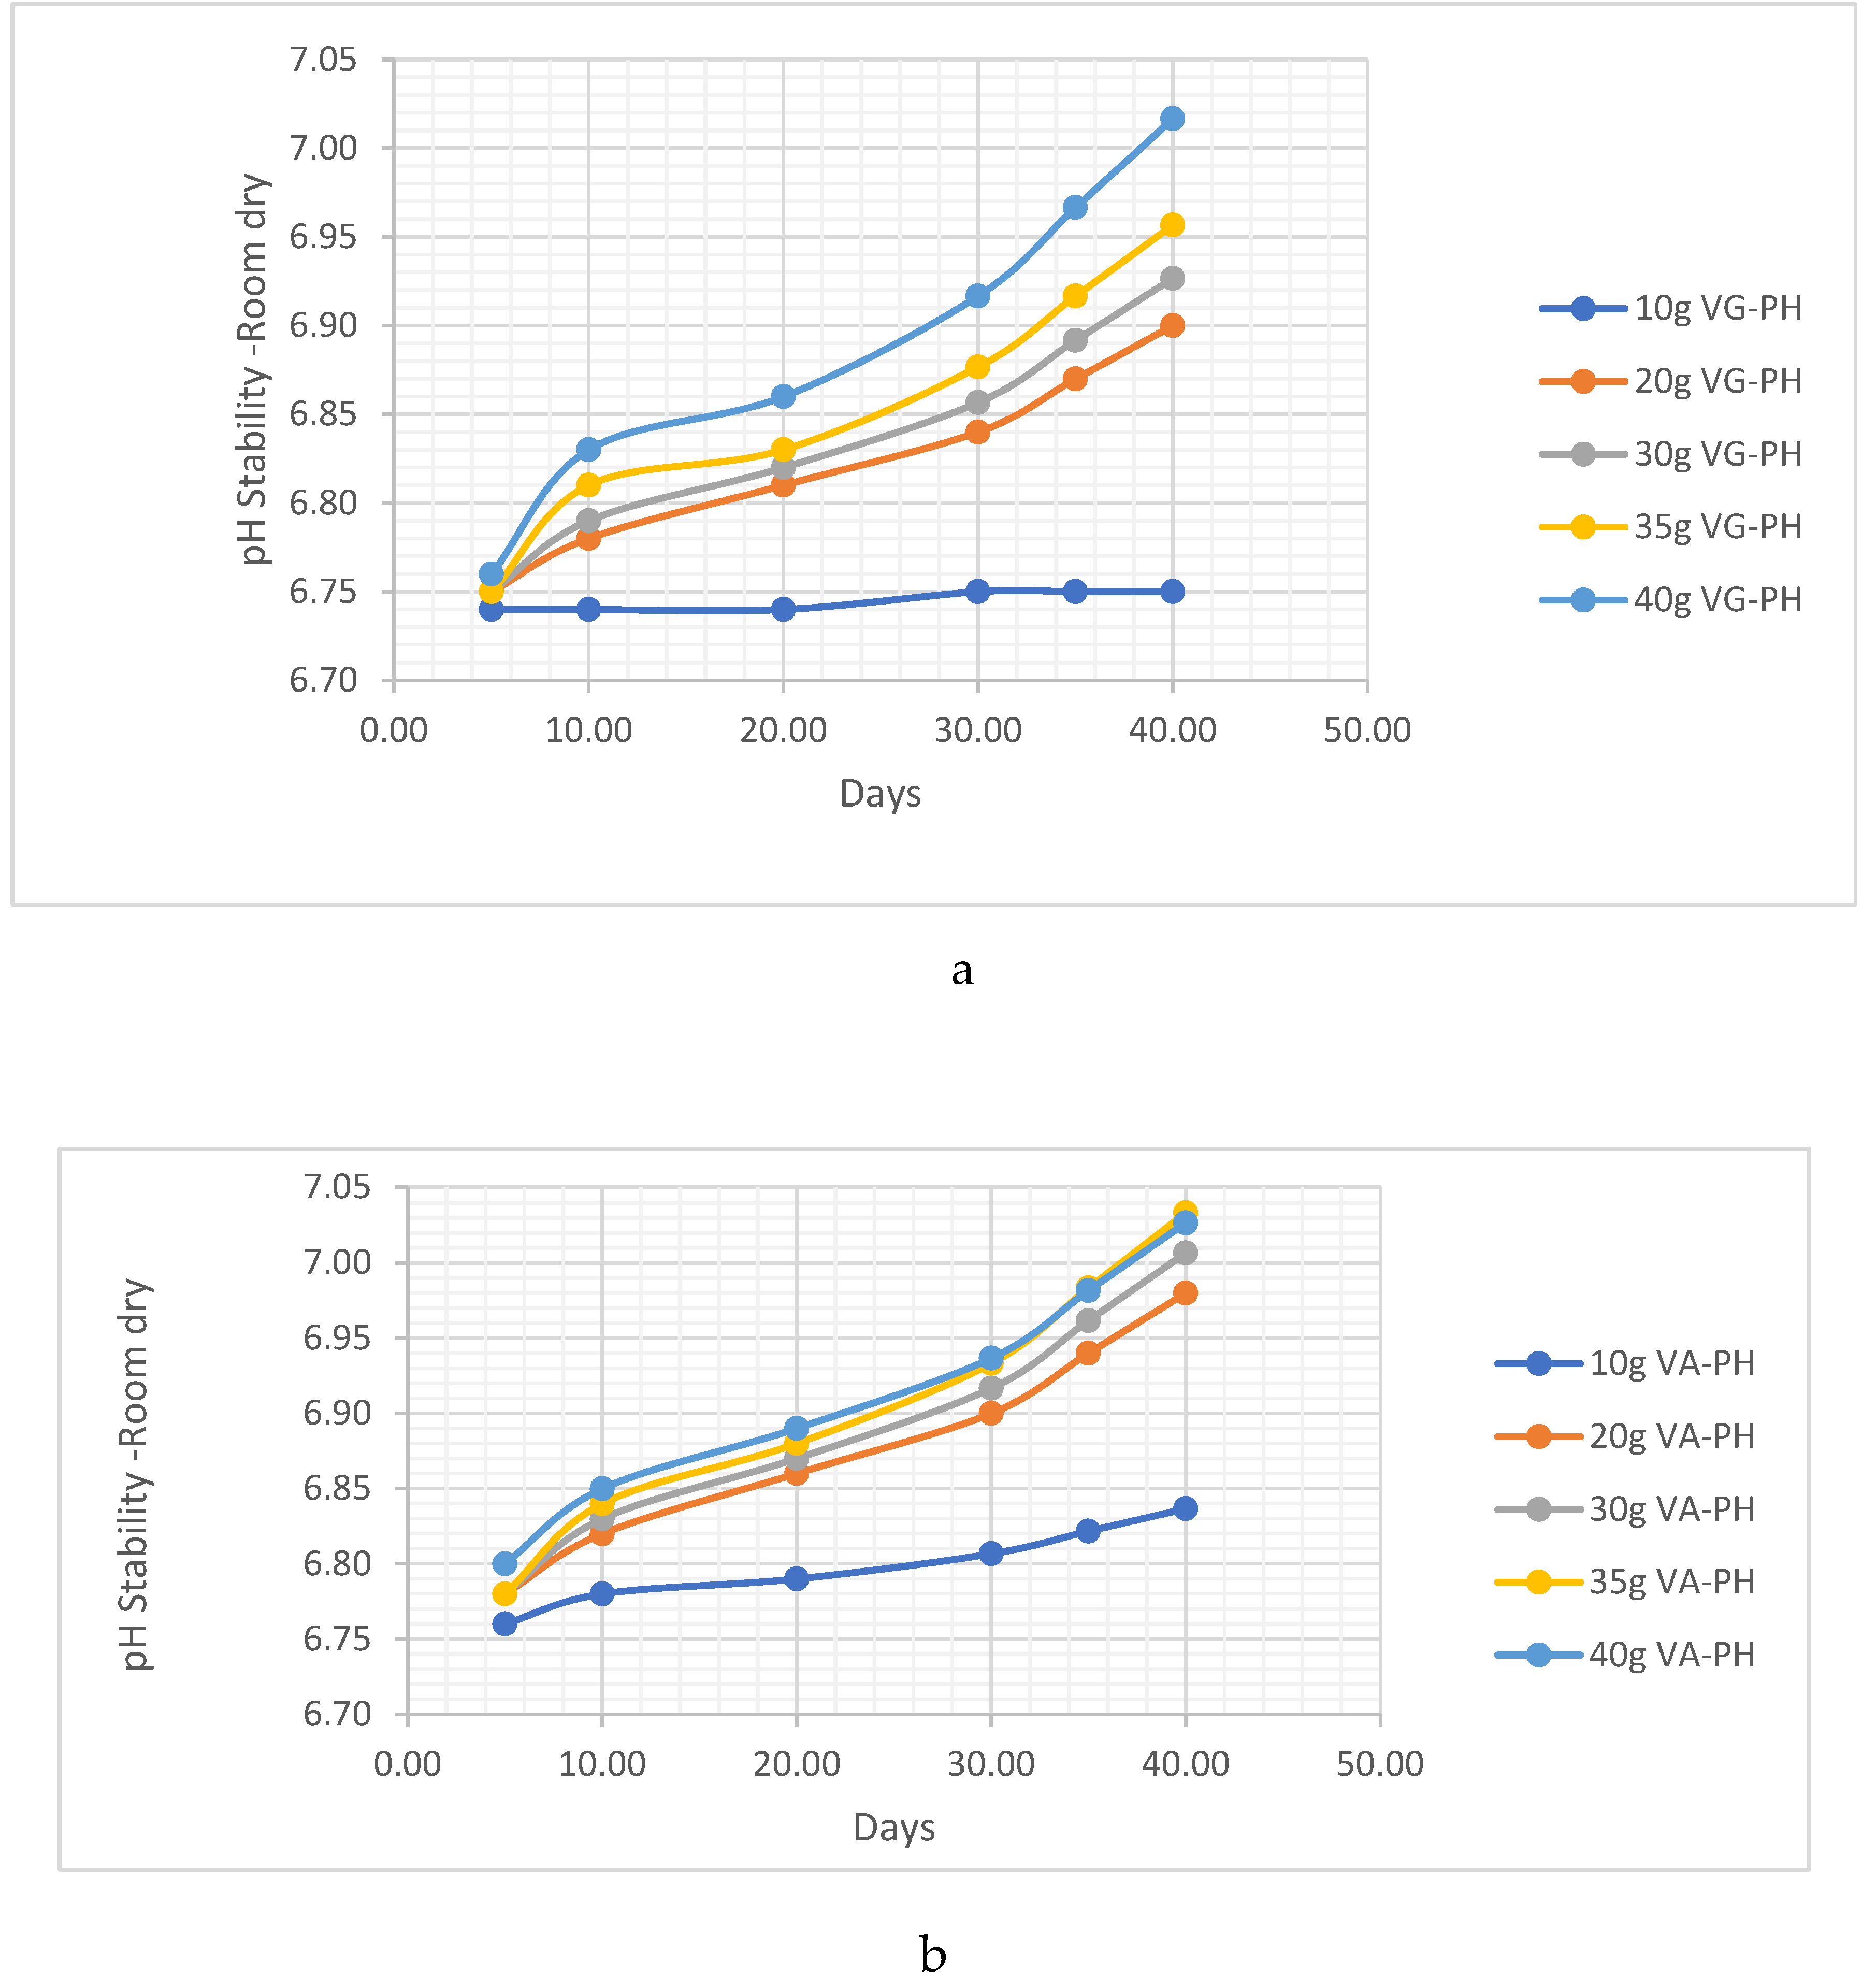
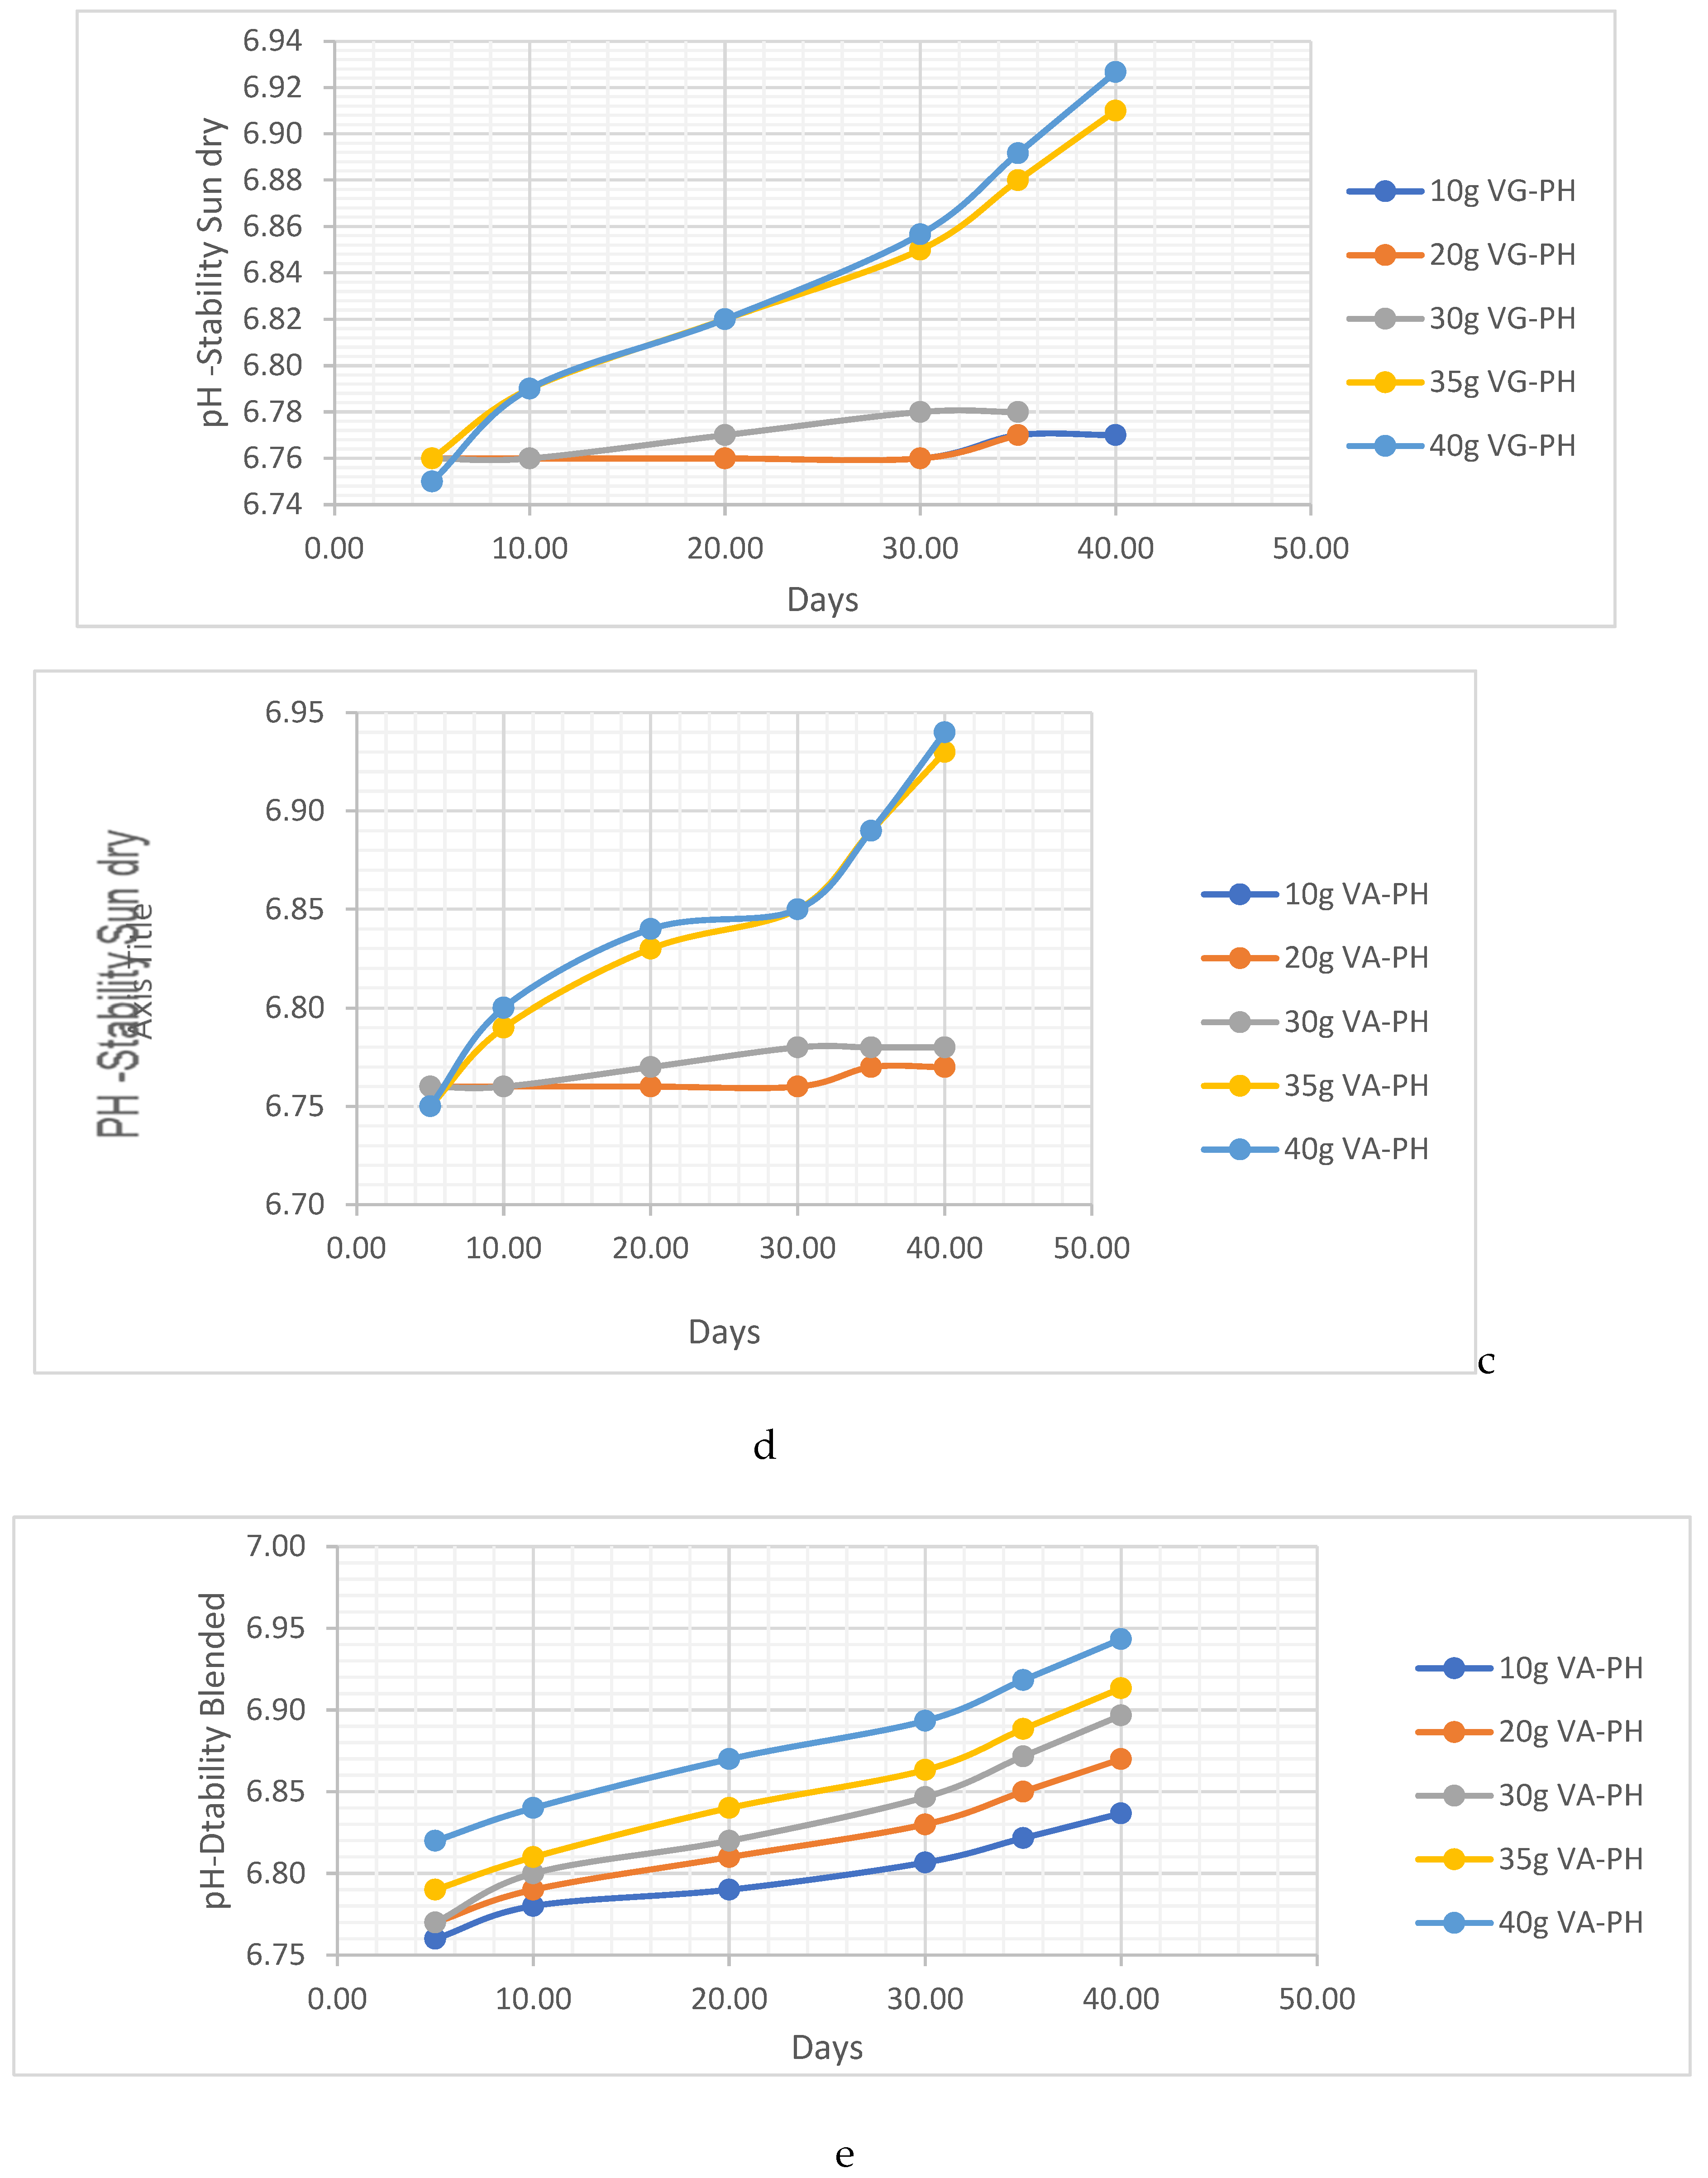
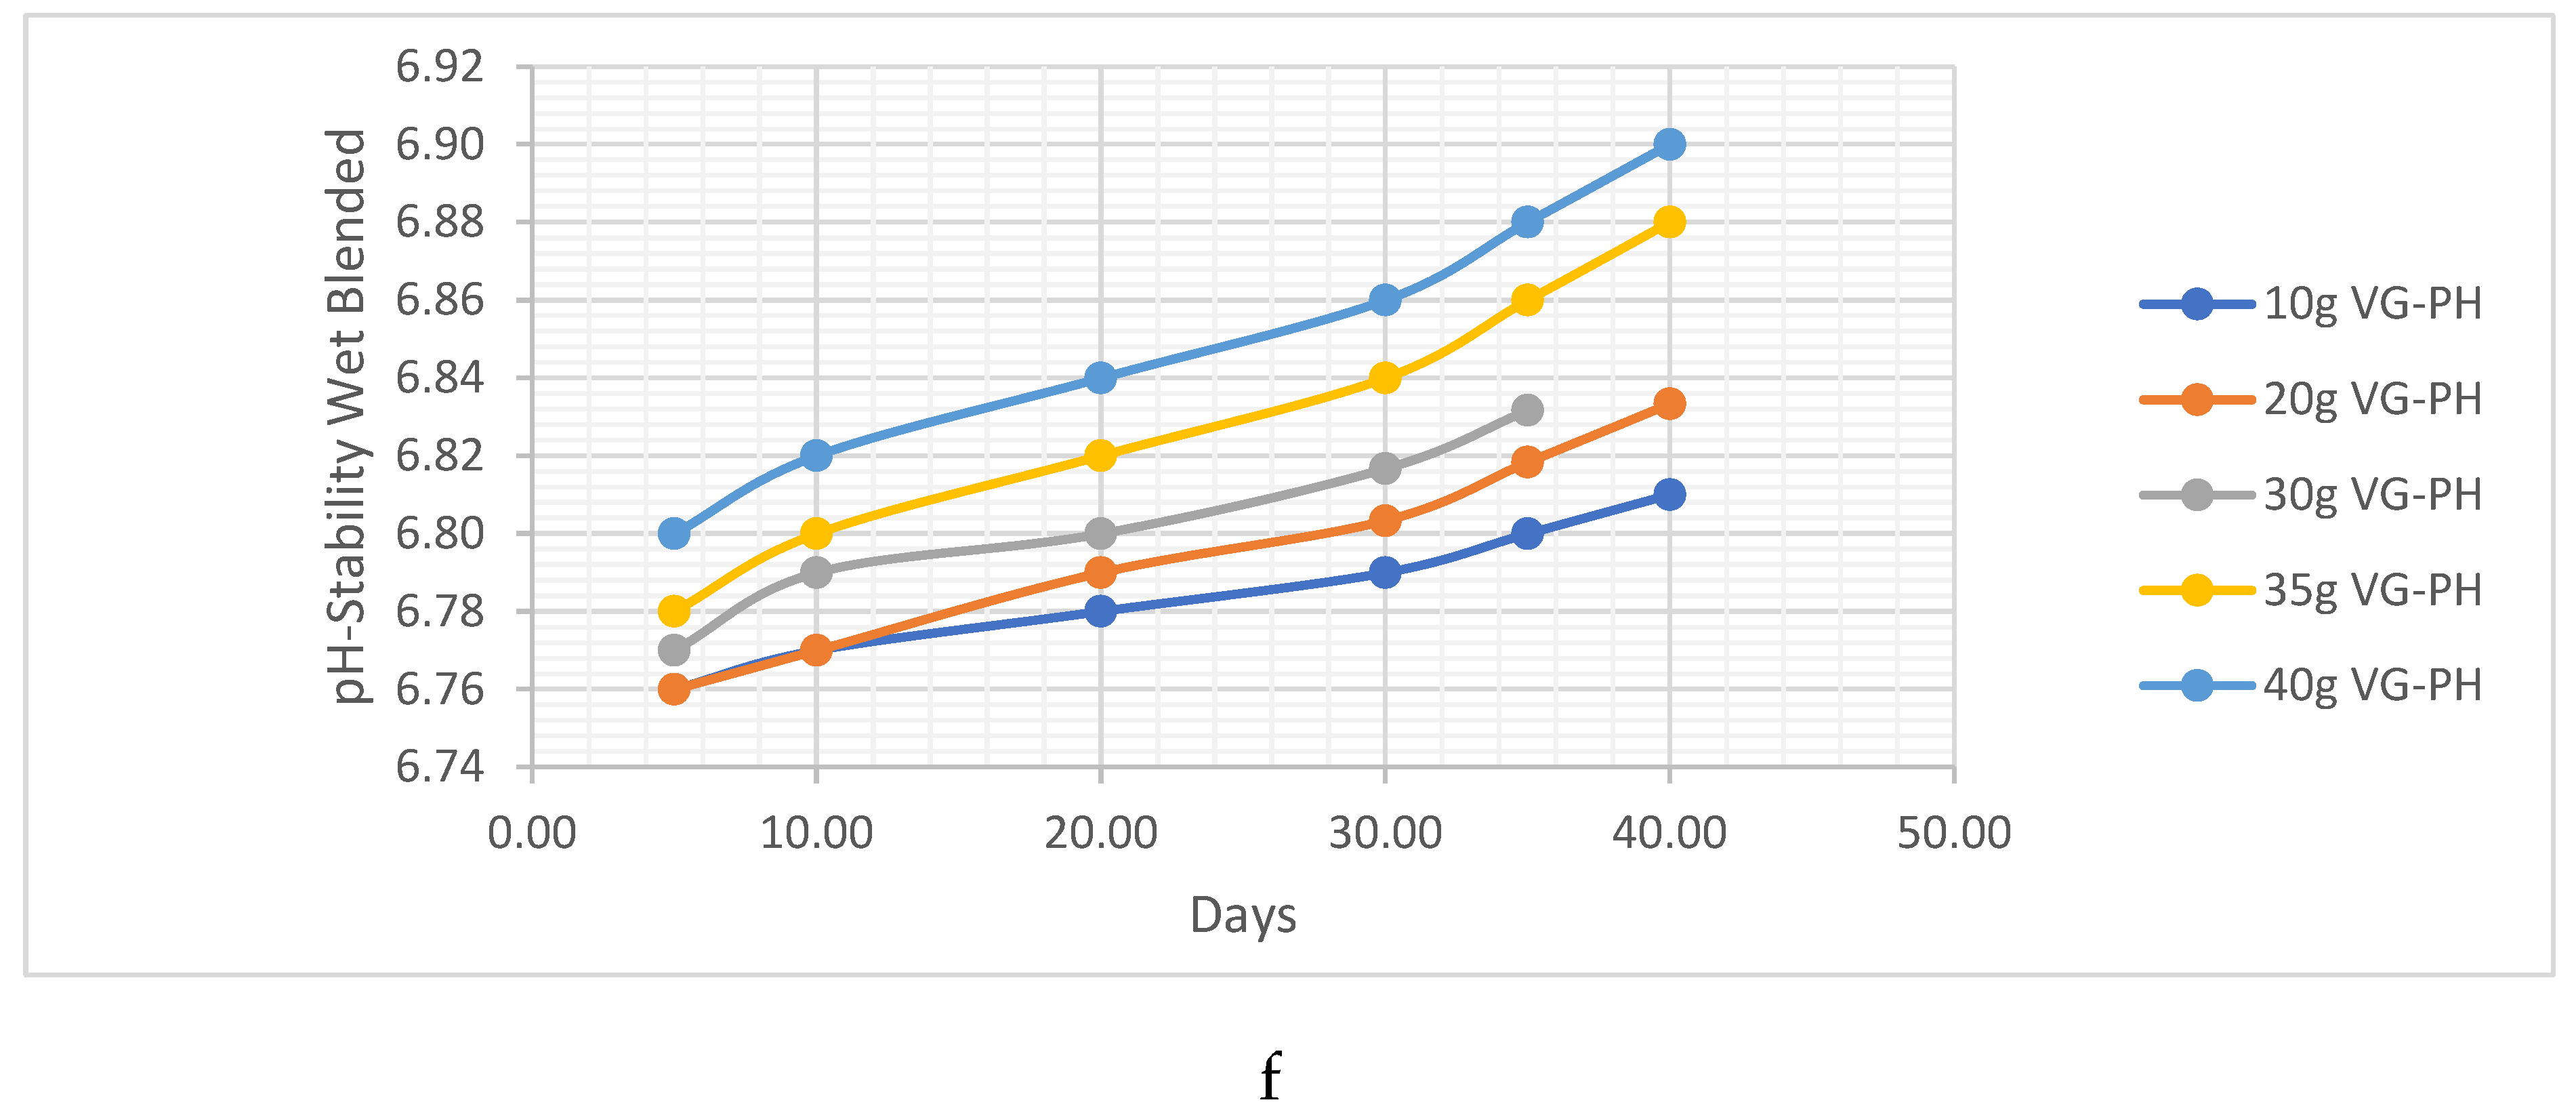
Figure 4.
12, a, b, c, d, e, f:pH behavioural characteristics of the vernonia extracts using different application methods on sandy-loamy soil.
Figure 4.
12, a, b, c, d, e, f:pH behavioural characteristics of the vernonia extracts using different application methods on sandy-loamy soil.
Based on Figure 4.12, we observe the impact of introducing Vernonia extracts on the stability of soil pH. Notably, only the sun-dried preparation at 10g and 20g demonstrated a stable pH. In contrast, all other treatments resulted in a change in pH, increasing it and rendering it more neutral. This shift in pH can be attributed to the reduction of metals present in the soil. The results suggest that the sun-dried Vernonia preparation at 10g and 20g effectively maintained the pH stability of the soil, potentially due to their ability to mitigate metal concentrations. Further analysis of these findings could provide valuable insights into the role of Vernonia extracts in soil pH stabilization and metal reduction.
HC Analysis .
The analysis of hydrocarbon content reveals that the remediation of hydrocarbons was more effective when using the Vernonia Amygdalina leaf extract that was dried under room conditions. Interestingly, the performance of Vernonia Amygdalina was more than twice as effective compared to Vernonia Galamensis. Specifically, when 40g of extracts were used for a duration of 40 days, 0.90ug/ml and 1.80ug/ml of hydrocarbons were respectively remediated for Vernonia Galamensis and Vernonia Amygdalina. These findings suggest that the Vernonia Amygdalina leaf extract, dried under room conditions, exhibits superior capabilities in hydrocarbon remediation compared to Vernonia Galamensis. The significant difference in hydrocarbon remediation potential between the two Vernonia species highlights the importance of selecting the appropriate variety for soil remediation purposes
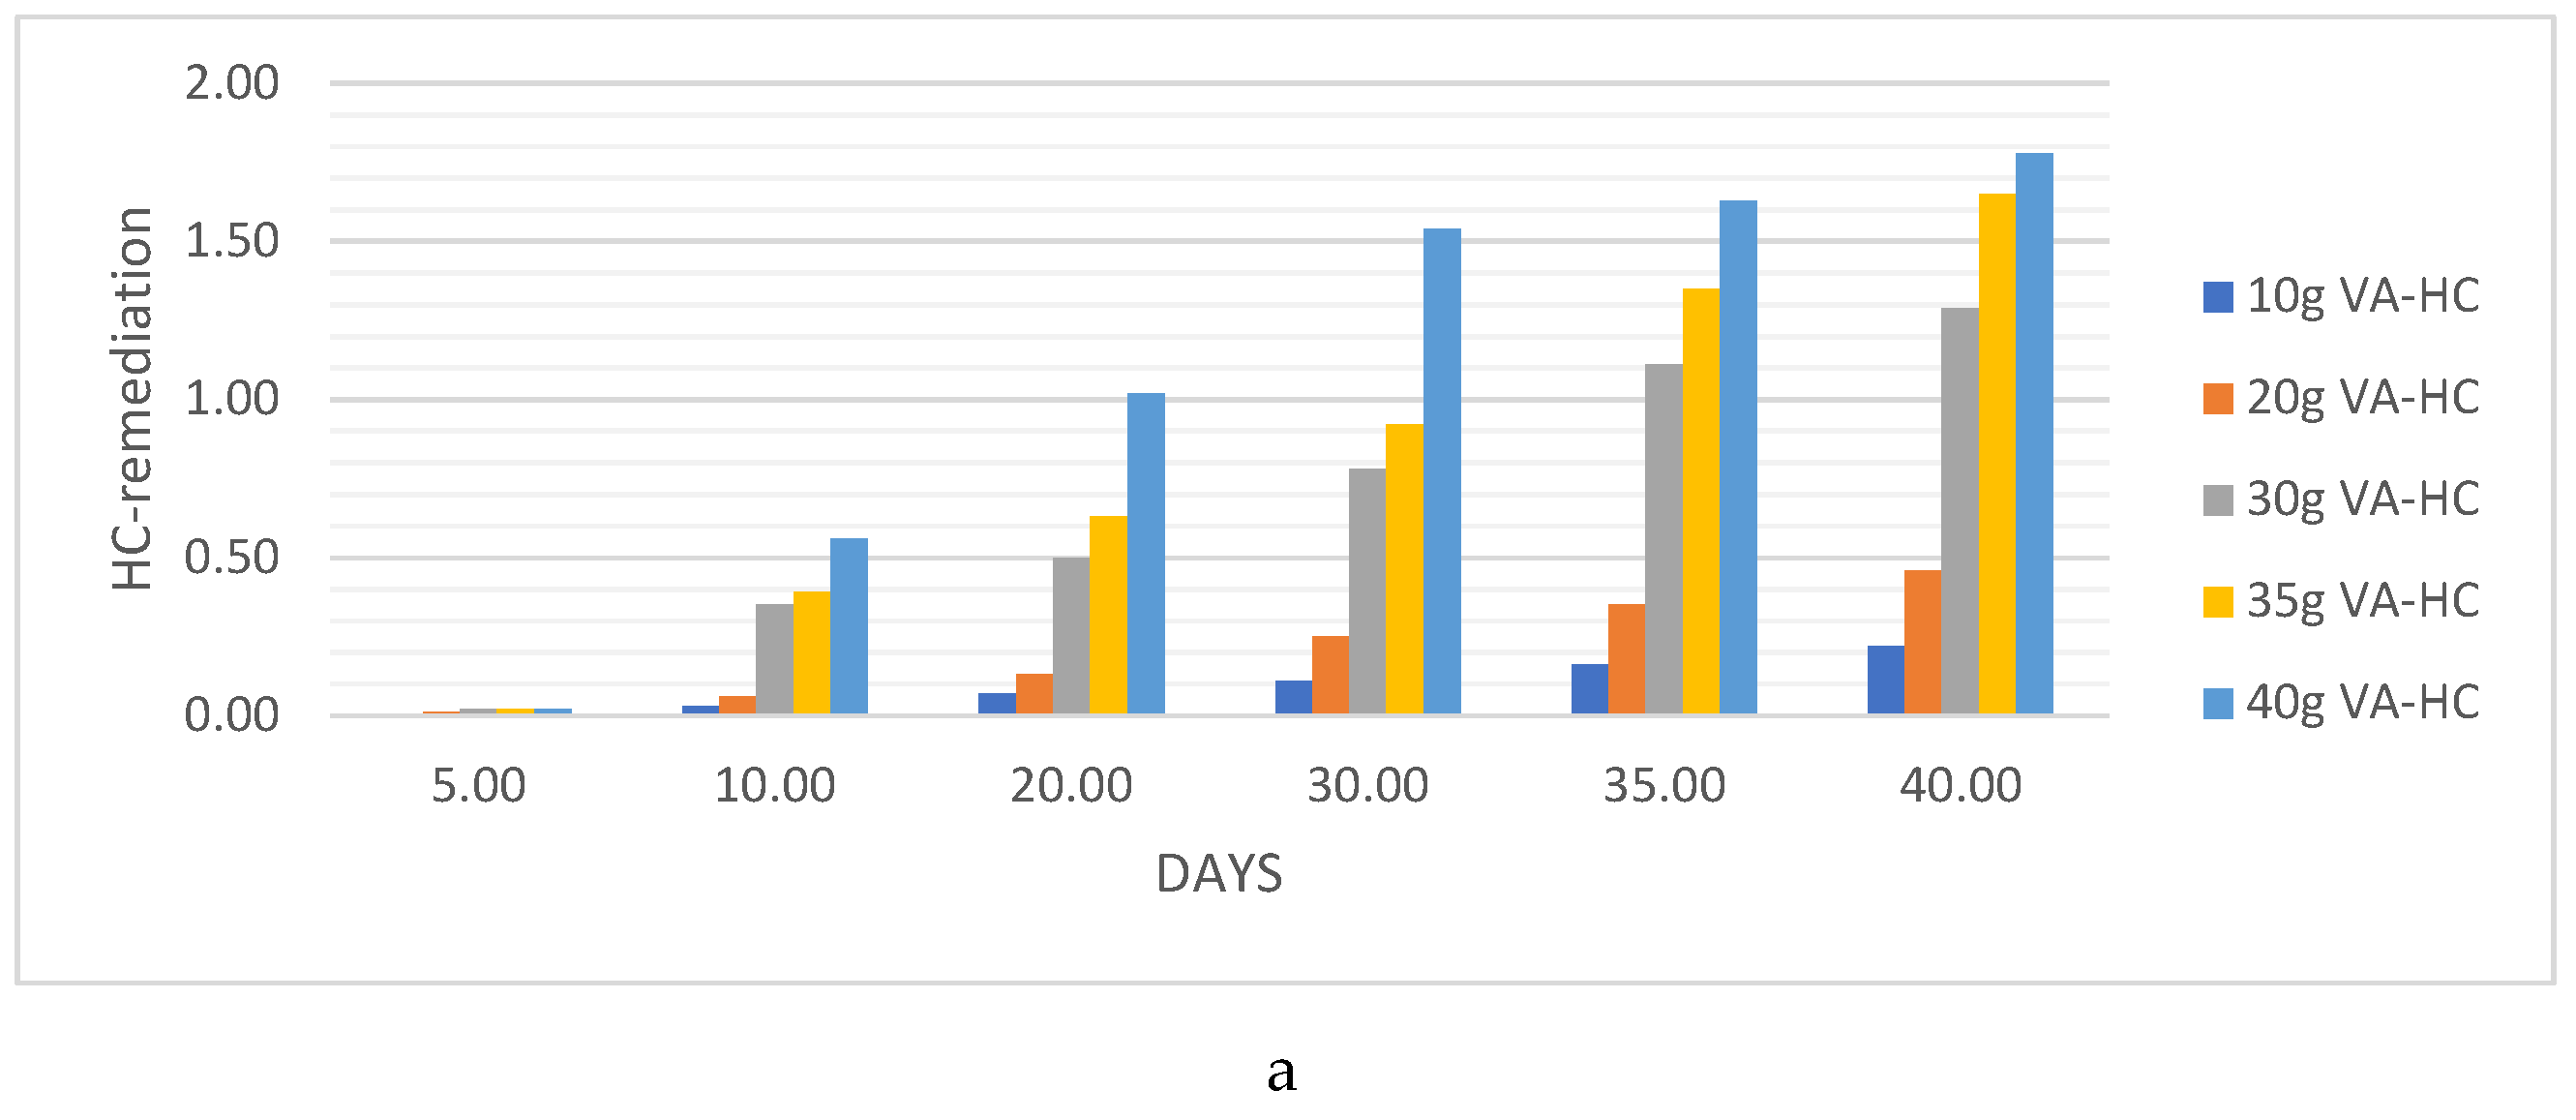
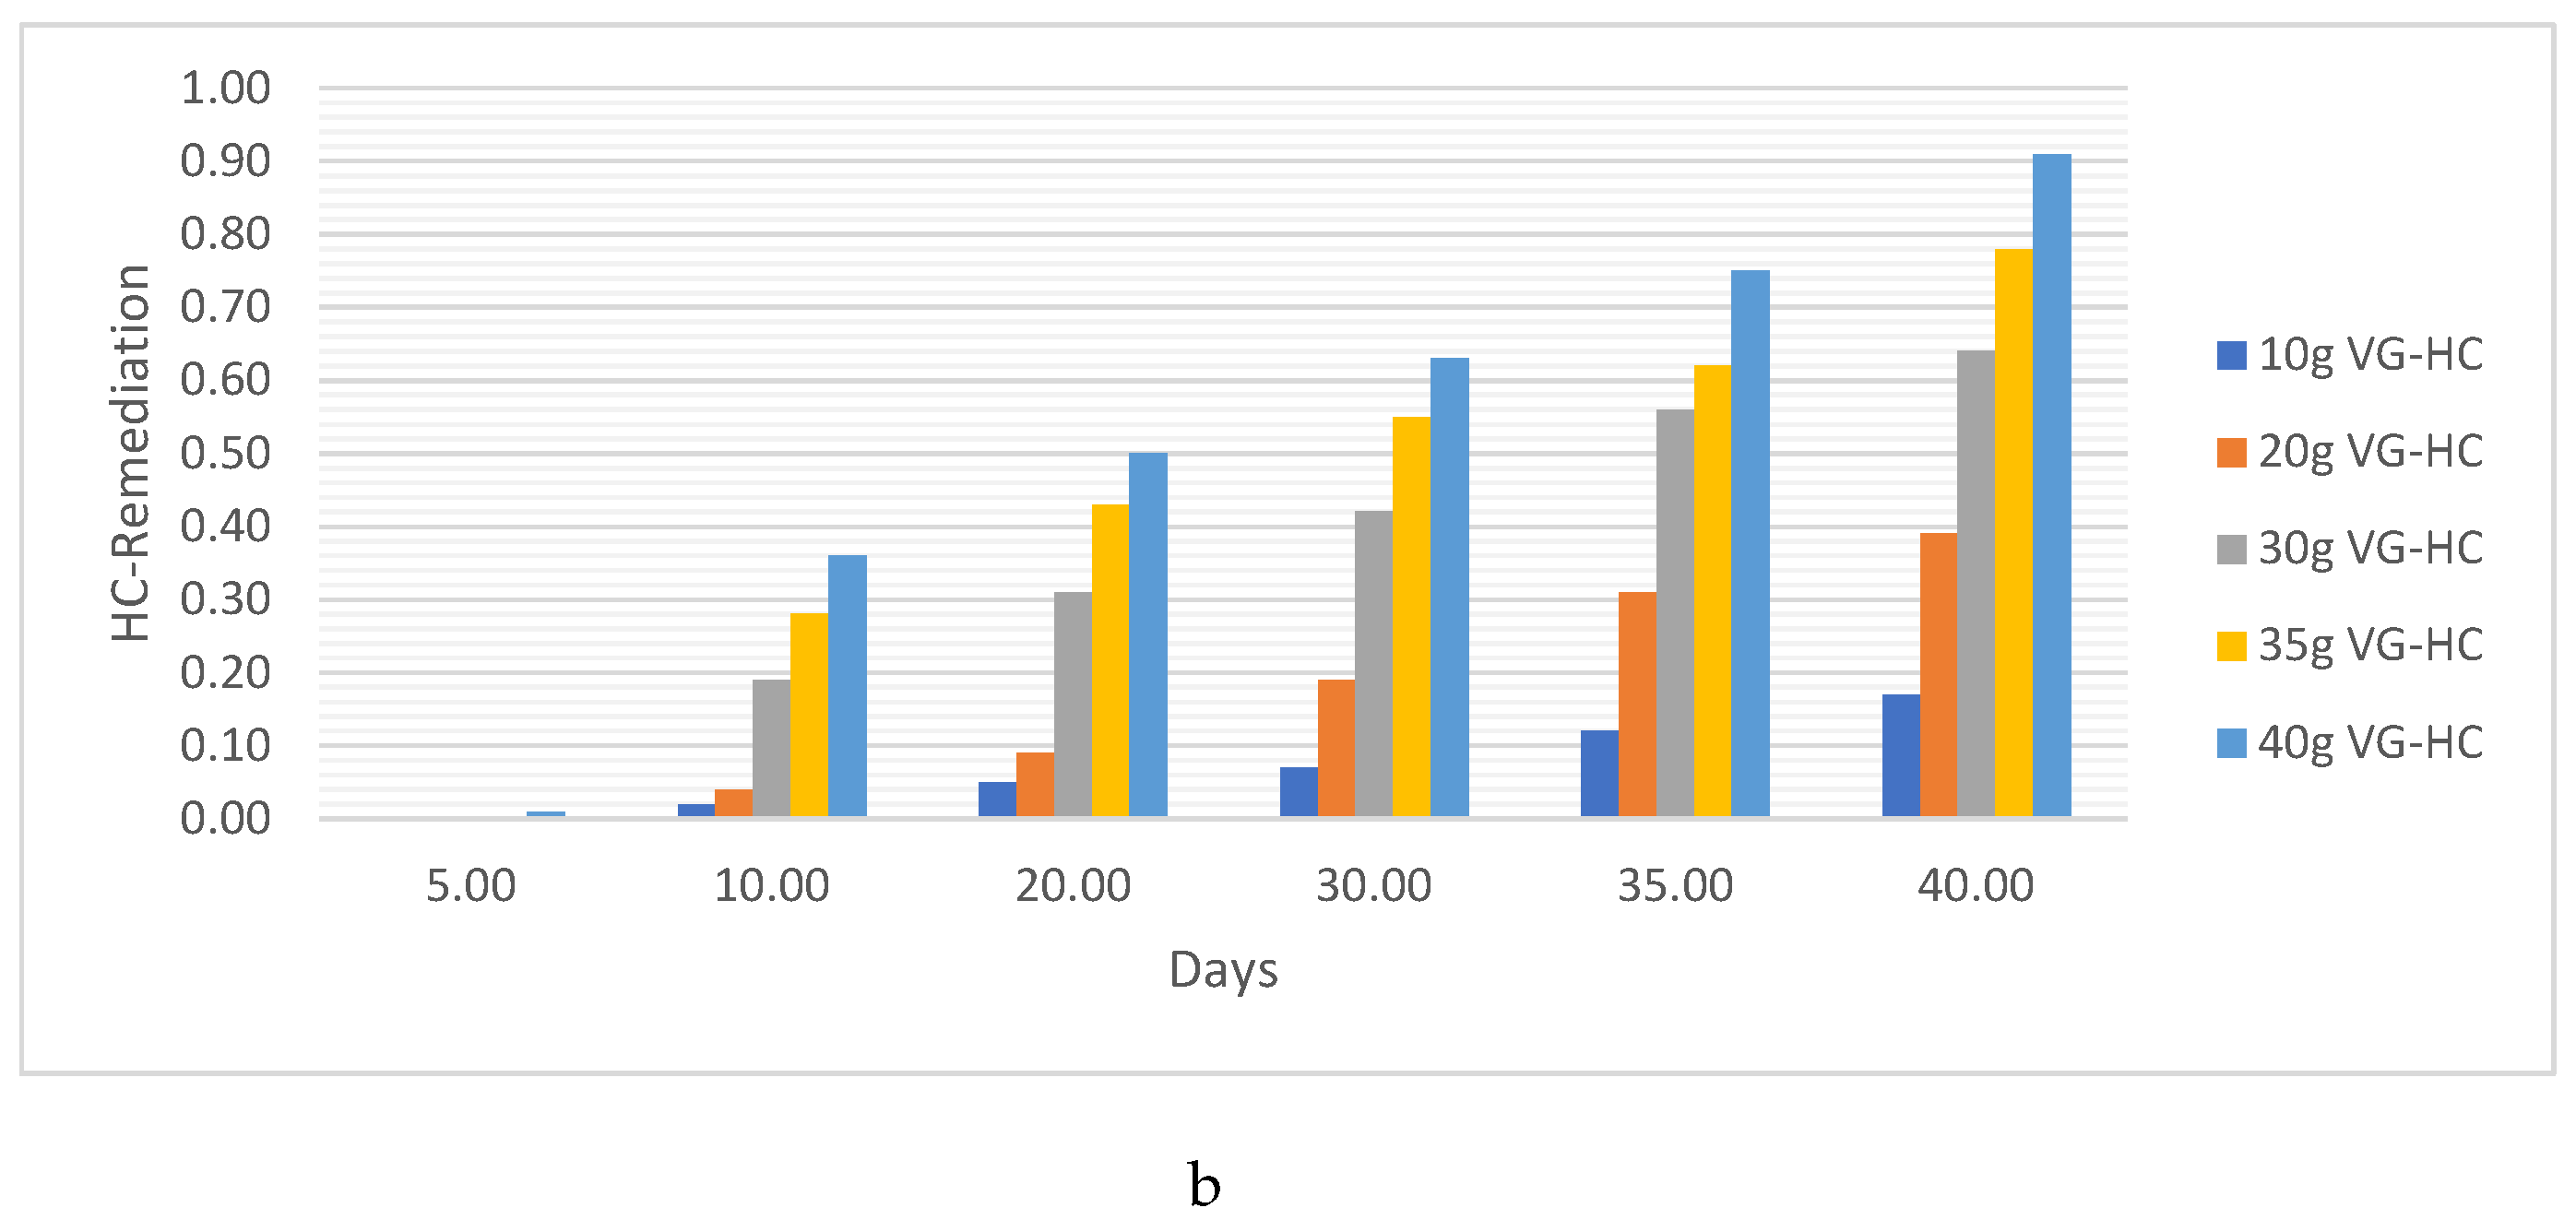
In Figure 4.13a and 4.13b, we examine the remediation of hydrocarbon content in sandy-loamy soil using Vernonia extracts of different masses over different durations. Figure 4.13a displays the hydrocarbon content remediation using Vernonia extracts of varying masses. As the mass of Vernonia extracts increases, we observe a corresponding increase in the effectiveness of hydrocarbon remediation. This suggests that higher quantities of Vernonia extracts result in more efficient removal of hydrocarbons from the soil. Figure 4.13b focuses on the remediation of hydrocarbon content over different durations. It demonstrates that as the duration of the experiment extends, the remediation of hydrocarbons becomes more pronounced. This indicates that prolonged exposure to Vernonia extracts enhances their ability to effectively remediate hydrocarbon contamination in sandy-loamy soil. These results underline the significance of both the mass of Vernonia extracts and the duration of the experiment in achieving successful hydrocarbon remediation in sandy-loamy soil..,To compare the effectiveness of different methods of preparation on the remediation action, we conducted tests using 40g of Vernonia extracts prepared through room drying, sun drying, and wet blending for both Vernonia Galamensis and Vernonia Amygdalina. Figure 4.14 illustrates the results, indicating that the wet blended extracts exhibit a higher capability for remediating hydrocarbon content in the polluted soil. Specifically, 2.11ug/ml and 2.40ug/ml of hydrocarbons were remediated using the wet blended Vernonia Galamensis and Vernonia Amygdalina extracts, respectively. These findings suggest that the wet blending method of preparation enhances the remediation efficiency of both Vernonia species, resulting in a greater reduction of hydrocarbon content in the contaminated soil.When comparing the remediation effect of room-dried extracts, it was observed that Vernonia Amygdalina exhibited a more effective remediation effect compared to Vernonia Galamensis. Specifically, the room-dried Vernonia Amygdalina extracts achieved a remediation value of 1.78ug/ml, while the same method resulted in a lower remediation value of 0.90ug/ml for Vernonia Galamensis. These results indicate that the room-dried extracts of Vernonia Amygdalina have a higher potential for remediating hydrocarbon content in the contaminated soil compared to Vernonia Galamensis. It highlights the importance of considering different Vernonia species and their specific qualities when selecting a remediation approach
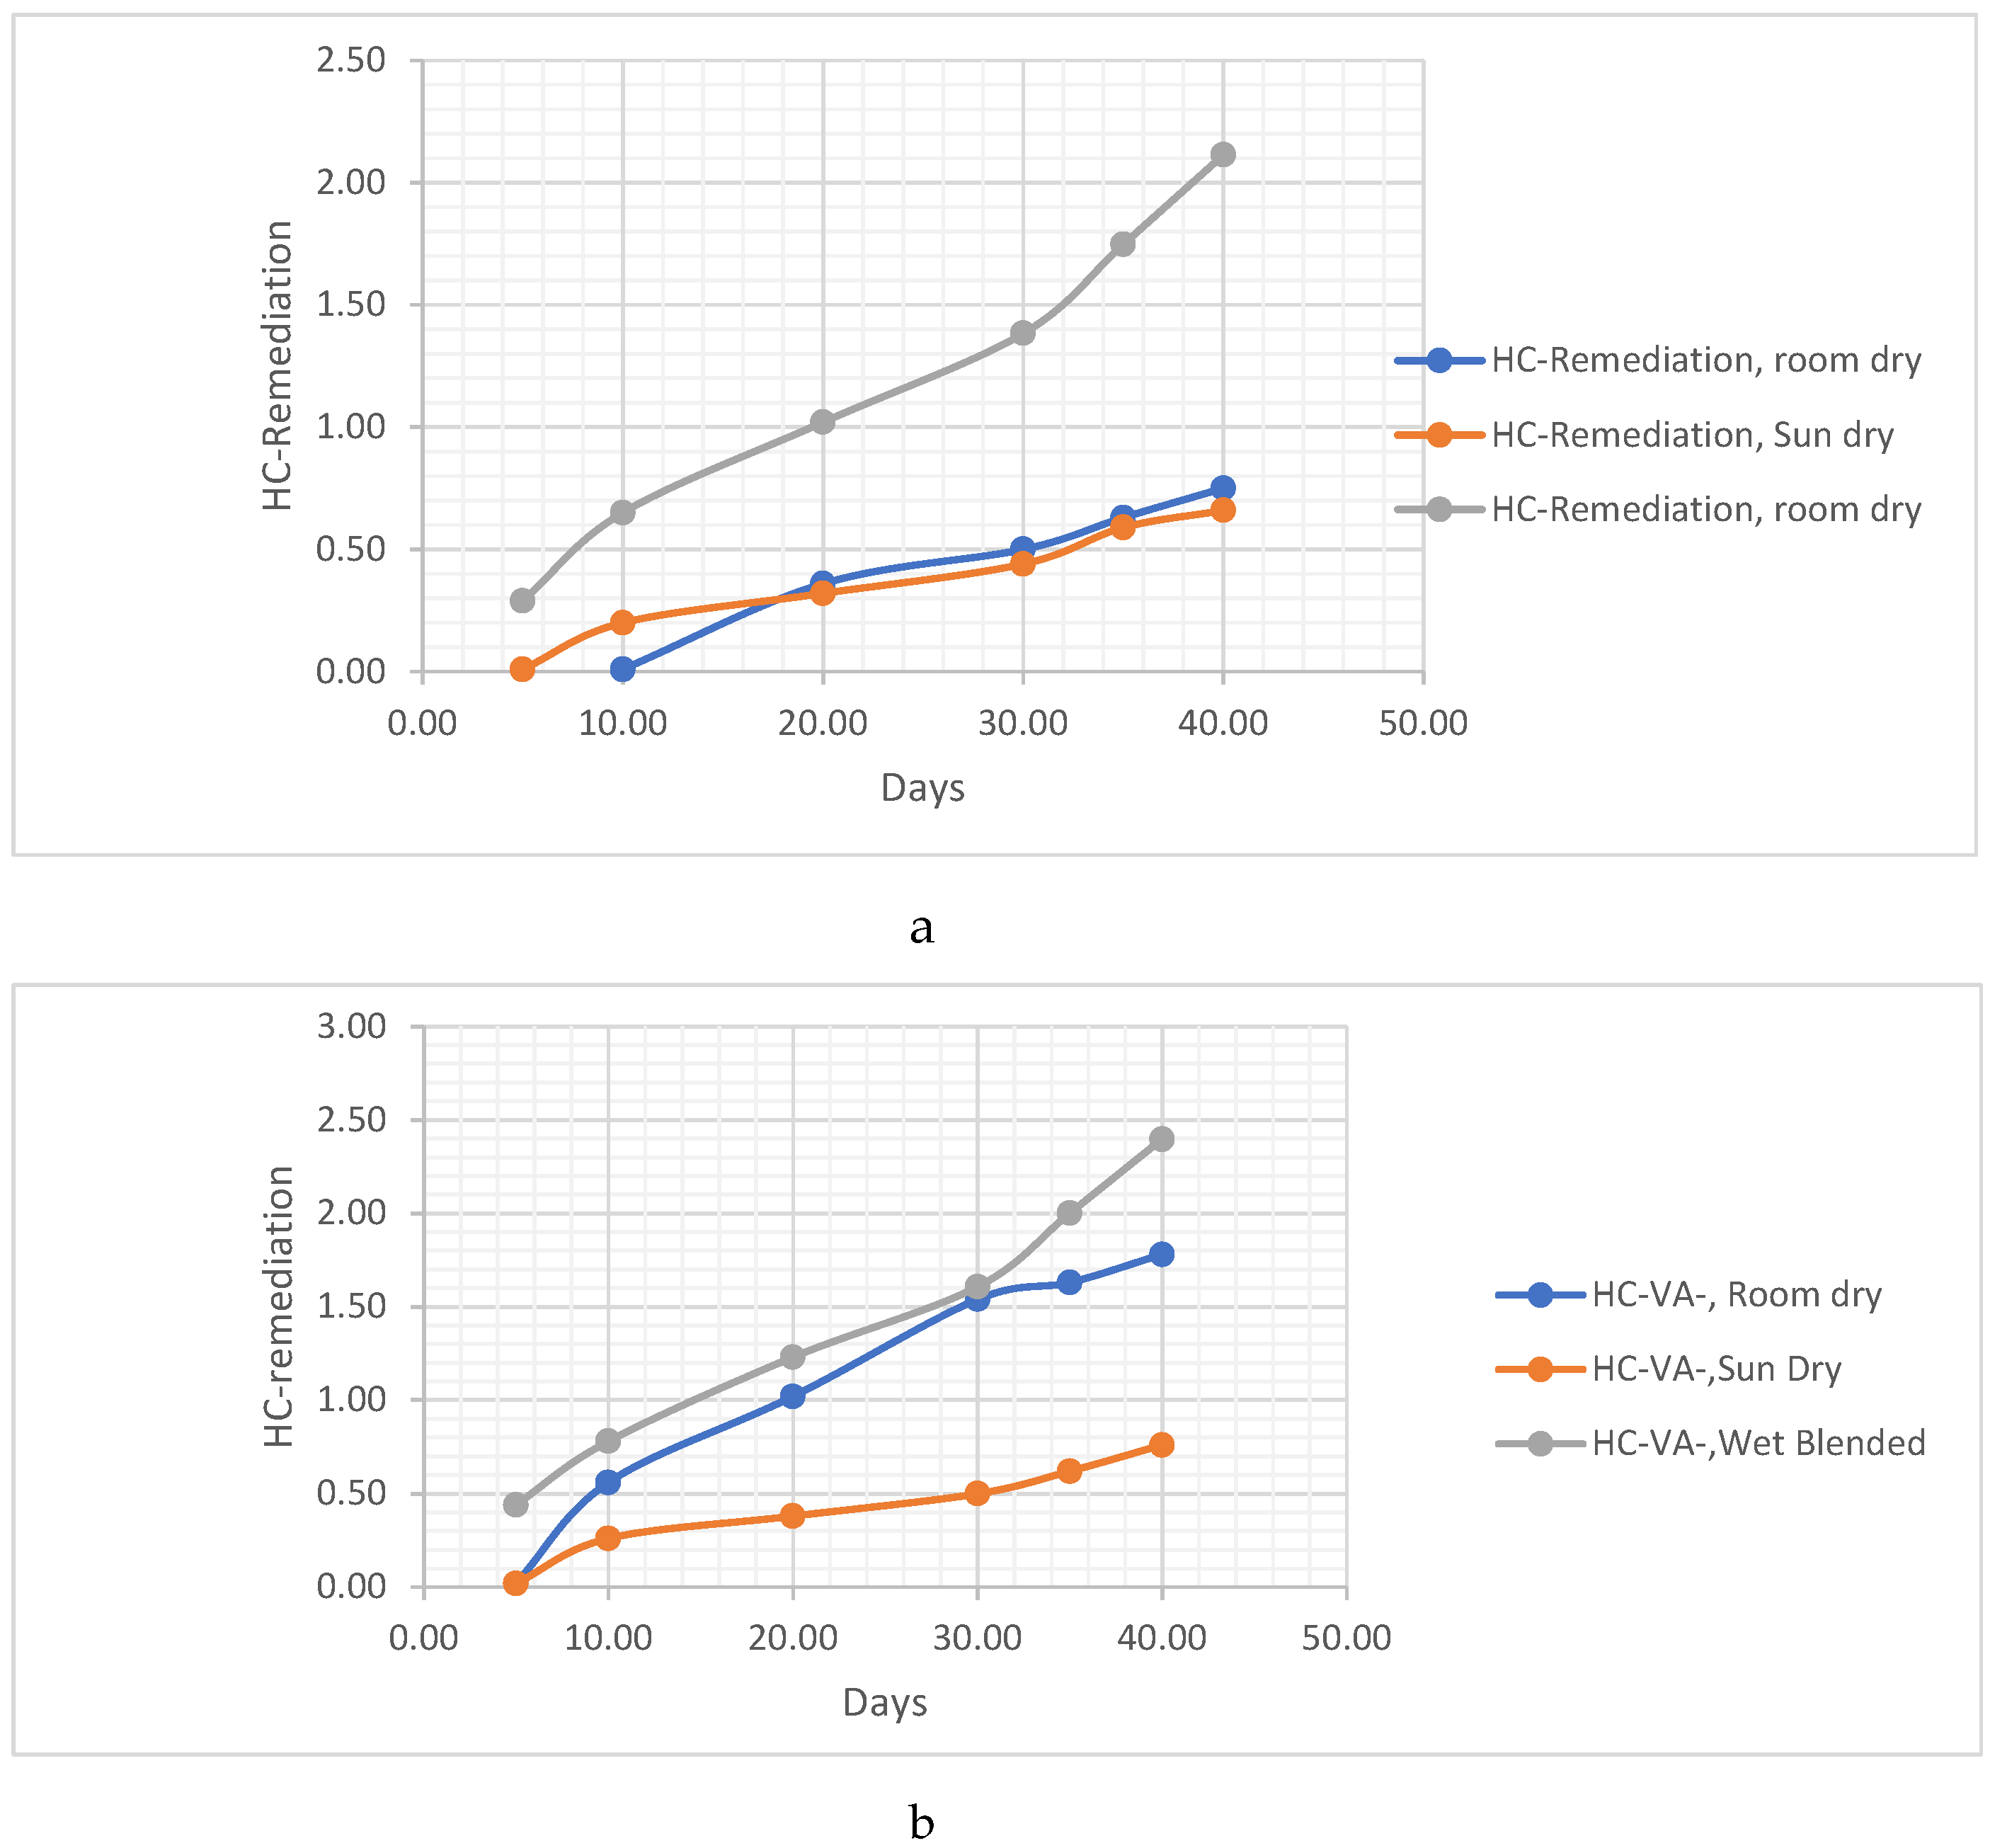
Figure 4.14a and 4.14b provide a comparison of the remediation methods for hydrocarbon content using Vernonia Galamensis and Vernonia Amygdalina in sandy-loamy soil. In Figure 4.14a, the remediation method comparison focuses on Vernonia Galamensis. The results indicate that the wet blended method exhibited the highest effectiveness in remediating hydrocarbon content in the soil. The remediation value achieved using the wet blended method for Vernonia Galamensis was 2.11ug/ml, suggesting superior remediation capabilities compared to other methods. Figure 4.14b presents the same comparison but for Vernonia Amygdalina. Here, too, the wet blended method demonstrates the highest remediation effect, with a value of 2.40ug/ml. This result further supports the notion that the wet blended method is particularly effective in remediating hydrocarbon content in sandy-loamy soil, regardless of the Vernonia species used. These findings highlight the importance of selecting the appropriate remediation method when using Vernonia Galamensis or Vernonia Amygdalina for remediating hydrocarbon contamination in sandy-loamy soil
Pb. Metal Analysis
Pb Remediating Response For Sandy-Loamy Soil.
Indeed, as the remediation activity was
progressing, the reduction of metals in the contaminated soil became evident,
leading to a shift towards neutral pH values. To gain a comprehensive
understanding of the potentiality of the mass of Vernonia extracts, it is
crucial to conduct a cross-examination of the drop in metal levels in the
contaminated soil. By analyzing the metal drop in the soil, we can assess the
effectiveness of different masses of Vernonia extracts in remediating metal
contamination. This examination will provide valuable insights into the optimal
mass of Vernonia extracts required for effective metal reduction in the
contaminated soil. Understanding the relationship between the mass of Vernonia
extracts and the drop in metal levels will contribute to determining the extent
of their potential in remediating metal-contaminated soil and further inform
remediation strategies.
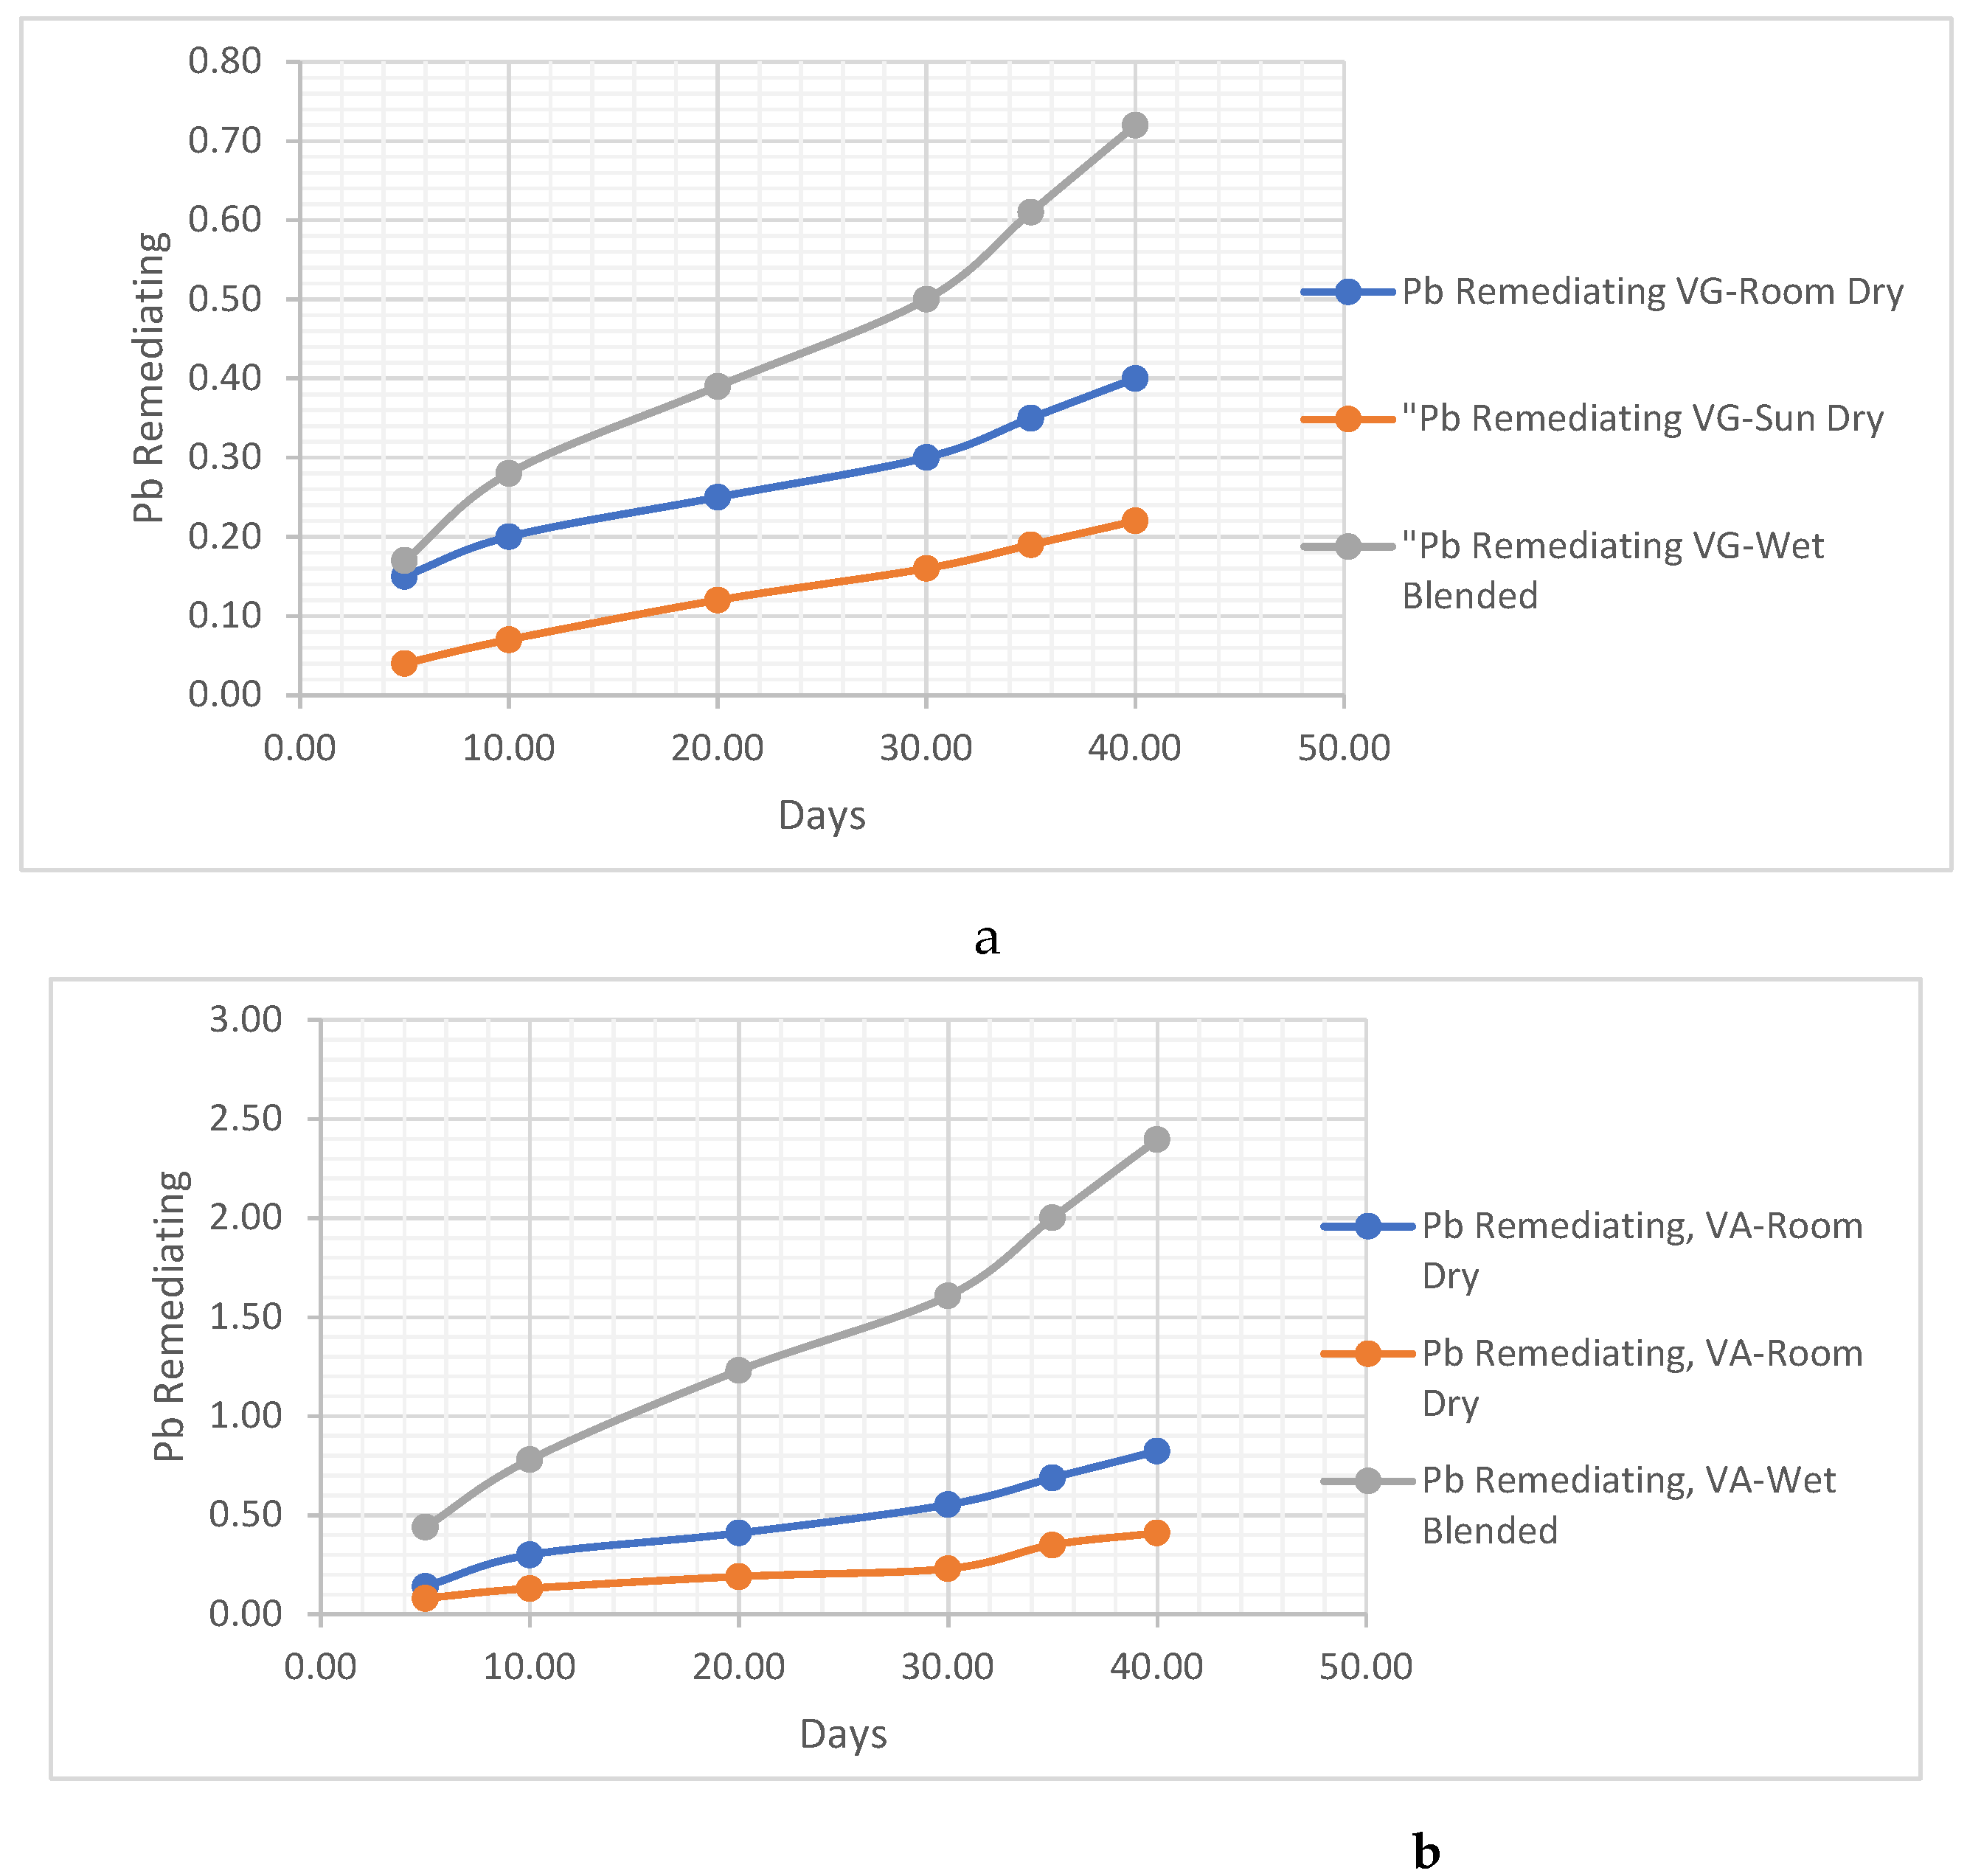
Figure 4.
15, a, b: Pb remediation method comparism using vernonia Galamensis and vernonia Amygdalina in Sandy-loamy soil.
Figure 4.
15, a, b: Pb remediation method comparism using vernonia Galamensis and vernonia Amygdalina in Sandy-loamy soil.
From Figure 4.15, it shows that the wet blended vernonia species perform more Pb remediation activity. The sun dry vernonia species has poor Pb remediating effects. This can be attributed to the inactivity of the micro-organisms and the pHytochemicals responsible for Pb remediation in that condition. Both species of vernonia leaf achieved about 0.72ug/ml of Pb remediation for Vernonia Galamensis and 0.99ug/ml for Vernonia Amygdalina.
- i. Zn Remediating Response
The Zn present in the sandy-loamy soil is also remediated and reduced. Looking at Figure 4.16, the room dry and sun-dry vernonia Galamensis gave closely related results leaving the wet blended extract to give about 0.51 ug/ml remediating effect for the vernonia Amygdalina extract, the room dry, sun dry and wet blended gives an approximate remediating values of 0.31ug/ml, 0.52ug/ml, 0.71ug/ml respectively. ultimately, the wet blended gives the best Zn remediating effect.
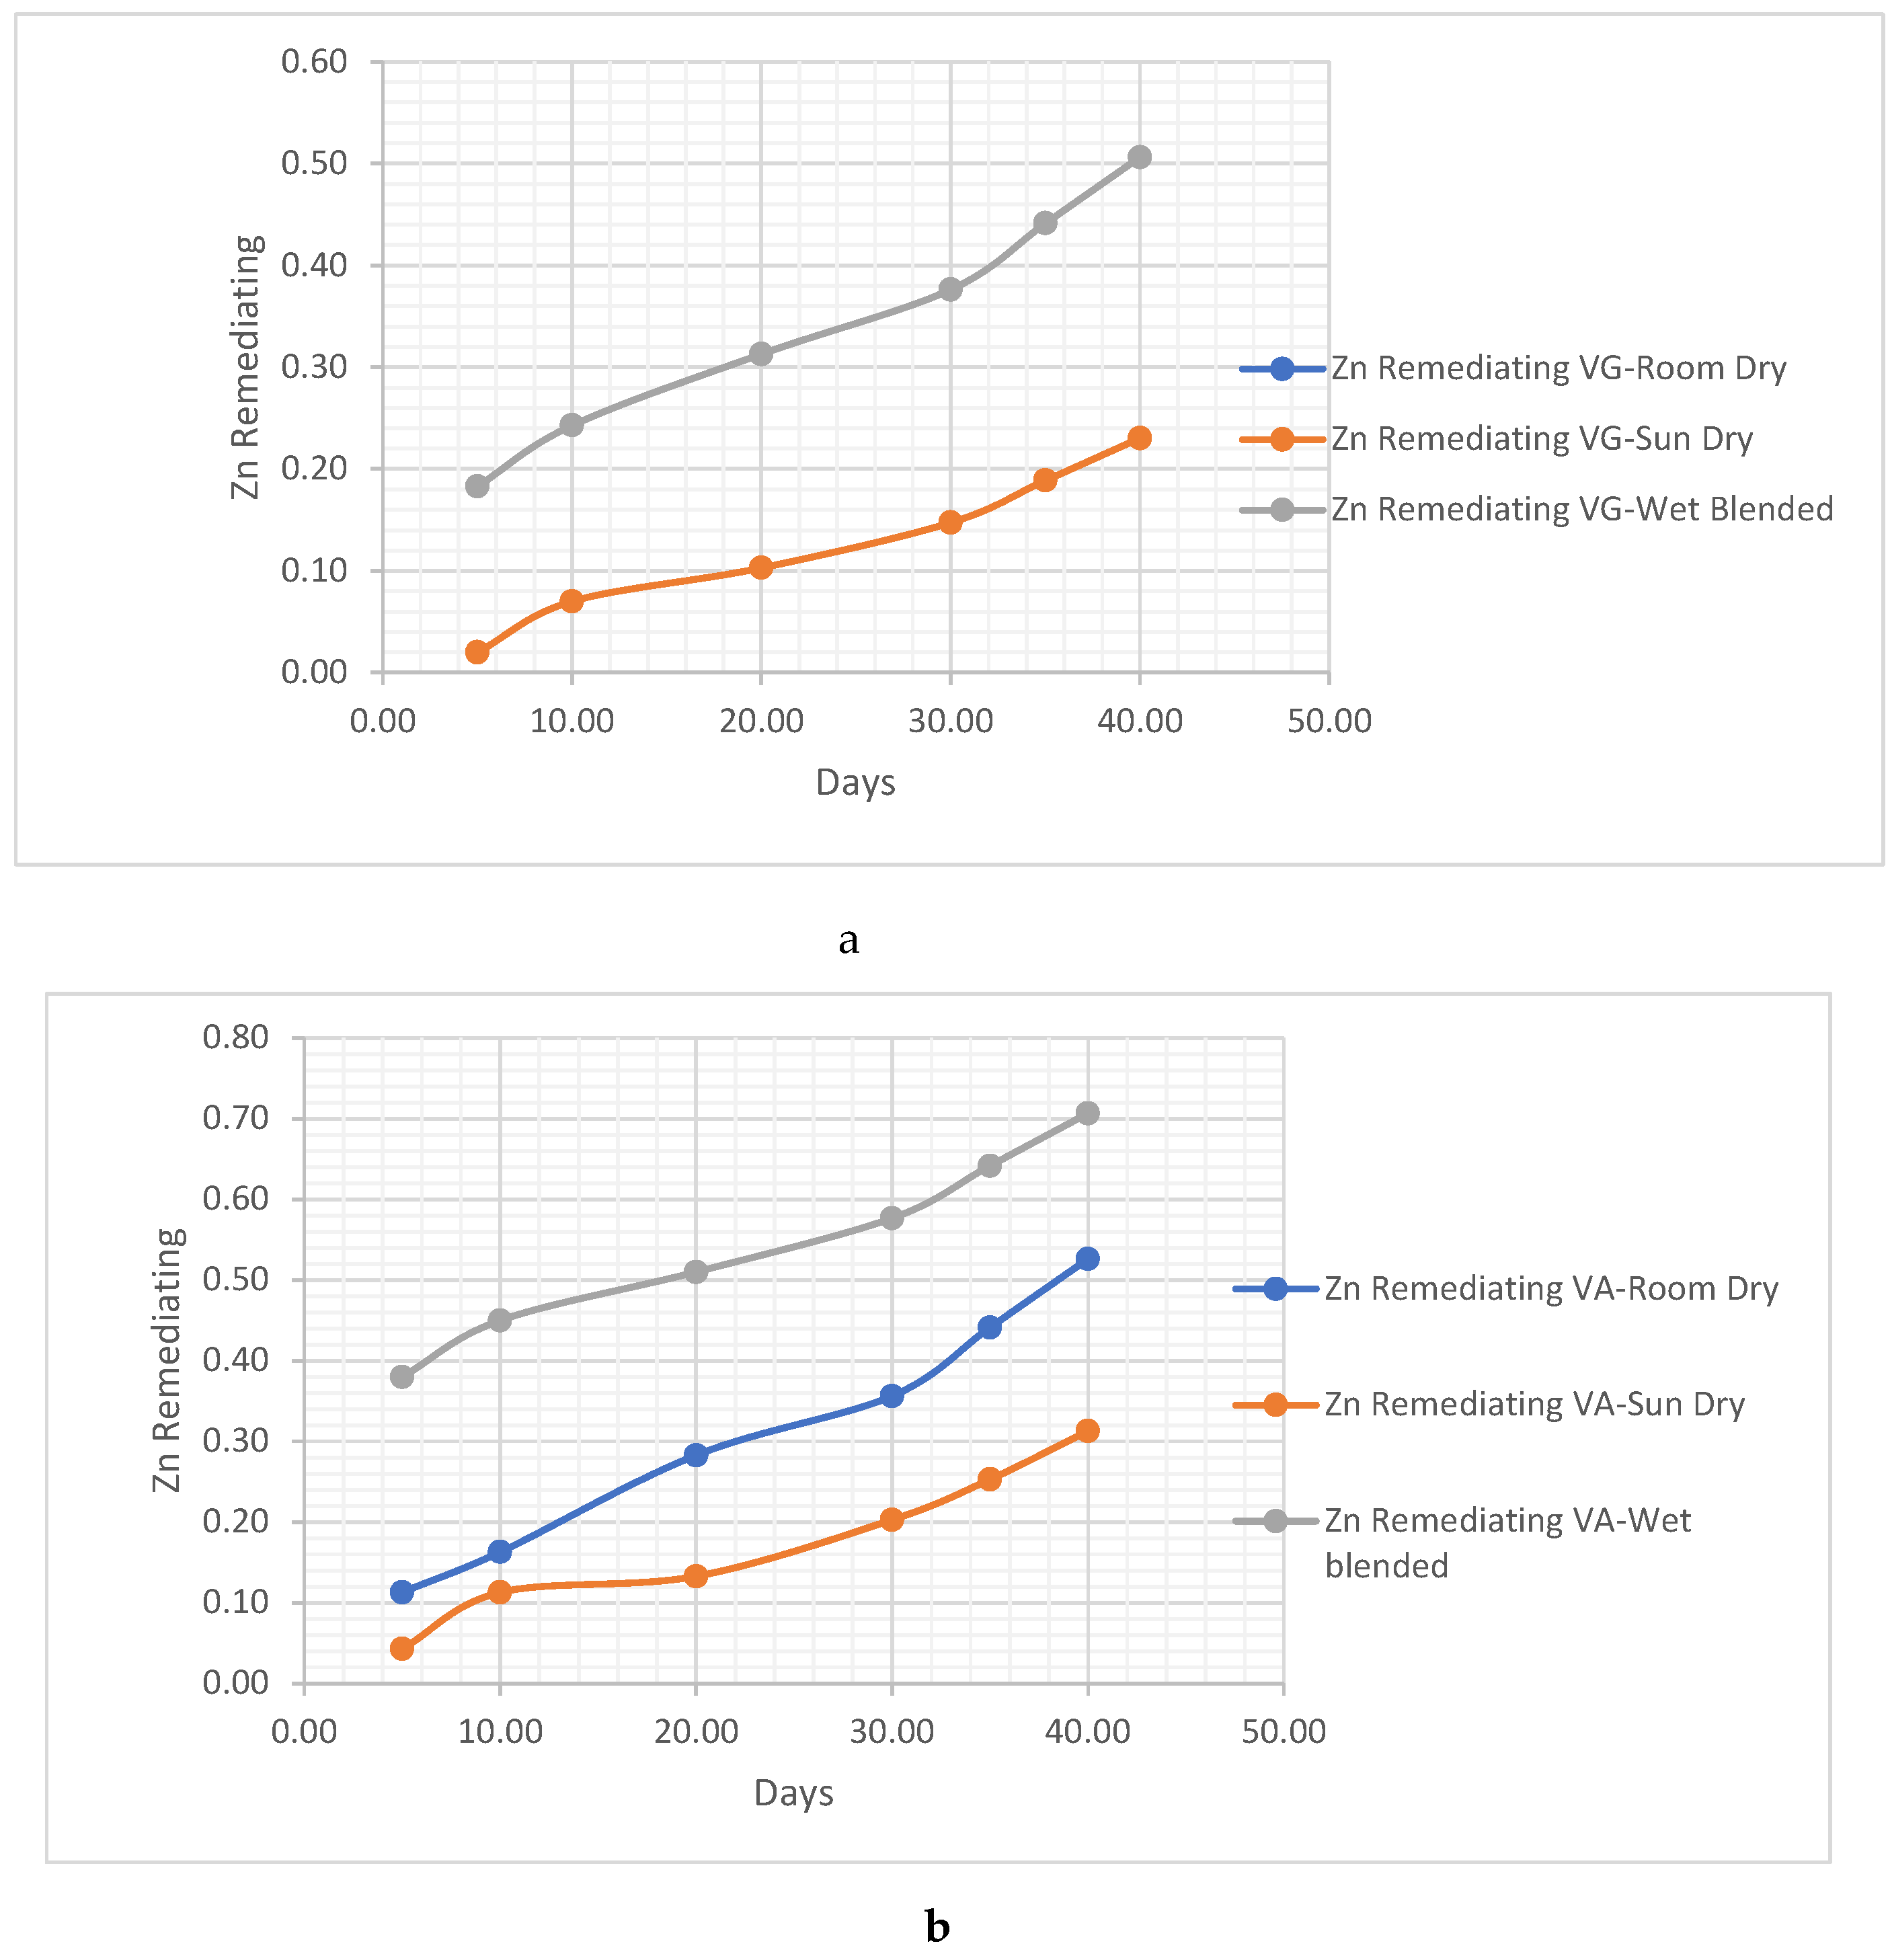
Figure 4.
16, a, b: Zn remediation method comparism using vernonia Galamensis and vernonia Amygdalina in sandy-loamy soil.
Figure 4.
16, a, b: Zn remediation method comparism using vernonia Galamensis and vernonia Amygdalina in sandy-loamy soil.
- ii. Cr remediating Response
For Chromium, the wet blended shows more Cr remediating potential compared to other methods of preparation. The Vernonia Galamensis remediates 0.67ug/ml while the vernonia Amygdalina remediates 0.68ug/ml
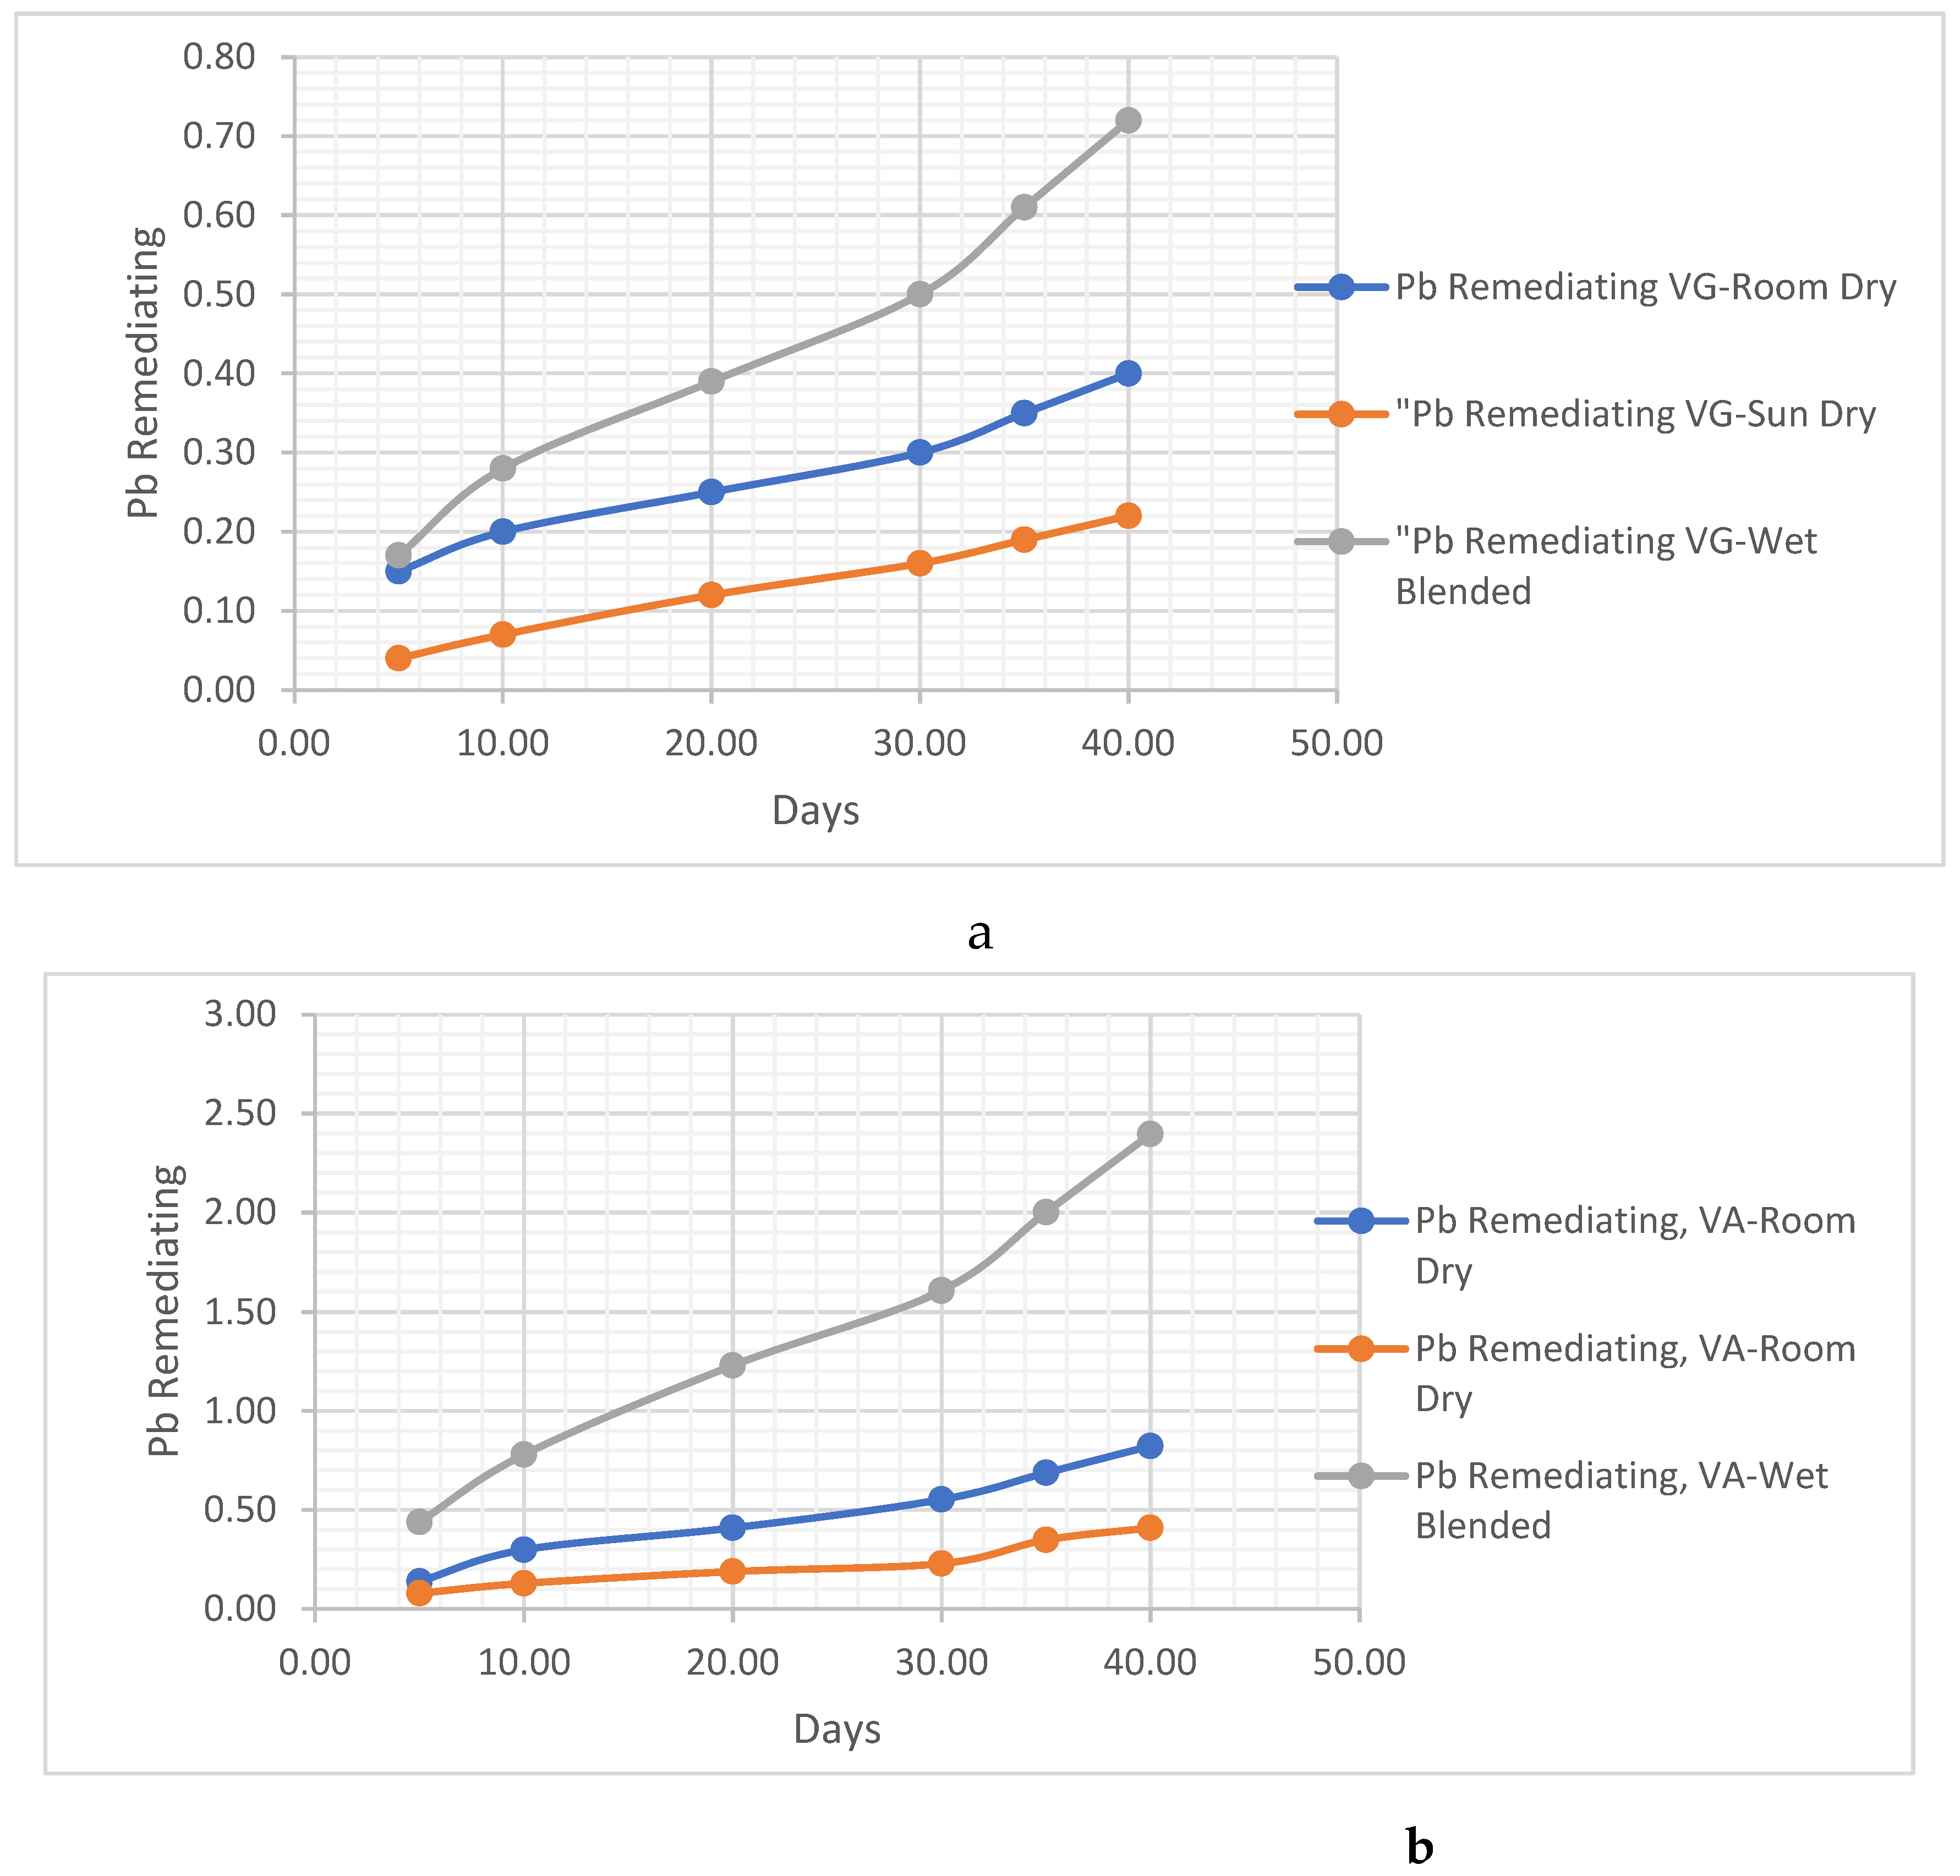
Figure 4.
17, a, b: Cr remediation method comparism using vernonia Galamensis and vernonia Amygdalina in clay soil.
Figure 4.
17, a, b: Cr remediation method comparism using vernonia Galamensis and vernonia Amygdalina in clay soil.
4.2-. Modal- Prediction Analysis
Now that we have ascertained the performance of the leaf extracts, it is customary that we try to develop a model that illustrates the individual remedial activity in the soil from the data generated. The metals and the hydrocarbon contents stands as the measurable responses from the remediation process with independent factors like the grams of vernonia species and the days taken. Since from the analysis done, the wet blended method showed more promising remediation effects. It is best we use this approach and perform the models on this methodology.
Performing a multiple regression analysis, the use of the least square method will be employed using the Minitab software.
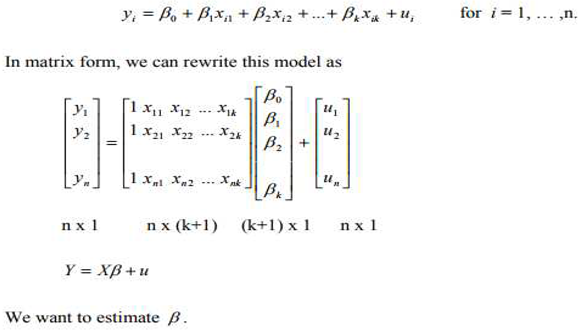
4.2.1. Model for Swamp Soil
Using the least square method explained earlier, the multiple regression for the remediation process can be explained below by using the data in Appendix ….:
(A). IN THE REGRESSION ANALYSIS FOR VERNONIA GALAMENSIS, THE EQUATION TO PREDICT THE HC (HYDROCARBON) CONCENTRATION IS AS FOLLOWS:
HC = 11.0 + 0.00416 Time + 0.00107 Mass - 1.63 * pH
The coefficient values for each predictor variable are as follows:
- Constant: 11.040
- Time: 0.0041616 with a standard error (SE) of 0.0003246
- Mass: 0.0010702 with a standard error (SE) of 0.0003751
- pH: -1.627 with a standard error (SE) of 1.359.
The T-values and P-values indicate the significance of each predictor variable:
- Time: T = 12.82, P < 0.000 (highly significant)
- Mass: T = 2.85, P = 0.008 (significant)
- pH: T = -1.20, P = 0.242 (not significant
Regression: The model includes 3 degrees of freedom (DF) and the sum of squares (SS) for regression is 0.100302. The mean sum of squares (MS) is 0.033434. The F-value is 91.04, indicating that the regression model is statistically significant. The p-value is 0.000, further supporting the significance of the regression model.
Residual Error: The residual error, which represents the variability not explained by the regression model, has 26 degrees of freedom. The sum of squares for the residual error is 0.009549, and the mean sum of squares is 0.000367.
Total: The total sum of squares is 0.109851, with a total of 29 degrees of freedom
ADDITIONAL STATISTICS:
Squared (R-Sq): The R-squared value is 91.3%, indicating that 91.3% of the variation in the HC concentration can be explained by the regression model.
Adjusted R-Squared (R-Sq(adj)): The adjusted R-squared value is 90.3%, which takes into account the number of predictor variables in the model.
These results suggest that time and mass have a significant impact on the HC concentration, while pH does not appear to be significant.
(B). In the regression analysis for Pb (lead), the equation to predict the Pb concentration is as follows:
Pb = 3.4 + 0.00773 Time + 0.00189 Mass - 0.51 * pH
The coefficient values for each predictor variable are as follows:
- Constant: 3.45
- Time: 0.0077294 with a standard error (SE) of 0.0009772
- Mass: 0.001892 with a standard error (SE) of 0.001129
- pH: -0.509 with a standard error (SE) of 4.091.
The T-values and P-values indicate the significance of each predictor variable
- Time: T = 7.91, P < 0.000 (highly significant)
- Mass: T = 1.68, P = 0.106 (not significant)
- pH: T = -0.12, P = 0.902 (not significant).
- S: The standard error of the regression (S) is 0.0576976.
- R-Squared (R-Sq): The R-squared value is 78.3%, indicating that 78.3% of the variation in the Pb concentration can be explained by the regression model.
- Adjusted R-Squared (R-Sq(adj)): The adjusted R-squared value is 75.8%, which takes into account the number of predictor variables in the model.
These results suggest that the regression model explains a significant portion of the variation in the Pb concentration, primarily influenced by the time variable.
(C ) IN THE REGRESSION ANALYSIS FOR ZN (ZINC), THE EQUATION TO PREDICT THE ZN CONCENTRATION IS AS FOLLOWS:
Zn = 10.4 + 0.00587 Time + 0.00153 Mass - 1.54 * pH.
The coefficient values for each predictor variable are as follows:
- Constant: 10.40
- Time: 0.0058693 with a standard error (SE) of 0.0004501
- Mass: 0.0015317 with a standard error (SE) of 0.0005201
- pH: -1.541 with a standard error (SE) of 1.885
The T-values and P-values indicate the significance of each predictor variable.
- Time: T = 13.04, P < 0.000 (highly significant)
- Mass: T = 2.94, P = 0.007 (significant)
- pH: T = -0.82, P = 0.421 (not significant)
These results suggest that time and mass have a significant impact on the Zn concentration, while pH does not appear to be significant.
Additional Statistics:
- S: The standard error of the regression (S) is 0.0265765.
- R-Squared (R-Sq): The R-squared value is 91.3%, indicating that 91.3% of the variation in the Zn concentration can be explained by the regression model.
- Adjusted R-Squared (R-Sq(adj)): The adjusted R-squared value is 90.3%, which takes into account the number of predictor variables in the model.
The analysis of variance (ANOVA) results for the regression analysis of Zn (zinc) are as follows
Regression: The model includes 3 degrees of freedom (DF) and the sum of squares (SS) for regression is 0.192083. The mean sum of squares (MS) is 0.064028. The F-value is 90.65, indicating that the regression model is statistically significant. The p-value is 0.000, further supporting the significance of the regression model.
Residual Error: The residual error, which represents the variability not explained by the regression model, has 26 degrees of freedom. The sum of squares for the residual error is 0.018364, and the mean sum of squares is 0.000706.
Total: The total sum of squares is 0.210447, with a total of 29 degrees of freedom.
These results suggest that the regression model is a good fit for the data and explains a significant portion of the variation in the Zn concentration.
(D). IN THE REGRESSION ANALYSIS FOR CR (CHROMIUM), THE EQUATION TO PREDICT THE CR CONCENTRATION IS AS FOLLOWS.
Cr = -7.3 + 0.00516 Time + 0.00694 Mass + 1.07 * pH
The coefficient values for each predictor variable are as follows:
- Constant: -7.31
- Time: 0.0051582 with a standard error (SE) of 0.0003631
- Mass: 0.0069393 with a standard error (SE) of 0.0004196
- pH: 1.070 with a standard error (SE) of 1.520
The T-values and P-values indicate the significance of each predictor variable:
- Time: T = 14.21, P < 0.000 (highly significant)
- Mass: T = 16.54, P < 0.000 (highly significant)
- pH: T = 0.70, P = 0.488 (not significant
These results suggest that time and mass have a highly significant impact on the Cr concentration, while pH does not appear to be significant.
Additional Statistics:
- S: The standard error of the regression (S) is 0.0214408.
- R-Squared (R-Sq): The R-squared value is 96.0%, indicating that 96.0% of the variation in the Cr concentration can be explained by the regression model.
- Adjusted R-Squared (R-Sq(adj)): The adjusted R-squared value is 95.5%, which takes into account the number of predictor variables in the model.
The analysis of variance (ANOVA) results for the regression analysis of Cr (chromium) are as follows:
Regression: The model includes 3 degrees of freedom (DF) and the sum of squares (SS) for regression is 0.284668. The mean sum of squares (MS) is 0.094889. The F-value is 206.41, indicating that the regression model is statistically significant. The p-value is 0.000, further supporting the significance of the regression model
Residual Error: The residual error, which represents the variability not explained by the regression model, has 26 degrees of freedom. The sum of squares for the residual error is 0.011952, and the mean sum of squares is 0.000460.
Total: The total sum of squares is 0.296620, with a total of 29 degrees of freedom.
These results suggest that the regression model is a very good fit for the data and explains a significant portion of the variation in the cr concentration.
(A). IN THE REGRESSION ANALYSIS FOR VERNONIA AMYGDALINA (HC), THE EQUATION TO PREDICT THE HC CONCENTRATION IS AS FOLLOWS.
HC = 3.10 + 0.00589 Time_1 + 0.00339 Mass_1 - 0.460 * pH_1
The coefficient values for each predictor variable are as follows:
- Constant: 3.0969
- Time_1: 0.0058911 with a standard error (SE) of 0.0005299
- Mass_1: 0.0033893 with a standard error (SE) of 0.0007112
- pH_1: -0.4596 with a standard error (SE) of 0.1432
The T-values and P-values indicate the significance of each predictor variable:
- Time_1: T = 11.12, P < 0.000 (highly significant)
- Mass_1: T = 4.77, P < 0.000 (highly significant)
- pH_1: T = -3.21, P = 0.004 (significant)
These results suggest that time and mass have a highly significant impact on the HC concentration, while pH_1 also has a significant impact.
Additional Statistics:
- S: The standard error of the regression (S) is 0.0166601.
- R-Squared (R-Sq): The R-squared value is 93.4%, indicating that 93.4% of the variation in the HC concentration can be explained by the regression model.
- Adjusted R-Squared (R-Sq(adj)): The adjusted R-squared value is 92.7%, which takes into account the number of predictor variables in the model.
These results suggest that the regression model is a good fit for the data and explains a significant portion of the variation in the HC concentration, primarily influenced by the time, mass, and pH_1 variables.
THE ANALYSIS OF VARIANCE (ANOVA) RESULTS FOR THE REGRESSION ANALYSIS OF VERNONIA AMYGDALINA (HC) ARE AS FOLLOWS.
Regression: The model includes 3 degrees of freedom (DF) and the sum of squares (SS) for regression is 0.102634. The mean sum of squares (MS) is 0.034211. The F-value is 123.26, indicating that the regression model is statistically significant. The p-value is 0.000, further supporting the significance of the regression model.
Residual Error: The residual error, which represents the variability not explained by the regression model, has 26 degrees of freedom. The sum of squares for the residual error is 0.007217, and the mean sum of squares is 0.000278.
Total: The total sum of squares is 0.109851, with a total of 29 degrees of freedom.
These results suggest that the regression model is a good fit for the data and explains a significant portion of the variation in the HC concentration.
(B). IN THE REGRESSION ANALYSIS FOR PB_1 (LEAD), THE EQUATION TO PREDICT THE PB_1 CONCENTRATION IS AS FOLLOW.
Pb_1 = 0.73 + 0.00881 Time_1 + 0.00204 Mass_1 - 0.104 * pH_1
The coefficient values for each predictor variable are as follows:
- Constant: 0.726
- Time_1: 0.008814 with a standard error (SE) of 0.001413
- Mass_1: 0.002037 with a standard error (SE) of 0.001897
- pH_1: -0.1037 with a standard error (SE) of 0.3820
The T-values and P-values indicate the significance of each predictor variable:
- Time_1: T = 6.24, P < 0.000 (highly significant)
- Mass_1: T = 1.07, P = 0.293 (not significant)
- pH_1: T = -0.27, P = 0.788 (not significant)
These results suggest that time has a significant impact on the Pb_1 concentration, while mass and pH_1 do not appear to be significant.
Additional Statistics:
- S: The standard error of the regression (S) is 0.0444367.
- R-Squared (R-Sq): The R-squared value is 87.6%, indicating that 87.6% of the variation in the Pb_1 concentration can be explained by the regression model.
- Adjusted R-Squared (R-Sq(adj)): The adjusted R-squared value is 86.1%, which takes into account the number of predictor variables in the model.
THE ANALYSIS OF VARIANCE (ANOVA) RESULTS FOR THE REGRESSION ANALYSIS ARE AS FOLLOWS.
Regression: The model includes 3 degrees of freedom (DF) and the sum of squares (SS) for regression is 0.36149. The mean sum of squares (MS) is 0.12050. The F-value is 61.02, indicating that the regression model is statistically significant. The p-value is 0.000, further supporting the significance of the regression model.
Residual Error: The residual error, which represents the variability not explained by the regression model, has 26 degrees of freedom. The sum of squares for the residual error is 0.05134, and the mean sum of squares is 0.00197.
Total: The total sum of squares is 0.41283, with a total of 29 degrees of freedom.
These results suggest that the regression model is a decent fit for the data and explains a significant portion of the variation in the Pb_1 concentration, primarily influenced by the time variable.
(C) In our research on revolutionizing soil remediation, specifically exploring the frontiers of bioremediation using Vernonia galamensis and Vernonia amydalina spices in hydrocarbon-contaminated soil, we conducted a regression analysis to evaluate the performance factors. We found that the presence of zinc (Zn_1) in the soil can be predicted using the following equation: Zn_1 = 3.78 + 0.00823 Time_1 + 0.00530 Mass_1 - 0.573 pH_1.
Analyzing the predictors, we observed that time (Time_1), mass (Mass_1), and pH (pH_1) all play significant roles. Specifically, time had a positive coefficient of 0.0082314, indicating that as time increases, the presence of zinc in the soil also tends to increase. Similarly, mass showed a positive coefficient of 0.005304, implying that higher mass contributes to higher zinc levels. On the other hand, pH had a negative coefficient of -0.5733, suggesting that higher pH levels may lead to a decrease in zinc concentration.
The analysis further revealed that the regression model accounted for approximately 93.8% of the variability in zinc levels (R-Sq = 93.8%), indicating a strong relationship between the predictors and the response variable. This relationship was also supported by the adjusted R-Squared value of 93.1%. Moreover, the standard error (S) of the model was found to be 0.0239661, indicating the accuracy of the predictions.
“In our analysis of variance, we evaluated the significance of the regression model in predicting zinc levels in hydrocarbon-contaminated soil using Vernonia galamensis and Vernonia amydalina spices. The results indicate a highly significant relationship between the predictors and the response variable.
The regression model demonstrated a significant overall impact, as evidenced by the F-statistic of 131.74 with a corresponding p-value of 0.000. This indicates that the model as a whole is effective in explaining the variability in zinc concentrations.
Furthermore, we assessed the variability within the model by examining the residual error. The sum of squares (SS) for the residual error was found to be 0.014934, with degrees of freedom (DF) of 26. This translates to a mean square (MS) value of 0.000574, representing the average variation in zinc levels not accounted for by the predictors
Considering both the regression and residual error, the total sum of squares (SS) was calculated to be 0.241937, with a total of 29 degrees of freedom (DF). This provides an overview of the overall variation in zinc concentrations within the hydrocarbon-contaminate
These findings underscore the significance of the regression model in accurately predicting zinc levels, highlighting the potential of Vernonia galamensis and Vernonia amydalina spices in revolutionizing soil remediation. The low p-value and high F-statistic further emphasize the strength and reliability of the model in explaining the variations observed in the data
(D) We conducted a regression analysis to examine the relationship between chromium levels (Cr_1) and the factors of time (Time_1), mass (Mass_1), and pH (pH_1) in the context of our research on revolutionizing soil remediation. The regression equation derived from our analysis is as follows: Cr_1 = -2.36 + 0.00428 Time_1 + 0.00556 Mass_1 + 0.345 pH_1.
Analyzing the predictors, we found that each factor plays a significant role in influencing chromium levels. Time exhibited a positive coefficient of 0.0042798, indicating that an increase in time can lead to higher chromium concentrations. Similarly, mass showed a positive coefficient of 0.0055637, suggesting that higher mass contributes to increased chromium levels. pH also had a positive coefficient of 0.3454, indicating that higher pH values are associated with higher chromium concentrations.
The regression model accounted for approximately 97.7% of the variability observed in chromium levels (R-Sq = 97.7%). This indicates a strong relationship between the predictors and the response variable. The adjusted R-Squared value of 97.5% further supports the model’s effectiveness in explaining the variations in chromium concentrations.
The standard error (S) of the model was found to be 0.0169970, which represents the accuracy of the predictions made by the model.
In our analysis of variance, we examined the significance of the regression model in predicting chromium levels (Cr_1) based on the factors of time (Time_1), mass (Mass_1), and pH (pH_1) in the context of soil remediation. The results revealed a highly significant relationship between the predictors and the response variable.
The regression model showed a significant overall impact, with a calculated F-statistic of 373.21 and a corresponding p-value of 0.000. This indicates that the model as a whole is effective in explaining the variability observed in chromium concentrations.
To further assess the variability within the model, we examined the residual error. The sum of squares (SS) for the residual error was found to be 0.00751, with 26 degrees of freedom (DF). This leads to a mean square (MS) value of 0.00029, representing the average variation in chromium levels not accounted for by the predictors.
Considering both the regression and residual error, the total sum of squares (SS) was calculated to be 0.33097, with a total of 29 degrees of freedom (DF). This provides an overview of the overall variation in chromium concentrations within the context of the soil remediation study.
These findings emphasize the significant role of the regression model in accurately predicting chromium levels, highlighting the potential of the time, mass, and pH factors in revolutionizing soil remediation. The low p-value and high F-statistic further underscore the strength and reliability of the model in explaining the observed variations in the data.
(E). IN OUR STUDY ON CLAY SOIL,
we conducted a multiple regression analysis using Minitab software to model the relationship between the presence of a specific component (HC) and the factors of time, mass, and pH. The regression equation derived from our analysis is as follows: HC = -6.59 + 0.00538 Time + 0.00455 Mass + 0.970 pH.
Analyzing the predictors, we observed that each factor plays a significant role in influencing the presence of the component. Time exhibited a positive coefficient of 0.005381, indicating that an increase in time can lead to higher levels of the specific component. Similarly, mass showed a positive coefficient of 0.004554, suggesting that higher mass contributes to increased levels of the component. pH also had a positive coefficient of 0.970, indicating that higher pH values are associated with higher levels of the component.
The regression model demonstrated statistical significance, as evidenced by the t-values and p-values for each predictor. The constant term had a t-value of -3.30 and a corresponding p-value of 0.003. The coefficients for time and mass had t-values of 4.90 and 2.73, respectively, with p-values of 0.000 and 0.011. These results indicate that each predictor significantly contributes to the presence of the component in the clay soil.
In the analysis of the Vernonia Galamensis model for clay soil, we further evaluated the significance of the pH factor and the overall model performance using additional statistical measures. Here’s the paraphrased information you provided:
“The pH factor showed a coefficient of 0.9696 with a standard error of 0.3016. The corresponding t-value was 3.22, and the associated p-value was 0.003. These results indicate that pH has a significant positive effect on the presence of the specific component in the clay soil when considering the Vernonia Galamensis model.
The regression model accounted for approximately 93.5% of the variability observed in the component levels (R-Sq = 93.5%), indicating a strong relationship between the predictors and the response variable. The adjusted R-Squared value of 92.7% further supports the model’s effectiveness in explaining the observed variations.
In the analysis of variance
we assessed the significance of the regression model as a whole. The model yielded an F-statistic of 124.36 and a p-value of 0.000, indicating a highly significant impact. This suggests that the model is effective in explaining the variability in the component levels.
Examining the variability within the model, the residual error showed a sum of squares (SS) of 0.04649, with 26 degrees of freedom (DF), resulting in a mean square (MS) value of 0.00179. This represents the average variation in component levels not accounted for by the predictors.
Considering both the regression and residual error, the total sum of squares (SS) was calculated to be 0.71364, with a total of 29 degrees of freedom (DF). This provides an overview of the overall variation in component levels within the context of the Vernonia Galamensis model for clay soil.
These findings highlight the significance of pH in influencing the presence of the specific component in clay soil. The high R-Squared values and low p-value in both the regression analysis and analysis of variance further support the reliability and effectiveness of the model, underscoring the potential of Vernonia Galamensis in revolutionizing soil treatment for clay soil.”
IN OUR REGRESSION ANALYSIS FOR LEAD (PB) LEVELS,
we examined the relationship between Pb and the factors of time, mass, and pH. The regression equation derived from our analysis is Pb = 2.96 + 0.00782 Time + 0.00324 Mass - 0.443 pH.
Analyzing the predictors, we found that each factor plays a significant role in influencing Pb levels. Time exhibited a positive coefficient of 0.0078210, indicating that as time increases, Pb levels tend to increase. Similarly, mass showed a positive coefficient of 0.003239, suggesting that higher mass contributes to higher Pb levels. On the other hand, pH had a negative coefficient of -0.4431, indicating that higher pH values are associated with lower Pb levels.
The regression model accounted for approximately 91.9% of the variability observed in Pb levels (R-Sq = 91.9%). This indicates a strong relationship between the predictors and the response variable. The adjusted R-Squared value of 91.0% further supports the model’s effectiveness in explaining the variations in Pb concentrations.
The standard error (S) of the model was found to be 0.0268981, which represents the accuracy of the predictions made by the model.
IN THE ANALYSIS OF VARIANCE,
We assessed the significance of the regression model in predicting lead (Pb) levels based on the factors of time, mass, and pH. Here’s a paraphrased version of the information you provided:
The analysis of variance revealed that the regression model as a whole has a significant impact on Pb levels, as indicated by the F-statistic of 98.37 and a corresponding p-value of 0.000. This suggests that the model is effective in explaining the variability observed in Pb concentrations.
Examining the variability within the model, the residual error had a sum of squares (SS) of 0.018811, with 26 degrees of freedom (DF). This resulted in a mean square (MS) value of 0.000724, representing the average variation in Pb levels not accounted for by the predictors.
Considering both the regression and residual error, the total sum of squares (SS) was calculated to be 0.232324, with a total of 29 degrees of freedom (DF). This provides an overview of the overall variation in Pb levels within the context of the regression model.
These findings further confirm the significant impact of the regression model in explaining the variability in Pb levels. The low p-value and high F-statistic indicate the reliability and effectiveness of the model, emphasizing the potential of time, mass, and pH as predictors for Pb concentrations.
IN OUR REGRESSION ANALYSIS FOR ZINC (ZN) LEVELS
We examined the relationship between Zn and the factors of time, mass, and pH. The regression equation derived from our analysis is Zn = -2.67 + 0.00210 Time + 0.00169 Mass + 0.396 pH.
Analyzing the predictors, we found that each factor plays a significant role in influencing Zn levels. Time exhibited a positive coefficient of 0.0020999, indicating that as time increases, Zn levels tend to increase. Similarly, mass showed a positive coefficient of 0.0016856, suggesting that higher mass contributes to higher Zn levels. Additionally, pH had a positive coefficient of 0.39558, indicating that higher pH values are also associated with higher Zn levels.
The regression model accounted for approximately 98.1% of the variability observed in Zn levels (R-Sq = 98.1%). This indicates a strong relationship between the predictors and the response variable. The adjusted R-Squared value of 97.9% further supports the model’s effectiveness in explaining the variations in Zn concentrations.
The standard error (S) of the model was found to be 0.00879440, which represents the accuracy of the predictions made by the model.
IN THE ANALYSIS OF VARIANCE,
We assessed the significance of the regression model in predicting zinc (Zn) levels based on the factors of time, mass, and pH. Here’s a paraphrased version of the information you provided:
The analysis of variance revealed that the regression model as a whole has a highly significant impact on Zn levels, as indicated by the F-statistic of 445.67 and a corresponding p-value of 0.000. This suggests that the model is highly effective in explaining the variability observed in Zn concentrations.
Examining the variability within the model, the residual error had a sum of squares (SS) of 0.002011, with 26 degrees of freedom (DF). This resulted in a mean square (MS) value of 0.000077, representing the average variation in Zn levels not accounted for by the predictors.
Considering both the regression and residual error, the total sum of squares (SS) was calculated to be 0.105417, with a total of 29 degrees of freedom (DF). This provides an overview of the overall variation in Zn levels within the context of the regression model.
These findings further confirm the highly significant impact of the regression model in explaining the variability in Zn levels. The low p-value and high F-statistic indicate the reliability and effectiveness of the model, emphasizing the potential of time, mass, and pH as predictors for Zn concentrations.
IN THE REGRESSION ANALYSIS OF CR (CONTAMINANT REMOVAL) VERSUS TIME, MASS, AND PH, WE OBTAINED THE FOLLOWING RESULTS.
The regression equation is: Cr = 1.71 + 0.00830 Time + 0.00608 Mass - 0.271 * pH
The predictors, coefficients (Coef), standard errors (SE Coef), t-values (T), and p-values (P) are as follows.
- Constant: 1.713, SE Coef: 1.689, T: 1.01, P: 0.320
- Time: 0.0082985, SE Coef: 0.0009276, T: 8.95, P: 0.000
- Mass: 0.006083, SE Coef: 0.001410, T: 4.31, P: 0.000
- pH: -0.2708, SE Coef: 0.2548, T: -1.06, P: 0.298
We also calculated the standard deviation (S) as 0.0357295, indicating the variability in the data. The coefficient of determination (R-Sq) is 91.4%, suggesting that 91.4% of the variation in Cr can be explained by the predictors. The adjusted R-Square (R-Sq(adj)) is 90.4%, which accounts for the degrees of freedom in the model.
We conducted an Analysis of Variance (ANOVA) to assess the significance of the regression model in explaining the variation in Cr (Contaminant Removal). Here are the results:
REGRESSION:
- ● Degrees of Freedom (DF): 3
- ● Sum of Squares (SS): 0.35398
- ● Mean Square (MS): 0.11799
- ● F-value: 92.43
- ● p-value: 0.000
Residual Error
- ● Degrees of Freedom (DF): 26
- ● SS: 0.03319
- ● MS: 0.00128
Total:
- ● Degrees of Freedom (DF): 29
- ● SS: 0.38717
The ANOVA indicates that the regression model is highly significant, with a p-value of 0.000. This suggests that the predictors (Time, Mass, pH) collectively have a strong influence on the variation in Cr. The Residual Error represents the unexplained variation in the data, while the Total SS represents the total variation observed.
LET’S DIVE INTO THE VERNONIA AMYGDALINA MODELLING!
Specifically, we’ll focus on the regression analysis of HC_1 (Hydrocarbon Concentration) versus Time_1, Mass_1, and pH_1. Here’s what we discovered:
The regression equation we derived is: HC_1 = -13.8 + 0.00243 Time_1 - 0.00250 Mass_1 + 2.06 * pH_1
Now, let’s take a closer look at the predictors, their coefficients (Coef), standard errors (SE Coef), t-values (T), and p-values (P):
- Constant: -13.772, SE Coef: 1.484, T: -9.28, P: 0.000
- Time_1: 0.0024258, SE Coef: 0.0009678, T: 2.51, P: 0.019
- Mass_1: -0.002502, SE Coef: 0.001491, T: -1.68, P: 0.105
- pH_1: 2.0617, SE Coef: 0.2248, T: 9.17, P: 0.000
These coefficients reveal the impact of each predictor on HC_1. The constant term provides an initial starting point. Time_1 has a positive coefficient, indicating that it contributes positively to HC_1. Mass_1, on the other hand, has a negative coefficient, suggesting a decreasing effect on HC_1. pH_1 displays a significant positive coefficient, indicating a strong positive influence on HC_1.
In summary, our analysis suggests that Time_1, Mass_1, and pH_1 play crucial roles in explaining the variation in HC_1. Time_1 and pH_1 have a significant impact, while Mass_1 exhibits a relatively weaker influence.
let’s explore the statistical analysis of the Vernonia Amygdalina Modelling. We obtained the following important metrics:
- Standard Deviation (S): 0.0345595
- Coefficient of Determination (R-Sq): 96.8%
- Adjusted R-Square (R-Sq(adj)): 96.5%
These metrics provide insights into the accuracy and goodness-of-fit of the model. The high R-Sq value suggests that 96.8% of the variance in HC_1 can be explained by the predictors (Time_1, Mass_1, pH_1). The adjusted R-Sq value takes into account the degrees of freedom in the model and provides an accurate measure of the model’s explanatory power.
Additionally, we performed an Analysis of Variance (ANOVA) to assess the significance of the regression model:
Regression
- ● Degrees of Freedom (DF): 3
- ● Sum of Squares (SS): 0.95150
- ● Mean Square (MS): 0.31717
- ● F-value: 265.55
- ● p-value: 0.000
Residual Error:
- ● Degrees of Freedom (DF): 26
- ● SS: 0.03105
- ● MS: 0.00119
Total:
- ● Degrees of Freedom (DF): 29
- ● SS: 0.98255
The ANOVA results indicate that the regression model is highly significant, with a p-value of 0.000. In other words, the predictors collectively have a significant impact on HC_1. The Residual Error represents the unexplained variation in the data, while the Total SS represents the total variation observed.
Overall, these findings provide strong evidence for the effectiveness of the Vernonia Amygdalina Modelling in predicting HC_1 and understanding the factors influencing it.
THE REGRESSION ANALYSIS OF PB_1 (LEAD CONCENTRATION) VERSUS TIME_1, MASS_1, AND PH_1
Here are the key findings:
The regression equation we derived is: Pb_1 = 3.96 + 0.00844 Time_1 + 0.00589 Mass_1 - 0.598 * pH_1
Now, let’s examine the predictors, their coefficients (Coef), standard errors (SE Coef), t-values (T), and p-values (P):
- Constant: 3.962, SE Coef: 1.697, T: 2.33, P: 0.028
- Time_1: 0.008439, SE Coef: 0.001107, T: 7.62, P: 0.000
- Mass_1: 0.005892, SE Coef: 0.001705, T: 3.46, P: 0.002
- pH_1: -0.5983, SE Coef: 0.2571, T: -2.33, P: 0.028
These coefficients represent the impact of each predictor on Pb_1. The constant term provides the starting point, while Time_1, Mass_1, and pH_1 show their respective influences on Pb_1. Time_1 has a positive coefficient, suggesting a positive relationship with Pb_1. Mass_1 also exhibits a positive coefficient, indicating its positive influence. Interestingly, pH_1 displays a negative coefficient, implying a negative association with Pb_1.
Now, let’s explore the statistical metrics of the model:
- Standard Deviation (S): 0.0395213
- Coefficient of Determination (R-Sq): 84.2%
- Adjusted R-Square (R-Sq(adj)): 82.4%
The R-Sq value of 84.2% indicates that 84.2% of the variation in Pb_1 can be explained by the predictors. The R-Sq(adj) accounts for the degrees of freedom in the model and provides a more accurate measure of the model’s explanatory power.
In summary, the regression analysis provides insights into the relationship between Pb_1 and the predictors (Time_1, Mass_1, pH_1). The model’s statistical metrics and the significance of the individual predictors contribute to a better understanding of Pb_1 and its influencing factors.
IN ORDER TO ASSESS THE SIGNIFICANCE OF THE REGRESSION MODEL FOR PB_1, AN ANALYSIS OF VARIANCE (ANOVA) WAS CONDUCTED. HERE ARE THE RESULTS:
REGRESSION:
- ● Degrees of Freedom (DF): 3
- ● Sum of Squares (SS): 0.216307
- ● Mean Square (MS): 0.072102
- ● F-value: 46.16
- ● p-value: 0.000
Residual Error:
- ● Degrees of Freedom (DF): 26
- ● SS: 0.040610
- ● MS: 0.001562
Total:
- ● Degrees of Freedom (DF): 29
- ● SS: 0.256917
The ANOVA results indicate that the regression model is highly significant, with a p-value of 0.000. This suggests that the predictors (Time_1, Mass_1, pH_1) collectively have a significant impact on Pb_1. The Residual Error represents the unexplained variation in the data, while the Total SS represents the total variation observed.
Overall, these findings provide strong evidence for the effectiveness of the regression model in explaining the variation in Pb_1 and emphasizing the significance of the predictors.
Regression Analysis: Zn_1 and its relationship with Time_1, Mass_1, and pH_1
The regression equation shows that Zn_1 (Zinc) can be estimated based on the values of Time_1, Mass_1, and pH_1. The equation is given by Zn_1 = -1.63 + 0.00253 Time_1 + 0.00189 Mass_1 + 0.244 pH_1.
Predictor Coefficients:
The coefficients for each predictor variable are as follows:
- Time_1: 0.0025315
- Mass_1: 0.0018940
- pH_1: 0.24446
These coefficients represent the change in Zn_1 associated with a one-unit increase in each predictor, while holding other predictors constant.
Statistical Measures:
- Standard Error (SE) represents the precision of the coefficient estimates.
- T-value indicates the significance of the coefficient, where larger absolute values suggest more significant relationships.
- P-value shows the probability of observing a coefficient as extreme as the one obtained, assuming the null hypothesis (no relationship) is true.
Additional information:
- The constant term in the regression equation is -1.6346, indicating the estimated Zn_1 value when all predictors are zero.
- The Standard Error (S) of the regression is 0.00870020, which represents the average distance between the observed and predicted values.
- R-squared (R-Sq) is 98.1%, indicating that the predictor variables explain 98.1% of the variability in Zn_1.
- R-squared (adjusted) (R-Sq(adj)) is 97.8%, which considers the number of predictor variables and adjusts R-squared accordingly.
The Analysis of Variance (ANOVA) shows the breakdown of the sources of variation in the data:
1. Regression:
- Degrees of Freedom (DF): 3
- um of Squares (SS): 0.099379
- Mean Square (MS): 0.033126
- F-value: 437.64
- P-value: 0.000
The regression analysis indicates that the predictor variables have a significant impact on the response variable.
1. Residual Error:
- Degrees of Freedom (DF): 26
- Sum of Squares (SS): 0.001968
- Mean Square (MS): 0.000076
The residual error represents the unexplained variation in the data that is not accounted for by the regression model.
1. Total:
- Degrees of Freedom (DF): 29
- Sum of Squares (SS): 0.101347
The total variation in the data is the sum of the variation explained by the regression model and the residual error.
The ANOVA results indicate a highly significant relationship between the predictor variables and the response variable. The variation explained by the regression model is much larger than the unexplained variation.
1. Regression Analysis: Cr_1 and its relationship with Time_1, Mass_1, and pH_1:
The regression equation shows that Cr_1 (Chromium) can be estimated based on the values of Time_1, Mass_1, and pH_1. The equation is given by Cr_1 = 1.80 + 0.00685 Time_1 + 0.00940 Mass_1 - 0.279 pH_1.
Predictor Coefficients:
The coefficients for each predictor variable are as follows:
- Time_1: 0.0068464
- Mass_1: 0.009396
- pH_1: -0.2788
These coefficients represent the change in Cr_1 associated with a one-unit increase in each predictor, while holding other predictors constant.
Statistical Measures:
- Standard Error (SE) represents the precision of the coefficient estimates.
- T-value indicates the significance of the coefficient, where larger absolute values suggest more significant relationships.
- P-value shows the probability of observing a coefficient as extreme as the one obtained, assuming the null hypothesis (no relationship) is true.
Additional information:
- The constant term in the regression equation is 1.801, indicating the estimated Cr_1 value when all predictors are zero.
- The Standard Error (S) of the regression is 0.0278546, which represents the average distance between the observed and predicted values.
- R-squared (R-Sq) is 94.9%, indicating that the predictor variables explain 94.9% of the variability in Cr_1.
- R-squared (adjusted) (R-Sq(adj)) is 94.3%, which considers the number of predictor variables and adjusts R-squared accordingly.
These results suggest a strong relationship between the predictor variables and the response variable. However, it’s important to note that the coefficient for pH_1 is not statistically significant at the conventional level (P = 0.136). Further investigation may be needed to determine the significance of this variable.
The Analysis of Variance (ANOVA) table shows the breakdown of the sources of variation in the data:
Regression:
- Degrees of Freedom (DF): 3
- Sum of Squares (SS): 0.37409
- Mean Square (MS): 0.12470
- F-value: 160.72
- P-value: 0.000
The regression analysis indicates that the predictor variables have a highly significant impact on the response variable.
Residual Error:
- Degrees of Freedom (DF): 26
- Sum of Squares (SS): 0.02017
- Mean Square (MS): 0.00078
The residual error represents the unexplained variation in the data that is not accounted for by the regression model.
Total:
- Degrees of Freedom (DF): 29
- Sum of Squares (SS): 0.39426
The total variation in the data is the sum of the variation explained by the regression model and the residual error.
The ANOVA results indicate a highly significant relationship between the predictor variables and the response variable. The variation explained by the regression model is much larger than the unexplained variation.
PROCEED WITH THE ANALYSIS FOR THE SANDY-LOAMY SOIL AND THE VERNONIA GALAMENSIS MODEL
Vernonia Galamensis Modelling.
a. Regression Analysis: HC (Hydrocarbon) versus Time, Mass, and pH:
The regression equation for the Sandy-Loamy Soil and Vernonia Galamensis model is as follows:
HC = -126 - 0.0207 Time - 0.0157 Mass + 18.6 pH
This equation represents the relationship between the Hydrocarbon concentration (HC) and the factors Time, Mass, and pH.
The coefficients in the equation show the impact of each factor on the Hydrocarbon concentration. A negative coefficient indicates that as the corresponding factor increases, the Hydrocarbon concentration decreases, while a positive coefficient indicates the opposite.
Using the least squares method, this regression equation was derived to best fit the data and predict the Hydrocarbon concentration based on the given factors.
Based on the information provided, here’s a paraphrased version of the analysis for the Vernonia Galamensis model on Sandy-Loamy Soil:
Regression Coefficients:
- Constant: -125.51 (P = 0.003)
- Time: -0.02073 (P = 0.127)
- Mass: -0.01570 (P = 0.247)
- pH: 18.619 (P = 0.004)
These coefficients represent the impact of each predictor variable (Time, Mass, and pH) on the Hydrocarbon concentration (HC).
Statistical Measures:
- Standard Error (S): 0.328763
- R-squared (R-Sq): 62.3%
- Adjusted R-squared (R-Sq(adj)): 57.9%
These measures indicate the goodness of fit and the explanatory power of the model. The R-squared value suggests that 62.3% of the variability in HC can be explained by the predictor variables.
Analysis of Variance:
Regression:
- ● Degrees of Freedom (DF): 3
- ● Sum of Squares (SS): 4.6396
- ● Mean Square (MS): 1.5465
- ● F-value: 14.31 (P = 0.000)
Residual Error:
- ● Degrees of Freedom (DF): 26
- ● Sum of Squares (SS): 2.8102
- ● Mean Square (MS): 0.1081
Total:
- ● Degrees of Freedom (DF): 29
- ● Sum of Squares (SS): 7.4498
The ANOVA table indicates that the regression model is statistically significant, with a significant F-value (P = 0.000). This implies that the predictors collectively have a significant impact on the variation in HC.
Overall, the Vernonia Galamensis model on Sandy-Loamy Soil shows a moderate fit to the data, with pH being the most significant predictor. Further analysis or experimentation may be needed to improve the model’s performance.
THE REGRESSION EQUATION THAT DESCRIBES THE RELATIONSHIP BETWEEN PB (LEAD) AND THE VARIABLES TIME, MASS, AND PH IS AS FOLLOWS.
Lead (Pb) = -37.7 - 0.00290 Time + 0.00340 Mass + 5.56 * pH
Now, let’s take a look at the predictor coefficients and their statistical significance:
The constant coefficient is -37.681, indicating the baseline value of Pb when all other variables are zero. It has a standard error (SE) of 6.988 and a statistically significant T-value of -5.39 (p-value of 0.000).
The coefficient for Time is -0.002902, suggesting that as Time increases, there is a slight decrease in Pb concentration. However, this coefficient is not statistically significant, with a T-value of -1.23 (p-value of 0.229).
The coefficient for Mass is 0.003397, indicating that as Mass increases, there is a slight increase in Pb concentration. However, like Time, this coefficient is not statistically significant, with a T-value of 1.43 (p-value of 0.165).
The coefficient for pH is 5.562, suggesting that as pH increases, there is a significant increase in Pb concentration. This coefficient has a SE of 1.042 and a statistically significant T-value of 5.34 (p-value of 0.000)
THE OVERALL GOODNESS OF FIT OF THE REGRESSION MODEL IS ASSESSED THROUGH THE FOLLOWING METRICS:
The standard deviation (S) of the residuals is 0.0589214, indicating the average difference between the predicted and actual Pb values..
The R-squared value (R-Sq) is 93.3%, which means that 93.3% of the variability in Pb can be explained by the variables Time, Mass, and pH in the regression model.
The adjusted R-squared value (R-Sq(adj)) is 92.5%, taking into account the number of predictors in the model.
The ANOVA table provides information about the variance and significance of the regression model:
Source: This column indicates the source of the variation in the analysis.
DF (Degrees of Freedom): This column represents the degrees of freedom associated with each source of variation.
- SS (Sum of Squares): This column indicates the sum of squares for each source of variation.
MS (Mean Square): This column represents the mean square, which is the sum of squares divided by the degrees of freedom.
- F (F-value): This column shows the F-value, which is a ratio of the mean squares between regression and residual error. It measures the significance of the regression model.
- P (p-value): This column provides the p-value associated with the F-value, indicating the significance level of the regression model.
Based on the ANOVA table:
Regression: The regression model has 3 degrees of freedom (DF) and accounts for a significant amount of variance in the data. The sum of squares (SS) for regression is 1.25980, and the mean square (MS) is 0.41993. The F-value is 120.96, with a very low p-value of 0.000, suggesting that the regression model is statistically significant.
Residual Error: The residual error represents the unexplained variance in the data after considering the regression model. It has 26 degrees of freedom and a sum of squares (SS) of 0.09026. The mean square (MS) for residual error is 0.00347.
Total: The total sum of squares (SS) is 1.35007, representing the total variance in the data.
The ANOVA indicates that the regression model significantly explains the variability in the data, as evidenced by the high F-value and low p-value. This suggests that the predictors (Time, Mass, and pH) have a significant impact on the Pb concentration.
The regression equation that describes the relationship between Zn (Zinc) and the variables Time, Mass, and pH is as follows:
Zinc (Zn) = -23.3 - 0.00135 Time + 0.00122 Mass + 3.45 * pH
Now, let’s delve into the predictor coefficients and their statistical significance:
The constant coefficient is -23.321, representing the baseline value of Zn when all other variables are zero. It has a standard error (SE) of 1.407 and a highly statistically significant T-value of -16.57 (p-value of 0.000).
The coefficient for Time is -0.0013451, indicating that as Time increases, there is a slight decrease in Zn concentration. This coefficient is statistically significant, with a T-value of -2.83 (p-value of 0.009).
The coefficient for Mass is 0.0012178, suggesting that as Mass increases, there is a slight increase in Zn concentration. This coefficient is also statistically significant, with a T-value of 2.54 (p-value of 0.017).
The coefficient for pH is 3.4524, indicating that as pH increases, there is a significant increase in Zn concentration. This coefficient has a SE of 0.2098 and a highly statistically significant T-value of 16.46 (p-value of 0.000).
The goodness of fit of the regression model is assessed through the following metrics:
The standard deviation (S) of the residuals is 0.0118667, indicating the average difference between the predicted and actual Zn values.
The R-squared value (R-Sq) is 99.2%, suggesting that 99.2% of the variability in Zn can be explained by the variables Time, Mass, and pH in the regression model.
The adjusted R-squared value (R-Sq(adj)) is 99.1%, taking into account the number of predictors in the model.
Based on these findings, it appears that Time, Mass, and pH are significant predictors of Zn concentration..
The ANOVA table provides information about the variance and significance of the regression model.
- Source: This column indicates the source of the variation in the analysis.
- DF (Degrees of Freedom): This column represents the degrees of freedom associated with each source of variation.
- SS (Sum of Squares): This column indicates the sum of squares for each source of variation.
- MS (Mean Square): This column represents the mean square, which is the sum of squares divided by the degrees of freedom.
- F (F-value): This column shows the F-value, which is a ratio of the mean squares between regression and residual error. It measures the significance of the regression model.
- P (p-value): This column provides the p-value associated with the F-value, indicating the significance level of the regression model.
Based on the ANOVA results
Regression: The regression model has 3 degrees of freedom (DF) and accounts for a significant amount of variance in the data. The sum of squares (SS) for regression is 0.45649, and the mean square (MS) is 0.15216. The F-value is 1080.55, with a very low p-value of 0.000, suggesting that the regression model is highly statistically significant.
Residual Error: The residual error represents the unexplained variance in the data after considering the regression model. It has 26 degrees of freedom and a sum of squares (SS) of 0.00366. The mean square (MS) for residual error is 0.00014.
Total: The total sum of squares (SS) is 0.46015, representing the total variance in the data.
The ANOVA indicates that the regression model significantly explains the variability in the data, as evidenced by the high F-value and low p-value. This suggests that the predictors (Time, Mass, and pH) have a strong and significant impact on the Zn concentration.
The regression equation that describes the relationship between Cr (Chromium) and the variables Time, Mass, and pH is as follows:
Chromium (Cr) = -18.6 + 0.00396 Time + 0.00195 Mass + 2.76 * pH
Now, let’s take a look at the predictor coefficients and their statistical significance:
The constant coefficient is -18.648, indicating the baseline value of Cr when all other variables are zero. It has a standard error (SE) of 1.941 and a highly statistically significant T-value of -9.61 (p-value of 0.000).
The coefficient for Time is 0.0039635, suggesting that as Time increases, there is a slight increase in Cr concentration. This coefficient is statistically significant, with a T-value of 6.05 (p-value of 0.000).
The coefficient for Mass is 0.0019489, indicating that as Mass increases, there is a slight increase in Cr concentration. This coefficient is also statistically significant, with a T-value of 2.95 (p-value of 0.007).
The coefficient for pH is 2.7577, indicating that as pH increases, there is a significant increase in Cr concentration. This coefficient has a SE of 0.2893 and a highly statistically significant T-value of 9.53 (p-value of 0.000).
The goodness of fit of the regression model is assessed through the following metrics:
The standard deviation (S) of the residuals is 0.0163666, indicating the average difference between the predicted and actual Cr values.
The R-squared value (R-Sq) is 99.0%, informing us that 99.0% of the variability in Cr can be explained by the variables Time, Mass, and pH in the regression model.
The adjusted r-squared value (r-sq(adj)) is 98.9%, taking into account the number of predictors in the model..
Based on these findings, it appears that Time, Mass, and pH are significant predictors of Cr concentration.
Vernonia amygdalina modeling refers to the process of developing a statistical or mathematical model to understand and predict the behavior, characteristics, or effects of Vernonia amygdalina, which is a plant species known for its medicinal properties. The modeling process involves analyzing data, identifying relevant variables, and fitting the data to a mathematical or statistical model. This allows researchers to gain insights into the various factors that influence Vernonia amygdalina and make predictions about its behavior, growth patterns, or potential applications. By using modeling techniques, researchers can enhance their understanding of Vernonia amygdalina and explore its potential uses in different fields such as medicine, agriculture, or environmental studies.
A. In the regression analysis conducted, the response variable “HC_1” was analyzed in relation to the predictor variables “Time_1,” “Mass_1,” and “pH_1.” The objective of this analysis was to examine the relationship between the predictor variables and their potential impact on the response variable. Through regression analysis, the model identifies the coefficients that best fit the data and allows for predictions or inferences to be made based on the values of the predictor variables. By studying the relationship between “HC_1” and “Time_1,” “Mass_1,” and “pH_1,” valuable insights can be gained regarding the influence of these factors on hydrocarbon levels
.R
The regression equation is
HC_1 = - 145 - 0.0395 Time_1 - 0.0217 Mass_1 + 21.5 pH_1
Predictor Coef SE Coef T P
Constant -144.86 22.10 -6.55 0.000
Time_1 -0.03950 0.01004 -3.93 0.001
Mass_1 -0.021669 0.008885 -2.44 0.022
pH_1 21.498 3.297 6.52 0.000
S = 0.208392 R-Sq = 87.5% R-Sq(adj) = 86.1%
Analysis of Variance
Source DF SS MS F P
Regression 3 7.9029 2.6343 60.66 0.000
Residual Error 26 1.1291 0.0434
Total 29 9.0320
.B….In the regression analysis performed, the response variable “Pb_1” was examined in relation to the predictor variables “Time_1,” “Mass_1,” and “pH_1.” The main objective of this analysis was to assess the relationship between the predictor variables and their potential impact on the response variable. By running regression analysis, the model determines the coefficients that best fit the data and enables predictions or inferences to be made based on the values of the predictor variables. By studying the relationship between “Pb_1” and “Time_1,” “Mass_1,” and “pH_1,” valuable insights can be gained concerning the influence of these factors on lead levels.
The regression equation is
Pb_1 = - 23.7 + 0.00058 Time_1 + 0.0130 Mass_1 + 3.48 pH_1
Predictor Coef SE Coef T P
Constant -23.74 10.01 -2.37 0.025
Time_1 0.000577 0.004546 0.13 0.900
Mass_1 0.012987 0.004024 3.23 0.003
pH_1 3.484 1.493 2.33 0.028
S = 0.0943675 R-Sq = 90.6% R-Sq(adj) = 89.5%
Analysis of Variance
Source DF SS MS F P
Regression 3 2.23640 0.74547 83.71 0.000
Residual Error 26 0.23154 0.00891
Total 29 2.46794
C. In the regression analysis conducted, the response variable “Zn_1, was analyzed in relation to the predictor variables “Time_1,” “Mass_1,” and “pH_1.” The purpose of this analysis was to assess the relationship and potential influence of these predictor variables on the response variable. Through regression analysis, the model determines the coefficients that best fit the data and enables predictions or inferences to be made based on the values of the predictor variables. By examining the relationship between “Zn_1” and “Time_1,” “Mass_1,” and “pH_1,” valuable insights can be gained regarding the impact of these factors on zinc levels.
The regression equation is
Zn_1 = - 4.66 + 0.00585 Time_1 + 0.0124 Mass_1 + 0.669 pH_1
Predictor Coef SE Coef T P
Constant -4.662 3.611 -1.29 0.208
Time_1 0.005848 0.001641 3.56 0.001
Mass_1 0.012441 0.001452 8.57 0.000
pH_1 0.6695 0.5388 1.24 0.225
S = 0.0340525 R-Sq = 97.1% R-Sq(adj) = 96.7%
Analysis of Variance
Source DF SS MS F P
Regression 3 0.99199 0.33066 285.16 0.000
Residual Error 26 0.03015 0.00116
Total 29 1.02214
D. In the regression analysis conducted, the response variable “Cr”.was analyzed in relation to the predictor variables “Time_1,” “Mass_1,” and “pH_1.” The aim of this analysis was to determine the relationship and potential influence of these predictor variables on the response variable. Through regression analysis, the statistical model identifies the coefficients that best fit the data and allows for predictions or inferences to be made based on the values of the predictor variables.
The regression equation is a mathematical representation of the relationship between a dependent variable and one or more independent variables. It is used to predict or estimate the value of the dependent variable based on the values of the independent variables.
Cr = - 16.8 + 0.00258 Time_1 + 0.00153 Mass_1 + 2.48 pH_1
Predictor Coef SE Coef T P
Constant -16.768 1.707 -9.82 0.000
Time_1 0.0025843 0.0007755 3.33 0.003
Mass_1 0.0015306 0.0006863 2.23 0.035
pH_1 2.4798 0.2547 9.74 0.000
S = 0.0160963 R-Sq = 99.0% R-Sq(adj) = 98.9%
Analysis of Variance: (ANOVA) is a statistical technique used to compare the means of multiple groups or factors to determine if there are significant differences among them. It helps in understanding the variability within and between groups and assesses the impact of different factors on the observed variations. ANOVA provides insights into whether the differences observed in the data are statistically significant or simply due to chance. By calculating the F-statistic and corresponding p-value, ANOVA helps researchers make informed decisions and draw meaningful conclusions from their data analysis.
Source DF SS MS F P
Regression 3 0.70075 0.23358 901.55 0.000
Residual Error 26 0.00674 0.00026
Total 29 0.70749
Based on the various models developed, the primary focus lies on two key statistical indicators: the p-value and the R2 value. The p-value, or probability value, plays a crucial role in determining the significance of a model. A model is considered to be statistically significant if the overall p-value is less than 0.05, indicating a high level of confidence in its accuracy. On the other hand, the R2 value represents the coefficient of determination, which measures the relationship between variables. A higher R2 value, closer to 100%, indicates a stronger correlation between the variables, making it a desirable outcome in model evaluation.
CONCLUSION AND RECOMMENDATION .
CONCLUSION.
In conclusion, this research study has demonstrated the effectiveness of Vernonia Galamensis and Vernonia Amygdalina, commonly known as bitter leaf, in remediating hydrocarbon and metal-contaminated soils. The study focused on sandy-loamy soil, clay soil, and swamp soil as representative soil types. The contamination involved the presence of hydrocarbons and metals in the soil. Through the application of bitter leaf extracts, the microorganisms present in the extracts, such as Pseudomonas aeruginosa, Staphylococcus aureus, and Escherichia coli, along with the phytochemicals present in the leaves, played a crucial role in the degradation of the metals present in the contaminated soil. These findings highlight the potential of bitter leaf as a natural and eco-friendly solution for soil remediation. By utilizing the bio-remedial properties of bitter leaf, the study offers a promising approach to mitigate the environmental impacts of hydrocarbon and metal contamination in various soil types. This research contributes to the field of environmental sustainability and aligns with the global efforts towards achieving the Sustainable Development Goals, particularly SDG 15 (Life on Land) and SDG 12 (Responsible Consumption and Production). The study’s findings provide valuable insights for further research and implementation of bitter leaf-based remediation strategies, ultimately leading to the restoration and preservation of contaminated soils and ecosystems,”After applying approximately 40g of both Vernonia extracts, a remarkable reduction of over 50% in contaminant concentration was observed across all soil samples within a span of 40 days. These promising findings establish the efficacy of both Vernonia extracts as highly effective bio-remediating agents suitable for the remediation of polluted soils.
RECOMMENDATION
It is recommended that to get the best remediating effect, depending on the vernonia extracts available. It should be applied wet and blended into the polluted soil. This is because the micro-organisms present to perform the bio-remediating activity is still active and numerous in the leaf as well as the area of contact between the micro-organisms and the pollutants are well increased. The increase in surface contact is due to the blending into the soil substrate. Applying the room dry is better in few approaches as it helps the remediation of more Pb in clay soil than using the wet blended extracts. Thus it is advised that the wet blended is used clinically with a more neutral PH to enable the micro-organisms function properly.
Limitation of Study
The first limitation to this study is the lack of financial support from the institution, to get more results like other metals and the constituents of the hydrocarbon like the PONA (paraffin, olefin, Naphthenes and aromatic) analysis requires more finance which cannot be handled by one person alone. Secondly, the non-availability of quality labs around to aid in carrying our environmental analysis is of a concern. This limits the type of projects and studies that should be carried out to aid knowledge contribution.
Contribution to Knowledge
In this thesis, I have been able to establish that the vernonia Galamensis and Vernonia Amygdalina can be used for bio-remediation and have developed regression models to know and predict the extent of materials and time required to perform remediation activities in the three types of soil for the required contaminants.
References
- Aldrett, S., Bonner, J.S., McDonalds, T.J., Mills, M.A., Autenrieth, R.L. (1997) Degradation of crude oil enhanced by commercial microbial cultures. Proceedings of 1997 International Oil Spill Conference. American Petroleum Institute, Washington DC, 995-996. [CrossRef]
- Anderson, I: (2005). Niger River basin: A Vision for Sustainable Development, The World Bank Pp. 1-131.
- Atlas, R. M., (1988). Biodegradation of hydrocarbons in the environment, In: Environmental Biotechnology Omenn, GS EdPlenum Press, NewYork. [CrossRef]
- Atlas, R. M., (1991). Microbial hydrocarbon degradation: bioremediation of oil spills. J. Chem. Technol. Biotechnol., 52, 149-156. [CrossRef]
- Azarowicz, R.M. (1973) Microbial degradation of petroleum. US Patent 3,769,164.
- Baird, J.,(2010). “Oil’s Shame in Africa”. Newsweek: 27. [CrossRef]
- Banerjee, D. K., Fedora, P. M., Hashimoto, A., Masliyah, J. H., Pickard, M.A. andGray, M. R., (1995). Monitoring the biological treatment of anthracite-contaminated soil in a rotating –drum bioreactor. Appl. Microbial. Biotechnol., 43, 521-528.
- Barbee, G. C., Brown, K. W., Thomas, J. C., Donelley, K. C., Murray, H. E., (1996). Mutagenic activity (Ames test) of wood-preserving waste sludge applied to soil Bull. Environ Contam Toxicol., 57, 54-62. [CrossRef]
- Bogumil T, (2014). Oil-Induced Displacement and Resettlement: Social Problem and Human Rights Issue,http://www.conflictrecovery.org/bin/Bogumil_Terminski-Oil.
- Bonaventura, C., Boneventura, J., Bodishbaugh, D. F., (1995). Environmental Bioremediation: Approaches and processes. In: Ecotoxicity and Human Health (Eds) de serres, F.J and Bloom, AD CRS Lewis Publ. Boca Raton, New York. 199-200.
- Bronwen M.M (1999). The Price of Oil Human Rights Watch. 1999. Retrieved November 9, 2007.
- Bronwen, M., (1999). The Price of Oil Human Rights Watch. Retrieved November 9, 2007.
- Cheesbrough, M., 2002. District Laboratory Practice in Tropical Countries, Part 2. Cambridge University Press, UK., pp: 135-162.
- CNN, (2006). Pipeline explosion kills at least 200. Retrieved May 29, 2007.
- Compeau, G. C., Mahaffey, W. D., Patras, L., (1991). Full scale bioremediation of contaminated soil and water. In : Environmental biotechnology for waste treatment. Eds. GS Sayler, R. Fox, JW Blackbourn. Plenum Press, NewYork and London. Environ. Sci. Res., 25, 91-109.
- Environmental Inquiry - Bioremediation., retrieved 2017 (http://ei.cornell.edu/biodeg/bioremed/).
- Forsyth, J.V., Tsao, Y.M., Blem, R.D. (1995) Bioremediation: when is augmentation needed? In Hinchee, R.E. et al. (eds) Bioaugmentation for Site Remediation. Battelle Press, Columbus, OH, pp1 14.
- Goldstein, R.M., Mallory, L.M., Alexander, M. (1985) Reasons for possible failure of inoculation to enhance biodegradation. Applied and Environmental Microbiology, 50, 977-983. [CrossRef]
- Gray, M. R., Banerjee, D. K., Fedora, K. P. M., Habhimoto,A., Maslryah,J. H., Pickard, M.A., (1994). Biological remediation of anthracene-contaminated soil in rotating bioreactors. Appl. Microbial Biotechnol., 40, 933-944.
- Hozumi, T., Tsutsumi, H. and Kono, M. (2000) Bioremediation on the shore after an oil spill from the Nakhodka in the Sea of Japan. I. Chemistry and characteristics of the heavy oil loaded on the Nakhodka and biodegradation tests on oil by a bioremediation agent with microbial cultures in the laboratory. Marine Pollution Bulletin, 40, 308-314. [CrossRef]
- Huan Jing Ke Xue (February 2007). “Chemical fixation of metals in soil using bone char and assessment of the soil genotoxicity”. Huan Jing Ke Xue. 28: 232–7. PMID 17489175.
- Hupe, K., Luth, J. C., Heerenklage, J., Stegmann, R., (1995). Blade-milking reactors in the biological treatment of contaminated soils, in Biological unit processes for HazardousWasteTreatment. Ed by HuncheeRE, Skeen RS, and Sayles GD, Battele Press, Columbus. 153-159.
- Jenkins, K. D., Sanders, B. M., (1992). Biomonitoring with biomarkers:A multi-tiered framework for conducting the ecological impact of contaminants. In: Ecological indicators. Mekenzie, D., Hyatt, E., McDonald, J. Eds. Elsever, NewYork.
- Kris S. Freeman (January 2012). Remediating Soil Lead with Fishbones. Environmental Health Perspectives. 120: A20–1.
- Le Floch, S., Merlin, F.X., Guillerme, M., Dalmazzone, C., and Le Corre, P. (1999) A field experimentation on bioremediation: Bioren. Environmental Technology, 20, 897-907. [CrossRef]
- Le Floch, S., Merlin, F.X., Guillerme, M., Tozzolino, P., Ballerini, D., Dalmazzone, C., and Lundh, T. (1997) Bioren: recent experiment on oil polluted shoreline in temperate climate. In: In-Situ and On-Site Bioremediation: Volume 4, Battelle Press, Columbus, OH, pp. 411-417.
- Leahy, J. A., Colwell, R. R., (1990). Microbial degradation of hydrocarbons in the environment. Microbiological Reviews, 54, 305-315. [CrossRef]
- Lovley, D. R., (2003). Cleaning up with genomics: applying molecular biology to bioremediation. Nature Reviews/Microbiology, 1, 35-44. Available at: (www.nature.com/reviews/micro). [CrossRef]
- Mauro, G. and Wynne, III, B.J. (1990) Mega Borg oil spill: an open water bioremediation test. Texas General Land Office, Austin, Texas.
- Meagher, RB (2000). Phytoremediation of toxic elemental and organic pollutants. Current Opinion in Plant Biology. 3 (2): 153–162. [CrossRef]
- Microbiological cultures for the treatment of an oil spill. Marine Pollution Bulletin, 40, 320 324.
- Moffat, F and Linden, K., (2009). Perception and Reality: Assessing Priorities for Sustainable Development in the Niger River Delta.
- Mohan, R.R., Byrd, G.H., Nixon, J., and Bucker, E.R. (1975) Use of microorganisms to disperse and degrade oil spills. US Patent 3,871,957.
- National Research Council (NRC), (1985). Oil in the sea; inputs, fates and effects. National Academy Press, Washington, DC. [CrossRef]
- Nwilo, P.C. & Badejo, O. T.:(2001). Impacts of Oil spills along the Nigerian coast ,The Association for Environmental Health and Sciences, 2001.
- Olapade, OA; Ronk, AJ (2014). Isolation, Characterization and Community Diversity of Indigenous Putative Toluene-Degrading Bacterial Populations with Catechol-2,3-Dioxygenase Genes in Contaminated Soils. Microbial Ecology. 69: 59–65. [CrossRef]
- O’Loughlin, E. J; Traina, S. J.; Sims, G. K. (2000). Effects of sorption on the biodegradation of 2 methylpyridine in aqueous suspensions of reference clay minerals. Environ. Toxicol. And Chem. 19: 2168–2174. [CrossRef]
- Olson, B. H., Tsai, Y., (1992). Molecular approaches to environmental management. In: Environmental Microbiology ed Ralph Mitchell. John Wiley and sons Inc. Pub. New York,239-263.
- Onwurah, I. N. E., (1999a). Restoring the crop sustaining potential of crude oil polluted soil by means of Azotobacter inoculation. Plant Prod. Res, J., 4, 6-16.
- Onwurah, I. N. E., (2000). A Perspective of Industrial and Environmental Biotechnology. Snaap Press / Publishers Enugu, Nigeria, 148.
- Paerl, H., Piehler, M., Swistak, J., (1996). Coastal diesel fuel pollution effects on the native microbial community. Poster presentedat the Meeting of the American Society of Microbiology, New Orleans May 19-23.
- Prince, P. C., (1992). Bioremediation of oil spills with particular reference to the spill from Exxon Valdez. Microbial Control of Pollution. (Eds. Fry Jc, Gadd GM Herbert RA, Jones CW and Watson-Craik 1A.) Society for General Microbiology symposium 48.
- Ritter, W. F., Scarborough, R. W., (1995). A review of bioremediation of contaminated soils and ground water. J. Environ Sci Health. A., 30, 323-330. [CrossRef]
- Robson,B.D (2003) : ‘Phytoremediation of hydrocarbon-contaminated soil using plants adapted to the western Canadian climate’, Department of Soil Science, University of Saskatchewan, Saskatoon.
- Rosenberg, E. and Ron, E.Z (1996) Bioremediation of petroleum contamination, In R.L. Crawford and D.L. Crawford (Eds.), Bioremediation: principles and Applications, Cambridge University Press, UK, 100-124. [CrossRef]
- Shell International Petroleum Company, Developments in Nigeria (London: March 1995).
- Simon, M., Autenrieth, R.L., McDonald, T.J., Bonner, J.S.(1999) Evaluation of bioaugmentation for remediation of petroleum in a wetland. Proceedings of 1999 International Oil Spill Conference. American Petroleum Institute, Washington DC.
- Sims, G.K. (2006). “Nitrogen Starvation Promotes Biodegradation of N-Heterocyclic Compounds in Soil”. Soil Biology & Biochemistry. 38: 2478–2480. [CrossRef]
- Stroo, H. F., (1992). Biotechnology and hazardous waste treatment .J Environ. Qual., 21, 167. [CrossRef]
- Swannell, R.P.J., Lee, K., and McDonagh, M. (1996) Field evaluations of marine oil spill bioremediation. Microbiological Reviews, 60(2), 342-365. [CrossRef]
- The Daily Independent Lagos (2010).“Shell And The N15bn Oil Spill Judgement Debt”. . 2010-07 19. Retrieved 27 July 2010.
- Tsutsumi, H., Kono, M., Takai, K., Manabe, T. (2000) Bioremediation on the shore after an oil spill from the Nakhodka in the Sea of Japan. III. Field test of a bioremediation agent with.
- UNDP.( 2006 )“Niger Delta Human Development Report”. . p. 76. Retrieved 19 June 2011.
- Venosa, A. D., Lee, K., Suidan, M. T., Garcia-Blanco, S., Cobanli, S., Moteleb, M., Haines, J.R., Tremblay, G., and Hazelwood, M. (2002) Bioremediation and biorestoration of a crude oilcontaminated freshwater wetland on the St. Lawrence River. Bioremediation Journal, 6.
- Vidal, J., (2010). “Nigeria’s agony dwarfs the Gulf oil spill. The US and Europe ignore it”. The Observer. Retrieved 27 July 2010. government’s national oil spill detection and response agency (Nosdra) says that between 1976 and 1996 alone, more than 2.4m barrels.
Disclaimer/Publisher’s Note: The statements, opinions and data contained in all publications are solely those of the individual author(s) and contributor(s) and not of MDPI and/or the editor(s). MDPI and/or the editor(s) disclaim responsibility for any injury to people or property resulting from any ideas, methods, instructions or products referred to in the content. |
© 2024 by the authors. Licensee MDPI, Basel, Switzerland. This article is an open access article distributed under the terms and conditions of the Creative Commons Attribution (CC BY) license (http://creativecommons.org/licenses/by/4.0/).
Copyright: This open access article is published under a Creative Commons CC BY 4.0 license, which permit the free download, distribution, and reuse, provided that the author and preprint are cited in any reuse.


