Submitted:
09 January 2024
Posted:
09 January 2024
You are already at the latest version
Abstract
Functional ankle instability (FAI) results from multiple ankle sprains, causing a perceived sense of joint instability due to muscle and ligament imbalances. Neuromuscular training (NMT) is employed to enhance ankle stability in individuals with FAI. The study included 24 male university students with FAI, who underwent ankle NMT on three surfaces. OpenSim musculoskeletal model analyzed the effects on ankle muscle activity, kinetics, and kinematics. Utilizing repeated measures analysis of variance (ANOVA) and one-dimensional statistical non-parametric mapping (SNPM1d) to identify distinctions between training surfaces. NMT on foam cushion (FC) significantly enhanced tibialis anterior (TA) and gastrocnemius medial (GM) activation during walking compared to level-ground (LG) and artificial turf (AT) (p<0.05). However, no differences observed for peroneus longus (PL), gastrocnemius lateral (GL), and peak ankle plantarflexion (PF). During jogging and fast running, post FC training increased TA, PL, GM, GL activation, and peak ankle PF moment (p<0.05). Additionally, post FC training, subtalar mobility was significantly reduced (p<0.05), and ankle joints exhibited greater dorsiflexion (DF) angles during jogging and fast running (p<0.05). Consequently, selecting FC for short-term ankle NMT proves more advantageous in enhancing ankle stability among individuals with FAI, yielding a more positive impact on FAI improvement.
Keywords:
Functional ankle instability
; Neuromuscular training
; OpenSim
; Muscle
; Ankle biomechanics.
1. Introduction
Correct aerobic exercise is beneficial for our health [1]. Running, as a form of aerobic exercise, has become increasingly popular among the general public due to its convenience and affordability, and has become an important form of exercise [2]. While running offers numerous benefits, there is a certain risk of lower limb injuries due to the fact that runners need to load their own body weight and contend with the ground reaction forces (GRF) on surfaces with varying properties [3], especially in their ankle. It has been reported that there is a high probability of ankle injuries in various sports and this may lead to osteoarthritis [4]. One study found that in the United States, the majority of people who experienced ankle sprains was around 2 million per year [5]. However, ankle sprains that are not properly treated or rehabilitated could result in Chronic Ankle Instability (CAI) [6]. FAI is a prevalent manifestation of CAI, which is mainly characterized by ankle instability that is sometimes perceived by the individual as well as repeated ankle concessions [7]. Consequently, individuals with FAI may exhibit ankle injuries, loss of motion control, and ankle muscle imbalance during exercise [8].
It has been shown that the main preventive methods to reduce ankle injuries are ankle immobilizers and NMT [9]. The first method, which directly influences the individual's limb movement, typically utilizes external supports such as elastic bandages and ankle immobilizers, which are intended to provide good immobilization during movement, with the aim of controlling joint motion within a reasonable physiological range [10]. The second approach involves enhancing proprioception and neuromuscular function. This can be achieved by implementing specific training programs for sports stability, aimed at reducing the likelihood of ankle joint injuries during sports through targeted training methods [11]. Herb et al. found that strengthening ankle stabilizing muscles can help counteract changes in ankle ligament mechanoreceptor activity, thereby enhancing ankle stability [12]. Previous studies have confirmed that training the ankle stabilizing muscles is usually accomplished through NMT, involving a combination of heel lifts, lunges, jumps, and other training techniques [13]. Previous reports have suggested that long-term interventions are required for NMT of FAI [14]. However, whether short-term NMT can enhance ankle joint stability during movement remains inconclusive.
Specifically, NMT is applicable for stable surfaces and various surfaces of instability [15]. Previous reports have suggested that NMT of the ankle stabilizing muscles using surfaces of instability may be more helpful in enhancing ankle proprioception for individuals with FAI compared to training on a stable surface, leading to improved ankle stability [16]. Non-stable interfaces such as FC of different densities, BOSU balls, balance boards, etc. are usually used for training of FAI individuals. These devices rely on deformable surfaces, thus contributing to postural instability in the human body [17]. The high-density FC, a common foam cushion, and is moderately unstable, making it a good choice for FAI individuals who are choosing an unstable surface to exercise for the first time [18]. Jang et al. [19] employed OpenSim, an open source software, to calculate and process the GRF and ankle contact forces in a population with ankle instability so as to validate the data collected from the experiment. OpenSim provides a realistic simulation of the range of muscle forces by constructing a personalized skeletal muscle model to predict the muscle forces and joint contact loads generated during exercise [20,21]. This is crucial for a thorough discussion of what kind of training on FC maximizes muscle activation and ankle protection.
The aim of this work was to investigate potential differences in the biomechanical characteristics of ankle joint movement in FAI individuals with short-term NMT using FC, compared to training using LG and AT. The hypothesis of this study was that FAI individuals would be able to better activate the ankle stabilizing muscles after a short-term of NMT on FC compared to short-term of NMT on LG and AT, thus providing an efficient ankle stabilization training method for FAI individuals.
2. Materials and Methods
2.1. Participants
Statistical efficacy analyses were conducted via G*Power3(Hamburg, GRE) software using medium effect sizes to minimize the risk of Type II errors and to determine the minimum number of participants required for this study. Inputs to adapt the parameters chosen for this experiment: Effect Size was 0.4, Alpha was 0.05, Power was 0.8, Number of measures was 3, and Nonsphericity was 0.5. The results showed that a sample size of 12 was sufficient to achieve over 80 % statistical efficacy in this study.
Twenty-four male university students (age: 22.00 ± 2.00 years, height: 1.76 ± 0.05 m, weight: 73.00 ± 5.33 kg) were finally recruited for this experiment. Selected participants were asked to complete the Identification of Functional Ankle Instability (IDFAI) scale [22]. The assessment tool consists of 10 items to assess sensations such as subjective ankle pain, whether the ankle is unstable during daily activities, and recovery time after an ankle sprain. When the score is higher than 10, it is considered FAI. The participants had no history of major lower limb injuries in the last 6 months, and the right leg was the dominant leg (identified by the leg habitually used to kick a football). This study was approved by the Ethics Committee of Ningbo University Research Institute (RAGH202305221185). Written consent was obtained from all participants and they were informed of the objectives, procedures and requirements of this experimental test.
2.2. Neuromuscular Training Program
Prior to the start of the formal test, subjects were required to perform NMT on different surfaces in bare feet. The combinations of movements for training were derived from previous reports [16] [13], and the five most common, simple and highly beneficial movements were selected as shown in Table 1.
2.3. Instruments
Prior to the formal experiment, participants' maximal voluntary contraction (MVC) was collected using a CON-TREX dynamometer (CON-TREX-MJ System, CMV, Dübendorf, Switzerland). The lab was equipped with an eight-camera Vicon (Vicon Metrics Ltd., Oxford, UK) motion capture system and an embedded AMTI (AMTI, Watertown, MA, United States) force platform fixed in the middle of the path. They were synchronized to record marker trajectories and GRF at 200 Hz and 1000 Hz, respectively. Cameras and laboratory setups were calibrated and noise-reduced before each experiment. Reflective markers on the subject were simultaneously captured by at least two cameras throughout the movement [23]. Simultaneous acquisition of EMG signals from TA, PL, GM and GL at 1000 Hz using a wireless Delsys EMG test system (Delsys, Boston, MA, USA) for data processing and OpenSim model validation [24]. single beam electronic timing gates (Brower Timing Systems, Draper, Utah, United States, height = 1 m) were employed to detect running speed in subjects.
2.4. Protocol
This experiment consisted of two parts. The objective of the first part was to implement the previously described NMT program to participants through various planes (Figure 1a). The second part aimed to collect biomechanical data on participants post the intervention. In order to exclude the effect of fatigue on the experiment, each subject was tested continuously over three days. The first day comprised the experimental test post LG training, and the second and third days involved the experimental test post AT training and FC training, respectively.
During the first part of the experiment, subjects performed ankle NMT in a specified surface as required, barefoot to minimize the possible influence of shoes on the experiment. The second part of the experiment was conducted immediately post the training intervention.
While conducting the second part of the experiment, all subjects wore uniformly provided leggings and footwear. Thirty-eight reflective markers (12.5 mm in diameter) were set up to be fixed on each participant according to the requirements of the OpenSim (Stanford University, Stanford, CA, USA) model of gait 2392, and the markers were secured with tape by the same skilled tester (Figure 1b). The calibration procedure for the VICON Motion Capture System was performed according to the camera manufacturer's recommendations. At the same time, surface myoelectric are correctly attached to the tendons of the target muscle, and the electrodes should be placed in the direction of the muscle fibers, with reference to the bone markings on the subject's body surface to ensure the correct orientation of the muscle fibers [25]. Subjects were then sequentially tested for normal walk, jog at 2.68m/s, and fast run on a 10m test track [26] [27] [28]. During our tests, we used single beam electronic timing gates to control the speed. Meanwhile, during the subject's movement, the experimenter had to make sure that the subject's right leg (heel strike pattern) stepped accurately into the force platform, with an interval of 30 s between each test for fatigue recovery, and the subject was required to complete 3 corresponding data collections at each speed.
2.5. Data Processing
We provided coordinate system conversion, low-pass filtering, data extraction, and format conversion of laboratory datasets using MATLAB R2018b (The MathWorks, Natick, MA, USA) [29]. This resulted in " trc" (labelled trajectories) and " mot" (GRF) files suitable for OpenSim runs.
The weights of the marker points in the model were manually adjusted in OpenSim and the model was scaled to match the anthropometric characteristics of the subjects so that the root mean square (RMS) error between the marker points in the experiment and the virtual marker points was less than 0.01 and the maximum error was less than 0.02. Then Ankle angles and moments were calculated using inverse kinematics and inverse dynamics algorithmic tools. Static optimization was used to estimate the degree of muscle activation during exercise in the major muscle groups, including the TA, PL, GM and GL.
In Delsys EMG works, the raw EMG signals were first filtered with a bandpass fourth order Butterworth filter in the frequency range of 100-500 Hz. Amplitude analysis was carried out using RMS calculations, outputting MVC and normalized activity values for each movement. The degree of EMG activation was calculated by testing the root mean square amplitude/ MVC root mean square amplitude from 0 (0, completely inactive) to 1 (100%, fully activated).
2.6. Statistical Analysis
A Shapiro-Wilk test (SPSS Inc., Chicago, IL, USA) was employed to assess the normality of the mean muscle activation on the ankle surface during exercise in the subjects. One-way repeated measures ANOVA was used to assess statistically significant differences in subjects' changes in muscle activation at the ankle surface after different surfaces of intervention. Pairwise comparisons with Bonferroni were used post-hoc for further analysis. Descriptive statistics are provided in the form of arithmetic mean (Mean) and standard deviations (SD). The level of significance was set at α < 0.05 and the above was realized using IBM SPSS Statistics 26 (SPSS, Chicago, IL, USA).
The Shapiro-Wilk test (SPSSs Inc., Chicago, IL, USA) was used to determine the normal distributions of ankle moments, sagittal plane PF and DF, and subtalar joint Inversion (INV) and eversion (EVE) at different mating speeds. If a normal distribution was satisfied, a one-way repeated measures ANOVA with one-dimensional statistical parameter mapping (SPM1d) was performed. Otherwise, one-way repeated measures ANOVA with one-dimensional statistical non-parametric mapping (SnPM1d) was performed [30]. Bonferroni adjustment was used for post hoc pairwise comparisons of significant main effects (direction). In this study, SPM1d and SnPM1d were statistically analyzed using MATLAB open source scripts (The MathWorks, Natick, MA, USA). The significance level for each test was set at 0.05.
3. Results
3.1. Model Validation and Sensitivity
We evaluated the reliability and sensitivity of the model by comparing the captured surface EMG data with muscle activations calculated by the OpenSim static optimization tool. During the walk, jog and fast run, the RMS calculations for the four muscles in the surface EMG were adjusted to the maximum RMS during the MVC test, which ranged from 0 to 1.
Model-simulated muscle activation is also reported on a scale from 0 to 1, where 0 indicates no muscle activation and 1 indicates full activation. Comparative results are shown in Figure 2, where predicted muscle activation is consistent with surface EMG during the standing phase and compared with previous results, demonstrating good agreement [31].
3.2. Comparative results of non-parametric tests of muscle activation
The initial hypothesis indicated that the sample did not significantly deviate from the normal distribution, i.e., it conformed to the normal distribution. At the 0.05 level of significance (p < 0.05), the original hypothesis was rejected and all samples did not conform to a normal distribution. Therefore, we used non-parametric tests. Analysis of the results showed that there was a statistical difference in the mean muscle activation of the subjects after training in different surfaces.
As shown in Figure 3a, PL and GL were not statistically significant after training on different surfaces during walk. Mean muscle activation was significantly higher in TA (p=0.001) and GM (p<0.05) post FC training than post LG and AT training.
As shown in Figure 3b, the mean muscle activation levels of TA, PL, GM, and GL during the jog were statistically significant after training at different interfaces. Post hoc pairwise comparisons showed that mean muscle activation was significantly higher in TA post FC training (p=0.003) than post LG training (p=0.018) and AT training (p=0.018). Mean muscle activation was significantly higher in the PL post FC training (p=0.001) than post LG training (p=0.001) and AT training (p=0.002). Mean muscle activation was significantly higher in GM post FC training (p=0.014) than post LG training (p<0.001) and AT training (p<0.001). Mean muscle activation was significantly higher in GL post FC training (p=0.003) than post LG training (p=0.003) and AT training (p=0.008).
As shown in Figure 3c, the mean muscle activation levels of TA, PL, GM, and GL during the fast run were significantly different after training at different interfaces. Post hoc pairwise comparisons showed that mean muscle activation was significantly higher in TA post FC training (p=0.001) than post LG training (p=0.001) and AT training (p=0.006). Mean muscle activation was significantly higher in the PL post FC training (p<0.001) than post LG training (p<0.001) and AT training (p=0.008). Mean muscle activation was significantly higher in GM post FC training (p<0.001) than post LG training (p<0.001) and AT training (p=0.021). Mean muscle activation was significantly higher in the GL post FC training (p<0.001) than post LG training (p<0.001) and AT training (p=0.001).
3.3. Results of the SNPM1d comparison of kinematic and kinetic
3.3.1. Ankle moments
As shown in Table 2, there were no significant differences in peak ankle PF moment during walk. However, during jog, the peak ankle PF moment post AT training was significantly greater than LG (p=0.002), and the peak ankle PF moment post FC training was significantly greater than LG (p<0.001) and AT (p<0.001). In fast run, the peak ankle PF moment post AT training was significantly greater than LG (p=0.006), and the peak ankle PF moment post FC training was significantly greater than LG (p<0.001) and AT (p=0.02).
As shown in Figure 4a, post hoc paired analyses showed no statistically difference between LG and AT during the walk, and a significantly greater PF moment in FC than in LG during the 46%-70% standing phase (p<0.001). The PF moment was significantly greater for FC than for AT in the 14%-20% (p=0.03) and 47%-73% (p<0.001) standing phases. During the jog (Figure 4b), the PF moment of the AT was significantly greater than that of the LG during the 15%-56% standing phase (p<0.001). The FC had a greater PF moment than the LG in the 14%-20% (p=0.035) and 38%-75% (p<0.001) standing phases. During the 54%-74% standing phase, the plantar flexion moment was significantly greater in FC than in AT (p<0.001). During the fast run (Figure 4c), the PF moment of the AT was significantly greater than that of the LG during the 40%-65% stance phase (p<0.001). The FC had a greater PF moment than the LG in the 12%-18% (p=0.046) and 47%-83% (p<0.001) standing phases. The PF moment was greater in FC than in AT during the 10%-20% (p=0.038) and 52%-70% (p<0.001) stance phases.
3.3.2. Subtalar joint INV and EVE
As shown in Table 3, post training under different planes, comparing the peak INV and EVE angles of the subtalar joint revealed the following results: during the walk, the peak EVE angle of the subtalar joint post FC training was significantly smaller than AT (p<0.001), and the subtalar mobility post FC training was significantly smaller than AT (p<0.001); During the jog, the peak EVE angle of the subtalar joint post FC training was significantly smaller than LG (p<0.001) and AT (p<0.001). The peak INV angle of the subtalar joint post LG training was significantly smaller than AT (p<0.001). Additionally, the subtalar mobility post FC training was significantly smaller than LG (p<0.001) and AT (p<0.001); During the fast running, the peak EVE angle of the subtalar joint post AT training was significantly smaller than LG (p=0.009), the peak EVE angle post FC training was significantly smaller than LG (p<0.001), and the subtalar mobility post FC training was significantly smaller than LG (p<0.001) and AT (p=0.042).
During the walk (Figure 4d), the INV angle of the AT was significantly greater than the LG in 13%-27% of the standing phase (p<0.001), and the EVE angle of the AT was significantly greater than the LG in 55%-85% of the standing phase (p<0.001). In the 0%-12% standing phase, FC had a significantly greater EVE angle than LG (p<0.001). The EVE angle of the FC was significantly smaller than that of the LG in the 84%-100% standing phase (p<0.001). During the 8%-17% standing phase, the INV angle was significantly greater in FC than in AT (p<0.001). In the 66%-100% standing phase, FC had a significantly smaller EVE angle than AT (p<0.001).
During the jog (Figure 4e), the INV angle of the AT was significantly greater than that of the LG during the 33%-84% standing phase (p<0.001). In the 0%-8% (p=0.002) and 57%-100% (p<0.001) standing phases, the FC had a significantly smaller EVE angle than the LG. In the 0%-4% (p=0.005) and 85%-100% (p<0.001) standing phases, the FC had a significantly smaller EVE angle than the AT. In the 22%-33% (p=0.02) standing phase, the FC had a significantly smaller INV angle than the AT.
During the fast run (Figure 4f), the INV angle of the AT was significantly greater than that of the LG during the 14%-30% (p<0.001) standing phase. In the 80%-100% (p<0.001) standing phase, the EVE angle of the AT was significantly smaller than that of the LG. In the 56%-100% (p<0.001) standing phase, the FC had a significantly smaller EVE angle than the LG. During the 17%-32% standing phase, the INV angle of the FC was less than the AT (p=0.004). In the 60%-100% standing phase, the FC had a significantly smaller EVE angle than the AT.
3.3.3. Ankle sagittal plane kinematics
As indicated in Table 4, following training under different planes, a comparison of ankle joint DF and PF peaks revealed the following outcomes: during the walk, post FC training, the ankle joint DF was significantly greater than LG (p=0.01); During the jog, post FC training, ankle joint DF was significantly greater than LG (p=0.038) and AT (p<0.001). Post AT training, ankle joint PF was significantly smaller than LG (p=0.006) and FC (p=0.34), and ankle joint sagittal plane mobility was significantly smaller than LG (p=0.01) and FC (p<0.001); During the fast run, post AT training, ankle joint DF was significantly greater than LG (p<0.001). Post FC training, ankle joint DF was significantly greater than LG (p<0.001) and AT (p=0.16), and ankle joint PF was significantly smaller than LG (p<0.001) and AT (p<0.001).
Post hoc paired analyses showed that during the walk (Figure 4g), the ankle DF angle of the AT was significantly greater than that of the LG in the 0%-7% (p=0.02) and 47%-62% (p=0.003) stance phases, and the ankle PF angle of the AT was significantly less than that of the LG in the 90%-100% (p<0.001) stance phase. The ankle DF angle was significantly greater in FC than in LG during the 50%-92% stance phase (p<0.001), and the ankle PF angle was significantly less in FC than in LG during the 92%-100% stance phase (p<0.001). There was no statistical significance between DF and PF angles of the ankle in AT and FC (p>0.05).
During the jog (Figure 4h), the ankle DF angle of the AT was significantly greater than that of the LG during the 31%-44% (p=0.001) stance phase, and the ankle PF angle of the AT was significantly less than that of the LG during the 86%-100% (p<0.001) stance phase. The ankle DF angle was significantly greater in FC than in LG during the 0%-45% standing phase (p<0.001). The ankle DF angle was significantly greater in FC than in AT during the 10%-50% standing phase (p<0.001). The ankle PF angle was significantly greater in FC than in AT during the 83%-100% standing phase (p<0.001).
During the fast run (Figure 4i), the ankle DF angle of the AT was significantly greater than that of the LG during the 50%-74% stance phase (p<0.001), and the ankle PF angle of the AT was significantly less than that of the LG during the 74%-90% stance phase (p<0.001). The ankle DF angle was significantly greater in FC than in LG during the 21%-80% stance phase (p<0.001), and the ankle PF angle was significantly less in FC than in LG during the 80%-100% stance phase (p<0.001). The ankle DF angle of FC was significantly greater than AT in the 12%-52% stance phase (p<0.001), and the ankle PF angle of FC was significantly less than AT in the 78%-100% stance phase (p<0.001).
4. Discussion
Ankle joint NMT is commonly used for FAI training and rehabilitation. However, most of the current studies on ankle NMT for FAI have focused on long-term interventions on the ankle joint [32,33,34,35,36], and there have been few studies on the effects of short-term ankle NMT on the ankle. At the same time, surfaces with different levels of stabilization will have different effects on the effectiveness of training [15]. Therefore, in this study, we investigated the effects of short-term NMT on the ankle joint, conducted on surfaces with varying degrees of stability, on the biomechanical characteristics of the ankle joint in individuals with FAI. The results of this study suggest that ankle NMT in surfaces with different levels of stabilization can differentially affect ankle moments, joint angles, and ankle stabilizer muscle activation in FAI individuals. Comparing the three surface types of training, it was found that training on FC with a relatively high degree of instability may have more positive effects on FAI individuals.
We observed that increased instability in the training surface may increase the average level of activation of the ankle stabilizer muscles in subjects (e.g., Figures 3), which is consistent with our previous hypothesis. The PL around the ankle joint is mainly responsible for controlling the movement of the ankle in the left-right direction, the GM and GL are mainly responsible for regulating the PF movement of the ankle joint, and the TA plays an important role in both INV and DF movements, and ankle joint stability is largely dependent on these four muscles [37]. Therefore, NMT utilizing a surface with a higher degree of instability (e.g., FC) compared to a surface that is commonly used (e.g., LG) in everyday life will be more conducive to the activation of the four muscles. In addition, different training movements will have different effects on the ankle joint, and an increase in jumping movements may be more conducive to the activation of ankle stabilizer muscles [38]. Increased levels of activation of these muscles during exercise can have a positive effect on ankle stability [39], thereby reducing the risk of ankle injury in FAI individuals during running. It has been reported that TA, PL, GM, and GL EMG activity are higher after training in the unstable surface compared to the stable surface, which is similar to our results (e.g., Figure 3) [40]. This phenomenon may be explained by the fact that during ankle training in unstable environments, the muscles surrounding the joint need to be more actively involved in maintaining balance and stability [41,42]. The mean level of activation of the ankle stabilizer muscles increases to some extent with increasing instability in the training surface, a finding that is supported by a previous study [15], this study found that the level of activation of the ankle stabilizer muscles in individuals with CAI all increased to some extent with increasing instability in the training surface. However, it has also been shown that training in the surface of instability does not have a significant effect on the level of activation of the muscles surrounding the ankle joint [43]. However, the study was conducted on healthy subjects with no history of ankle sprains, and we hypothesized that the sensitivity of the training effect may be lower in this healthy population, thus producing different results.
When the instability of the training surface is altered, the participant's ankle moment during movement is directly affected. In the present study, it was observed that participants exhibited greater peak ankle PF moments during exercise as the instability of the training surface gradually increased, this may be due to increased levels of activation of the plantarflexor muscles, including the TA, around the ankle joint to accommodate surface instability, resulting in stronger moment generation [37]. However, the increase in PF moment may subject the ankle joint to greater loads, which will increase the risk of ankle injuries [44], which is a point that needs to be worthy of our attention.
Increased levels of TA activation will produce greater foot DF during gait [45], and it is possible that stretching of the gastrocnemius muscle may also be associated with improved DF of the ankle [46]. In this study, after NMT on a FC, the DF angle of the ankle joint during exercise was significantly increased, which improved the flexibility of the ankle joint in the sagittal plane to some extent. It has been shown that a single session of joint activity can result in a moderate increase in ankle DF mobility, which is similar to the training in this study to increase the ankle DF angle [47]. Moreover, the increased DF mobility of the ankle joint in FAI is conducive to improved motor control and dynamic balance of the ankle joint [48,49]. At the same time, increased ankle DF mobility may help reduce the risk of ankle sprains and lower extremity injuries [50]. The geometry of the subtalar joint allows for INV and EVE of the ankle, and it is in this position that most of the foot's EVE and INV is achieved [51]. In this study, the range of motion of the subtalar joint decreased with increasing instability of the training surface, indicating a reduced ankle INV and EVE angle. This may be associated with an increased activation level of the ankle EVE muscles PL and INV muscles TA controlling the ankle joint. Related studies have reported that increased levels of TA muscle activation may place the lateral ankle at less risk of stress in athletes with CAI [52,53]. Simultaneously, it has been observed that preparatory co-activation of ankle EVE and INV muscles can limit the angular range of ankle INV and EVE, potentially reducing the incidence of ankle injuries [54]. INV and EVE injuries are also common in ankle sports injuries [55], and reducing the incidence of this injury is of great significance for individuals with FAI.
Although, it has also been found in an article that post a short period of proprioceptive training, there was no positive effect on ankle stability in athletes, which contradicts the present study, but may be related to the population of the experiment, the training methodology, and training fatigue [56]. Therefore, the choice of training movements and training time is a factor to be considered. Too long training time and too intense training movements may cause the early appearance of exercise fatigue, which may have some adverse effects on the exercise.
However, this study still has some limitations. The main results were as follows: (1) The participants were mainly general FAI individuals, and it is not known whether the results of this study are applicable to athletes with FAI. (2) Our research has focused mainly on the dominant leg, while neglecting the study of the non-dominant leg. Since both legs are often utilized in sports, it is also important to understand how the non-dominant leg performs in sports. (3) This experiment mainly considered the sports biomechanics of the ankle joint in walk and run post NMT, but it remains to be considered whether the training method is applicable to other sports. (4) Future related research should focus more on the movement and timing of training and the effects of fatigue on the experiment. (5) This study focused on male FAI individuals, and future related studies should include females for a more comprehensive understanding of the effects of NMT on the ankle joint.
5. Conclusions
The findings of this study indicate that ankle joint NMT on a surface with a relatively high level of instability may be more effective in assisting individuals with FAI. That is, ankle joint NMT on FC is more effective in activating the ankle stabilizing muscles in individuals with FAI compared to training on LG and AT. And the increased activation level of the ankle stabilizer muscles is beneficial to improve the flexibility of the ankle joint in the sagittal plane and reduce subtalar INV and EVE, which has a positive effect on the motion control and stability of the ankle joint during exercise. It is worth noting, however, that the duration of the effect of such short-term ankle joint NMT is unknown. Therefore, we recommend that individuals with FAI incorporate ankle NMT training on an unstable surface (FC) into their daily routine. This practice helps to further enhance ankle stability through prolonged training interventions while reducing the risk of sports-related injuries.
Author Contributions
Conceptualization, J.Z. and E.S.; methodology, J.Z.; software, E.S.; validation, E.C.T., J.S.B. and Y.G.; formal analysis, E.C.T.; investigation, J.Z.; resources, E.C.T.; data curation, E.S.; writing—original draft preparation, J.Z.; writing—review and editing, E.C.T. and J.S.B; supervision, J.S.B. and Y.G; project administration, E.C.T.; funding acquisition, Y.G. All authors have read and agreed to the published version of the manuscript.
Funding
This study was sponsored by Health Science and Technology Program of Zhejiang Province (Grant number: 2022KY1151), Zhejiang Province Science Fund for Distinguished Young Scholars (Grant number: LR22A020002), Public Welfare Science and Technology Project of Ningbo, China (Grant number: 2021S134), Ningbo Key Research and Development Program (Grant number: 20222ZDYF020016), Ningbo Natural Science Foundation (Grant number: 2021J241, 2022J120), Graduate Student Scientific Research and Innovation Project of Ningbo University and K. C. Wong Magna Fund in Ningbo University.
Institutional Review Board Statement
The study was conducted in accordance with the Declaration of Helsinki and approved by the Ethics Committee of Ningbo University (RAGH202305221185).
Informed Consent Statement
Informed consent was obtained from all subjects involved in the study. Written informed consent was obtained from the patient(s) to publish this paper.
Data Availability Statement
The data are unavailable due to privacy or ethical restrictions.
Conflicts of Interest
The authors declare no conflict of interest.
References
- Health, N.I.o. Concurrent and aerobic exercise training promote similar benefits in body composition and metabolic profiles in obese adolescents.
- Paluska, S.A. An overview of hip injuries in running. Sports medicine 2005, 35, 991–1014. [Google Scholar] [CrossRef]
- Chen, T.L.-W.; Wong, D.W.-C.; Wang, Y.; Lin, J.; Zhang, M. Foot arch deformation and plantar fascia loading during running with rearfoot strike and forefoot strike: a dynamic finite element analysis. Journal of Biomechanics 2019, 83, 260–272. [Google Scholar] [CrossRef]
- Valderrabano, V.; Horisberger, M.; Russell, I.; Dougall, H.; Hintermann, B. Etiology of ankle osteoarthritis. Clinical Orthopaedics and Related Research® 2009, 467, 1800–1806. [Google Scholar] [CrossRef] [PubMed]
- Herzog, M.M.; Kerr, Z.Y.; Marshall, S.W.; Wikstrom, E.A. Epidemiology of ankle sprains and chronic ankle instability. Journal of athletic training 2019, 54, 603–610. [Google Scholar] [CrossRef] [PubMed]
- Yu, P.; Mei, Q.; Xiang, L.; Fernandez, J.; Gu, Y. Differences in the locomotion biomechanics and dynamic postural control between individuals with chronic ankle instability and copers: a systematic review. Sports Biomechanics 2022, 21, 531–549. [Google Scholar] [CrossRef]
- Delahunt, E.; Coughlan, G.F.; Caulfield, B.; Nightingale, E.J.; Lin, C.-W.C.; Hiller, C.E. Inclusion criteria when investigating insufficiencies in chronic ankle instability. Medicine & Science in Sports & Exercise 2010, 42, 2106–2121. [Google Scholar]
- Munn, J.; Sullivan, S.J.; Schneiders, A.G. Evidence of sensorimotor deficits in functional ankle instability: a systematic review with meta-analysis. Journal of Science and Medicine in Sport 2010, 13, 2–12. [Google Scholar] [CrossRef]
- Kaminski, T.W.; Needle, A.R.; Delahunt, E. Prevention of lateral ankle sprains. Journal of Athletic Training 2019, 54, 650–661. [Google Scholar] [CrossRef] [PubMed]
- Miller, H.; Needle, A.R.; Swanik, C.B.; Gustavsen, G.A.; Kaminski, T.W. Role of external prophylactic support in restricting accessory ankle motion after exercise. Foot & Ankle International 2012, 33, 862–869. [Google Scholar]
- Schiftan, G.S.; Ross, L.A.; Hahne, A.J. The effectiveness of proprioceptive training in preventing ankle sprains in sporting populations: a systematic review and meta-analysis. Journal of science and medicine in sport 2015, 18, 238–244. [Google Scholar] [CrossRef]
- Herb, C.C.; Hertel, J. Current concepts on the pathophysiology and management of recurrent ankle sprains and chronic ankle instability. Current Physical Medicine and Rehabilitation Reports 2014, 2, 25–34. [Google Scholar] [CrossRef]
- Lee, H.M.; Oh, S.; Kwon, J.W. Effect of plyometric versus ankle stability exercises on lower limb biomechanics in taekwondo demonstration athletes with functional ankle instability. International Journal of Environmental Research and Public Health 2020, 17, 3665. [Google Scholar] [CrossRef] [PubMed]
- Vriend, I.; Gouttebarge, V.; Van Mechelen, W.; Verhagen, E. Neuromuscular training is effective to prevent ankle sprains in a sporting population: a meta-analysis translating evidence into optimal prevention strategies. Journal of ISAKOS 2016, 1, 202–213. [Google Scholar] [CrossRef]
- De Ridder, R.; Willems, T.; Vanrenterghem, J.; Roosen, P. Influence of balance surface on ankle stabilizing muscle activity in subjects with chronic ankle instability. Journal of rehabilitation medicine 2015, 47, 632–638. [Google Scholar] [CrossRef] [PubMed]
- Ha, S.-Y.; Han, J.-H.; Sung, Y.-H. Effects of ankle strengthening exercise program on an unstable supporting surface on proprioception and balance in adults with functional ankle instability. Journal of exercise rehabilitation 2018, 14, 301. [Google Scholar] [CrossRef] [PubMed]
- Behm, D.G.; Muehlbauer, T.; Kibele, A.; Granacher, U. Effects of strength training using unstable surfaces on strength, power and balance performance across the lifespan: a systematic review and meta-analysis. Sports Medicine 2015, 45, 1645–1669. [Google Scholar] [CrossRef] [PubMed]
- Lin, C.-C.; Roche, J.L.; Steed, D.P.; Musolino, M.C.; Marchetti, G.F.; Furman, G.R.; Redfern, M.S.; Whitney, S.L. Test-retest reliability of postural stability on two different foam pads. Journal of nature and science 2015, 1, e43. [Google Scholar] [PubMed]
- Jang, J.; Migel, K.G.; Kim, H.; Wikstrom, E.A. Acute vibration feedback during gait reduces mechanical ankle joint loading in chronic ankle instability patients. Gait & Posture 2021, 90, 261–266. [Google Scholar]
- Delp, S.L.; Anderson, F.C.; Arnold, A.S.; Loan, P.; Habib, A.; John, C.T.; Guendelman, E.; Thelen, D.G. OpenSim: open-source software to create and analyze dynamic simulations of movement. IEEE transactions on biomedical engineering 2007, 54, 1940–1950. [Google Scholar] [CrossRef]
- Seth, A.; Hicks, J.L.; Uchida, T.K.; Habib, A.; Dembia, C.L.; Dunne, J.J.; Ong, C.F.; DeMers, M.S.; Rajagopal, A.; Millard, M. OpenSim: Simulating musculoskeletal dynamics and neuromuscular control to study human and animal movement. PLoS computational biology 2018, 14, e1006223. [Google Scholar] [CrossRef]
- Simon, J.; Donahue, M.; Docherty, C. Development of the identification of functional ankle instability (IdFAI). Foot & Ankle International 2012, 33, 755–763. [Google Scholar]
- Mei, Q.; Fernandez, J.; Xiang, L.; Gao, Z.; Yu, P.; Baker, J.S.; Gu, Y. Dataset of lower extremity joint angles, moments and forces in distance running. Heliyon 2022, 8, e11517. [Google Scholar] [CrossRef]
- Delp, S.L.; Anderson, F.C.; Arnold, A.S.; Loan, P.; Habib, A.; John, C.T.; Guendelman, E.; Thelen, D.G. OpenSim: open-source software to create and analyze dynamic simulations of movement. IEEE transactions on bio-medical engineering 2007, 54, 1940–1950. [Google Scholar] [CrossRef] [PubMed]
- Lu, Z.; Li, X.; Xuan, R.; Song, Y.; Bíró, I.; Liang, M.; Gu, Y. Effect of heel lift insoles on lower extremity muscle activation and joint work during barbell squats. Bioengineering 2022, 9, 301. [Google Scholar] [CrossRef]
- Monaghan, K.; Delahunt, E.; Caulfield, B. Ankle function during gait in patients with chronic ankle instability compared to controls. Clinical biomechanics 2006, 21, 168–174. [Google Scholar] [CrossRef] [PubMed]
- Chinn, L.; Dicharry, J.; Hertel, J. Ankle kinematics of individuals with chronic ankle instability while walking and jogging on a treadmill in shoes. Physical Therapy in Sport 2013, 14, 232–239. [Google Scholar] [CrossRef] [PubMed]
- Iwamoto, Y.; Takahashi, M.; Shinkoda, K. Differences of muscle co-contraction of the ankle joint between young and elderly adults during dynamic postural control at different speeds. Journal of physiological anthropology 2017, 36, 1–9. [Google Scholar] [CrossRef] [PubMed]
- Lu, Y.; Mei, Q.; Peng, H.-T.; Li, J.; Wei, C.; Gu, Y. A comparative study on loadings of the lower extremity during deep squat in Asian and Caucasian individuals via OpenSim musculoskeletal modelling. BioMed Research International 2020, 2020. [Google Scholar] [CrossRef]
- Pataky, T.C.; Vanrenterghem, J.; Robinson, M.A. Zero- vs. one-dimensional, parametric vs. non-parametric, and confidence interval vs. hypothesis testing procedures in one-dimensional biomechanical trajectory analysis. J Biomech 2015, 48, 1277–1285. [Google Scholar] [CrossRef]
- Steele, K.M.; DeMers, M.S.; Schwartz, M.H.; Delp, S.L. Compressive tibiofemoral force during crouch gait. Gait & posture 2012, 35, 556–560. [Google Scholar]
- Smith, B.I.; Docherty, C.L.; Simon, J.; Klossner, J.; Schrader, J. Ankle strength and force sense after a progressive, 6-week strength-training program in people with functional ankle instability. Journal of athletic training 2012, 47, 282–288. [Google Scholar] [CrossRef] [PubMed]
- Cloak, R.; Nevill, A.; Day, S.; Wyon, M. Six-week combined vibration and wobble board training on balance and stability in footballers with functional ankle instability. Clinical journal of sport medicine 2013, 23, 384–391. [Google Scholar] [CrossRef] [PubMed]
- Huang, P.-Y.; Jankaew, A.; Lin, C.-F. Effects of plyometric and balance training on neuromuscular control of recreational athletes with functional ankle instability: a randomized controlled laboratory study. International journal of environmental research and public health 2021, 18, 5269. [Google Scholar] [CrossRef] [PubMed]
- Samadi, H.; Rajabi, R.; Karimizadeh Ardakani, M. The effect of six weeks of neuromuscular training on joint position sense and lower extremity function in male athletes with functional ankle instability. Journal of Exercise Science and Medicine 2017, 9, 15–33. [Google Scholar]
- Samadi, H.; Rajabi, R.; Alizadeh, M.H.; Jamshidi, A. Effect of six weeks neuromuscular training on dynamic postural control and lower extremity function in male athletes with functional ankle instability. Studies in sport medicine 2014, 5, 73–90. [Google Scholar]
- Fujimoto, M.; Hsu, W.-L.; Woollacott, M.H.; Chou, L.-S. Ankle dorsiflexor strength relates to the ability to restore balance during a backward support surface translation. Gait & posture 2013, 38, 812–817. [Google Scholar]
- Monteleone, B.J.; Ronsky, J.L.; Meeuwisse, W.H.; Zernicke, R.F. Ankle kinematics and muscle activity in functional ankle instability. Clinical Journal of Sport Medicine 2014, 24, 62–68. [Google Scholar] [CrossRef]
- Feger, M.A.; Donovan, L.; Hart, J.M.; Hertel, J. Lower extremity muscle activation during functional exercises in patients with and without chronic ankle instability. PM&R 2014, 6, 602–611. [Google Scholar]
- Ferreira, L.A.B.; Pereira, W.M.; Rossi, L.P.; Kerpers, I.I.; de Paula Jr, A.R.; Oliveira, C.S. Analysis of electromyographic activity of ankle muscles on stable and unstable surfaces with eyes open and closed. Journal of bodywork and movement therapies 2011, 15, 496–501. [Google Scholar] [CrossRef]
- Conceição, J.S.; Schaefer de Araújo, F.G.; Santos, G.M.; Keighley, J.; Dos Santos, M.J. Changes in postural control after a ball-kicking balance exercise in individuals with chronic ankle instability. Journal of athletic training 2016, 51, 480–490. [Google Scholar] [CrossRef]
- Williams III, D.B.; Murray, N.G.; Powell, D.W. Athletes who train on unstable compared to stable surfaces exhibit unique postural control strategies in response to balance perturbations. Journal of sport and health science 2016, 5, 70–76. [Google Scholar] [CrossRef] [PubMed]
- Dias, A.; Pezarat-Correia, P.; Esteves, J.; Fernandes, O. The influence of a balance training program on the electromyographic latency of the ankle musculature in subjects with no history of ankle injury. Physical Therapy in sport 2011, 12, 87–92. [Google Scholar] [CrossRef] [PubMed]
- Petersen, J.; Nielsen, R.O.; Rasmussen, S.; Sørensen, H. Comparisons of increases in knee and ankle joint moments following an increase in running speed from 8 to 12 to 16 km· h− 1. Clinical Biomechanics 2014, 29, 959–964. [Google Scholar] [CrossRef] [PubMed]
- Frigo, C.A.; Merlo, A.; Brambilla, C.; Mazzoli, D. Balanced Foot Dorsiflexion Requires a Coordinated Activity of the Tibialis Anterior and the Extensor Digitorum Longus: A Musculoskeletal Modelling Study. Applied Sciences 2023, 13, 7984. [Google Scholar] [CrossRef]
- Weerapong, P.; Hume, P.A.; Kolt, G.S. Stretching: mechanisms and benefits for sport performance and injury prevention. Physical Therapy Reviews 2004, 9, 189–206. [Google Scholar] [CrossRef]
- Hoch, M.C.; McKeon, P.O. Joint mobilization improves spatiotemporal postural control and range of motion in those with chronic ankle instability. Journal of Orthopaedic Research 2011, 29, 326–332. [Google Scholar] [CrossRef]
- Basnett, C.R.; Hanish, M.J.; Wheeler, T.J.; Miriovsky, D.J.; Danielson, E.L.; Barr, J.B.; Grindstaff, T.L. Ankle dorsiflexion range of motion influences dynamic balance in individuals with chronic ankle instability. International journal of sports physical therapy 2013, 8, 121. [Google Scholar]
- Hoch, M.C.; Staton, G.S.; McKeon, J.M.M.; Mattacola, C.G.; McKeon, P.O. Dorsiflexion and dynamic postural control deficits are present in those with chronic ankle instability. Journal of Science and Medicine in Sport 2012, 15, 574–579. [Google Scholar] [CrossRef]
- Hoch, M.C.; Farwell, K.E.; Gaven, S.L.; Weinhandl, J.T. Weight-bearing dorsiflexion range of motion and landing biomechanics in individuals with chronic ankle instability. Journal of athletic training 2015, 50, 833–839. [Google Scholar] [CrossRef]
- Michael, J.M.; Golshani, A.; Gargac, S.; Goswami, T. Biomechanics of the ankle joint and clinical outcomes of total ankle replacement. Journal of the mechanical behavior of biomedical materials 2008, 1, 276–294. [Google Scholar] [CrossRef]
- Wilkerson, G.B.; Pinerola, J.J.; Caturano, R.W. Invertor vs. evertor peak torque and power deficiencies associated with lateral ankle ligament injury. Journal of Orthopaedic & Sports Physical Therapy 1997, 26, 78–86. [Google Scholar]
- Rosen, A.; Swanik, C.; Thomas, S.; Glutting, J.; Knight, C.; Kaminski, T.W. Differences in lateral drop jumps from an unknown height among individuals with functional ankle instability. Journal of athletic training 2013, 48, 773–781. [Google Scholar] [CrossRef]
- DeMers, M.S.; Hicks, J.L.; Delp, S.L. Preparatory co-activation of the ankle muscles may prevent ankle inversion injuries. Journal of biomechanics 2017, 52, 17–23. [Google Scholar] [CrossRef]
- Chen, E.T.; McInnis, K.C.; Borg-Stein, J. Ankle sprains: evaluation, rehabilitation, and prevention. Current sports medicine reports 2019, 18, 217–223. [Google Scholar] [CrossRef] [PubMed]
- Romero-Franco, N.; Martínez-López, E.J.; Lomas-Vega, R.; Hita-Contreras, F.; Osuna-Pérez, M.C.; Martínez-Amat, A. Short-term effects of proprioceptive training with unstable platform on athletes' stabilometry. The Journal of Strength & Conditioning Research 2013, 27, 2189–2197. [Google Scholar]
Figure 1.
(a) Different degrees of stability with three training surfaces. (b) OpenSim 2392 reflective marker points.
Figure 1.
(a) Different degrees of stability with three training surfaces. (b) OpenSim 2392 reflective marker points.
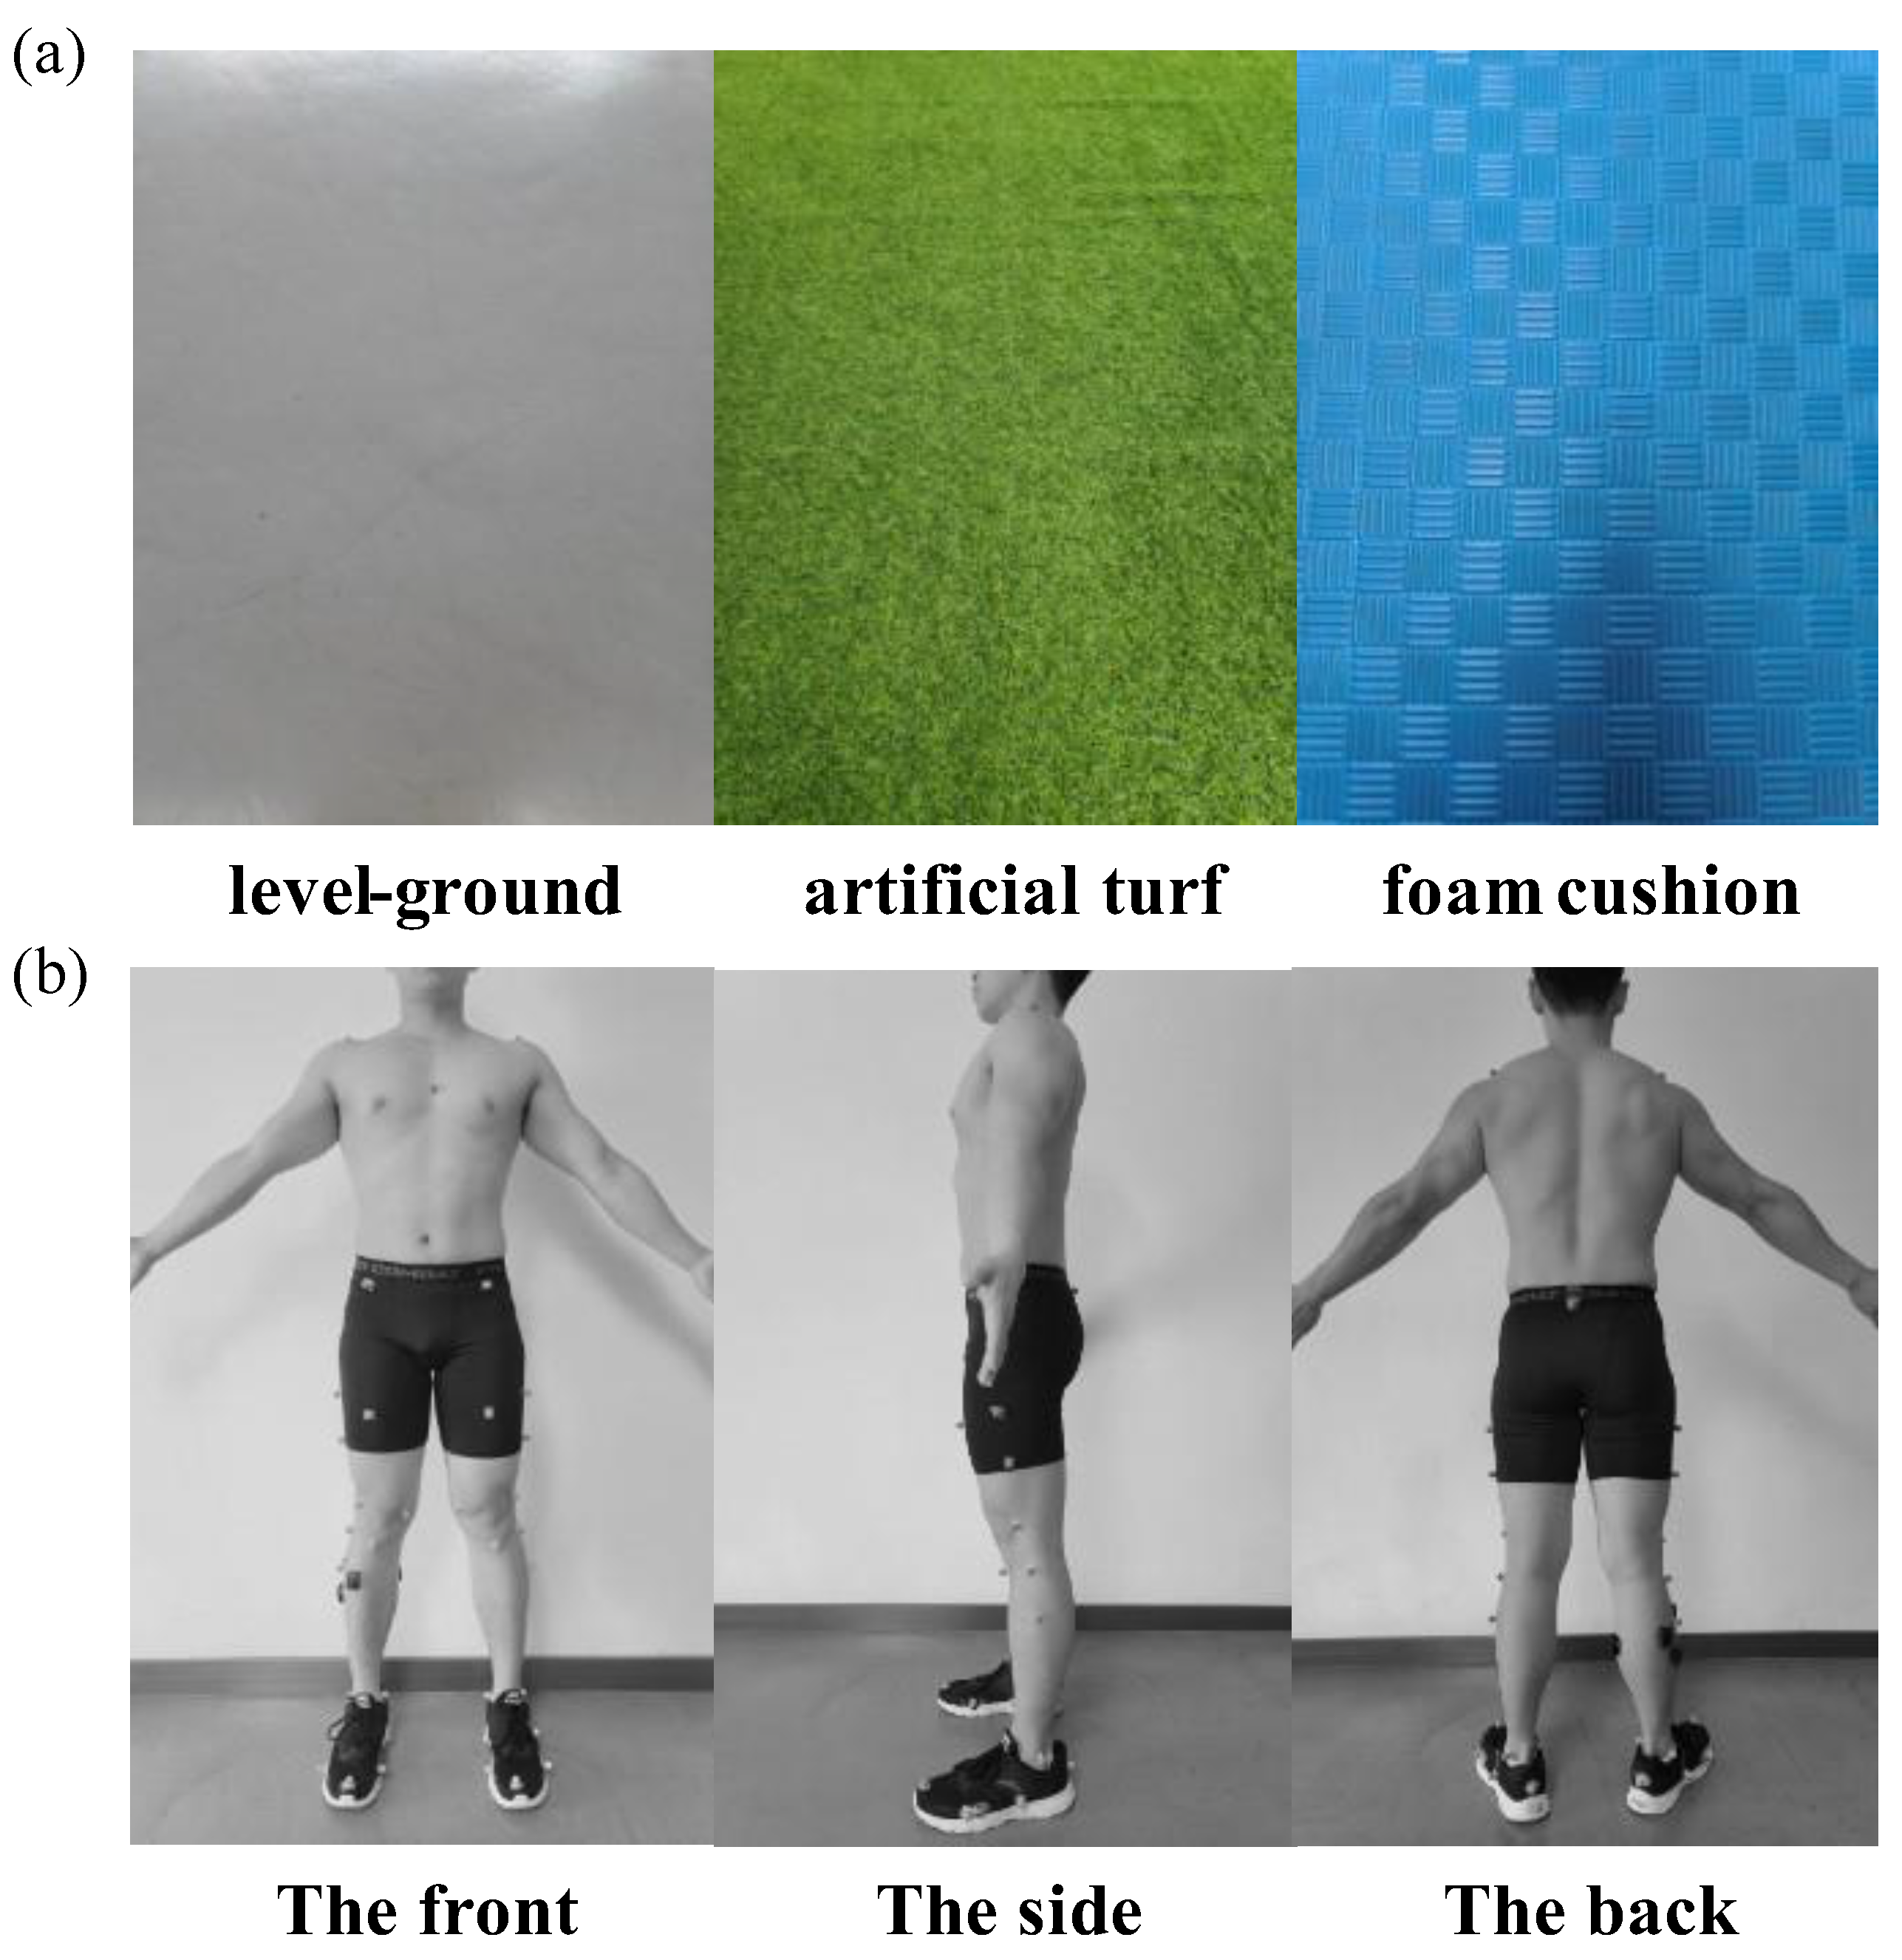
Figure 2.
Comparison of activation of tibialis anterior, peroneus longus, gastrocnemius medial and gastrocnemius lateral measured by static optimization estimation (black line) and filtered EMG signals (blue) during the walk, jog and fast run. Walk denotes normal walk, Jog denotes jog at 2.68 m/s, and Run denotes fast run.
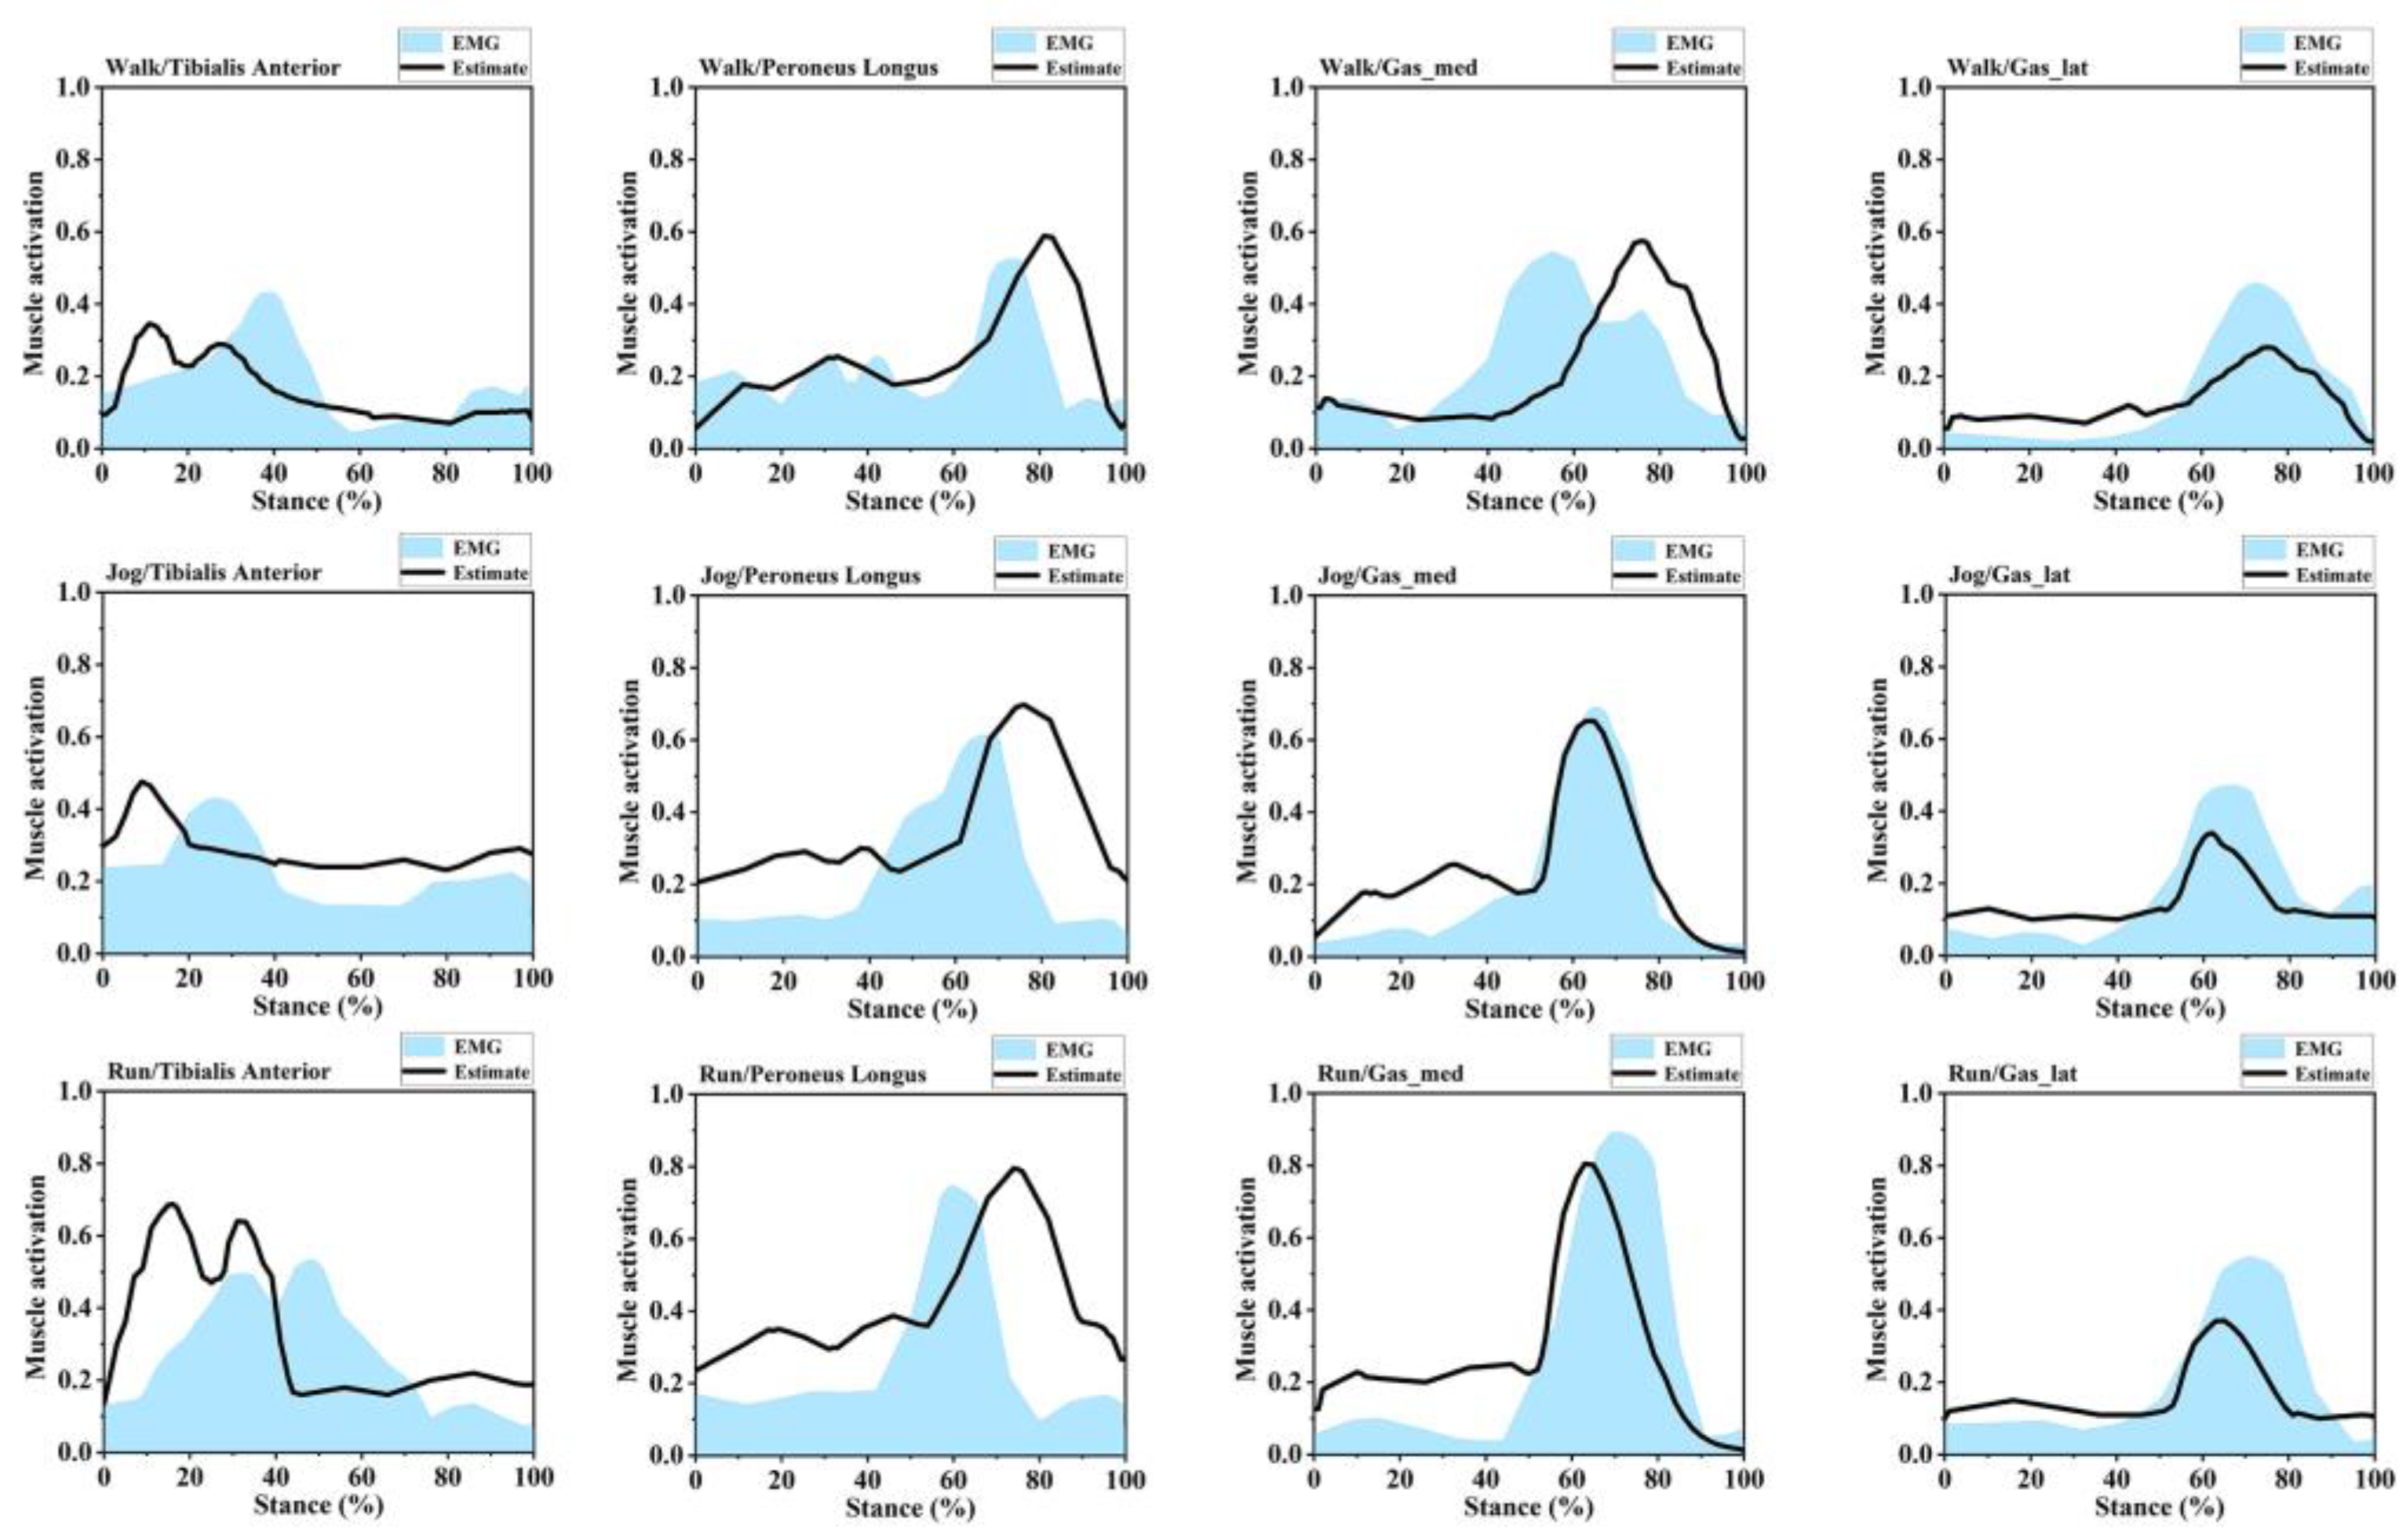
Figure 3.
Mean normalized muscle activation of participants post training in LG, AT, and FC during walk, jog, and fast run. *Indicates significant differences between the two groups. (a) Mean normalized muscle activation during the walk; (b) Mean normalized muscle activation during the jog; (c) Mean normalized muscle activation during the run; Orange indicates LG training, green indicates AT training, purple indicates FC training; TA, tibialis anterior; PL, peroneus longus; GM, gastrocnemius medial; GL, gastrocnemius lateral.
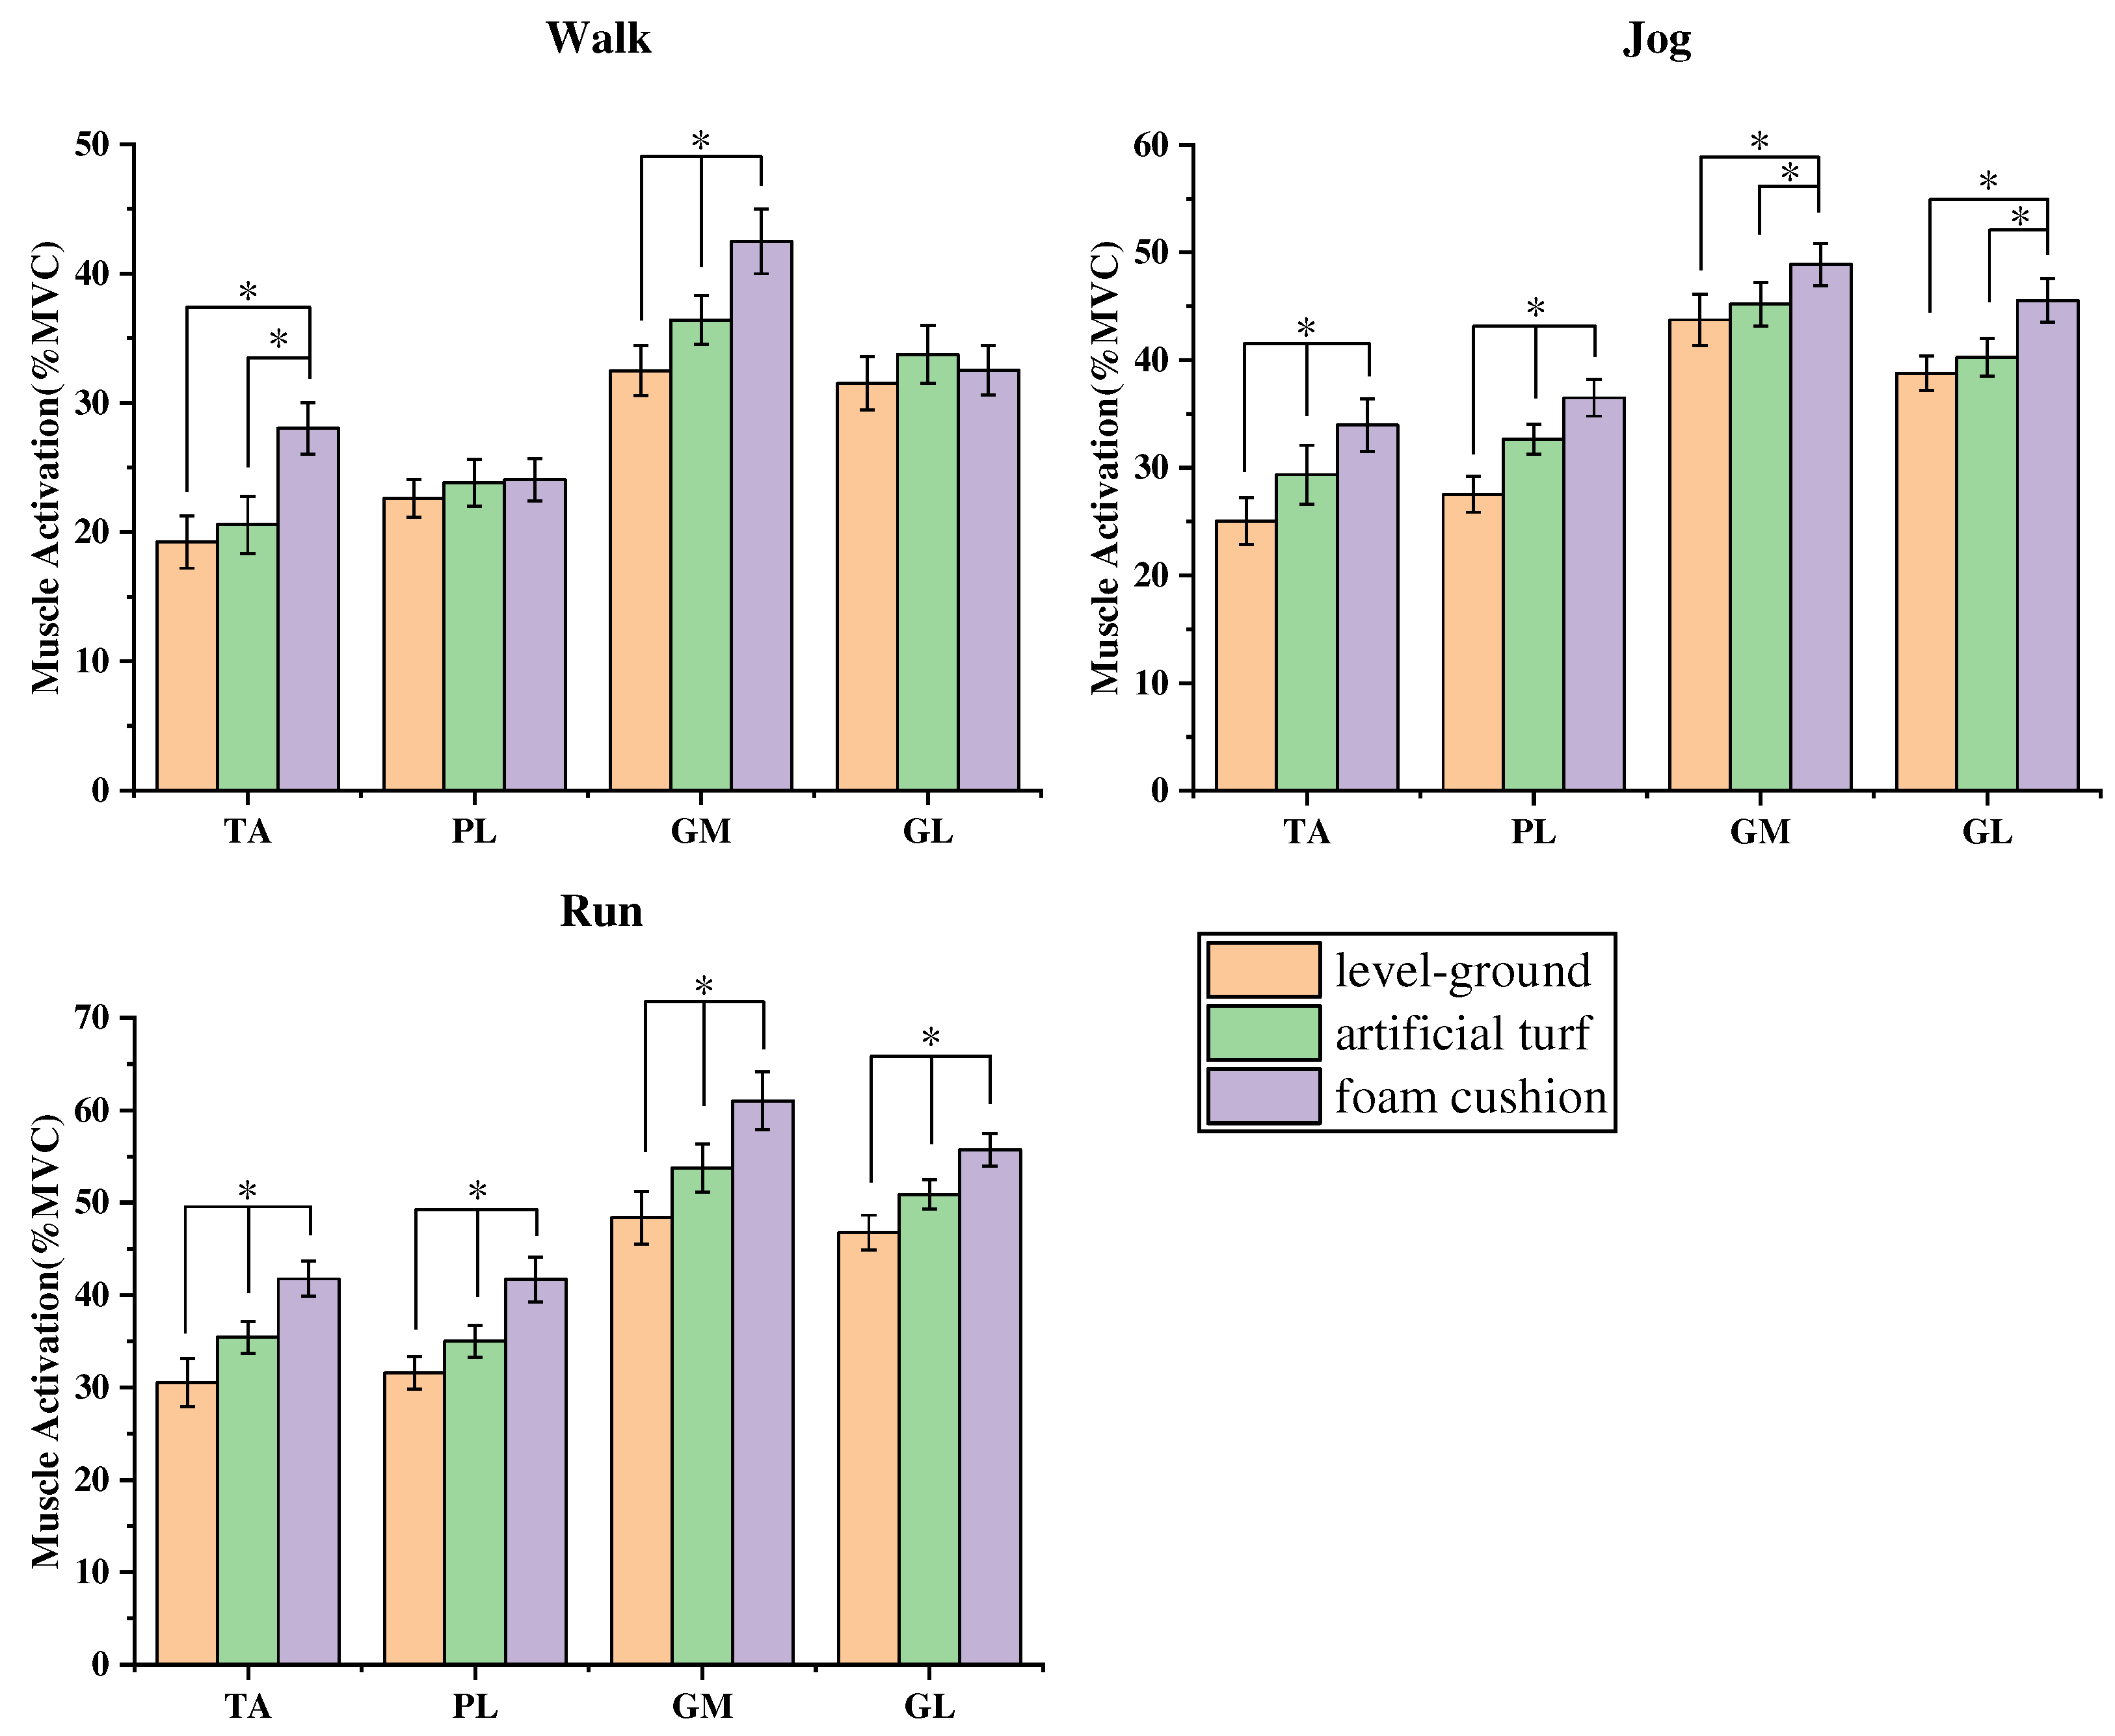
Figure 4.
Post LG, AT, and FC training, the mean and standard deviation of waveform changes in ankle joint moment, subtalar joint angle, and ankle sagittal plane angle during walk, jog, and fast run. (a) Ankle joint DF/PF moment during stance phase of walk; (b) Ankle joint DF/PF moment during stance phase of jog; (c) Ankle joint DF/PF moment during stance phase of fast run;(d) Subtalar joint INV/EVE during stance phase of walk; (e) Subtalar joint INV/EVE during stance phase of jog; (f) Subtalar joint INV/EVE during stance phase of fast run; (g) Ankle joint DF/PF during stance phase of walk; (h) Ankle joint DF/PF during stance phase of jog; (i) Ankle joint DF/PF during stance phase of fast run; Red line denotes LG training, blue line denotes AT training, black line denotes FC training; Orange denotes significant difference in LG compared to AT in SnPM1d analysis, green denotes significant difference in LG compared to FC in SnPM1d analysis, and purple denotes significant difference in AT compared to FC in SnPM1d analysis. Walk denotes normal walk, Jog denotes jog at 2.68 m/s, and Run denotes fast run.
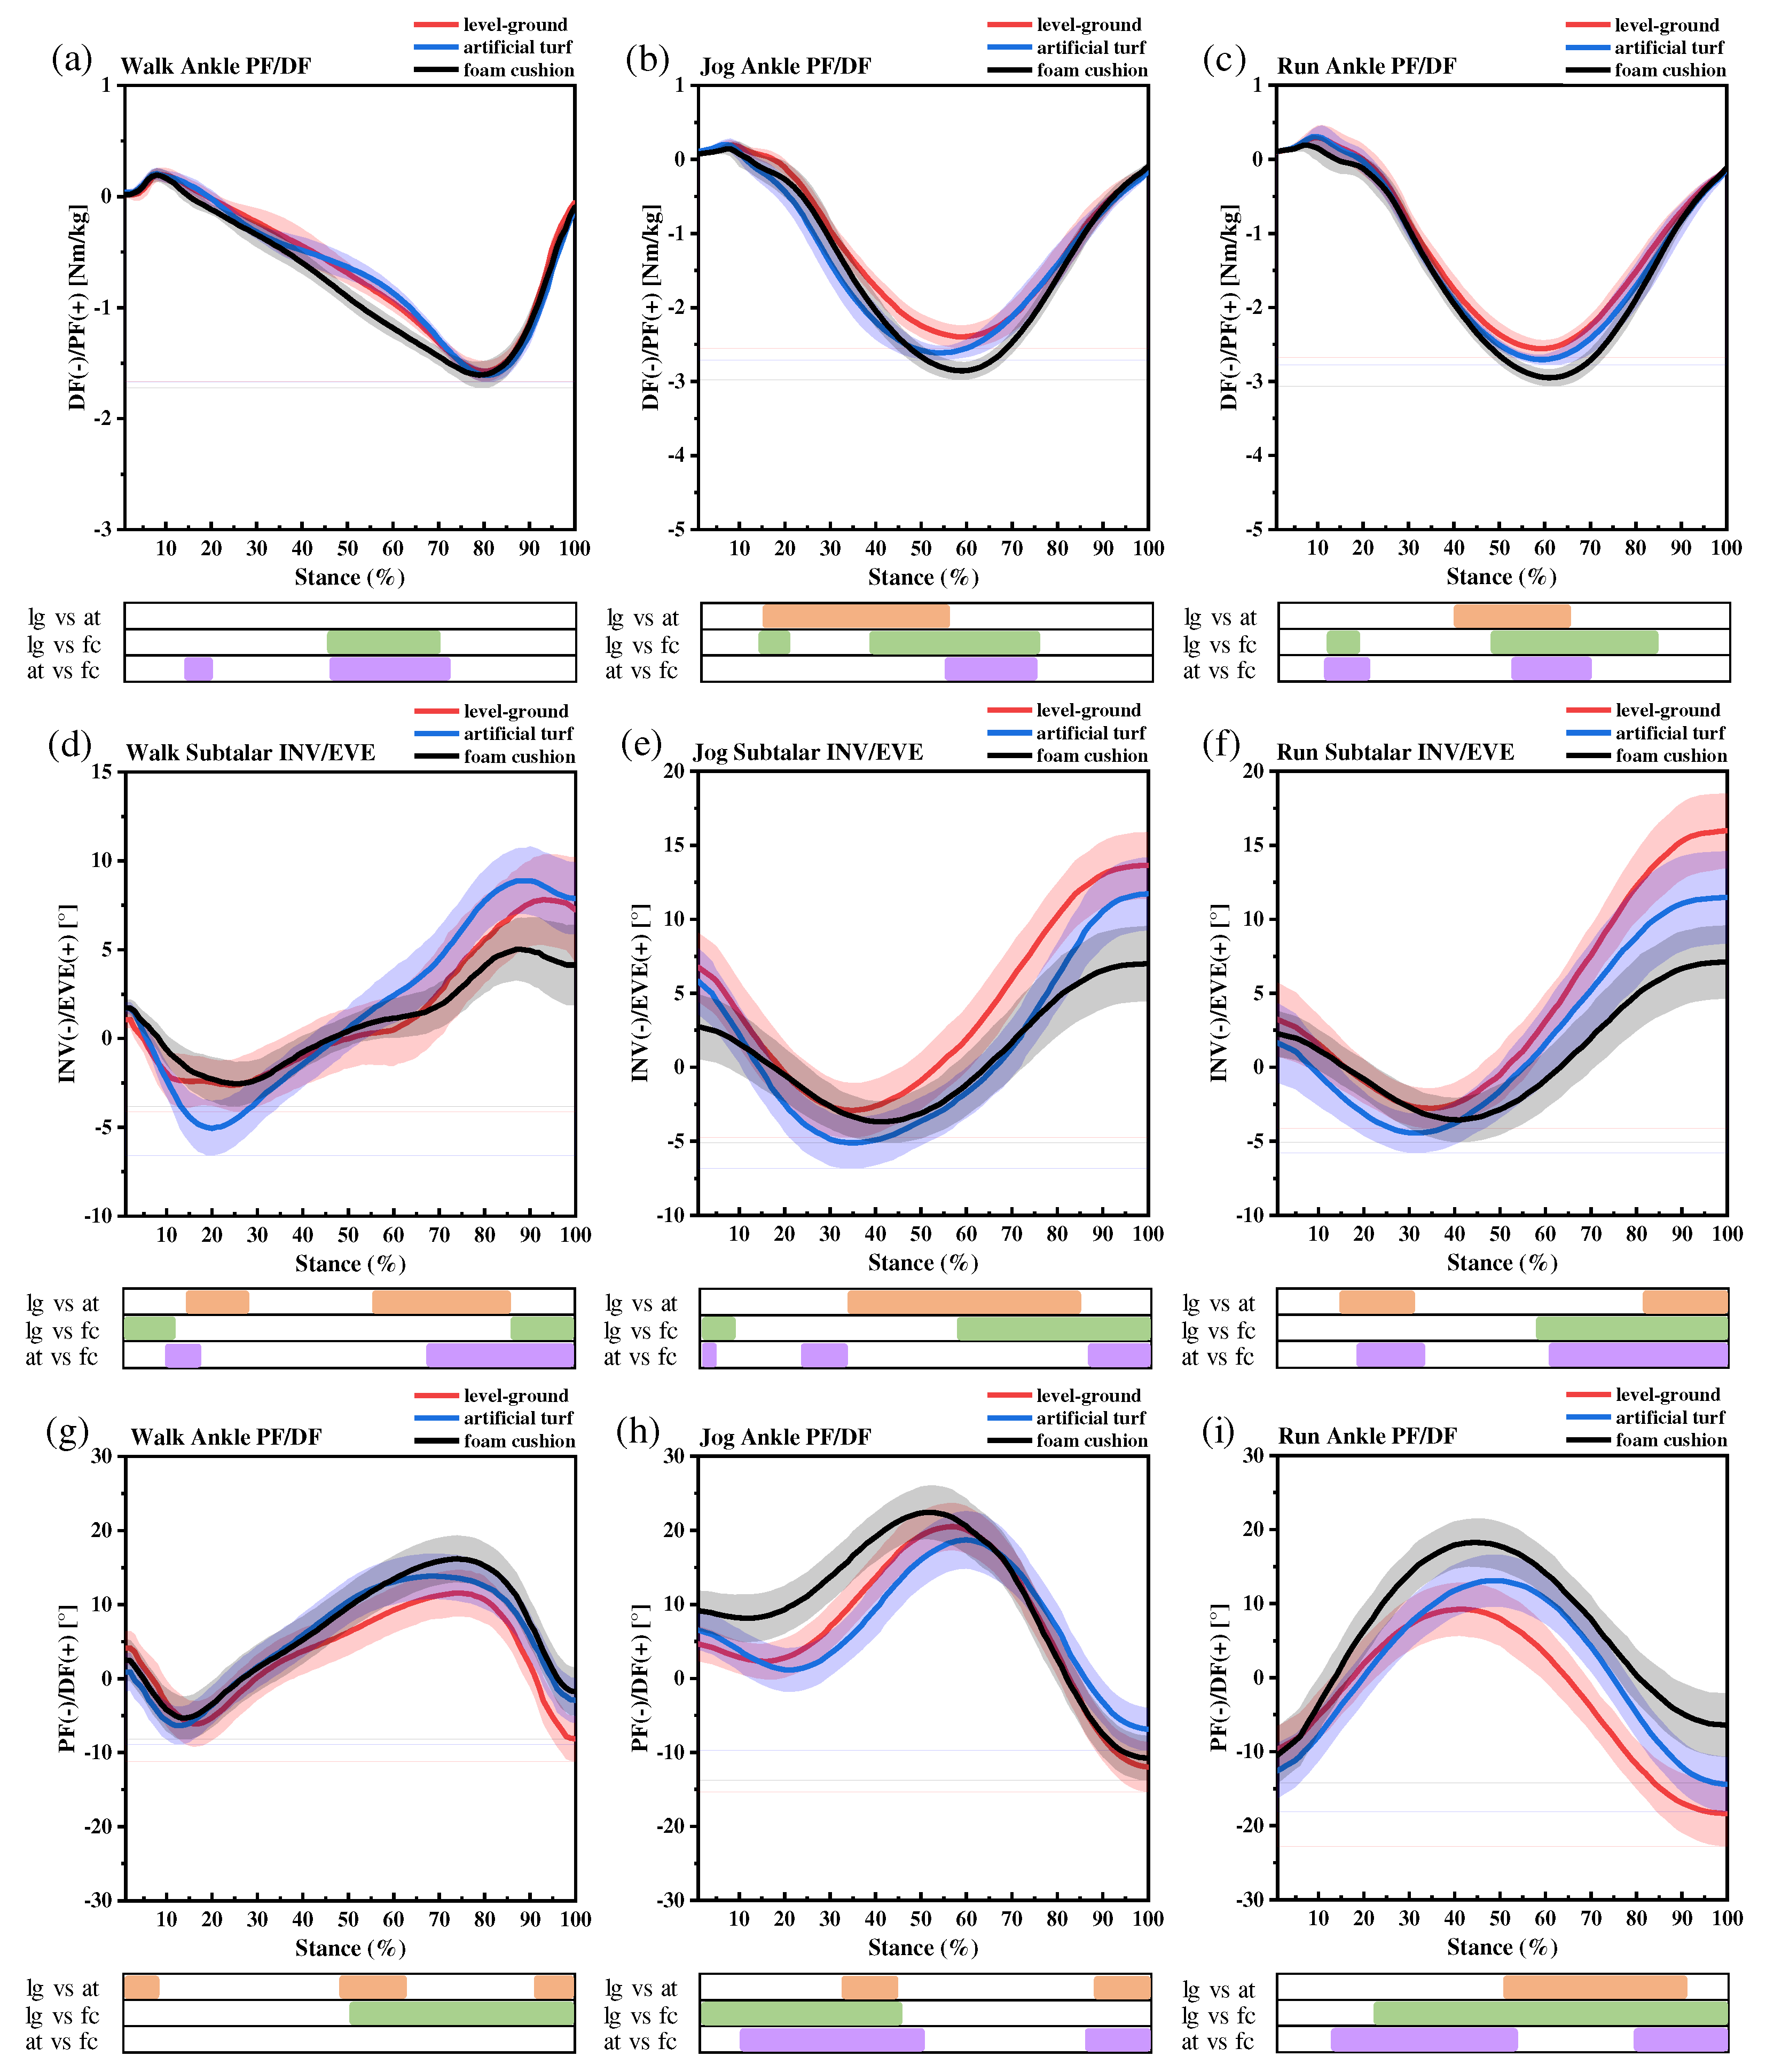

Table 1.
Neuromuscular training program.
| Program | Number of times | Group | Interval | Time |
|---|---|---|---|---|
| PF | 15 | 3 | 20s | 3min |
| DF | 15 | 3 | 20s | 3min |
| lunge | 16 | 2 | 60s | 3min |
| vertical jump | 15 | 2 | 60s | 3min |
| lateral jump | 15 | 2 | 60s | 3min |
Table 2.
Peak ankle PF moment under different movement conditions.
| Joint Moments (Nm/kg) | LG | AT | FC | |
|---|---|---|---|---|
| Walk | Ankle PF | 1.58±0.10 | 1.62±0.06 | 1.61±0.12 |
| Jog | Ankle PF | 2.41±0.16bc | 2.65±0.09ac | 2.87±0.12ab |
| Run | Ankle PF | 2.51±0.12bc | 2.72±0.10ac | 2.96±0.17ab |
Note: a indicates a significant difference from LG, b indicates a significant difference from AT, and c indicates a significant difference from FC. Walk denotes normal walk, Jog denotes jog at 2.68 m/s, and Run denotes fast run.
Table 3.
Subtalar joint angles peak and mobility.
| Joint kinematics (°) | LG | AT | FC | ||
|---|---|---|---|---|---|
| Walk | Subtalar EVE | 8.10±2.67 | 9.01±1.86c | 5.14±1.84b | |
| Subtalar INV | 3.14±1.54 | 5.12±1.52 | 2.82±1.01 | ||
| Subtalar mobility | 11.24±3.08 | 14.13±2.40c | 7.96±2.10b | ||
| Jog | Subtalar EVE | 13.63±1.34c | 11.72±1.86c | 7.20±2.47ab | |
| Subtalar INV | 2.97±0.94b | 5.15±0.93a | 3.88±1.37 | ||
| Subtalar mobility | 16.60±1.64c | 16.87±2.08c | 11.09±2.83ab | ||
| Run | Subtalar EVE | 15.97±1.59bc | 11.47±3.12a | 7.19±2.49a | |
| Subtalar INV | 2.84±1.55 | 4.51±1.29 | 3.65±1.49 | ||
| Subtalar mobility | 18.81±2.22c | 15.98±3.37c | 10.84±2.90ab | ||
Note: a indicates a significant difference from LG, b indicates a significant difference from AT, and c indicates a significant difference from FC. Walk denotes normal walk, Jog denotes jog at 2.68 m/s, and Run denotes fast run.
Table 4.
Ankle sagittal plane angle peak and mobility.
| Joint kinematics (°) | LG | AT | FC | ||
|---|---|---|---|---|---|
| Walk | Ankle DF | 10.10±2.73c | 13.18±2.35 | 15.14±2.58a | |
| Ankle PF | 6.64±2.18 | 7.37±1.88 | 5.05±1.79 | ||
| Ankle mobility | 17.74±3.49 | 20.55±3.01 | 20.19±3.14 | ||
| Jog | Ankle DF | 18.58±2.61c | 16.71±2.87c | 22.52±2.67ab | |
| Ankle PF | 12.78±2.69b | 7.90±2.36ac | 12.04±2.54b | ||
| Ankle mobility | 31.36±3.75b | 24.61±3.72ac | 34.56±3.69b | ||
| Run | Ankle DF | 7.14±2.73bc | 13.25±3.04ac | 18.44±2.62ab | |
| Ankle PF | 18.41±2.70c | 14.49±2.74c | 8.38±2.98ab | ||
| Ankle mobility | 25.55±3.84 | 27.74±4.09 | 26.82±3.97 | ||
Note: a indicates a significant difference from LG, b indicates a significant difference from AT, and c indicates a significant difference from FC. Walk denotes normal walk, Jog denotes jog at 2.68 m/s, and Run denotes fast run.
Disclaimer/Publisher’s Note: The statements, opinions and data contained in all publications are solely those of the individual author(s) and contributor(s) and not of MDPI and/or the editor(s). MDPI and/or the editor(s) disclaim responsibility for any injury to people or property resulting from any ideas, methods, instructions or products referred to in the content. |
© 2024 by the authors. Licensee MDPI, Basel, Switzerland. This article is an open access article distributed under the terms and conditions of the Creative Commons Attribution (CC BY) license (http://creativecommons.org/licenses/by/4.0/).
Copyright: This open access article is published under a Creative Commons CC BY 4.0 license, which permit the free download, distribution, and reuse, provided that the author and preprint are cited in any reuse.


