
Submitted:
08 January 2024
Posted:
08 January 2024
You are already at the latest version
Abstract
This paper presents a numerical study on the laser shock wave propagation in a 3D woven CFRP material by means of detailed and homogenized FE models. The aim of the study is to numerically characterize the shock wave response of the 3D woven CFRP in terms of back face velocity profiles and the induced damage and to investigate whether the detailed FE models could be replaced by homogenized FE models. The 3D woven geometry was designed using the TexGen software, while the numerical analyses were executed using the LS-Dyna explicit FE software. A high-strain rate behavior was considered for the matrix. The fiber bundles in the detailed models were modeled as a high fiber content unidirectional composite laminate, with its mechanical properties calculated by micromechanical equations. Both for the fiber bundles of the detailed model and the homogenized models a progressive damage material model was applied. The results of the detailed model reveal a considerable effect of material’s architecture on the shock wave propagation and the sensitivity of the back face velocity profile to the spot location. Consequently, the homogenized model is not capable of accurately simulating the shock wave response of the 3D woven composite. Moreover, the detailed predicts with high accuracy matrix cracking in the resin-rich areas and in the bundles as well as fiber failure. On the contrary, the homogenized model predicts matrix cracking at the same areas and no fiber failure.
Keywords:
3D woven composites
; Laser shock
; Finite element analysis
; Shock wave modeling
1. Introduction
Novel aircraft engine fan blades utilize a multi-material structure composed of a 3D woven CFRP core partially covered by an adhesively bonded thin metallic layer. The end-of-life management (reuse or recycle) of such a configuration involves many challenges, with one of them being the disassembly of the components [1,2,3,4]. Numerous methodologies have been explored to address the debonding challenge, encompassing various physical and chemical phenomena [5]. However, many of these methods have been proved less suitable in scenarios involving composite materials, especially when the preservation of the integrity of the materials is essential. Recent developments on the laser-shock technique have revealed the potential of the method to be used for disassembly of adhesively bonded CFRP and metallic parts [6]. One advantage of this method is it’s the precise load application at the bondline by calibrating the laser parameters [6].
The laser-shock technique involves the interaction between a high-power beam laser and a target material. This interaction initiates a plasma expansion process, induced by the recoil momentum of the ablated material, resulting in a pulsed pressure. Notably, when plasma expansion occurs within a confinement regime, where the dielectric material is transparent to the laser, both the pressure level and duration are increased. Thus, an elastic precursor shock followed by an elastic-plastic compression shock is generated and propagates in the material. After the plasma expansion, the surface unloads, and a plastic-decompression shock alongside an elastic-plastic decompression shock starts to propagate, creating a release wave. When the release wave interacts with the elastic precursor shock wave, it creates high localized tensile stresses. Demonstrating versatility, this technique has already been successfully used to induce controlled delamination in composite materials [7], paint stripping on metallic and composite substrates [6,8,9].
In [6], the authors have demonstrated experimentally for the first time the application of the laser shock technique for the disassembly of adhesively bonded CFRP/metallic coupons. To get a deeper insight of the physical mechanisms and to understand the role of the parameters that must be calibrated in order for the achieve debonding without damaging the CFRP part, a numerical simulation model of the process has been developed in [10]. Although that model has served its role efficiently a careful look at the numerical and experimental findings brings the need for a more detailed understanding of the shock wave propagation in the 3D woven CFRP material and for a validation of the predicted induced damage state.
In recent years, there have been reported several simulation attempts of the laser-shock process [8,9,10,11,12,13], with most of them focusing on the use of homogenized models to investigate or optimize the stress field in specific areas. While for metallic materials, there have been a few works studying in detail the laser shock wave propagation, such as the work of [14], for composites, and especially for 3D woven composites, there is a notable gap.
On the other hand, the extension of use of 3D woven composites in engineering applications has raised the need for developing reliable simulation models. Two useful reviews of such models can be found in [15]. While for simple geometries and loading conditions homogenized models [16] are sufficiently efficient, and at the same time very fast and easy to be developed, for complicated geometries and dynamic loading conditions [17,18], detailed models are needed. If the mechanical behavior of structural parts or structures is to be simulated, multi-scale models are used. Such models usually employ homogenization of a representative volume element which represents the exact geometry of the 3D woven composite [19,20,21,22,23,24,25,26]. Additionally, Meso-scale modeling has been applied to study structural components of bi-axial weft-knitted composites in [27]. Only one paper has been published on the modeling of shock loading of 3D woven composites. In that paper, Pankow et al. [28] have developed FE models to simulate the deformation response and damage development of 3D glass-reinforced composites subjected to shock loading. Two models were presented; the first comprised of a layered homogenous model and in the second model each layer is represented to capture the interactions between fiber tows and matrix, considering the discrete non-homogeneous material distribution in each layer.
In this paper, we have developed a detailed model to study the mechanical response of a 3D woven composite subjected to laser shock loading and to assess the efficiency of a homogenized model used for the same purpose.
2. Materials and Methods
2.1. Detailed FE Model
2.1.1. Design of the 3D Woven Geometry
The 3D woven geometry was designed in TexGen [29] using the Python code. The specimen's woven pattern comprises two noticeably distinct sections: the bulk and the surface. Combining these elements into a unified woven model necessitates the utilization of the scripting features of the TexGen software [29]. Initially, a layer-to-layer 3D weave is established to develop the bulk structure of the specimen. This procedure is direct and extensively detailed in the scripting manual, available on the TexGen website. To incorporate the top and bottom layer in the designed model, each yarn is designed individually. The implementation subroutine has been created parametrically in relation to the yarn dimensions and the inputs required are the positions of the offset for each layer, as it is described by Figure 1, and the identification numbers of the yarn. The geometrical parameters such as the warp dimensions and the gap distances are the global parameters that are used for the whole script. The nodes are progressively denser, while approaching the curvature of the offset and their position underneath the wrap fiber bundle, for the top binders, or on top of the wrap bundle, for the bottom binders follows the super-ellipse shape of the wrap bundle’s cross section. The node’s coordinates for the super-ellipse, and , are calculated by [30]
where, h is the height of the super-ellipse, n is the order of the ellipse and t is a local variable ranging from 0-1 indicating the start and end of the super-ellipse. Combining the two geometries using the LayeredTextile function, the final geometry of the 3D woven composite, shown in Figure 2, was created.
2.1.2. Meshing of the Detailed Model
The model's discretization employs voxel elements which have been proven to be accurate even in the presence of high curvature in certain binder yarns [31]. This choice was based on two primary considerations. Firstly, the utilization of voxel elements permits the application of the advanced material models which are detailed in Section 4, and secondly, the voxel elements offer a more uniform distribution of stresses through the material's thickness compared to tetrahedral elements. The meshing process was conducted within the TexGen software and subsequently exported as an Abaqus file, which was then imported into the LS-Dyna. Specifically, the voxel elements employed in the model utilize ELFORM 1, which is a constant stress solid element.
The aforementioned process exhibits inherent limitations that warrant careful consideration. Specifically, the LS-Prepost software encounters challenges in converting the exported Abaqus input file to an LS-Dyna key file for denser meshes. Considering the scale of the geometry that was described in Section 2, it is not difficult to exceed the software capabilities. The conversion process’s upper limit is not described in any of the manuals, but from rigorous testing utilizing different high-performance computer systems it was concluded that the software was not designed to manage large file conversions. To address the issue, a reduced geometry was employed to conduct a mesh density study. The dimensions of the reduced model are 10 mm by 10 mm, which encloses the center of the original model, while preserving the full thickness.
2.1.3. Mesh Density Study for the Detailed Model
The selection of the mesh density in the detailed FE model is a trade-off process among the accurate representation of the woven structure of the material, the accuracy of the computed results and the capabilities and restrictions of the conversion software. To evaluate the effect of mesh density, square and rectangular elements of different sizes have been considered. The rectangular elements, although have an increased aspect ratio, allow for a more accurate modeling of the bundle’s curvature. Table 1 provides the details of the elements. Figure 3 shows the square and rectangular FE meshes of the reduced geometry of the 3D woven composite.
The evaluation of the different meshes was done in terms of back-face velocity measurements. The corresponding back-face velocity diagrams are compared in Figure 4. As shown, there is a minor effect of the mesh density. The shock wave velocity, derived from the shock front's arrival time, remains constant, indicating that the through-the-thickness stiffness remains unaffected by changes in the mesh size. The rectangular meshes R1 and R2 exhibit a marginal increase in the first reflected pulse, while the initial peak remains unaltered. In mesh SQ3, in some boundaries of the bundles, isolated elements have been created as can be seen in Figure 5, which is a known issue in coarse voxel meshes [32]. Considering these factors and the absence of substantial deviations noted in the mesh density study, the selected mesh for the simulations is the R1, which results to a final model comprised of 6.6 million elements. Figure 6 depicts the final FE mesh of the wrap and binder bundles.
Another crucial parameter in the accuracy of the FE model is the detailed description of the fiber bundles’ geometry. This depends on the proper description of material directions, particularly for the binder yarns that present high curvature and, in some regions, appear to be almost vertical. The description of the material direction in the model requires adding a curve that follows the geometry of the binders, for each binder separately, and rotating the local coordinate system of each according to the angle defined by the position of the element on the curve. Figure 7 illustrates a highly complex binder yarn and its respective material direction at each element.
2.2. Homogenized FE Model
The homogenized FE model was created by means of the LS-PrePost also using ELFORM 1 constant stress solid elements. The element shape and size were selected accordingly so as to enable a direct comparison with the detailed model. The FE mesh of the homogenized model is shown in Figure 8.
2.3. Material Models
2.2.1. Fiber Bundles
The fiber bundles were modeled as a high fiber content unidirectional composite. In order to model the composite bundles in LS-Dyna, MAT_162 was used. This material model is characterized by strain rate dependent constants and a progressive damage formulation. Both unidirectional and woven composite configurations can be applied within the framework of this constitutive model. To describe the failure mechanisms of composite materials, a variety of failure criteria can be incorporated into the MAT_162 formulation. Specifically, the model can simulate fiber failure, matrix damage, and delamination phenomena under various loading scenarios, including opening, closure, and sliding modes of failure. The degradation of material properties is accounted for by using a damage parameter in the stiffness matrix, which controls the progressive reduction in material strength and stiffness. A more detailed explanation of the material model can be found in [33].
The homogenized mechanical properties of the fiber bundles were determined using the the Chamis micromechanical equations [34]. The elastic modulus of the composite in the longitudinal direction was calculated by
where and are the elastic moduli of the fiber in the longitudinal direction and the matrix respectively, and and indicate the fiber and matrix content. The elastic moduli in the transverse and normal directions are considered equal and were calculated by
where is the fiber’s transverse elastic modulus. The shear moduli were derived by
where indicates the shear modulus of the matrix, and and the shear moduli of the fiber. Additionally, the micromechanical equations for the Poisson’s ratios are
where, and are the Poisson’s ratios for the fibers describing the planes of 1-2 and 1-3 respectively. is the Poisson’s ratio of the matrix and , are the homogenized elastic moduli for the directions parallel and perpendicular to the fibers respectively. Finally, the equations that calculate the homogenized strength properties of the composite are the following
where, the subscript indicates the tensile and the compressive properties respectively. is the tensile strength of the fibers and , are the tensile and compressive strengths of the matrix respectively, indicates the shear strength of the matrix. , , are stress concentration factors that can be derived from literature [35]. The mechanical properties of the IM7 fibers are listed in Table 2.
Regarding the 2896 epoxy matrix, the mechanical properties were primarily derived from the data sheet of the manufacturer and are listed in Table 3. Notably, the manufacturer did not specify the shear strength. Consequently, an assumption was made, aligning it with the comparable epoxy matrix LY556, acquired from bibliographic sources. Finally, the calculated mechanical properties of the fiber bundles, considering a high fiber content of 90% (), are listed in Table 4.
2.2.2. Matrix
The matrix was modeled using the elastoplastic material model 81 of LS-Dyna. This model applies an elasto-visco-plastic material behavior, allowing the users to define stress-strain curves that may exhibit a strain rate dependency. Also, this model accommodates the influence of damage preceding rupture, primarily based on the measure of the effective plastic strain. The stress-strain curve that is imported into the material model describes a bilinear elastic-plastic behavior. The yield stress of the 2896 epoxy matrix is not available in the literature; thus, an assumption was made based on the available data. As presented in Table 3, the known properties of the matrix are the stress and strain at fracture, as well as the elastic modulus. In order to combine them into an elastic-plastic curve an assumed yield stress needs to be calculated using the available elastic modulus. The strain for the calculation was chosen to be 30% of the fracture strain in order to obtain a yield stress that is lower than the tensile strength.
The laser-shock process is characterized by very high strain rates. Therefore, modification of material properties is required. In this context, maintaining a consistent adjustment of the material properties with strain rate across material models is essential. To achieve this, the same strain rate dependency formulations that are utilized for the properties of the composite bundles using MAT_162 are also employed for the modification of the matrix properties. Specifically, the elastic modulus and strength of the matrix material were determined according to [33] using
where a dynamic property, that is denoted by the subscript d, is calculated at a specified strain rate using the quasi-static property, denoted by the subscript qs, that has been measured at the reference strain rate . Evidently, there is a lack of high strain rate experiments for the required epoxy matrix. In order to calculate the strain rate coefficients, strain rate dependent properties of a similar, well-studied, epoxy resin were utilized. The data for the LY 556 material that were used to correlate the increase in the elastic modulus and strength with the strain rate are listed in Table 5. The least squares methodology was applied for the fitting of the data and the determination of the two Crates. The calculated values are 0.05 and 0.07 for the and respectively. The comparison of the experimental and computed values of the elastic modulus and strength with the strain rate is presented in Figure 9.
The previously mentioned methodology has given the Crates that were used to calculate the modified stress-strain curve of the matrix at a strain rate of 106/s, which is the developed strain rate in the laser-shock process. The modified stress-strain curve is presented in Figure 10.
2.2.3. Homogenized Model
The homogenized model also employed MAT_162, incorporating the composite's homogenized properties in the formulation of a standard woven composite that is provided by the material model. These properties, that are well-tuned for laser shock applications, have been effectively validated against experimental back-face velocity measurements. Furthermore, accurate properties of the 3D woven composite at high strain rates were obtained through a comprehensive experimental campaign using the Split-Hopkinson apparatus in [10].
2.4. Laser Shock Modeling
In the laser shock experimental process, a protective, sacrificial layer is used on the top surface of the CFRP specimen. In this context, a thin aluminum layer was modeled on top of the 3D woven material, both in the detailed and the homogeneous models. The shock loading was modeled as a pressure on a circular spot with a diameter of 4 mm as shown in Figure 11. The pressure loading is following the normalized temporal profile shown in Figure 12, and the maximum pressure was calculated by [41]
where, I0 (GW/cm2) is the laser intensity, a is the part of the energy being used for the ionization, Z (g cm-2/s-1) is the relative acoustic impedance calculated by
where, and are the acoustic impedance of the material and the confinement respectively.
As due to the inhomogeneity of the 3D woven composite in the through-the-thickness direction a different shock wave response is expected at different normal paths of the wave, two spot locations were modeled: one causing a shock wave that intersects the fiber bundles and one causing a shock wave that passes mainly through the matrix areas.
3. Results
3.1. Shock Wave Propagation
A step-by-step comparative analysis of the shock wave propagation was conducted between the detailed and homogenized models, as depicted in Figure 13. When observing the normal stress σz stress at a cross-section during mid-loading, it is apparent that the behavior of the shock front and the subsequent release wave, resulting from the surface unloading, align closely in both simulations. Notably, in the detailed model the shock front is confined within a smaller area, likely due to the energy dissipation from numerous small reflections during material alterations. This effect tends to diminish the σz stress at the edges of the shock front, where its values are generally lower. Furthermore, at t = 4 x 10⁻⁶ s, where the two release waves, one traveling in the shock front's direction and the other occurring upon the shockwave's reflection at the material's back-face, converge, both models effectively depict the stress field. The primary difference between the models lies in the computed values of smaller stresses at the edges and tail of the shock wave.
In addition, the shock wave propagation was evaluated for both models by means of the back-face velocity computed at a singular node placed at the center of the loading region. The corresponding diagrams are compared in Figure 14. In the detailed model, spot 1 corresponds to the fiber bundles path and spot 2 to the matrix path. A similar wave arrival time is observed for both models. This is an indication of the efficient simulation of the elastic behavior by the models and more specifically, of the efficient modeling of the macroscopic through thickness properties of the 3D woven composite material. The two velocity curves predicted by the detailed model exhibit lower peak velocities. This can be ascribed to the increased energy dissipation of the additional reflections. In Figure 15, the shock wave propagation in the detailed model is compared for the two spots. For spot 2, additional reflections caused by the intersection of the wave with the binder bundles are visible. This explains the lower peak in the back-face velocity diagram for this spot.
3.2. Damage Accumulation
A big asset of the detailed model is the capability to predict even a minor damage, including matrix cracking between the fiber bundles and several damage modes within the bundles. Validation of the localized damage is very difficult as in most cases it is not observable in experiments. However, the insights offered by the detailed model can be proved highly advantageous in efforts aimed at preserving the composite's integrity during a disassembly process.
In the present laser shock simulations, the detailed model predicted only minor matrix cracking at the resin-rich area under the loaded surface (Figure 16), two matrix cracking modes within the bundles at the area below the loaded surface and at the opposite edge of the specimen (Figure 17 and Figure 18), and, finally, fiber damage in the bundles just below the loaded surface (Figure 19).
The homogenized model has predicted only matrix cracking, parallel and perpendicular to the fibers at the loaded area as shown in Figure 20. Contrary to the detailed model, no information is given by the homogenized model on whether the predicted damage is in the resin-rich areas or within the bundles. Moreover, the homogenized model did not predict any fiber damage, which is a significant omission.
4. Conclusions
To study in detail the laser shock loading of 3D woven composites, a detailed FE model was developed and compared with a homogenized model. Observations on the shock wave propagation were made in terms of normal stress contours and back-face velocity diagrams. Also, an in-depth examination of the induced damage was conducted in both models. From the implementation process and the numerical results, the following conclusions can be drawn.
Both models efficiently simulate the laser shock wave propagation and accurately describe the convergence of release waves in the 3D woven composite as it was revealed by the relatively good comparison between the computed back-face velocity diagrams and a corresponding experimental diagram. However, there are some considerable differences on the wave propagation between the two models. In the detailed model, more wave reflections take place, thus affecting the back-face velocity curve. Moreover, using the detailed model, the effect of spot location, which determines the shock propagation path, was revealed. When the wave intersects with more bundles more reflections take place, and the wave is delayed.
The detailed model predicted matrix cracking in the resin-rich areas and the fiber bundles and fiber failure, while the homogenized model predicted only matrix cracking whose exact location cannot be justified. Those differences are attributed to the capacity of the detailed model to compute more precisely the stresses at areas with geometrical variations, thus capturing the stress concentrations.
In terms of computational efficiency, the development of the homogenized model is much easier, while the homogenized model runs faster by 36% than the detailed model.
In conclusion, if the objective is to obtain an overview of the laser shock wave propagation process in order to adjust the laser parameters so as to create a customized delamination or a debonding, the homogenized model is sufficient. On the other hand, if the objective is to ensure that no damage is developed within the 3D woven composite and to study how the composite’s architecture affects the shock propagation process, then the detailed should be used.
Author Contributions
Conceptualization, K.T. and P.K.; methodology, K.T. and P.K.; software, P.K.; Investigation, P.K; writing—original draft preparation, P.K. and Κ.Τ.; writing—review and editing, Κ.Τ.; All authors have read and agreed to the published version of the manuscript.
Funding
This research received no external funding.
Data Availability Statement
Not applicable.
Conflicts of Interest
The authors declare no conflicts of interest.
References
- Revolutionizing Aircraft Materials and Processes; Pantelakis, S. , Tserpes, K., Eds.; Springer International Publishing: Cham, Switzerland, 2020; ISBN 978-3-030-35345-2. [Google Scholar]
- Tserpes, K. Adhesive Bonding of Aircraft Structures. In Revolutionizing Aircraft Materials and Processes; Pantelakis, S., Tserpes, K., Eds.; Springer International Publishing: Cham, Switzerland, 2020; pp. 337–357. ISBN 978-3-030-35345-2. [Google Scholar]
- Adhesive Bonding of Aircraft Composite Structures: Non-Destructive Testing and Quality Assurance Concepts; Leite Cavalcanti, W. , Brune, K., Noeske, M., Tserpes, K., Ostachowicz, W.M., Schlag, M., Eds.; Springer International Publishing: Cham, Switzerland, 2021; ISBN 978-3-319-92809-8. [Google Scholar]
- Stergiou, V.; Konstantopoulos, G.; Charitidis, C.A. Carbon Fiber Reinforced Plastics in Space: Life Cycle Assessment towards Improved Sustainability of Space Vehicles. J. Compos. Sci. 2022, 6, 144. [Google Scholar] [CrossRef]
- Srinivasan, D.V.; Idapalapati, S. Review of Debonding Techniques in Adhesively Bonded Composite Structures for Sustainability. Sustain. Mater. Technol. 2021, 30, e00345. [Google Scholar] [CrossRef]
- Kormpos, P.; Unaldi, S.; Berthe, L.; Tserpes, K. A Laser Shock-Based Disassembly Process for Adhesively Bonded Ti/CFRP Parts. Processes 2023, 11, 506. [Google Scholar] [CrossRef]
- Ghrib, M.; Berthe, L.; Mechbal, N.; Rébillat, M.; Guskov, M.; Ecault, R.; Bedreddine, N. Generation of Controlled Delaminations in Composites Using Symmetrical Laser Shock Configuration. Compos. Struct. 2017, 171, 286–297. [Google Scholar] [CrossRef]
- Papadopoulos, K.; Tserpes, K.; Unaldi, S.; Sma, I.; Berthe, L.; Karanika, A. Experimental and Numerical Investigation of the Laser Shock-Based Paint Stripping Process on CFRP Substrates. Opt. Laser Technol. 2024, 169, 110068. [Google Scholar] [CrossRef]
- Papadopoulos, K.; Tserpes, K. Analytical and Numerical Modeling of Stress Field and Fracture in Aluminum/Epoxy Interface Subjected to Laser Shock Wave: Application to Paint Stripping. Materials 2022, 15, 3423. [Google Scholar] [CrossRef]
- Kormpos, P.; Tserpes, K. An Efficient Numerical Model for the Simulation of Debonding of Adhesively Bonded Titanium/CFRP Samples Induced by Repeated Symmetric Laser Shocks. J. Adhes. 2023, 1–25. [Google Scholar] [CrossRef]
- Ünaldi, S.; Papadopoulos, K.; Rondepierre, A.; Rouchausse, Y.; Karanika, A.; Deliane, F.; Tserpes, K.; Floros, G.; Richaud, E.; Berthe, L. Towards Selective Laser Paint Stripping Using Shock Waves Produced by Laser-Plasma Interaction for Aeronautical Applications on AA 2024 Based Substrates. Opt. Laser Technol. 2021, 141, 107095. [Google Scholar] [CrossRef]
- Ecault, R.; Touchard, F.; Boustie, M.; Berthe, L.; Dominguez, N. Numerical Modeling of Laser-Induced Shock Experiments for the Development of the Adhesion Test for Bonded Composite Materials. Compos. Struct. 2016, 152, 382–394. [Google Scholar] [CrossRef]
- Tserpes, K.; Papadopoulos, K.; Unaldi, S.; Berthe, L. Development of a Numerical Model to Simulate Laser-Shock Paint Stripping on Aluminum Substrates. Aerospace 2021, 8, 233. [Google Scholar] [CrossRef]
- Ducousso, M.; Marmonier, M.; Cuenca, E.; Marchiano, R.; Coulouvrat, F.; Berthe, L. Acoustic Imaging of the Laser-Driven Shock Wave Propagation in Metallic Materials. 2020, 1. [CrossRef]
- Wielhorski, Y.; Mendoza, A.; Rubino, M.; Roux, S. Numerical Modeling of 3D Woven Composite Reinforcements: A Review. Compos. Part A: Appl. Sci. Manuf. 2022, 154, 106729. [Google Scholar] [CrossRef]
- Shah, S.Z.H.; Lee, J.; Megat-Yusoff, P.S.M.; Hussain, S.Z.; Sharif, T.; Choudhry, R.S. Multiscale Damage Modelling of Notched and Un-Notched 3D Woven Composites with Randomly Distributed Manufacturing Defects. Compos. Struct. 2023, 318, 117109. [Google Scholar] [CrossRef]
- Millen, S.L.J.; Dahale, M.; Fisher, T.; Samy, A.; Thompson, K.; Ramaswamy, K.; Ralph, C.; Archer, E.; McIlhagger, A.; Ullah, Z.; et al. Modelling Low-Velocity Impact Damage and Compression after Impact of 3D Woven Structures Considering Compaction. Compos. Struct. 2023, 318, 117104. [Google Scholar] [CrossRef]
- Guo, J.; Wen, W.; Zhang, H.; Cui, H. A Mesoscale Fatigue Progressive Damage Model for 3D Woven Composites. Int. J. Fatigue 2021, 152, 106455. [Google Scholar] [CrossRef]
- Yan, S.; Zeng, X.; Long, A. Meso-Scale Modelling of 3D Woven Composite T-Joints with Weave Variations. Compos. Sci. Technol. 2019, 171, 171–179. [Google Scholar] [CrossRef]
- Zhang, Y.; Tong, J.; Guo, Q.; Guo, J.; Liu, X.; Chen, L. Hierarchical Multiscale Analysis for 3D Woven Composite Leaf Spring Landing Gear. Thin-Walled Struct. 2023, 189, 110913. [Google Scholar] [CrossRef]
- Hang, C.; Cui, H.; Liu, H.; Suo, T. Micro/Meso-Scale Damage Analysis of a 2.5D Woven Composite Including Fiber Undulation and in-Situ Effect. Compos. Struct. 2021, 256, 113067. [Google Scholar] [CrossRef]
- Courtois, A.; Marcin, L.; Benavente, M.; Ruiz, E.; Lévesque, M. Numerical Multiscale Homogenization Approach for Linearly Viscoelastic 3D Interlock Woven Composites. Int. J. Solids Struct. 2019, 163, 61–74. [Google Scholar] [CrossRef]
- Zheng, T.; Huang, J.; Huang, K.; Yu, H.; Hong, C.; Guo, L. Different Effects of Interfacial Properties on the Tensile and Compressive Damage Mechanisms of 3D Woven Composites: Multiscale Damage Model and Numerical Comparative Study. Eng. Fract. Mech. 2023, 109741. [Google Scholar] [CrossRef]
- Zheng, T.; Guo, L.; Benedictus, R.; Pascoe, J.-A. Micromechanics-Based Multiscale Progressive Failure Simulation of 3D Woven Composites under Compressive Loading with Minimal Material Parameters. Compos. Sci. Technol. 2022, 219, 109227. [Google Scholar] [CrossRef]
- Leos, A.; Vasylevskyi, K.; Tsukrov, I.; Gross, T.; Drach, B. Evaluation of Process-Induced Residual Stresses in Orthogonal 3D Woven Composites via Nonlinear Finite Element Modeling Validated by Hole Drilling Experiments. Compos. Struct. 2022, 297, 115987. [Google Scholar] [CrossRef]
- Dhimole, V.K.; Chen, Y.; Cho, C. Modeling and Two-Step Homogenization of Aperiodic Heterogenous 3D Four-Directional Braided Composites. J. Compos. Sci. 2020, 4, 179. [Google Scholar] [CrossRef]
- Pham, M.Q.; Bollengier, Q.; Rabe, D.; Lang, T.G.; Häntzsche, E.; Trümper, W.; Cherif, C.; Gereke, T. Meso-Scale Finite Element Model for Rib-Stiffened Composites with Biaxial Weft-Knitted Reinforcements. J. Compos. Sci. 2023, 7, 175. [Google Scholar] [CrossRef]
- Pankow, M.; Waas, A.M.; Yen, C.-F.; Ghiorse, S. Shock Loading of 3D Woven Composites: A Validated Finite Element Investigation. Compos. Struct. 2011, 93, 1347–1362. [Google Scholar] [CrossRef]
- Advanced Weaving Technology; Kyosev, Y. , Boussu, F., Eds.; Springer International Publishing: Cham, Switzerland, 2022; ISBN 978-3-030-91514-8. [Google Scholar]
- Gardner, M. Mathematical Carnival: A New Round-up of Tantalizers and Puzzles from Scientific American; Vintage Books: New York, NY, USA, 1977; ISBN 978-0-394-72349-5. [Google Scholar]
- Doitrand, A.; Fagiano, C.; Irisarri, F.-X.; Hirsekorn, M. Comparison between Voxel and Consistent Meso-Scale Models of Woven Composites. Compos. Part A: Appl. Sci. Manuf. 2015, 73, 143–154. [Google Scholar] [CrossRef]
- Ma, D.; González-Jiménez, Á.; Giglio, M.; Dos Santos Cougo, C.M.; Amico, S.C.; Manes, A. Multiscale Modelling Approach for Simulating Low Velocity Impact Tests of Aramid-Epoxy Composite with Nanofillers. Eur. J. Mech. - A/Solids 2021, 90, 104286. [Google Scholar] [CrossRef]
- LS-DYNA Keyword User’s Manual, LS-DYNA R11, Volume I, II, III, Livermore Software Technology Corporation (LSTC).
- Chamis, Christos Simplified Composite Micromechanics Equations for Strength, Fracture Toughness and Environmental Effects. SAMPE Q. 1984, 15.
- Daniel, I.M.; Ishai, O. Engineering Mechanics of Composite Materials, 2nd ed.; Oxford University Press: New York, NY, USA, 2006; ISBN 978-0-19-515097-1. [Google Scholar]
- Shah, S.P.; Maiarù, M. Effect of Manufacturing on the Transverse Response of Polymer Matrix Composites. Polymers 2021, 13, 2491. [Google Scholar] [CrossRef] [PubMed]
- HEXCEL HexTow IM7 Product Data Sheet.
- 3M Matrix Resin 2894.
- MCA | Free Full-Text | Interval-Based Computation of the Uncertainty in the Mechanical Properties and the Failure Analysis of Unidirectional Composite Materials Available online:. Available online: https://www.mdpi.com/2297-8747/27/3/38 (accessed on 18 September 2023).
- Naik, N.K.; Shankar, P.J.; Kavala, V.R.; Ravikumar, G.; Pothnis, J.R.; Arya, H. High Strain Rate Mechanical Behavior of Epoxy under Compressive Loading: Experimental and Modeling Studies. Mater. Sci. Eng. A 2011, 528, 846–854. [Google Scholar] [CrossRef]
- Fabbro, R.; Peyre, P.; Berthe, L.; Scherpereel, X. Physics and Applications of Laser-Shock Processing. J. Laser Appl. 1998, 10, 265–279. [Google Scholar] [CrossRef]
Figure 1.
Schematic representation of the offset position.

Figure 2.
Iso view of the 3D woven block created in TexGen.
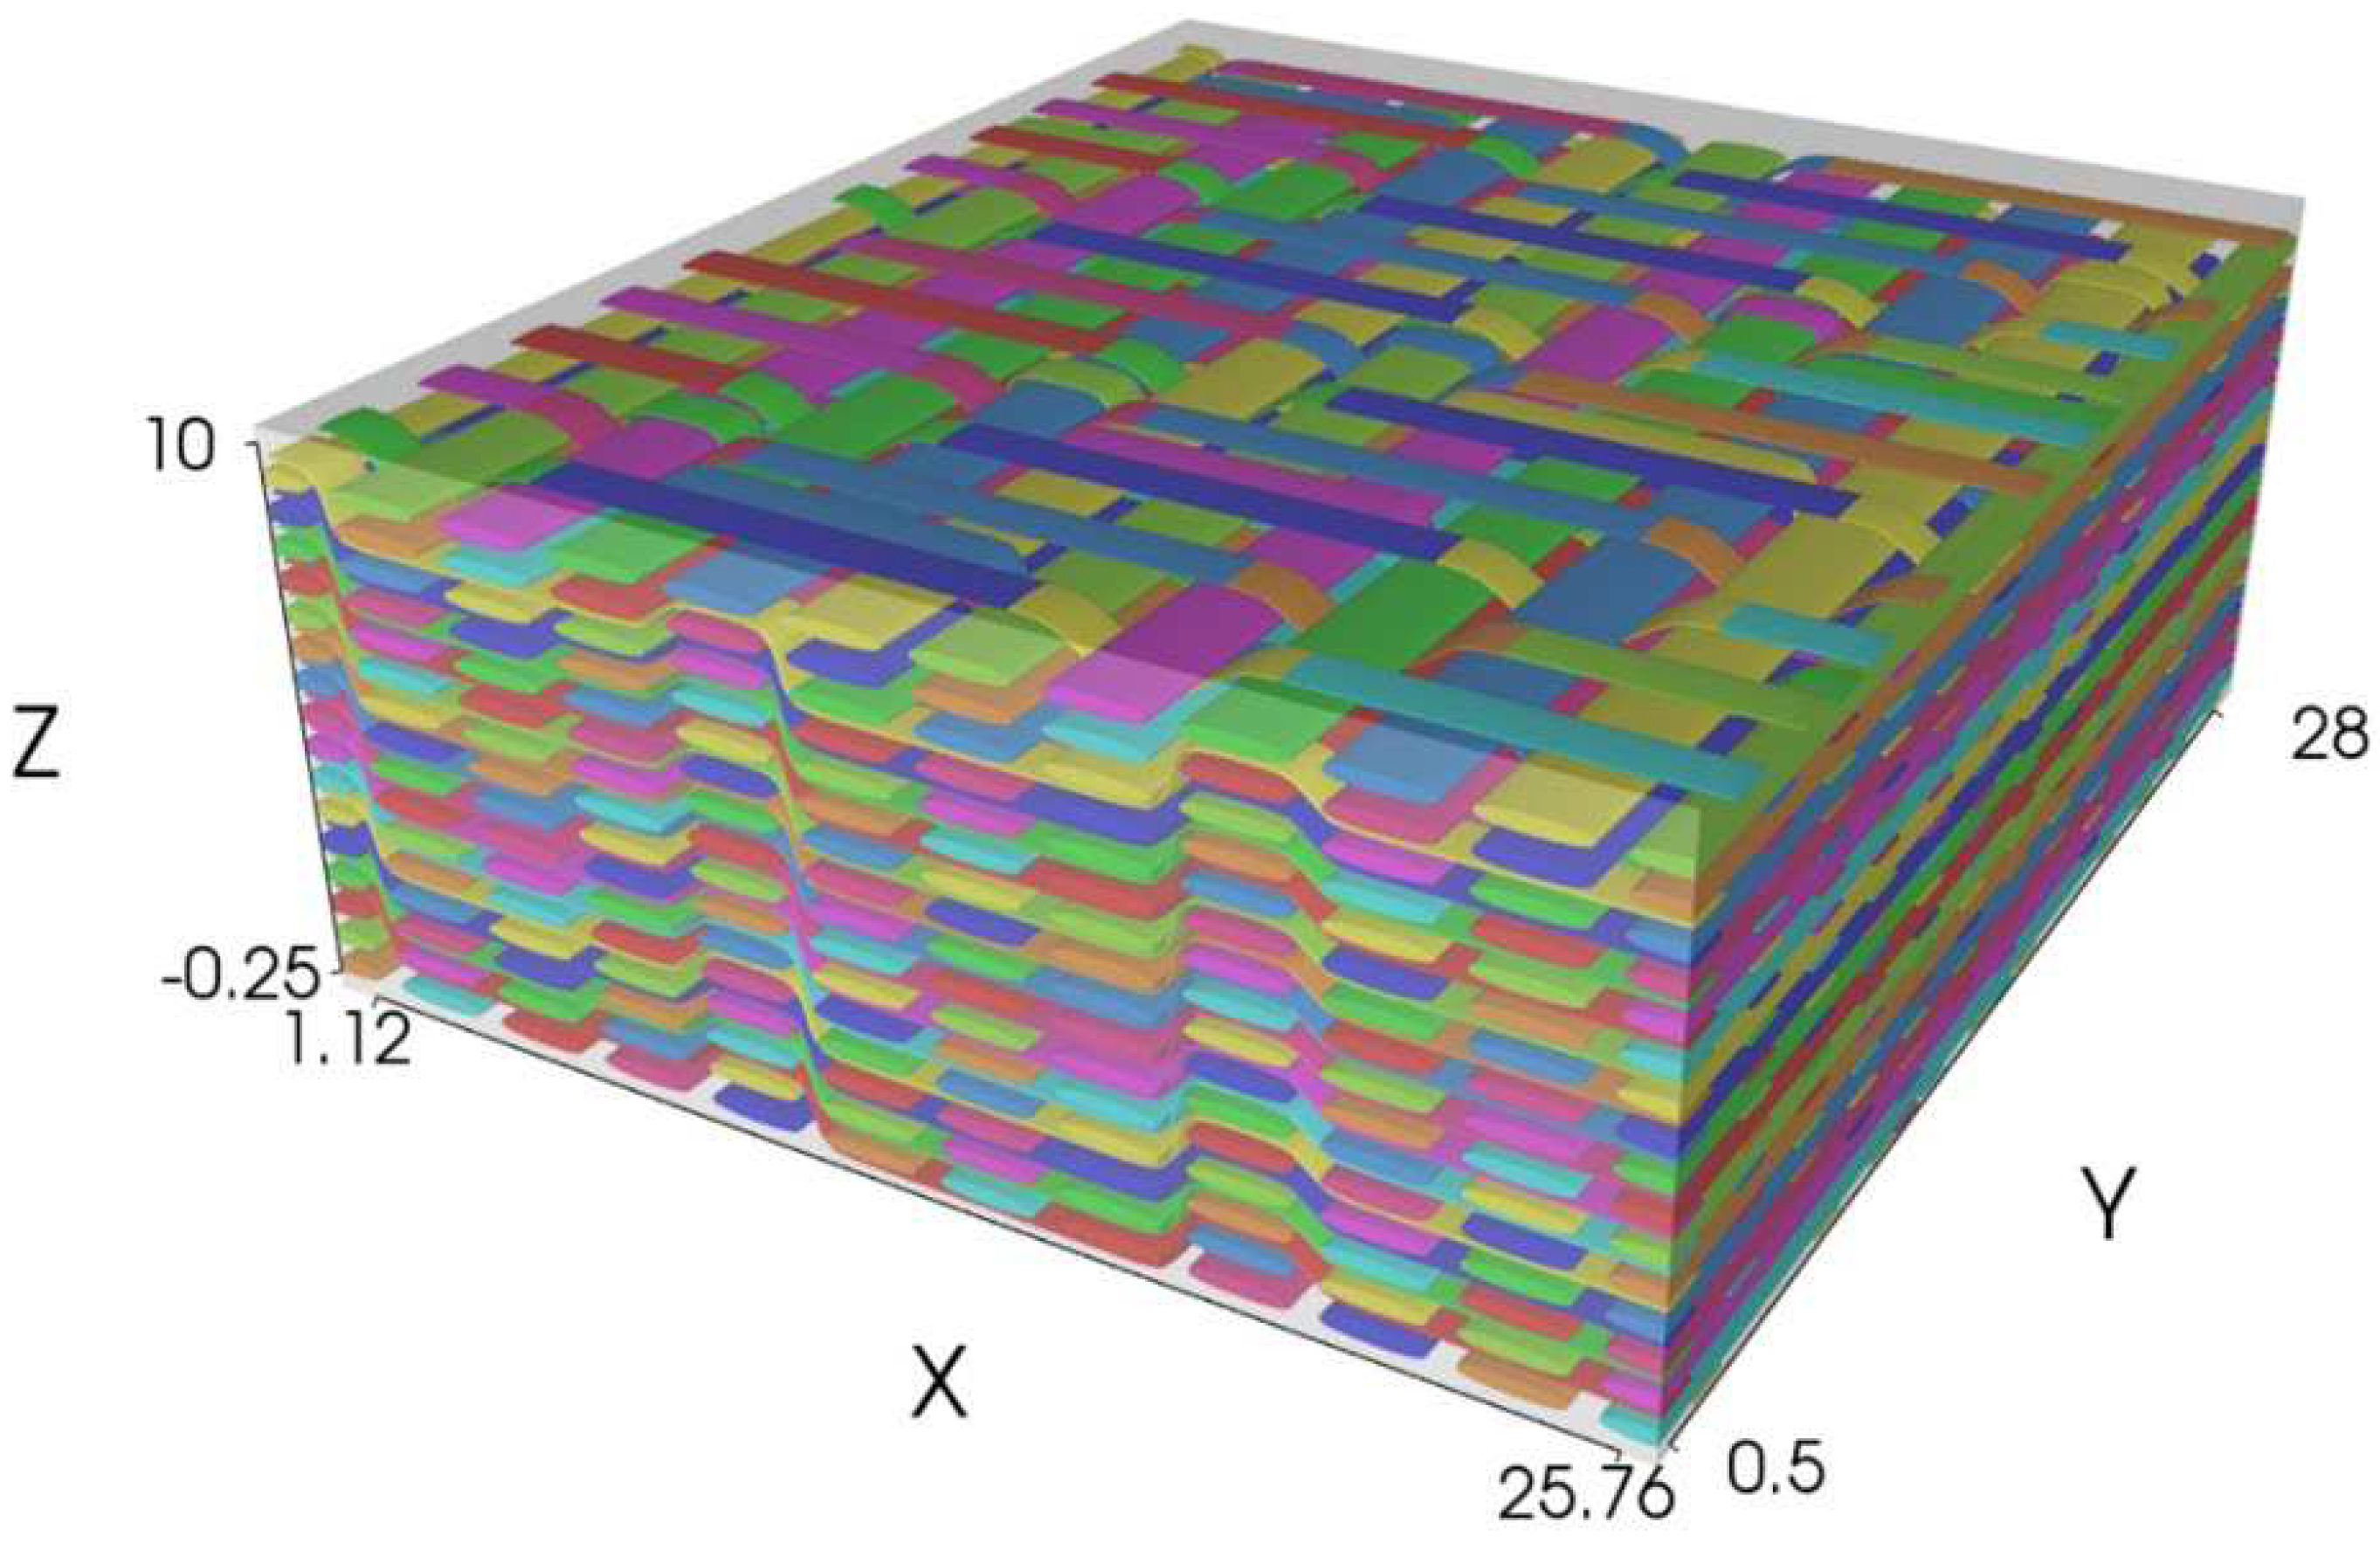
Figure 3.
(a) FE mesh of rectangular elements and (b) square elements.
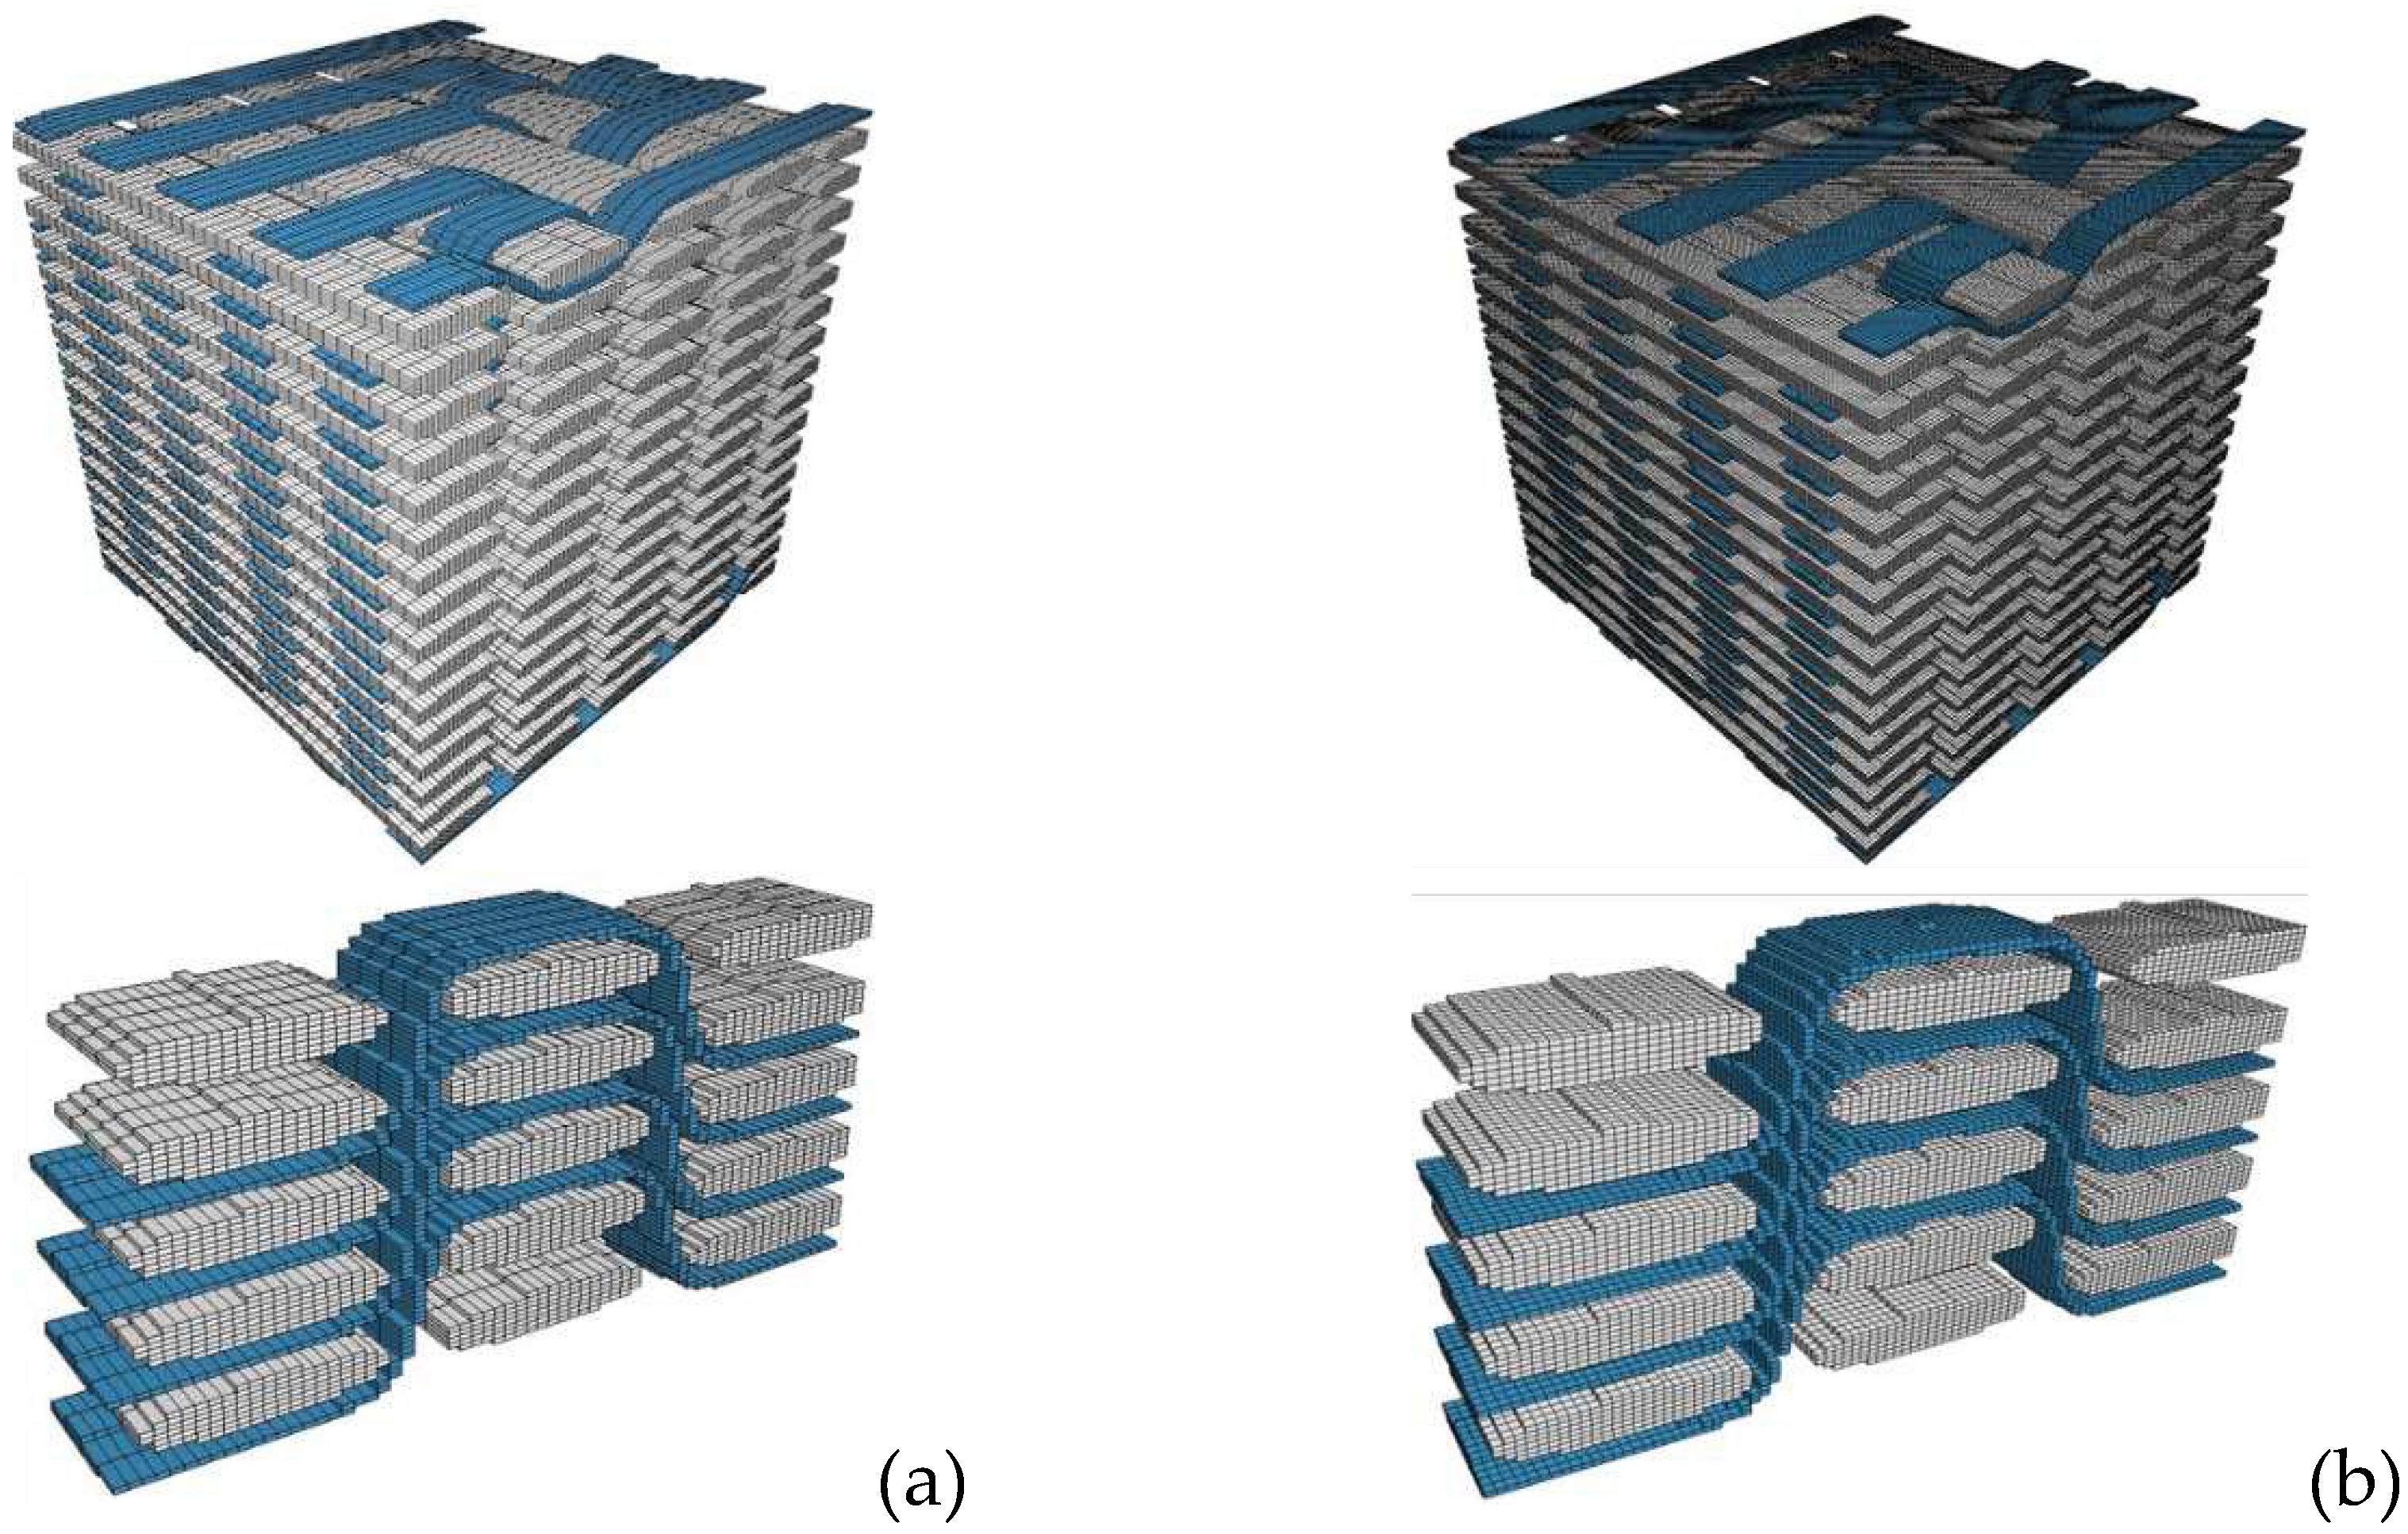
Figure 4.
Back-face velocity vs. time diagrams computed using the different FE meshes.
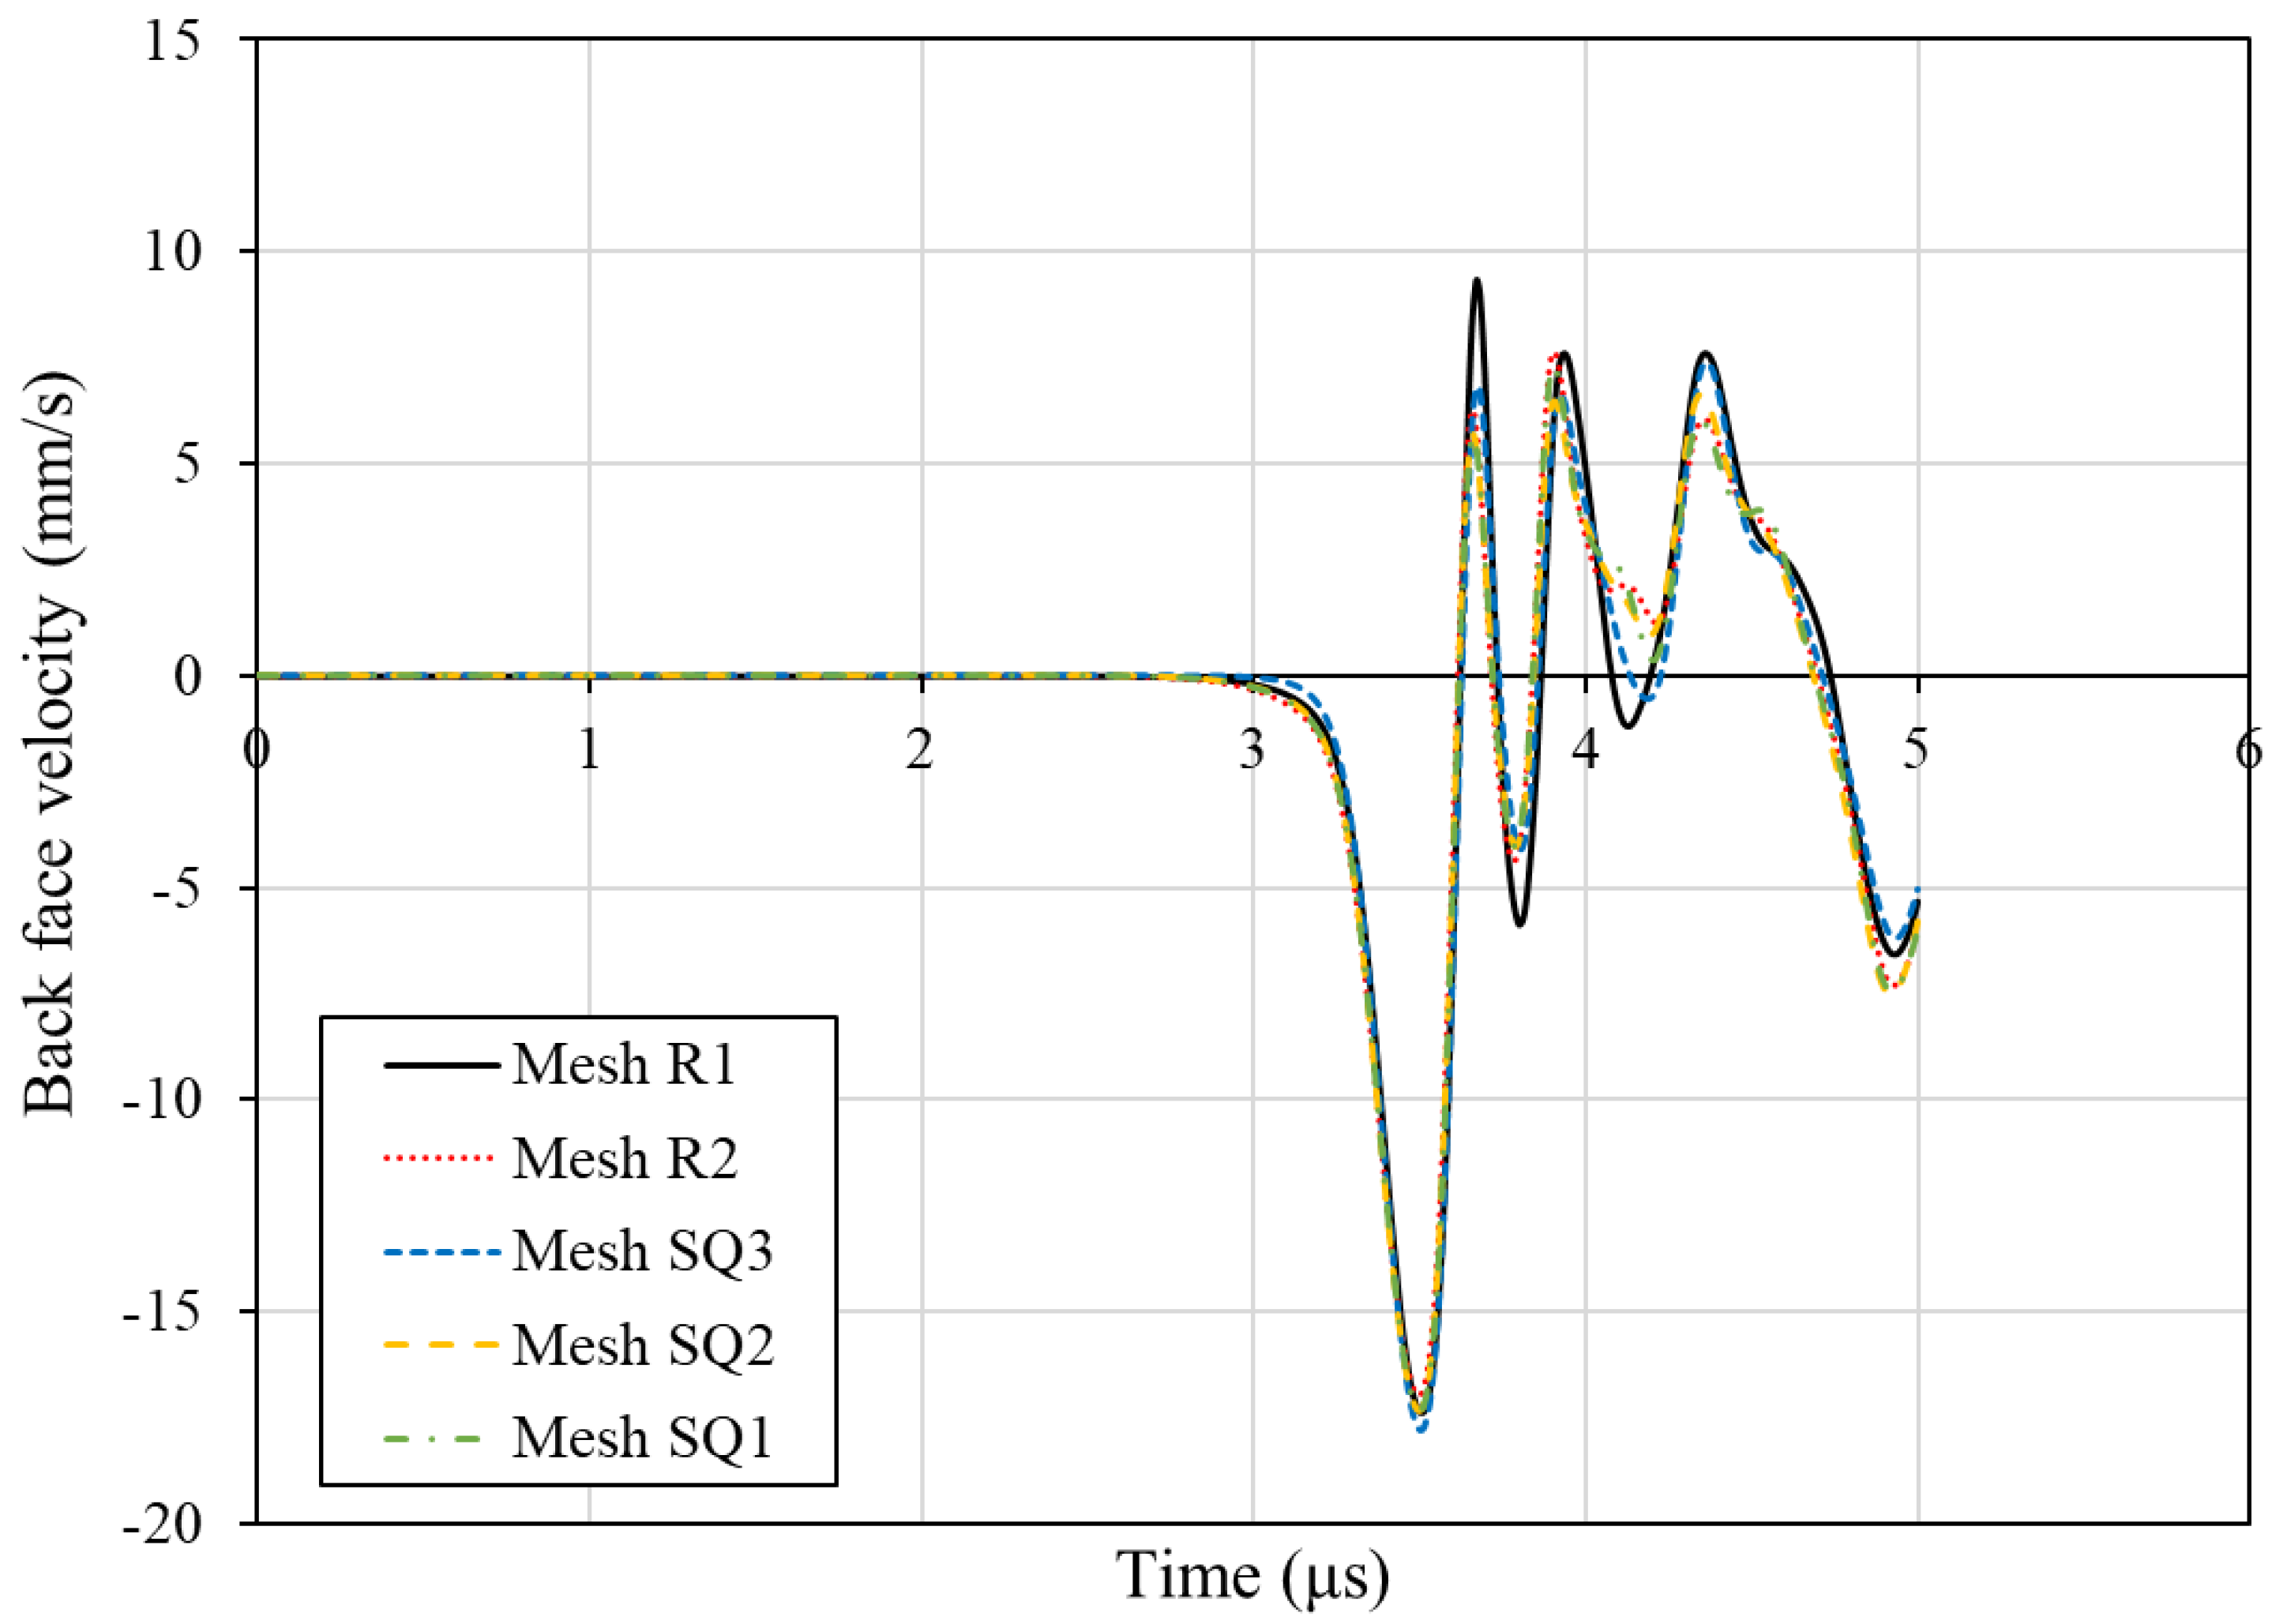
Figure 5.
Isolated cubic elements appearing in the SQ3 FE mesh.
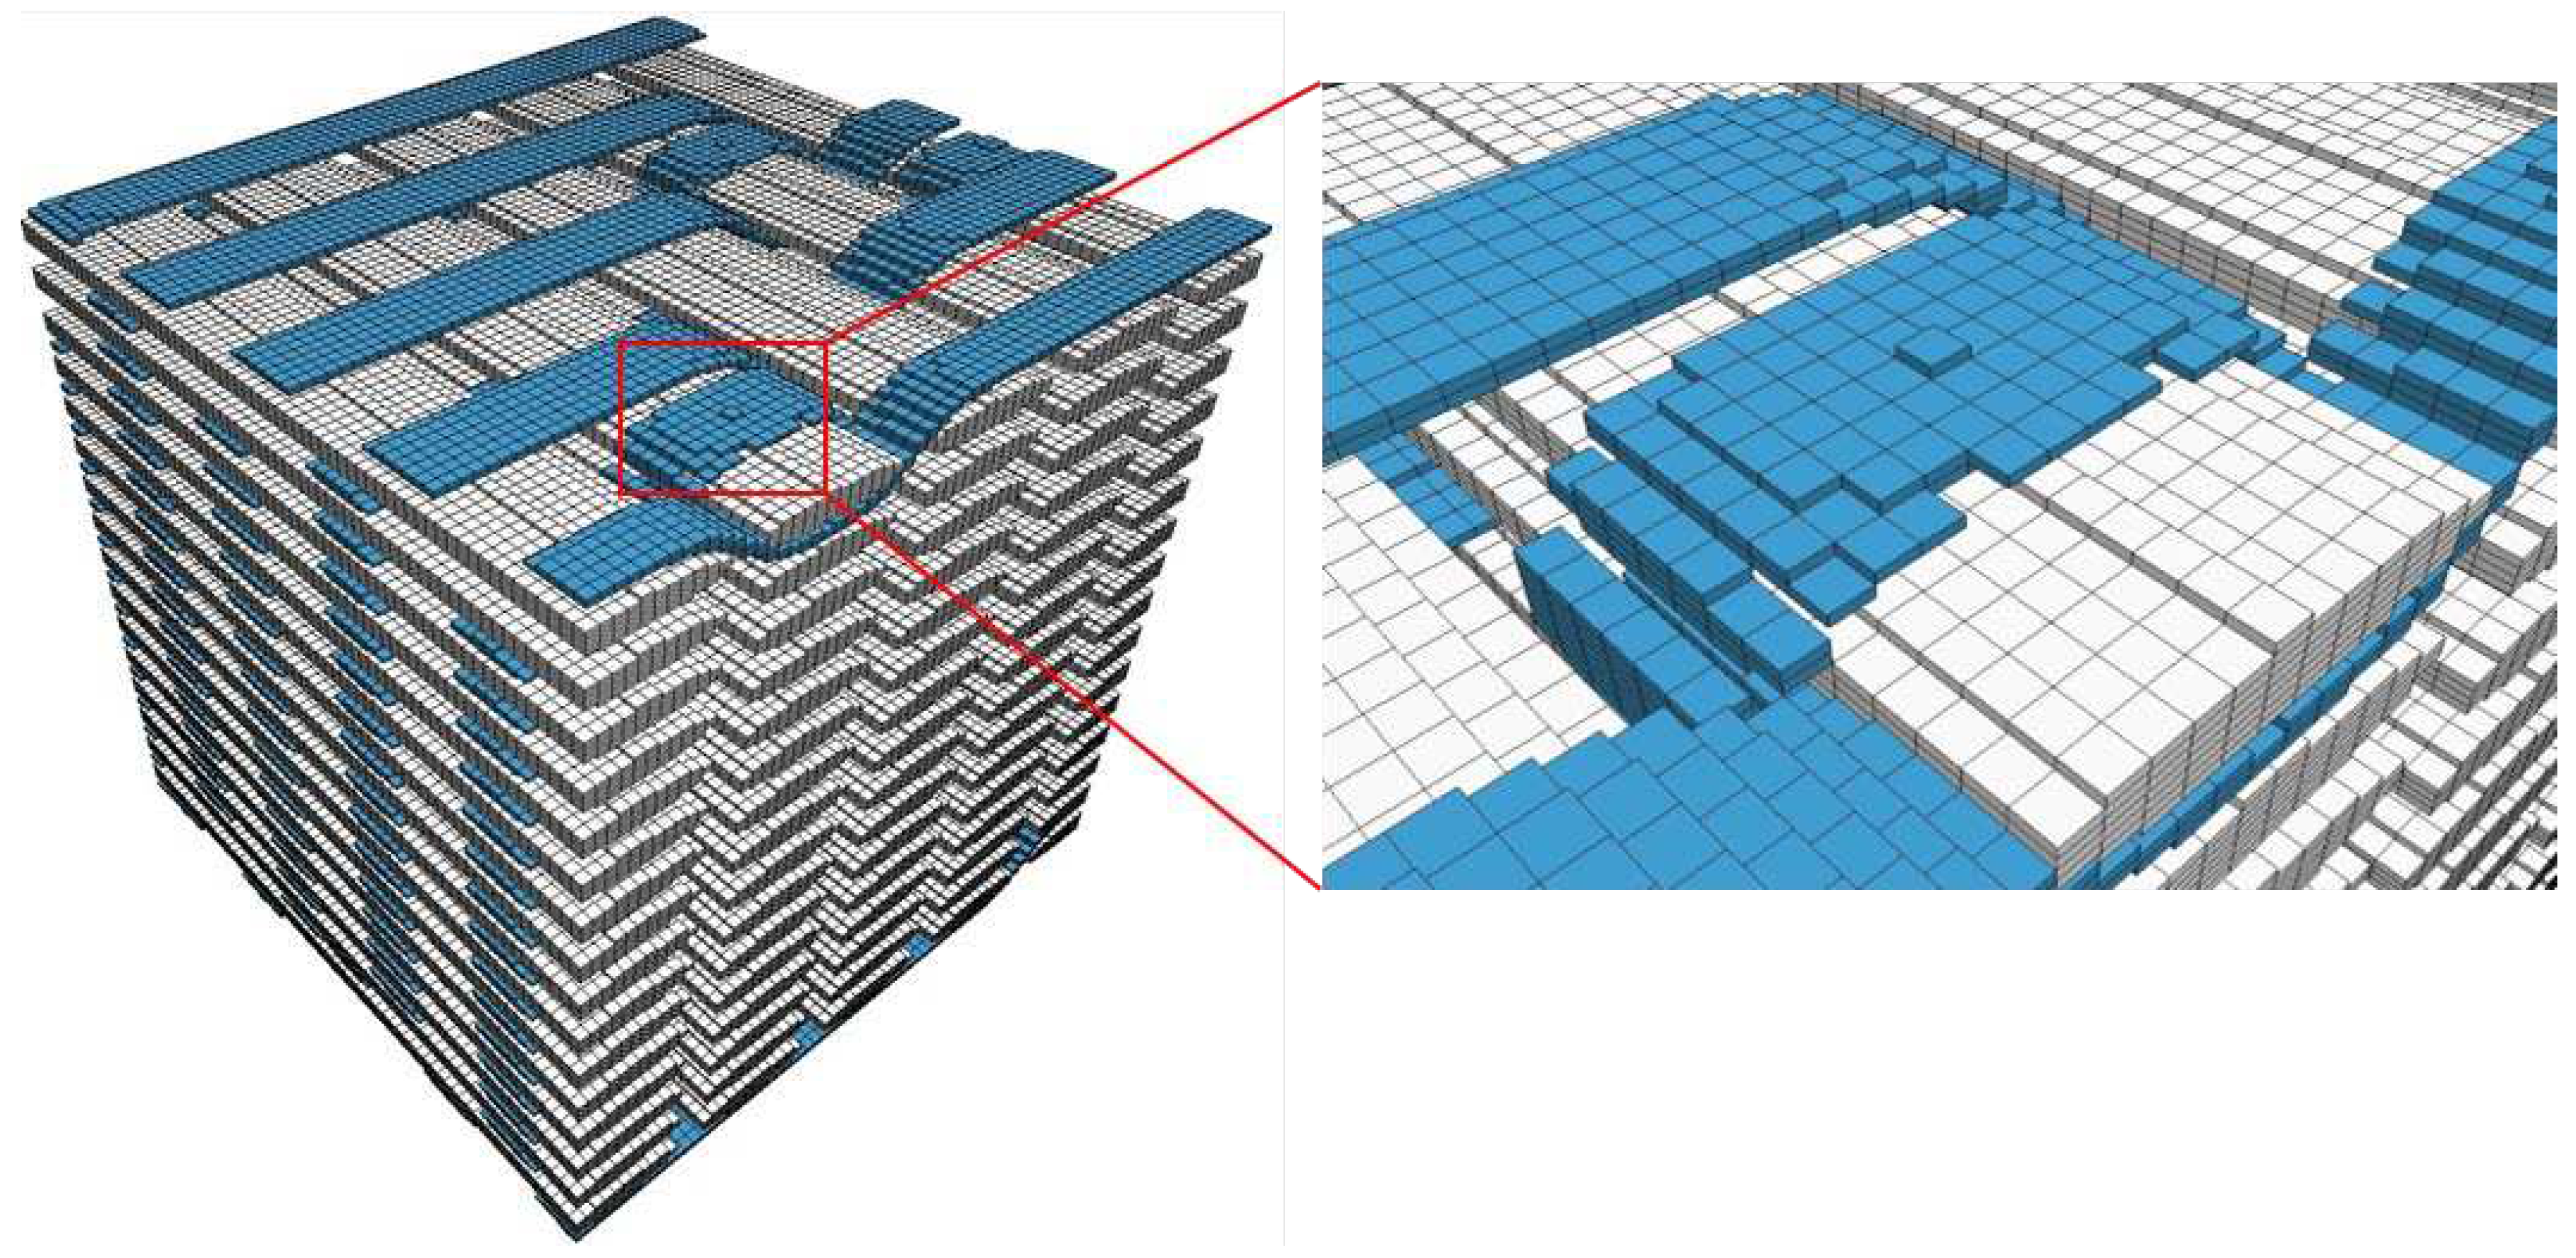
Figure 6.
Voxel-based FE mesh of the warp and binders.

Figure 7.
Material direction of binder yarns.
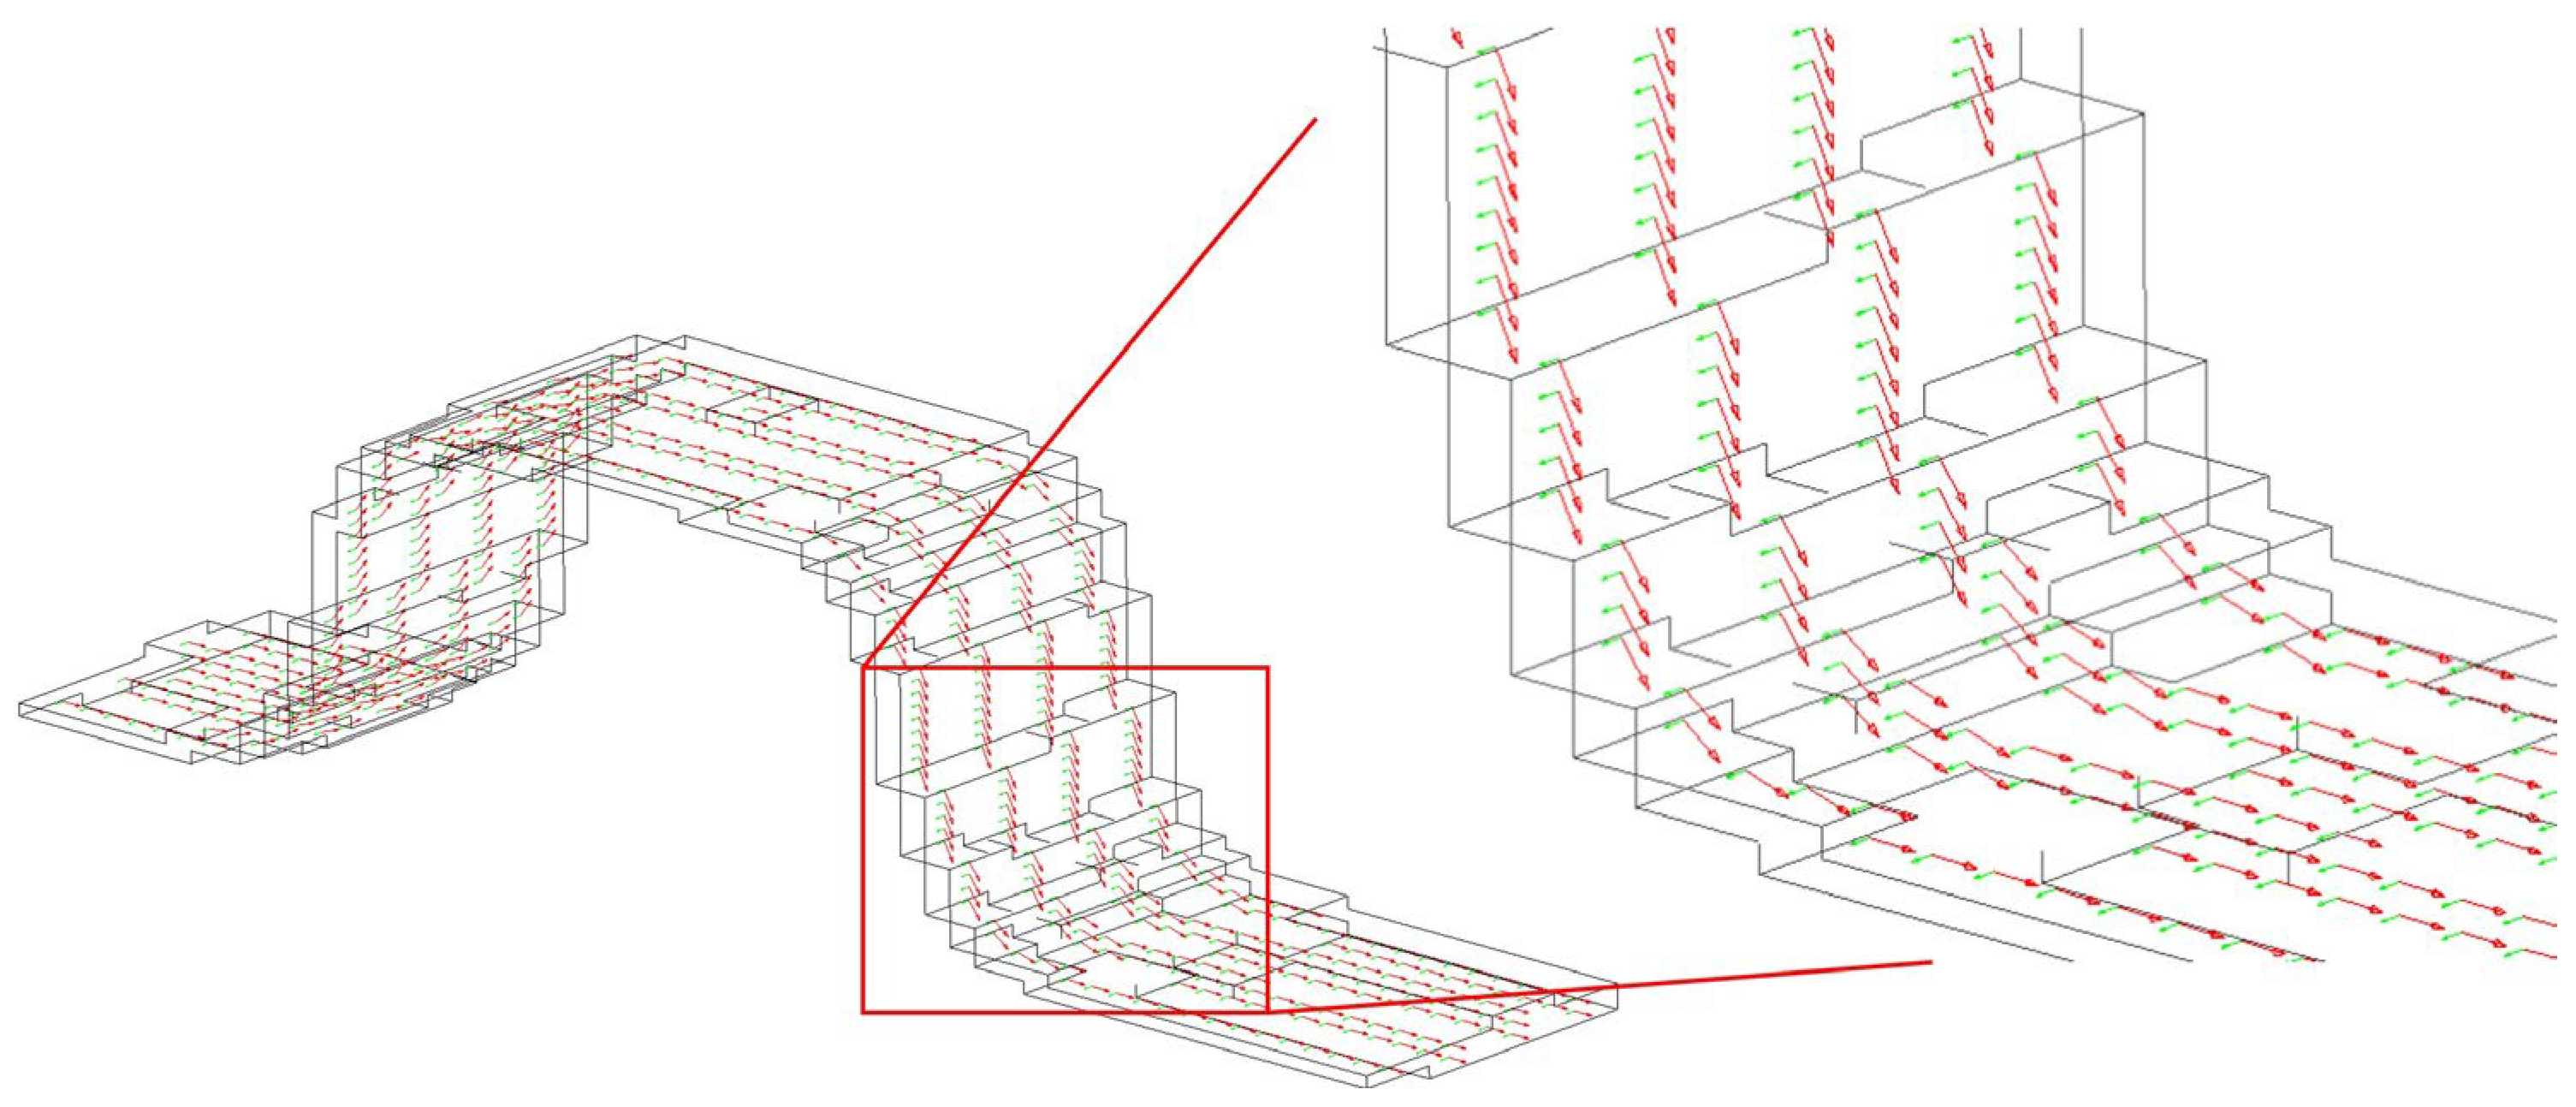
Figure 8.
Homogenized model utilizing the same mesh size as the detailed model.
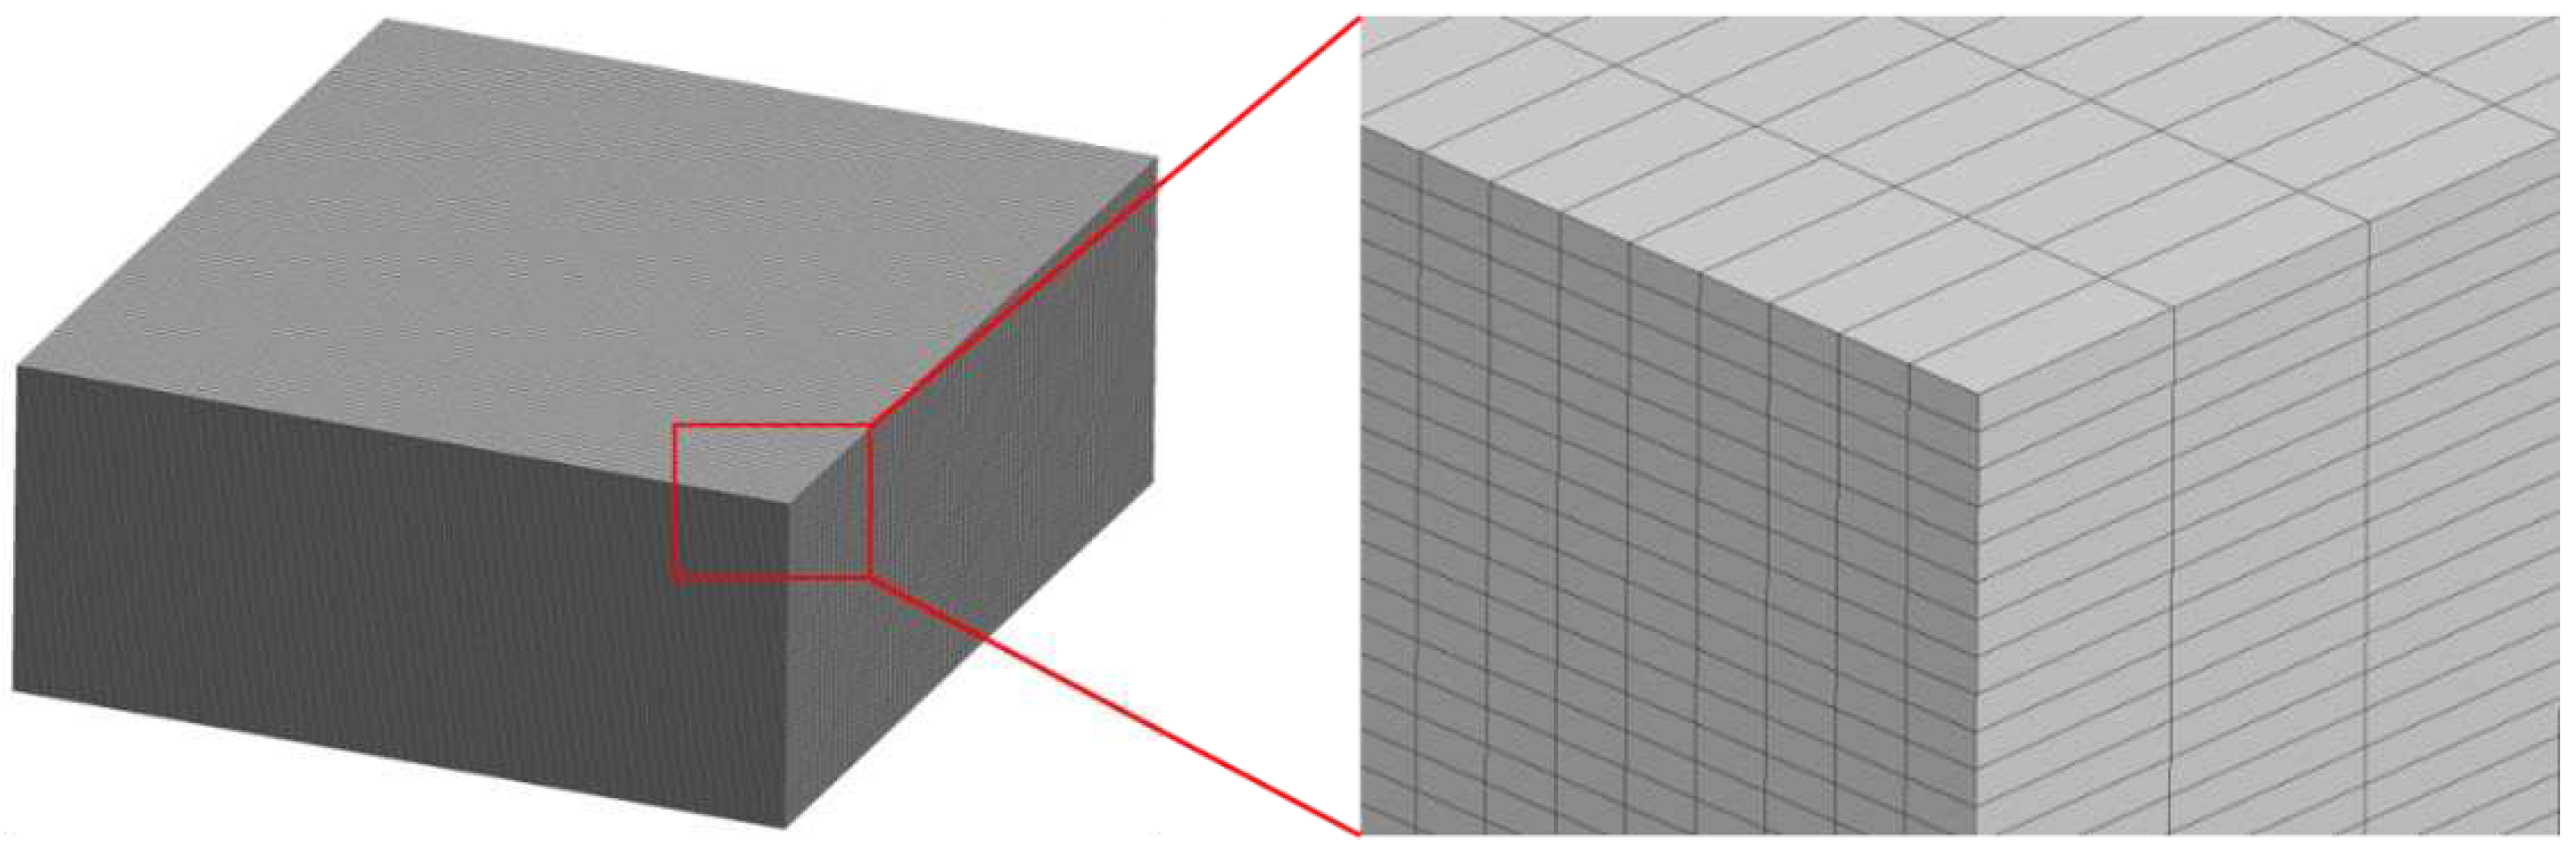
Figure 9.
Comparison of the experimental and the analytical relationship of (a) the elastic modulus and (b) the strength versus the strain rate.
Figure 9.
Comparison of the experimental and the analytical relationship of (a) the elastic modulus and (b) the strength versus the strain rate.
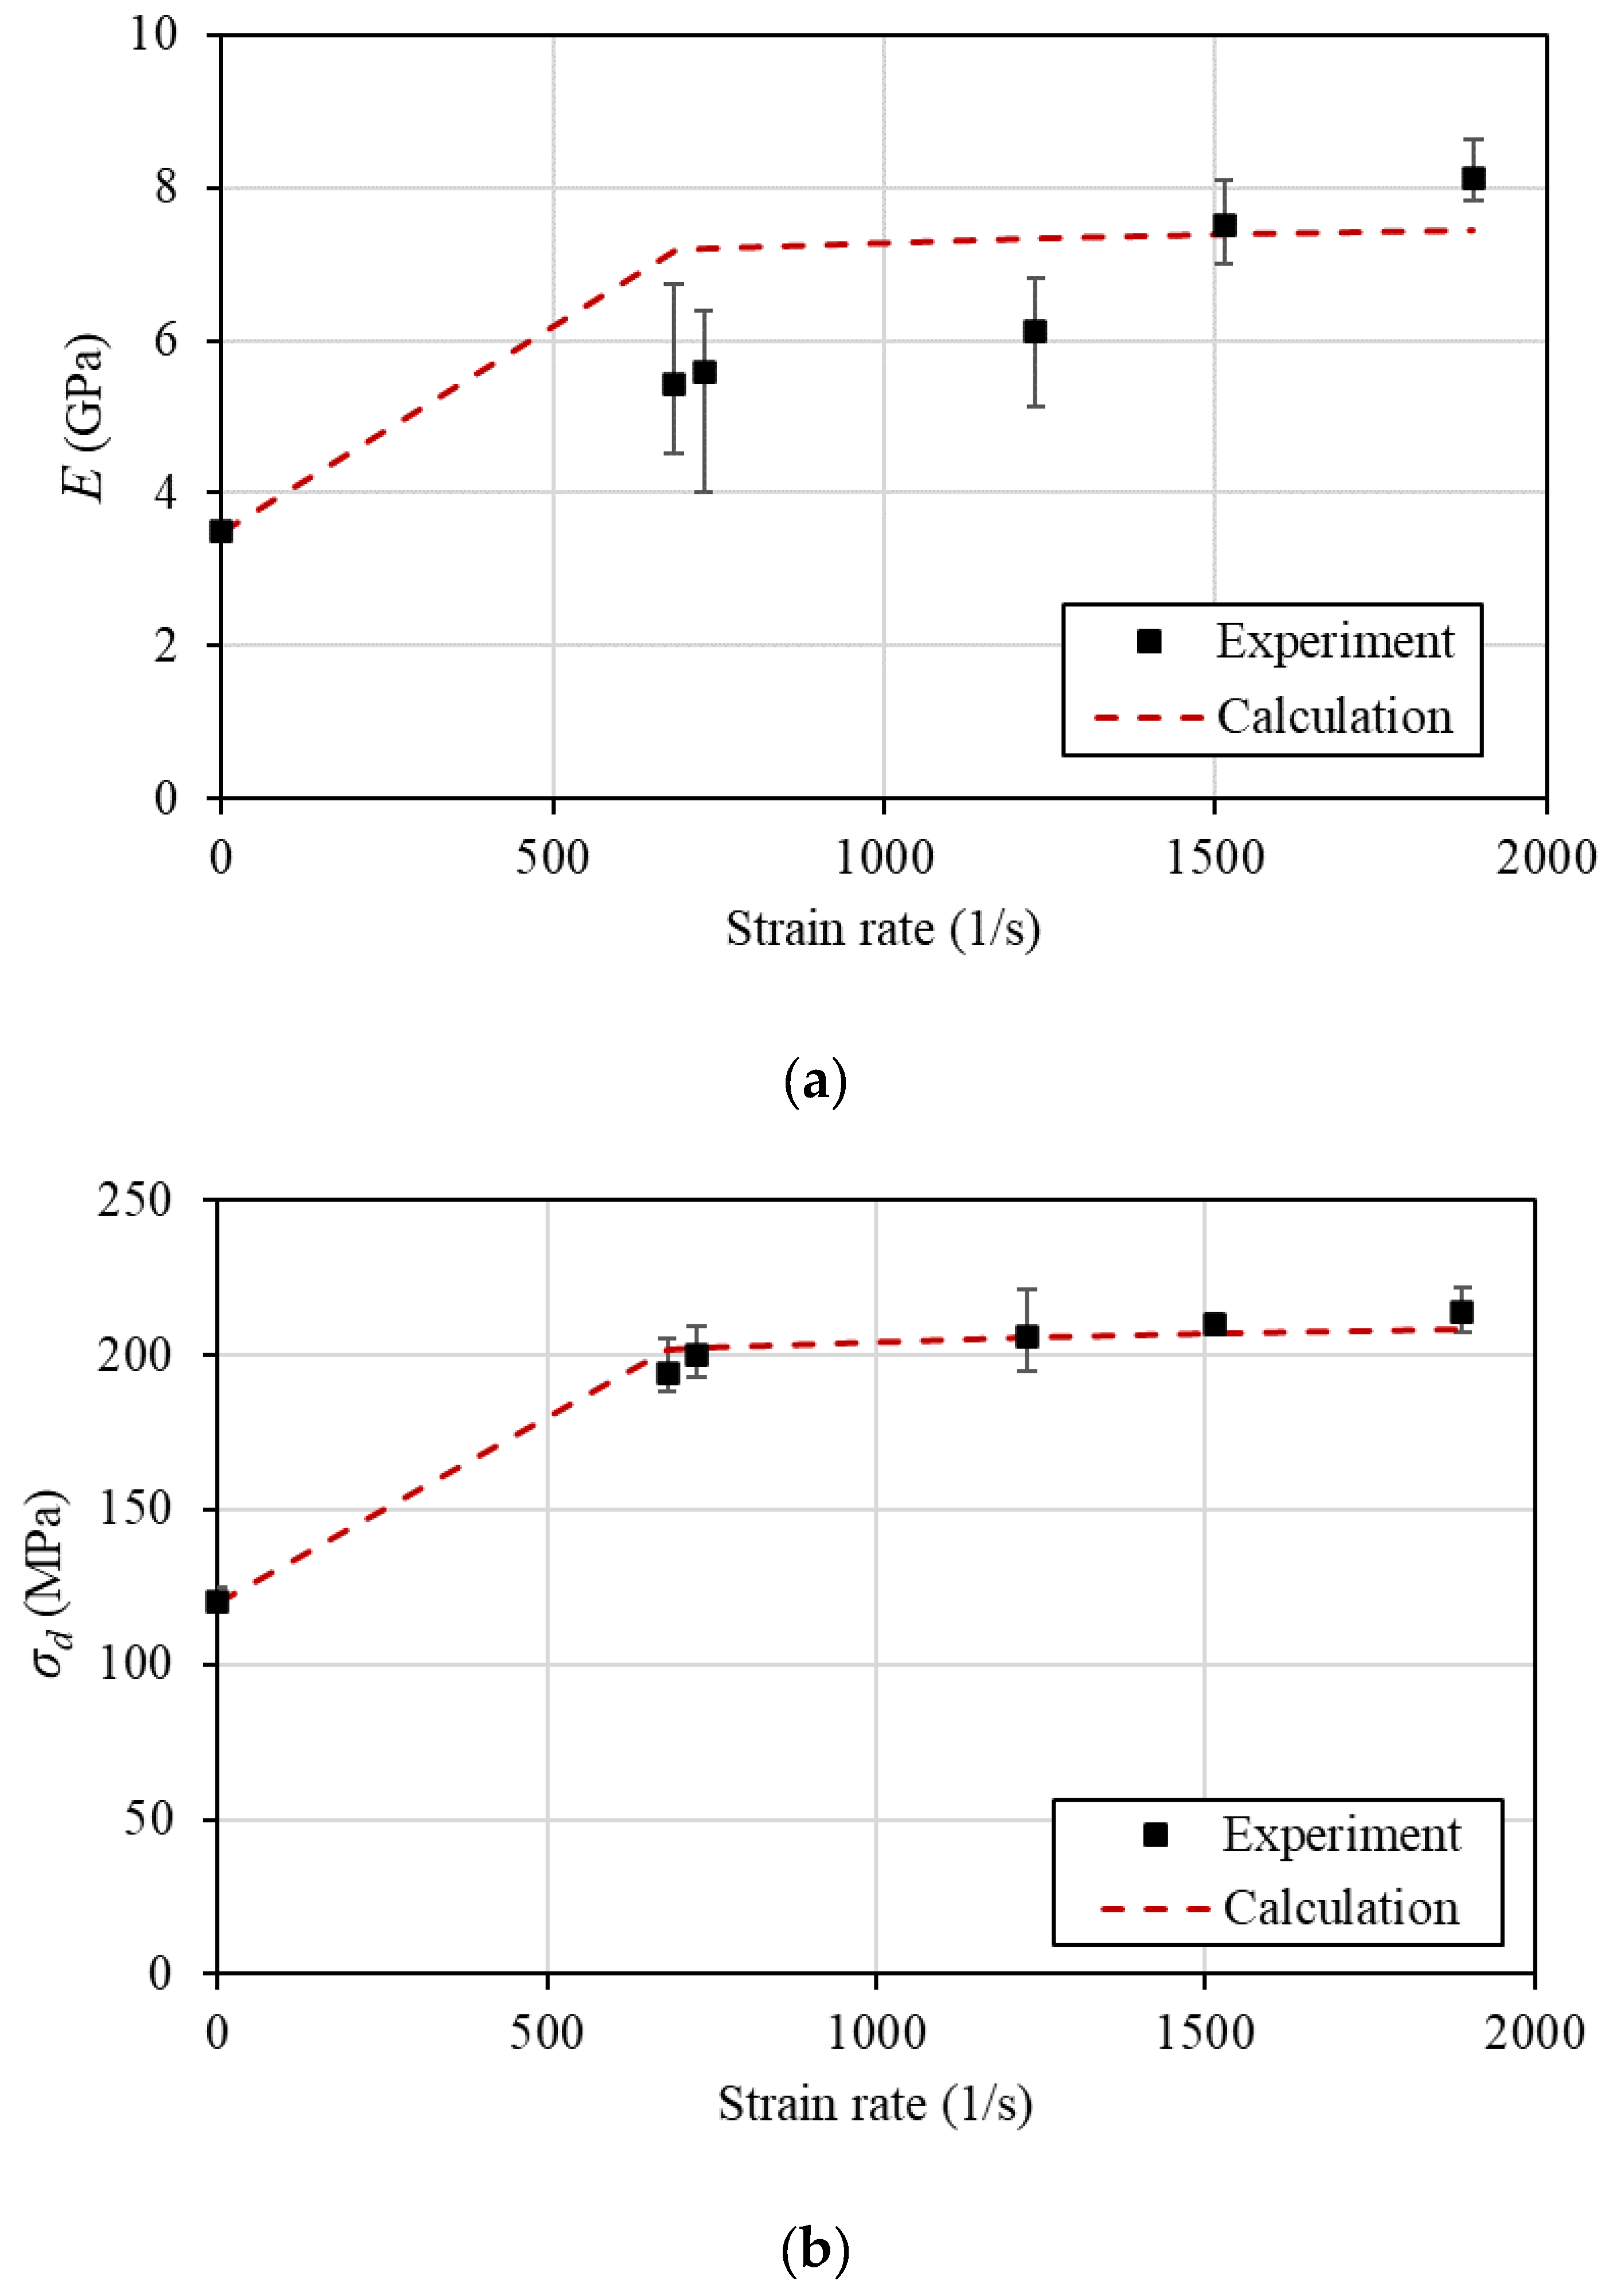
Figure 10.
Modified stress-strain curve of the resin 2896 based on the calculated Crates.
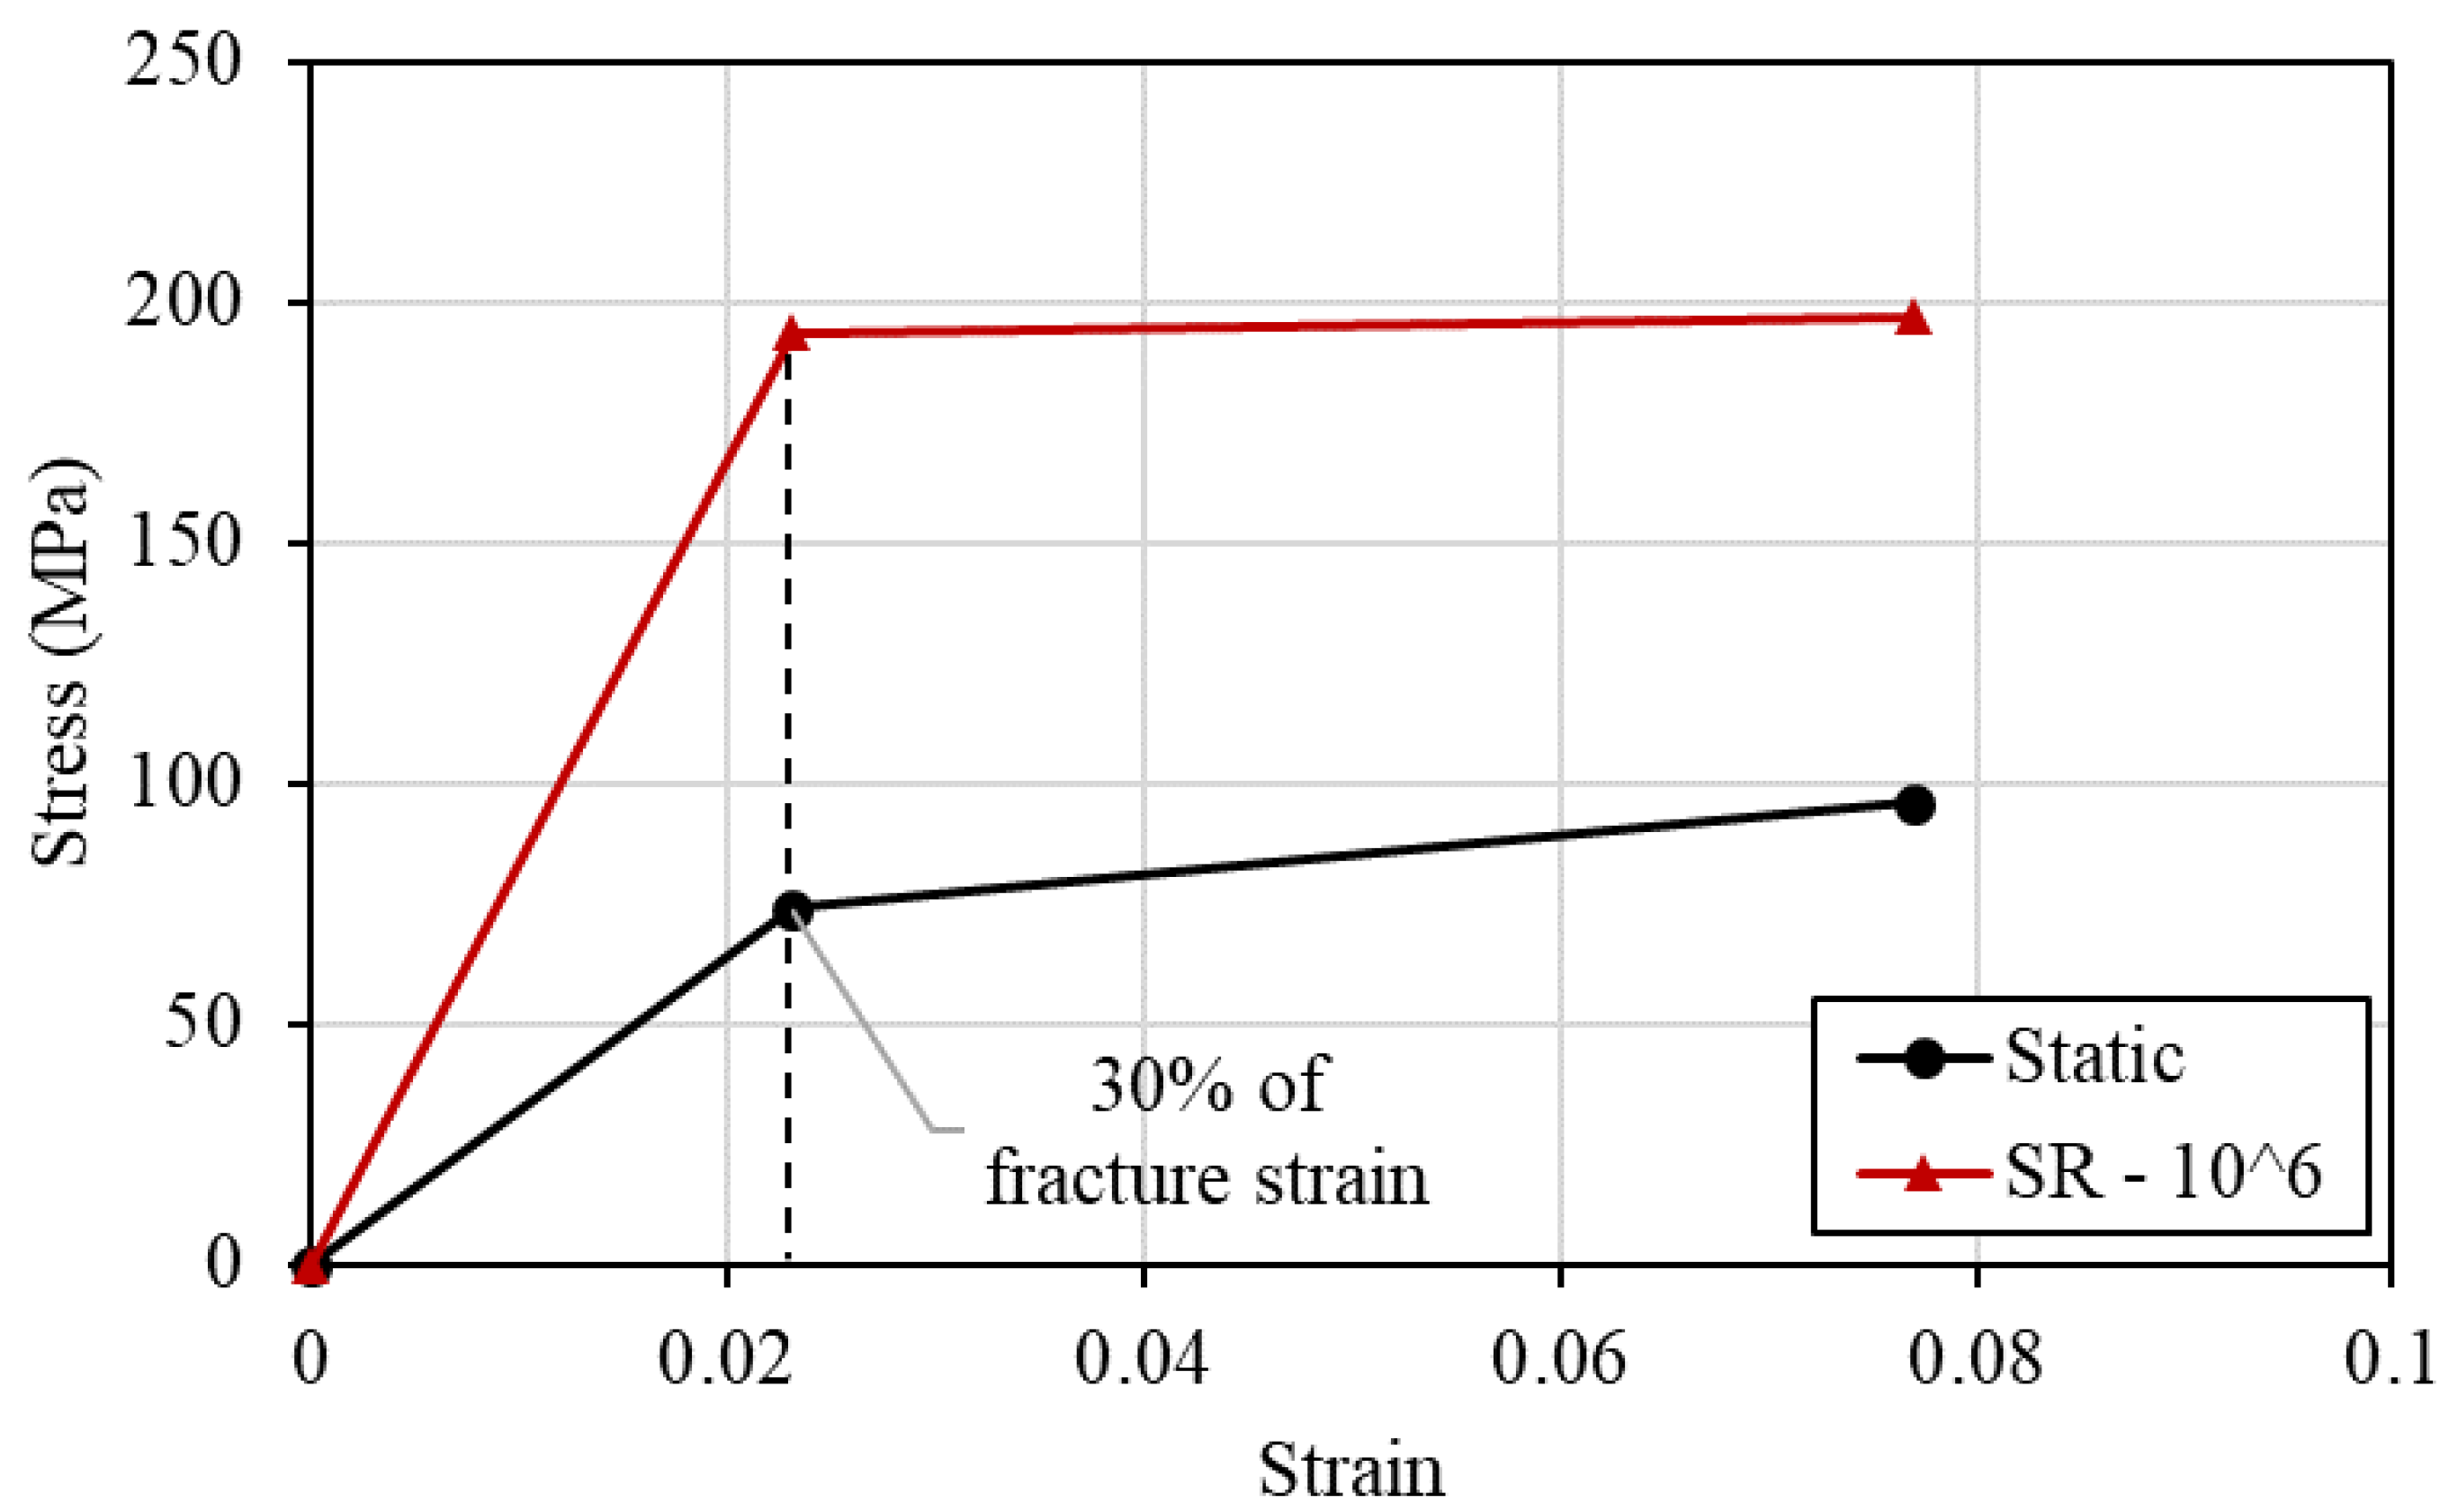
Figure 11.
The circular loaded spot on the top surface of the FE mesh of the 3D woven composite (detailed model).
Figure 11.
The circular loaded spot on the top surface of the FE mesh of the 3D woven composite (detailed model).
Figure 12.
The applied temporal profile.
Figure 13.
Shock wave propagation illustrated by means of the normal σz stress for the two FE models (detailed model on the left and homogenized model on the right).
Figure 13.
Shock wave propagation illustrated by means of the normal σz stress for the two FE models (detailed model on the left and homogenized model on the right).
Figure 14.
Back-face velocity diagrams comparison between the detailed model and the homogenized model.
Figure 14.
Back-face velocity diagrams comparison between the detailed model and the homogenized model.
Figure 15.
Comparison of the wave propagation between different spots of the detailed model.
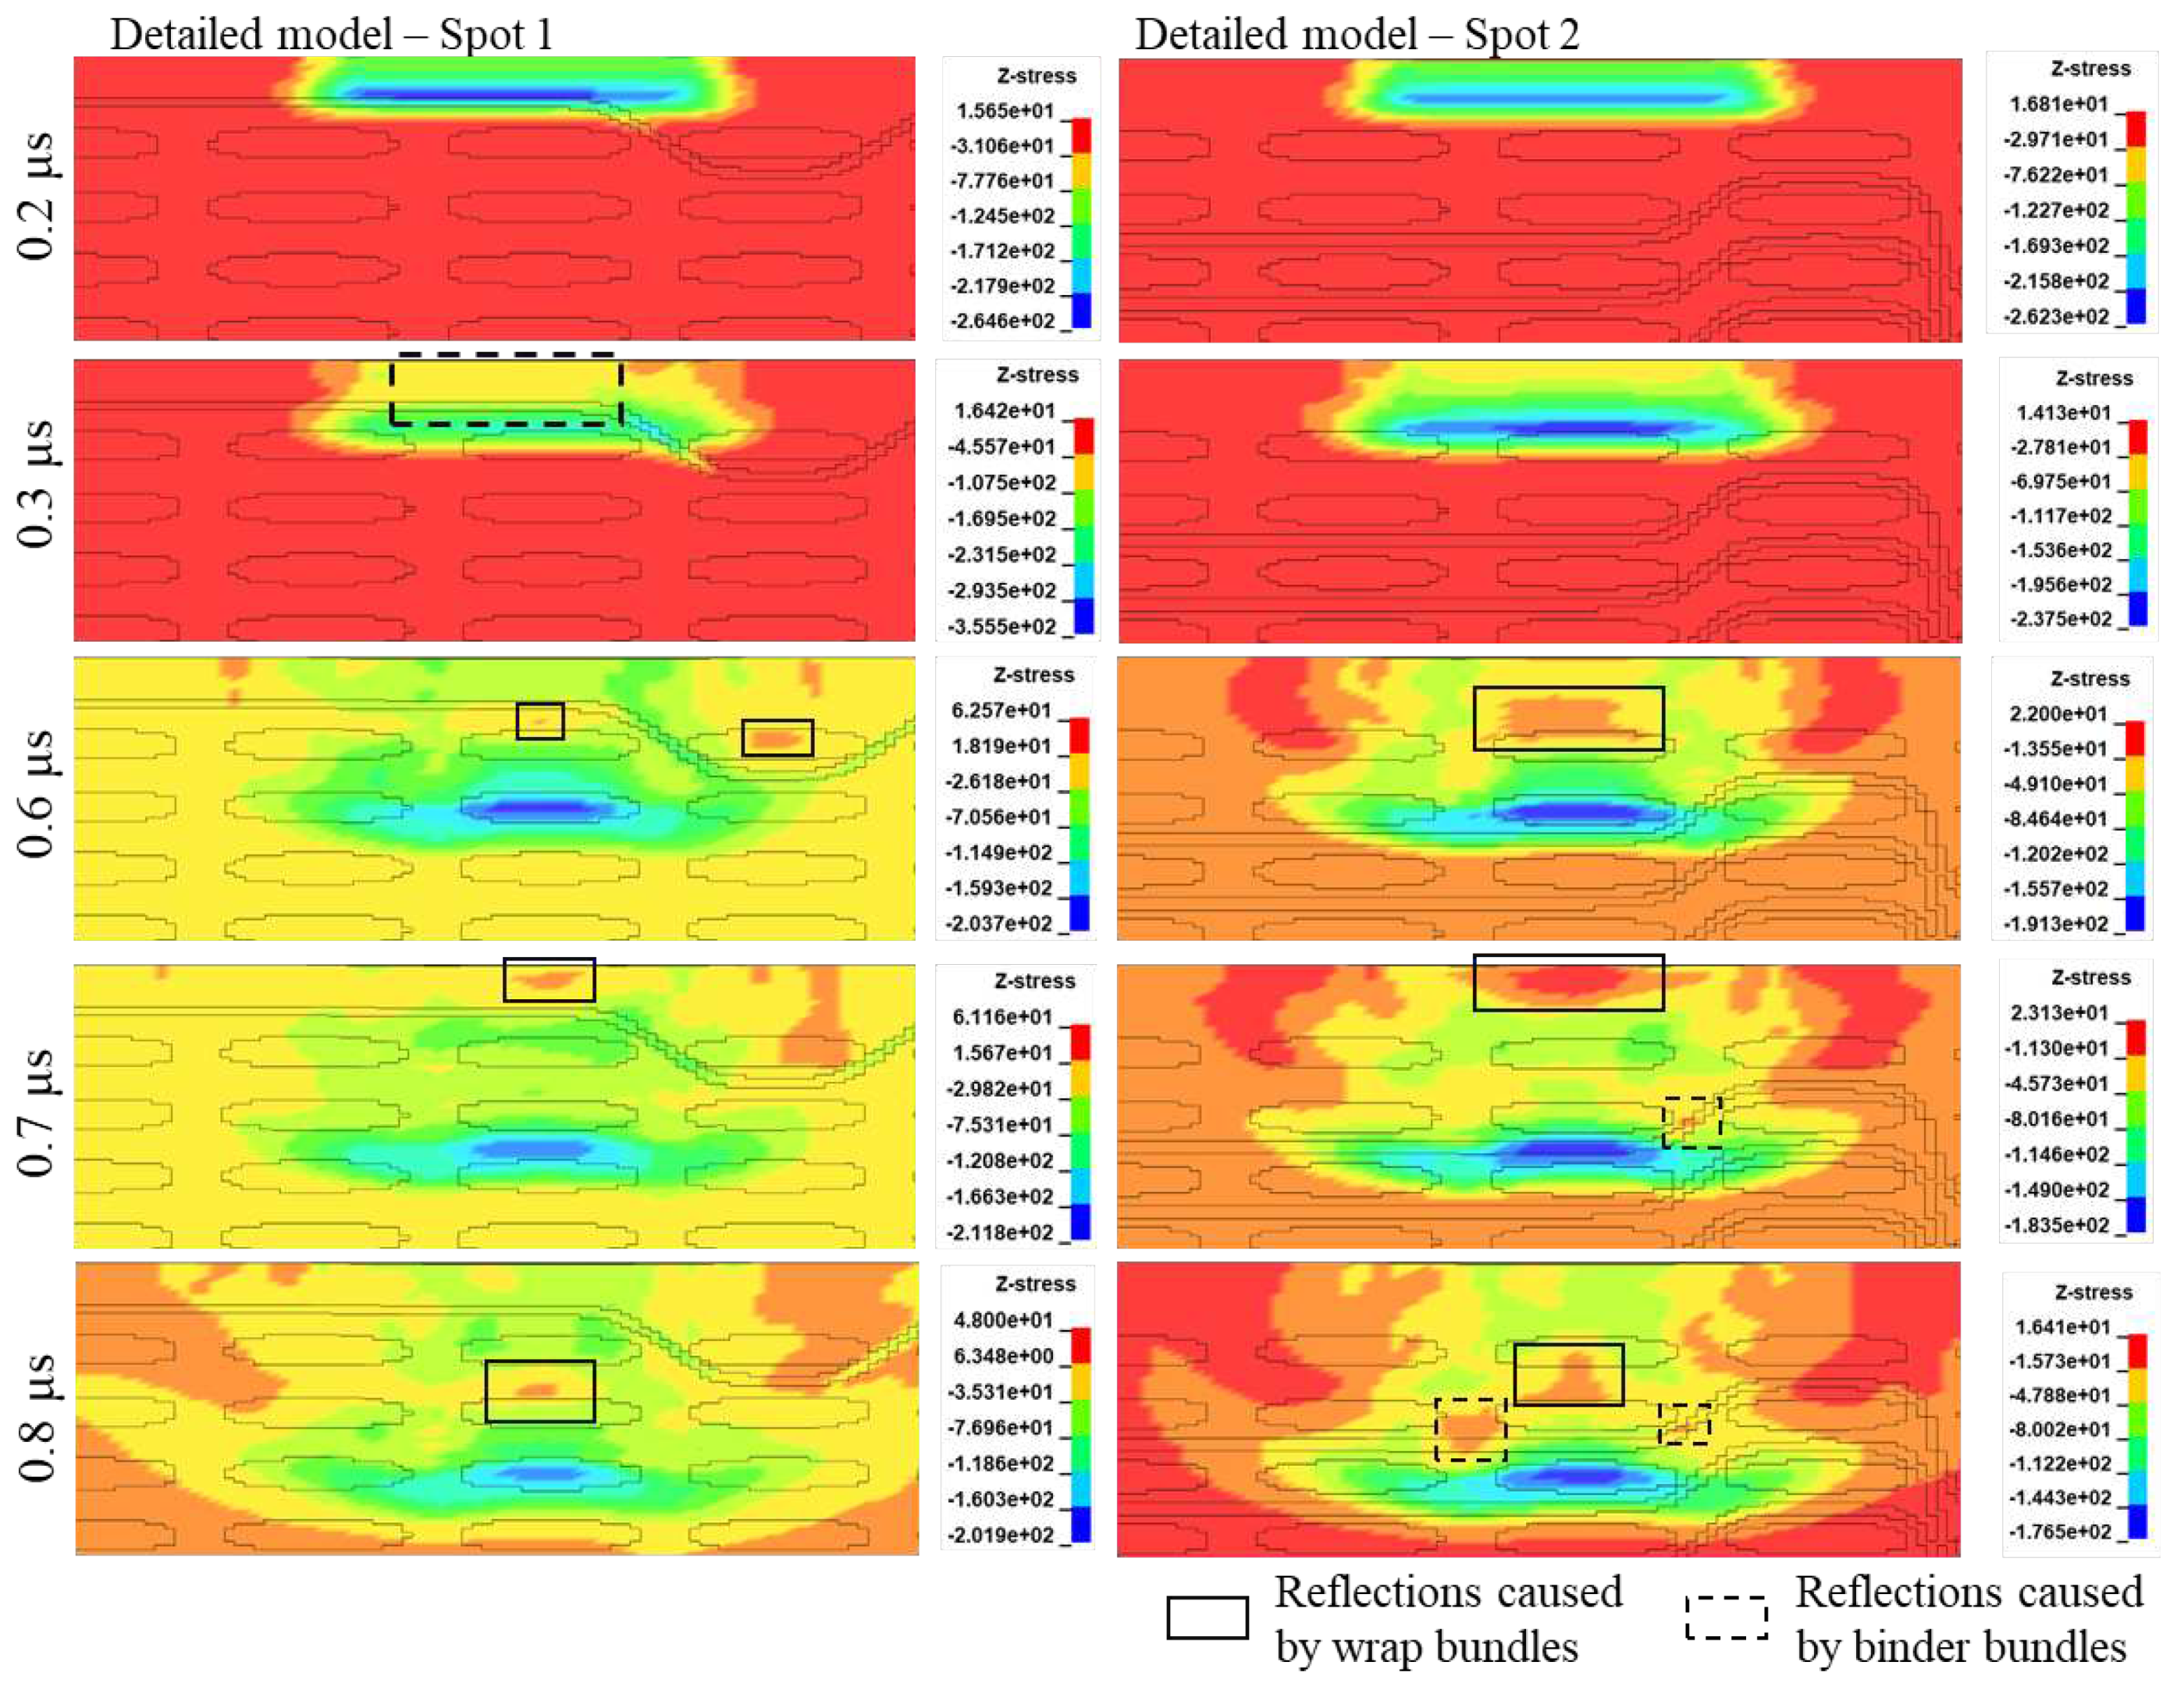
Figure 16.
Predicted matrix damage predicted by the detailed model: (a) Effective plastic strain and (b) the failed element.
Figure 16.
Predicted matrix damage predicted by the detailed model: (a) Effective plastic strain and (b) the failed element.
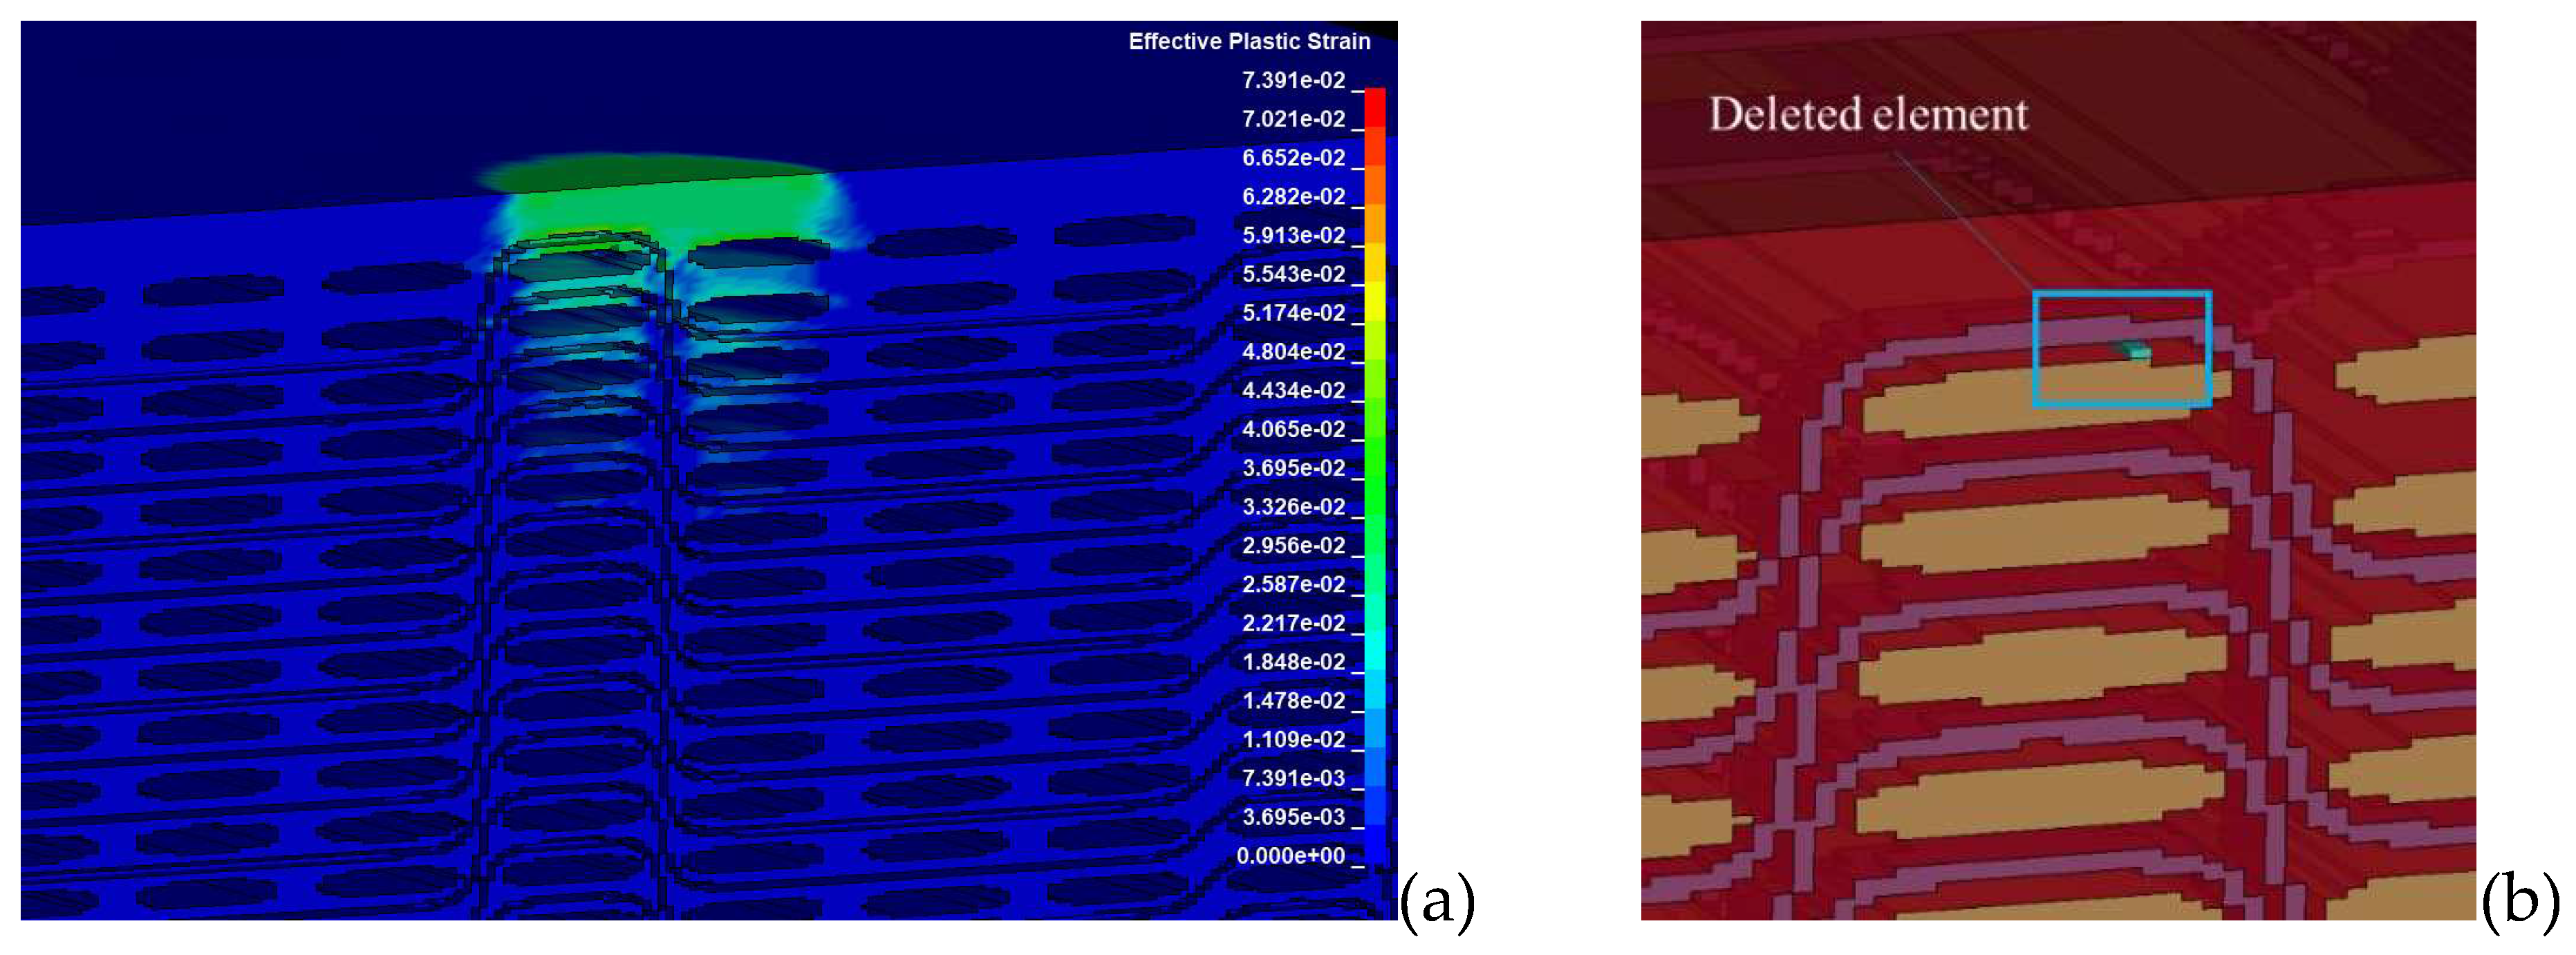
Figure 17.
Predicted matrix damage within the fiber bundles parallel to the fiber direction.
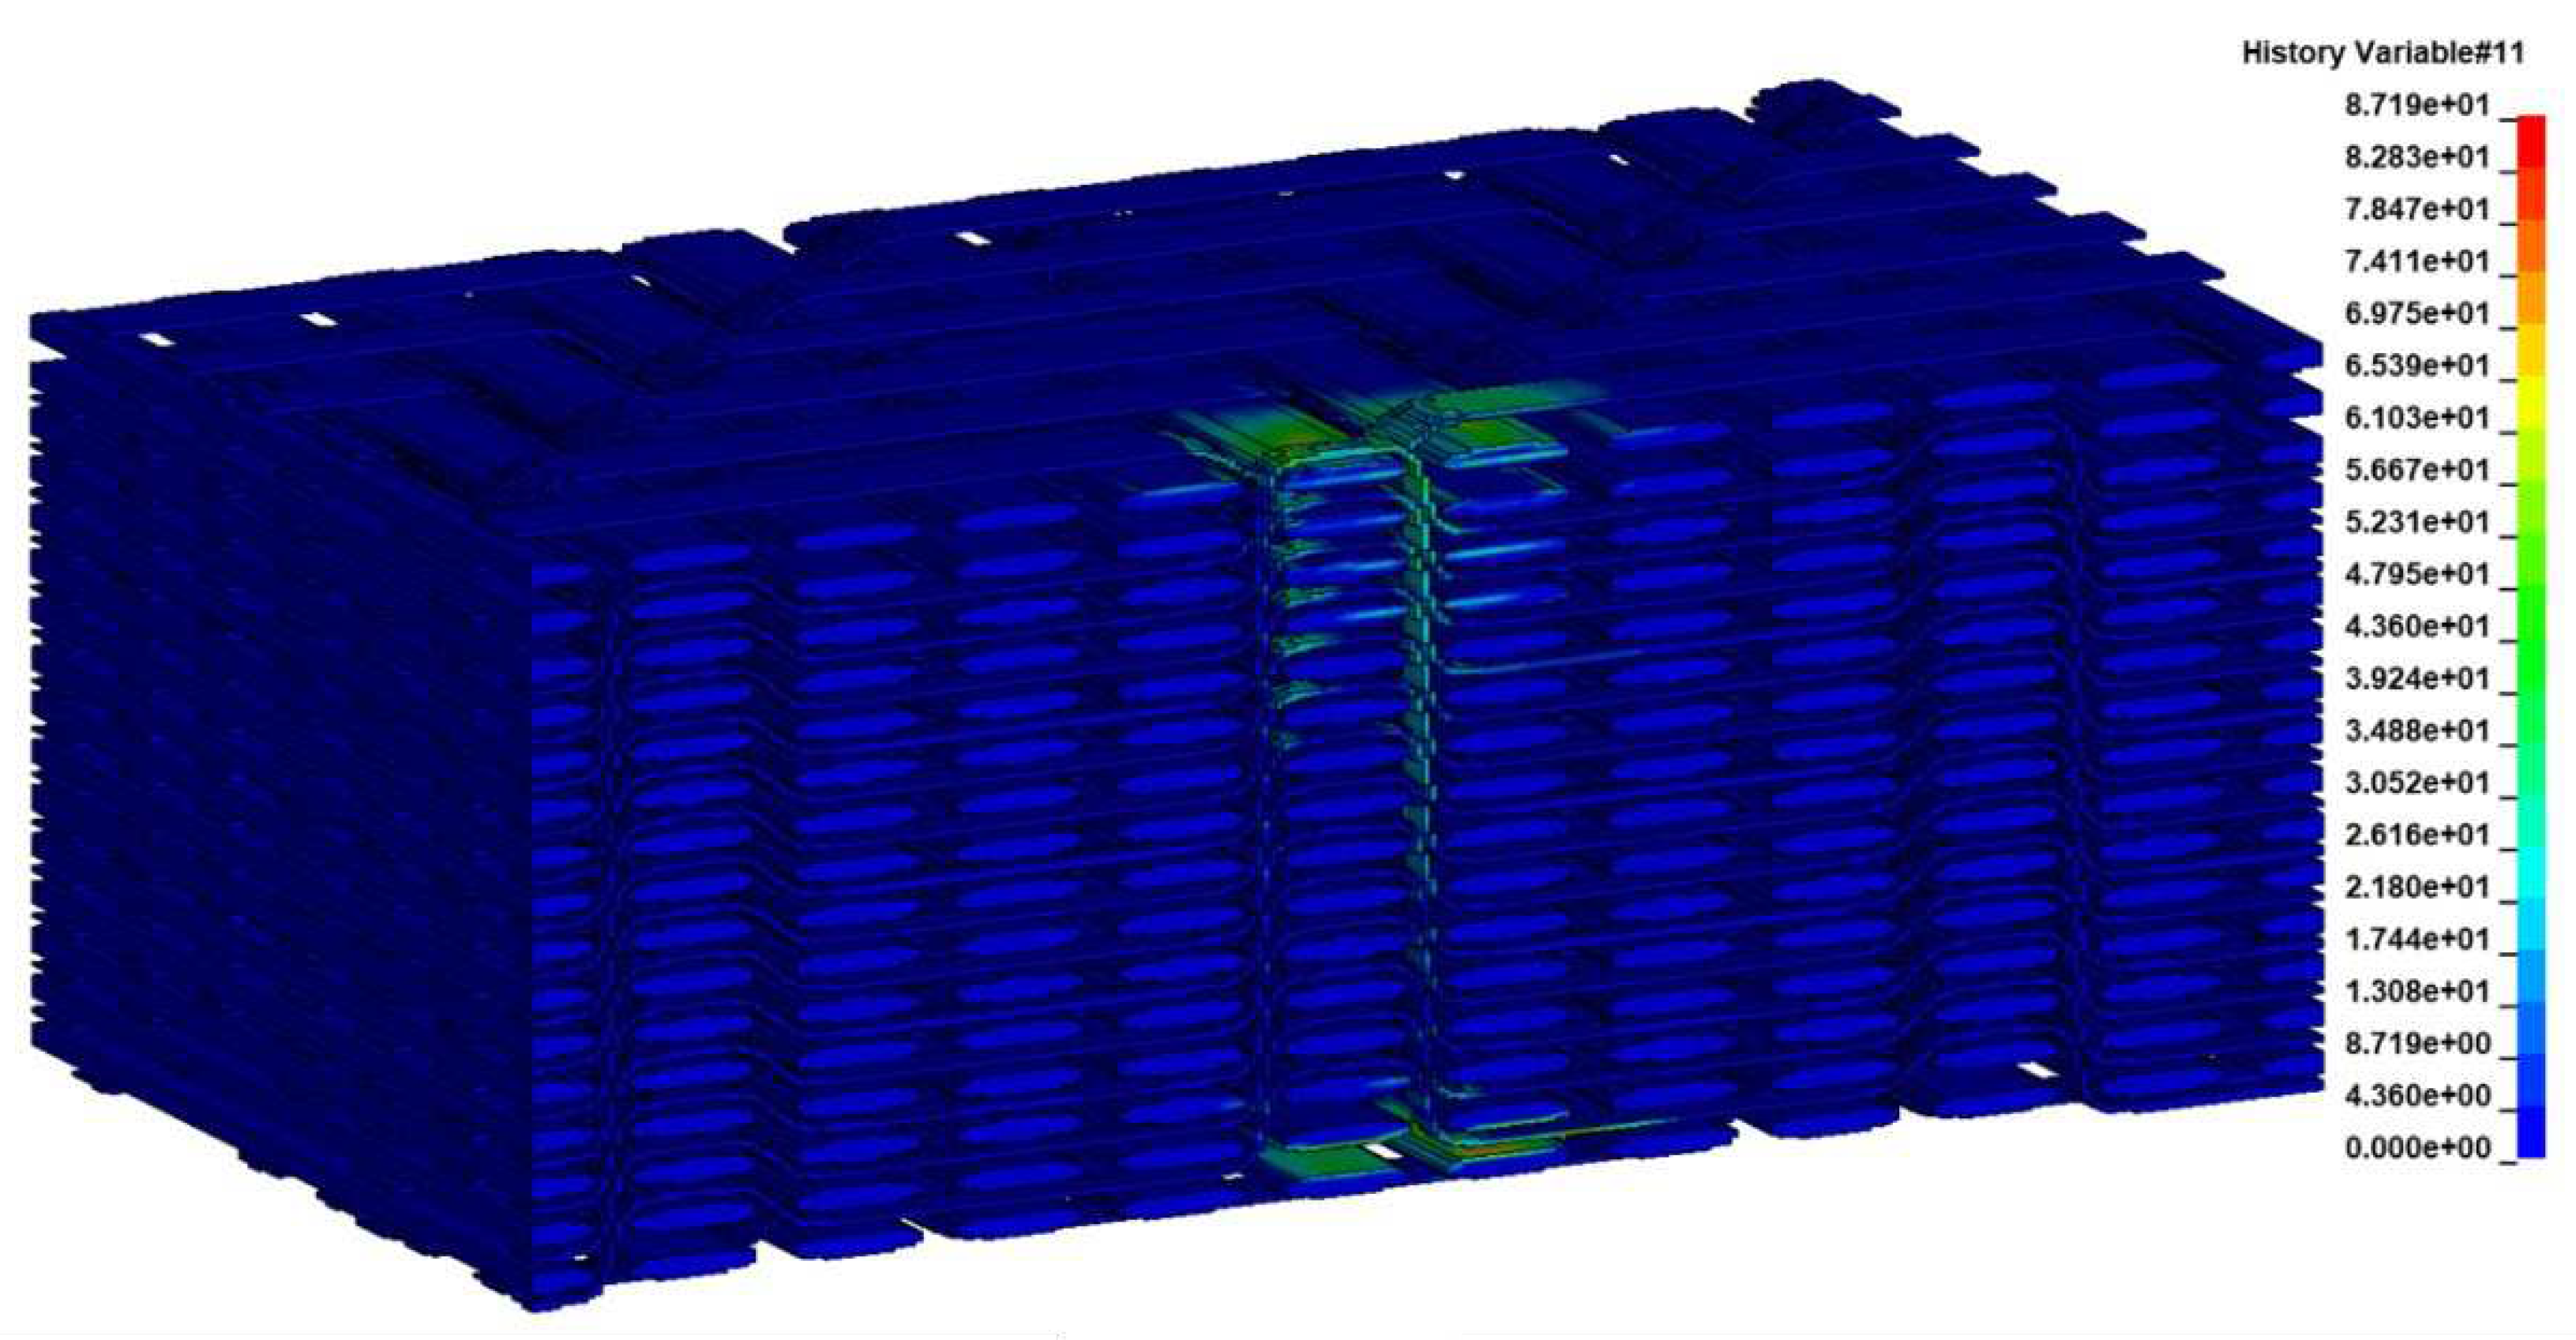
Figure 18.
Predicted matrix damage within the fiber bundles perpendicular to the fiber direction.
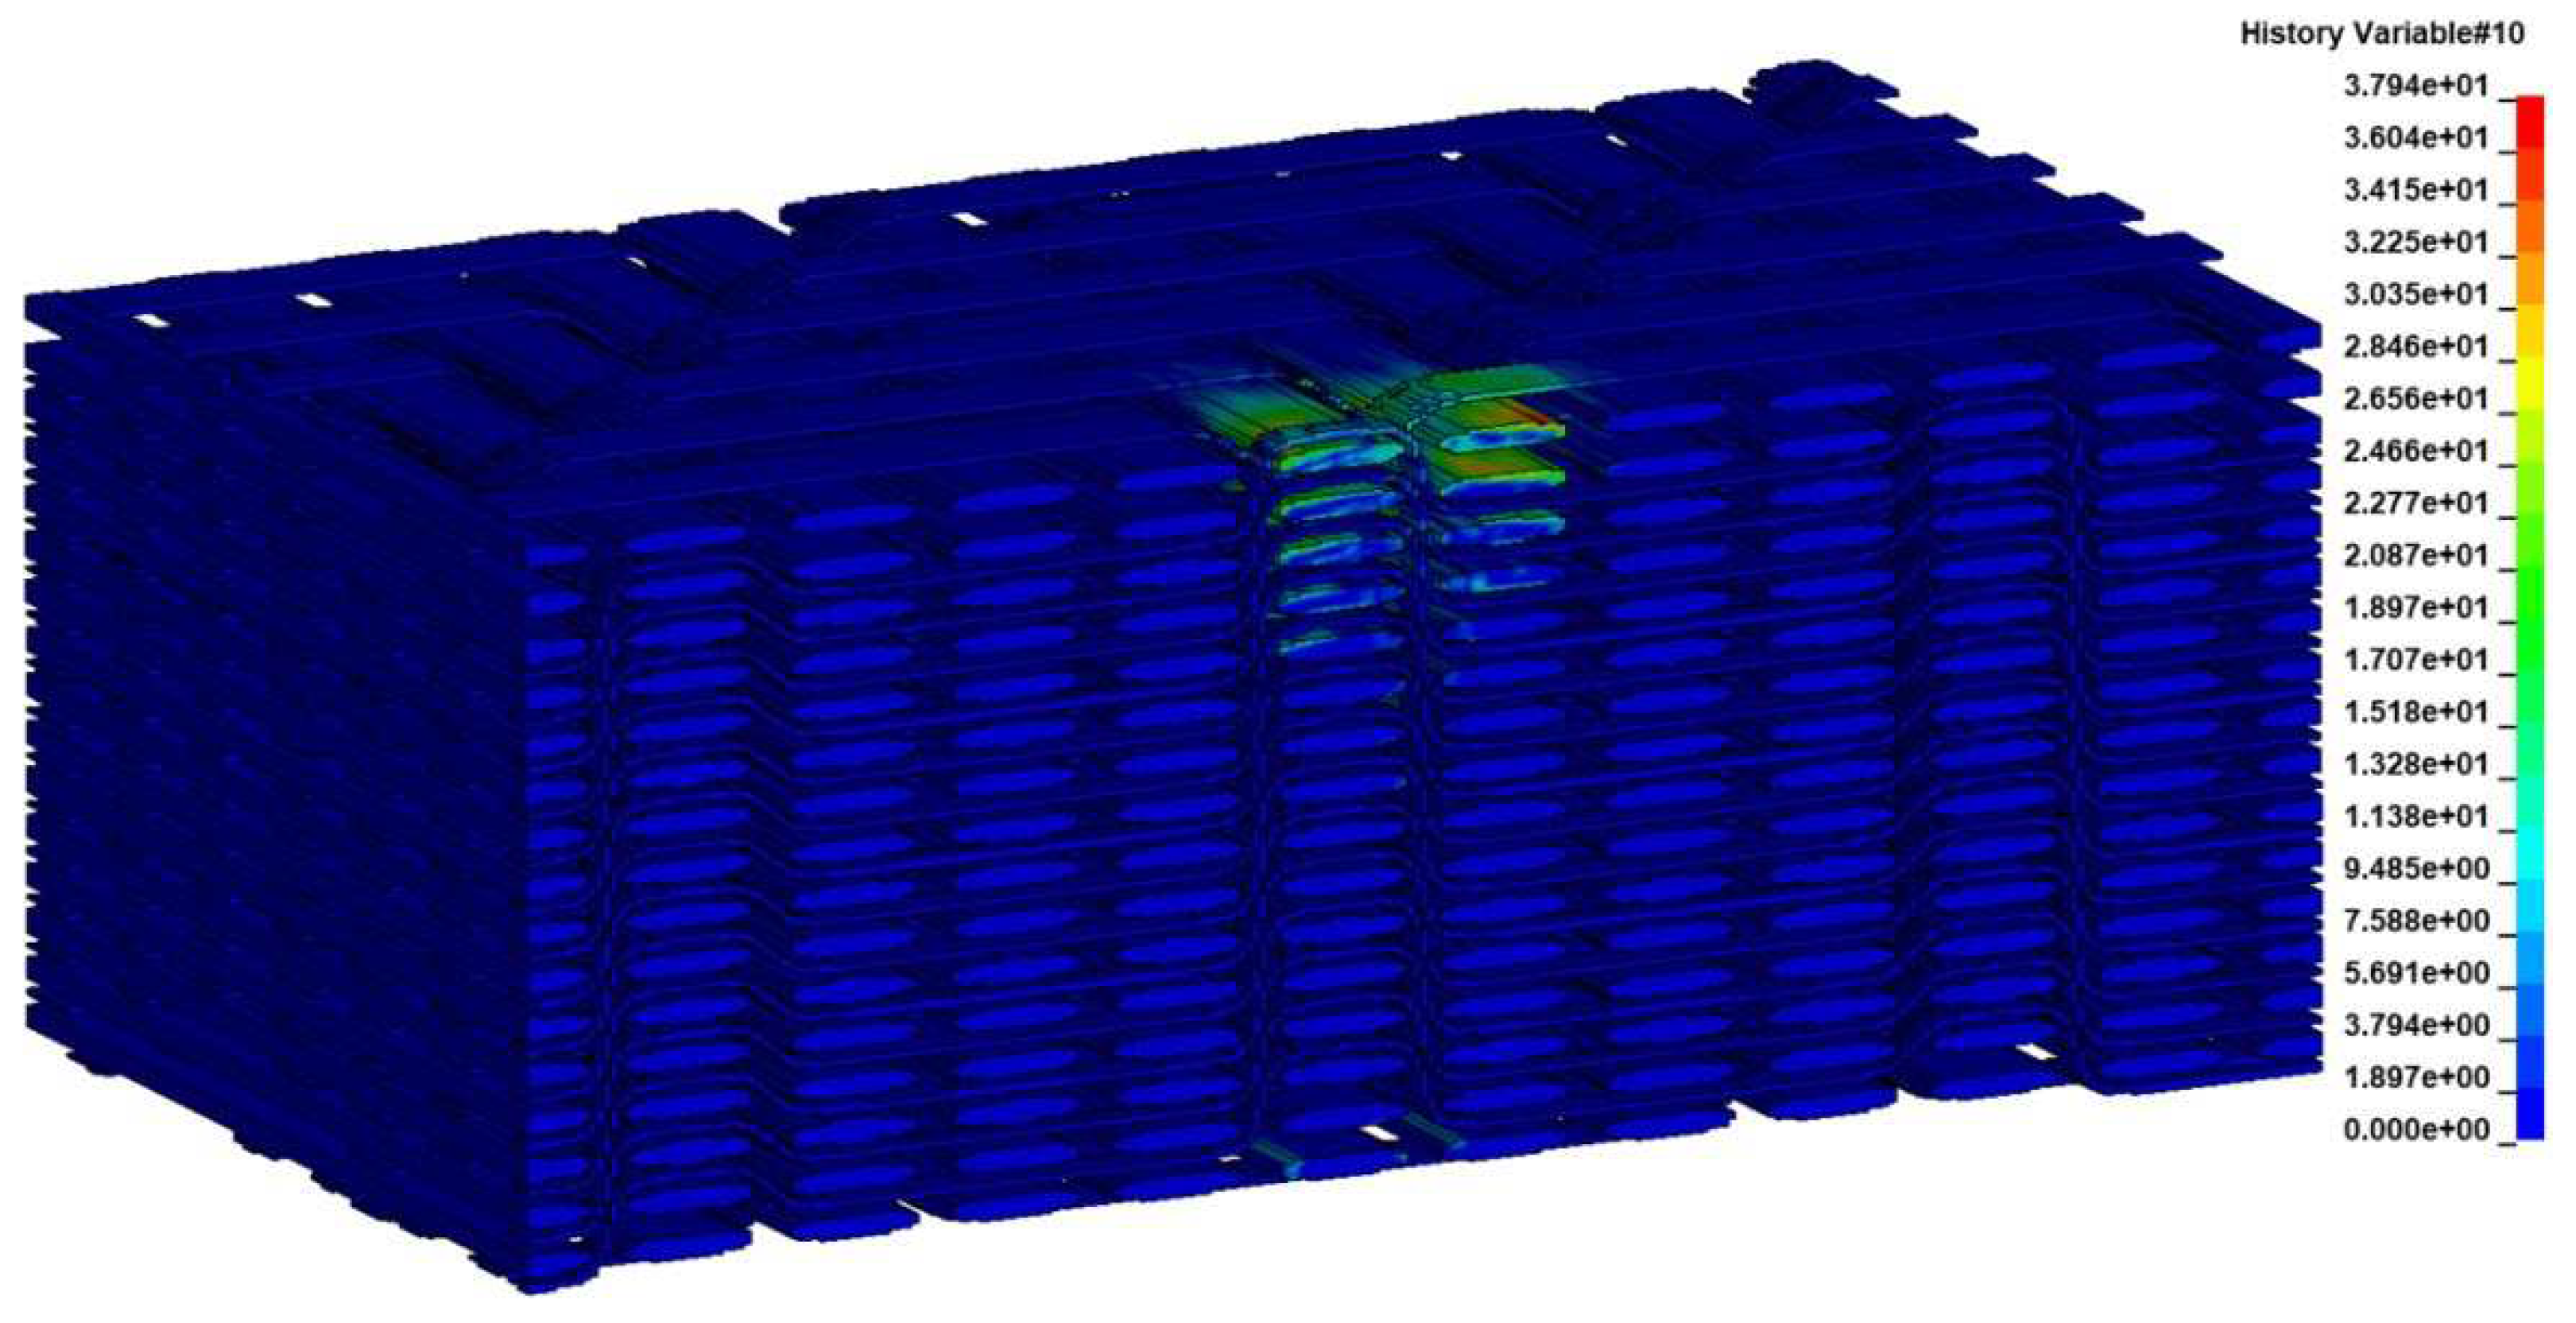
Figure 19.
Predicted fiber damage.
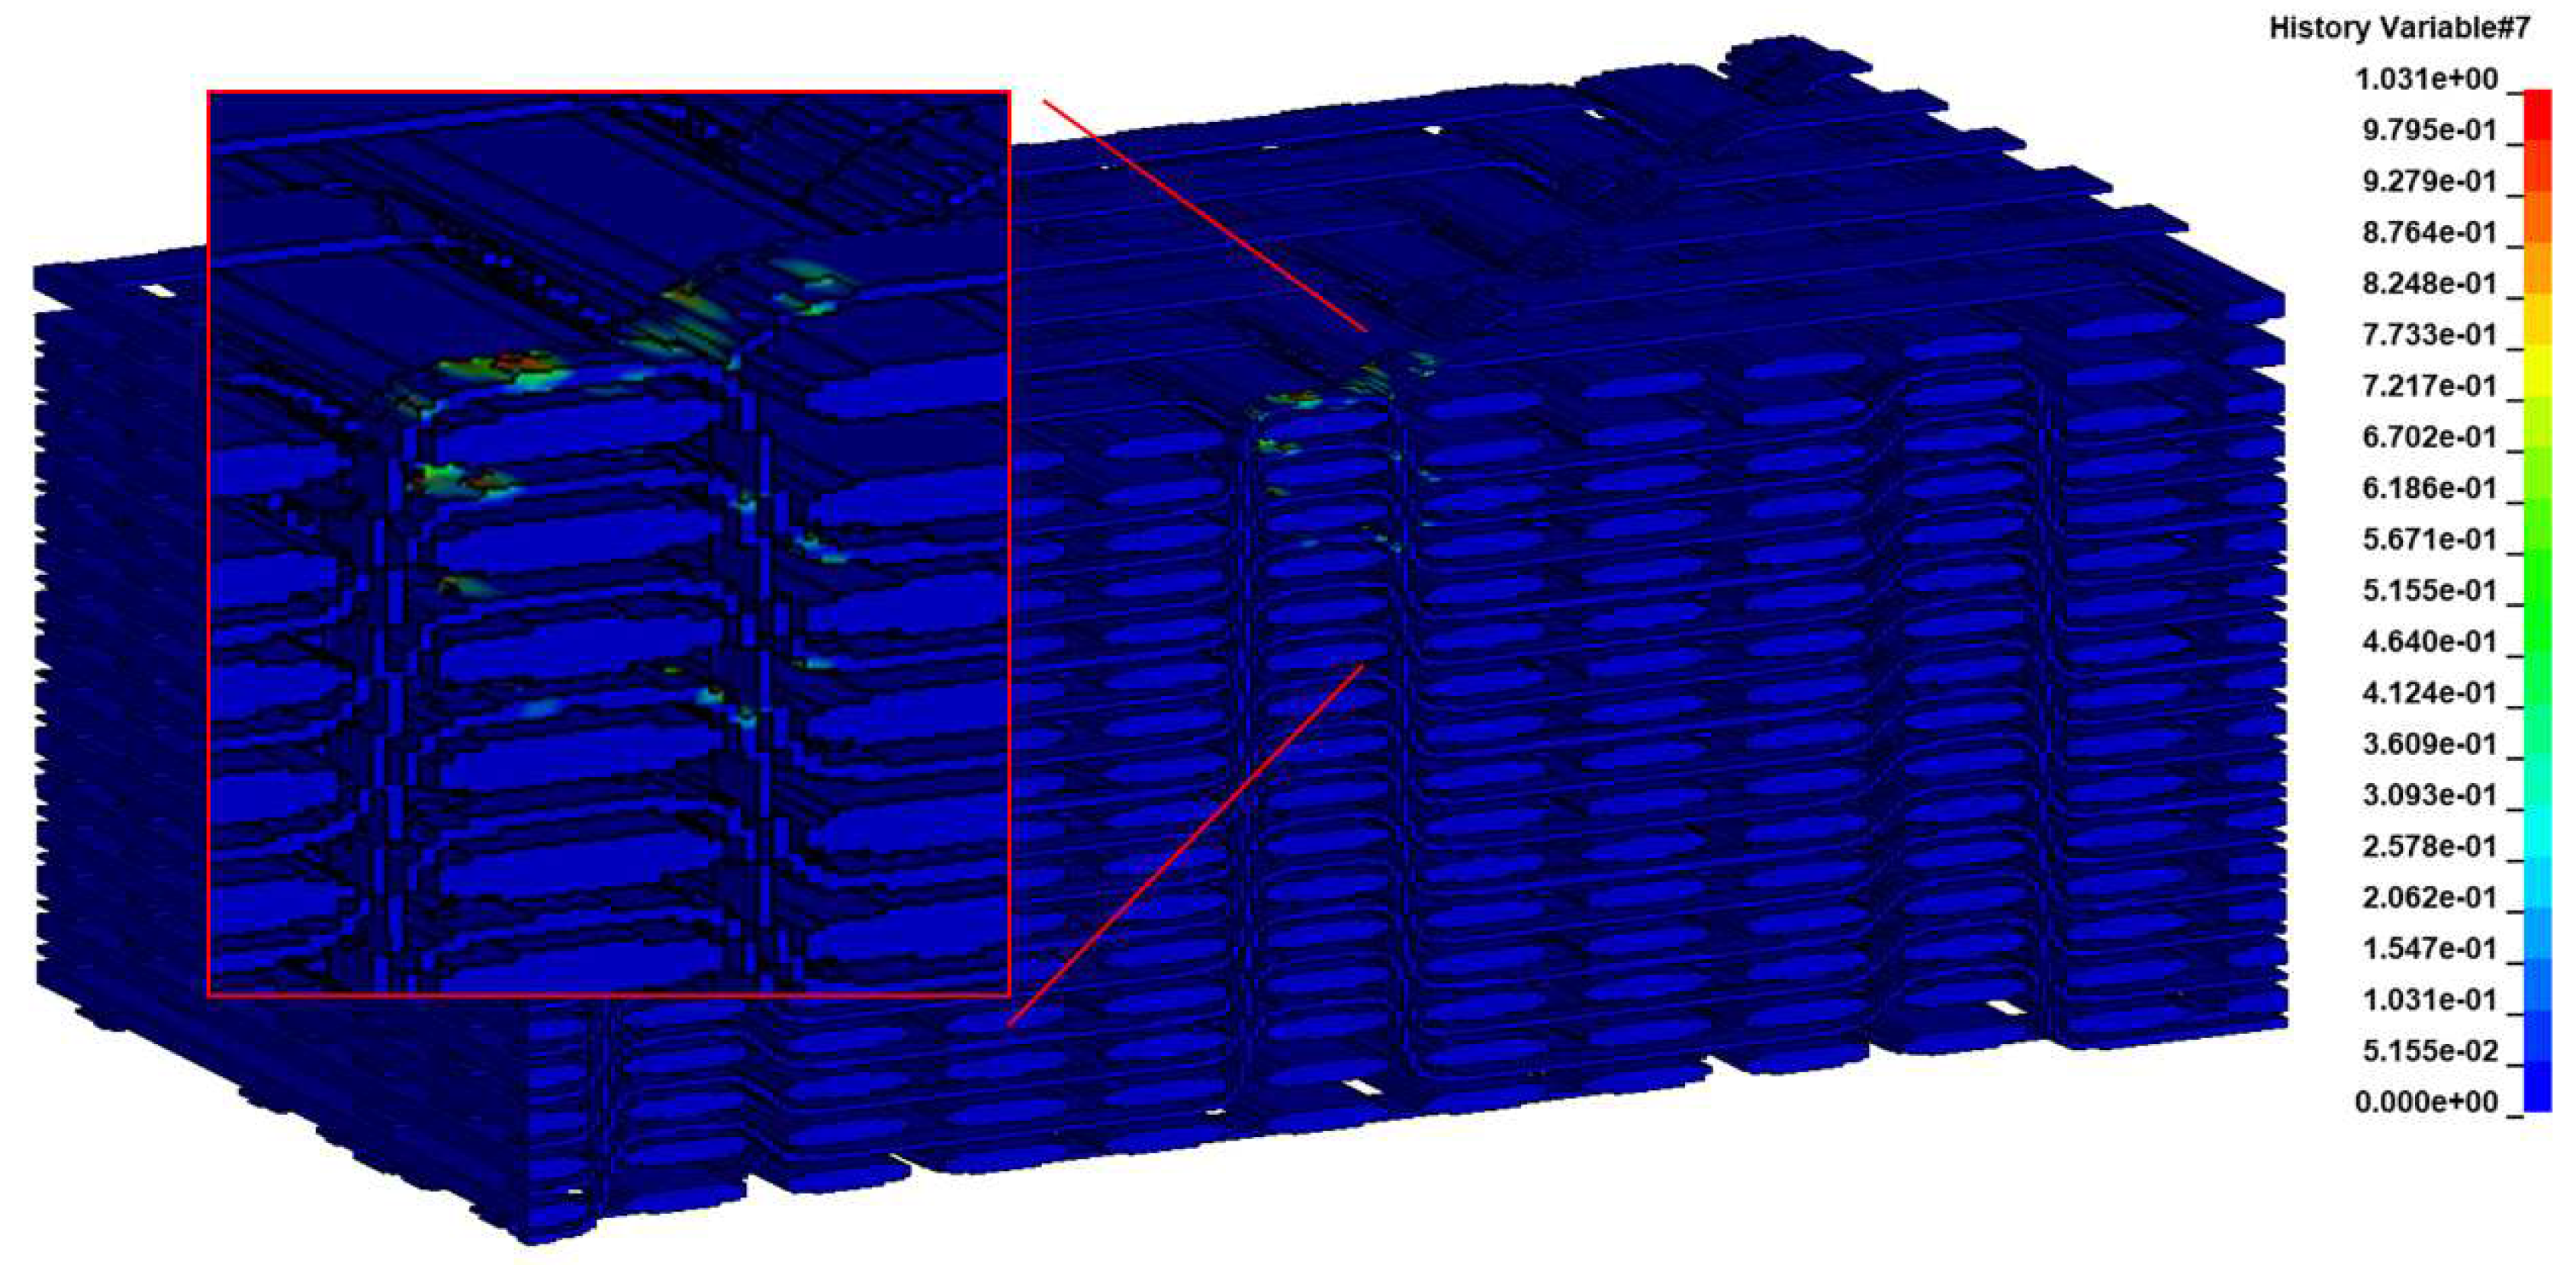
Figure 20.
Matrix damage predicted by the homogenized model: (a) parallel to the fibers (a) and perpendicular to the fibers.
Figure 20.
Matrix damage predicted by the homogenized model: (a) parallel to the fibers (a) and perpendicular to the fibers.
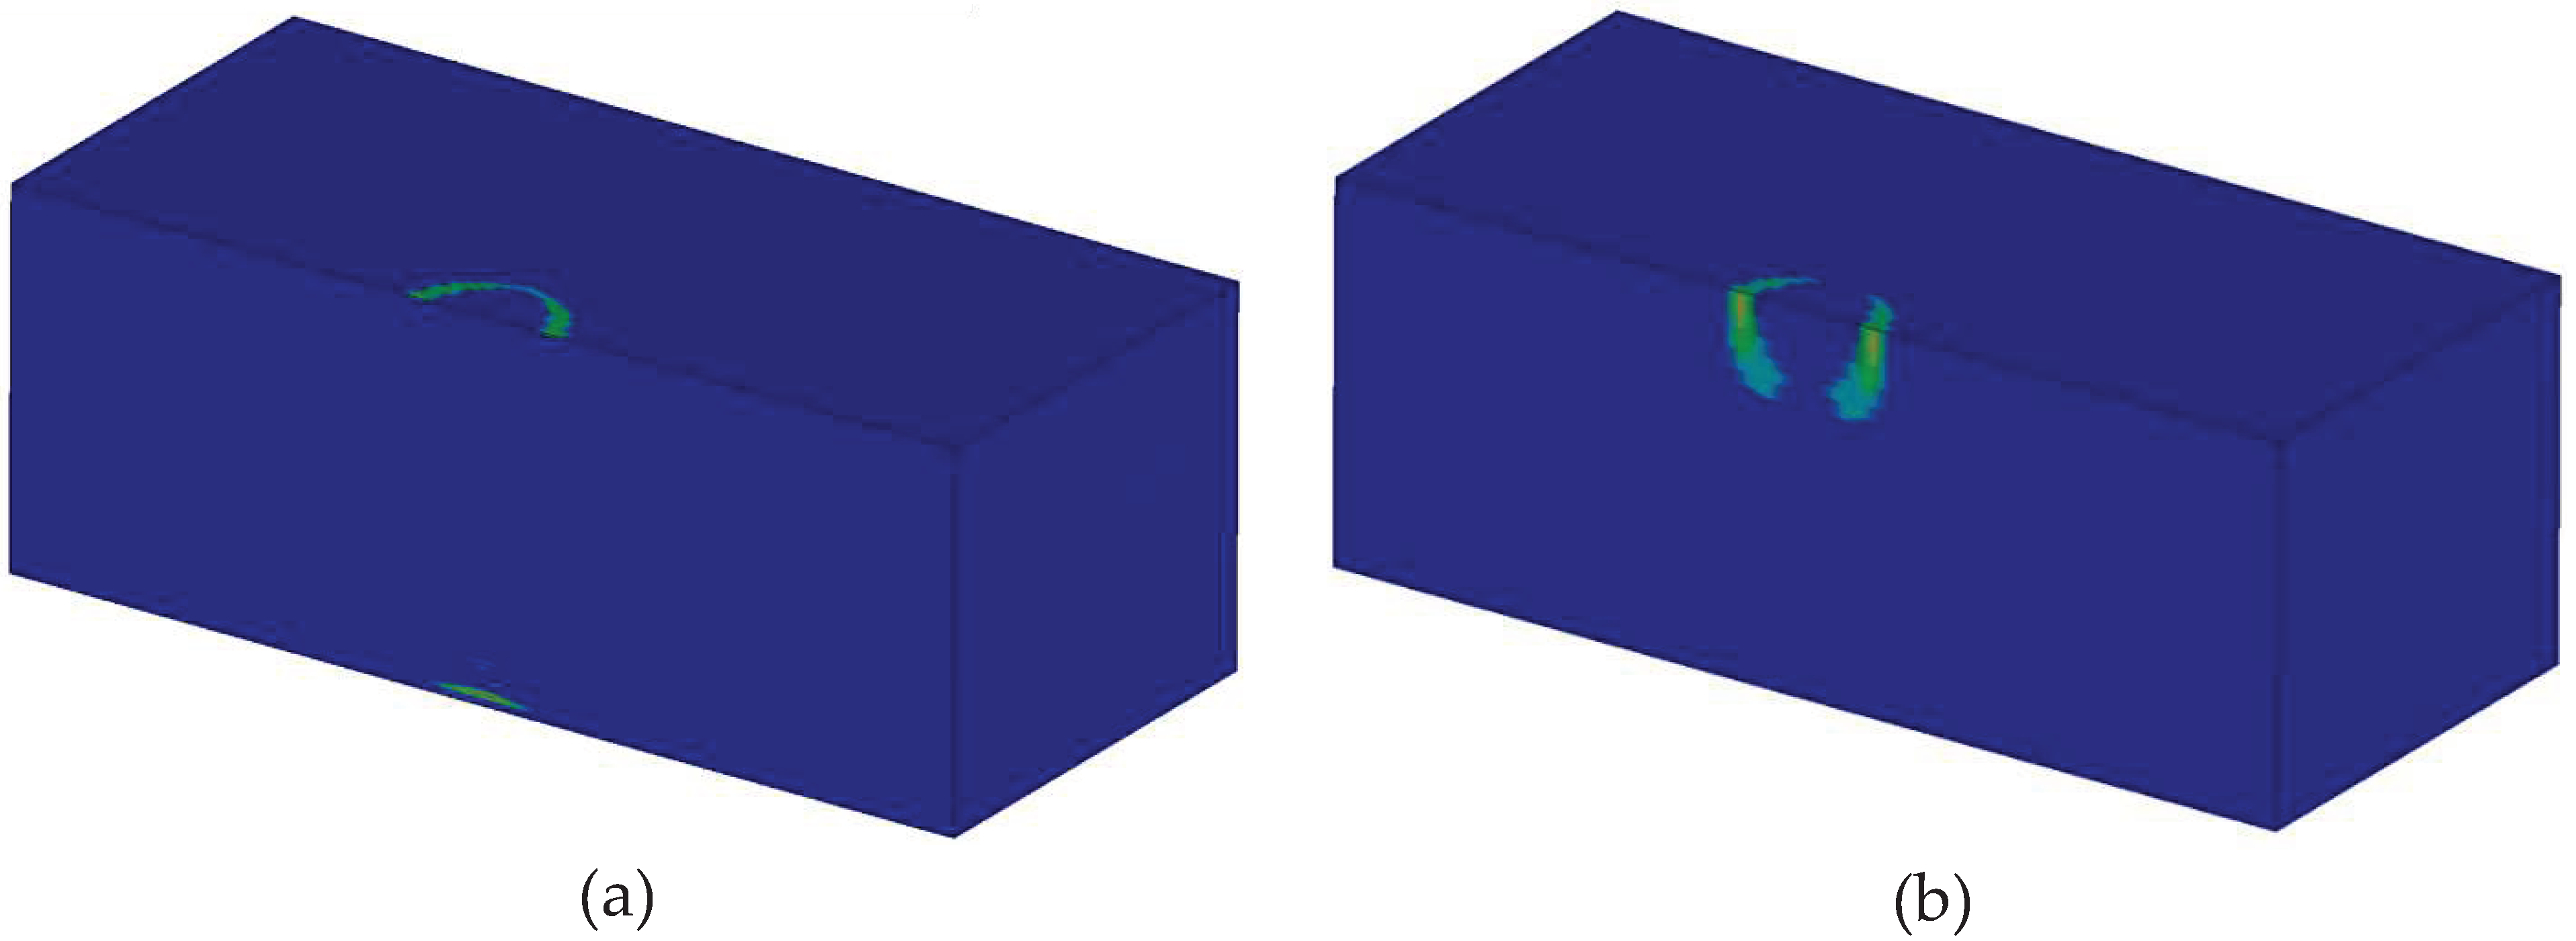

Table 1.
Element sizes used in the mesh density study.
| Name | Element Type | Element Size |
|---|---|---|
| SQ1 | Square | 0.07 mm x 0.07 mm |
| SQ2 | Square | 0.1 mm x 0.1 mm |
| SQ3 | Square | 0.15 mm x 0.15 mm |
| R1 | Rectangle | 0.095 mm x 0.27 mm |
| R2 | Rectangle | 0.05 mm 0.13 mm |
Table 2.
IM7 Fiber properties.
| Fiber Properties | Reference | |
|---|---|---|
| Elastic modulus, Ef11 (GPa) | 276 | [36] |
| Elastic modulus, Ef22f (GPa) | 19.5 | [36] |
| Elastic modulus, Ef33 (GPa) | 19.5 | [36] |
| Shear modulus, Gf12 (GPa) | 70 | [36] |
| Shear modulus, Gf23 (GPa) | 7.8 | [36] |
| Poisson’s ratio, Vf12 | 0.28 | [36] |
| Poisson’s ratio, Vf23 | 0.25 | [36] |
| Tensile strength, Fft (MPa) | 5516 | [37] |
Table 3.
Matrix 2896 properties.
| Matrix Properties | Reference | |
|---|---|---|
| Elastic modulus, Em (GPa) | 3.2 | [38] |
| Poisson’s ratio, Vm | 0.31 | [38] |
| Shear modulus, Gm (GPa) | 1030.53 | [38] |
| Tensile strength, Fmt (MPa) | 96 | [38] |
| Compressive strength, Fmc (MPa) | 96 | [38] |
| Shear strength, Fms (MPa) | 80 | [39] |
Table 4.
Homogenized properties of the fiber bundles.
| Composite Fiber Bundle Properties | |
|---|---|
| Longitudinal elastic modulus, E11 (GPa) | 262.36 |
| Transverse elastic modulus, E22, E33 (GPa) | 15.54 |
| Shear modulus, G12 (GPa) | 16.11 |
| Shear modulus, G23 (GPa) | 5.87 |
| Poisson’s ratio, v12 | 0.282 |
| Poisson’s ratio, v23 | 0.268 |
| Longitudinal tensile strength, F1t (MPa) | 5245 |
| Transverse tensile strength, F2t, F3t (MPa) | 64.00 |
| Longitudinal compressive strength, F1c (MPa) | 20610.69 |
| Transverse compressive strength, F2c, F3c (MPa) | 64.00 |
| Shear strength, F23 (MPa) | 57.57 |
| Shear strength, F12 (MPa) | 80 |
Table 5.
Strength and Youngs’s modulus of LY 556 in different strain rates [40].
Table 5.
Strength and Youngs’s modulus of LY 556 in different strain rates [40].
| Strain Rate, (1/s) | Strength, Xc (MPa) | Young's Modulus, E (GPa) | Ultimate Strain, ɛmax (%) |
|---|---|---|---|
| 0.001 | 120 | 3.5 | 3.4 |
| 683 | 194 | 5.43 | 3.3 |
| 728 | 200 | 5.6 | 3.55 |
| 1229 | 206 | 6.13 | 3.5 |
| 1513 | 210 | 7.51 | 2.86 |
| 1890 | 214 | 8.13 | 2.9 |
Disclaimer/Publisher’s Note: The statements, opinions and data contained in all publications are solely those of the individual author(s) and contributor(s) and not of MDPI and/or the editor(s). MDPI and/or the editor(s) disclaim responsibility for any injury to people or property resulting from any ideas, methods, instructions or products referred to in the content. |
© 2024 by the authors. Licensee MDPI, Basel, Switzerland. This article is an open access article distributed under the terms and conditions of the Creative Commons Attribution (CC BY) license (https://creativecommons.org/licenses/by/4.0/).
Copyright: This open access article is published under a Creative Commons CC BY 4.0 license, which permit the free download, distribution, and reuse, provided that the author and preprint are cited in any reuse.


