
Submitted:
29 December 2023
Posted:
04 January 2024
You are already at the latest version
Abstract
Inflammation is widely acknowledged as a significant characteristic of cancer, playing a substantial function in both the initiation and advancement of cancers. In this research, we planned to investigate the comparison among pan-immune inflammation markers and other well-known markers (systemic immune inflammation index and neutrophil to lymphocyte ratio) to predict prognosis in individuals treated with radical cystectomy for bladder cancer. Methods: In this retrospective analysis, we focused on preoperative PIV, systemic immune inflammation index (SII), and neutrophil-lymphocyte ratio (NLR) in 193 individuals managed with radical cystectomy for bladder cancer between January 2016 and November 2022. Multivariable logistic regression assessments were perfomred to assess the predictive capabilities of PIV, SII, and NLR for infiltration of lymph nodes (N), aggressive tumor stage (pT3/pT4), and any non-organ limited disease at the time of RC. Multivariable Cox regression analyses were conducted to assess the predictive impact of PIV on Relapse-free survival (RFS), Cancer-specific survival (CSS), and Overall survival (OS). Results: Our individuals were divided into high PIV and low PIV cohorts using the optimal cut-off value (340.96 x 10⁹/ L) based on receiver operating characteristic curve analysis for relapse-free survival. In multivariable preoperative logistic regression models, only SII and PIV correlated with the infiltration of lymph nodes, aggressive disease, and any non-organ confined disease. In multivariable Cox regression models considering presurgical clinicopathological variables, an higher PIV was associated with diminished RFS (p = 0.017) and OS (p = 0.029). In addition, in multivariable Cox regression models for postoperative outcomes, a high PIV correlated with both RFS ( p = 0.034) and OS ( p= 0.048). Conclusions: Our study suggests that PIV and SII are two very similar markers that may serve as an independent and significant predictor of aggressive disease and worse survival impacts on individuals undergoing radical cystectomy for bladder neoplasm.
Keywords:
urothelial carcinoma
; inflammation
; pan-immune inflammation value
; radical cystectomy
Introduction
Bladder cancer, being a frequently encountered urological malignancy, is a disease of complex management that imposes a significant burden on society, with an annual global diagnosis exceeding 430,000 men and women and occupies 10th place among the most common cancers worldwide [1]. Bladder cancer arises from the transitional epithelium, with urothelial bladder cancer being the predominant subtype, representing over 90% of cases [2]. Non-muscle invasive bladder cancer (NMIBC) is highly prevalent, attributed to its indolent natural course (which occurs in approximately 75% of patients) and frequent recurrence. One quarter of bladder cancers cases, along with the majority of non-urothelial carcinoma subtypes, progress to the muscle-invasive stage (MIBC). The management of muscle-invasive cases often involves systemic chemotherapy and/or immunotherapy, radical interventions such as cystectomy or radiotherapy, or palliative care [3]. Despite in recent years, various innovative treatment modalities have surfaced, including antibody-drug conjugates, targeted therapy, and immunotherapy utilizing checkpoint inhibition, a significant portion of the patients develop disease escalation within a five year period, attributed to the elevated incidence of micro metastases [4,5,6]. To date, due to his devious behavior at the time of diagnosis and his inaccurate preoperative clinical staging, only postoperative pathologic features offer a dependable prognostic assessment. In this context, the knowledge and evaluation of potential biomarkers or predictive models play a crucial role in stratifying risks, planning treatments, closely monitoring patients, and determining oncological outcomes. As observed in various neoplasms, immune response cells (neutrophils, monocytes, and lymphocytes), platelets, and their associate signaling pathways constitute crucial elements within the tumor microenvironment, significantly influencing tumor progression and metastasis [7]. Many of these indicators, such as systemic immune inflammation index (SII), platelet-to-lymphocyte ratio (PLR), lymphocyte-to-monocyte ratio (MLR), and systemic inflammation score, have been remarked to forecast the aggressive disease and survival outcomes in various types of neoplasms, including BCa [8,9,10]. Many studies have focused more on these two biomarkers, NLR and SII. About NLR, a meta-analysis of 23 papers highlighted that high NLR was linked to poorer global survival (OS), cancer-specific survival (CSS), and relapse-free survival (RFS) in patients affected by urothelial cancer [11]. An intensified neutrophil response and concurrent suppression of lymphocytes, reflected in a high NLR, have the potential to foster carcinogenesis and hamper the anti-tumor immune response.
The Systemic Immune Inflammation Index (SII), evaluated using the equation: neutrophil count multiplied by platelet count, divided by lymphocyte count, assesses patients' inflammatory and immune response considering three cell lines that play a vital role in the immune process. High SII is closely tied to adverse outcomes and more hostile pathological traits in several types of cancer, including bladder cancer [12,13,14]. Recently, the Pan-immune inflammation value (PIV), which is based on peripheral monocytes, platelets, neutrophils, and lymphocytes, has been employed as an evaluation tool for the preoperative balance of inflammatory factors and immune status, enhancing the ability to make more accurate prognosis prediction and whose role has been clarified in the literature. Our objective was to compare PIV with two other biomarkers commonly used today, SII and NLR, to provide essential insights into the potential association between PIV and adverse cancer-related events within a uniformly characterized and precisely characterized patient cohort. Our single-center and retrospective investigation was designed to assess the prospective preoperative role of PIV as an indicator for malignant condition and adverse results.
2. Materials and Methods
2.1. Patients
The records of 314 patients who underwent radical cystectomy and lymphadenectomy at the hospital of the researcher from January 2016 to November 2022 were examined. We only evaluated patients with non-metastatic urothelial bladder cancer and did not consider other histologic variants. The data collection followed the principles outlined in the Declaration of Helsinki and obtained endorsement from the Institutional Ethical Board. Of all patients who underwent RC, we excluded those who could have an altered inflammatory/immune profile independent of disease and surgery. In particular, patients with previous radiotherapy of the pelvis (3), previous surgery (1), neoadjuvant chemotherapy (115), and a history of autoimmune disease (2) were excluded from our analysis. Finally, this retrospective study included 193 enrolled patients, all of whom underwent both open and robotic radical cystectomy (RC) along with lymphadenectomy. The selection of lymphadenectomy extent and the method of urinary reconstruction were determined taking into consideration the individual’s medical traits and the doctor’s discernment. Prior to RC, we performed routine presurgical examinations, clinical and physical tests, and imaging studies (computer tomography or magnetic resonance) to rule out metastases. The RC specimens were examined by a specialized uropathologist who staged them a3ccording to the 2017 classification (8th edition) of the Tumor Nodes Metastasis (TNM) staging. The histological grading was also reviewed using the 2004/2016 World Health Organization system.
2.2. Data gathering
Patient features prior to surgery were age, sex, smoking condition, diabetes, body composition index or BMI, clinical staging (cT), operative technique, urinary reconstruction, tumor grading (pT), nodal status (pN), lymph vascular infiltration (LVI) and adjuvant therapy. Laboratory examinations included neutrophil count (109/ l), platelet count (10 9/ l), monocyte count (109/ l) and lymphocyte count (109/ l). PIV, SII, and NLR were the results of "neutrophil count x platelet count x monocyte count /lymphocyte count," "neutrophil count x platelet count/lymphocyte count," neutrophil count/lymphocyte count, "respectively. The PIV value was derived through the construction of a diagnostic performance curve (ROC) curve, utilizing relapse as the outcome to optimize the Youden index. Subsequently, individuals were categorized into low PIV and high PIV groups, determined by the optimal cut-off PIV value (< 340.96 and > 340.96, respectively).
2.3. Outcomes
Association between inflammatory biomarkers and unfavorable pathological characteristics, including lymph node infiltration, advanced tumor grading (pTstage), and locoregionally extended state (defined as any progressed pT stage and lymphatic infiltration) at RC pathology, were established as the primary outcomes of our study. As secondary outcomes, we analyzed survival outcomes as relapse-free survival (RFS), cancer-specific survival (CSS), and overall survival (OS). We defined RFS as the time from radical cystectomy (RC) to the first occurrence of local relapse or systemic spread. CSS and OS were established as the duration from surgery to death from neoplasm and from general mortality, respectively.
2.4. Statistical methodology
Statistical analysis was performed using STATA/SE version 18 (StataCorp, College Station, TX, USA). With the ROC curve and the Youden index, we obtained the best cut offs for each of the biomarkers analyzed. Descriptive statistics were reported as medians and interquartile ranges (IQR) for continuous variables, while frequencies and percentages for categorical variables. The assessment of patient characteristics involved employing the Mann-Whitney U test for continuous data and utilizing the chi-square test and Fisher’s exact tests for categorical data. Statistical significance was defined as a p-value below 0.05. Correlation between preoperative features (lymph node infiltration, advanced tumor grading (pT3/pT4) and locoregionally extended state) and PIV, SII and NLR were examined through univariable and multivariable logistic regression models. To gauge the predictive efficacy of each model, we determined the Area under the Curve (AUC) from the ROC analysis. At the same time, we applied the Hosmer-Lemeshow test to appraise the model's effectiveness. Relapse-free survival rate (RFS), Cancer-specific survival rate (CSS), and Overall survival rate (OS) were established by the Kaplan-Meier, and the relationship of RFS, CSS, and OS was carried out using log-rank tests. Univariable and multivariable Cox proportional hazard regression models were conducted to determine the correlation between PIV and RFS, CSS, and OS. The Harrel’s C-index or concordance index was used to evaluate the discriminatory power of models and with likelihood ratio test we compared the goodness of fit of two statistical models, where one model was a restricted version of the other (model without PIV).
3. Results
3.1. Patient features
The demographic features of the patients stratified into the two groups of PIV are outlined in Table 1. The median estimates of NLR, SII, and PIV (x109) were 3.0 (quartile 2.1 - 4.3), 712.5 (quartile 460.5 - 1215.8), and 311.4 (quartile 185.5 – 644.5), respectively. The optimal cut-off value of NLR, SII, and PIV (x 109) was 3.14, 640.27, and 340.96, respectively. The corresponding AUC for the three markers was 0.57, 0.63 and 0.65, respectivel (Figure 1). An elevated presurgical PIV was more frequently detected in individuals with conditions characterized by more advanced clinical (p < 0.001) and histological stages (p = 0.001), lymph node involvement (p = 0.004), lymph vascular invasion (p < 0.001), lcoregionally extended state ( p < 0.001) and disease prgression ( p = 0.004).
3.2. Oncological results
Table 2, Table 3 and Table 4 show the results of logistic regression analyses (both univariable and multivariable) concerning the prediction of oncological outcomes of three biomarkers. Elevated PIV linked with an increased likelihood of infiltration of lymph nodes (odds ratio (OR) 1.11, 95% confidence interval (95% CI): 0.34-1.89; p = 0.005), advanced Tumor grading (pT3/pT4) (OR 1.17, 95% CI: 0.58-1.76); p < 0.001), and locoregionally extended state (OR 1.32, 95% CI: 0.72-1.92; p < 0.001). We had different results about the NLR. High NLR correlated with aggressive pT stage (OR 0.63, 95% CI: 0.06-1.21; p = 0.02). High SII correlated with an increased likelihood of nodal invasion (OR 1.35, 95% CI: 0.47-2.23; p = 0.003), advanced Tumor grading (OR 0.81, 95% CI: 0.22-1.40; p = 0.007) and locoregionally extended state (OR 1.11, 95% CI: 0.52-1.71; p < 0.001).
In multivariable logistic regression models, adjustments were made for presurgical features (age, sex, smoke, and disease staging), an elevated PIV maintained an independent association with advanced tumor grading (OR 2.87, 95% CI: 1.36-6.04; p = 0.005) and locoregionally extended state (OR 3.30, 95% CI: 1.60-6.77; p = 0.001). SII also showed a statistically independent association with lymph node infiltration (OR 2.91, 95%CI: 1.09-7-72; p = 0.03), complex tumor grading (OR 2.09, 95% CI: 1.00-4.40; p = 0.05) and locoregionally extended state (OR 2.96, 95%CI: 1.44-6.08; p = 0.003). Table 3 shows no significant correlation between NLR and the three variables in the multivariable logistic regression analysis.
3.3. Long-term outcomes
Individuals with elevated PIV experienced a reduced of follow-up duration (36 vs 23 months, p < 0.001). Likewise, individuals exhibiting a high SII also exhibited a reduced median follow-up duration (24 vs. 37 months, p = 0.002). Although patients with high NLR exhibited a shorter median follow-up, the difference did not reach statistical significance (27 vs. 32 months, p = 0.14). Through the follow-up duration, recurrences occurred in 74 (38.3%) individuals, and 96 (49.7%) patients succumbed, with 52 (26.9%) of these fatalities linked to neoplasm. Figure 2 compares RFS between PIV, SII, and NLR groups. The Kaplan-Meier estimates curves revealed significantly poorer survival outcomes across all three biomarkers regarding relapse-free interval (RFS). Figure 3 illustrates a correlation regarding Cancer-specific Survival (CSS) for PIV, SII, and NLR. Individuals exhibiting elevated PIV and SII levels experienced a notably diminished Cancer-specific survival rate (CSS) compared to those with lower PIV and SII levels (p = 0.05 and p = 0.02), respectively. There wasn't a significant difference for CSS about the NLR biomarker between high NLR and low NLR. Lastly, we evaluated the overall survival among the three groups (Figure 4). As can be seen in Figure 4, individuals with an elevated PIV, SII, and NLR have a lower overall survival than those with lower values (p < 0.001, p < 0.001 and p = 0.04), respectively.
We employed a Cox regression model to explore the relationship between the PIV value and time to the event of interest. Initially, we assess the PIV’s effect considering preoperative variables, including smoke, gender, and clinical T stage. In this kind of analysis, an elevated PIV was significantly linked with RFS (hazard ratio (HR): 1.89, 95% CI:1.12-3.19; p = 0.017) and global survival (OS) (HR: 1.64, 95% CI: 1.05-2.56; p = 0.029) (Table 5.)
Subsequently, we examined how this association changes when introducing postoperative variables, such as pT stage, Lymph vascular invasion, lymph node infiltration, and adjuvant chemotherapy. Also, in this case, high PIV was intensely associated with RFS (HR 1.74, 95% CI: 1.04-2.92; p = 0.034) and OS (HR 1.58, 95% CI: 1.00-2.49; p = 0.048) (Table 6.). Despite the addition of a preoperative PIV to the reference model not yielding a significant discrimination potential of the model for CSS ( p = 0.67), it did, however, result in a considerable improvement of both RFS (by 1%, p = 0.03) and OS (by 1%, p =0.04).
4. Discussion
We analyzed the prognostic implications of preoperative PIV and compared its effects with other biomarkers in patients undergoing RC for BCa. The assessment and recognition of systemic variables that could indicate a poorer prognosis in patients with various diseases have been the subject of growing research [15]. Our study represents the first analysis in existing literature, encompassing an evaluation of PIV with other distinct systemic indices associated with an unfavorable prognosis among patients with BCa. In a previous article, it was reported that high PIV in individuals with non-metastatic MIBC was linked to worse global survival and cancer-specific survival [16]. Conforming to the findings of the exclusive article in the literature [16], an elevated PIV was related to increased aggressiveness of urothelial bladder cancer (worst clinical T stage, lymph node infiltration, lymph vascular involvement, progressive disease) and continued to be independently linked to pT3/T4 disease, locoregional advanced disease, and lymph node metastasis. Also, our analysis revealed that high PIV (> 340.96) demonstrated an independent correlation with survival results (both RFS and OS) in a model that accounted for both pre and post-surgical factors. The PIV and SII exhibited better predictive power than NLR. As far as our understanding goes, this study is the initial observation of an association within a logistic model that integrates postsurgical features. Furthermore, the study reveals the intricate interplay between inflammation and cancer, which is a pivotal aspect underpinning the complex dynamics of tumorigenesis and disease progression. Inflammatory responses mirror the systemic immune status, unveiling the intricacies of compromised immune surveillance induced by cancer cells [17]. The biomarkers analyzed in this study comprise cells that are key players in the body's immune and inflammatory processes. Neutrophils and platelets have been demonstrated to facilitate the advancement of neoplasm [18]. Neutrophils promote cellular cohesion, acting as a bridge as they bind circulating tumor cells (CTCs) to the endothelium of the organ in which they are destined (a contact-dependent mechanism) [19]. In addition, neutrophils can release soluble components that stimulate endothelial and parenchymal cells, thereby augmenting the attachment of CTCs in distant organs [20,21,22]. Platelets, through the release of dense adenine nucleotide granules in the tumor stroma, assist the migration of tumor cells across the endothelium and, in addition, support tumor cell survival in the bloodstream and induce a pro-metastatic phenotype [23]. Monocytes play a crucial role in tumor development and metastasis. Tumor-associated macrophages derived from peripheral blood mononuclear cells can suppress the acquired immune response [24]. Conversely, lymphocytes can exert an anti-tumoral function by promoting cellular cytotoxicity, impeding tumor cell replication, and bolstering the organism’s immune reaction against tumors [25,26]. It has already been shown in the literature that NLR is an unfavorable prognostic indicator in patients diagnosed with urothelial bladder cancer, and a high NLR negatively correlates with DFS [27]. Another meta-analysis by Tang et al., which included 5425 patients across 17 studies, showed that NLR had negative predictive value for OS, CSS, RFS, and PFS [28]. Our findings revealed a statistically significant negative correlation between NLR and OS but not for CSS and DFS. Moreover, it has lower predictive power among the three biomarkers used than SII and PIV for oncological and survival outcomes. Another factor examined is the Systemic Immune inflammation Index, which has become increasingly popular recently. The SII has been employed as a prognostic marker in urological cancers and various other malignancies. Jian-Hui C. et al. showed a relationship between SII and colorectal cancer [29], Wang et al. detected a correlation among elevated SII and lung neoplasm [30], and Zhong et al. discovered a strong connection between an elevated SII and a poorer prognosis in solid tumors [31]. In particular, in bladder cancer, an elevated SII was linked to worse survival and oncological outcomes [32,33]. In addition, the superiority of SII over other biomarkers, such as NLR and PLR, has already been demonstrated in the prognosis of oncological disease [34,35,36]. Our findings are consistent with the existing literature, illustrating that an elevated SII adversely impacts both RFS and OS. Finally, the last biomarker evaluated and compared with the others is the Pan-immune inflammation value, a newly defined inflammation-related index. In 2020, the investigation of PIV commenced in patients with metastatic colorectal cancer, revealing its substantial prognostic value for patient survival. Furthermore, PIV's predictive efficiency was significantly superior to previously recognized inflammation-related markers [37]. A meta-analysis conducted by Qi et al., involving eight articles and 2953 patients with breast cancer, showed that the patients with elevated PIV correlated with shorter OS and PFS [38]. In the context of bladder cancer, specifically, Kayar et al. discovered that an elevated PIV (> 406.29) was associated with diminished OS and DFS [16]. Our analysis reveals that patients with higher PIV (>340.96) had a worse RFS and OS in both Cox regression models incorporating pre and post-operative characteristics. In addition, the biomarker PIV correlated very similarly with SII with oncological and survival outcomes. This data holds the capability to improve predictive models, resulting in a more precise prognosis for patients undergoing RC. Notwithstanding, establishing a clinical utility for PIV as a biomarker goes beyond merely associating high PIV with aggressive disease or compromised survival results in multivariable models [39]. Furthermore, high PIV value may result from other immune/inflammatory pathologies such as chronic inflammation, autoimmune disease, or infectious disease. Nevertheless, further examination of PIV is justified, given its immediate and economical accessibility. The key significance of this analysis resides in its potential benefit for practitioners as a supplementary indicator to assess the prognosis of BCa. This can improve the precision of risk assessment and contribute to more precise treatment planning decisions, including the evaluation of adjuvant therapy, neoadjuvant therapy, or bladder-sparing therapies.
While our study provides valuable insights for the first time, it is essential to recognize its limitations. The primary challenges revolve around the limitations associated with retrospective data collection, small sample size, and monocentric cohort study. This analysis is strengthened by the deliberate exclusion of potential confounding factors related to PIV, the consistent use of the same laboratory for PIV evaluations, and histological examinations conducted by a consistent uropathologist. Although akin to approaches applied in previous studies, determining the optimal PIV cut-off value for BC patients still needs to be discovered. It is crucial to validate our findings externally using independent cohorts to confirm the relevance and applicability of our results.
5. Conclusions
In conclusion, our study suggests that both PIV and SII can serve as independent predictors of aggressive disease and prognosis in bladder cancer patients following radical cystectomy. Looking ahead, the incorporation of SII and PIV into clinical practice holds promise for enhancing diagnostic and prognostic strategies. The ability to identify patients with a more aggressive disease profile early on may guide tailored therapeutic interventions and improve overall clinical results. Further investigation and validation studies are justified to strengthen the applicability of these biomarkers and to explore their potential in personalized medicine and treatment optimization.
Funding
This study did not receive any specific funding from external agencies.
Institutional Review Board Statement
The study was carried out in compliance with the principles of the Declaration of Helsinki.
Informed Consent Statement
The patient(s) have provided written informed consent for the publication of this paper.
Data Availability Statement
All data used in this analysis were sourced from an anonymized database. The code for the analyses can be provided upon request.
Conflicts of Interest
All authors have no conflict of interest to disclose.
References
- Bray, F., Ferlay, J., Soerjomataram, I., Siegel, R. L., Torre, L. A., & Jemal, A. (2018). Global cancer statistics 2018: GLOBOCAN estimates of incidence and mortality worldwide for 36 cancers in 185 countries. CA: a cancer journal for clinicians, 68(6), 394–424. [CrossRef]
- Giridhar, K. V., & Kohli, M. (2017). Management of Muscle-Invasive Urothelial Cancer and the Emerging Role of Immunotherapy in Advanced Urothelial Cancer. Mayo Clinic proceedings, 92(10), 1564–1582. [CrossRef]
- Witjes, J. A., Bruins, H. M., Cathomas, R., Compérat, E. M., Cowan, N. C., Gakis, G., Hernández, V., Linares Espinós, E., Lorch, A., Neuzillet, Y., Rouanne, M., Thalmann, G. N., Veskimäe, E., Ribal, M. J., & van der Heijden, A. G. (2021). European Association of Urology Guidelines on Muscle-invasive and Metastatic Bladder Cancer: Summary of the 2020 Guidelines. European urology, 79(1), 82–104. [CrossRef]
- Bassi, P., Ferrante, G. D., Piazza, N., Spinadin, R., Carando, R., Pappagallo, G., & Pagano, F. (1999). Prognostic factors of outcome after radical cystectomy for bladder cancer: a retrospective study of a homogeneous patient cohort. The Journal of urology, 161(5), 1494–1497. [CrossRef]
- Stein, J. P., Lieskovsky, G., Cote, R., Groshen, S., Feng, A. C., Boyd, S., Skinner, E., Bochner, B., Thangathurai, D., Mikhail, M., Raghavan, D., & Skinner, D. G. (2001). Radical cystectomy in the treatment of invasive bladder cancer: long-term results in 1,054 patients. Journal of clinical oncology : official journal of the American Society of Clinical Oncology, 19(3), 666–675. [CrossRef]
- Ghoneim, M. A., el-Mekresh, M. M., el-Baz, M. A., el-Attar, I. A., & Ashamallah, A. (1997). Radical cystectomy for carcinoma of the bladder: critical evaluation of the results in 1,026 cases. The Journal of urology, 158(2), 393–399. [CrossRef]
- Hanahan, D., & Weinberg, R. A. (2011). Hallmarks of cancer: the next generation. Cell, 144(5), 646–674. [CrossRef]
- Huang, Y., Gao, Y., Wu, Y., & Lin, H. (2020). Prognostic value of systemic immune-inflammation index in patients with urologic cancers: a meta-analysis. Cancer cell international, 20, 499. [CrossRef]
- Fu, X., Li, T., Dai, Y., & Li, J. (2019). Preoperative systemic inflammation score (SIS) is superior to neutrophil to lymphocyte ratio (NLR) as a predicting indicator in patients with esophageal squamous cell carcinoma. BMC cancer, 19(1), 721. [CrossRef]
- Deng, J. P., Hua, X., Long, Z. Q., Zhang, W. W., Lin, H. X., & He, Z. Y. (2020). Erratum to prognostic value of skeletal muscle index and monocyte-to-lymphocyte ratio for lymph node-positive breast cancer patients after mastectomy. Annals of translational medicine, 8(7), 520. [CrossRef]
- Marchioni, M., Primiceri, G., Ingrosso, M., Filograna, R., Castellan, P., De Francesco, P., & Schips, L. (2016). The Clinical Use of the Neutrophil to Lymphocyte Ratio (NLR) in Urothelial Cancer: A Systematic Review. Clinical genitourinary cancer, 14(6), 473–484. [CrossRef]
- Li, X., Gu, L., Chen, Y., Chong, Y., Wang, X., Guo, P., & He, D. (2021). Systemic immune-inflammation index is a promising non-invasive biomarker for predicting the survival of urinary system cancers: a systematic review and meta-analysis. Annals of medicine, 53(1), 1827–1838. [CrossRef]
- Meng, L., Yang, Y., Hu, X., Zhang, R., & Li, X. (2023). Prognostic value of the pretreatment systemic immune-inflammation index in patients with prostate cancer: a systematic review and meta-analysis. Journal of translational medicine, 21(1), 79. [CrossRef]
- Russo, Pierluigi et al. “Is Systemic Immune-Inflammation Index a Real Non-Invasive Biomarker to Predict Oncological Outcomes in Patients Eligible for Radical Cystectomy?.” Medicina (Kaunas, Lithuania) vol. 59,12 2063. 22 Nov. 2023. [CrossRef]
- Halabi, Susan et al. “Developing and Validating Risk Assessment Models of Clinical Outcomes in Modern Oncology.” JCO precision oncology vol. 3 (2019): PO.19.00068. [CrossRef]
- Kayar, Ridvan et al. “Pan-immune-inflammation value as a prognostic tool for overall survival and disease-free survival in non-metastatic muscle-invasive bladder cancer.” International urology and nephrology, 10.1007/s11255-023-03812-w. 29 Sep. 2023. [CrossRef]
- Kim, Jaehong, and Jong-Sup Bae. “Tumor-Associated Macrophages and Neutrophils in Tumor Microenvironment.” Mediators of inflammation vol. 2016 (2016): 6058147. [CrossRef]
- Lolli, Cristian et al. “Systemic immune-inflammation index predicts the clinical outcome in patients with metastatic renal cell cancer treated with sunitinib.” Oncotarget vol. 7,34 (2016): 54564-54571. [CrossRef]
- Auguste, Patrick et al. “The host inflammatory response promotes liver metastasis by increasing tumor cell arrest and extravasation.” The American journal of pathology vol. 170,5 (2007): 1781-92. [CrossRef]
- Chen, Hao-Cheng et al. “Neutrophil elastase induces IL-8 synthesis by lung epithelial cells via the mitogen-activated protein kinase pathway.” Journal of biomedical science vol. 11,1 (2004): 49-58. [CrossRef]
- Coussens, L M et al. “MMP-9 supplied by bone marrow-derived cells contributes to skin carcinogenesis.” Cell vol. 103,3 (2000): 481-90. [CrossRef]
- Liang, Shile et al. “Effects of the Tumor-Leukocyte Microenvironment on Melanoma-Neutrophil Adhesion to the Endothelium in a Shear Flow.” Cellular and molecular bioengineering vol. 1,2-3 (2008): 189-200. [CrossRef]
- Schumacher, Dagmar et al. “Platelet-derived nucleotides promote tumor-cell transendothelial migration and metastasis via P2Y2 receptor.” Cancer cell vol. 24,1 (2013): 130-7. [CrossRef]
- Wang, Lei et al. “Prognostic value of the systemic inflammation response index (SIRI) before and after surgery in operable breast cancer patients.” Cancer biomarkers : section A of Disease markers vol. 28,4 (2020): 537-547. [CrossRef]
- Minami, Takafumi et al. “Identification of Programmed Death Ligand 1-derived Peptides Capable of Inducing Cancer-reactive Cytotoxic T Lymphocytes From HLA-A24+ Patients With Renal Cell Carcinoma.” Journal of immunotherapy (Hagerstown, Md. : 1997) vol. 38,7 (2015): 285-91. [CrossRef]
- Thommen, Daniela S et al. “A transcriptionally and functionally distinct PD-1+ CD8+ T cell pool with predictive potential in non-small-cell lung cancer treated with PD-1 blockade.” Nature medicine vol. 24,7 (2018): 994-1004. [CrossRef]
- Ofner, Heidemarie et al. “Blood-Based Biomarkers as Prognostic Factors of Recurrent Disease after Radical Cystectomy: A Systematic Review and Meta-Analysis.” International journal of molecular sciences vol. 24,6 5846. 19 Mar. 2023. [CrossRef]
- Tang, Xingxing et al. “The clinical use of neutrophil-to-lymphocyte ratio in bladder cancer patients: a systematic review and meta-analysis.” International journal of clinical oncology vol. 22,5 (2017): 817-825. [CrossRef]
- Chen, Jian-Hui et al. “Systemic immune-inflammation index for predicting prognosis of colorectal cancer.” World journal of gastroenterology vol. 23,34 (2017): 6261-6272. [CrossRef]
- Wang, Yan et al. “Prognostic value of the pretreatment systemic immune-inflammation index (SII) in patients with non-small cell lung cancer: a meta-analysis.” Annals of translational medicine vol. 7,18 (2019): 433. [CrossRef]
- Zhong, Jie-Hui et al. “Prognostic role of systemic immune-inflammation index in solid tumors: a systematic review and meta-analysis.” Oncotarget vol. 8,43 75381-75388. 29 Jun. 2017. [CrossRef]
- Gorgel, Sacit Nuri et al. “Retrospective study of systemic immune-inflammation index in muscle invasive bladder cancer: initial results of single centre.” International urology and nephrology vol. 52,3 (2020): 469-473. [CrossRef]
- Grossmann, Nico C et al. “Impact of preoperative systemic immune-inflammation Index on oncologic outcomes in bladder cancer patients treated with radical cystectomy.” Urologic oncology vol. 40,3 (2022): 106.e11-106.e19. [CrossRef]
- Zhang, Yi et al. “Prognostic value of pretreatment systemic immune-inflammation index in patients with gastrointestinal cancers.” Journal of cellular physiology vol. 234,5 (2019): 5555-5563. [CrossRef]
- Ji, Yongfang, and Haiyan Wang. “Prognostic prediction of systemic immune-inflammation index for patients with gynecological and breast cancers: a meta-analysis.” World journal of surgical oncology vol. 18,1 197. 7 Aug. 2020. [CrossRef]
- Wang, Bolin et al. “Prognostic impact of elevated pre-treatment systemic immune-inflammation index (SII) in hepatocellular carcinoma: A meta-analysis.” Medicine vol. 99,1 (2020): e18571. [CrossRef]
- Fucà, Giovanni et al. “The Pan-Immune-Inflammation Value is a new prognostic biomarker in metastatic colorectal cancer: results from a pooled-analysis of the Valentino and TRIBE first-line trials.” British journal of cancer vol. 123,3 (2020): 403-409. [CrossRef]
- Qi, Xiaoyan et al. “Clinical utility of the pan-immune-inflammation value in breast cancer patients.” Frontiers in oncology vol. 13 1223786. 30 Aug. 2023. [CrossRef]
- Shariat, Shahrokh F et al. “Statistical consideration for clinical biomarker research in bladder cancer.” Urologic oncology vol. 28,4 (2010): 389-400. [CrossRef]
Figure 1.
Roc curves of PIV, SII, NLR for RFS.
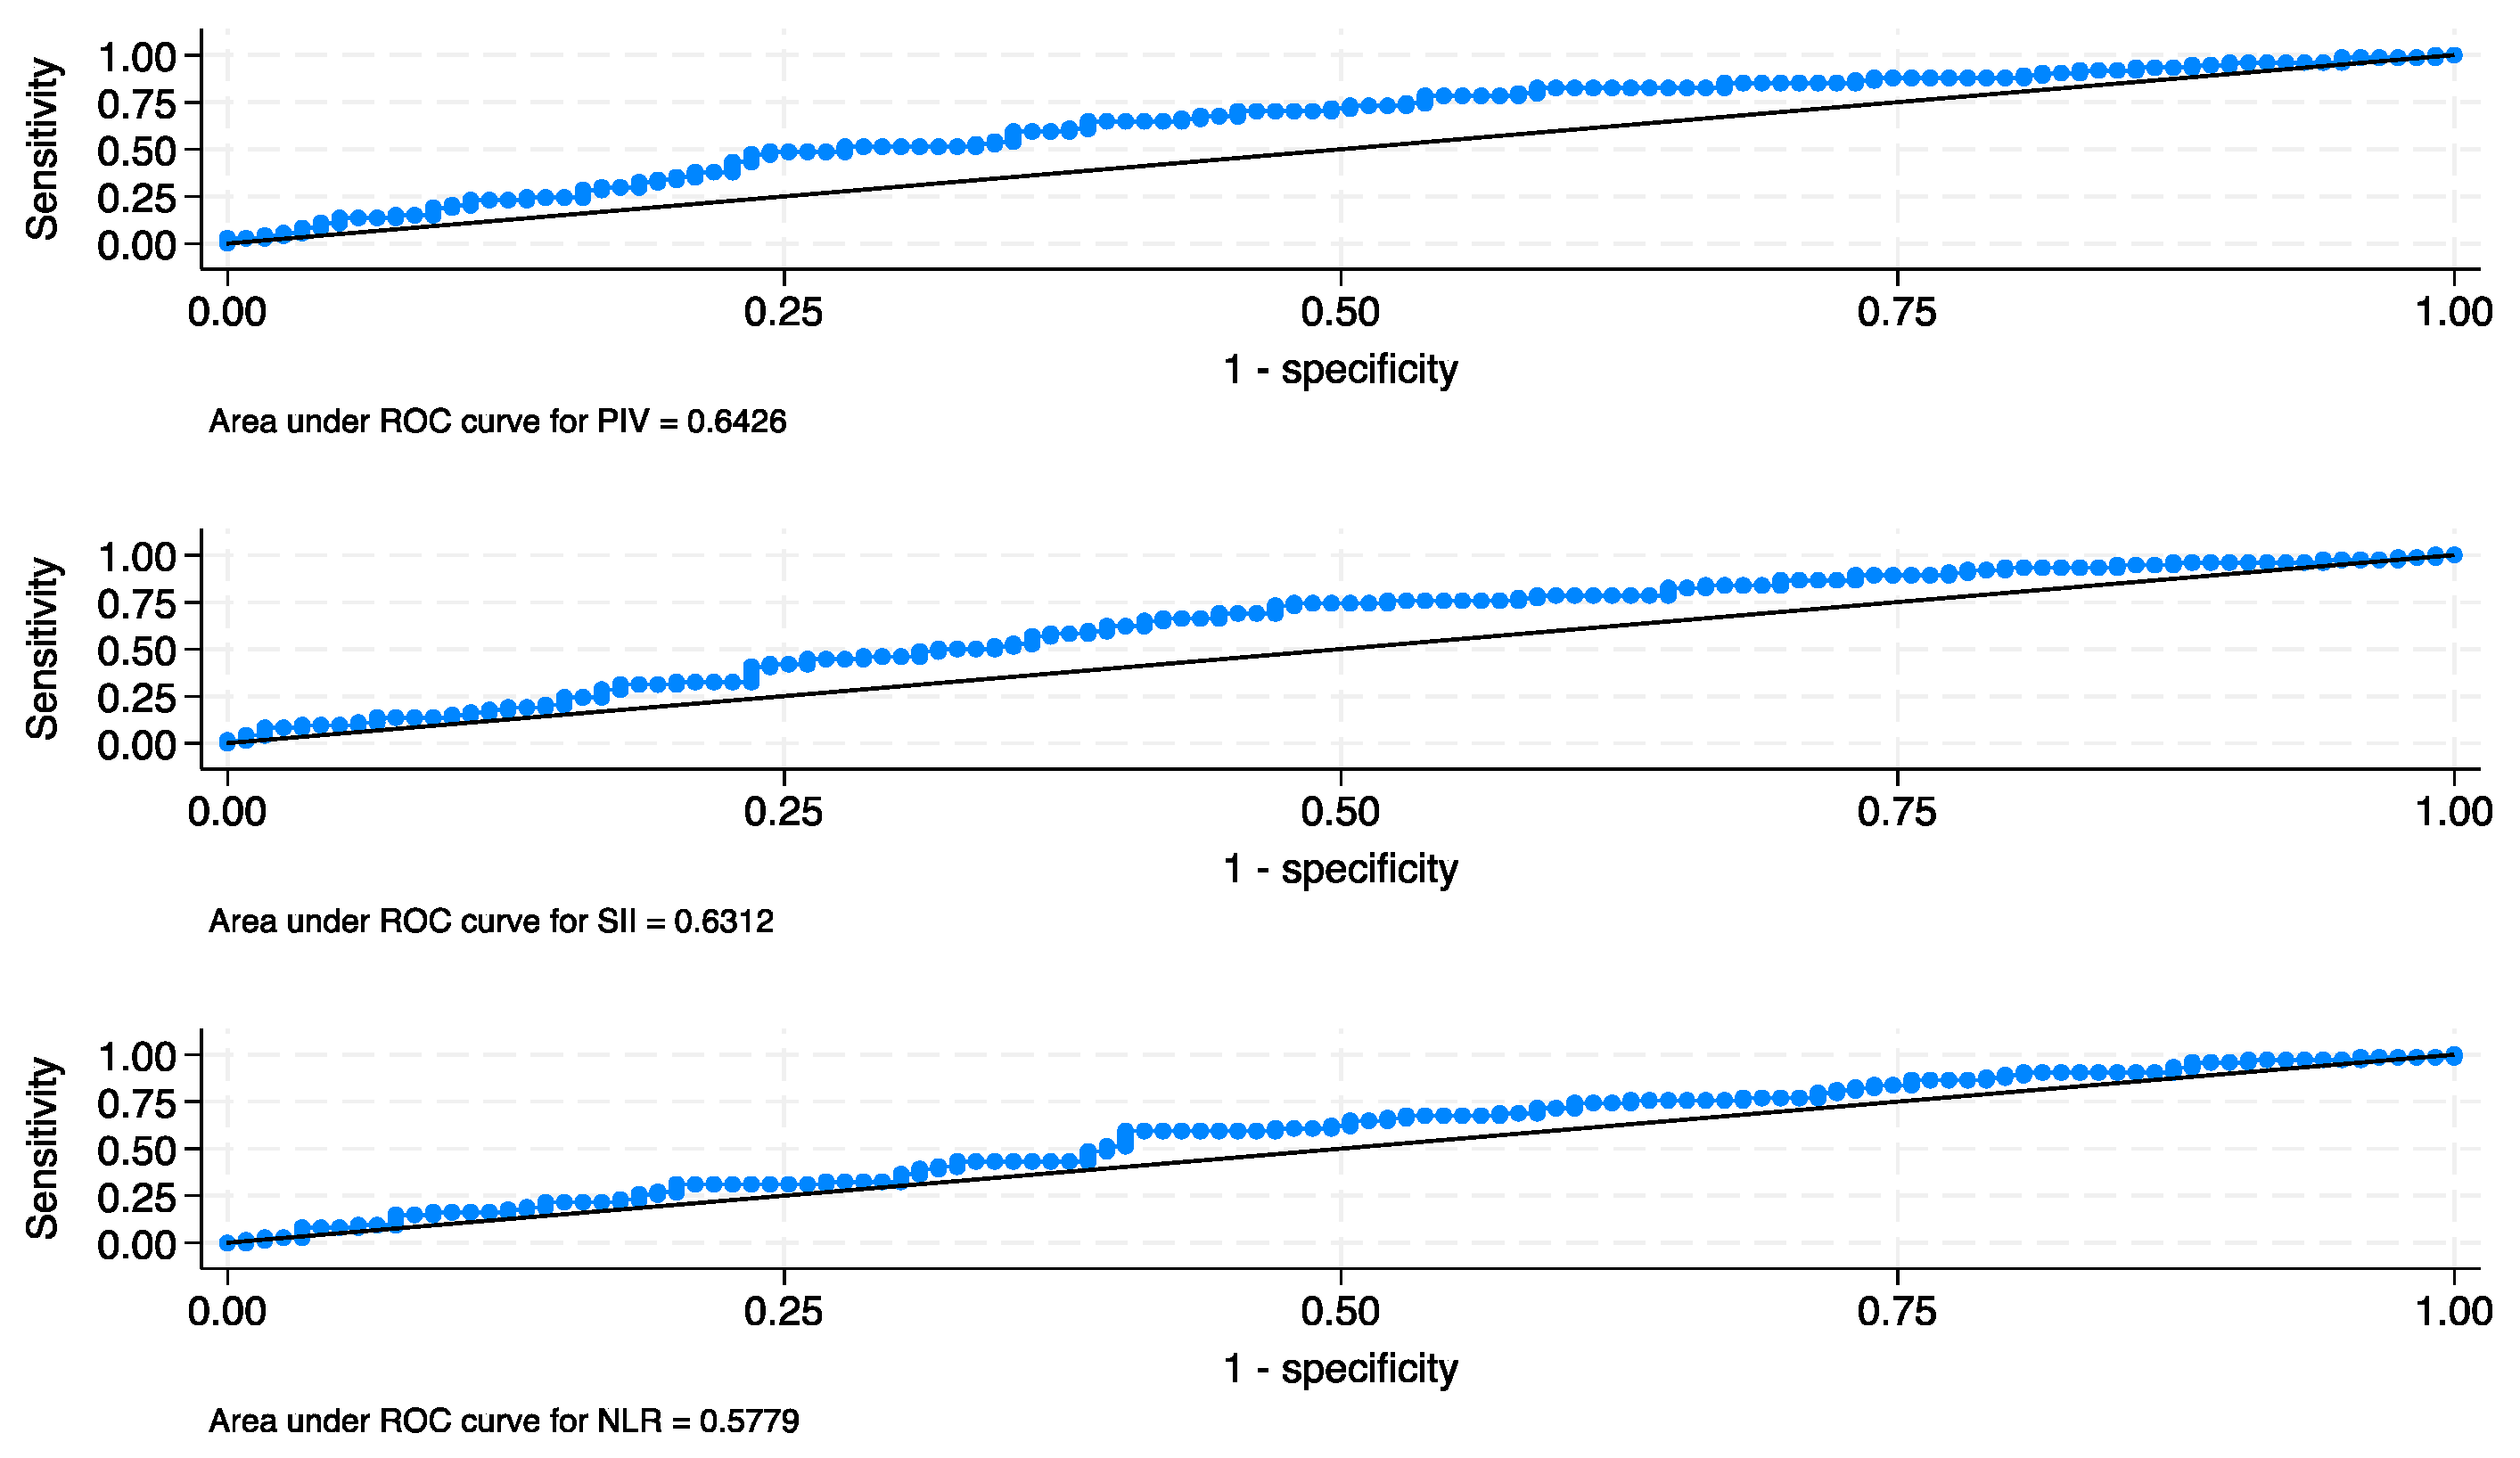
Figure 2.
Kaplan-Meier of RFS is based on baseline PIV (A), SII (B), and NLR (C).
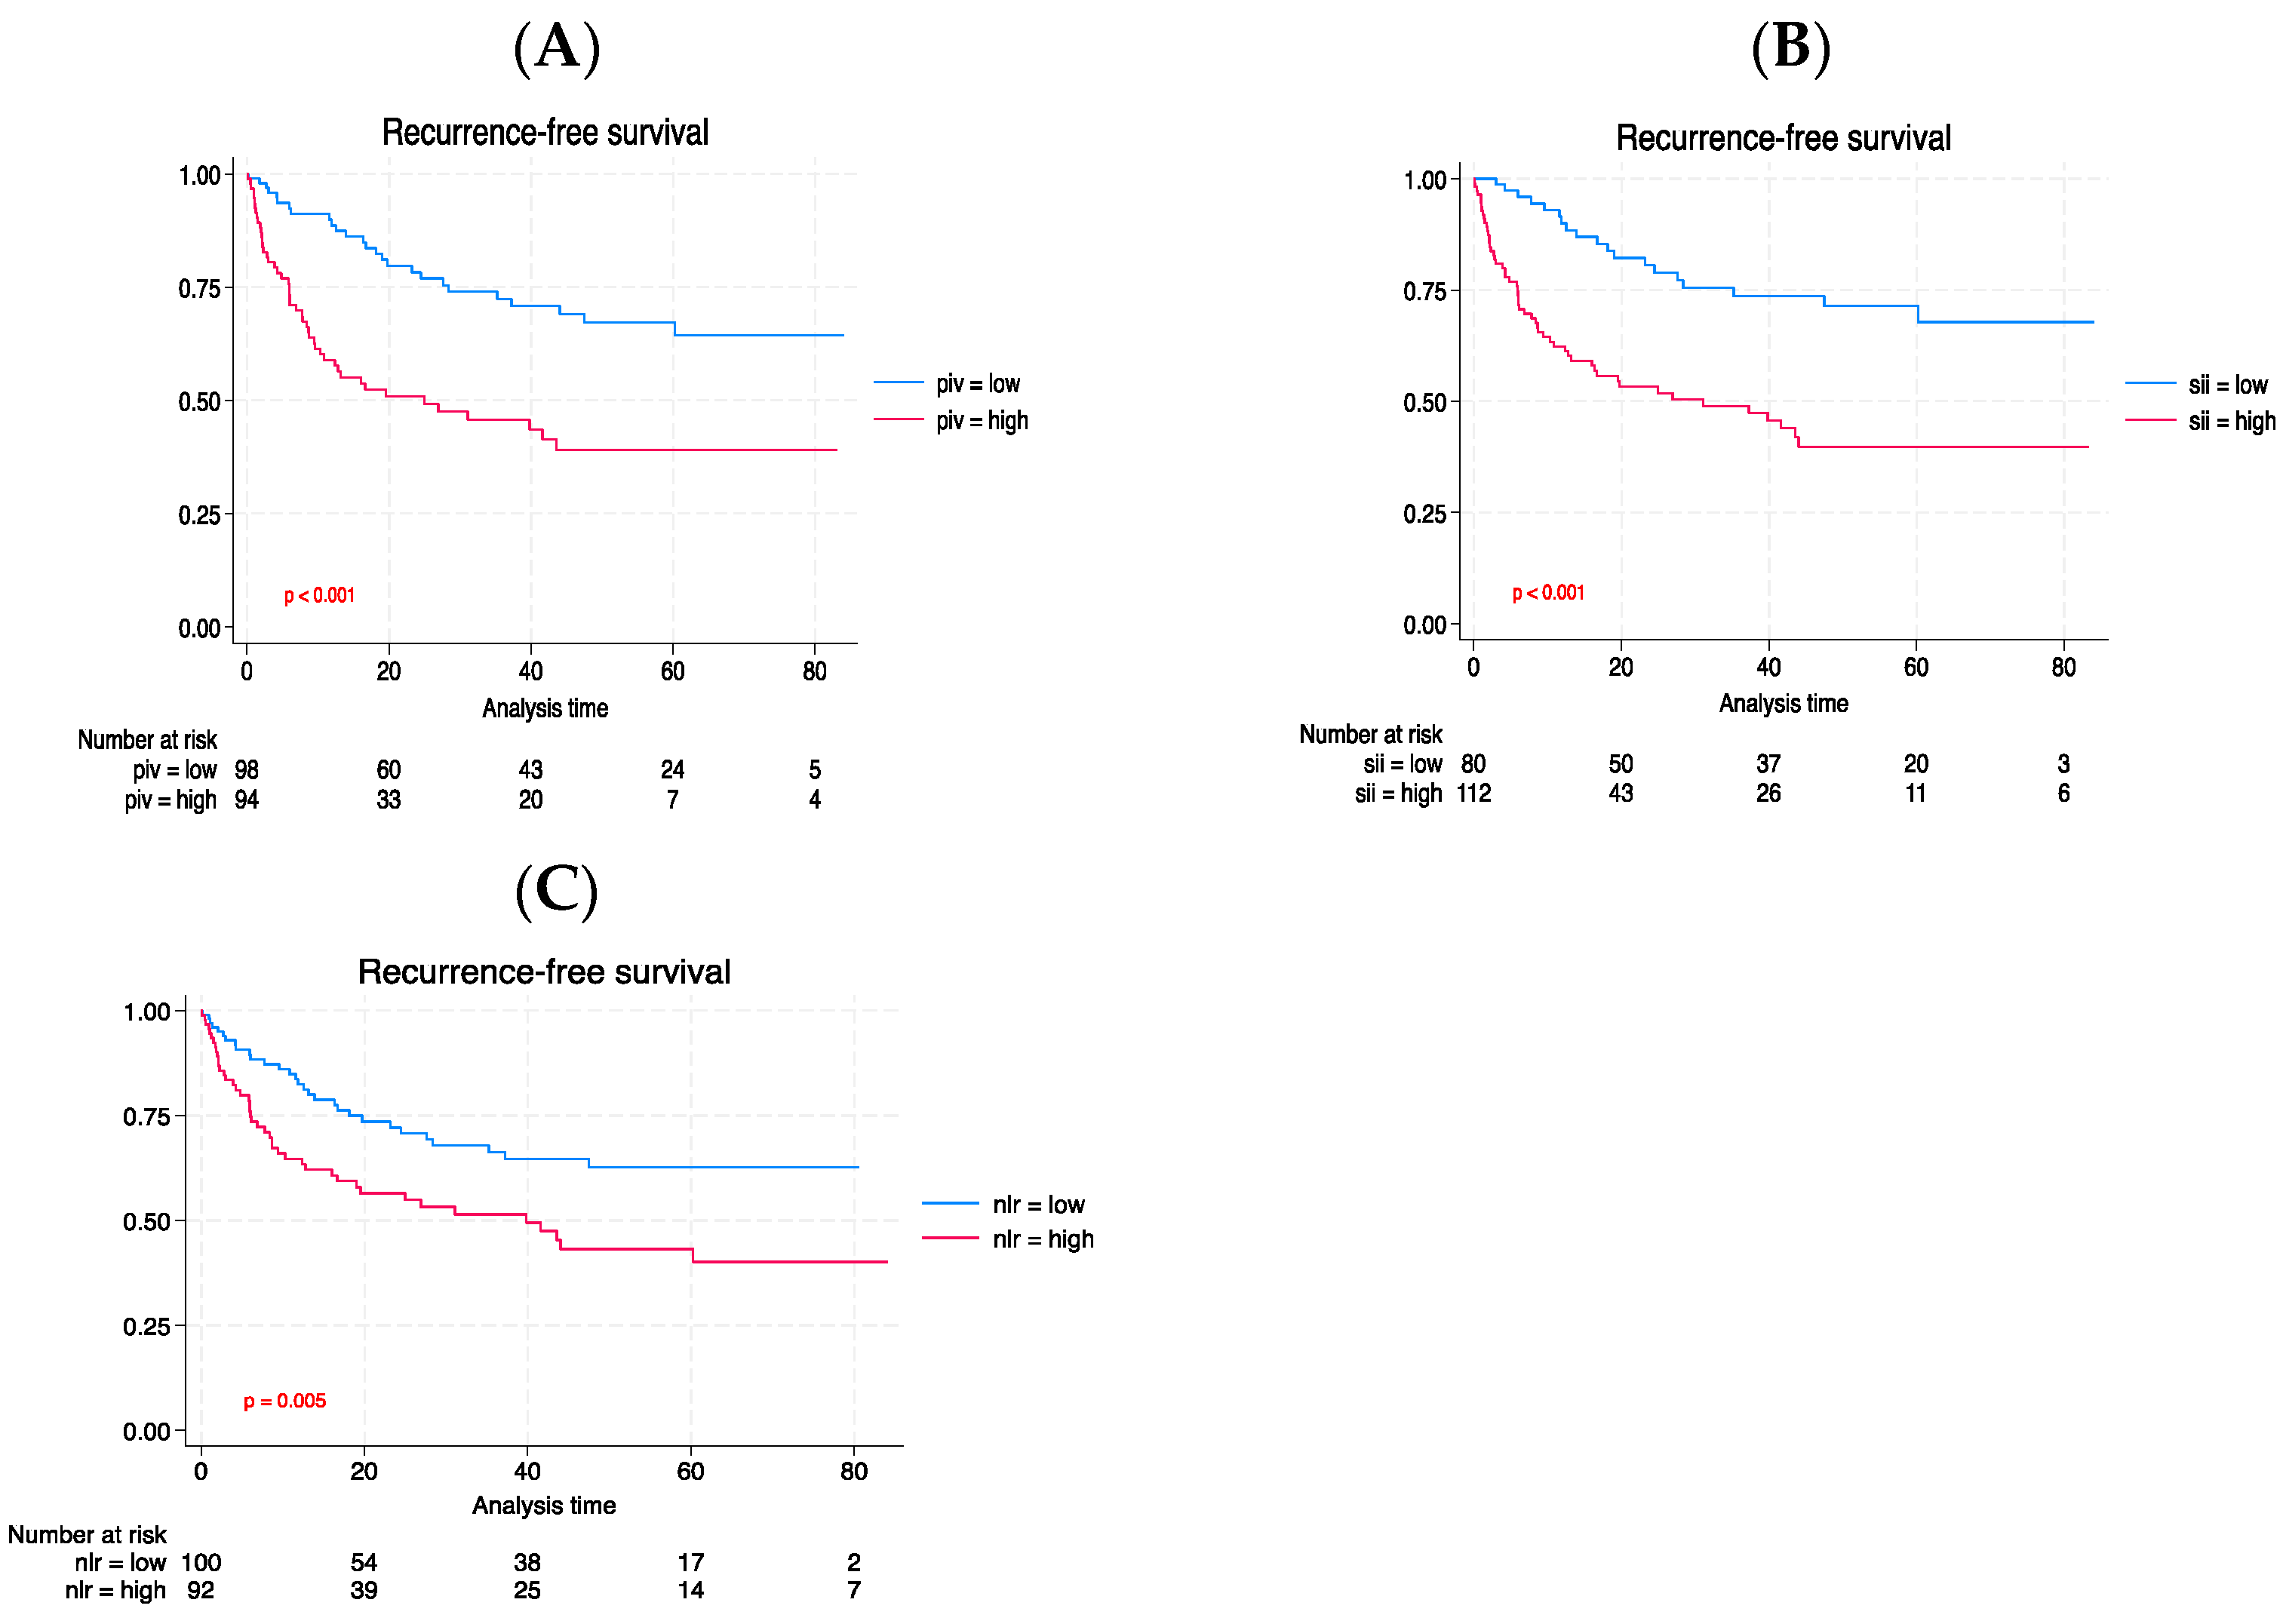
Figure 3.
Kaplan-Meier of CSS is based on baseline PIV (A), SII (B), and NLR (C).
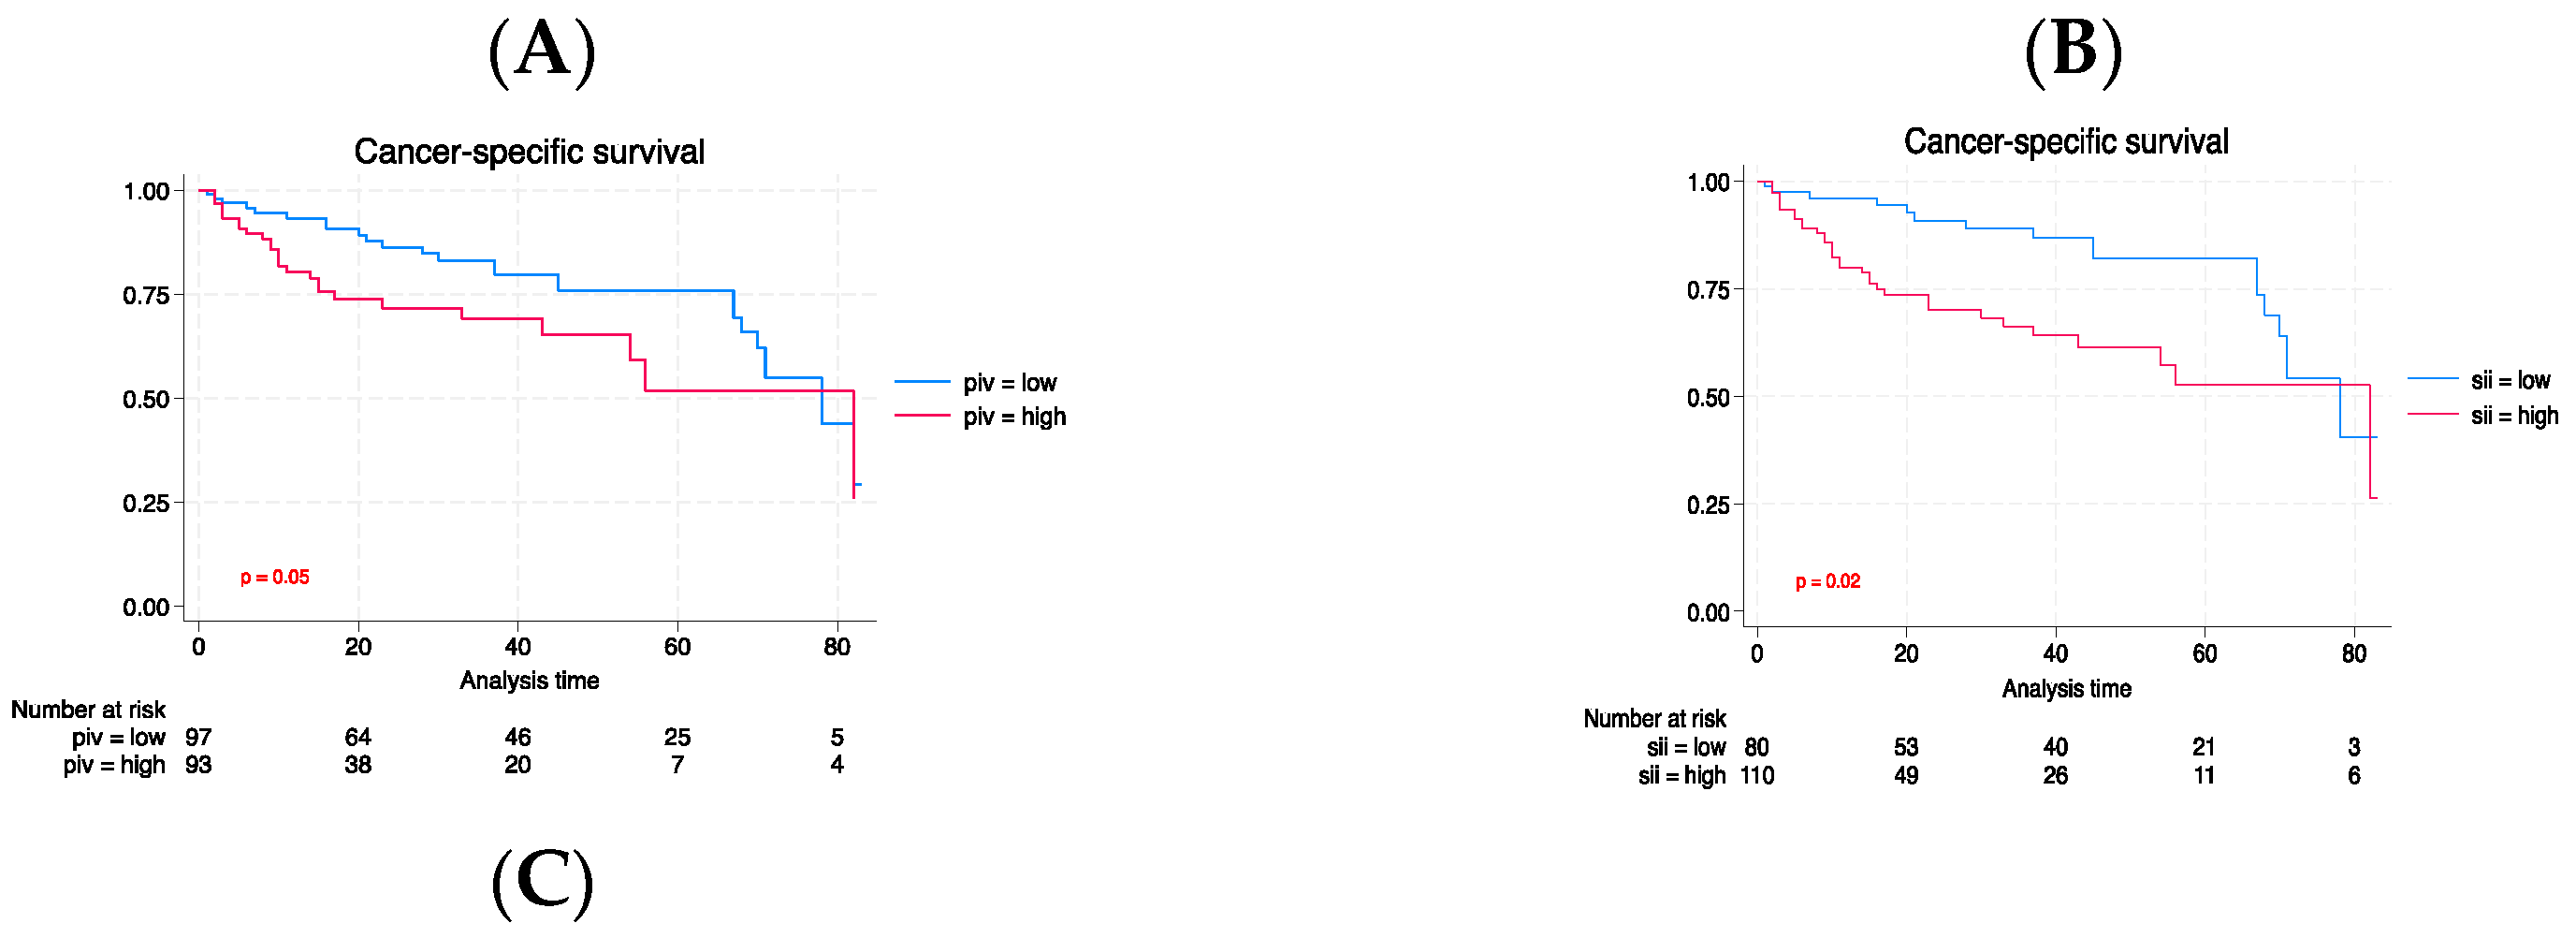
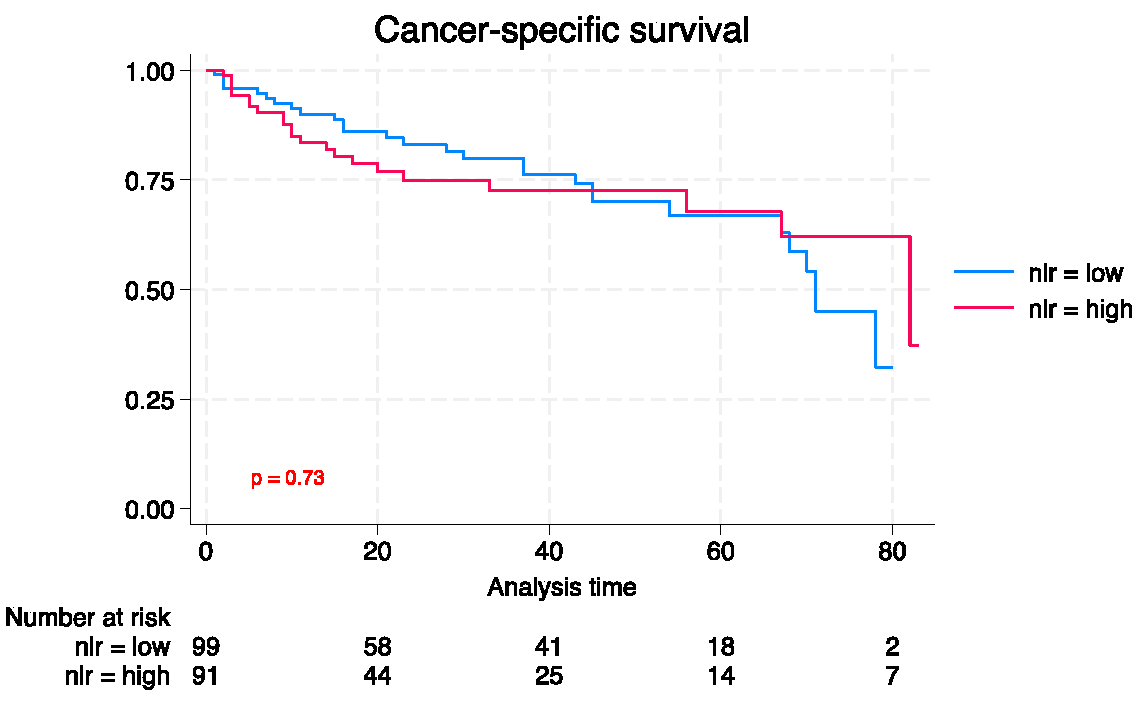
Figure 4.
Kaplan-Meier of OS is based on baseline PIV (A), SII (B), and NLR (C).
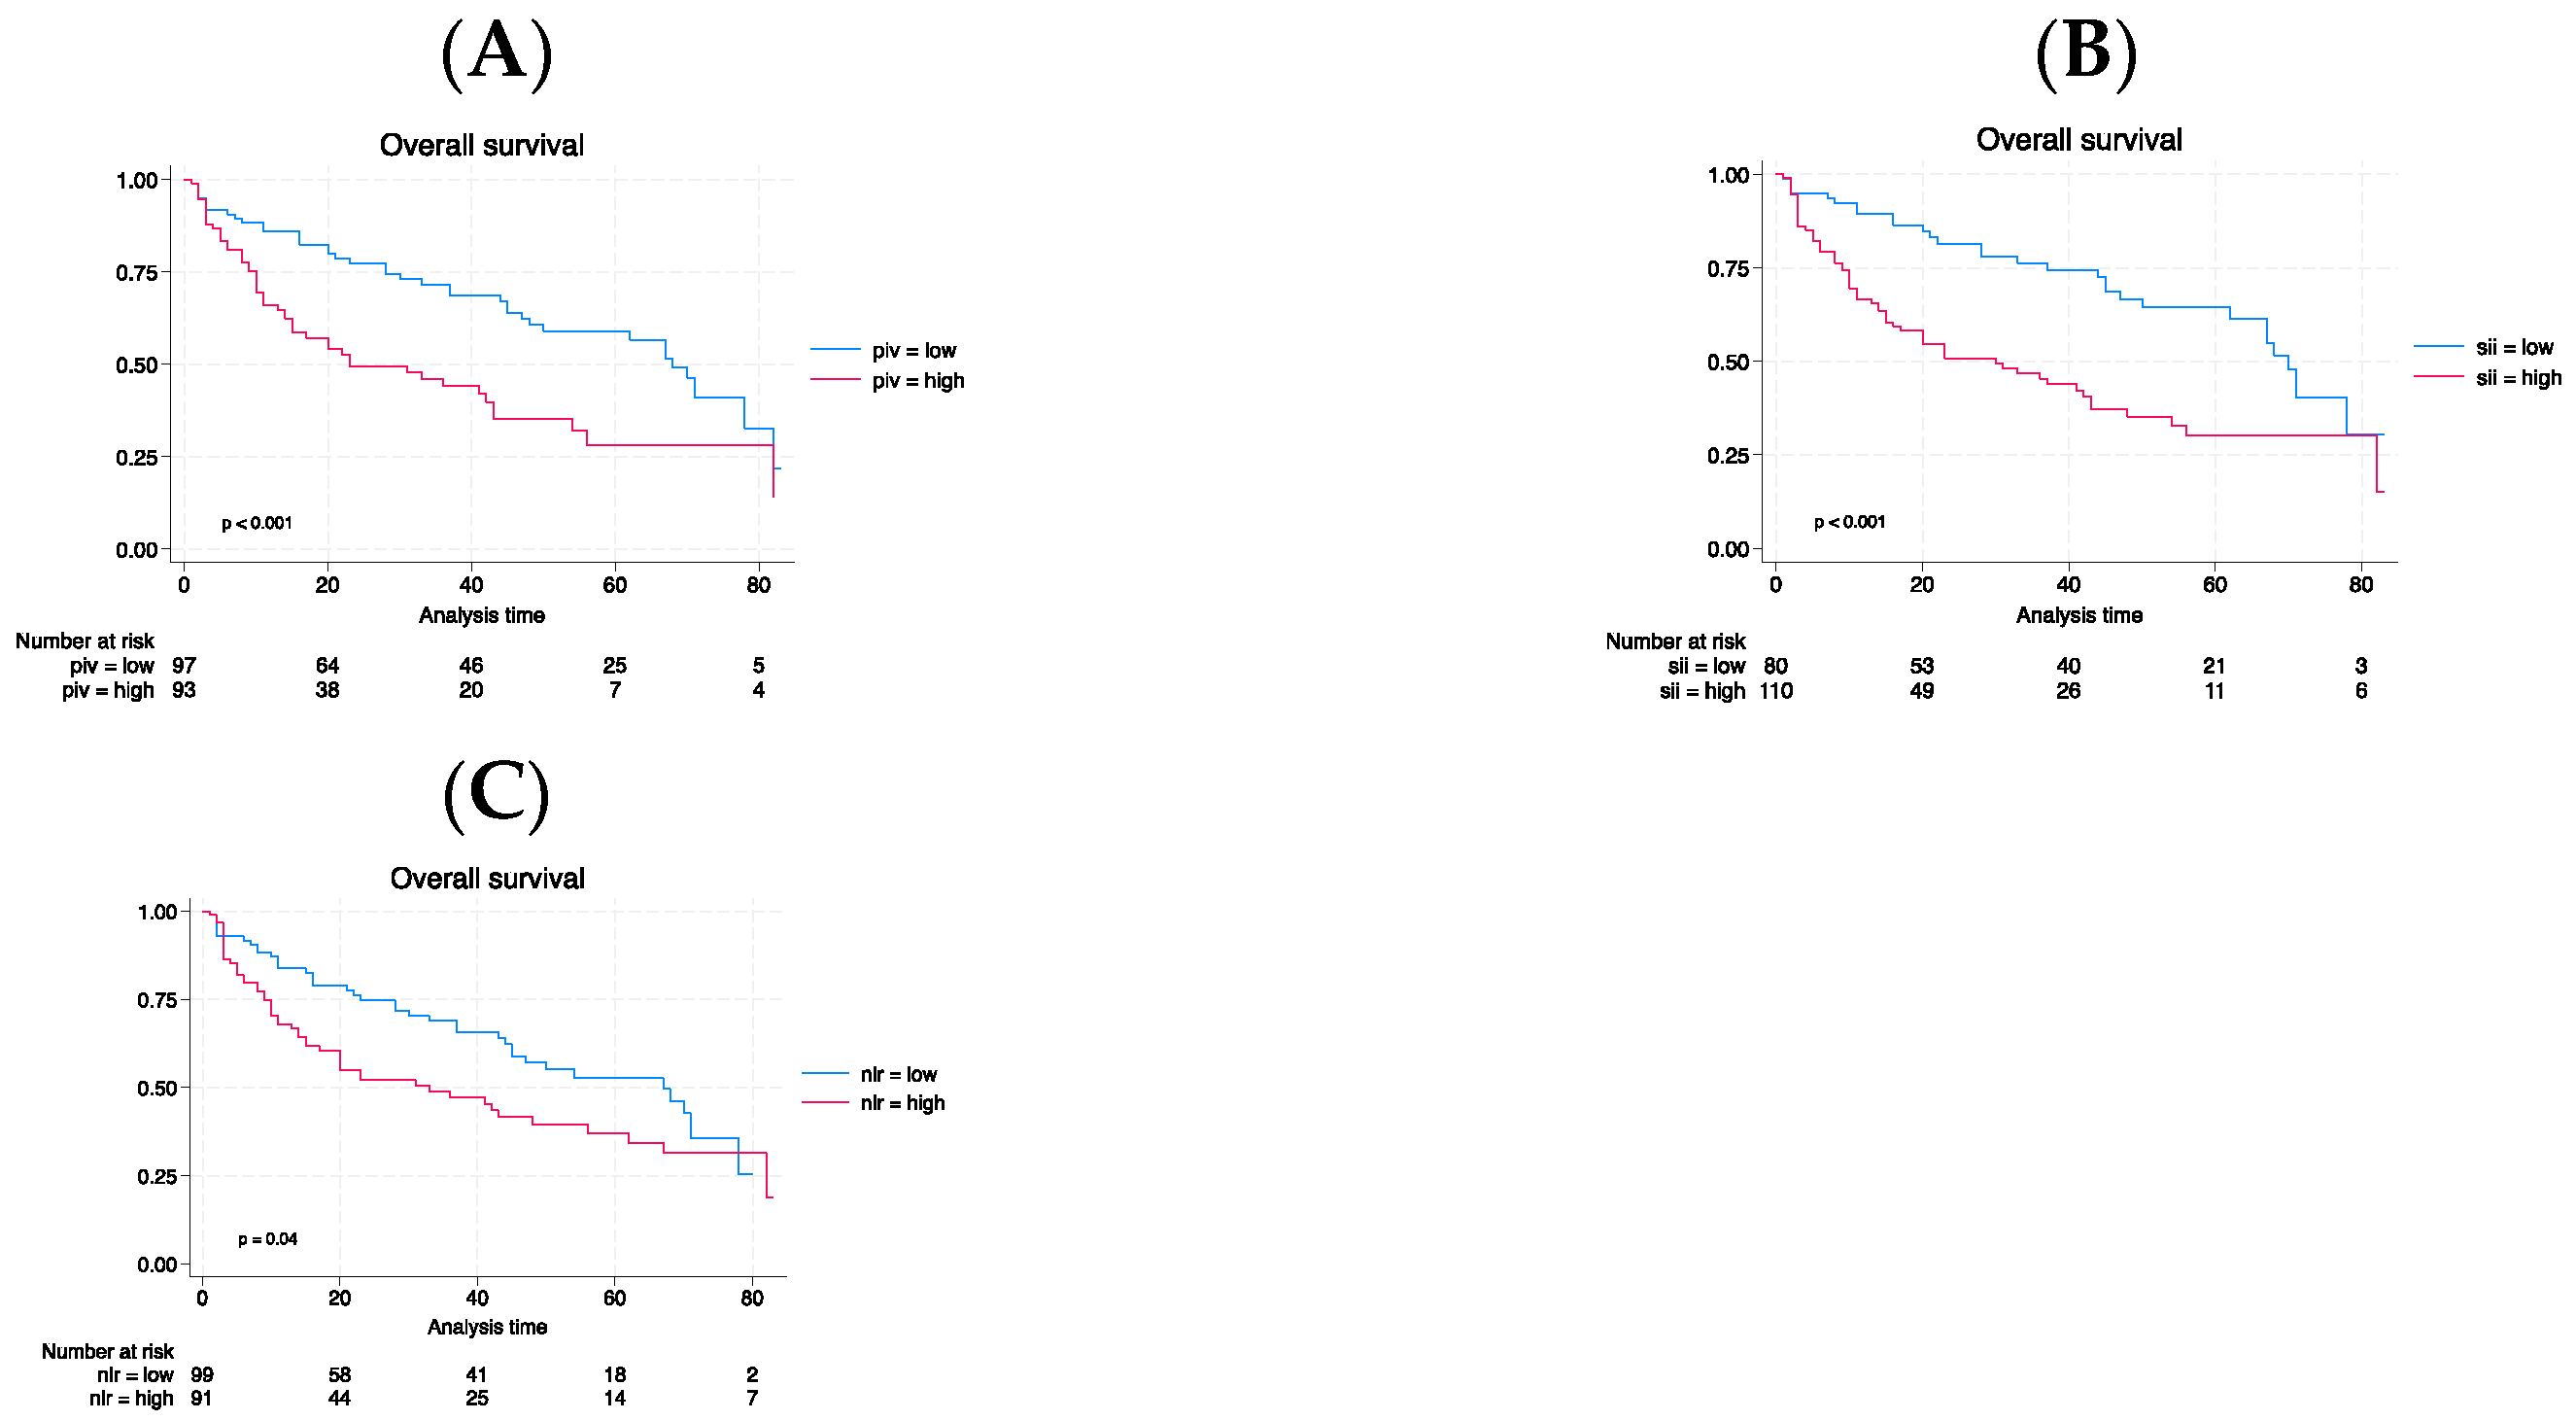

Table 1.
Analyzing the differences in patients’ demographics between those with high PIV and low PIV.
Table 1.
Analyzing the differences in patients’ demographics between those with high PIV and low PIV.
| Characteristic | Total | Low PIV | High PIV | p |
|---|---|---|---|---|
| N=193 | N= 99 (51.3) | N = 94 (48.7) | ||
| Age, median (IQR) | 78 (73-83) | 78 (73-83) | 79 (73-83) | 0.38 |
| Sex, n (%) | 0.07 | |||
| Male | 154 (79.7) | 84 (84.8) | 70 (74.7) | |
| Female | 39 (20.2) | 15 (15.1) | 24 (25.5) | |
| Smoke, n (%) | 149 (77.2) | 83 (83.8) | 66 (70.2) | 0.02 |
| Diabetes, n (%) | 31 (16.0) | 16 (16.1) | 15 (15.9) | 0.96 |
| Clinical T stage, n (%) | <0.001 | |||
| cTa | 67 (34.7) | 41 (41.4) | 26 (27.6) | |
| cTis | 24 (12.4) | 18 (12.3) | 6 (11.7) | |
| cT1 | 49 (25.3) | 23 (25.1) | 26 (23.9) | |
| cT2 | 29 (15.0) | 14 (14.9) | 15 (14.1) | |
| cT3 | 18 (9.3) | 3 (9.2) | 15 (8.8) | |
| cT4 | 6 (3.1) | 0 (3.1) | 6 (2.9) | |
| BMI, median (IQR) | 26 (24-29) | 26 (24-29) | 26 (24-28) | 0.39 |
| Surgical approach, n (%) | 0.27 | |||
| Open | 186 (96.3) | 94 (94.9) | 92 (97.8) | |
| Robot-assisted | 7 (3.6) | 5 (5.0) | 2 (2.1) | |
| Urinary diversion, n (%) | 0.003 | |||
| Ureterocutaneostomy | 21 (10.8) | 6 (6.0) | 15 (15.9) | |
| Ileal conduit | 148 (76.6) | 74 (78.2) | 74 (78.7) | |
| Orthotopic neobladder | 24 (12.4) | 19 (19.1) | 5 (5.3) | |
| Pathological T stage, n (%) | 0.001 | |||
| pT0 | 14 (7.2) | 10 (10.1) | 4 (4.2) | |
| pTa | 10 (5.1) | (5.0) | 5 (5.3) | |
| pTis | 23 (11.9) | 17 (17.1) | 6 (6.3) | |
| pT1 | 26 (13.4) | 19 (19.1) | 7 (7.4) | |
| pT2a | 30 (15.5) | 16 (16.1) | 14 (14.8) | |
| pT2b | 5 (2.5) | 3 (3.0) | 2 (2.1) | |
| pT3a | 49 (25.3) | 22 (22.2) | 27 (28.7) | |
| pT3b | 8 (4.1) | 4 (3.0) | 5 (5.3) | |
| pT4a | 21 (10.8) | 4 (4.0) | 17 (18.0) | |
| pT4b | 7 (3.6) | 0 (0.0) | 7 (7.4) | |
| Lymph node, n (%) | 37 (19.1) | 11 (11.1) | 26 (27.6) | 0.004 |
| LVI, n (%) | 128 (66.3) | 54 (54.5) | 74 (78.7) | < 0.001 |
| Locally advanced disease, n (%) | 102 (52.8) | 37 (37.3) | 65 (69.1) | < 0.001 |
| Adjuvant chemotherapy, n (%) | 40 (20.7) | 15 (15.1) | 25 (26.6) | 0.05 |
| Progressive disease, n (%) | 61 (31.6) | 22 (22.2) | 39 (41.4) | 0.004 |
| Cancer-related deaths, n (%) | 96 (49.7) | 44 (44.4) | 52 (55.3) | 0.131 |
| Any-cause deaths, n (%) | 52 (26.9) | 26 (26.2) | 26 (27.6) | 0.827 |
PIV= Pan-immune inflammation index; BMI = Body mass index; IQR = Interquartile range; LVI= lymph vascular infiltration.
Table 2.
Analyzing relationship among PIV and oncological outcomes using mutivariable logistic regression.
Table 2.
Analyzing relationship among PIV and oncological outcomes using mutivariable logistic regression.
| Lymph node | Advanced Tumor grading | Locoregionally extended state | |||||||
|---|---|---|---|---|---|---|---|---|---|
| Characteristic | OR | 95% CI | p-value | OR | 95% CI | p-value | OR | 95%CI | p-value |
| PIV (Reference:low) | |||||||||
| High | 1.84 | 0.76, 4.47 | 0.17 | 2.87 | 1.36, 6.04 | 0.005 | 3.30 | 1.60, 6.77 | 0.001 |
| Age | 1.14 | 0.33, 3.88 | 0.82 | 0.75 | 0.28, 1.99 | 0.576 | 1.00 | 0.39, 2.57 | 0.98 |
| Smoke (Reference: no) | |||||||||
| Smoke | 0.59 | 0.23, 1.50 | 0.27 | 0.93 | 0.37, 2.33 | 0.890 | 1.48 | 0.59, 3.70 | 0.39 |
| Sex (Reference: male) | |||||||||
| Female | 0.56 | 0.19, 1.60 | 0.28 | 0.31 | 0.10, 0.90 | 0.032 | 0.53 | 0.20, 1.42 | 0.21 |
| Clinical tumor stage | |||||||||
| (Reference: cTa/cTis/cT1) | |||||||||
| cT2 | 4.92 | 1.84, 13.13 | 0.001 | 45.10 | 9.46, 215.03 | <0.001 | 29.15 | 6.32, 134.36 | <0.001 |
| cT3/cT4 | 11.16 | 3.86, 32.27 | <0.001 | 23.49 | 4.91, 112.20 | <0.001 | |||
| Goodness-of-fit test | Hosmer–Lemeshow test | 0.20 | 0.68 | 0.91 | |||||
| AUC | |||||||||
| Model with PIV | AUC: 0.78 | AUC: 0.80 | AUC: 0.81 | ||||||
| Model without PIV | AUC: 0.76 (+2%) | AUC: 0.77 (+3%) | AUC: 0.76 (+5%) | ||||||
| (p = difference model) | 0.27 | 0.12 | 0.04 |
PIV = Pan-immune inflammation value; OR = Odds Ratio; CI = Confidence Inter al; AUC = Area under the curve.
Table 3.
Analyzing relationship between NLR and oncological outcomes using multivariable logistic regression.
Table 3.
Analyzing relationship between NLR and oncological outcomes using multivariable logistic regression.
| Lymph node | Advanced Tumor grading | Locoregionally extended state | |||||||
|---|---|---|---|---|---|---|---|---|---|
| Characteristic | OR | 95% CI | p-value | OR | 95% CI | p-value | OR | 95%CI | p-value |
| NLR (Reference: low) | |||||||||
| High | 1.47 | 0.65, 3.36 | 0.35 | 1.98 | 0.97, 4.05 | 0.06 | 1.60 | 0.80, 3.18 | 0.17 |
| Age | 1.13 | 0.33, 3.82 | 0.84 | 0.76 | 0.29, 1.99 | 0.588 | 1.01 | 0.40, 2.51 | 0.97 |
| Smoke (Reference: no) | |||||||||
| Smoke | 0.54 | 0.21, 1.35 | 0.19 | 0.79 | 0.32, 1.94 | 0.620 | 1.22 | 0.51, 2.93 | 0.65 |
| Sex (Reference: male) | |||||||||
| Female | 0.58 | 0.20, 1.66 | 0.31 | 0.31 | 0.11, 0.92 | 0.035 | 0.57 | 0.21, 1.48 | 0.25 |
| Clinical tumor stage | |||||||||
| (Reference: cTa/cTis/cT1) | |||||||||
| cT2 | 4.99 | 1.88, 13.25 | 0.001 | 44.10 | 9.29, 209.21 | <0.001 | 27.01 | 5.97, 122.05 | <0.001 |
| cT3/cT4 | 13.19 | 4.72, 36.85 | <0.001 | 32.22 | 6.73, 154.29 | <0.001 | |||
| Goodness-of-fit test | Hosmer–Lemeshow test | 0.97 | 0.25 | 0.91 | |||||
| AUC | |||||||||
| Model with NLR | AUC: 0.77 | AUC: 0.78 | AUC: 0.77 | ||||||
| Model without NLR | AUC: 0.76 (+1%) | AUC: 0.77 (+1%) | AUC: 0.76 (+1%) | ||||||
| (p = difference model) | 0.51 | 0.55 | 0.55 |
NLR = Neutrophil to lymphocyte ratio;OR = Odds ratio; CI = Confidence Interval; AUC = Area under the curve.
Table 4.
Analyzing the relationship between SII and oncological outcomes using multivariable logistic regression.
Table 4.
Analyzing the relationship between SII and oncological outcomes using multivariable logistic regression.
| Lymph Node | Advanced Tumor grading | Locoregionally extended state | |||||||
|---|---|---|---|---|---|---|---|---|---|
| Characteristic | OR | 95% CI | p-value | OR | 95% CI | p-value | OR | 95%CI | p-value |
| SII (Reference: low) | |||||||||
| High | 2.91 | 1.09, 7.72 | 0.03 | 2.09 | 1.00, 4.40 | 0.05 | 2.96 | 1.44, 6.08 | 0.003 |
| Age | 1.10 | 0.33, 3.72 | 0.86 | 0.79 | 0.30, 2.07 | 0.644 | 1.06 | 0.42, 2.70 | 0.89 |
| Smoke (Reference: no) | |||||||||
| Smoke | 0.56 | 0.22, 1.41 | 0.22 | 0.82 | 0.33, 2.02 | 0.680 | 1.30 | 0.53, 3.19 | 0.56 |
| Sex (Reference: male) | |||||||||
| Female | 0.52 | 0.18, 1.51 | 0.23 | 0.31 | 0.11, 0.91 | 0.034 | 0.51 | 0.19, 1.36 | 0.18 |
| Clinical tumor stage | |||||||||
| (Reference: cTa/cTis/cT1) | |||||||||
| cT2 | 5.35 | 1.97, 14.56 | 0.001 | 45.06 | 9.47, 214.31 | <0.001 | 31.41 | 6.73, 146.46 | <0.001 |
| cT3/cT4 | 10.58 | 3.70, 30.19 | <0.001 | 27.08 | 5.66, 129.51 | <0.001 | |||
| Goodness-of-fit test | Hosmer–Lemeshow test | 0.89 | 0.21 | 0.82 | |||||
| AUC | |||||||||
| Model with SII | AUC: 0.79 | AUC: 0.80 | AUC: 0.81 | ||||||
| Model without SII | AUC: 0.76 (+3%) | AUC: 0.77 (+3%) | AUC: 0.76 (+5%) | ||||||
| (p = difference model) | 0.17 | 0.16 | 0.03 |
SII = Systemic Immune Inflammation Index; OR = Odds Ratio; CI = Confidence Interval; AUC: Area under the curve.
Table 5.
Multivariable Cox regression analysis before surgery to predict RFS, CSS and OS.
| Relapse-Free Survival | Cancer-Specific Survival | Overall Survival | |||||||
|---|---|---|---|---|---|---|---|---|---|
| HR | 95% CI | p-value | HR | 95%CI | p-value | HR | 95%CI | p-value | |
| PIV (Reference: low) | |||||||||
| High | 1.89 | 1.12, 3.19 | 0.017 | 1.07 | 0.57, 2.02 | 0.819 | 1.64 | 1.05, 2.56 | 0.029 |
| Age | 0.77 | 0.40, 1.46 | 0.427 | 1.27 | 0.53, 3.04 | 0.579 | 1.11 | 0.61, 2.02 | 0.717 |
| Smoking status (Reference: no) | |||||||||
| Smoke | 0.91 | 0.53, 1.55 | 0.744 | 1.30 | 0.62, 2.73 | 0.478 | 1.25 | 0.74, 2.10 | 0.401 |
| Sex (Reference: male) | |||||||||
| Female | 0.86 | 0.49, 1.52 | 0.624 | 1.47 | 0.78, 2.80 | 0.230 | 1.06 | 0.64, 1.75 | 0.811 |
| Clinical tumor condition | |||||||||
| (Reference: cTa/cTis/cT1) | |||||||||
| cT2 | 1.58 | 0.82, 3.05 | 0.168 | 1.03 | 0.42, 2.53 | 0.938 | 1.25 | 0.69, 2.27 | 0.450 |
| cT3/cT4 | 7.14 | 3.90, 13.06 | <0.001 | 8.77 | 4.13, 18.61 | <0.001 | 4.02 | 2.24, 7.19 | <0.001 |
| Harrel’s index | |||||||||
| Model accuracy | 0.72 | 0.72 | 0.66 | ||||||
| Model accuracy without PIV | 0.68 (+4%) | 0.71 (+1%) | 0.63 (+3%) | ||||||
| (p = difference model) | 0.01 | 0.81 | 0.03 |
PIV = Pan-immune inflammation value ; HR = Hazard Ratio ; CI: Confidence Interval.
Table 6.
Multivariable Cox regression analysis following surgery to predict RFS, CSS and OS.
| Relapse-Free Survival | Cancer-Specific Survival | Overall Survival | |||||||
|---|---|---|---|---|---|---|---|---|---|
| Characteristic | HR | 95%CI | p-value | HR | 95%CI | p-value | HR | 95%CI | p-value |
| PIV (Reference: low) | |||||||||
| High | 1.74 | 1.04, 2.92 | 0.034 | 1.30 | 0.69, 2.43 | 0.412 | 1.58 | 1.00, 2.49 | 0.048 |
| Age | 0.99 | 0.52, 1.88 | 0.994 | 1.46 | 0.61, 3.49 | 0.387 | 1.21 | 0.67, 2.21 | 0.517 |
| Smoking status (Reference: no) | |||||||||
| Smoke | 1.26 | 0.72, 2.19 | 0.403 | 2.13 | 1.02, 4.44 | 0.043 | 1.73 | 1.02, 2.92 | 0.039 |
| Sex (Reference: male) | |||||||||
| Female | 1.42 | 0.77, 2.61 | 0.258 | 1.78 | 0.92, 3.45 | 0.084 | 1.30 | 0.77, 2.18 | 0.314 |
| Tumor grading | |||||||||
| (Reference: pT0/pTa/pTispT1) | |||||||||
| pT2 | 1.67 | 0.65, 4.28 | 0.283 | 0.98 | 0.31, 3.11 | 0.981 | 1.54 | 0.70, 3.40 | 0.276 |
| pT3/pT4 | 2.84 | 1.14, 7.09 | 0.025 | 2.88 | 1.17, 7.11 | 0.021 | 3.23 | 1.59, 6.53 | 0.001 |
| Lymphovascular invasion | 1.03 | 0.41, 2.54 | 0.94 | 0.97 | 0.38, 2.44 | 0.957 | 0.90 | 0.44, 1.81 | 0.774 |
| Lymph node invasion | 3.85 | 2.12, 6.99 | <0.001 | 4.26 | 1.89, 9.61 | <0.001 | 3.12 | 1.74, 5.60 | <0.001 |
| Adjuvant chemotherapy | 1.31 | 0.73, 2.34 | 0.349 | 0.44 | 0.19, 1.00 | 0.05 | 0.61 | 0.34, 1.08 | 0.092 |
| C-index | |||||||||
| Model with PIV | 0.78 | 0.76 | 0.73 | ||||||
| Model without PIV | 0.77 (+1%) | 0.76 | 0.72 (1%) | ||||||
| (p = difference model) | 0.03 | 0.67 | 0.04 |
PIV = Pan-immune inflammation value; HR = Hazard ratio; CI = Confidence Interval.
Disclaimer/Publisher’s Note: The statements, opinions and data contained in all publications are solely those of the individual author(s) and contributor(s) and not of MDPI and/or the editor(s). MDPI and/or the editor(s) disclaim responsibility for any injury to people or property resulting from any ideas, methods, instructions or products referred to in the content. |
© 2024 by the authors. Licensee MDPI, Basel, Switzerland. This article is an open access article distributed under the terms and conditions of the Creative Commons Attribution (CC BY) license (http://creativecommons.org/licenses/by/4.0/).
Copyright: This open access article is published under a Creative Commons CC BY 4.0 license, which permit the free download, distribution, and reuse, provided that the author and preprint are cited in any reuse.


