Preprint
Article

Sm3+/Gd3+ Co-doped Lead/Bismuth Borogermanate Glasses – New Materials for Luminescent Thermometry

Altmetrics

Downloads

129

Views

61

Comments

0

Submitted:

30 December 2023

Posted:

04 January 2024

You are already at the latest version

Alerts
Abstract
The Sm3+/Gd3+ co-doped glasses in the B2O3–GeO2–PbO and B2O3–GeO2–Bi2O3 systems have been synthesized in the composition range of 40B2O3–40GeO2–(15-17)PbO(Bi2O3)–(3-2)Sm2O3–(2-1)Gd2O3 and 42.5B2O3–42.5GeO2–(11.25-12.75)PbO(Bi2O3)–(2.25-1.5)Sm2O3–(1.5-0.075)Gd2O3. The physical, structural, and spectral properties of the produced glasses have been studied. The fabricated glass samples demonstrated changes in temperature-sensitive luminescence parameters in 298-673 K temperature range. We found out several photoluminescence bands attributed with transitions from different Stark sublevels. By using a combination of two temperature sensitive and one non-sensitive transitions we calculated fluorescence intensities ratio (FIR). This procedure made it possible to increase the sensitivity of luminescence thermometry in several times. Such method could be very useful for the luminescent thermometry materials based on Ln3+ ions with multiplied f-f transitions.
Keywords: 
Subject: Chemistry and Materials Science  -   Electronic, Optical and Magnetic Materials

1. Introduction

Temperature (T) is one of the most fundamental parameter in all technological processes. Thermosensors are widely used in metrology, environment, high-temperature engineering, chemistry, medicine, biology, physiology, air conditioning, in production plants and the storage of goods etc. T-sensors are estimated to fill as much as 75–80% of the world’s sensor market [1]. The first wide spread types of thermometers were liquid-filled glass thermometers [2]. In the 19th century, the real breakthrough in thermometry was made using the Seebeck effect, which gave rise to the era of thermocouples. The next step in thermometry dealt with optical sensors of various types [3], which cross the threshold of 3700 K and made it possible to apply the thermometry in plasma technologies.
In the last 20 years, there has been growing interest in luminescent thermometry (LT), due to its higher efficiency in accurately measuring the temperature of objects with sizes less than 10 μm [4], fast response, high thermal and spatial resolution, as well as a wide range of operating temperatures from 10 K up to 1300 K [5]. Luminescence thermometry can operate in extremely high electric fields [6], unlike thermocouples. This opens up opportunities for its application in industry [7], scientific research [8] and biomedicine [9]. However, in recent decades, the most popular LT temperature range has been the measurement of physiological temperature over a narrow temperature range of 300–330 K with high spatial resolution and accuracy better than 0.1 °C.
There are many scientific applications that require fast sensing with high spatial resolution, unaffected by strong electromagnetic fields, in the temperature range from RT to 673 K and above. For example, for studying heat and mass transfer in liquids in various technological and chemical processes, measuring local temperature is very important. Correct 3D mapping of temperature inside chemical reactors in which processes occur during ultrasonic or microwave activation is a very urgent task for substantiating a numerical model of the technological process. This problem could only be solved using fluorescent thermometry. Sometimes, in order to develop a correct numerical model for the growth of crystals from a melt at high temperatures (1000-3000 K) [10], information on 3D temperature mapping in the volume of the melt is very important to correct the growth process. To solve the problem, scientists use numerical modeling, which requires confirmation by physical experiments at relatively low temperatures [11]. The application of LT for 3D temperature mapping of melt volume is a promising tool for improving numerical models.
Over the decades, two classes of methods: time-resolved methods and spectral-resolved methods, using both emission lifetimes and spectral responses, have found application in remote thermometry.
Temperature determination through LT can be based on monitoring various photoluminescence (PL) temperature-sensitive parameters [12,13,14], including absolute PL intensity (Figure 1a), spectral width of the PL band (Figure 1b), fluorescence intensity ratio of two bands (FIR) (Figure 1c), spectral shift of the PL band maximum (Figure 1d), and excited-state lifetime (Figure 1e).
LT does not provide the value of the temperature directly; instead, it provides an indication (Q). Depending on Q the luminescent thermometry is classified as fluorescent intensity thermometry, imaging luminescent thermometry, fluorescent intensity ratio thermometry (FIR), luminescent decay time thermometry.
The most important parameters to quantifying measurement performance are the measurement temperature range, absolute (Sa) and relative (Sr ) sensitivities, temperature resolution (δT), temporal resolution (δxmin), spatial resolution (δtmin), the repeatability and reproducibility (R).
S a = d Q d T ,
S r = 1 Q × d Q d T × 100 % ,
δ Τ = σ S a = σ r S r ,
δ x m i n = δ T d T / d x ,
δ t m i n = δ T d T / d t ,
R = 1 m a x Q ¯ Q 1 Q
The advantages of LT are high sensitivity, independence of the measured quantity from absolute value of PL intensities and excitation energy [15]. From the technical point of view, FIR could be easy implemented by comparing the intensities of only selected bands using narrowband filters and sensitive semiconducting detectors.
A variety of materials both well-ordered such as inorganic single crystals and strongly disordered such as organic dyes as well as nanostructured materials such as nanogels and quantum dots are used for sensitive elements of luminescent thermometers.
Among the luminescent materials investigated as potential LT sensors, special attention is given to materials doped with lanthanides due to their non-toxicity, thermal stability, high quantum yield, and emission independence from matrix [16]. In LT materials co-doped with different Ln3+ ions, e.g., Eu3+ and Tb3+, the ions are binding between each other and energy-transfer from excited levels may followed by a strong temperature dependence [5,17,18]. This mechanism does not lead to thermal equilibrium of populations in the excited state, which makes possible higher relative sensitivity if the luminescence intensity of various ions is sufficient enough [19,20]. The operating mechanism of energy transfer luminescent thermometers is complex because it depends not only on relaxation processes within the ion, but also involves interactions between different ions as well as the influence of the crystal field of the matrix.
Metalorganic Ln-ion based on β-diketonate chelates demonstrated Sr=4,9 %×K–1 in the 10-350 K temperature range [5]. High temperature LT sensors based on YAG:Dy and YAG:Dy, Er single crystals [21] performed an excellent Sr=0,9 %×K–1 in the temperature range up to 1973 K.
Optical quality glasses (contains commonly network former, intermediates, and modifiers) are considered a cheap alternative for creation a uniform doped compact material with adjustable PL, mechanical and chemical properties. For the last decade there were published a number of articles on the problem of functional glasses in the systems of B2O3-PbO-Bi2O3-GeO2 [22], Bi2O3-GeO2 [23], and B2O3-GeO2-Gd2O3 [24], doped with Sm3+ and/or Gd3+. The above investigations have proved the perspective of such glasses application as orange lighting sources [25] and key-feature components of optoelectronic devices [26]. Nevertheless, for LT application B2O3-PbO-Bi2O3-GeO2 glasses doped by RE has not been reported yet.
In this study, we have investigated for the first time luminescent properties of glasses in the systems of B2O3–GeO2–PbO and B2O3–GeO2–Bi2O3 co-doped by Sm3+/Gd3+ vs temperature. Particular attention was paid to the search for a new function to increase the sensitivity of LT materials.

2. Materials and Methods

2.1. Materials and synthesis

We used Bi2O3 99.999 wt%, GeO2 99.995 wt% (LANHIT LTD, Moscow, Russia), PbO 99.5 wt%, B2O3 98.5 wt% (Khimkraft, Kaliningrad, Russia), Sm2O3 99,9 wt%, Gd2O3 99.9 wt% (POLARIT LTD, Moscow, Russia). We synthesized glasses with the general formulas 40B2O3–40GeO2–xPbO(Bi2O3)–ySm2O3–zGd2O3, where x = 15, 16, 17; y = 3, 2.5, 2; z = 2, 1.5, 1 mol% and 42.5B2O3–42.5GeO2–xPbO(Bi2O3)–ySm2O3–zGd2O3, where x = 11.25, 12, 12.75; y = 2.25, 1.875, 1.5; z = 1.5, 1.125, 0.075 mol%.
For the easy presentation of the results, we made the following notation of the glass samples (see Table 1).
Glasses were synthesized in corundum crucibles at 1373 K for 30 min by the standard melt-quenching technique with casting onto a glassy carbon substrate at room temperature. Thermal stresses were removed by annealing at 573 K for 3 h, followed by cooling at ~100 K/h rate. Polished plane-parallel plates with 1.8 mm thickness were fabricated from glasses for further studies.

2.2. Characterization techniques

Structure analysis
The glass samples were grinded to 20 μm powder and their structure was examined by X-ray diffraction using an Equinox-2000 diffractometer (Inel SAS, Artnay, France) with CuKα radiation (λ=1.54056 Å). The element analysis of the synthesized glasses was carried out using X-ray spectral energy-dispersive microanalyzer (EDS Oxford Instruments X-MAX-50, Abingdon, Oxfordshire, UK) on the base of Tescan VEGA3-LMU scanning electron microscope (TESCAN ORSAY HOLDING, Brno, Czech Republic).
Raman spectra were recorded on a QE65000 spectrophotometer (Ocean Optics, Largo, FL, USA) using a 785 nm excitation laser in the frequency shift range of 200–2000 cm̶ 1 in backscattering geometry. FT-IR absorption spectra were recorded on a Tensor 27 IR-Fourier spectrometer (Bruker, Ettlingen, Germany) in 400–8000 cm ̶ 1 range.
Glass characterization
The glass transition temperatures of the samples were determined by differential scanning calorimetry methods using a NETZSCH STA 449 F3 Jupiter instrument (Erich Netzsch GmbH & Co. Holding KG, Selb, Germany) with 1 K accuracy. The measurements were carried out for 15 mg bulk samples placed in platinum crucibles at 10 K/min heating rate. The density of the samples was determined by the hydrostatic method using a MER123 ACF JR-150.005 TFT balance (Mercury WP Tech Group Co., Ltd., Incheon, The Republic of Korea) with the accuracy of 0.005 g/cm3.
Optical characterization techniques
The refractive index was determined using a MEGEON 72022 gemological refractometer (MEGEON, Moscow, Russia) with 1.78 refractive index liquid (sample nD < 1.78) and a MIN-8 optical microscope (LOMO JSC, Saint Peterburg, Russia) by measuring the shift of the refracted beam at different preset tilt angles of sample plates located on a special stage (sample nD > 1.78). The measuring accuracy was 0.01.
The absorption spectra were recorded on a JASCO V-770 spectrophotometer (JASCO Corporation, Tokyo, Japan) in the 190–2700 nm wavelength range with 1 nm step.
The photoluminescence and excitation spectra at room temperature were recorded on an Fluorolog FL3-22 (Horiba Jobin Yvon, Longjumeau, France) with double monohromatization of both excitation and emission radiation in 400–720 nm wavelength range with 1 nm step; the PL decay kinetics were measured on a Fluorolog FL3-22 (Horiba Jobin Yvon, Longjumeau, France) with 370 nm a pulsed diode excitation and Δτ = 1.5 ns. The decay kinetics was carried out using the OriginPro 8 SR4 program (OriginLab Corp., Northampton, MA, USA) using the Fit Exponential procedure.
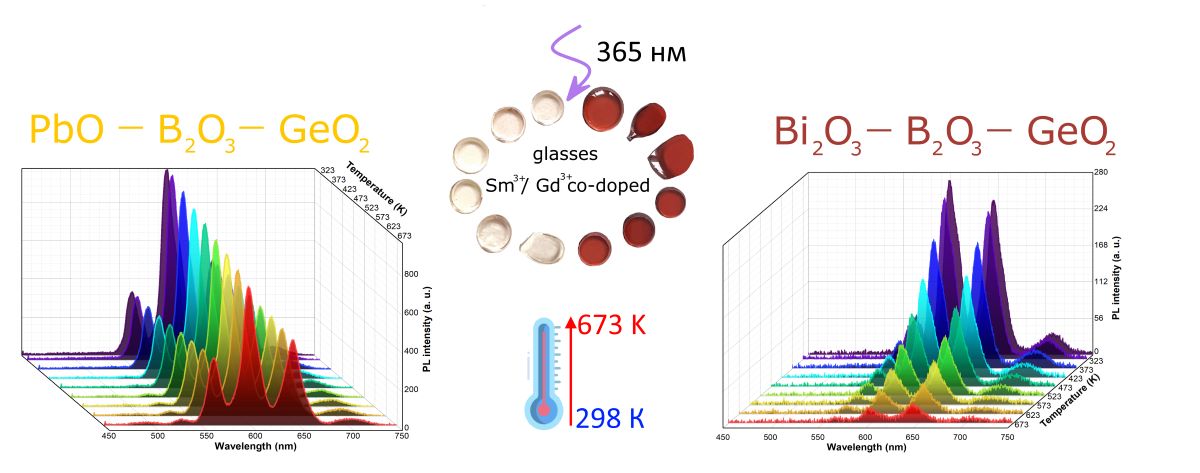
The thermoluminescence spectra were recorded on an OpticInsight OCEAN-HDX-UV-VIS fiber optic spectrometer (Ocean Insight, Orlando, FL, USA) under excitation with an XML T6 10W 365 nm laser LED (TiaoChongYi, Changchun, China). Heating and cooling of glass samples were carried out using Optical cryo and high temperature stage (SIMTRUM Pte. Ltd., Singapore, Singapore) with temperature control range from room temperature to 673 K.
In all PL measurements the exciting beam spot was 0.5 mm.

3. Experimental results

3.1. Glass samples
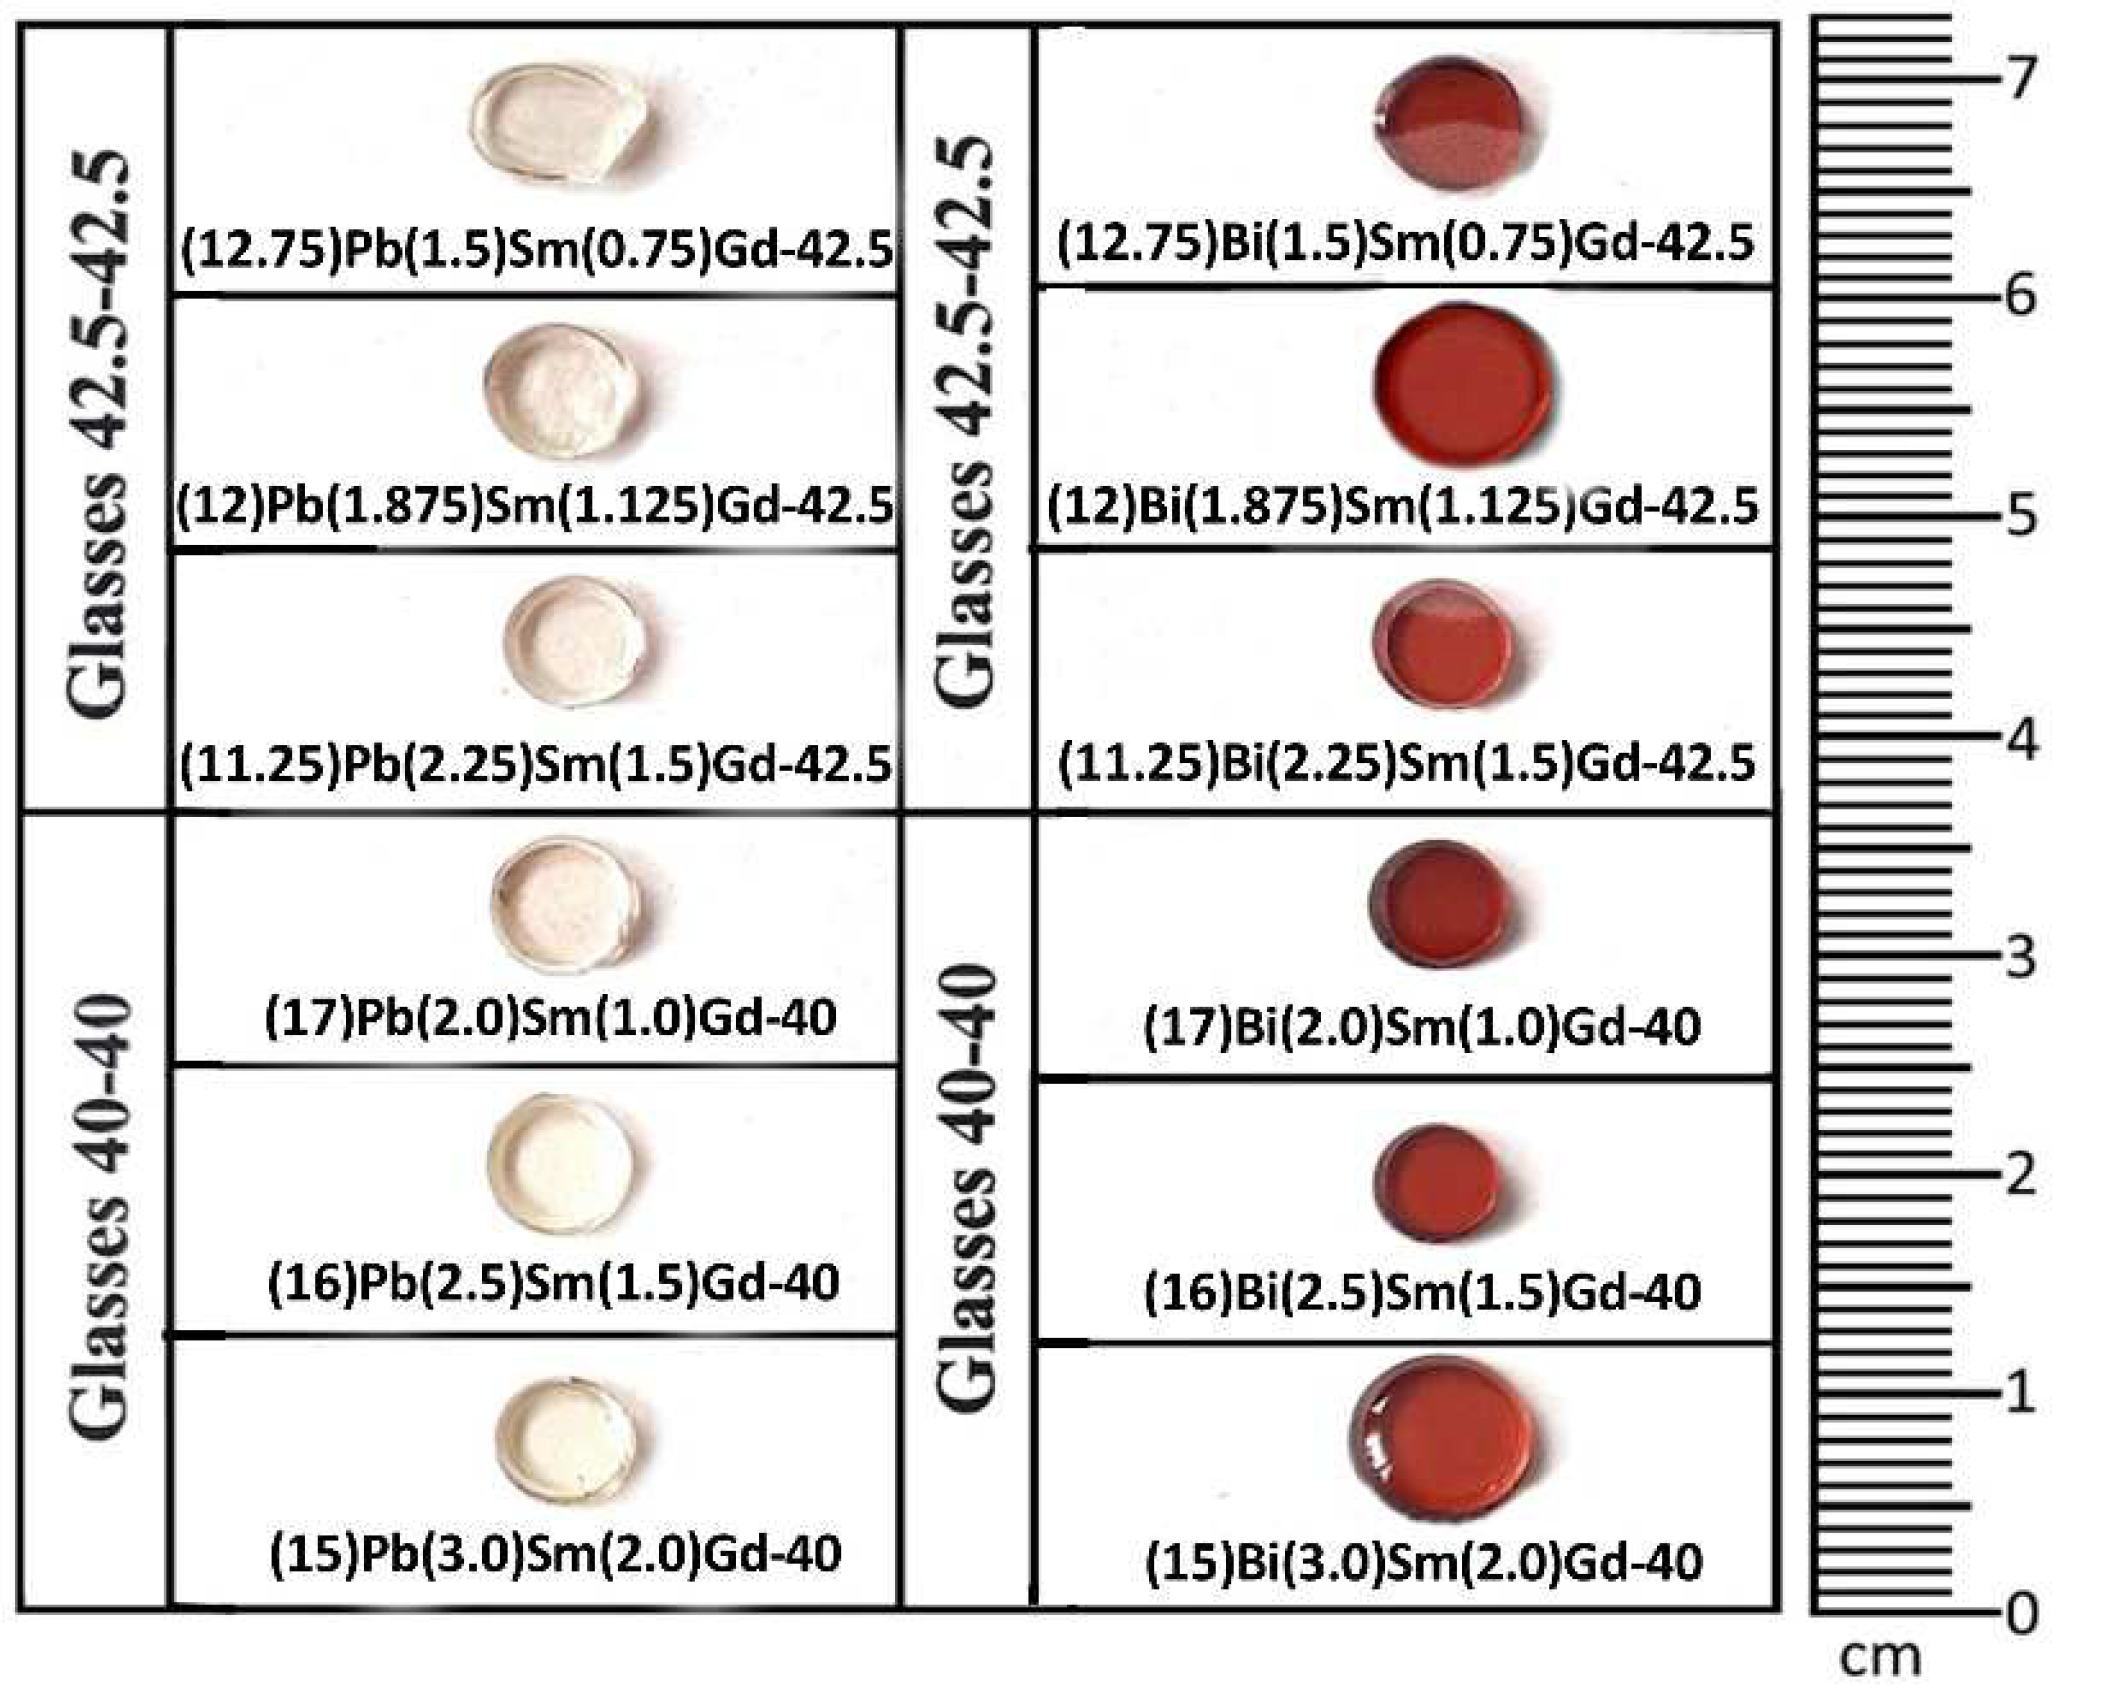
Pb-based glasses have a pale-yellow color, which is attributed to the presence of lead oxide (Figure 2). Pb-based glasses with a matrix composition of 40–40 have a more intense yellow color, due to an increase in the content of lead oxide shifts the short-wavelength absorption edge to the long-wavelength region of the spectrum [27].
Bi-based glasses had a ruby-red color due to the absorption shoulder in the region of 500 nm attributed with bismuth active centers [28], which becomes more saturated at bismuth oxide content increase.
Figure 2. The photographs of B2O3–GeO2–PbO and B2O3–GeO2–Bi2O3 glasses co-doped by Sm3+/Gd3+.
Preprints 94972 g002
The results of the elemental analysis (XFS-EDS) of the glasses showed that all samples were characterized by homogeneous composition and all of them contained an aluminum impurity due to the synthesis in corundum crucibles, which was explained by the chemical action of fluid PbO or Bi2O3 with the crucible material (for details see Figure S31-S42 and Table S1).

3.2. Glass structure characterisation

X-ray diffraction patterns of all synthesized glasses demonstrated a wide halo in 21-36 degree 2θ range (Figure S1) which proved the amorphous nature of all glass samples.
Samples of the two systems under consideration have common vibron modes in all frequency regions of Raman spectra (Figure S2-S3) and the corresponding interpretations are presented in Table 2, which correlates with various literature data.
In the low-frequency range (300–700 cm ̶ 1) we observed a band in the 460-465 cm ̶ 1 range which was referred to the symmetrical stretching of Ge–O–Ge bonds in 4- or 6-membered Ge4+ rings in a tetrahedral arrangement [29,30,31]. The 800 cm ̶ 1 band referred to vibrations of oxygen atoms in the boroxol ring with the participation of a very small movement of boron atoms [32,33]. The presence of broad bands in the high-frequency region (1250–1500 cm ̶ 1) were associated with stretching of the B–O terminal bonds in borate structures containing metaborate triangles [33,34,35,36].
We observed four additional bands: at 390, 650, 715, and 890 cm ̶ 1 for Bi-based glasses. The 390 cm–1 band was associated with the bending modes of the Ge–O–Ge [37]. The 650 cm ̶ 1 band was referred as vibrations of the 6-coordinated germanium atom in the glass structure [30,38]. The 890 cm ̶ 1 band is generally attributed with a double degenerate vibration [39]. According to the Ref. [31] the 715 cm ̶ 1 band characterized tensile vibrations of the B-sublattice relative to the O-sublattice and out-of-plane ring B–O–B vibration.
Table 2. Interpretation of Raman bands in Pb-based and Bi-based glasses.
Raman shift, cm–1 Interpretation Reference
Pb-based Bi-based
390 Bending modes of Ge–O–Ge bonds [37]
465 460 Symmetrical stretching of Ge−O−Ge bonds in
4- or 6-membered rings of Ge4+ in a tetrahedral arrangement
[29,30,31]
650 Vibrations of 6-coordinated atom Ge (VI) [30,38]
715 Stretching vibration of the B-sublattice against the O-sublattice, a B–O–B out-of-plane ring vibration [31]
800 800 Vibration of the oxygen
atoms in the boroxol ring
[32,33]
890 Ge–O–Ge
double degenerate vibration
[39]
1315 1240 B−O stretching mode in metaborate structures [33,34,35]
1500 Overlap of following modes: B–O in BØ2O-, BØ2O- triangle linked to BØ4 unit, and stretching in BØ3 triangles [36]
The Fourier transform infrared spectra were interpreted based on the assumption that the B–O and O–Ge–O bonds play a key role in the glass structure. The FT-IR spectra of bismuth/lead borogermanate glasses doped with Sm3+ and Gd3+ ions were investigated in the 500–2000 cm ̶ 1 range (Figure S4-S5). All analyzed glass samples demonstrated active vibrational modes, indicating the presence of typical characteristics for a borogermanate glass network.
The 540 and 544 cm ̶ 1 bands referred to the deforming vibrations of the Ge–O bond [40]. The 773 cm ̶ 1 band was related to the Ge–O stretching vibrations in the structural units [GeO4] [40,41]. Bands in the mid-frequency region (>800 cm ̶ 1) at 805, 1170, 1185, 1450, and 1547 cm ̶ 1 described the stretching of the B–O bond. The 805 cm ̶ 1 band is attributed with [BO4] unit stretching [34,41], while the bands at 1170, 1185, 1450, 1547 cm ̶ 1 are responsible for [BO3] unit stretching [41,42].
An analysis of IR spectra obtained by FT-IR and Raman spectroscopies did not reveal any contradictions. Hypotheses regarding the structure of glass presented earlier [29,30,31,32,33,34,35,36,37,38,39,40,41,42] were confirmed.

3.3. DSC characterisation and physical properties

To determine the maximum operating temperature for luminescent thermometry for the obtained glasses we measured the glass transition temperatures by the DSC technique (Table 3, Figures S6-S17). To the date as an upper limit for the maximum operating temperature for luminescent thermometry we chose the 673 K temperature which was ~100 K lower the glass transition temperatures for all glasses.
The density of the samples naturally increases with an increase in the content of heavy metal oxide and a decrease in the content of B2O3 and GeO2 (Table 4). The densities of Bi-based samples were higher compared to Pb-based ones, which could be associated with a higher Bi molecular weight [12]. A similar trend we observed for the refractive index (Table 4). It should be noted that the change in the content of lead oxide by ±1 mol. % did not significantly affect the refractive index values.

3.4. Spectral-luminescent properties

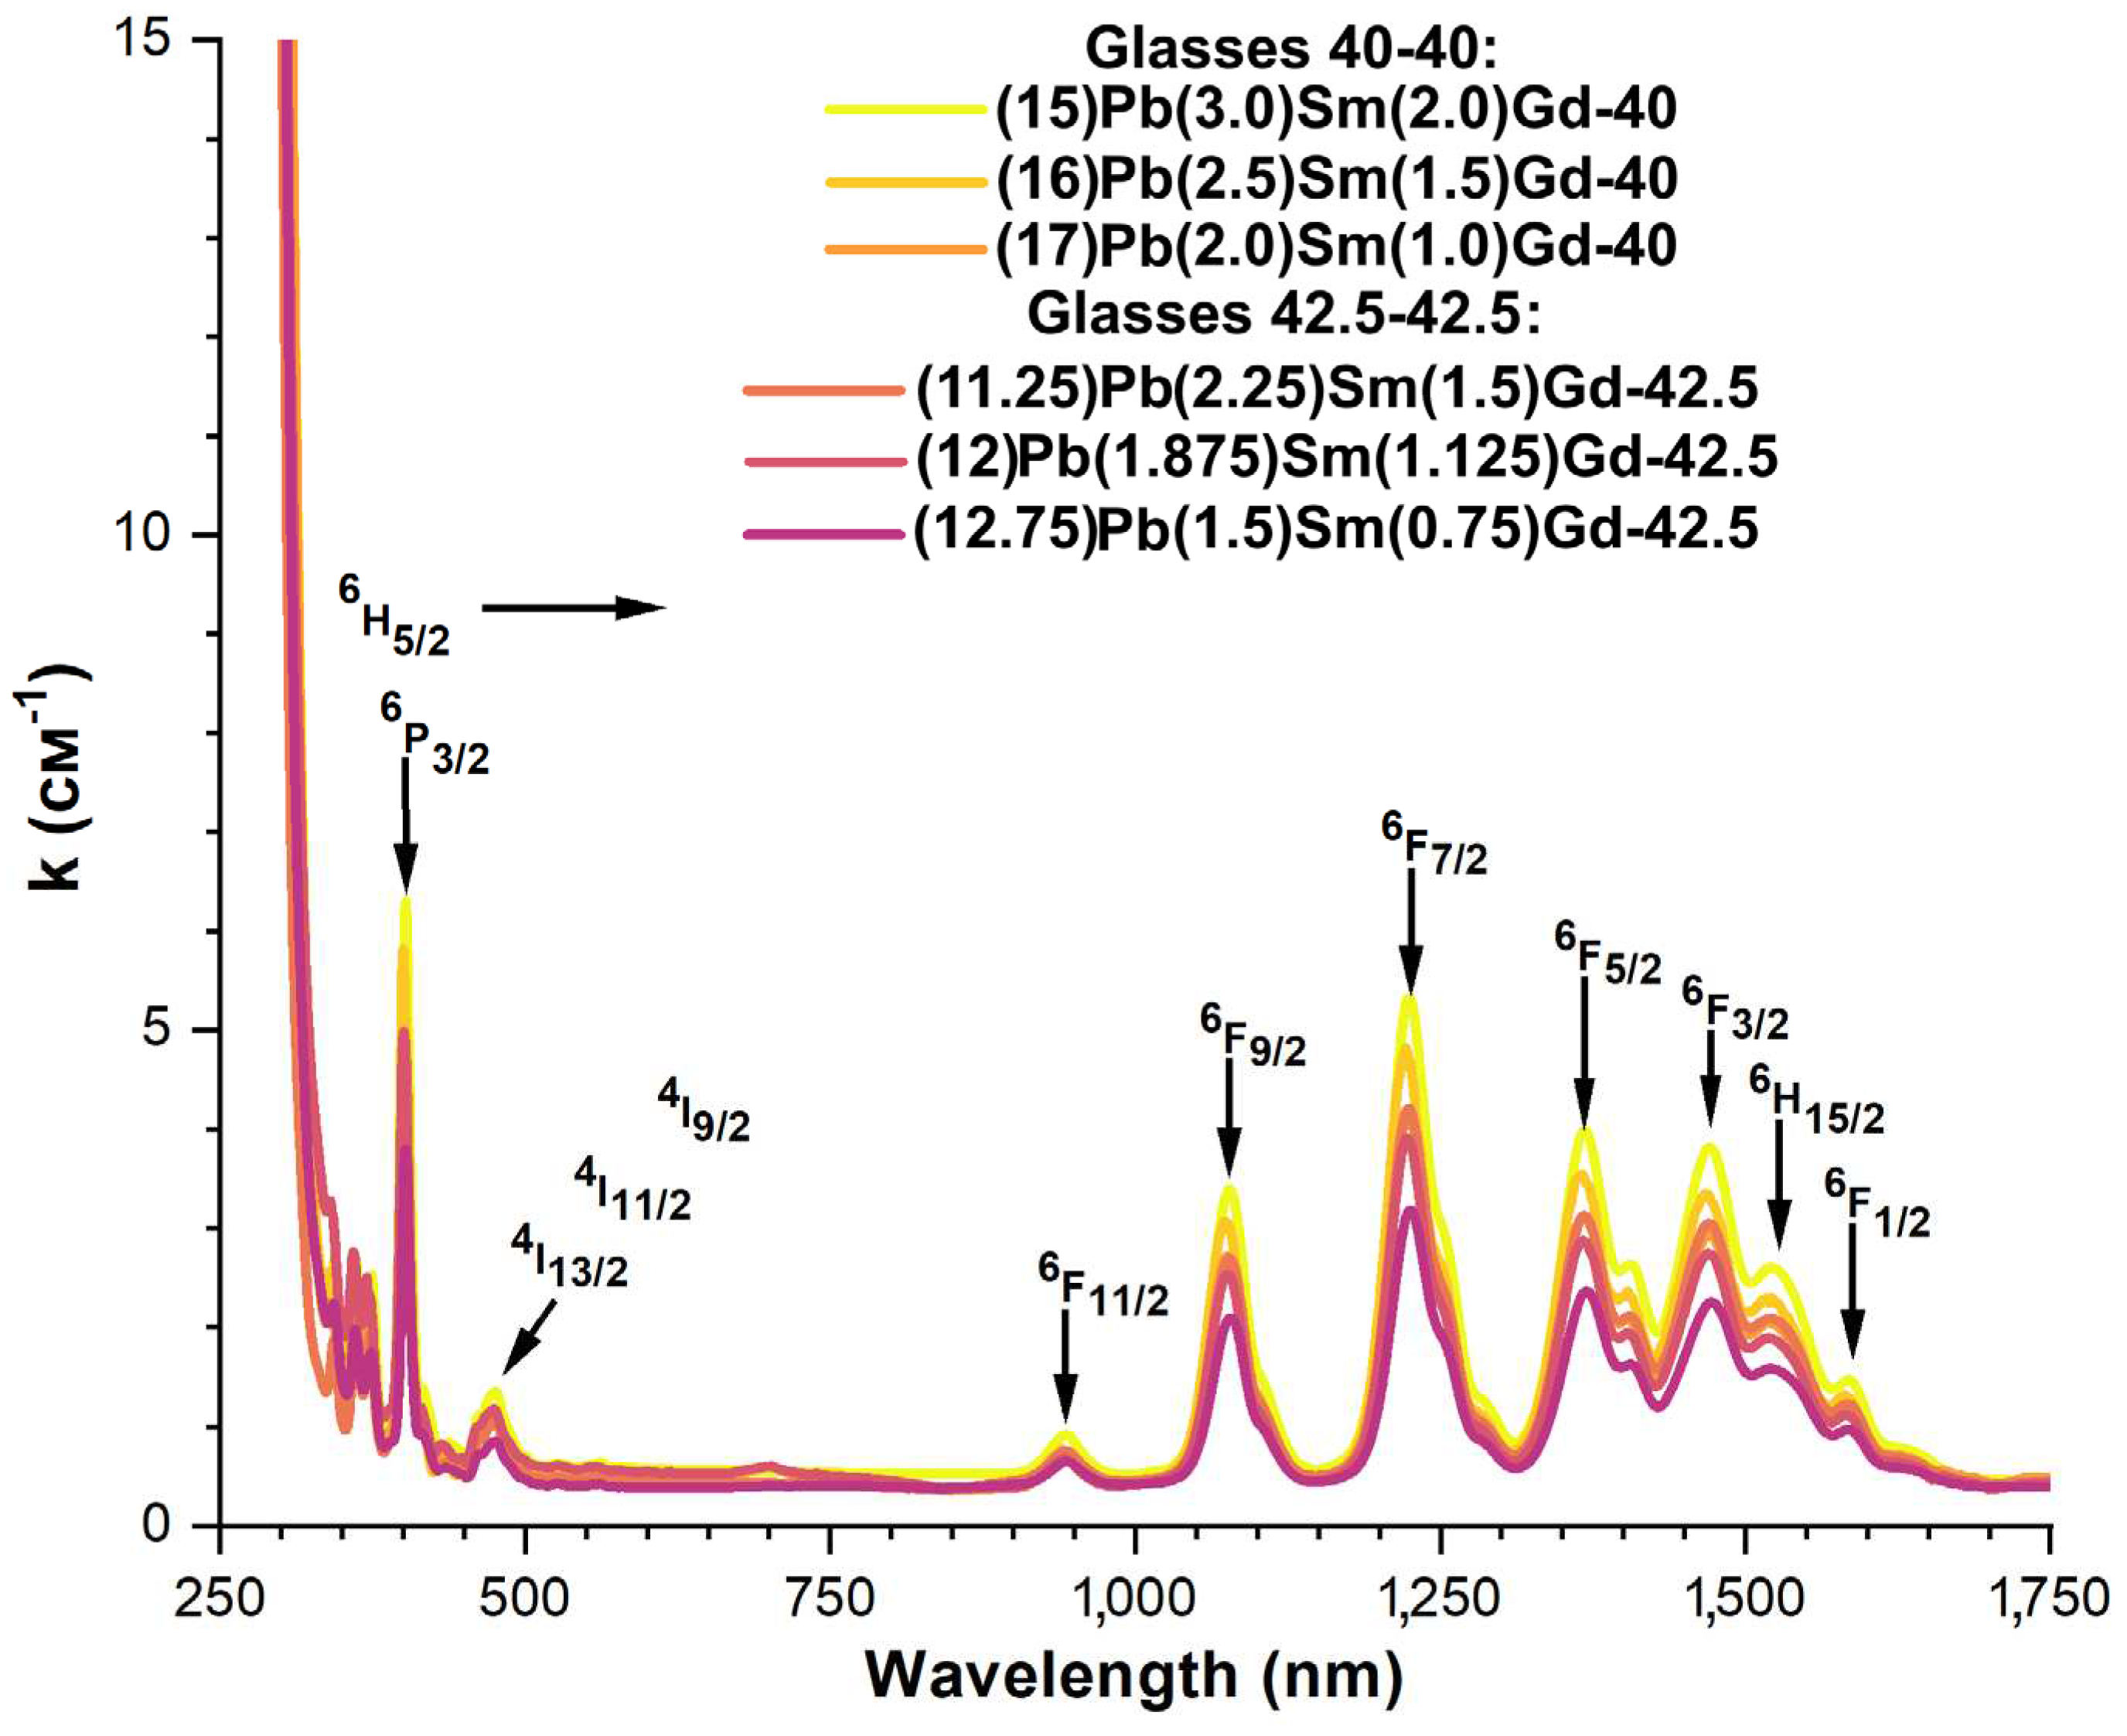
We observed that the absorption spectrum of Pb-based glasses (Figure 3) included 11 main bands associated with ff transitions from the ground state (6H5/2) to various excited states of Sm3+. The transition to the 6P3/2 state at 402 nm is the most intense, since the 4f electrons are screened by the 5s and 5p shells [43]. The remaining absorption bands are observed in the IR region. The most intense band corresponds to the 6H5/26F7/2 transition. The intensity of all absorption bands increased with increasing content of Sm3+ in the obtained Pb-based glasses.
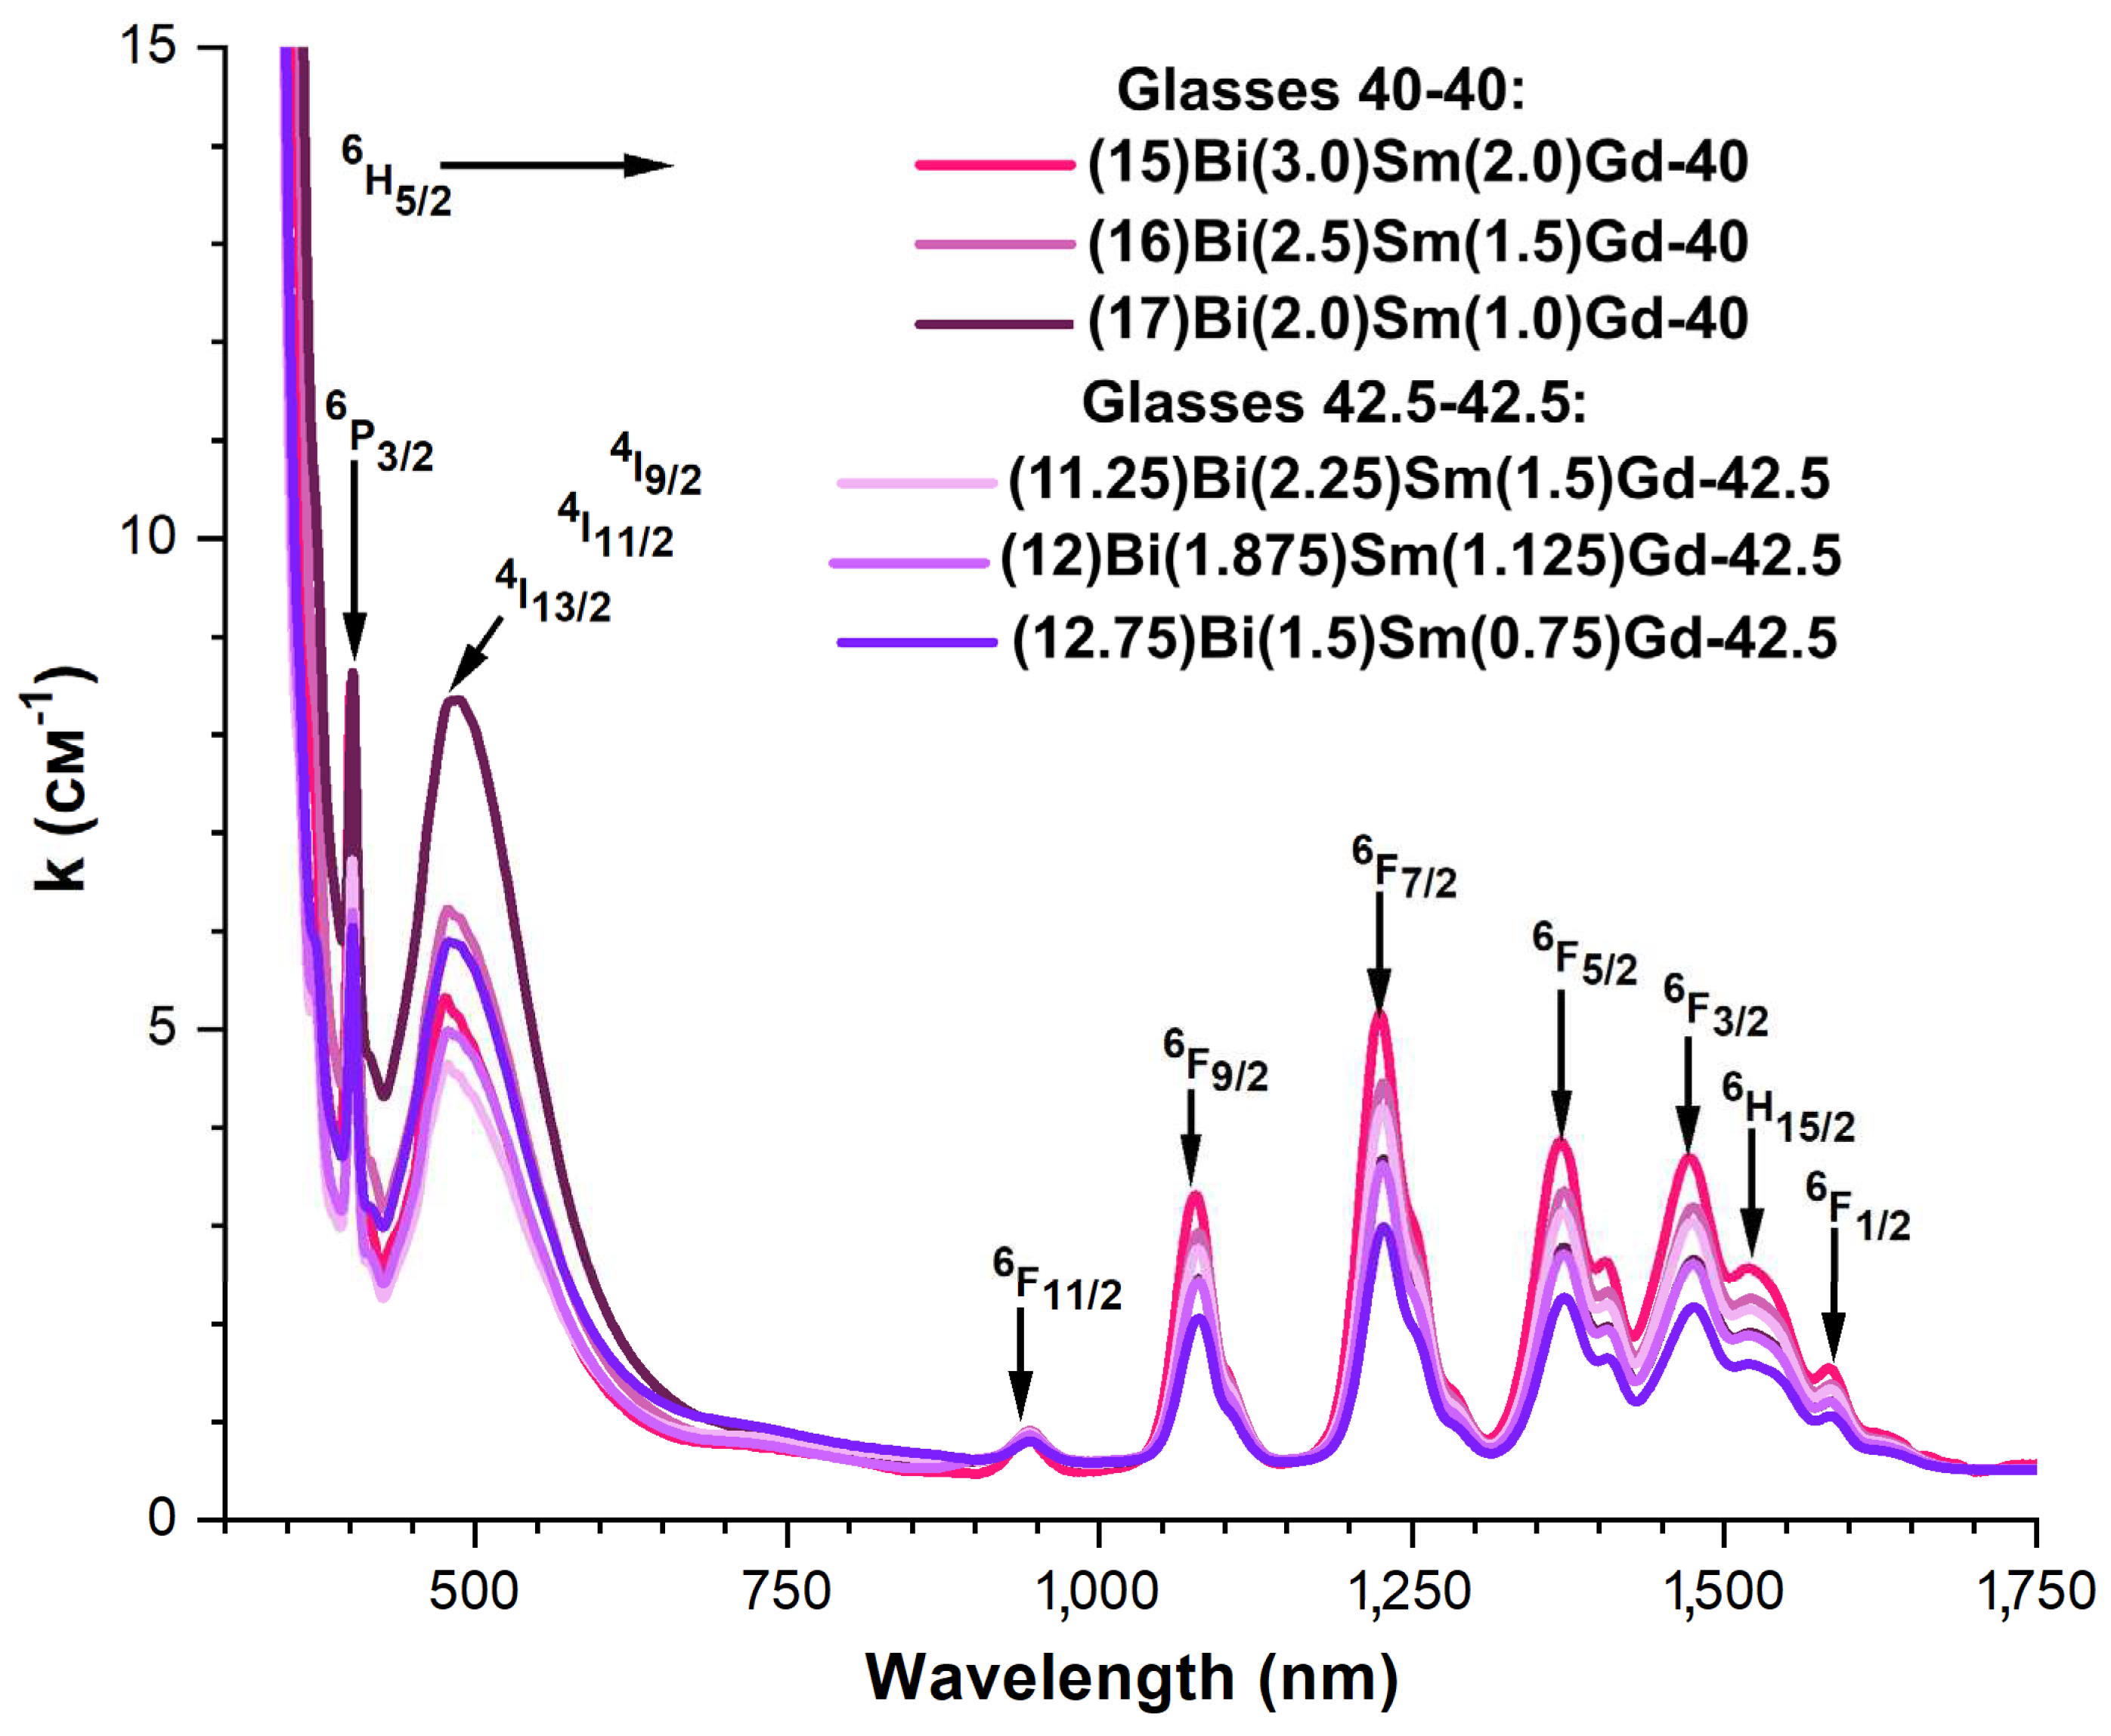
The absorption spectra of Bi-based samples similarly included the above 11 bands specific for Sm3+ (Figure 4). The bands attributed to the 4I9/2, 4I11/2 and 4I13/2 transitions (~475 nm) are invisible, since the absorption in the region of 500 nm of bismuth active centers (BACs) overlaps these bands [28,45]. An increase in the Bi2O3 concentration resulted in the intensity growth of 475 nm band, and in a shift of the short-wavelength absorption edge to the long-wavelength region, which led to a narrowing of the transparency window of the Bi-based glasses.
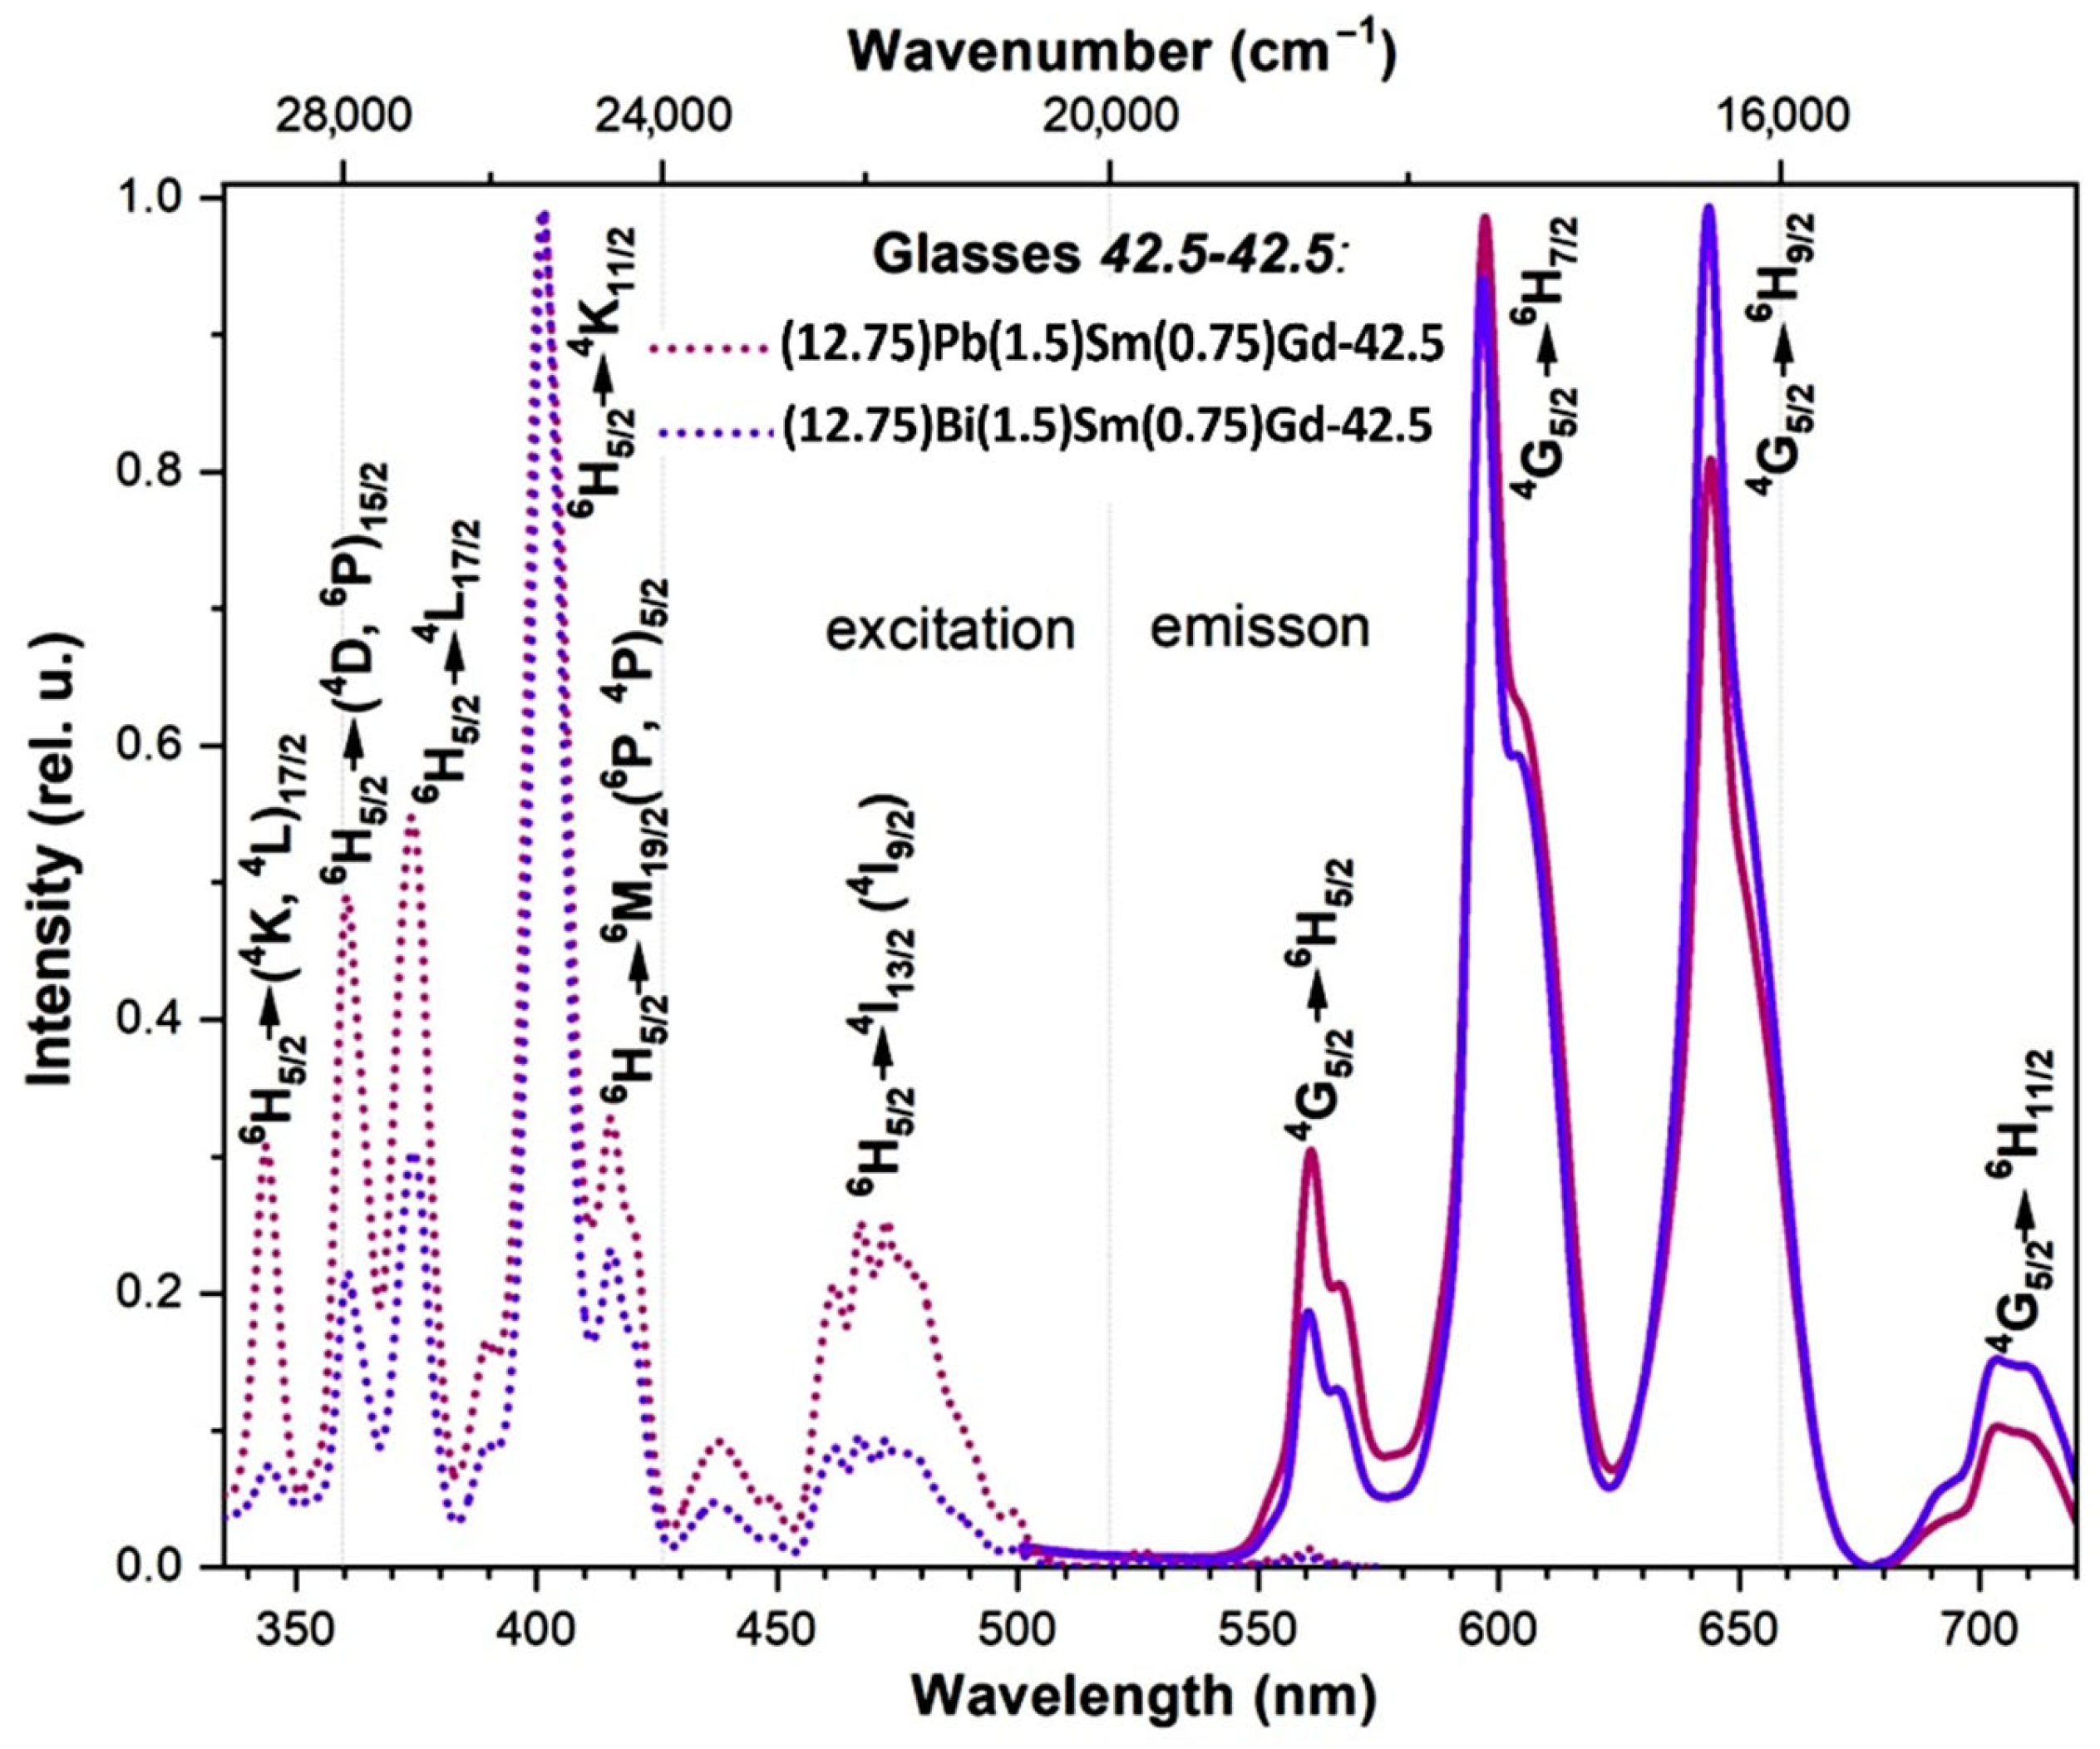
The intensive excitation band for all glasses was observed around 400 nm (Figure 5, S18). The intensity of the 6H5/24K11/2 transition at 404 nm is the highest regardless of the composition.
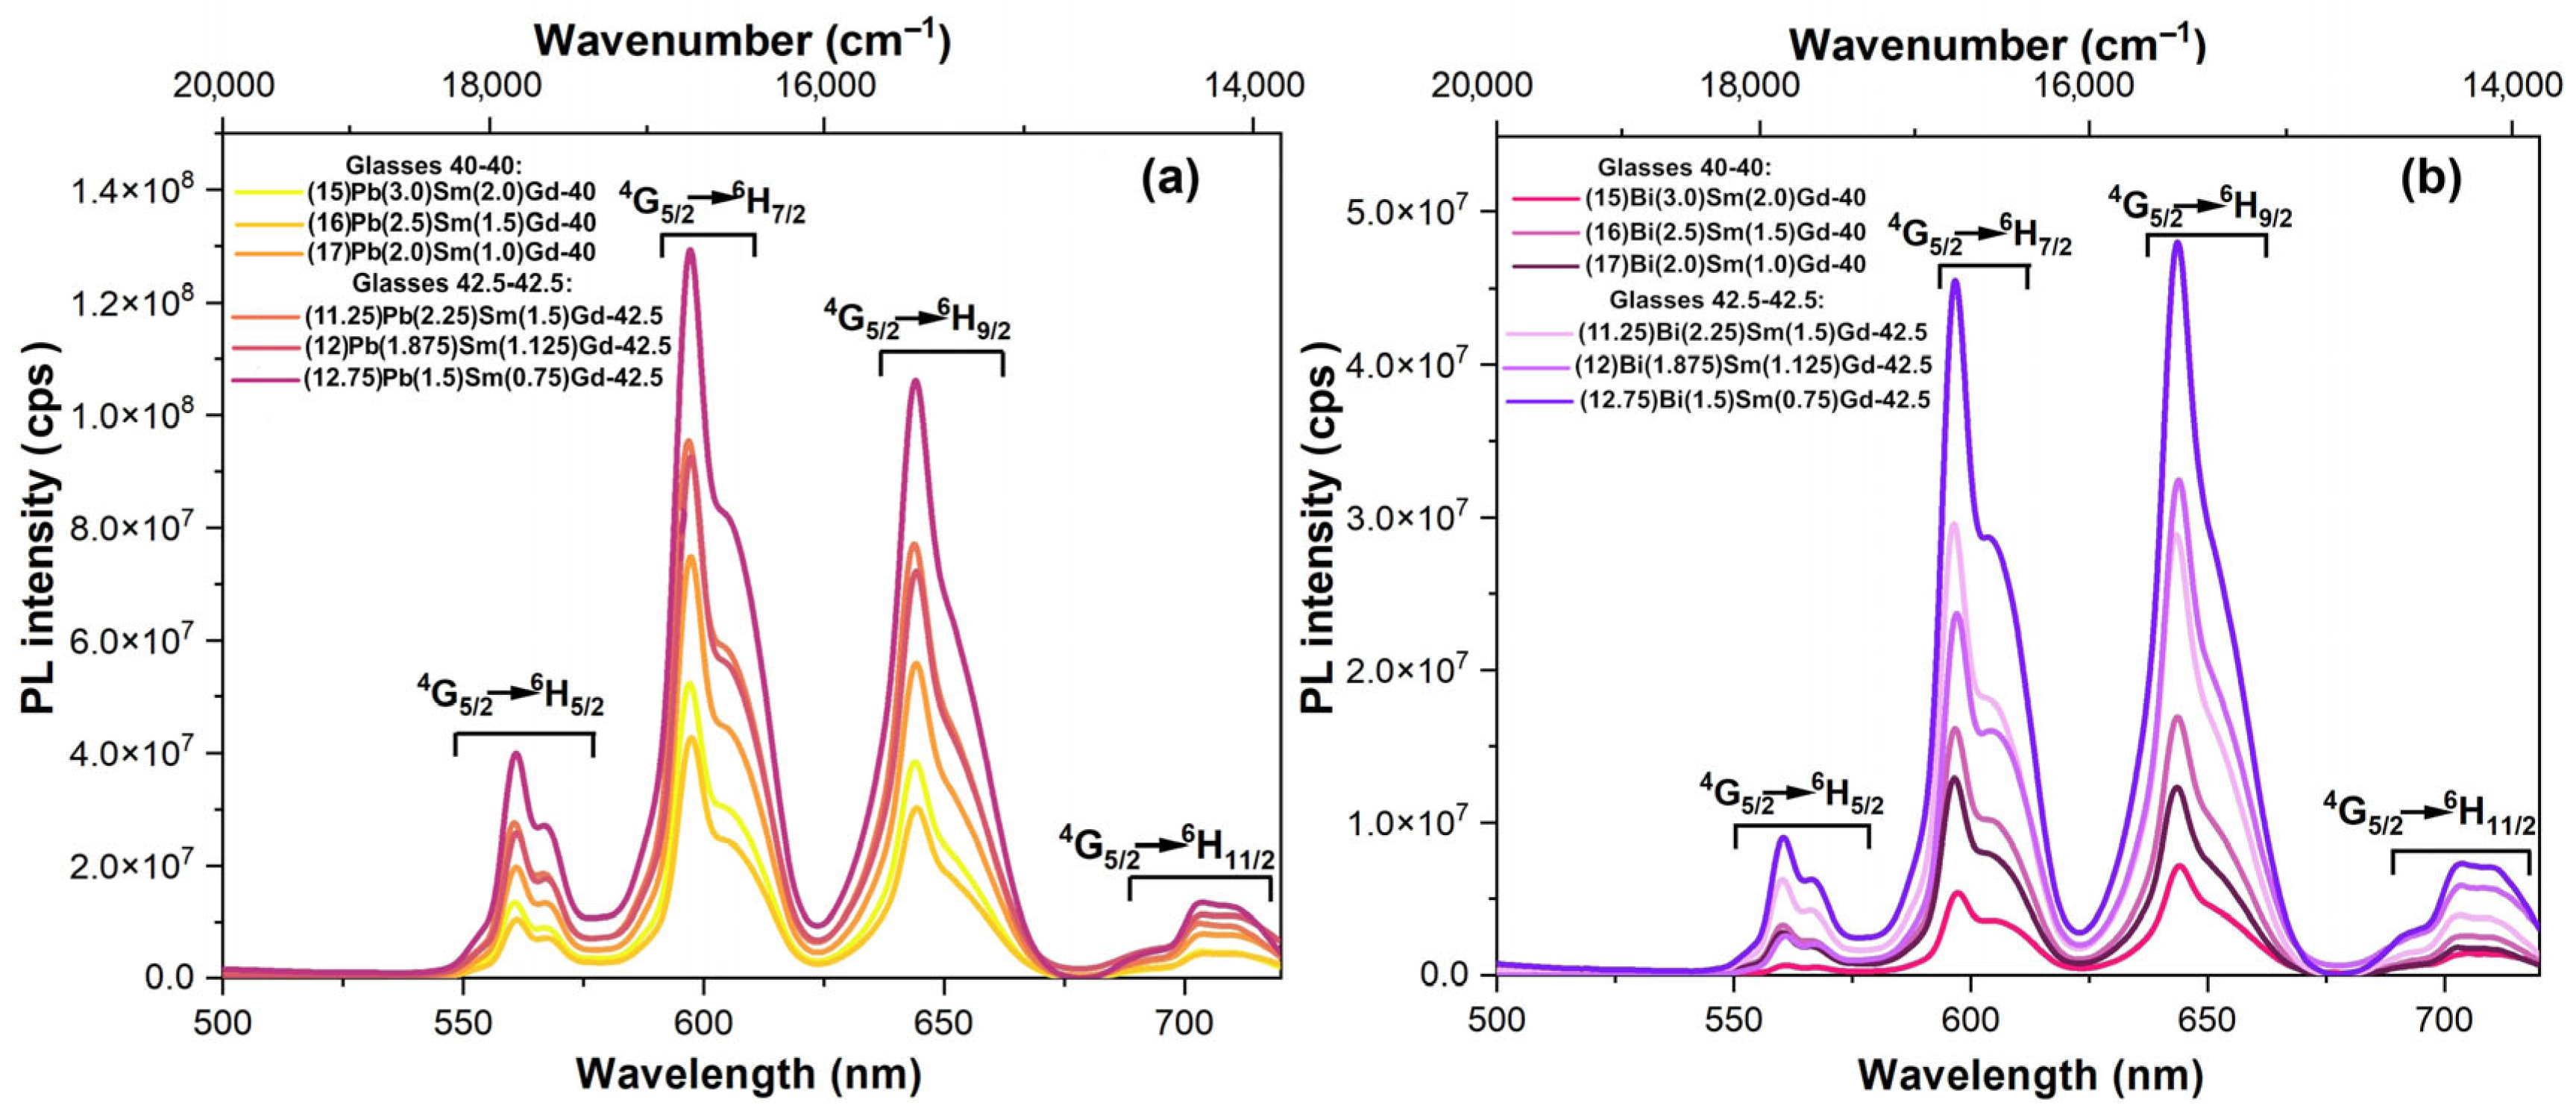
The photoluminescence (PL) spectra of glasses (Figure 6) revealed the Sm3+ bands at 562 nm (4G5/26H5/2), 597 nm (4G5/26H7/2), 645 nm (4G5/26H9/2) and 704 nm (4G5/26H11/2) resulted from the transitions between 4f–4f levels. The most intense transition is 4G5/26H7/2, which corresponds to the orange luminescence. An increase in the Sm3+ ion concentration led to concentration quenching. In the obtained glasses Gd3+ played a role of a sensitizer with respect to Sm3+ [46]. The presence of Gd3+ increased the PL intensity in times. The most intense luminescence was obtained for the (12.75)Pb(1.5)Sm(0.75)Gd-42.5 and (12.75)Bi(1.5)Sm(0.75)Gd-42.5 glass samples.
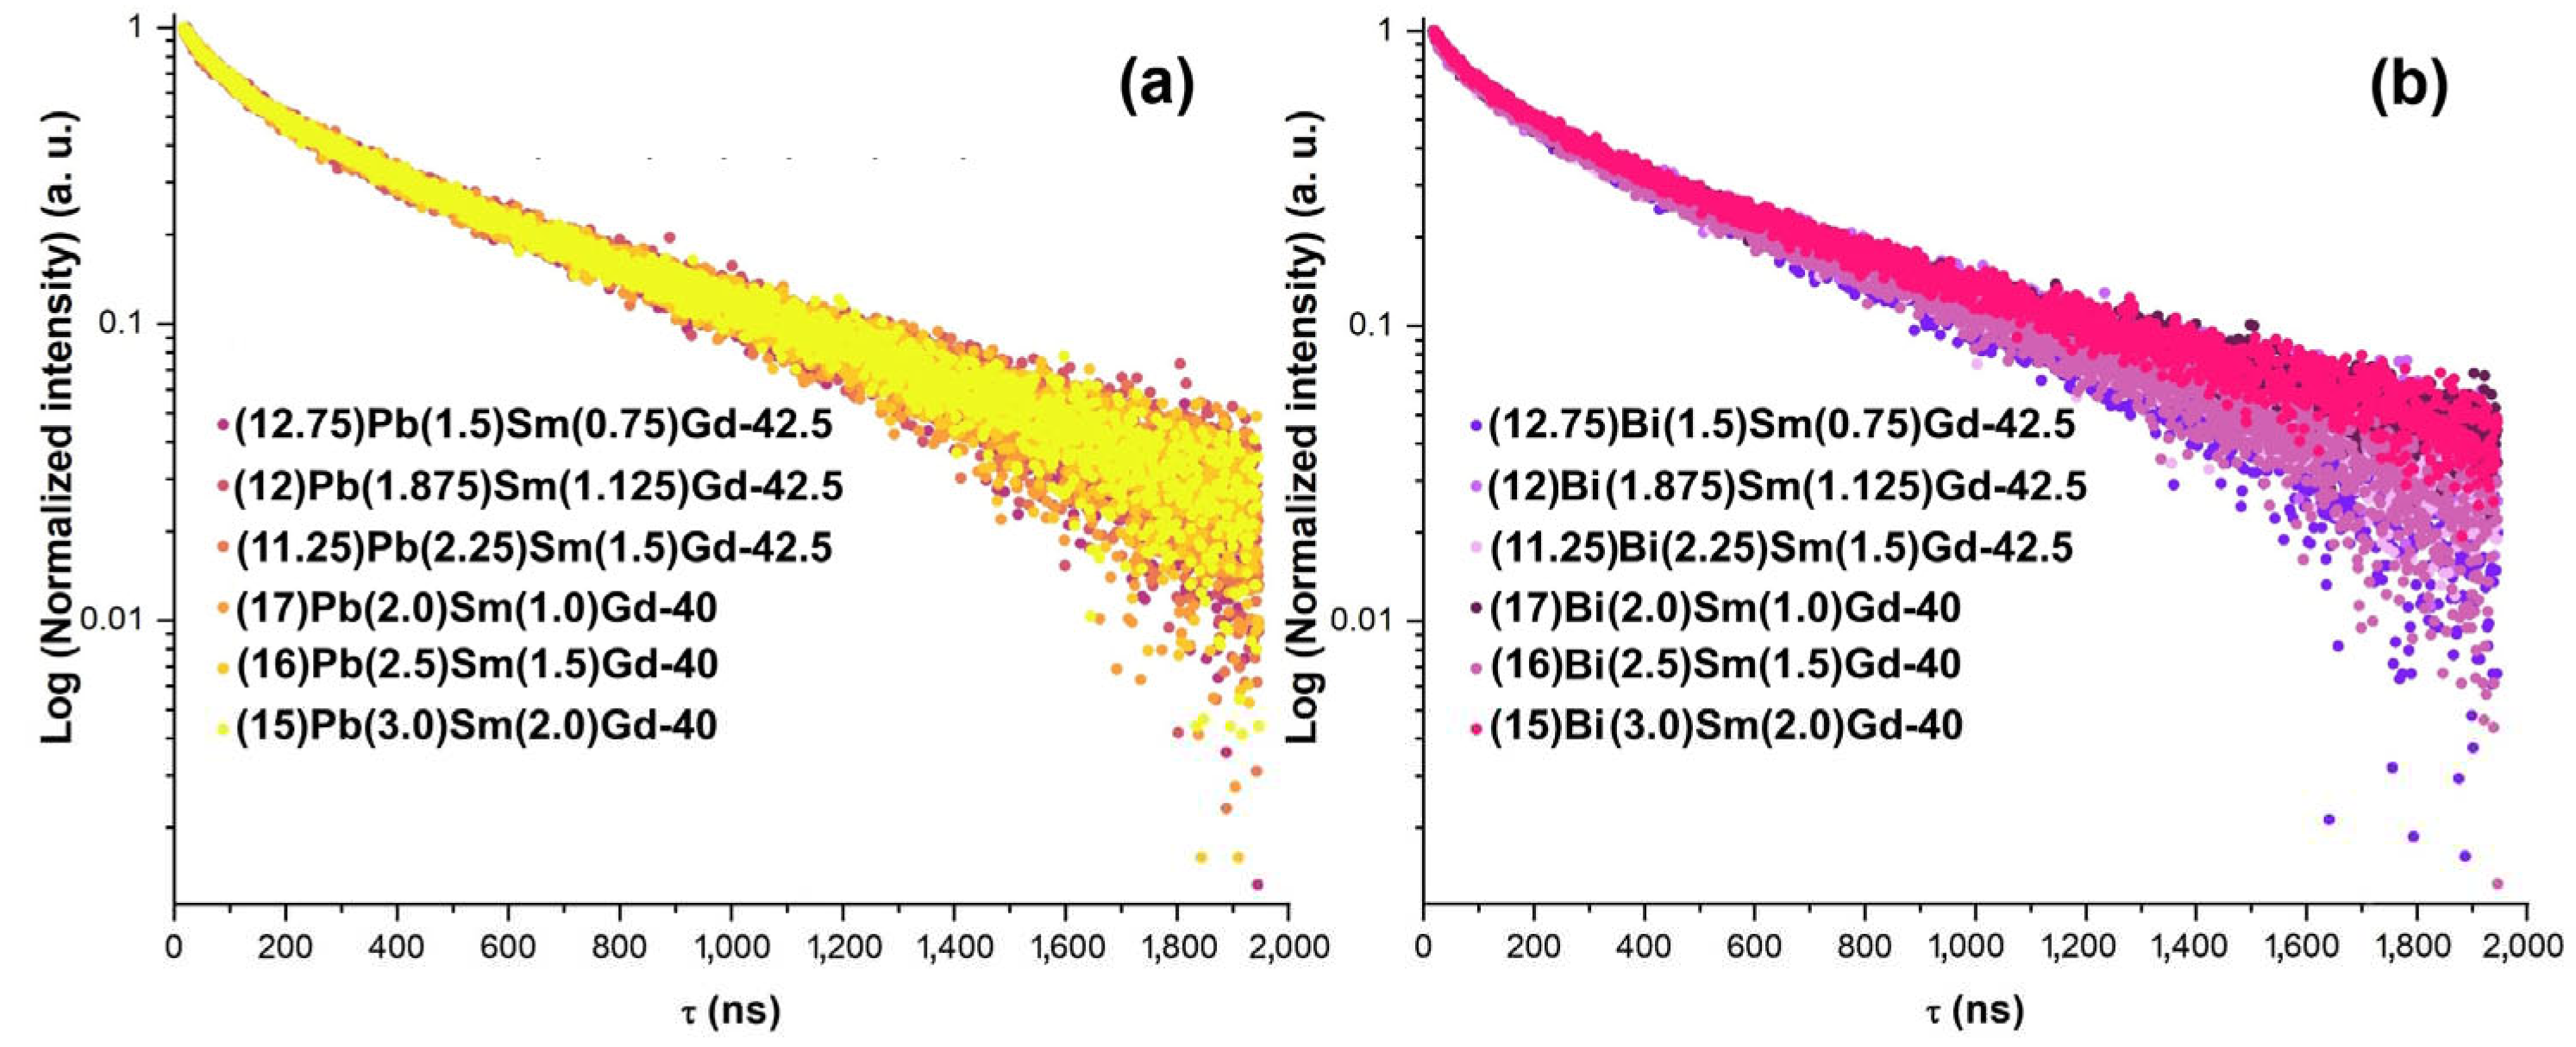
An analysis of PL kinetics (Figure 7, for details see Figure S19-S30) showed that the decay curves could be described by bi-exponential decay kinetics. The fast PL centers had the lifetime of 90-100 ns while the slow PL centers had the lifetime of 590-620 ns (Table 5).
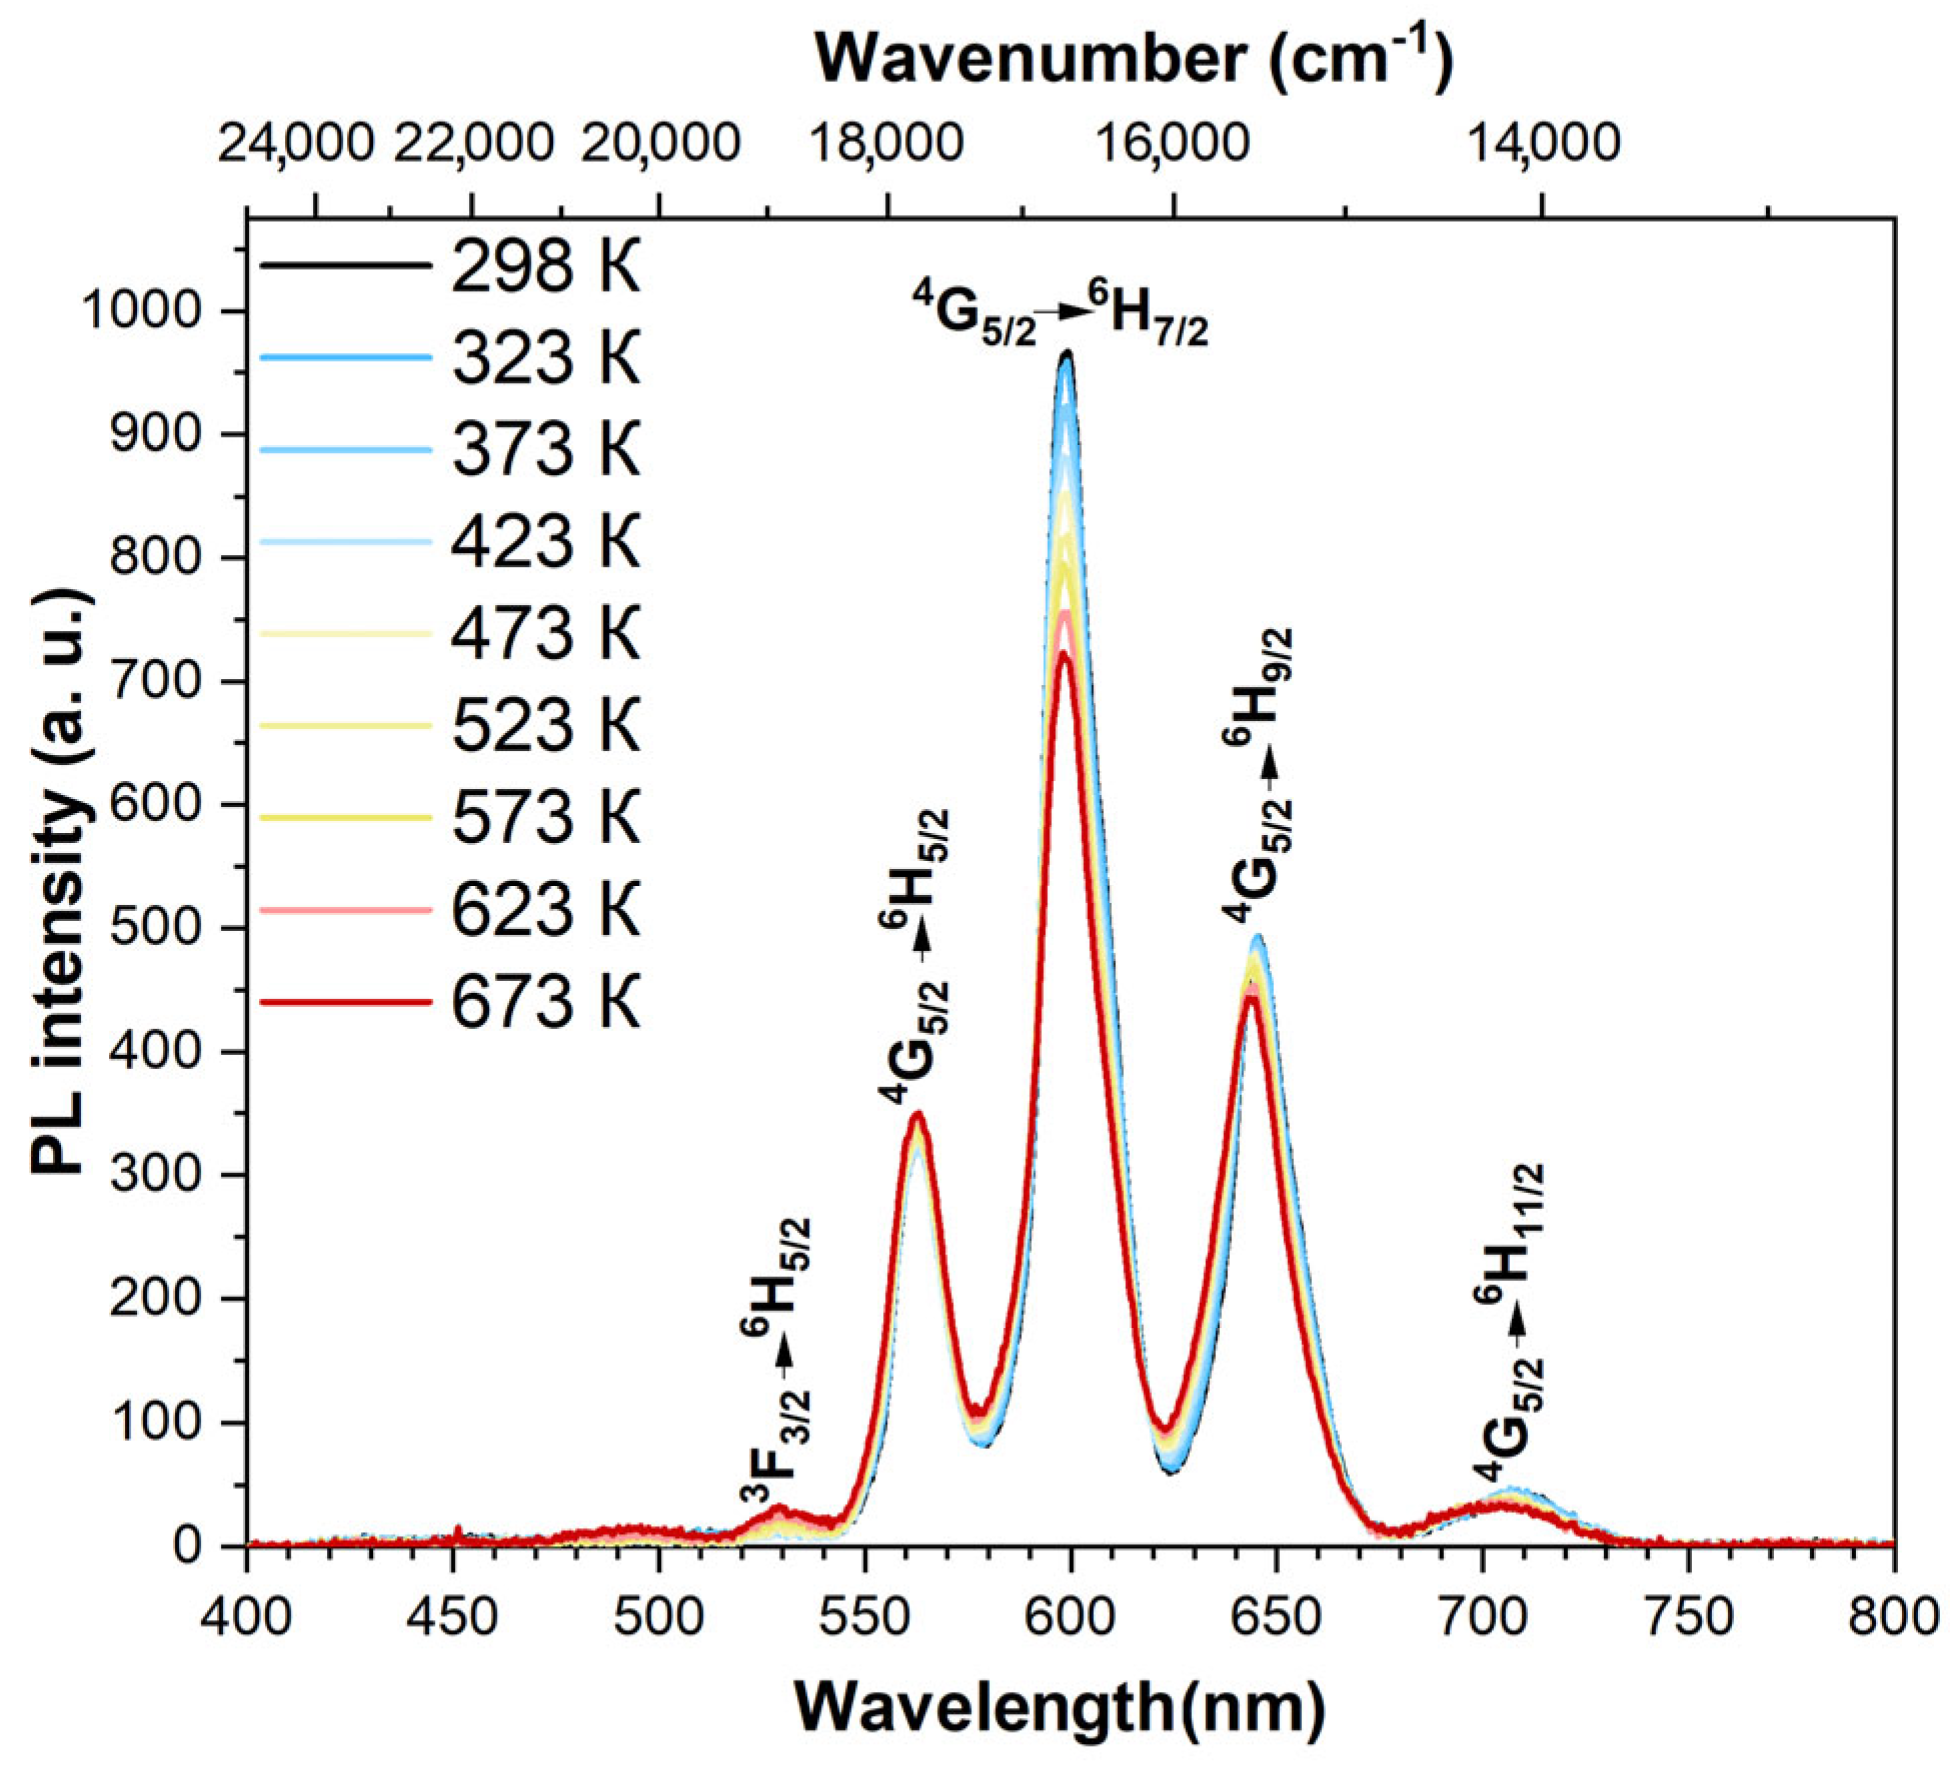
The (12.75)Pb(1.5)Sm(0.75)Gd-42.5 and (12.75)Bi(1.5)Sm(0.75)Gd-42.5 glass samples demonstrated the most intensive PL (Figure 7, 8) and they were chosen for the testing of LT properties in the 298–673 K temperature range.
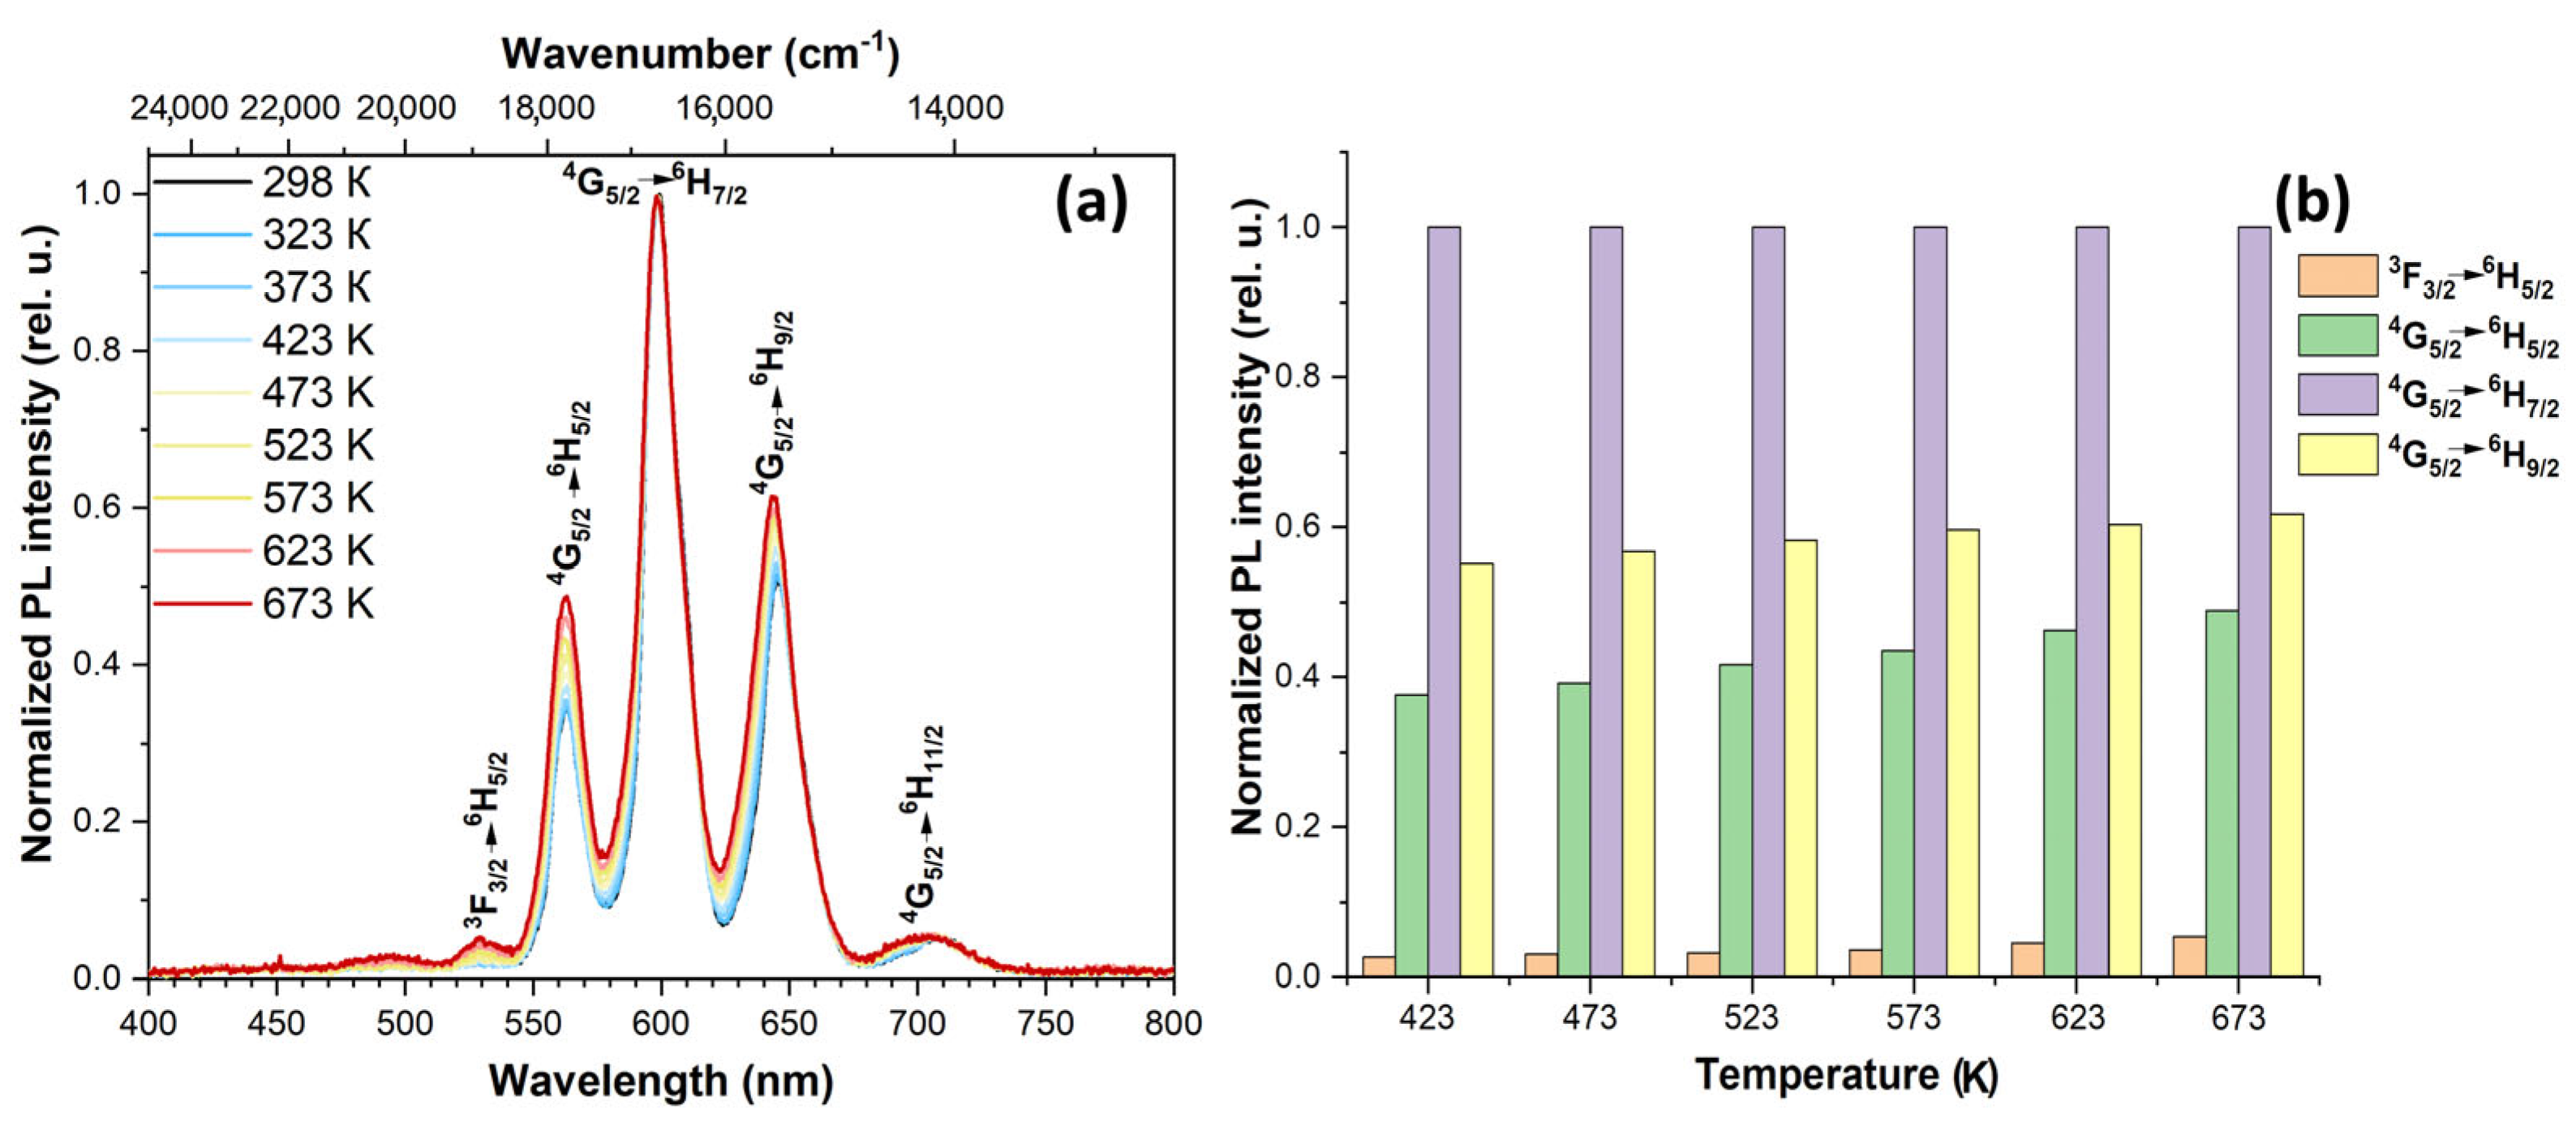
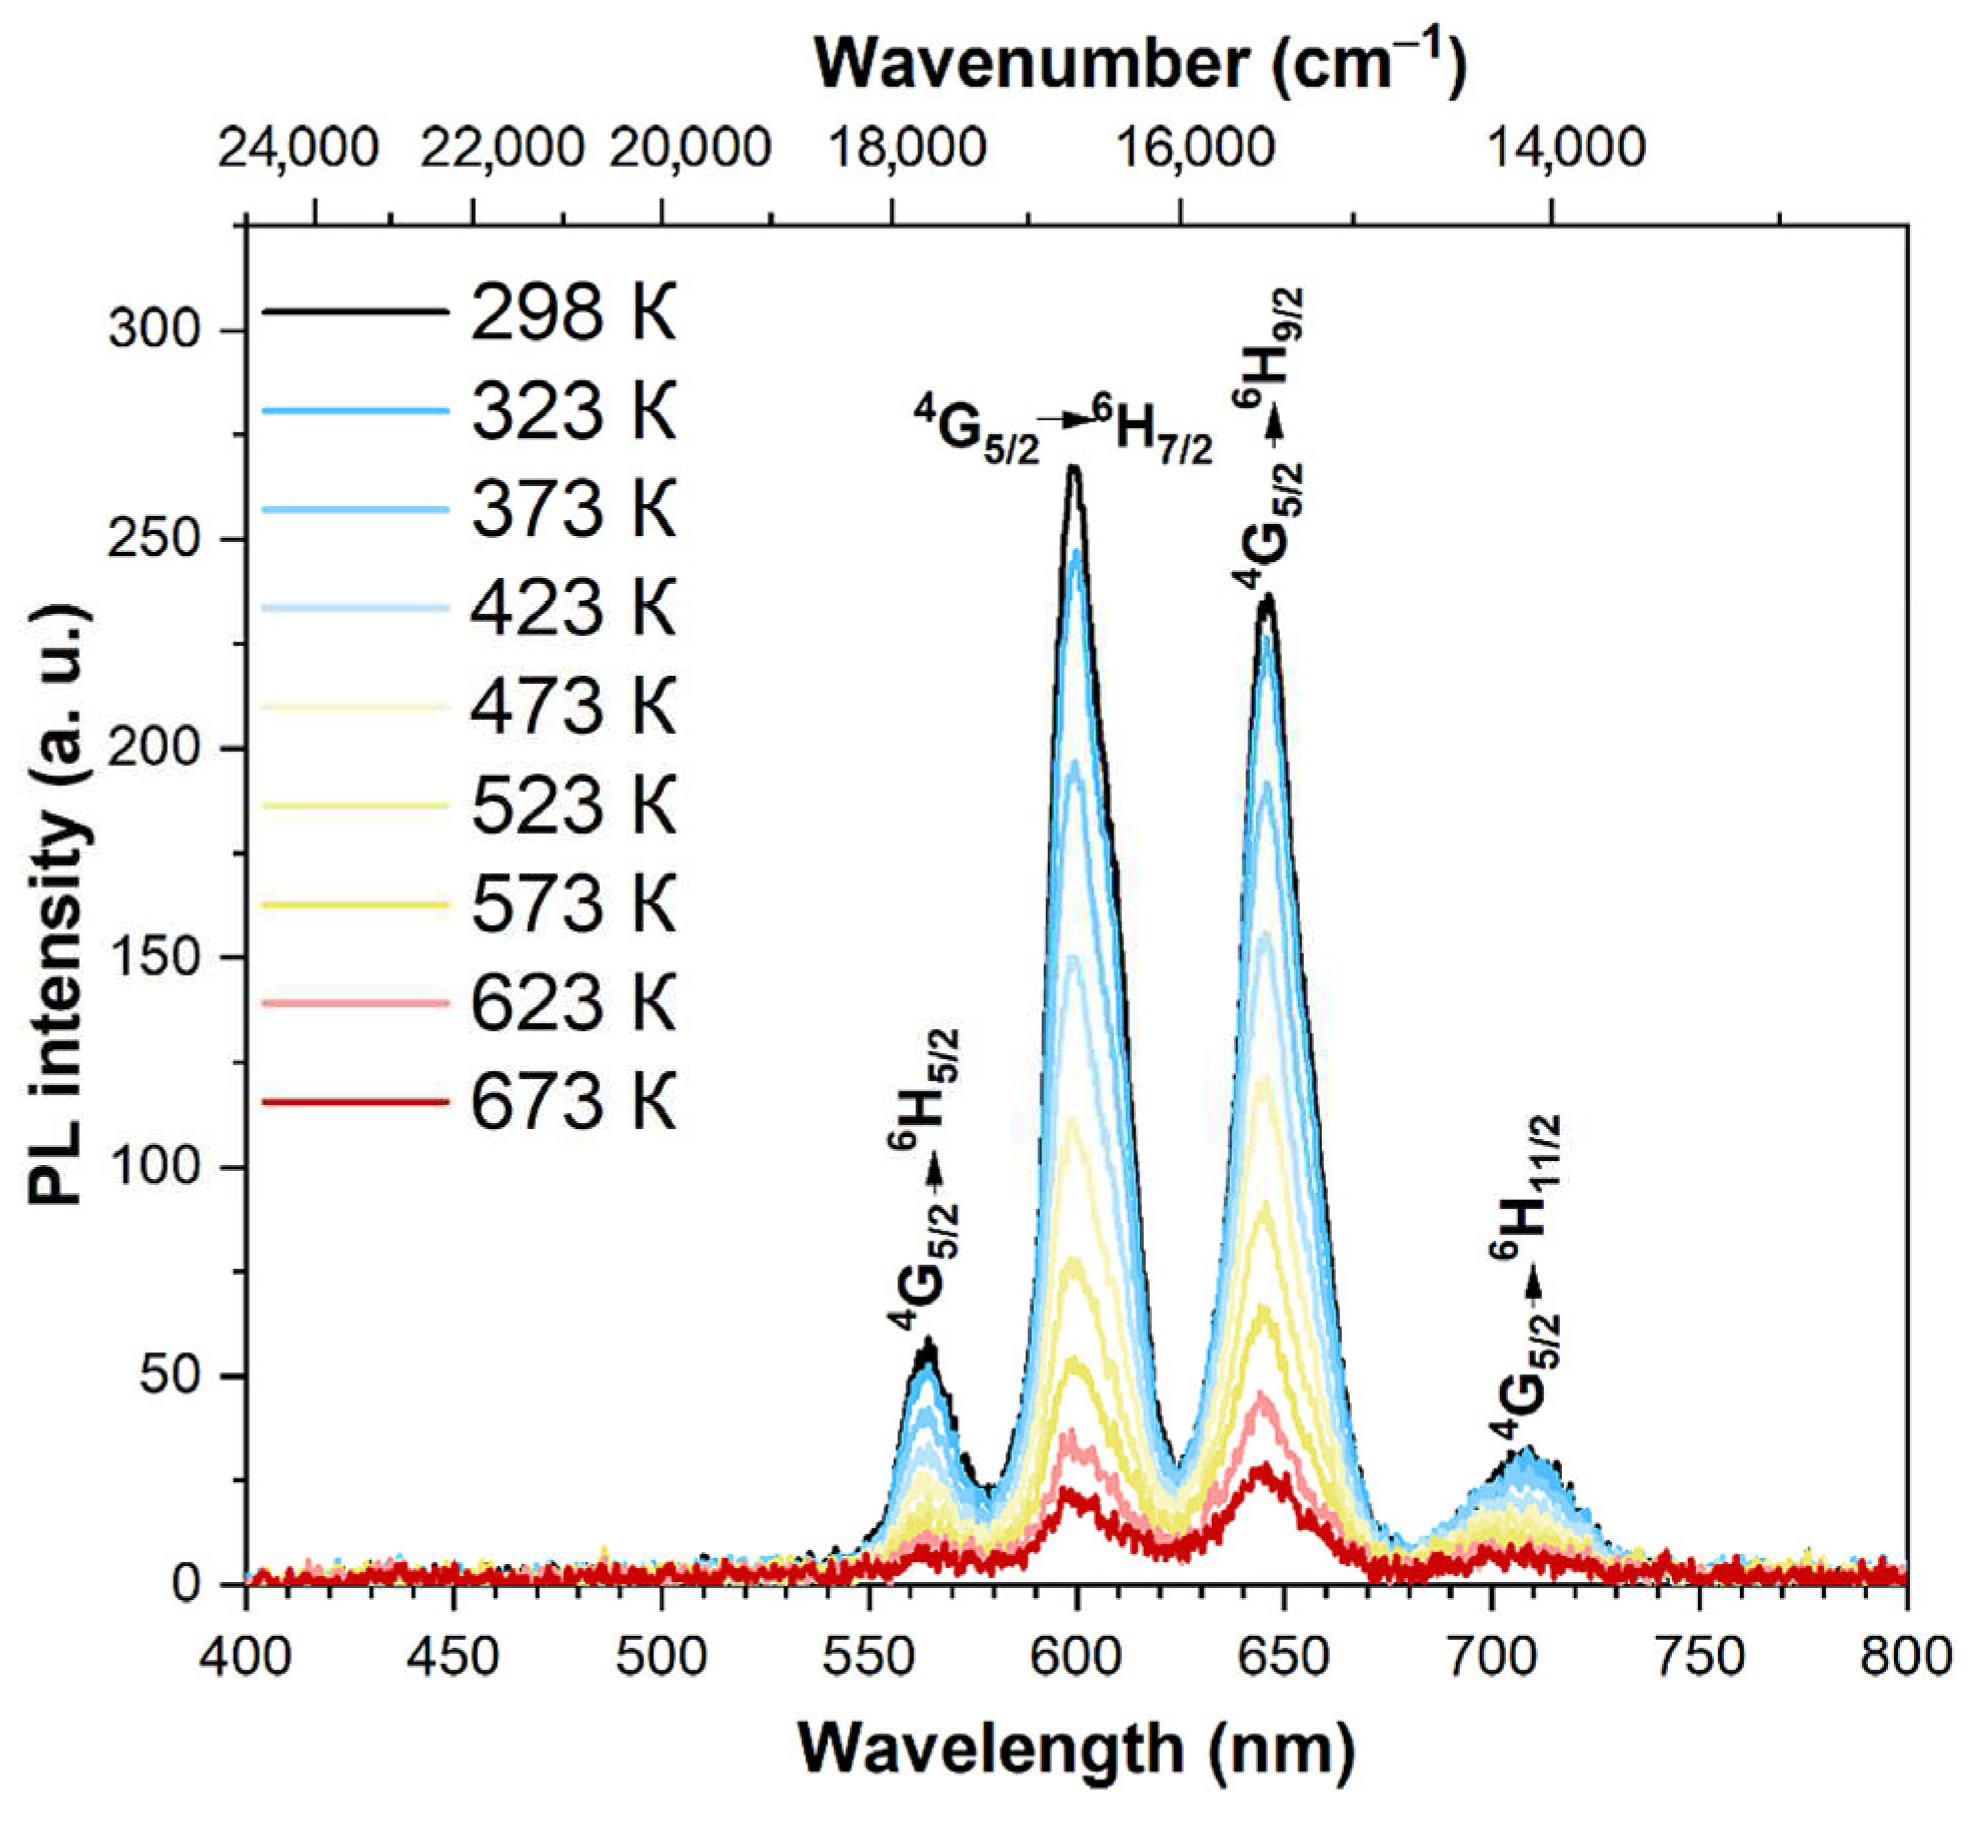
At temperature rise, the (12.75)Pb(1.5)Sm(0.75)Gd-42.5 sample demonstrated an appearance of 525–542 nm band starting with 423 K and its further growth up to 673 K, which could be associated with an increase in the population of the overlying 4F3/2 state due to transitions from the 4G5/2 level in samarium ions under the influence of temperature [47]. Simultaneously, the most intensive 597 and 645 nm bands gradually reduced at temperature rise from 423 to 673 K in 1.4 times maximum (Figure 8).
It is of common use that FIR is calculated using the ratio of normalized intensities of the band (Figure 9a). So, calculate FIR in the 423 to 673 K temperature range we used PL intensity of the 4F3/26H5/2 transition ( λ P L m a x = 530 nm) as a constant value of numerator while for a denominator the PL intensities of the 4G5/26H5/2 ( λ P L m a x = 562 nm); 4G5/26H7/2 ( λ P L m a x = 597 nm); 4G5/26H9/2 ( λ P L m a x = 645 nm) transitions were used (Figure 9b). At temperature increase starting from 423 K the PL peak at 535 nm attributed with 4F3/26H5/2 transition has been growing up. Using this thermosensitive transition for the numerator and thermostable transition 4G5/26H7/2 as the denominator we calculated FIR according to the equation (7).
F I R = I F 3 / 2 4   H 5 / 2 6 I G 5 / 2 4   H 7 / 2 6 ,
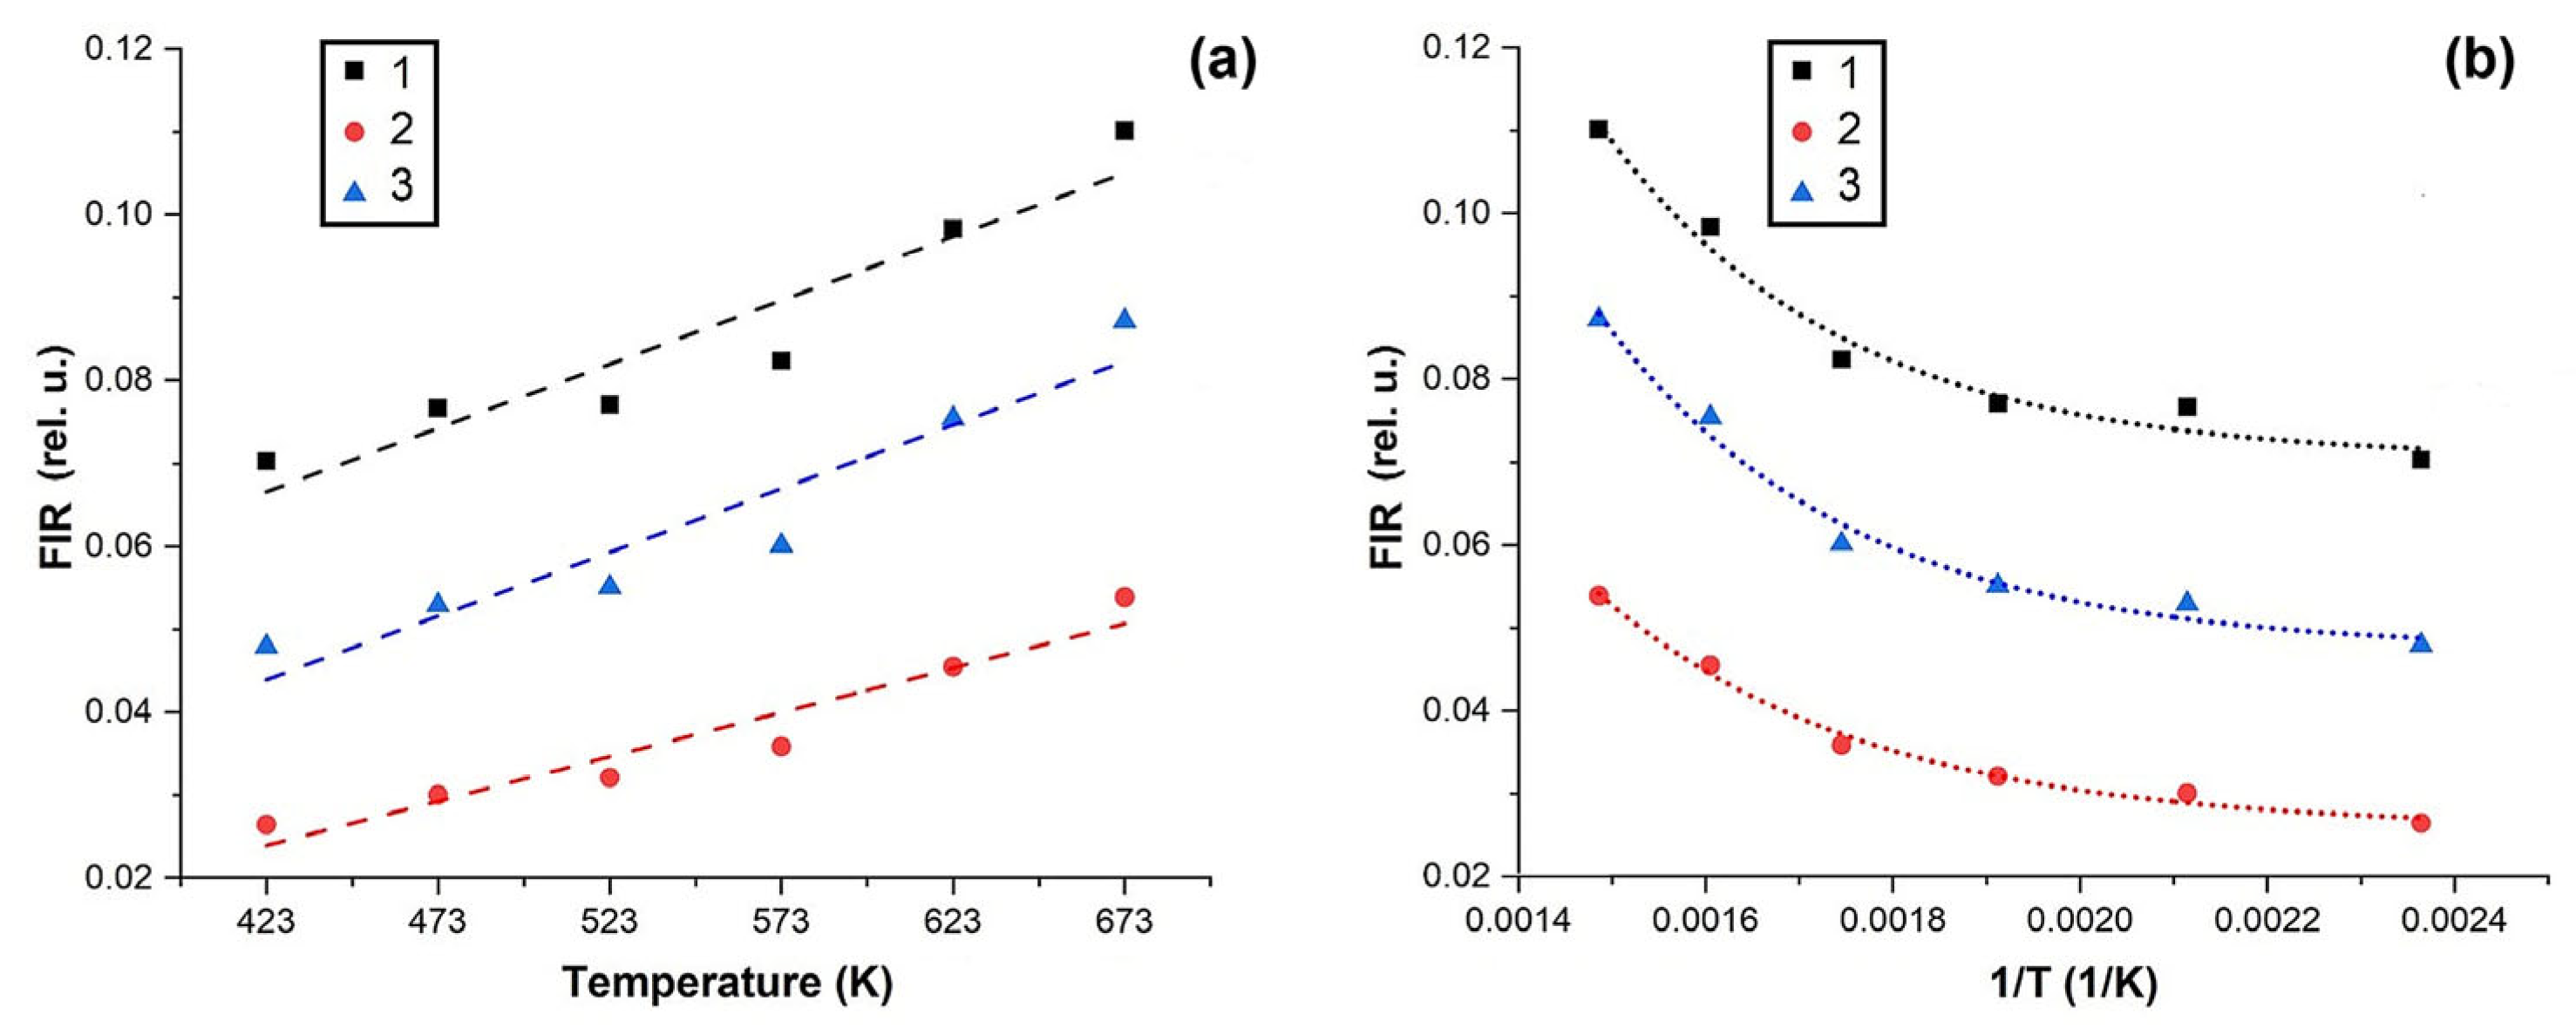
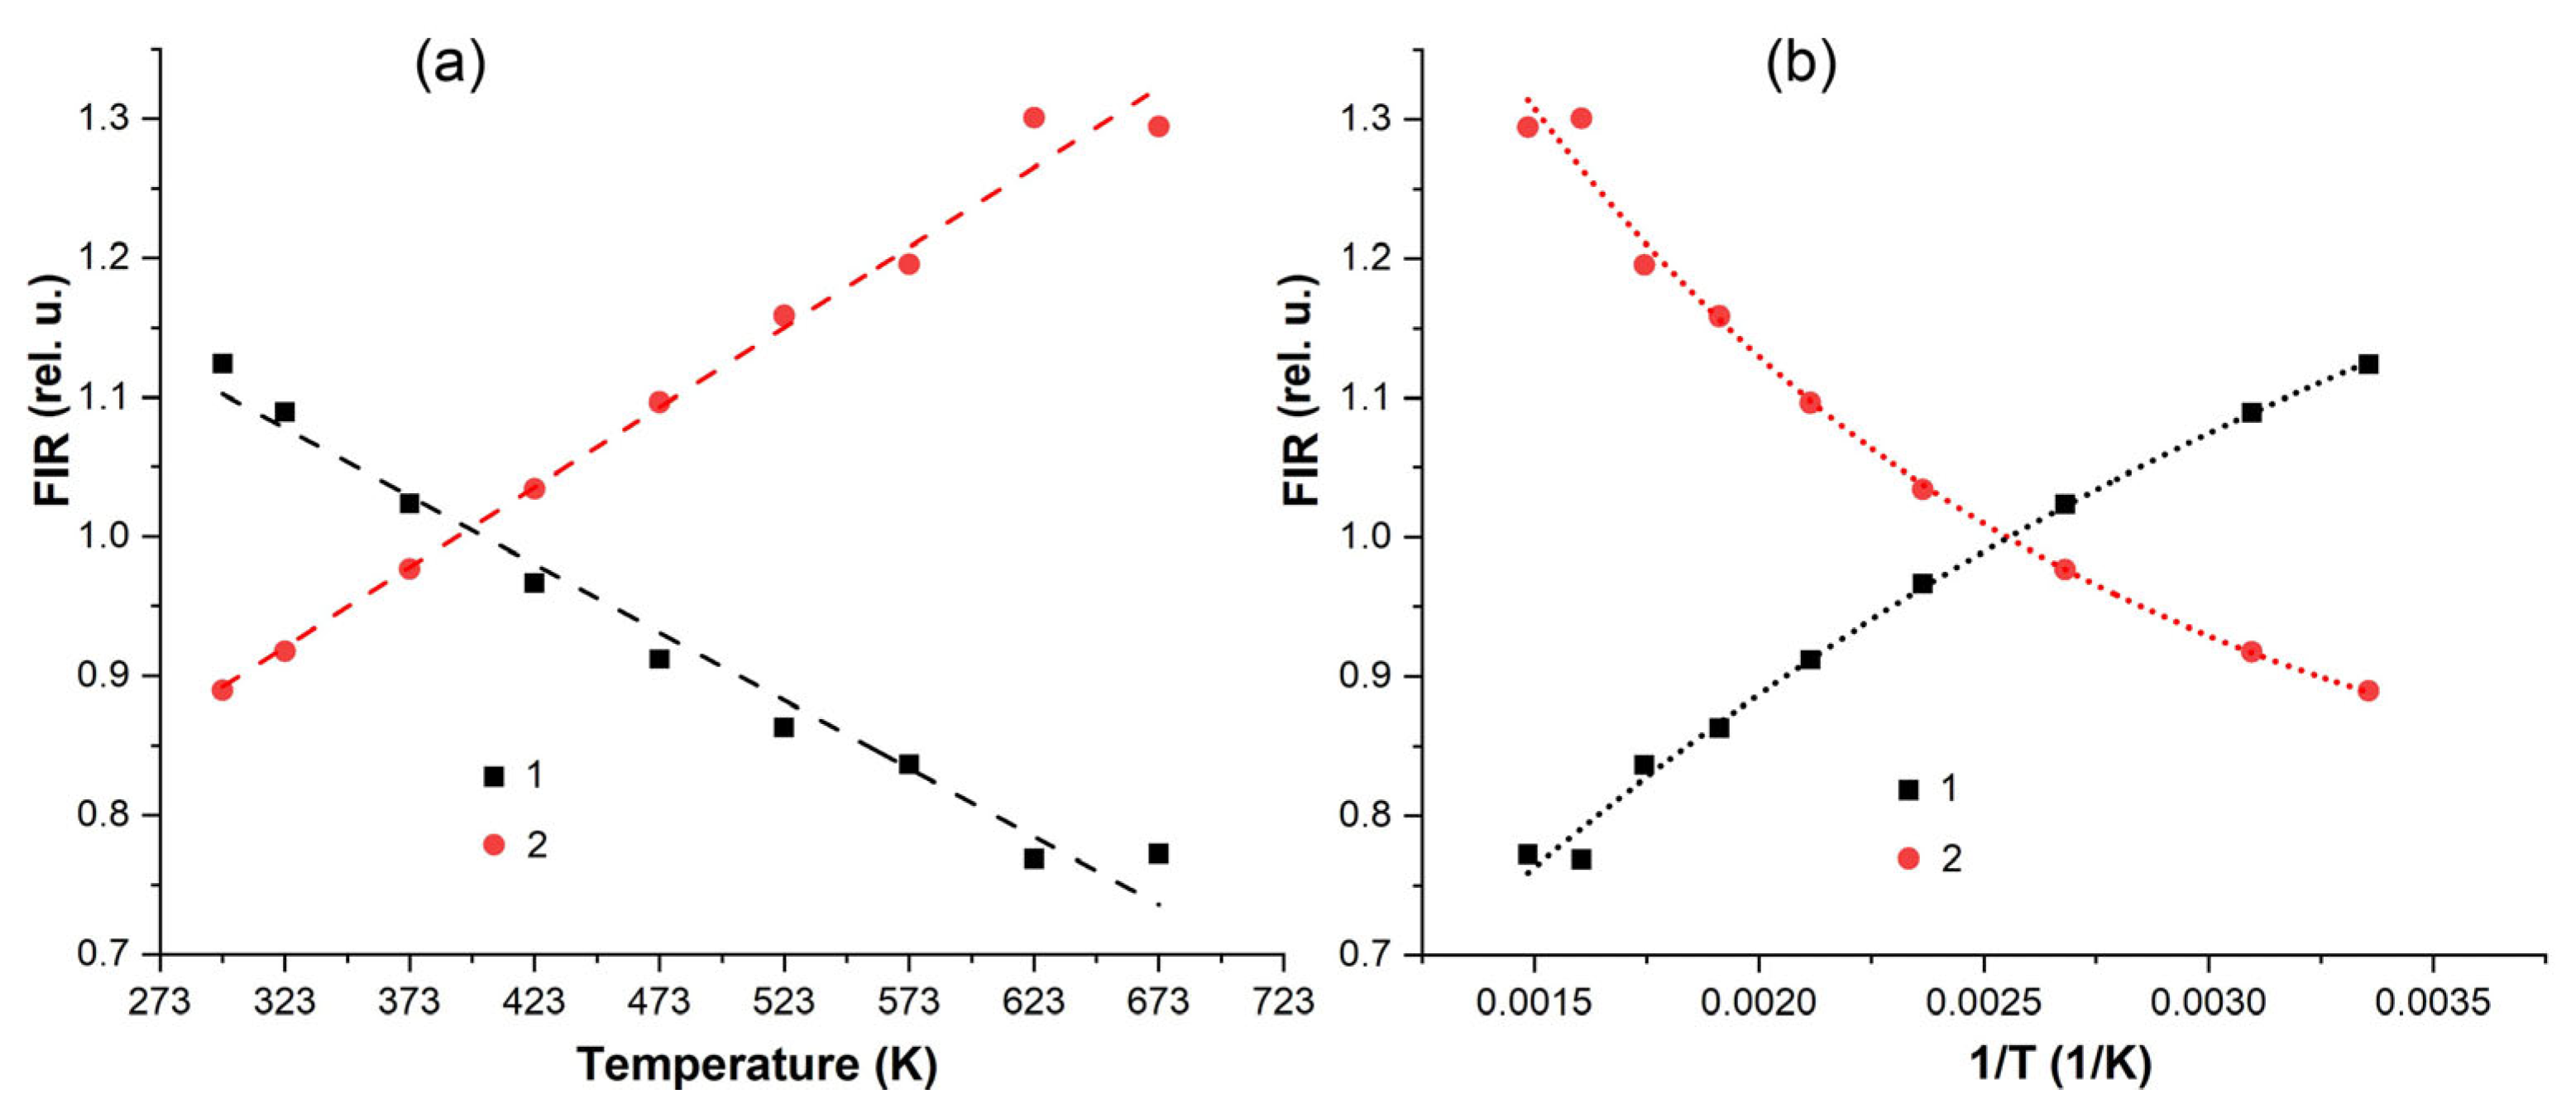
The temperature dependence of FIR was approximated by a linear function (FIR = a + b × T ) (Figure 10a) and an exponential Boltzmann function (FIR= a × e x p E / k T + b ) (Figure 10b). Regardless of the function the best descriptions of the obtained experimental data of FIR was calculated for the transitions I(4F3/26H5/2)/I(4G5/26H7/2) FIR=I535/I645 . We obtained Adj. R2=0.90644 for linear function and Adj. R2=0.97815 for the Boltzmann function.
The relative thermal sensitivity (Sr) for the parameter under consideration was obtained Sr ~0.20 %×K ̶ 1 for the temperature range 423–673 K.
We tried to increase FIR sensitivity by manipulation of different peak intensities. Indeed, when calculating FIR as a ratio
F I R = Q = I 1 I 2 ,
to increase the sensitivity Sr we need to reduce the denominator at temperature growth.
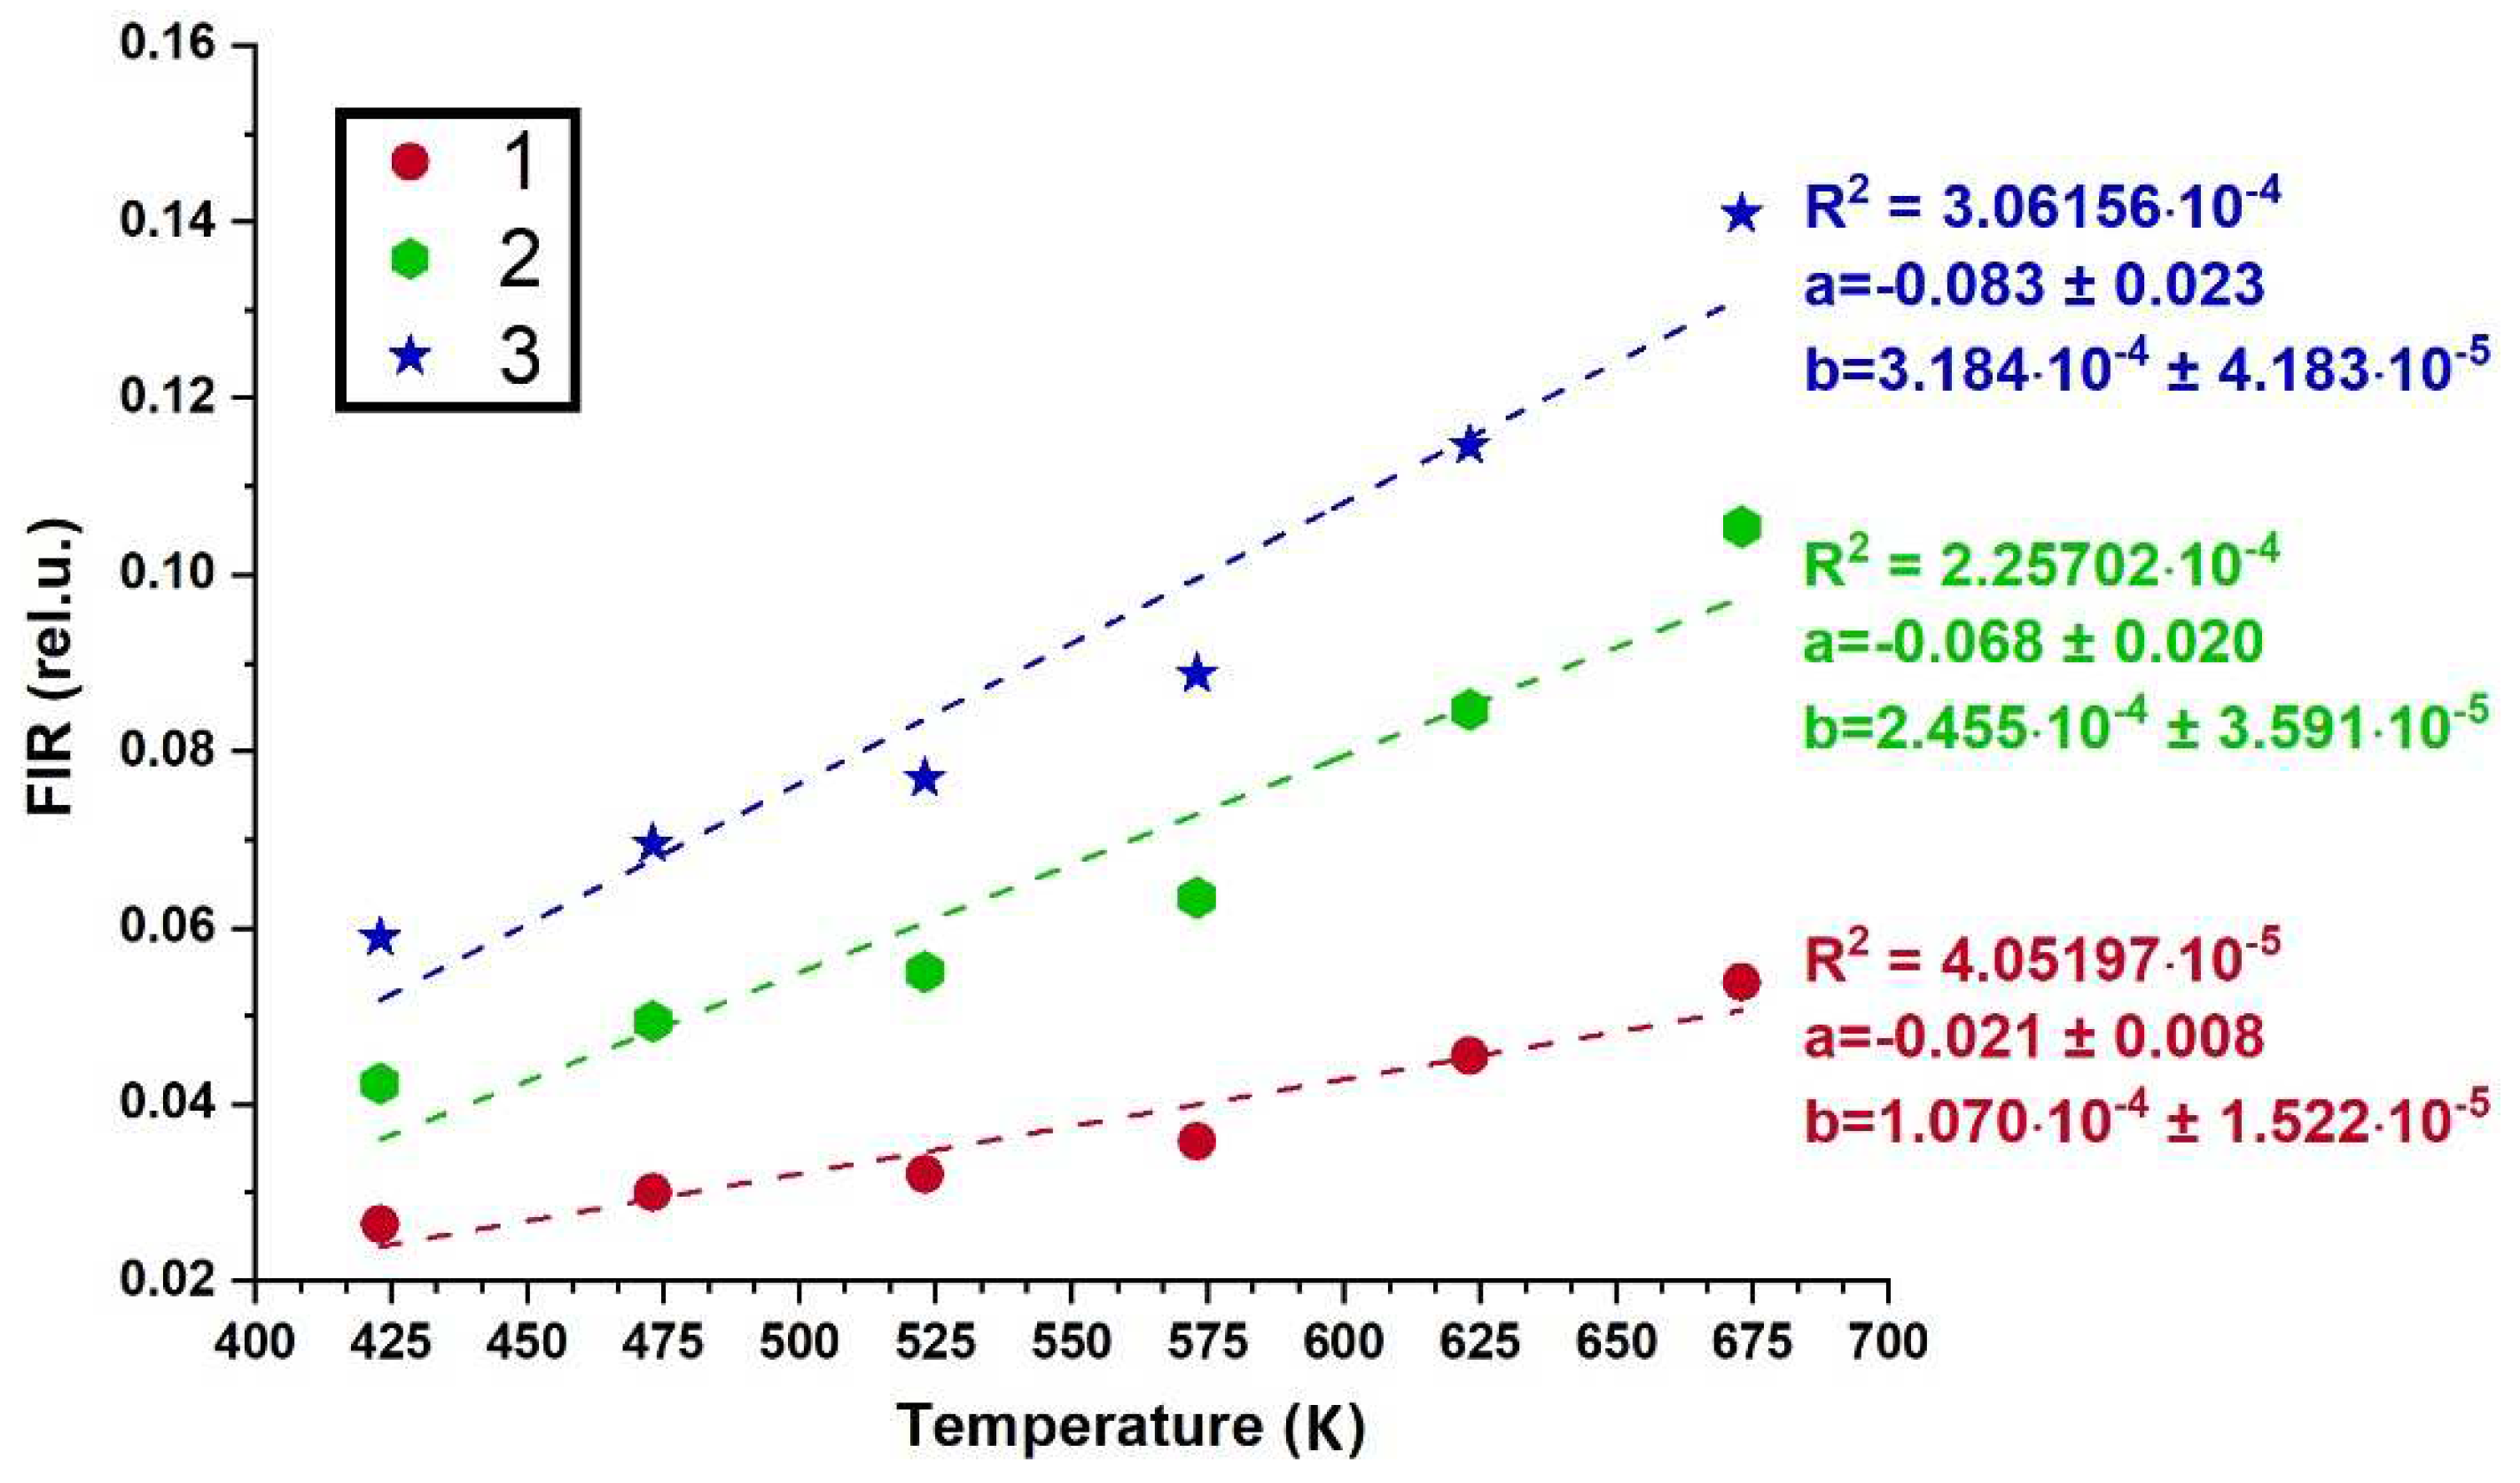
In the case of (12.75)Pb(1.5)Sm(0.75)Gd-42.5 sample the generalized picture of relative PL intensities redistribution with temperature are presented in Figure 11b. The PL intensity of 4F3/26H5/2 transition is growing up in 2 times. And this resulted to increase of the nominator in Eq. 7. But the denominator associated with PL intensity of 4G5/26H7/2 transition stayed unchangeable. We need to reduce the denominator. To do this we can use the difference of the constant PL intensity of 4G5/26H7/2 transition and growing up PL intensity of 4G5/26H9/2 or 4G5/26H5/2. Both of the latters are temperature sensitive transitions. In this case new efficient FIReff could be calculated from the expression
F I R e f f ( 1 ) = I F 3 / 2 4   H 5 / 2 6 I G 5 / 2 4   H 7 / 2 6 I G 5 / 2 4   H 5 / 2 6   ,
F I R e f f ( 2 ) = I F 3 / 2 4   H 5 / 2 6 I G 5 / 2 4   H 7 / 2 6 I G 5 / 2 4   H 9 / 2 6   ,
Figure 11 demonstrated the privilege of such approach when using the same raw data one can increase Sr in several times by manipulations of the PL intensities from different T-sensitive and non-sensitive transitions.
Figure 11. The temperature dependence of FIR for (12.75)Pb(1.5)Sm(0.75)Gd-42.5 sample calculated using the Eq.(7) red dots (1); Eq.(9) green dots (2), Eq.(10) blue dots (3).
Preprints 94972 g011
For the (12.75)Pb(1.5)Sm(0.75)Gd-42.5 sample the corresponding sensitivities for different FIRs occurred to be Sr(1) = 0.20 %×K–1; Sr(2) = 0.68 %×K–1; Sr(3) = 0.61 %×K–1. The better achieved sensitivity was more than in 3 times higher than that determined by the classical expression (7).
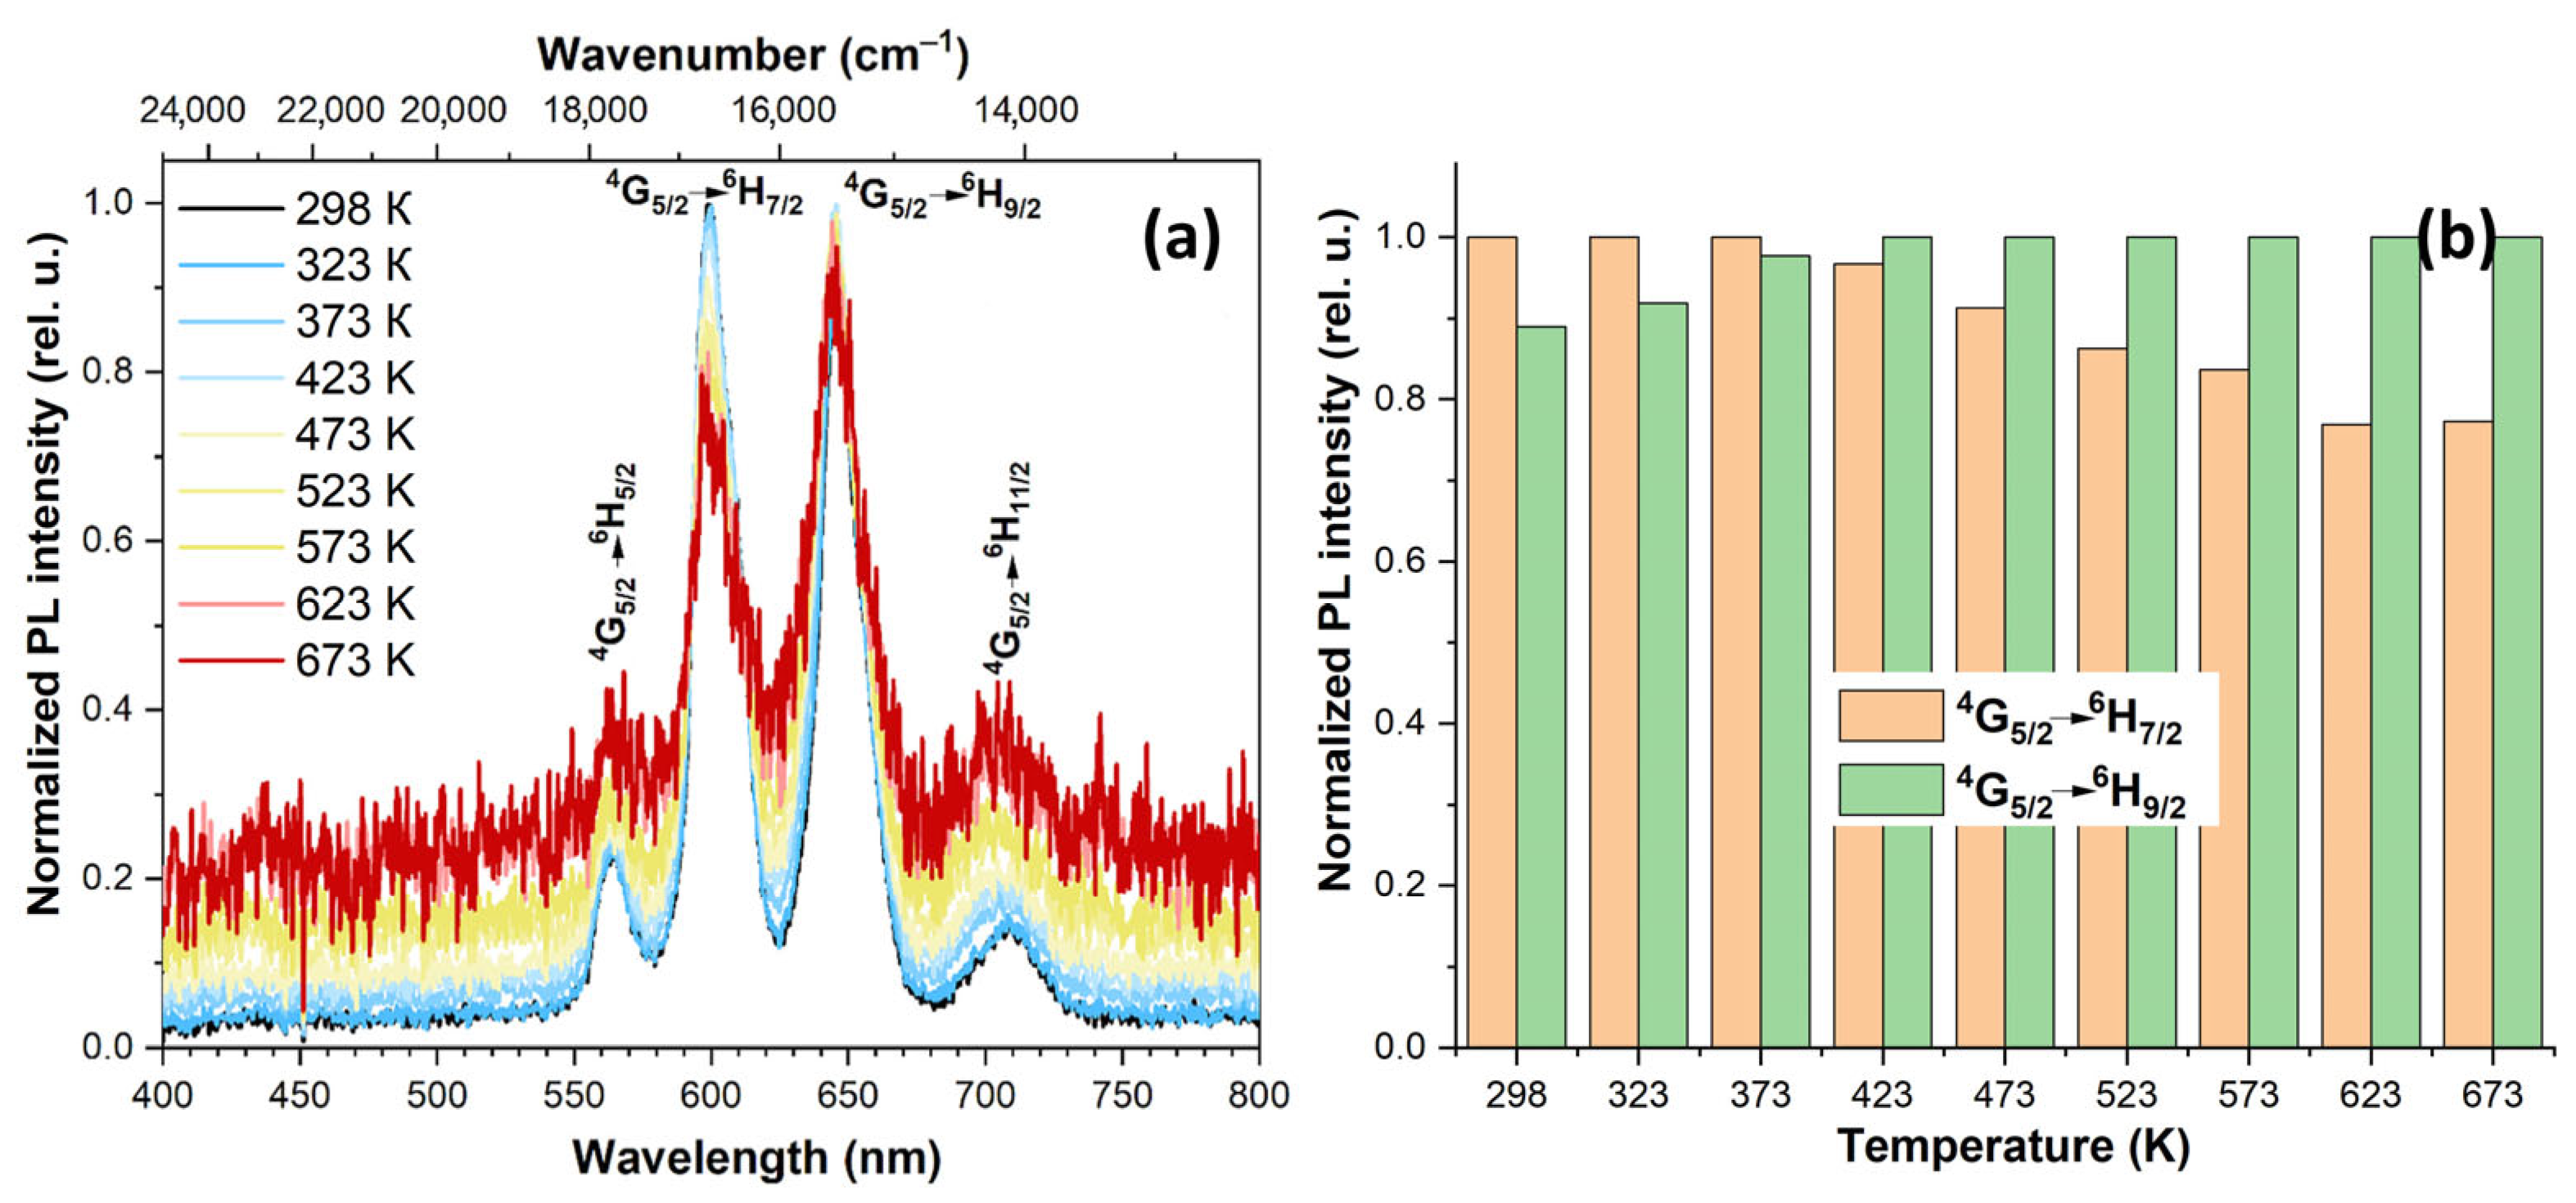
In the series of Bi-based samples, the most interesting was the (17)Bi(2)Sm(1)Gd-40 glass. We detected a redistribution of the intensities of the peaks corresponding to the 4G5/26H7/2 and 4G5/26H9/2 transitions (Figure 12, 13a). This redistribution is a temperature-sensitive parameter, which could be used for temperature determination. Such redistribution is usually observed for dyes [48], but we found out it for the glass sample for the first time.
So, calculating FIR in 298–673 K temperature range we tried to choose the most sensitive parameter based on PL intensities of the bands which had been redistributed: 4G5/26H9/2 ( λ P L m a x = 645 nm) or 4G5/26H7/2 ( λ P L m a x = 597 nm) (Figure 13b).
We varied the PL intensities ratio by changing nominator and denominator vice versa. The better approximation was derived for linear function when the I(4G5/26H7/2)/I(4G5/26H9/2) ratio was used (Figure 14a). Contrary, for the Boltzmann function the better result was achieved for the I(4G5/26H9/2)/I(4G5/26H7/2) ratio (Figure 14b). But taking into consideration the accuracy of the experimental data both these functions could be used in the case of (17)Bi(2)Sm(1)Gd-40 glass for luminescent thermometry. The relative thermal sensitivity for the considered parameter was ~0.105 %×K ̶ 1 for 298-673 K temperature range.

4. Discussion

Decay kinetics studies let us better understand the nature of PL mechanism in the analyzed samples. The obtained values of life-time in our research are in order smaller than those described in Ref. [46,49,50,51,52]. And in the majority of publications the authors presented one-exponential decay kinetics when measured the millisecond range [48,49,50]. The transition to microsecond range resulted to detecting two-exponential kinetics [46,52]. In our experiments we investigated the nanosecond decay range, in which we found out two-exponential kinetics with the contribution of the fast component was ~40%.
Decay kinetics studies demonstrate that the addition of Gd³⁺ ions provides an additional energy transfer mechanism, resulting in a decay time increase. Initially, the absorbed energy is transferred from the matrix to Gd³⁺ ions, and then further to the Sm³⁺ ions, which results to two different luminescent centers and affects the total decay time. This mechanism was also discussed in Ref. [46] and the authors came to the same conclusions.
In Pb-based glasses there is no specific dependence on the decay time, which correlates with the absence of absorption bands in 500-600 nm region (Figure 3). While in Bi-based glasses, an increase in the matrix content reduces the short life-time value, since the BACs additionally interacts with Sm3+ ions and in 500-600 nm region, the Bi-contained matrix has a characteristic absorption band (Figure 4).
In previous studies [43] devoted to the use of similar glasses as materials for non-contact thermometers, a relatively narrow operating temperature range (288-333 K) was considered with Sr = 1.68%×K ̶ 1 (288 K) and Sr = 1.25 %×K ̶ 1 (333 K). We have expanded the working range to 298-673 K and found out that Pb-based glasses could give Sr = 0.68%×K ̶ 1 (423-673 K) while Bi-based glasses had rather low Sr = 0.105%×K ̶ 1. So, we could not replace the toxic Pb-based glasses on non-toxic Bi-based glasses in LT applications for the large temperature range.
In the case of Bi-based glass one of the problem for LT is the interference of BACs with PL band if RE3+ ions. To solve the problem one can suppress BACs by introducing of alkali ions in a large amount [37]. But the LT properties of such glasses need the further investigation.
The achieved values of Sr in a wide temperature range open up real prospects for the use of the Pb-based glasses for thermal detection in medicine, energy and industry. In addition, in contrast to the previous study [43], we recorded not only changes in the PL peak intensity, but also in the redistribution of intensities between peaks, as well as the appearance of new peaks for the temperature measurement. Using the multiply function for FIR, which taking into account both thermal sensitive and non-sensitive transitions we have succeeded to increase the sensitivity of LT materials in 3.4 times.
It is worth emphasizing that the borogermanate matrix, thanks to GeO₂, is characterized by low phonon energy, while the presence of B₂O₃ enhances the glass’s resistance to thermal influences, which is critical for thermoluminescence detector operating in a wide temperature range.

5. Conclusions

Sm3+/Gd3+ co-doped glasses in the B2O3–GeO2–PbO and B2O3–GeO2–Bi2O3 systems were fabricated by conventional glass technology. The structural, optical and luminescence properties of the glasses have been studied. It was demonstrated that the obtained glasses revealed the photoluminescence in the wide temperature range of 298-673 K. The best temperature-sensitive luminescence was found out for (12.75)Pb(1.5)Sm(0.75)Gd-42.5 and (17)Bi(2)Sm(1)Gd-40 glass samples. An increase in temperature led to an increase in the population of the 4F3/2 Sm3+ state due to transitions from the lower 4S3/2 level for glasses under study.
The thermal sensitivity for the (12.75)Pb(1.5)Sm(0.75)Gd-42.5 glass sample was estimated to be about 0.250 %×K ̶ 1 and for the (17)Bi(2)Sm(1)Gd-40 glass sample ~0.105 %×K ̶ 1 based on the ratio of the luminescence intensities of transitions from different Stark sublevels.
For the first time we found out the effect of Bi-based samples, the most interesting was. We detected a redistribution of the intensities of the peaks corresponding to the 4G5/26H7/2 and 4G5/26H9/2 transitions in the inorganic phosphor (17)Bi(2)Sm(1)Gd-40 glass which is usually observed for dyes.
We used two temperature sensitive and one non-sensitive transitions to calculate FIR. This made it possible to increase the sensitivity of LT in several times. Such method could be very useful for the LT materials based on Ln ions with multiplied transitions.
The results showed that the produced glasses are perspective for photonics applications, in particular in luminescence thermometry.

Supplementary Materials

The following supporting information can be downloaded at: www.mdpi.com/xxx/s1, Figure S1. PXRD patterns of Pb-based (a) and Bi-based (b) glass samples; Figure S2. Raman spectra of Pb-based glass samples; Figure S3. Raman spectra of Bi-based glass samples; Figure S4. FT-IR spectra of Pb-based glass samples; Figure S5. FT-IR spectra of Bi-based glass samples; Figure S6. DSC curve for glass composition (15)Pb(3)Sm(2)Gd-40 and glass transition temperature; Figure S7. DSC curve for glass composition (16)Pb(2.5)Sm(1.5)Gd-40 and glass transition temperature; Figure S8. DSC curve for glass composition (17)Pb(2)Sm(1)Gd-40 and glass transition temperature; Figure S9. DSC curve for glass composition (11.25)Pb(2.25)Sm(1.5)Gd-42.5 and glass transition temperature; Figure S10 DSC curve for glass composition (12)Pb(1.875)Sm(1.125)Gd-42.5 and glass transition temperature; Figure S11. DSC curve for glass composition (12.75)Pb(1.5)Sm(0.75)Gd-42.5 and glass transition temperature; Figure S12. DSC curve for glass composition (15)Bi(3)Sm(2)Gd-40 and glass transition temperature; Figure S13. DSC curve for glass composition (16)Bi(2.5)Sm(1.5)Gd-40 and glass transition temperature; Figure S14. DSC curve for glass composition (17)Bi(2)Sm(1)Gd-40 and glass transition temperature; Figure S15. DSC curve for glass composition (11.25)Bi(2.25)Sm(1.5)Gd-42.5 and glass transition temperature; Figure S16. DSC curve for glass composition (12)Bi(1.875)Sm(1.125)Gd-42.5 and glass transition temperature; Figure S17. DSC curve for glass composition (12.75)Bi(1.5)Sm(0.75)Gd-42.5 and glass transition temperature; Figure S18. Excitation (λem = 595 nm) spectra of (15-17)Pb/Bi(3-2)Sm(2-1)Gd-40 and (11.25-12.75)Pb/Bi(2.25-1.5)Sm(1.5-0.75)Gd-42.5 glasses; Figure S19. Time resolved PL decay curve of (15)Pb(3)Sm(2)Gd-40 glass (λPL = 597 nm); Figure S20 Time resolved PL decay curve of (16)Pb(2.5)Sm(1.5)Gd-40 (λPL = 597 nm); Figure S21. Time resolved PL decay curve of (17)Pb(2)Sm(1)Gd-40 glass (λPL = 597 nm); Figure S22. Time resolved PL decay curve of (11.25)Pb(2.25)Sm(1.5)Gd-42.5 glass (λPL = 597 nm); Figure S23. Time resolved PL decay curve of (12)Pb(1.875)Sm(1.125)Gd-42.5 glass (λPL = 597 nm); Figure S24. Time resolved PL decay curve of (12.75)Pb(1.5)Sm(0.75)Gd-42.5 glass (λPL = 597 nm); Figure S25. Time resolved PL decay curve of (15)Bi(3)Sm(2)Gd-40 (λPL = 597 nm); Figure S26. Time resolved PL decay curve of (16)Bi(2.5)Sm(1.5)Gd-40 glass (λPL = 597 nm); Figure S27. Time resolved PL decay curve of (17)Bi(2)Sm(1)Gd-40 glass (λPL = 597 nm); Figure S28. Time resolved PL decay curve of (11.25)Bi(2.25)Sm(1.5)Gd-42.5 glass (λPL = 597 nm); Figure S29. Time resolved PL decay curve of (12)Bi(1.875)Sm(1.125)Gd-42.5 glass (λPL = 597 nm); Figure S30. Time resolved PL decay curve of (12.75)Bi(1.5)Sm(0.75)Gd-42.5 glass (λPL = 597 nm); Figure S31. EDS spectra of (15)Pb(3)Sm(2)Gd-40 glass composition; Figure S32. EDS spectra of (16)Pb(2.5)Sm(1.5)Gd-40 glass composition; Figure S33. EDS spectra of (17)Pb(2)Sm(1)Gd-40 glass composition; Figure S34. EDS spectra of (11.25)Pb(2.25)Sm(1.5)Gd-42.5 glass composition; Figure S35. EDS spectra of (12)Pb(1.875)Sm(1.125)Gd-42.5 glass composition; Figure S36. EDS spectra of (12.75)Pb(1.5)Sm(0.75)Gd-42.5 glass composition; Figure S37. EDS spectra of (15)Bi(3)Sm(2)Gd-40 glass composition; Figure S38. EDS spectra of (16)Bi(2.5)Sm(1.5)Gd-40 glass composition; Figure S39. EDS spectra of (17)Bi(2)Sm(1)Gd-40 glass composition; Figure S40. EDS spectra of (11.25)Bi(2.25)Sm(1.5)Gd-42.5 glass composition; Figure S41. EDS spectra of (12)Bi(1.875)Sm(1.125)Gd-42.5 glass composition; Figure S42. EDS spectra of (12.75)Pb(1.5)Sm(0.75)Gd-42.5 glass composition; Table S1. The composition of glasses according to the EDS data collected from 10 points distributed randomly on the surface of the every samples.

Author Contributions

Conceptualization, O.P., S.Z. and K.S.; methodology, S.Z. and K.S.; software, K.B.; validation, S.Z. and K.S.; formal analysis, I.A.; investigation, S.Z., K.S., K.R., K.B.; resources, K.R.; data curation, K.R.; writing—original draft preparation, S.Z. and K.S.; writing—review and editing, S.Z.; visualization, S.Z. and K.S.; supervision, K.R.; project administration, I.A.; funding acquisition, K.R. All authors have read and agreed to the published version of the manuscript.

Funding

This research was funded by the Ministry of Science and Higher Education of Russia through the project FSSM-2020-0005.

Institutional Review Board Statement

Not applicable.

Informed Consent Statement

Not applicable.

Data Availability Statement

Not applicable.

Acknowledgments

The authors are grateful to the Mendeleev Center for the Collective Use of Scientific Equipment for the optical measurements.

Conflicts of Interest

The authors declare no conflict of interest.

References

  1. Childs, P. R. N.; Greenwood, J. R.; Long, C. A. Review of temperature measurement. Rev. Sci. Instrum. 2000, 71, 2959–2978. [Google Scholar] [CrossRef]
  2. Michalski, L.; Eckersdorf, K.; Kucharski, J.; McGhee, J. Temperature measurement.; Publisher: Wiley, Chichester, UK, 2001. [Google Scholar]
  3. Beheim, G. Optical Temperature Sensors. Integrated Optics, Microstructures, and Sensors. 1995, 332, 285–313. [Google Scholar] [CrossRef]
  4. Wang, X.; Wolfbeis, O.S.; Meier, R. J. Luminescent probes and sensors for temperature. Chem. Soc. Rev. 2013, 42, 7834–7869. [Google Scholar] [CrossRef]
  5. Brites, C.D.; Lima, P.P.; Silva, N.J.; Millán, A.; Amaral, V.S.; Palacio, F.; Carlos, L.D. A luminescent molecular thermometer for long-term absolute temperature measurements at the nanoscale. Adv. Mater. 2010, 22, 4499–4504. [Google Scholar] [CrossRef] [PubMed]
  6. Dramićanin, M.D. Trends in luminescence thermometry. J. Appl. Phys. 2020, 128, 4. [Google Scholar] [CrossRef]
  7. Sutton, G.; Korniliou, S.; Andreu, A.; Wilson, D. Imaging luminescence thermometry to 750 °C for the heat treatment of common engineering alloys and com-parison with thermal imaging. Int. J. Thermophys. 2022, 43, 36. [Google Scholar] [CrossRef]
  8. van Swieten, T.P.; Yu, D.; Yu, T.; Vonk, S.J.; Suta, M.; Zhang, Q.A.; Meijerink, A.; Rabouw, F.T. Ho3+-based luminescent thermometer for sensitive sensing over a wide temperature range. Adv. Opt. Mater. 2021, 9, 2001518. [Google Scholar] [CrossRef]
  9. Bednarkiewicz, A.; Marciniak, L.; Carlos, L.D.; Jaque, D. Standardizing luminescence nanothermometry for biomedical applications. Nanoscale. 2020, 12, 14405–14421. [Google Scholar] [CrossRef] [PubMed]
  10. Lan, C. W.; Yu, W. C.; Hsu, W. C. Growth of Bulk Single Crystals. In Encyclopedia of Surface and Colloid Science, Third Edition; CRC Press, 2016; pp 2979–2990. [CrossRef]
  11. Avetissov, I.; Kostikov, V.; Meshkov, V.; Sukhanova, E.; Grishechkin, M.; Belov, S.; Sadovskiy, A. Modeling of Axial Vibrational Control Technique for CdTe VGF Crystal Growth under Controlled Cadmium Partial Pressure. J. Cryst. Growth 2014, 385, 88–94. [Google Scholar] [CrossRef]
  12. Jaque, D.; Vetrone, F. Luminescence nanothermometry. Nanoscale. 2012, 4, 4301–4326. [Google Scholar] [CrossRef]
  13. Abram, C.; Fond, B.; Beyrau, F. Temperature measurement techniques for gas and liquid flows using thermographic phosphor tracer particles. Prog. Energy Combust. Sci. 2018, 64, 93–156. [Google Scholar] [CrossRef]
  14. Suta, M.; Antić, Ž.; Ðorđević, V.; Kuzman, S.; Dramićanin, M.D.; Meijerink, A. Making Nd3+ a sensitive luminescent thermometer for physiological temperatures—An account of pitfalls in Boltzmann thermometry. Nanomaterials. 2020, 10, 543. [Google Scholar] [CrossRef] [PubMed]
  15. Suo, H.; Zhao, X.; Zhang, Z.; Wang, Y.; Sun, J.; Jin, M.; Guo, C. Rational design of ratiometric luminescence thermometry based on thermally coupled levels for bioapplications. Laser Photonics Rev. 2021, 15, 2000319. [Google Scholar] [CrossRef]
  16. Brities, C.D.S.; Millan, A. Handbook on the Physics and Chemistry of Rare Earths.; Publisher: Elsevier, North-Holland, 2016, pp. 339–427.
  17. Jaque, D.; Ramirez, M. O.; Bausá, L. E.; Solé, J. G.; Cavalli, E.; Speghini, A.; Bettinelli, M. Nd3+→Yb3+ energy transfer in YAl3(BO3)4 nonlinear laser crystal. Phys. Rev. B. 2003, 68, 35118. [Google Scholar] [CrossRef]
  18. Liu, X.; Akerboom, S.; de Jong, M.; Mutikainen, I.; Tanase, S.; Meijerink, A.; Bouwman, E. Mixed-Lanthanoid Metal–Organic Framework for Ratiometric Cryogenic Temperature Sensing. Inorg. Chem. 2015, 54, 11323–11329. [Google Scholar] [CrossRef]
  19. Brites, C. D. S.; Fiaczyk, K.; Ramalho, J. F. C. B.; Sójka, M.; Carlos, L. D.; Zych, E. Widening the Temperature Range of Luminescent Thermometers through the Intra- and Interconfigurational Transitions of Pr3+. Adv. Opt. Mater. 2018, 6, 1701318. [Google Scholar] [CrossRef]
  20. Runowski, M.; Woźny, P.; Stopikowska, N.; Martin, I. R.; Lavin, V.; Lis, S. Luminescent Nanothermometer Operating at Very High Temperature—Sensing up to 1000 K with Upconverting Nanoparticles (Yb3+/Tm3+). ACS Appl. Mater. Interfaces. 2020, 12, 43933–43941. [Google Scholar] [CrossRef]
  21. Allison, S. W.; Beshears, D. L.; Cates, M. R.; Scudiere, M. B.; Shaw, D. W.; Ellis, A. D. Luminescence of YAG:Dy and YAG:Dy, Er crystals to 1700 °C. Meas. Sci. Technol. 2019, 31, 044001. [Google Scholar] [CrossRef]
  22. Herrera, A.; Buchner, S.; Camerini, R. V.; Jacinto, C.; Balzaretti, N. M. Spectroscopic properties of B2O3–PbO–Bi2O3–GeO2 glass doped with Sm3+ and gold nanoparticles. Opt. Mater. 2016, 52, 230–236. [Google Scholar] [CrossRef]
  23. Gökçe, M.; Koçyiğit, D. Structural and optical properties of Gd+3 doped Bi2O3–GeO2 glasses and glass-ceramics. Mater. Res. Express. 2018, 2, 025203. [Google Scholar] [CrossRef]
  24. Gökçe, M.; Koçyiğit, D. Optical and luminescence characteristics of Sm3+ doped B2O3-GeO2-Gd2O3 glasses. Opt. Mater. 2018, 83, 233–240. [Google Scholar] [CrossRef]
  25. Lakshminarayana, G.; Meza-Rocha, A. N.; Soriano-Romero, O.; Huerta, E. F.; Caldino, U.; Lira, A.; Lee, D.-E.; Yoon, J.; Park, T. Analysis of fluorescence characteristics of Sm3+-doped B2O3-rich glasses for Orange-light-emitting diodes. J. Alloys Compd. 2021, 884, 161076. [Google Scholar] [CrossRef]
  26. Herrera, A.; Fernandes, R. G.; de Camargo, A. S. S.; Hernandes, A. C.; Buchnerd, S.; Jacinto, С.; Balzaretti, N. M. Visible-NIR emission and structural properties of Sm3+ doped heavy-metal oxide glass with composition B2O3-PbO-Bi2O3-GeO2. J. Lumin. 2015, 171, 106–111. [Google Scholar] [CrossRef]
  27. Rammah, Y.S.; Mahmoud, K.A.; Kavaz, E.; Kumar, A.; El-Agawany, F.I. The role of PbO/Bi2O3 insertion on the shielding characteristics of novel borate glasses. Ceram. Int. 2020, 15, 23357–23368. [Google Scholar] [CrossRef]
  28. Denker, B.; Galagan, B.; Osiko, V.; Sverchkov, S.; Dianov, E. Luminescent properties of Bi-doped boro-alumino-phosphate glasses. J. Appl. Phys. 2007, 87, 135–137. [Google Scholar] [CrossRef]
  29. Ren, J.; Eckert, H. Quantification of Short and Medium Range Order in Mixed Network Former Glasses of the System GeO2−NaPO3: A Combined NMR and X-Ray Photoelectron Spectroscopy Study. J. Phys. Chem. C, 2012; 116, 12747–12763. [Google Scholar] [CrossRef]
  30. Di Martino, D.; Santos, L.F.; Marques, A.C.; Almeida, R.M. Vibrational Spectra and Structure of Alkali Germanate Glasses. J. Non-Cryst. Solids, 2001; 293, 394–401. [Google Scholar] [CrossRef]
  31. Chakraborty, I.N.; Condrate, R.A. The Vibrational Spectra of B2O3-GeO2 Glasses. J. Non-Cryst. Solids, 1986; 81, 271–284. [Google Scholar] [CrossRef]
  32. Meera, B. N.; Sood, A. K.; Chandrabhas, N.; Ramakrishna, J. Raman study of lead borate glasses. J. Non-Cryst. Solids, 1990; 126, 224–230. [Google Scholar] [CrossRef]
  33. Yano, T.; Kunimine, N.; Shibata, S.; Yamane, M. Structural Investigation of Sodium Borate Glasses and Melts by Raman Spectroscopy. II. Conversion between BO4 and BO2O Units at High Temperature. J. Non-Cryst. Solids, 2003; 321, 147–156. [Google Scholar] [CrossRef]
  34. Koroleva, O.N.; Shtenberg, M.V.; Zainullina, R.T.; Lebedeva, S.M.; Nevolina, L.A. Vibrational Spectroscopy and Density of K2O−B2O3−GeO2 Glasses with Variable B/Ge Ratio. Phys. Chem. Chem. Phys, 2019; 21, 12676–12684. [Google Scholar] [CrossRef]
  35. Yiannopoulos, Y.D.; Chryssikos, G.D.; Kamitsos, E.I. Structure and properties of alkaline earth borate glasses. Phys. Сhem. glasses, 2001; 42, 164–172. [Google Scholar]
  36. Knoblochova, K.; Ticha, H.; Schwarz, J.; Tichy, L. Raman spectra and optical properties of selected Bi2O3–PbO–B2O3–GeO2 glasses. Opt. Mater. 2009, 31, 895–898. [Google Scholar] [CrossRef]
  37. Henderson, G.S.; Wang, H.M. Germanium coordination and the germanate anomaly. Eur. J. of Mineral. 2002, 14, 733–744. [Google Scholar] [CrossRef]
  38. Kamitsos, E.I.; Yiannopoulos, Y.D.; Karakassides, M.A.; Chryssikos, G.D.; Jain, H. Raman and infrared structural investigation of xRb2O·(1-x)GeO2 glasses. J. Phys. Chem. 1996, 100, 11755–11765. [Google Scholar] [CrossRef]
  39. Fan, H.; Gao, G.; Wang, G.; Hu, L. Infrared, Raman and XPS spectroscopic studies of Bi2O3–B2O3–GeO2 glasses. Solid State Sci. 2010, 12, 541–545. [Google Scholar] [CrossRef]
  40. Błaszczak, K.; Adamczyk, A.; Wędzikowska, M.; Rokita, M. Infrared studies of devitrification Li2O·B2O3·2GeO2 glass. J. Mol. Struct, 2004; 704, 275–279. [Google Scholar] [CrossRef]
  41. Taqiullah, S. M.; Alshahrani, T.; Shariq, M.; Hakami, J.; Ahmad, N.; Alshehri, A. M.; Chaudhary, A.A.; Khan, S.M.; Shinde, S.M.; Slimani, Y.; Ansari, A.R.; Siddiqui, M.A.; Imran, M.; Khan, F. Utilization of infrared, Raman spectroscopy for structural analysis of alkali boro-germanate glasses. J. Taibah Univ. Sci. 2022, 16, 820–827. [Google Scholar] [CrossRef]
  42. Bolundut, L.; Pop, L.; Bosca, M.; Borodi, G.; Olar, L.; Suciu, R.C.; Pascuta, P.; Culea, E.; Stefan, R. Structural and spectroscopic properties of some neodymium-boro-germanate glasses and glass ceramics embedded with silver nanoparticles. Cer. Int. 2017, 43, 12232–12238. [Google Scholar] [CrossRef]
  43. Morassuti, C.Y.; Nunes, L.A.; Lima, S.M.; Andrade, L.H. Eu3+-doped alumino-phosphate glass for ratiometric thermometer based on the excited state absorption. J. Lumin. 2018, 193, 39–43. [Google Scholar] [CrossRef]
  44. Wantana, N.; Kaewjaeng, S.; Kothan, S.; Kim, H.J.; Kaewkhao, J. Energy transfer from Gd3+ to Sm3+ and luminescence characteristics of CaO–Gd2O3–SiO2–B2O3 scintillating glasses. J. Lumin. 2017, 181, 382–386. [Google Scholar] [CrossRef]
  45. Meng, X.G.; Qiu, J.R.; Peng, M.Y.; Chen, D.P.; Zhao, Q.Z.; Jiang, X.W.; Zhu, C.S. Near infrared broadband emission of bismuth-doped aluminophosphate glass. J. Opt. Express. 2005, 13, 1635–1642. [Google Scholar] [CrossRef] [PubMed]
  46. Jaiswal, V. V.; Bishnoi, S.; Swati, G.; Singh, P.; Lohia, N.; Bathula, S.; Haranath, D. Luminescence properties of yttrium gadolinium orthovanadate nanophosphors and efficient energy transfer from VO43− to Sm3+ via Gd3+ ions. Arabian Journal of Chemistry. 2020, 13, 474–480. [Google Scholar] [CrossRef]
  47. Kaczkan, M.; Boruc, Z.; Turczyński, S.; Malinowski, M. Effect of temperature on the luminescence of Sm3+ ions in YAM crystals. J. Alloys Compd. 2014, 612, 149–153. [Google Scholar] [CrossRef]
  48. Pritula, I.; Gayvoronsky, V.; Gromov, Y.; Kopylovsky, M.; Kolybaeva, M.; Puzikov, V.; Kosinova, A.; Savvin, Y.; Velikhov, Y.; Levchenko, A. Linear and nonlinear optical properties of dye-doped KDP crystals: Effect of thermal treatment. Opt. 2009; 15, 1141–1147. [Google Scholar] [CrossRef]
  49. Padlyak, B.; Ryba-Romanowski, W.; Lisiecki, R.; Adamiv, V.; Burak, Y.; Teslyuk, I.; Banaszak-Piechowska, A. Optical spectra and luminescence kinetics of the Sm3+ and Yb3+ centres in the lithium tetraborate glasses. Optica Applicata. 2010, 2, 427–438. [Google Scholar]
  50. Kirdsiri, K.; Raja Ramakrishna, R.; Damdee, B.; Kim, H. J.; Kaewjaeng, S.; Kothan, S.; Kaewkhao, J. Investigations of optical and luminescence features of Sm3+ doped Li2O-MO-B2O3 (M =Mg/Ca/Sr/Ba) glasses mixed with different modifier oxides as an orange light emitting phosphor for WLED’s. Journal of Alloys and Compounds. 2018, 749, 197–204. [Google Scholar] [CrossRef]
  51. Khan, I.; Rooh, G.; Rajaramakrishna, R.; Sirsittipokakun, N.; Kim, H. J.; Ruangtaweep, Y.; Kaewkhao, J. Spectroscopy Study of Sm3+ Doped Fluorosilicate Glasses for Orange Emission Solid-State Device Application. Glass Physics and Chemistry. 2019, 45, 447–458. [Google Scholar] [CrossRef]
  52. Ivanova, A.A.; Gontcharenko, V.E.; Lunev, A.M.; Sidoruk, A.V.; Arkhipov, I.A.; Taydakov, I.V.; Belousov, Y.A. New Carboxylate Anionic Sm-MOF: Synthesis, Structure and Effect of the Isomorphic Substitution of Sm3+ with Gd3+ and Tb3+ Ions on the Luminescent Properties. Inorganics, 2022, 10, 104. [Google Scholar] [CrossRef]
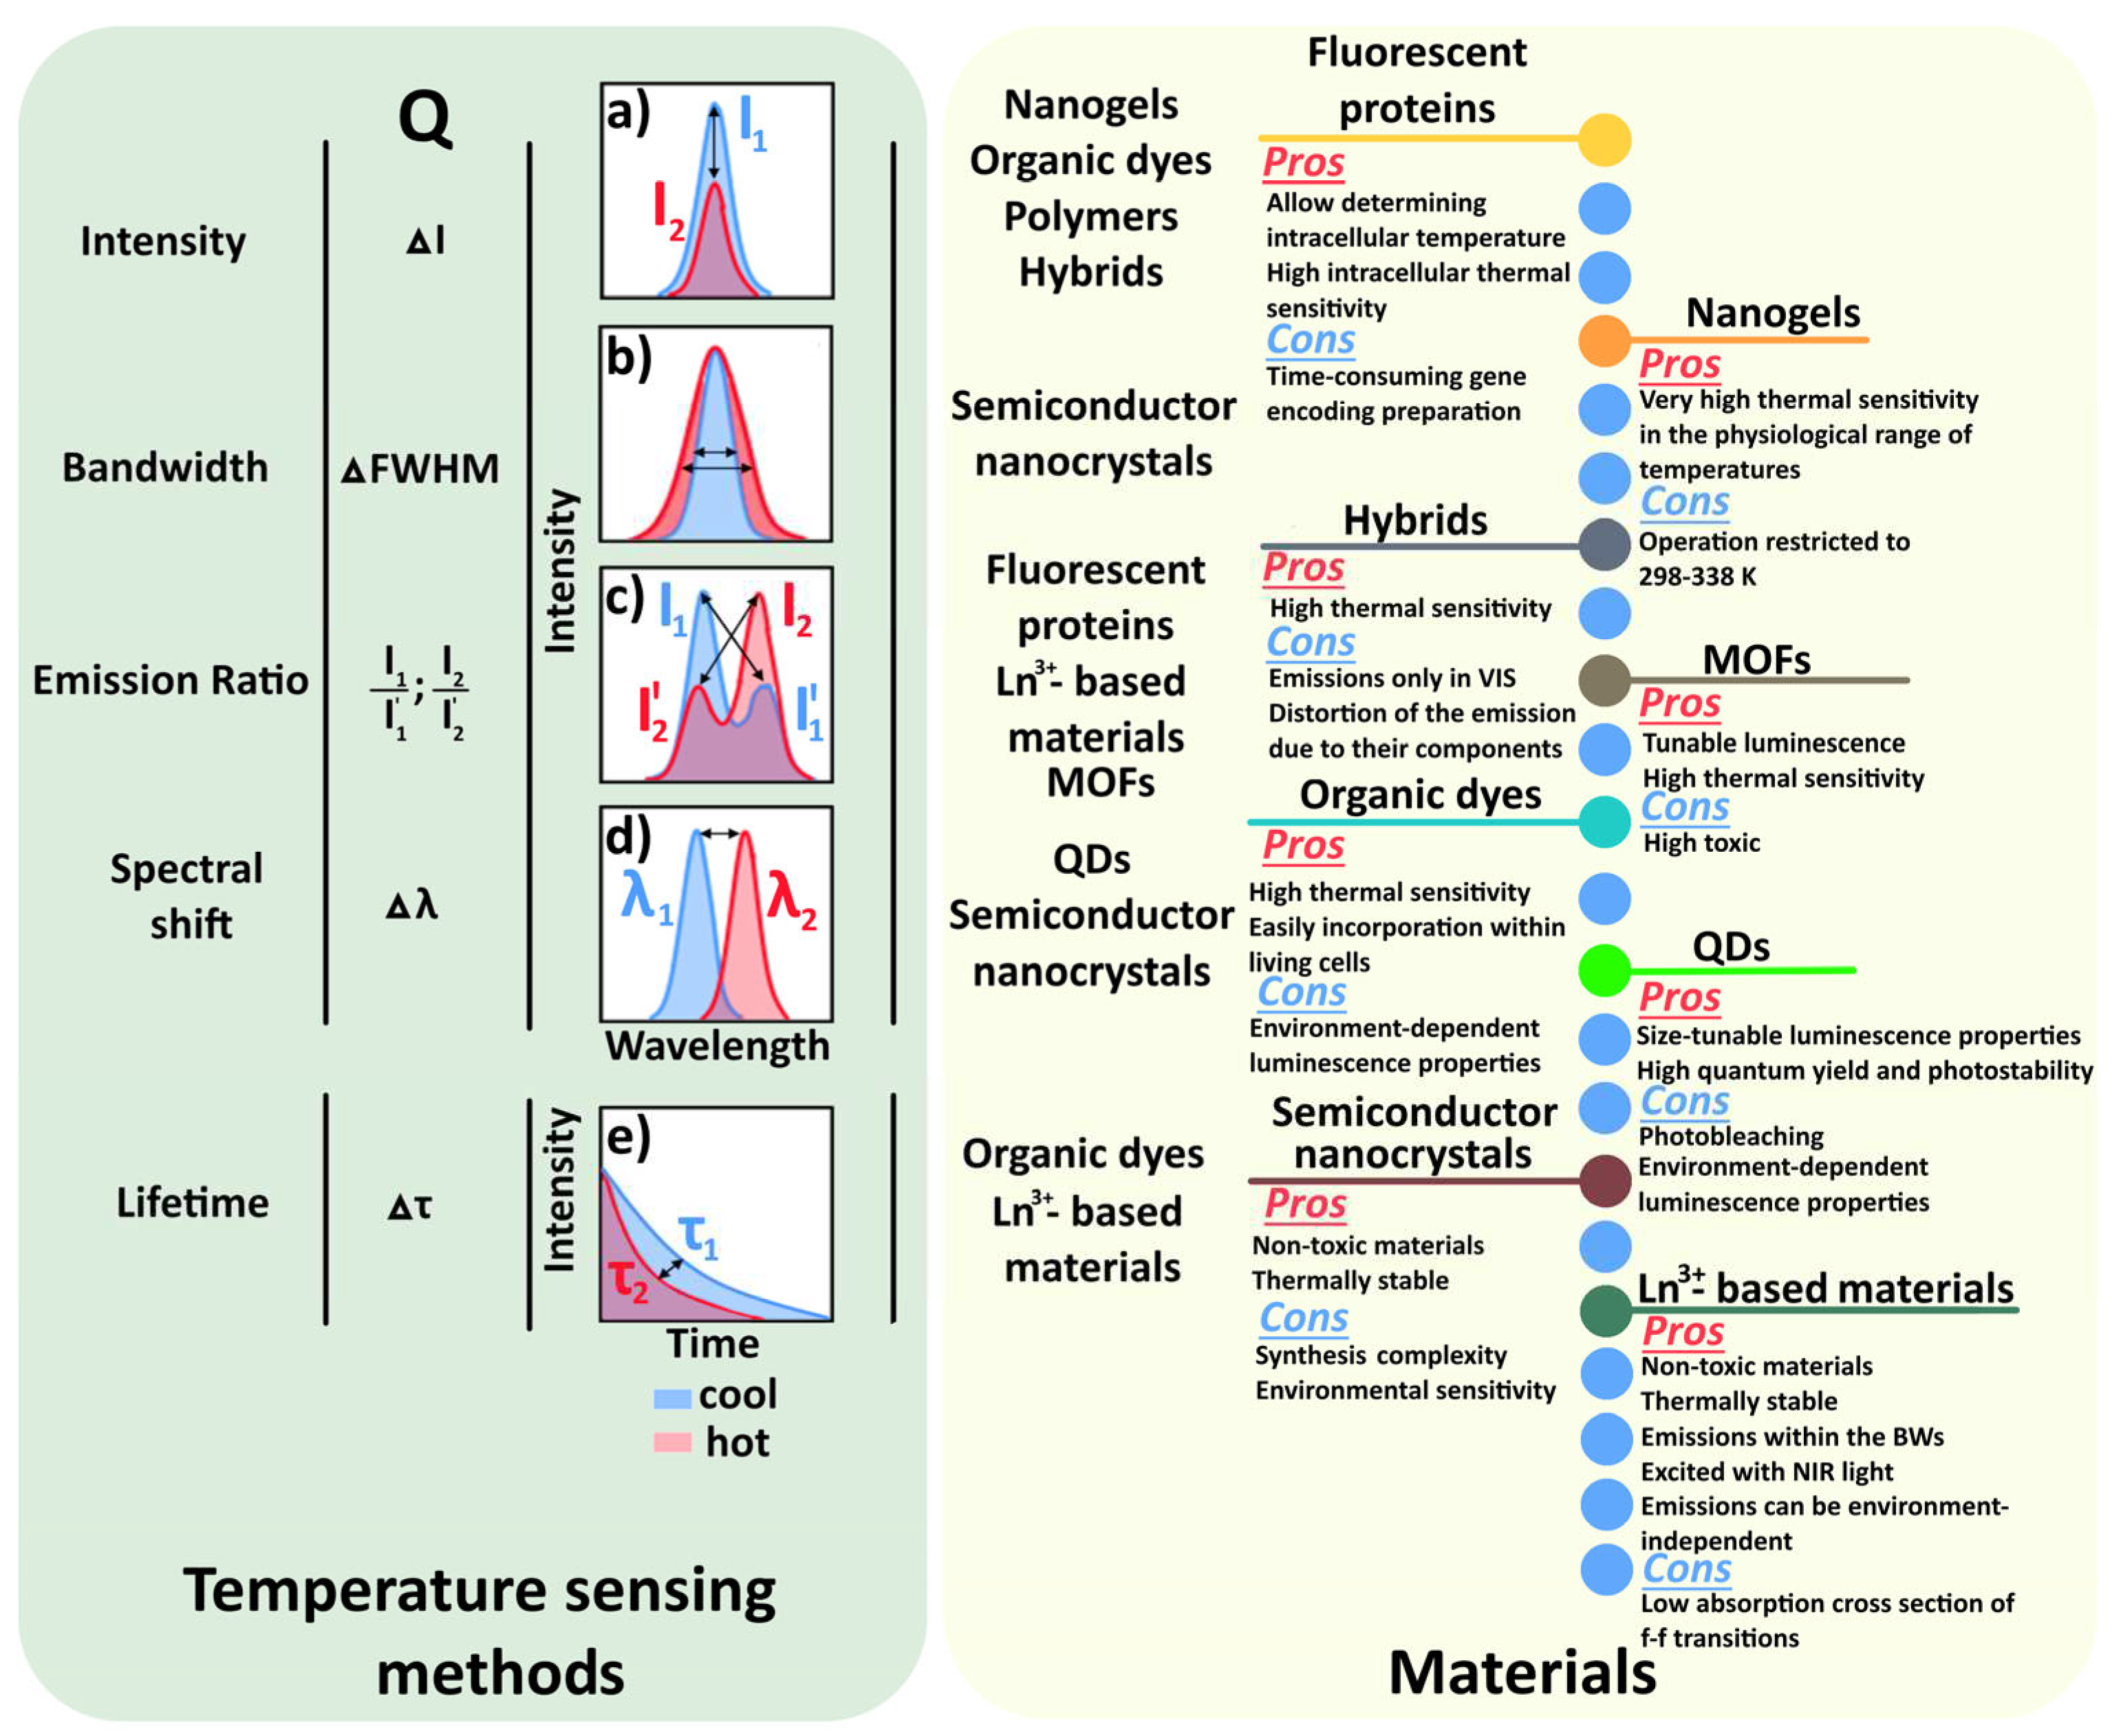
Figure 1. Schematic representation of the possible effects caused by a temperature increment on the luminescence (left) and corresponding materials using in the luminescent thermometry (right).
Preprints 94972 g001
Figure 3. Optical absorption spectra of synthesized Pb-based glasses.
Preprints 94972 g003
Figure 4. Optical absorption spectra of synthesized Bi-based glasses.
Preprints 94972 g004
Figure 5. Emission (λex = 377 nm) and excitation (λem = 595 nm) spectra of (12.75)Pb(1.5)Sm(0.75)Gd-42.5 and (12.75)Bi(1.5)Sm(0.75)Gd-42.5 glasses.
Preprints 94972 g005
Figure 6. Emission spectra of Pb-based (a) and Bi-based (b) glass samples (λex=404 nm).
Preprints 94972 g006
Figure 7. Time-resolved photoluminescence decay curve of Pb-based (a) and Bi-based (b) glass samples measured at λPL=597 nm.
Preprints 94972 g007
Figure 8. Emission spectra of Pb12.75Sm1.5Gd0.75 recorded at different temperatures (λex = 404 nm).
Preprints 94972 g008
Figure 9. Normalized emission spectra (a) of (12.75)Pb(1.5)Sm(0.75)Gd-42.5 glass sample recorded at different temperatures (λex = 404 nm) and normalized PL intensities of the bands (b), corresponding to the transitions in Sm3+.
Preprints 94972 g009
Figure 10. The temperature dependence of the ratio of luminescence intensities between the transitions for (12.75)Pb(1.5)Sm(0.75)Gd-42.5 sample described by linear (a) and Boltzmann equations (b): (1) - I(4F3/26H5/2)/I(4G5/26H5/2); (2) - I(4F3/26H5/2)/I(4G5/26H7/2); (3) - I(4F3/26H5/2)/I(4G5/26H9/2).
Preprints 94972 g010
Figure 12. Emission spectra of (17)Bi(2)Sm(1)Gd-40 glass recorded at different temperatures (λex = 404 nm).
Preprints 94972 g012
Figure 13. Normalized emission spectra (a) of (17)Bi(2)Sm(1)Gd-40 glass sample recorded at different temperatures (λex = 404 nm) and normalized PL intensities of the bands (b), corresponding to the transitions in Sm3+.
Preprints 94972 g013
Figure 14. The temperature dependence of the ratio of luminescence intensities between the transitions for Pb12.75Sm1.5Gd0.75 sample described by linear (a) and Boltzmann equations (b): (1) - I(4G5/26H9/2)/I(4G5/26H7/2); (2) - I(4G5/26H7/2)/I(4G5/26H9/2).
Preprints 94972 g014
Table 1. Notations (sample ID) of the glasses under study.
Sample ID /Notation Glass composition (mol.%) Sample ID /Notation Glass composition (mol.%)
(12.75)Pb(1.5)Sm
(0.75)Gd-42.5
42.5B2O3–42.5GeO2–12.75PbO–1.5Sm2O3–0.75Gd2O3 (12.75)Bi(1.5)Sm
(0.75)Gd-42.5
42.5B2O3–42.5GeO2–12.75Bi2O3–1.5Sm2O3–0.75Gd2O3
(12)Pb (1.875)Sm
(1.125)Gd-42.5
42.5B2O3–42.5GeO2–12PbO–1.875Sm2O3–1.125Gd2O3 (12)Bi(1.875)Sm
(1.125)Gd-42.5
42.5B2O3–42.5GeO2–12Bi2O3–1.875Sm2O3–1.125Gd2O3
(11.25)Pb (2.25)Sm
(1.5)Gd-42.5
42.5B2O3–42.5GeO2–11.25PbO–2.25Sm2O3–1.5Gd2O3 (11.25)Bi(2.25)Sm
(1.5)Gd-42.5
42.5B2O3–42.5GeO2–11.25Bi2O3–2.25Sm2O3–1.5Gd2O3
(17)Pb(2.0)Sm
(1.0)Gd-40
40B2O3–40GeO2–17PbO–
2Sm2O3–1Gd2O3
(17)Bi(2.0)Sm
(1.0)Gd-40
40B2O3–40GeO2–17Bi2O3
2Sm2O3–1Gd2O3
(16)Pb(2.5)Sm
(1.5)Gd-40
40B2O3–40GeO2–16PbO–
2.5Sm2O3–1.5Gd2O3
(16)Bi(2.5)Sm
(1.5)Gd-40
40B2O3–40GeO2–16Bi2O3
2.5Sm2O3–1.5Gd2O3
(15)Pb(3.0)Sm
(2.0)Gd-40
40B2O3–40GeO2–15PbO–
3Sm2O3–2Gd2O3
(15)Bi(3.0)Sm
(2.0)Gd-40
40B2O3–40GeO2–15Bi2O3
3Sm2O3–2Gd2O3
Table 3. Glass transition temperature (Tg) of synthesized glasses.
Sample ID Tg (K) Sample ID Tg (K)
(12.75)Pb(1.5)Sm(0.75)Gd-42.5 768 (12.75)Bi(1.5)Sm(0.75)Gd-42.5 772
(12)Pb(1.875)Sm(1.125)Gd-42.5 778 (12)Bi(1.875)Sm(1.125)Gd-42.5 795
(11.25)Pb(2.25)Sm(1.5)Gd-42.5 806 (11.25)Bi(2.25)Sm(1.5)Gd-42.5 802
(17)Pb(2.0)Sm(1.0)Gd-40 782 (17)Bi(2.0)Sm(1.0)Gd-40 796
(16)Pb(2.5)Sm(1.5)Gd-40 797 (16)Bi(2.5)Sm(1.5)Gd-40 804
(15)Pb(3.0)Sm(2.0)Gd-40 824 (15)Bi(3.0)Sm(2.0)Gd-40 810
Table 4. Density and refractive indices of synthesized glasses.
Sample ID Density
(g/cm3)
Refractive
index at
589 nm
Sample ID Density
(g/cm3)
Refractive
index at
589 nm
(12.75)Pb(1.5)Sm(0.75)Gd-42.5 4.060 1.68 (12.75)Bi(1.5)Sm(0.75)Gd-42.5 4.655 1.78
(12)Pb(1.875)Sm(1.125)Gd-42.5 4.030 1.68 (12)Bi(1.875)Sm(1.125)Gd-42.5 4.630 1.77
(11.25)Pb(2.25)Sm(1.5)Gd-42.5 4.015 1.68 (11.25)Bi(2.25)Sm(1.5)Gd-42.5 4.600 1.76
(17)Pb(2.0)Sm(1.0)Gd-40 4.390 1.72 (17)Bi(2.0)Sm(1.0)Gd-40 5.060 1.82
(16)Pb(2.5)Sm(1.5)Gd-40 4.370 1.72 (16)Bi(2.5)Sm(1.5)Gd-40 5.010 1.80
(15)Pb(3.0)Sm(2.0)Gd-40 4.270 1.72 (15)Bi(3.0)Sm(2.0)Gd-40 4.990 1.78
Table 5. Pl decay kinetics parameters of samples generated from the curve fitting.
Sample ID τ1, (ns) τ2, (ns) Sample ID τ1, (ns) τ2, (ns)
(12.75)Pb(1.5)Sm(0.75)Gd-42.5 95.3 ± 1.9 608.8 ± 7.9 (12.75)Bi(1.5)Sm(0.75)Gd-42.5 101.6 ± 2.2 609.0 ± 8.6
(12)Pb(1.875)Sm(1.125)Gd-42.5 98.7 ± 2.0 618.7 ± 8.7 (12)Bi(1.875)Sm(1.125)Gd-42.5 99.9 ± 2.1 619.7 ± 8.9
(11.25)Pb(2.25)Sm(1.5)Gd-42.5 97.9 ± 2.2 604.6 ± 8.8 (11.25)Bi(2.25)Sm(1.5)Gd-42.5 95.6 ± 1.9 586.0 ± 7.4
(17)Pb(2.0)Sm(1.0)Gd-40 100.4 ± 2.0 616.4 ± 8.5 (17)Bi(2.0)Sm(1.0)Gd-40 99.8 ± 2.1 617.7 ± 8.7
(16)Pb(2.5)Sm(1.5)Gd-40 93.4 ± 2.3 600.6 ± 8.8 (16)Bi(2.5)Sm(1.5)Gd-40 97.0 ± 2.2 623.4 ± 9.4
(15)Pb(3.0)Sm(2.0)Gd-40 96.9 ± 2.3 604.5 ± 7.9 (15)Bi(3.0)Sm(2.0)Gd-40 96.9 ± 2.1 602.7 ± 8.3
Disclaimer/Publisher’s Note: The statements, opinions and data contained in all publications are solely those of the individual author(s) and contributor(s) and not of MDPI and/or the editor(s). MDPI and/or the editor(s) disclaim responsibility for any injury to people or property resulting from any ideas, methods, instructions or products referred to in the content.
Copyright: This open access article is published under a Creative Commons CC BY 4.0 license, which permit the free download, distribution, and reuse, provided that the author and preprint are cited in any reuse.
Prerpints.org logo

Preprints.org is a free preprint server supported by MDPI in Basel, Switzerland.

Subscribe

© 2024 MDPI (Basel, Switzerland) unless otherwise stated