Submitted:
03 January 2024
Posted:
04 January 2024
You are already at the latest version
Abstract
This work proposes a simple model to take into account the annual volatility of the mortality level observed on the scale of a country like France in the construction of prospective mortality tables. By assigning a fragility factor to a basic hazard function, we generalize the Lee-Carter model. The impact on prospective life expectancies and capital requirements in the context of a life annuity scheme is analyzed in detail.
Keywords:
longevity risk
; prospective mortality tables
1. Introduction
The construction of life expectancy projections has been the subject of much work since the seminal article by Lee and Carter (Lee and Carter [1992]).
With a view to extrapolating trends observed in the past into the future, most of the approaches proposed are based on a “mortality surface”, measuring mortality forces by age and year at the time, which must then be extrapolated over time.
The models inspired by Lee and Carter start by reducing dimension by performing a PCA and then extrapolating one or two time series associated with the projection on the principal axes.
Bongaarts (Bongaarts [2004]) has proposed a different approach, based on parametric adjustments by year of time and extrapolation of the estimated coefficients each year.
In Bongaarts [2004], however, the author uses a rather frustrating parametric representation (Thatcher’s model) which does not allow all ages to be included. Moreover, he limits his extrapolation to 2 out of 3 parameters, treating them independently, which is a questionable approximation.
Models of this type project regular series. However, when we look at annual variations in the mortality rate in France, for example, we see a fairly high degree of volatility:
Figure 1.
Annual variation in mortality rate.
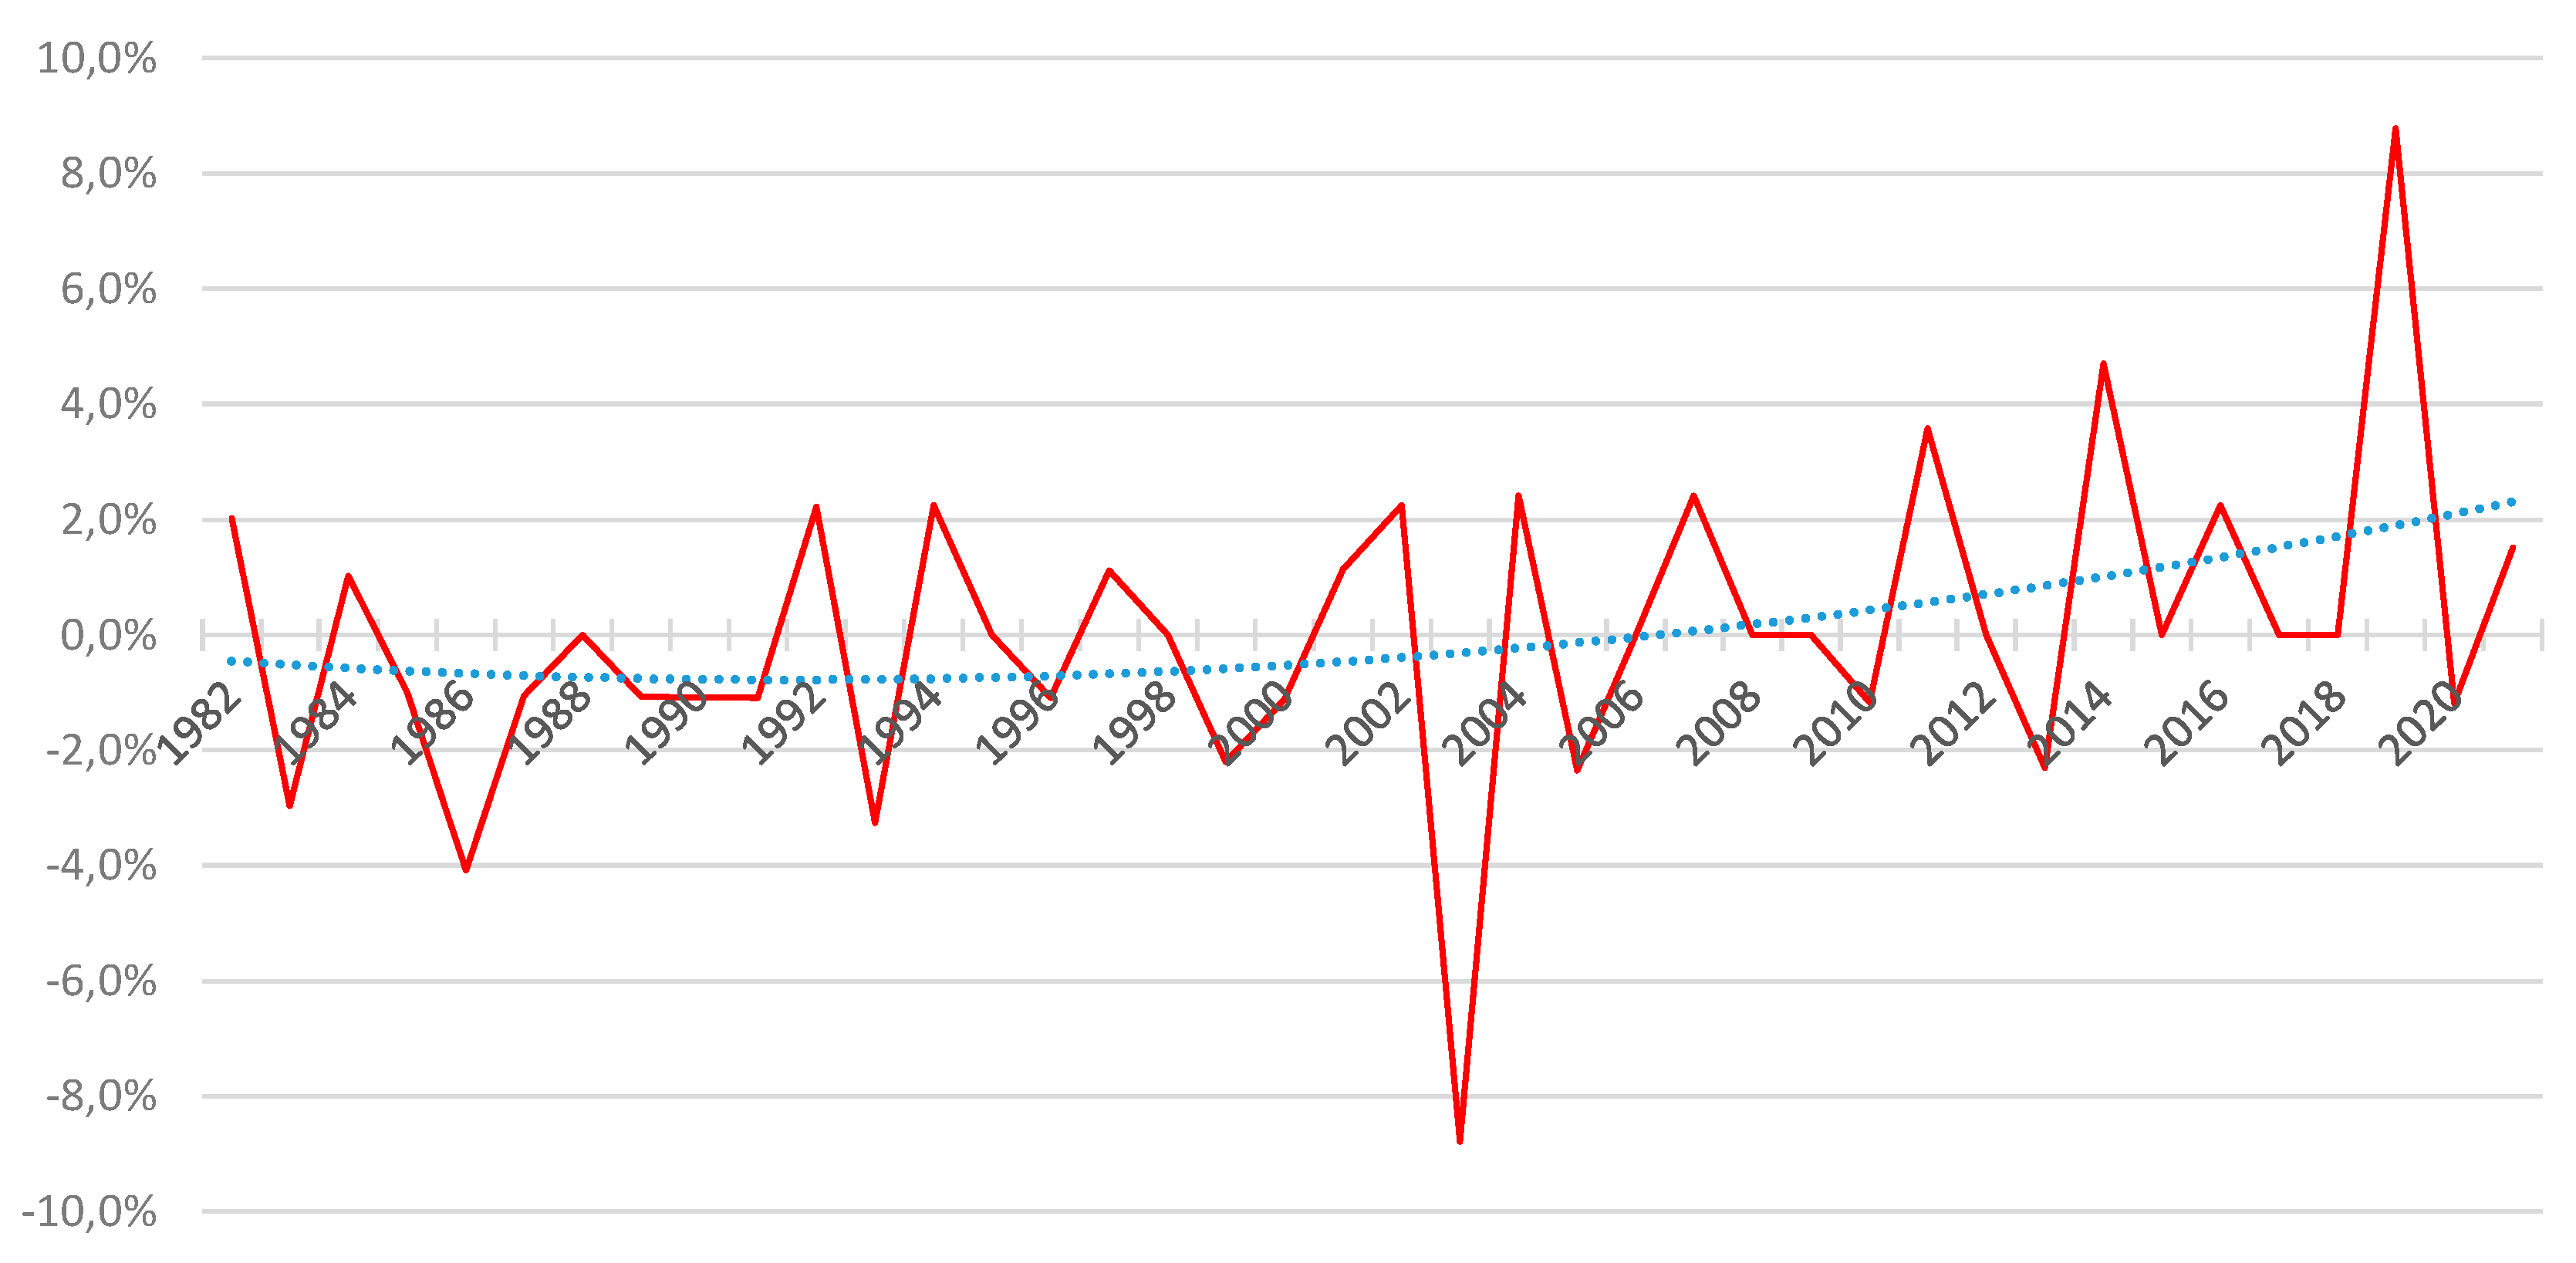
The classic models described above cannot account for these short-term variations. Proposed approaches have been put forward, for example, in Guette [2010] or Currie et al. [2003], but with a slightly different objective, as these works propose to model catastrophes such as wars or epidemics. More recently, an approach using regime-switching models was proposed in Robben and Antonio [2023].
Our aim here is not to model catastrophes, but to incorporate the above volatility into the modeling to provide a more accurate assessment of residual life expectancies when an unbiased estimate of mortality rates is available.
A specific approach is therefore proposed here, with the aim of accounting for this short-term volatility and measuring its impact on the anticipation of prospective residual life expectancies.
2. Proposed Stochastic Mortality Model
We draw inspiration here from the fragility models proposed by Vaupel and his co-authors (Vaupel et al. [1979]), by assigning a regular base hazard function of a shock that depends only on time, under a proportional hazards assumption.
The proposed specification is described below, followed by a method for estimating the parameters within the framework of conditional maximum likelihood.
a. Specification
Consider the following specification of the hazard function for the year of time t:
with the semi-parametric form of the basic hazard function . The shocks are assumed to be mean-centered, i.e., and the classical identifiability conditions for the basic hazard function are imposed (cf. Brouhns et al. [2002]):
This involves estimating the parameters of and the matrix, then extrapolating the time series.
b. Log-Likelihood Determination
For maximum likelihood estimation, we know that everything happens as if the number of deaths observed followed a Poisson distribution,
which leads to the following expression for the conditional likelihood for an observation, noting :
Likelihood is easy to deduce:
We then choose a Gamma distribution of parameters a and b for the distribution of Z, i.e., , which leads to . Using the change of variable , we obtain the following expression for the likelihood of an observation
which in turn gives log-likelihood
with .
As a function of the parameters and conditional on , the log-likelihood for an observation is of the form with . Conditional on , the log-likelihood has the following form (with one additive constant):
It can then be maximized by under the constraint that and .
c. Parameter Estimation
Parameter estimation can be carried out in two stages: in the first stage, the fragility parameter is estimated, then, in the second stage, the above log-likelihood is maximized at .
The condition implies . We also have , so the disturbance control parameter is the inverse of the variance . A direct estimate of this parameter can be made as follows, observing that the mean annual output intensities are of the form
from which we derive , then . The variance of is therefore equal to the square of the coefficient of variation of : . It is then straightforward to propose as estimator
With and as estimators, the Hoem estimator of the hazard function.
Once the fragility parameter has been estimated, the aim is to maximize the previously expressed log-likelihood. The partial derivatives of the log-likelihood for an observation are as follows:
with p one of the parameters . We also have , and.
Finally, it remains to estimate , which is a solution of the first-order conditions:
This system is non-linear.
d. Calculating Prospective Residual Life Expectancies
In the proposed model, the calculation of prospective life expectancy
takes the form
because the Laplace transform of a Gamma distribution is . As , we deduce that:
Note that when , and then we find the classic formula .
3. Numerical Application
We use data for metropolitan France for the period 2000-2020, for ages 0 to 105 inclusive, from the Agalva and Blanpain study [2021]. All calibration was performed in R.
Prospective analyses are then carried out over the entire age range and for the years from 2021 to 2060.
a. Model Adjustment
All these steps are discussed in turn in the following subsections. Throughout the study, all the results obtained are compared with those given by a Lee-Carter model calibrated on the same data.
Estimation of Gamma Distribution Parameters
The estimation of the pair of parameters has been made with the raw data and we find , i.e., .
Estimation of Model Parameters
The calibration of under constraints was then carried out using the Rsolnp package (https://cran.r-project.org/web/packages/Rsolnp/index.html), and more specifically the solnp function (see Ghalanos and Theussl [2015]). In order to carry out this calibration, it was chosen to provide as initial parameters the results of a Lee-Carter model, calibrated using the lca function from the demography package (https://cran.r-project.org/web/packages/demography/index.html) (cf. Hyndman [2023]). All these coefficients are transcribed in the Appendix.
As shown in the following figure, this leads to coefficients very close to those of the reference Lee-Carter model:
Figure 2.
Comparison of different coefficients with those of a Lee-Carter model.
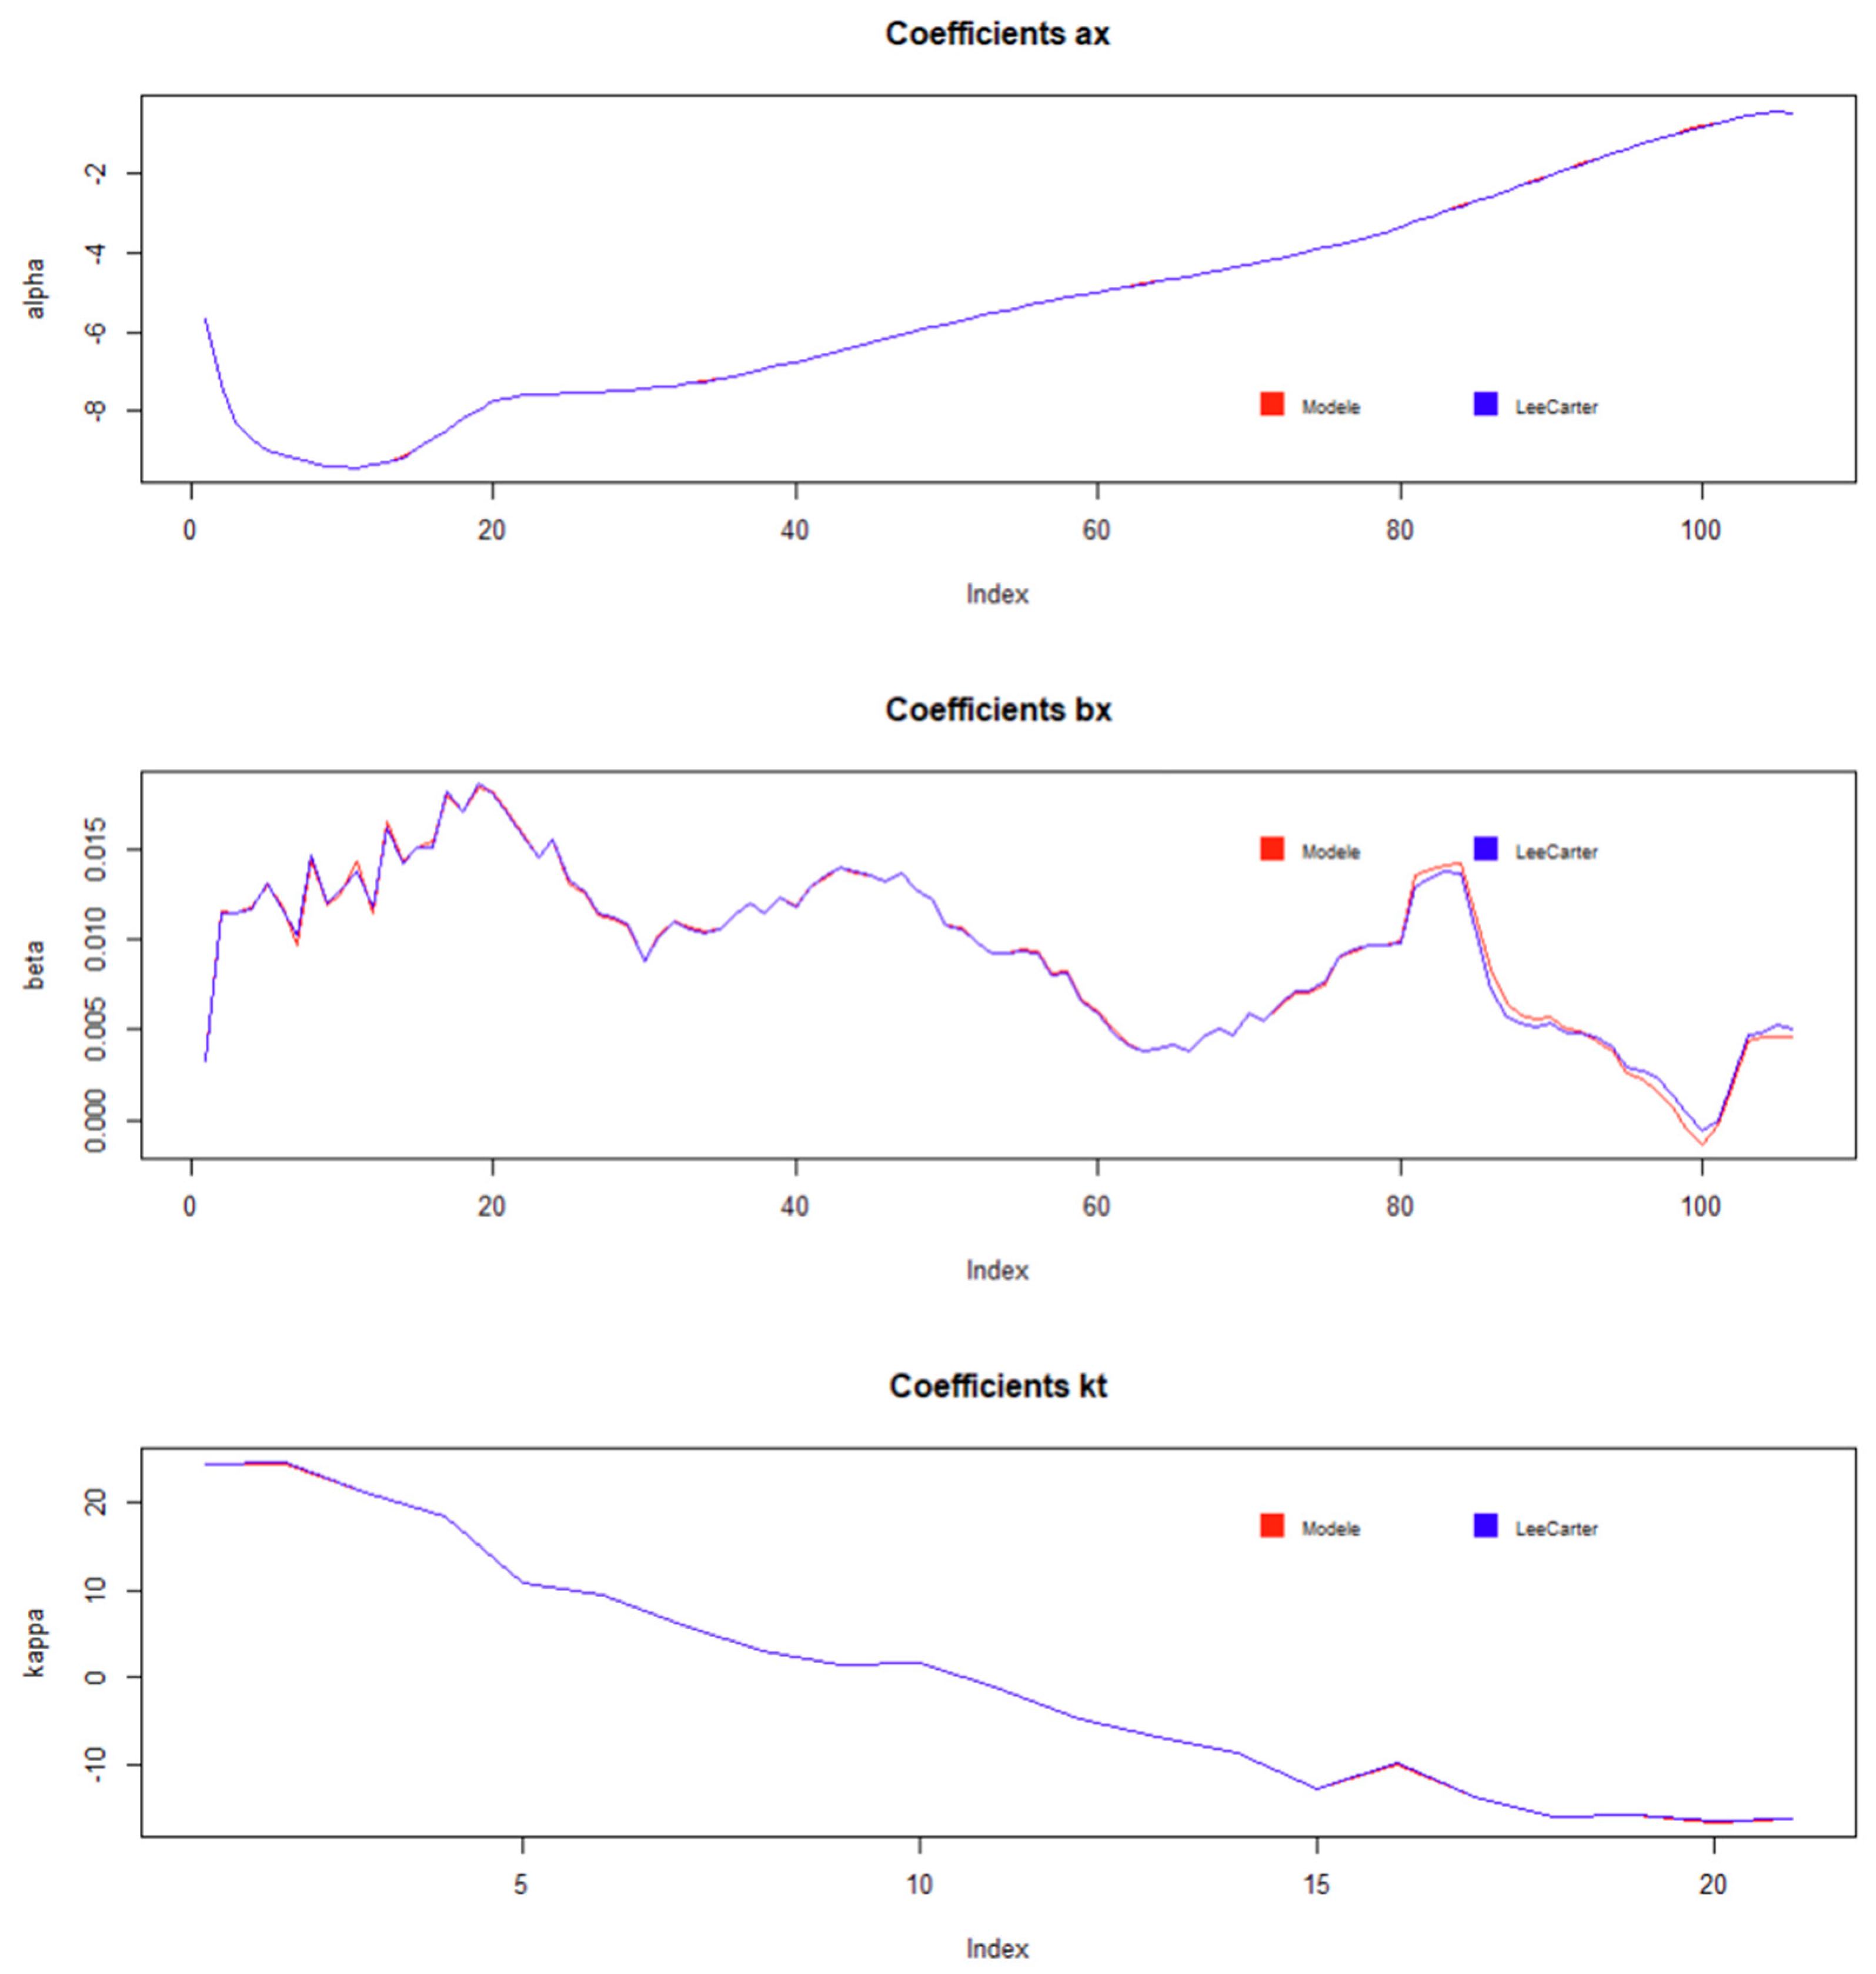
It can be seen that the time parameter shows a slower rate of decline from the 18ème year of the observation period.
Extrapolation of Time Coefficients
Whether in the model studied here or in the Lee-Carter model used as a reference, the projection of coefficients for beyond the calibration range has been done by linear regression, by fitting the following equation to the calibrated parameters:
In both cases, we find the coefficients shown in the following table:

Table 1.
Results of the extension of the time coefficients k.
| m | p | |
|---|---|---|
| Model studied | -2,19 | 4401,98 |
| Lee-Carter reference model | -2,19 | 4402,33 |
The results are logically very similar in both cases.
b. Projected Mortality Forces
Here, we compare projected mortality forces with and without shocks integrated into the model, as a function of age and year.
First, we look at the evolution of the mortality force as a function of age, for a few fixed years:
Figure 3.
Mortality forces by age.
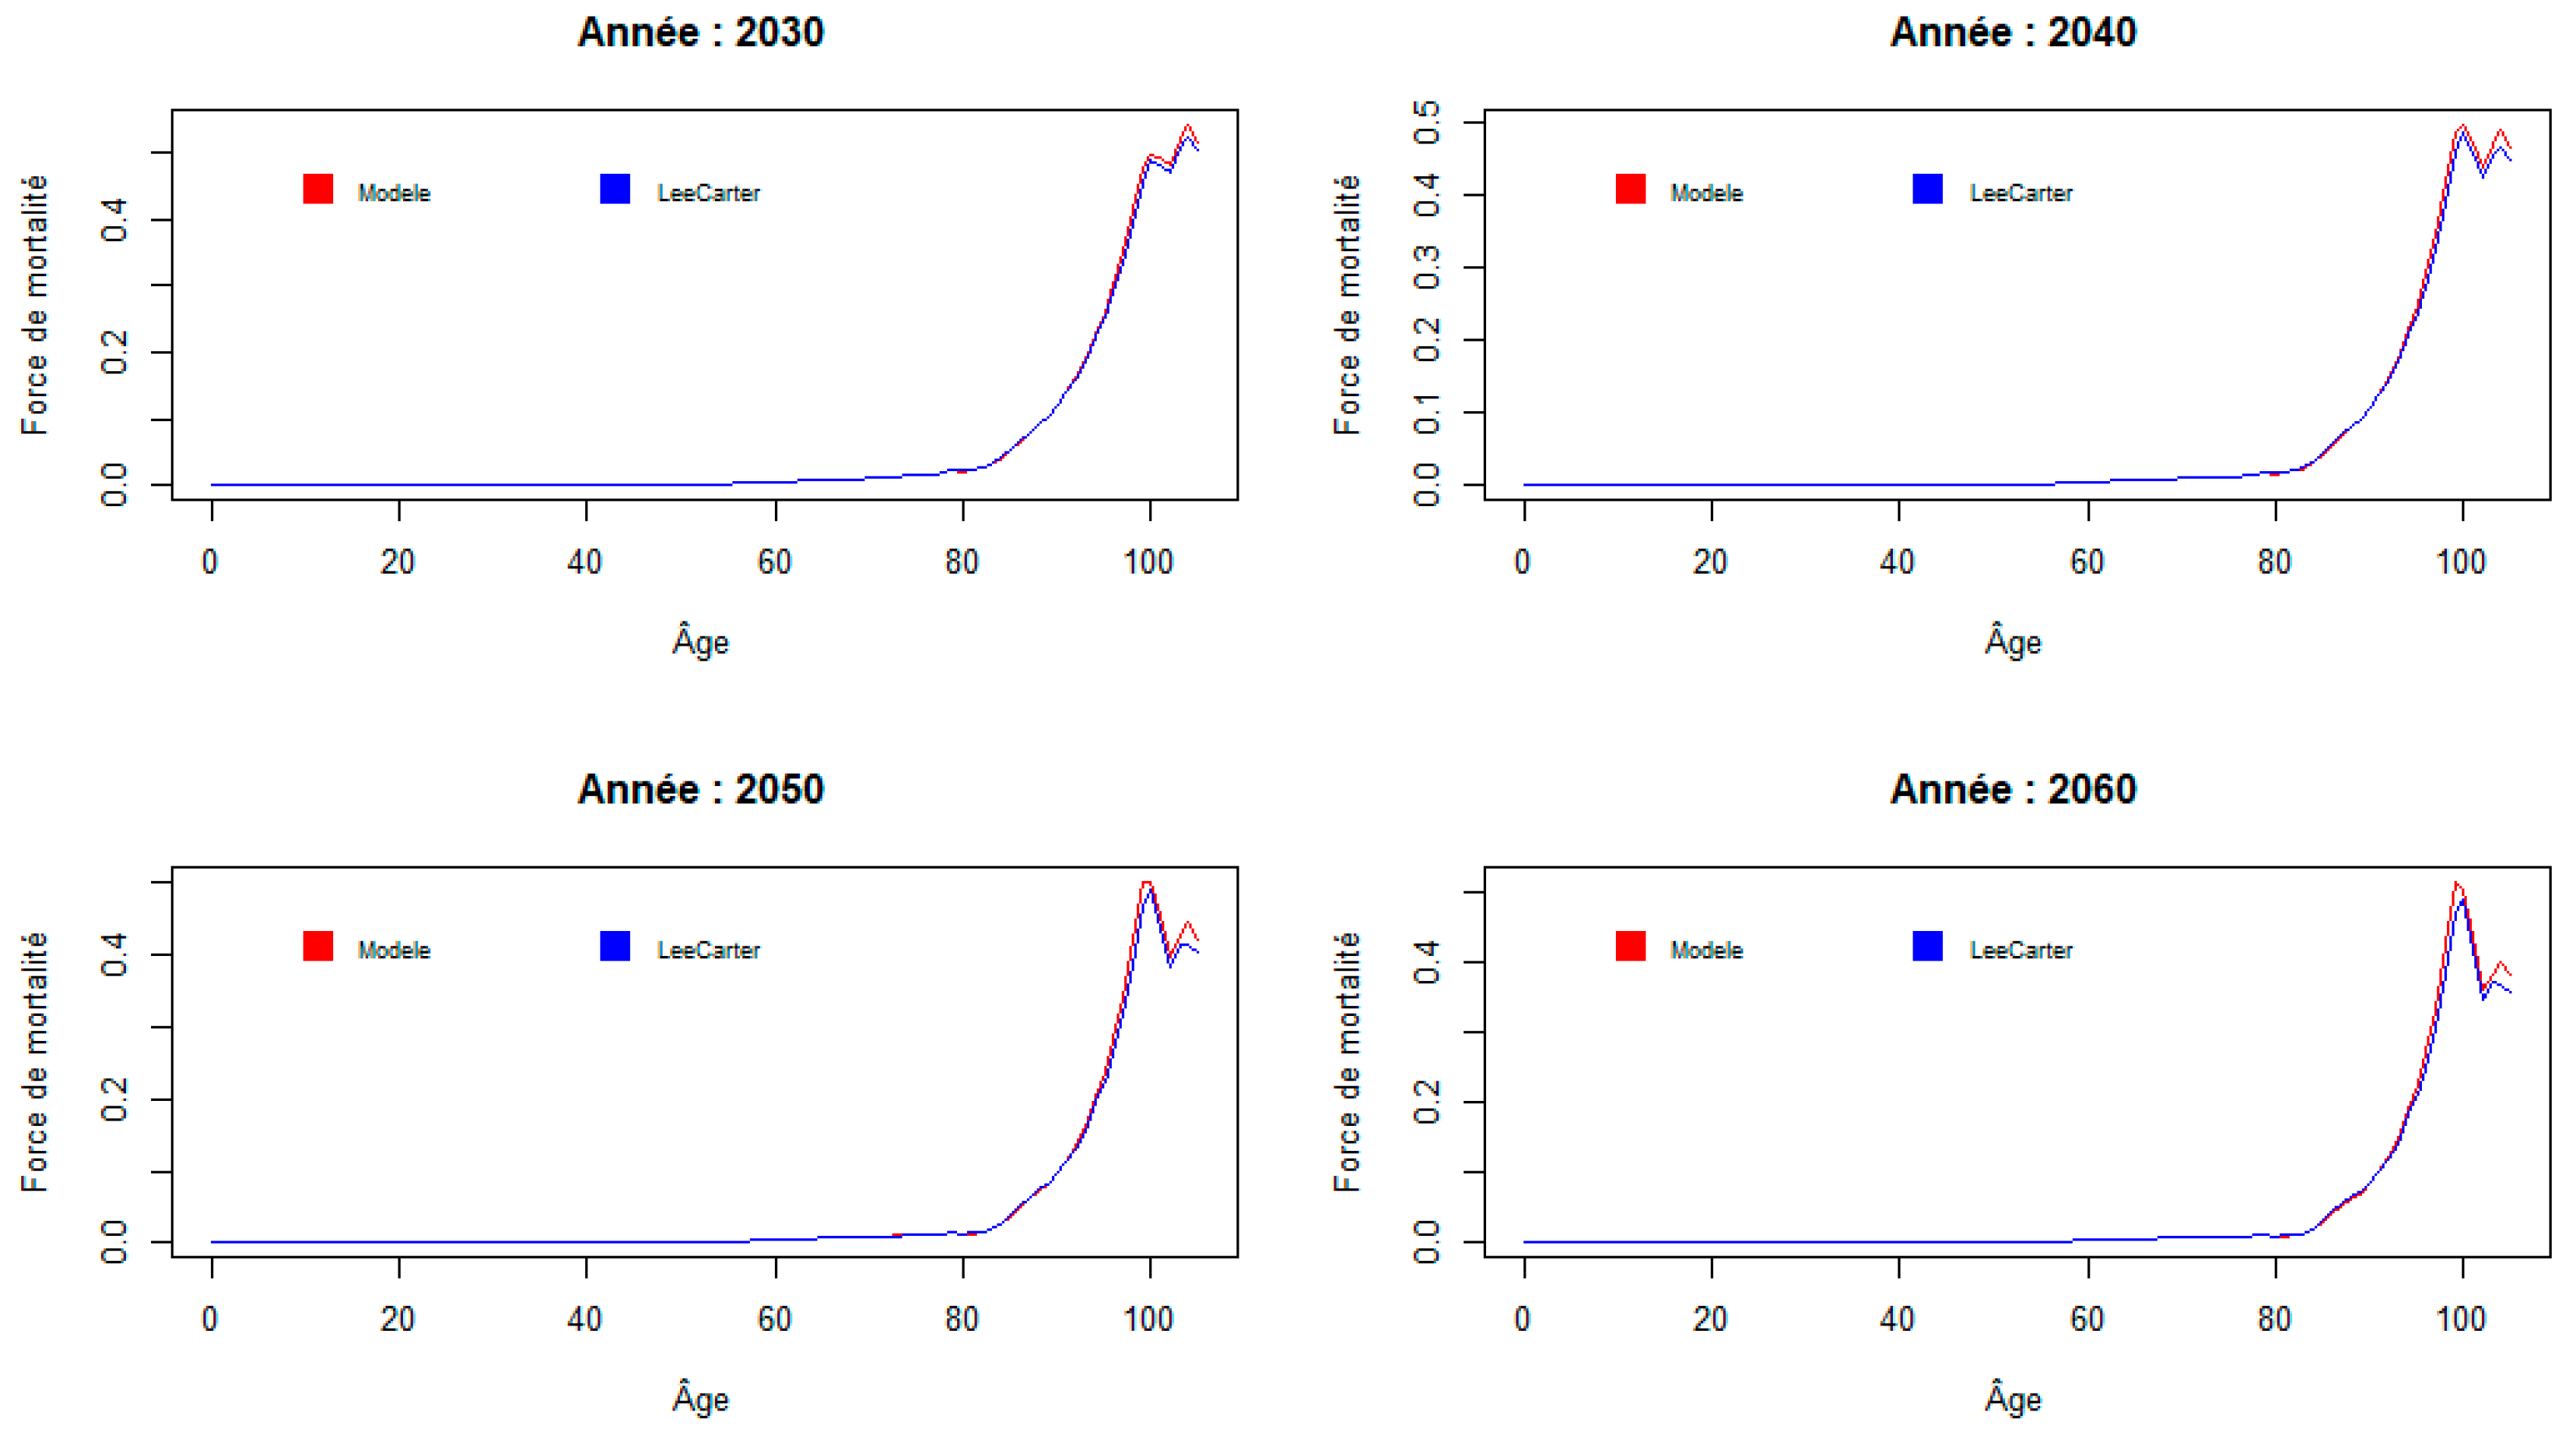
The mortality forces of the two models are very close, except at the highest ages, where the model with shocks tends to predict higher mortality forces. A closer look at the age range [90; 105] reveals the following:
Figure 4.
Mortality rates by age from 90 to 105 years.
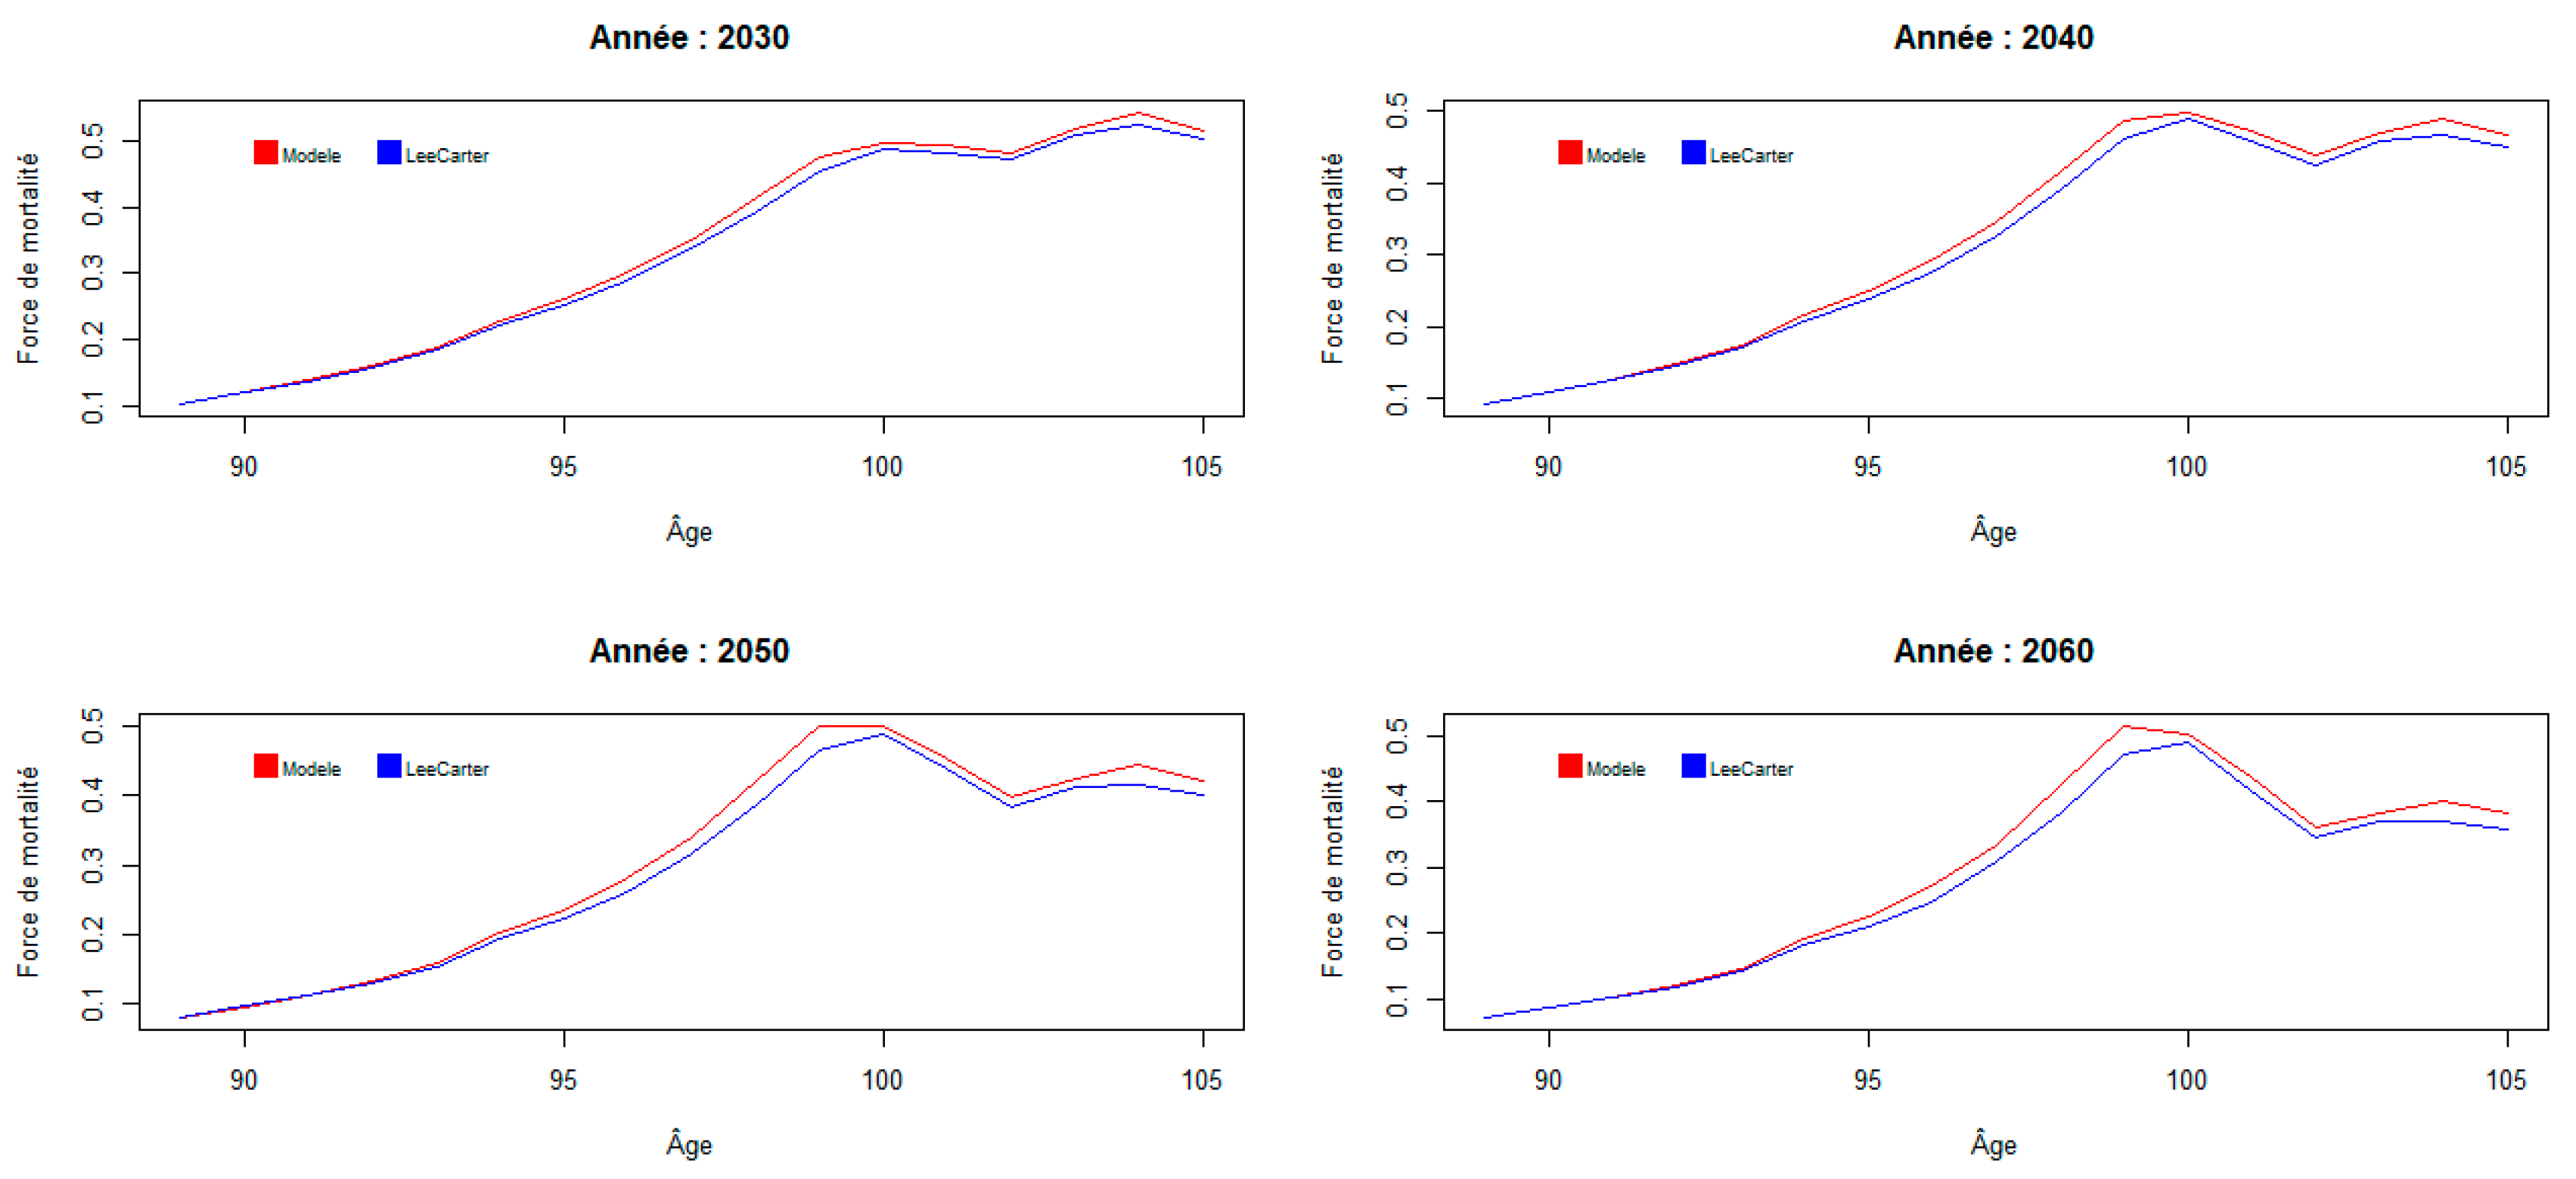
The maximum relative deviation over the entire prospective range is 3.6% at age 80 for the year 2060.
We now compare the mortality forces of the two models over the entire prospective analysis period, for a few selected ages.
Figure 5.
Mortality rates by year for selected ages.
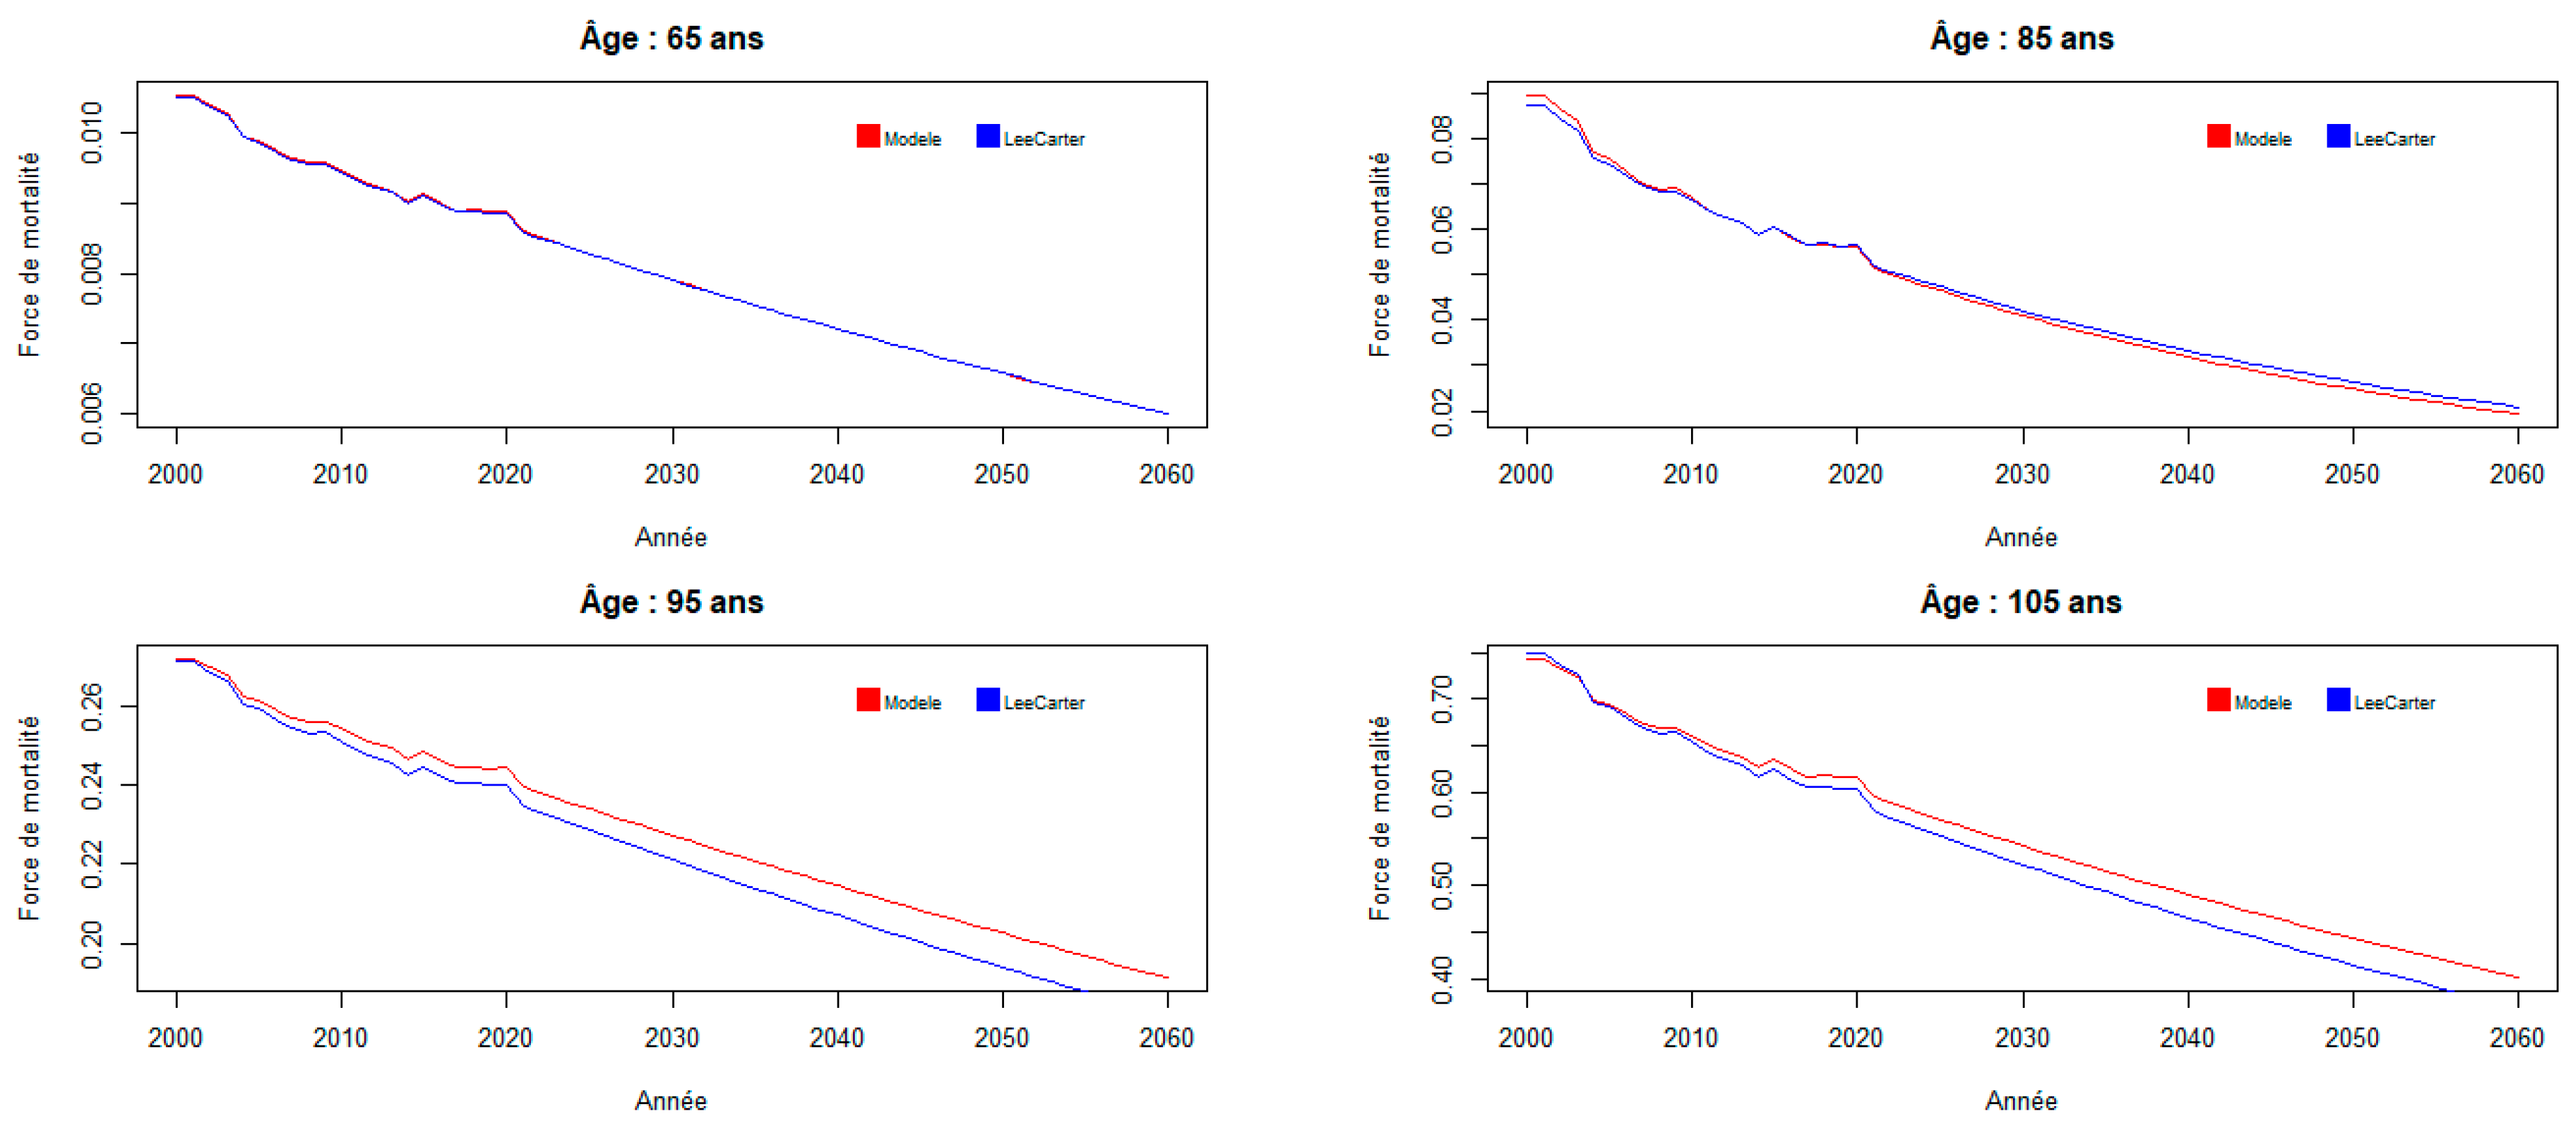
Overall, the mortality model studied tends to predict higher mortality forces than the reference Lee-Carter model at older ages, and the gap increases over time.
Before calculating prospective residual life expectancies, it’s worth looking at the overall impact on mortality forces. To this end, we calculate the following ratio:
with the mortality force derived from the reference Lee-Carter model and model. This ratio is shown in the following figure:
Figure 6.
Mortality force ratio over the entire age range and prospective analysis period (2021-2060).
Figure 6.
Mortality force ratio over the entire age range and prospective analysis period (2021-2060).
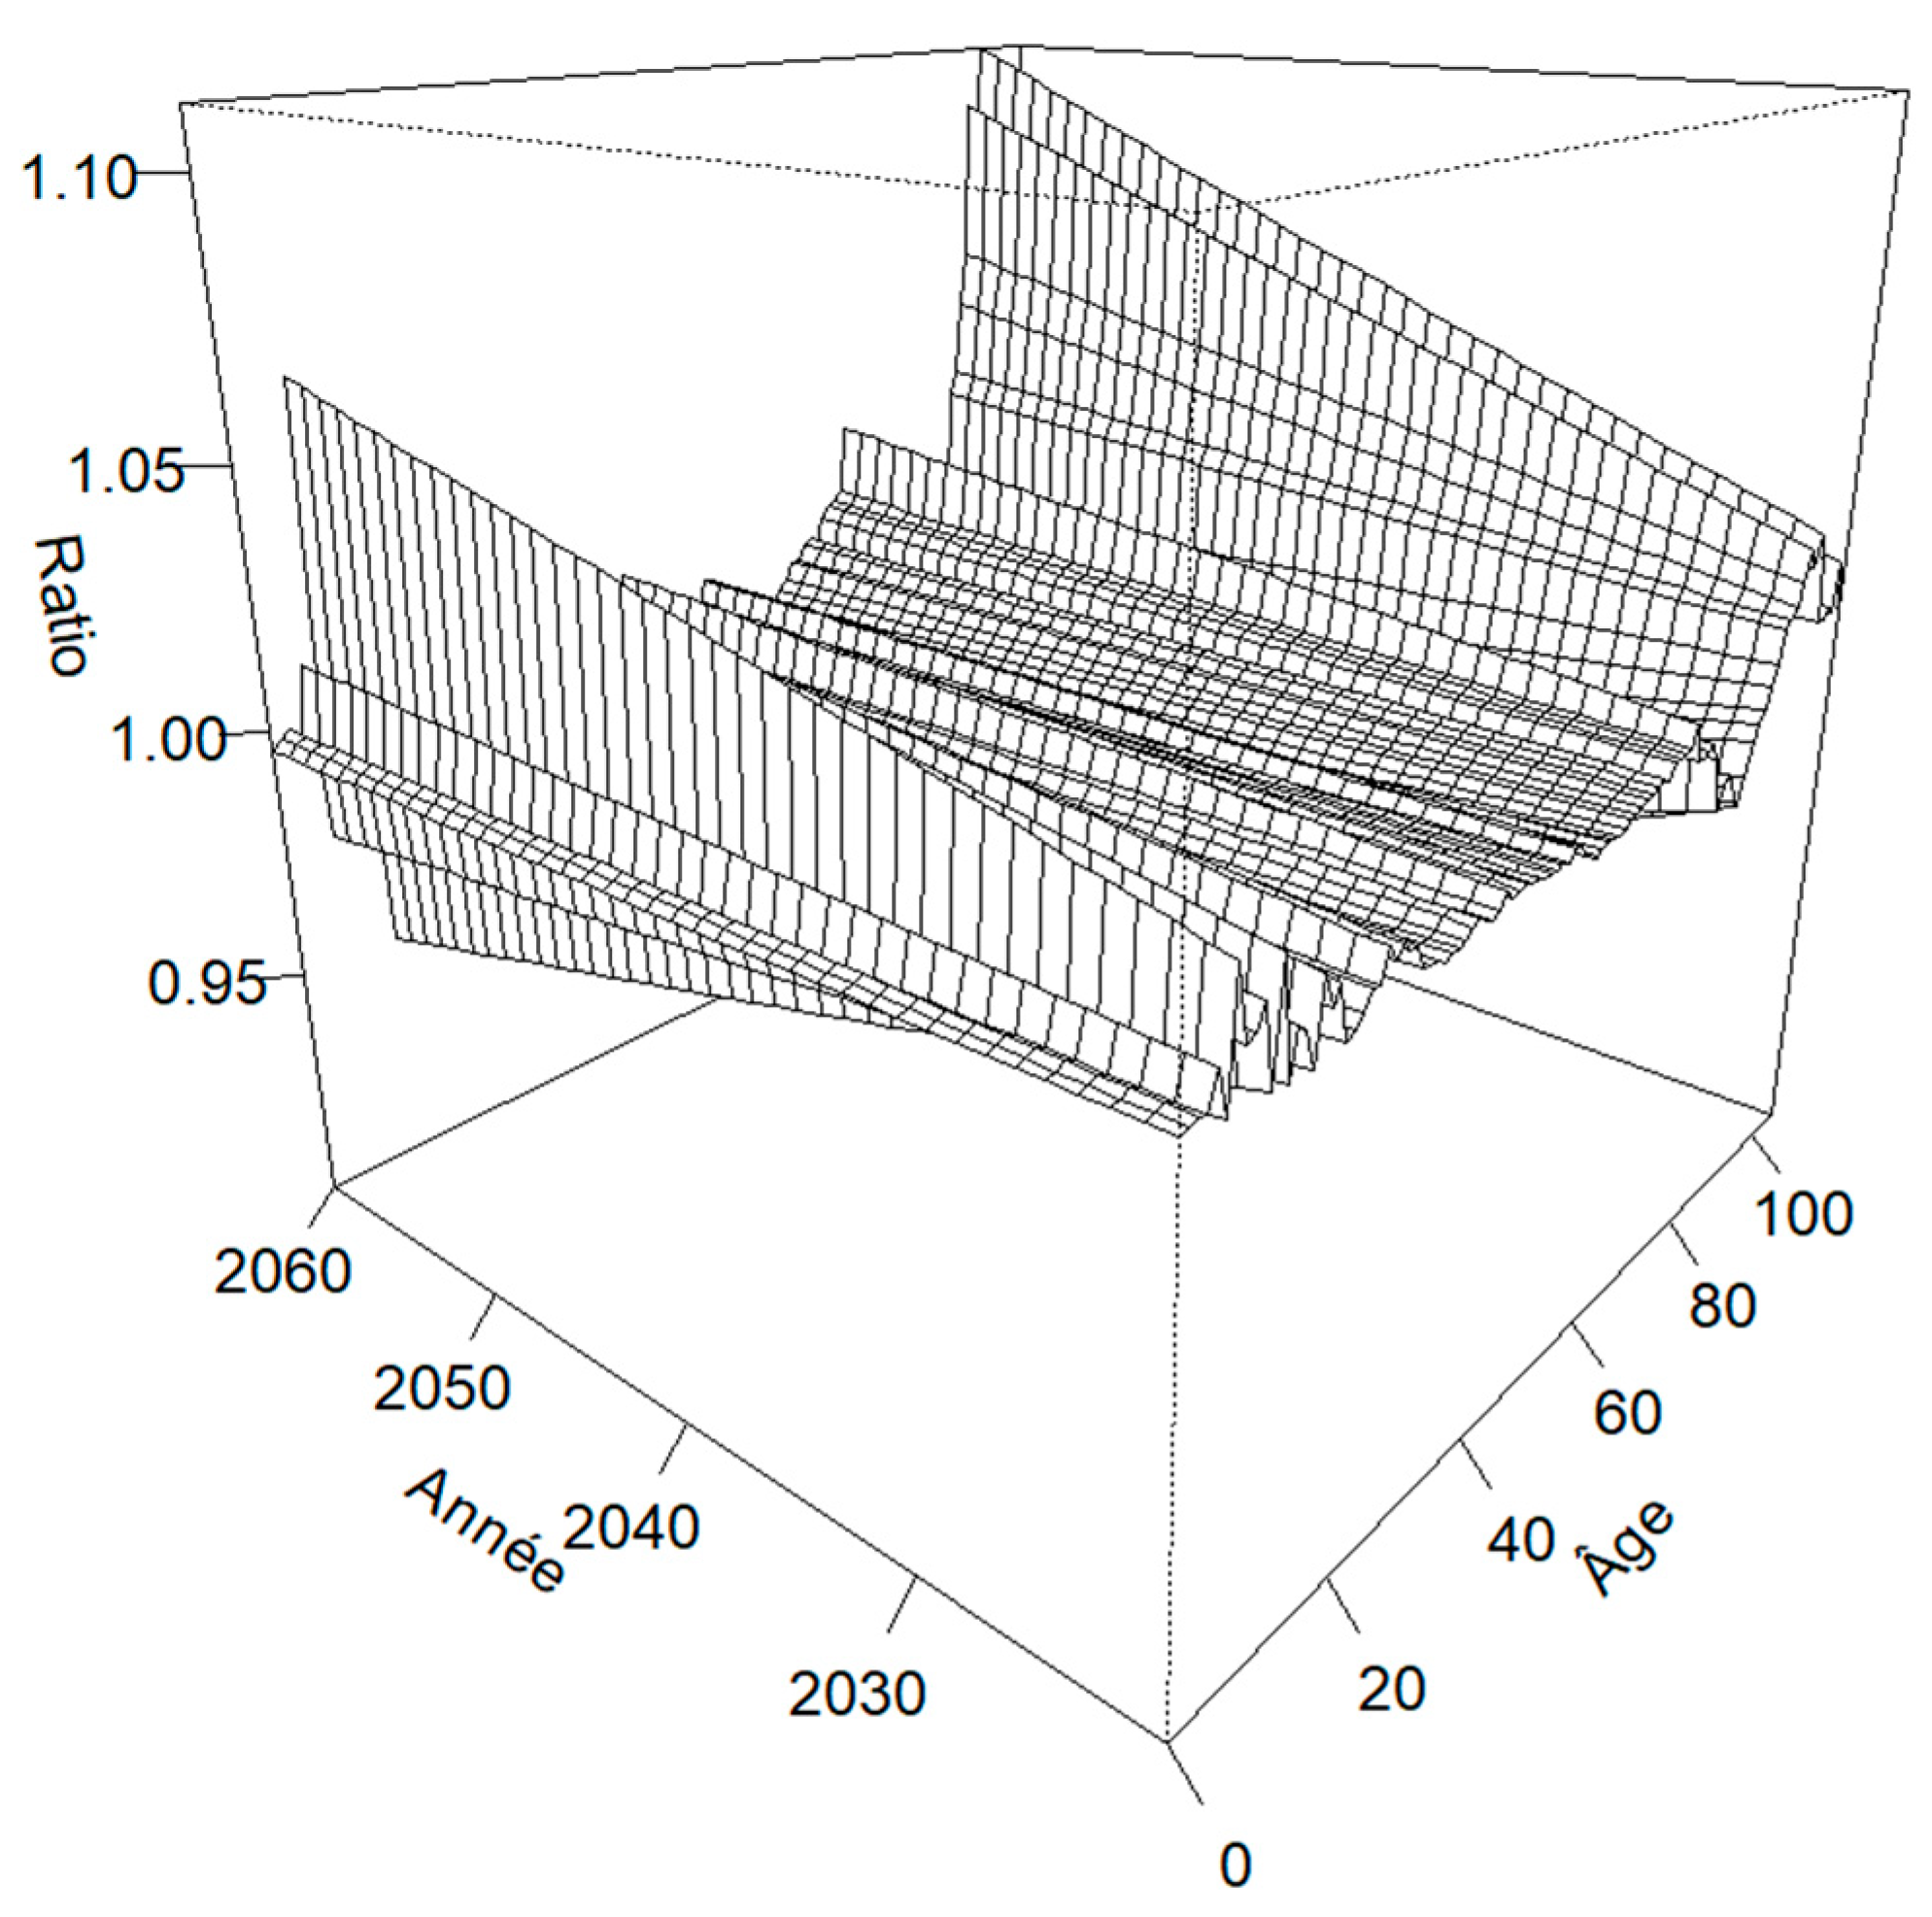
The average value of this ratio for all ages and years combined is 100%, which means that the model studied is equivalent to the Lee-Carter model.
The impact of the introduction of shocks on adjustment is therefore negligible when assessed on a very global basis. However, the difference increases over time, leading the two models to diverge in the medium term and at older ages.
If we restrict ourselves to ages over 65, we obtain a weighted average equal to 99.8%.
In addition, the average mortality rate of the population, calculated on the basis of exposure to risk in 2020, evolves as follows:
Figure 7.
Average mortality rate per year, all ages combined, from 2021 to 2060.
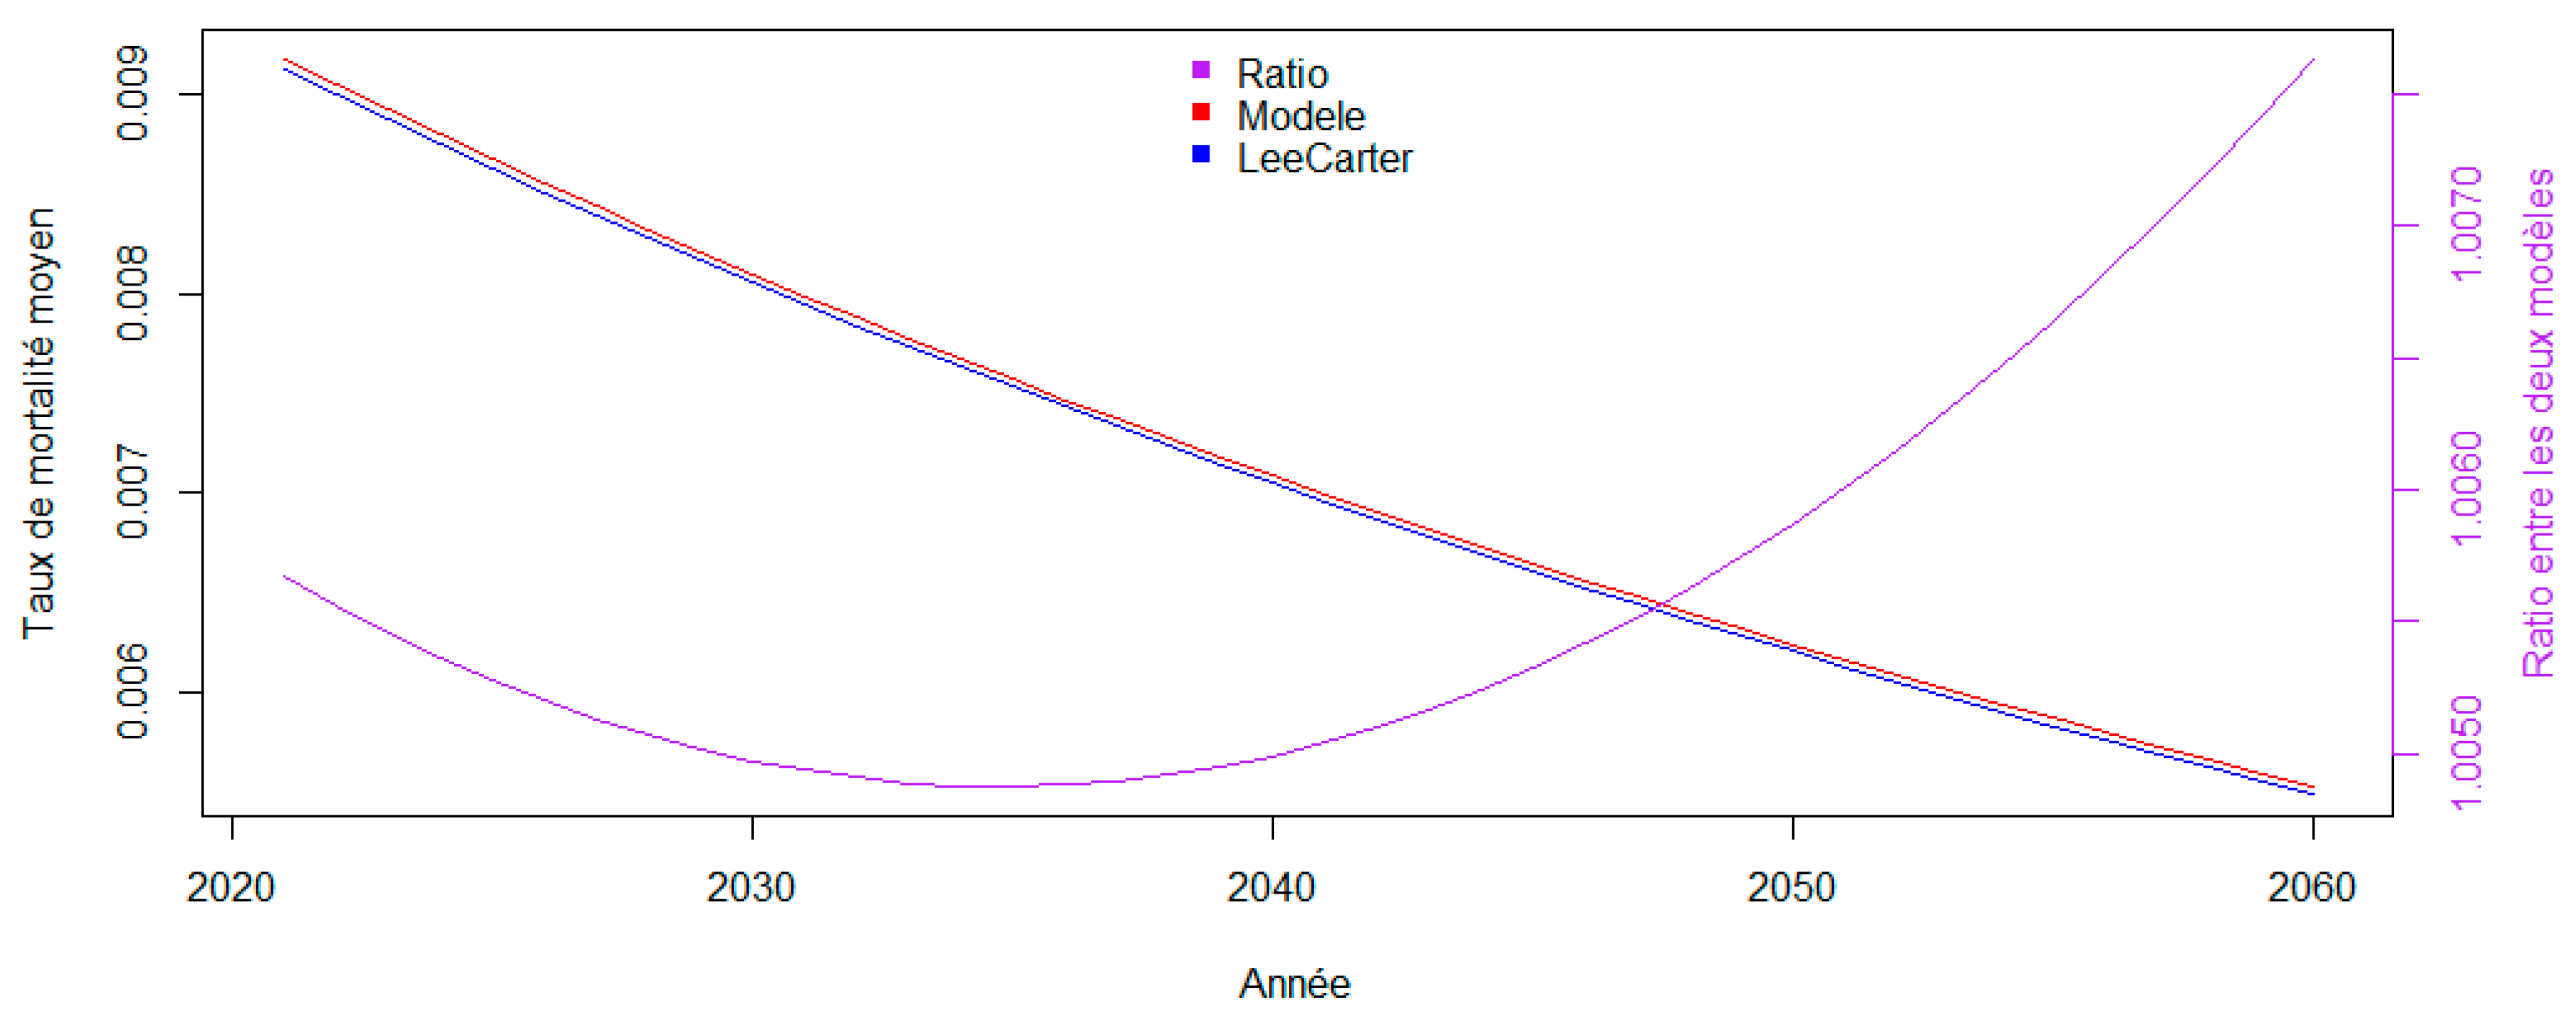
It can be seen that the model studied is on average more pessimistic than the Lee-Carter model on mortality improvement in future mortality.
c. Estimating Prospective Residual Life Expectancies
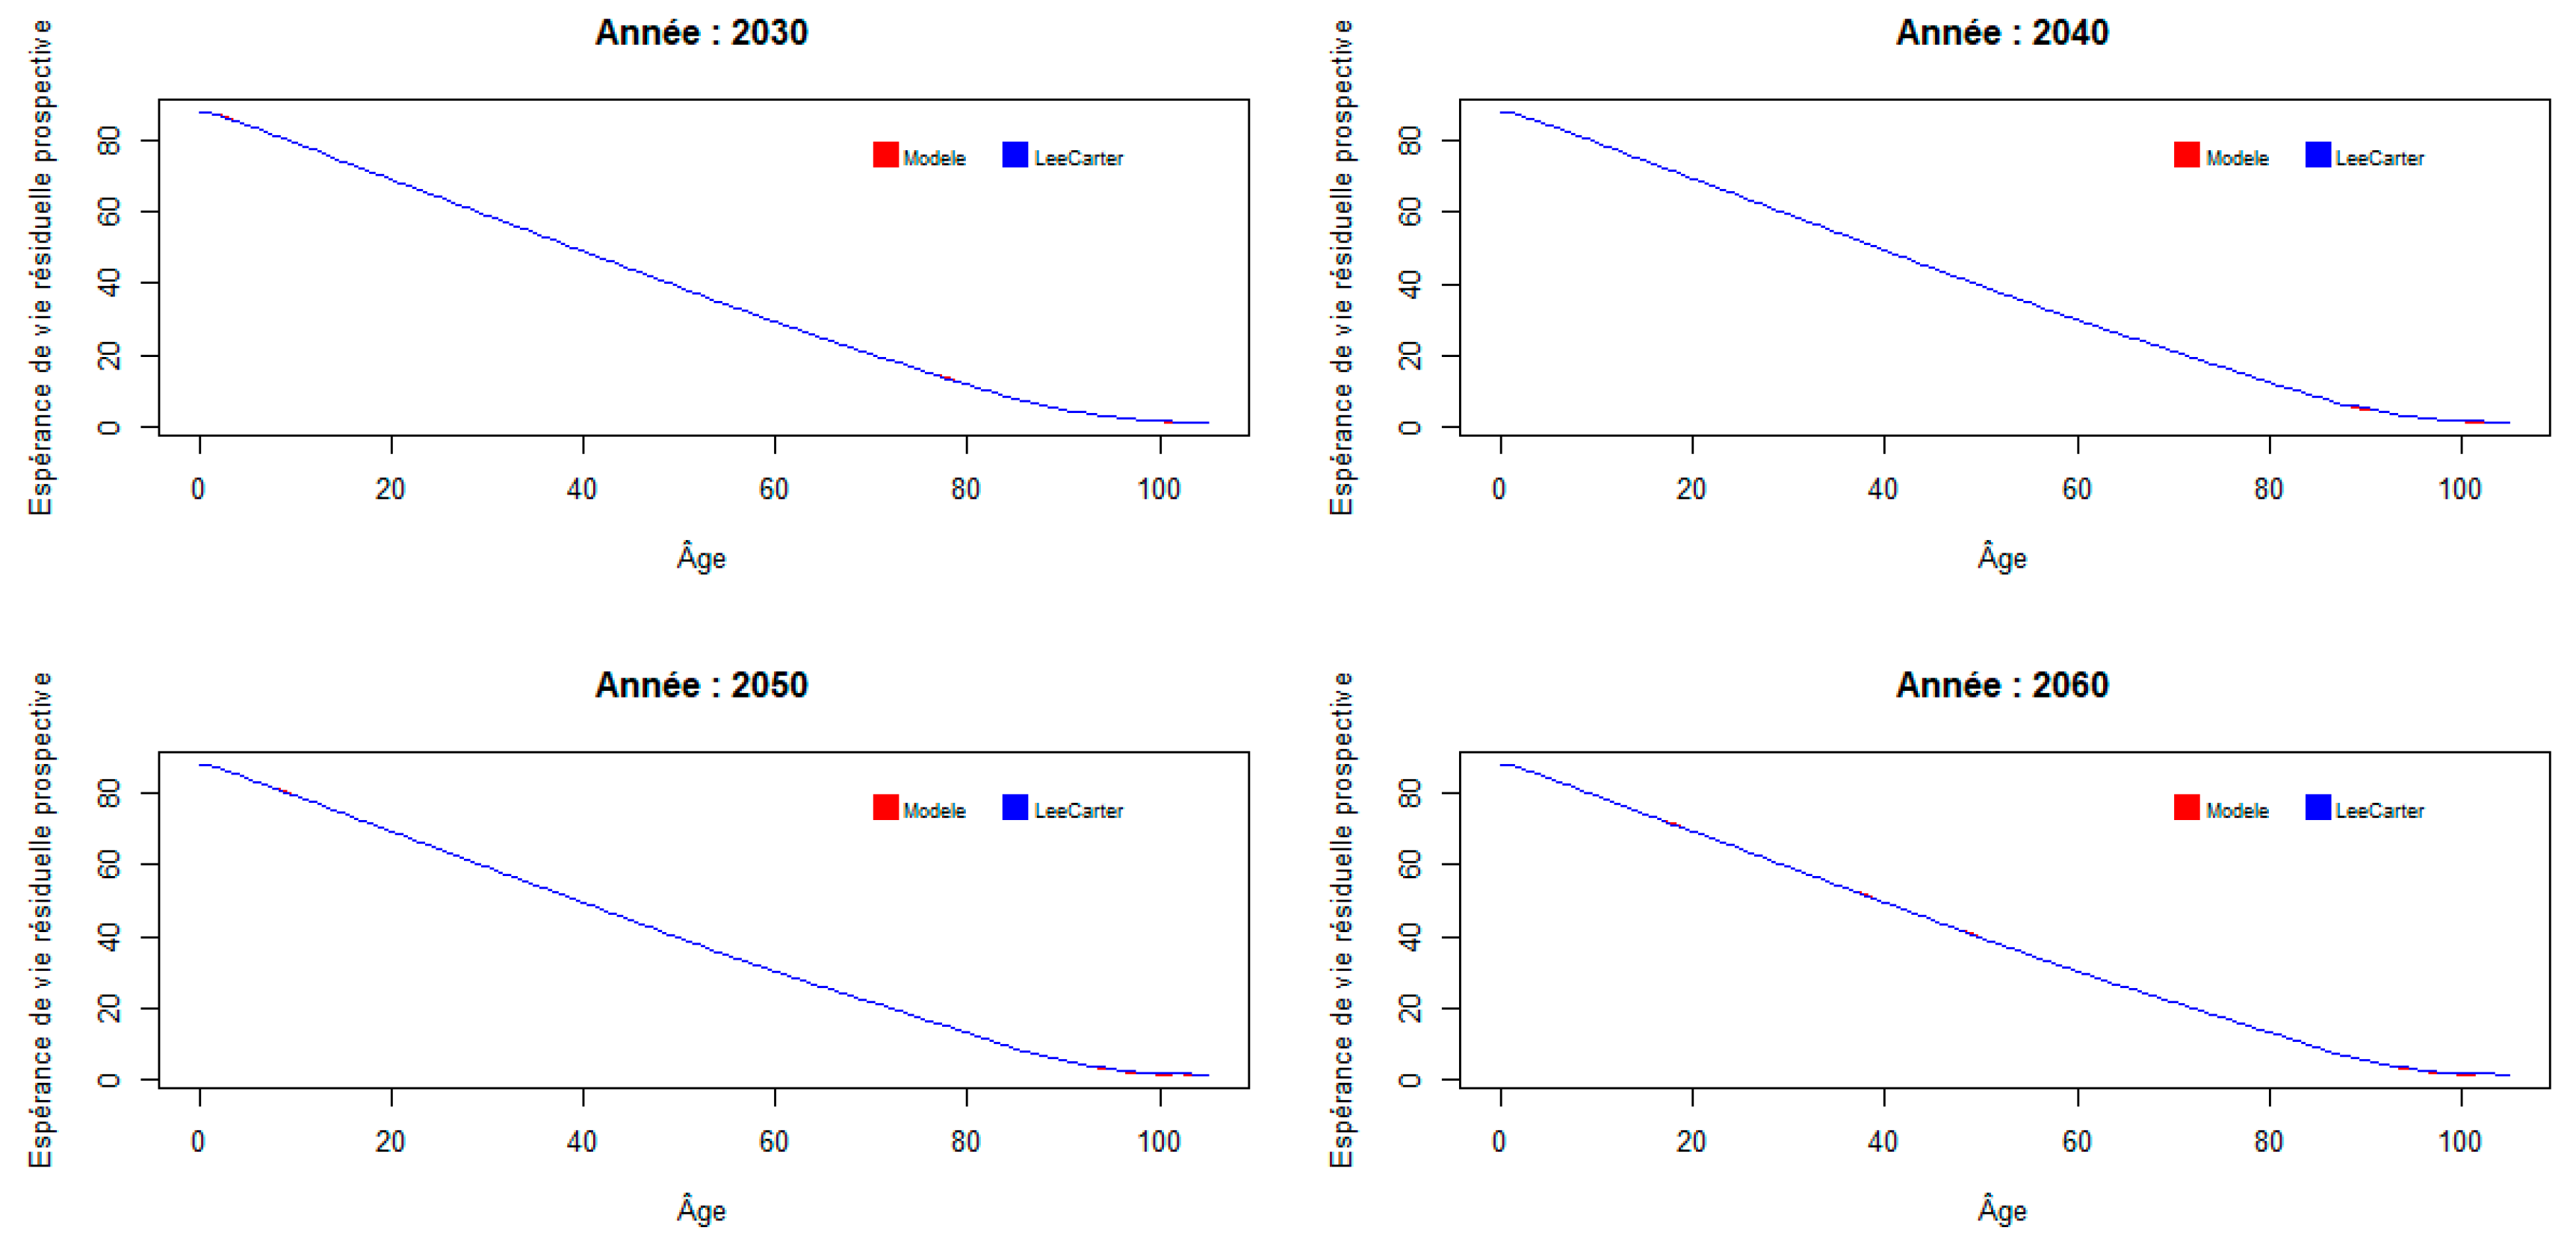
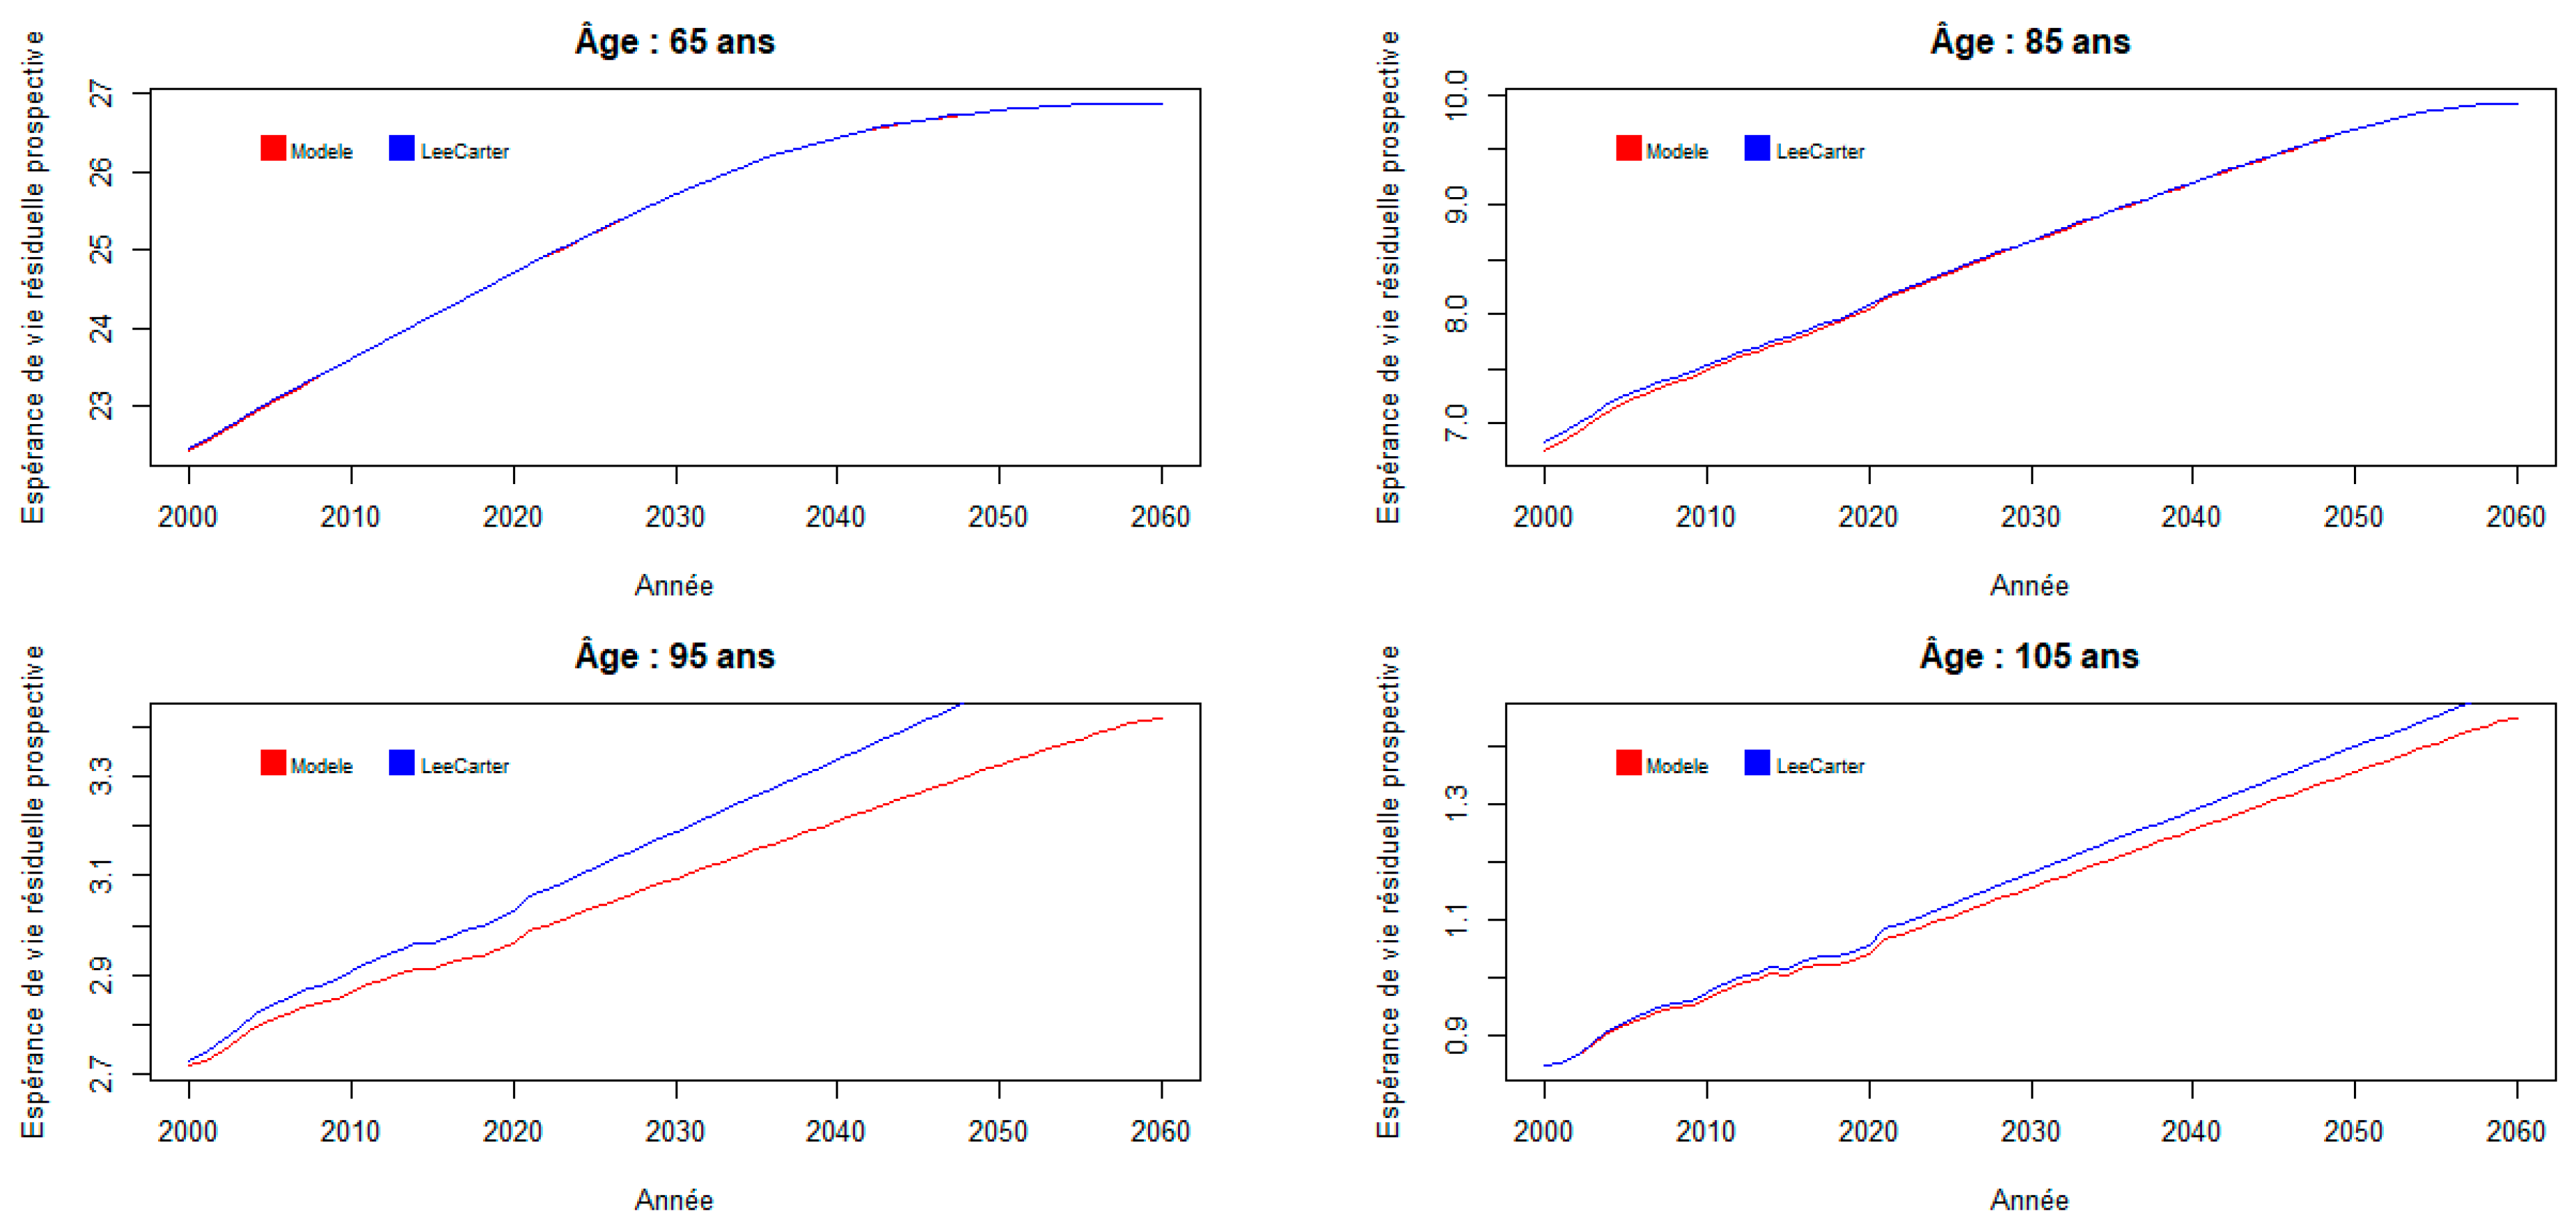
It is then possible to look at the consequences of the mortality model studied on prospective residual life expectancies, first by variable age for a few fixed years, then by variable year for a few fixed ages.
As shown in the following figure, it appears that the mortality model studied does not greatly change prospective residual life expectancies compared to the reference mortality model, except possibly at high ages:
Figure 8.
Trends in prospective residual life expectancy by age.
An enlargement of these graphs at older ages is shown below, with the algebraic difference between the two models for each year:
Figure 9.
Change in prospective residual life expectancy from age 90 to 105.
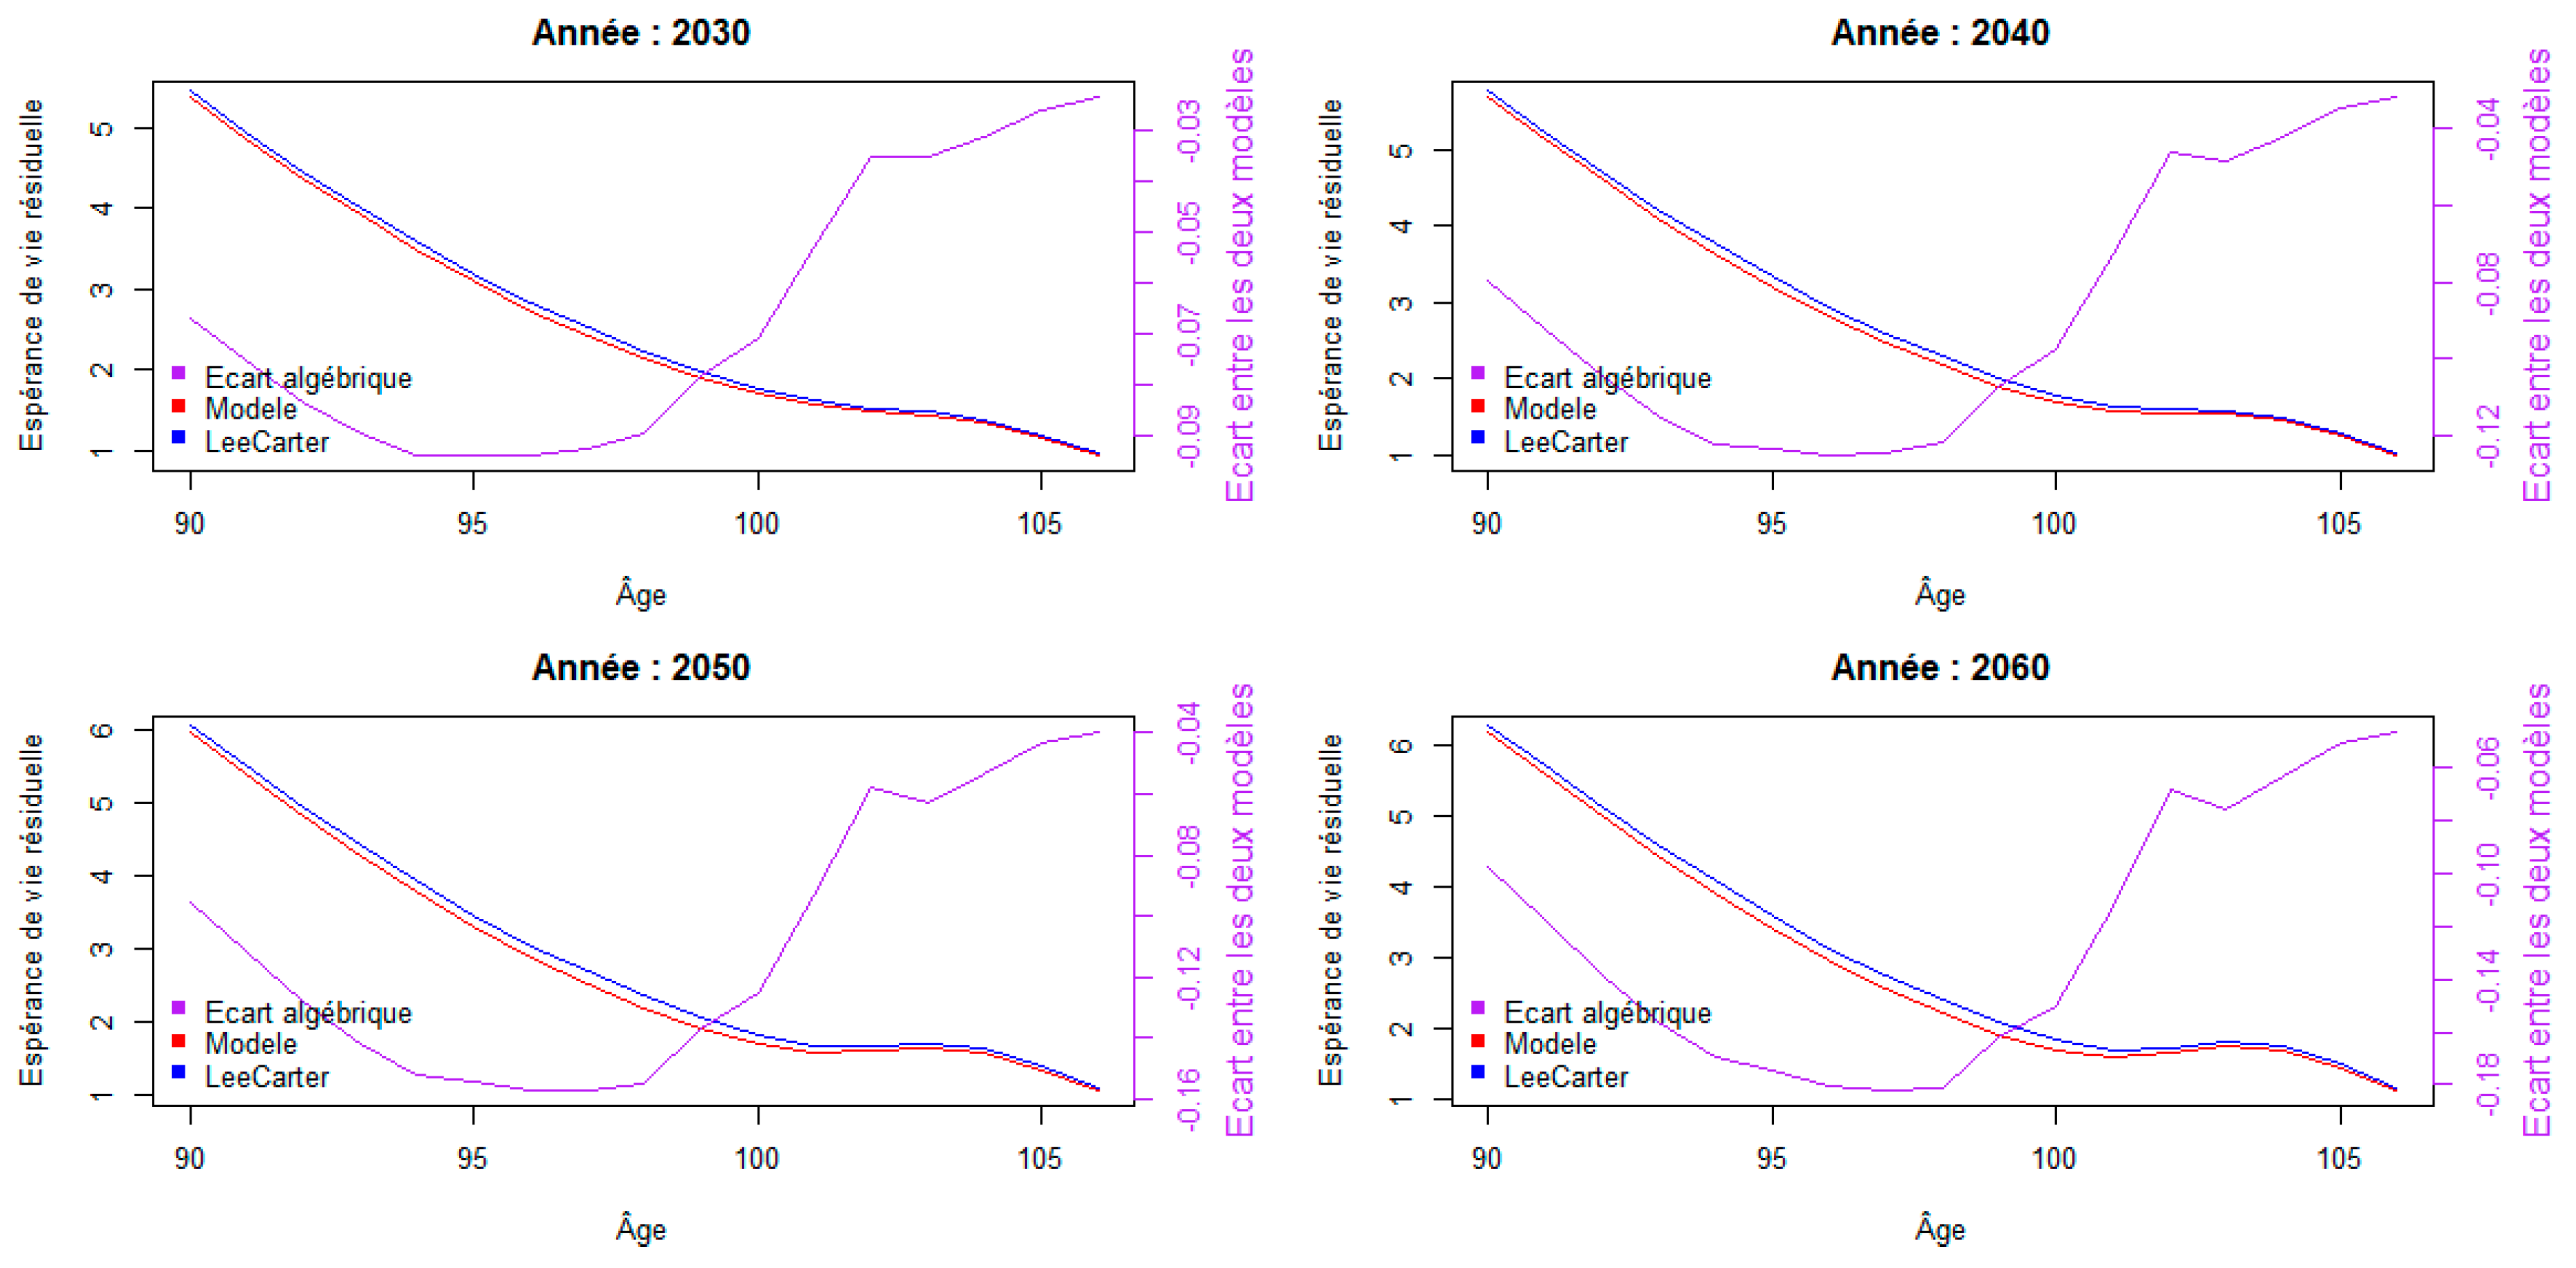
The maximum absolute difference between the two models is found at age 96 for the year 2060, and is worth 0.18, or around 65 days.
In this analysis, we return to the observation made in the previous section: it is at older ages that the difference with the reference Lee-Carter model is most marked.
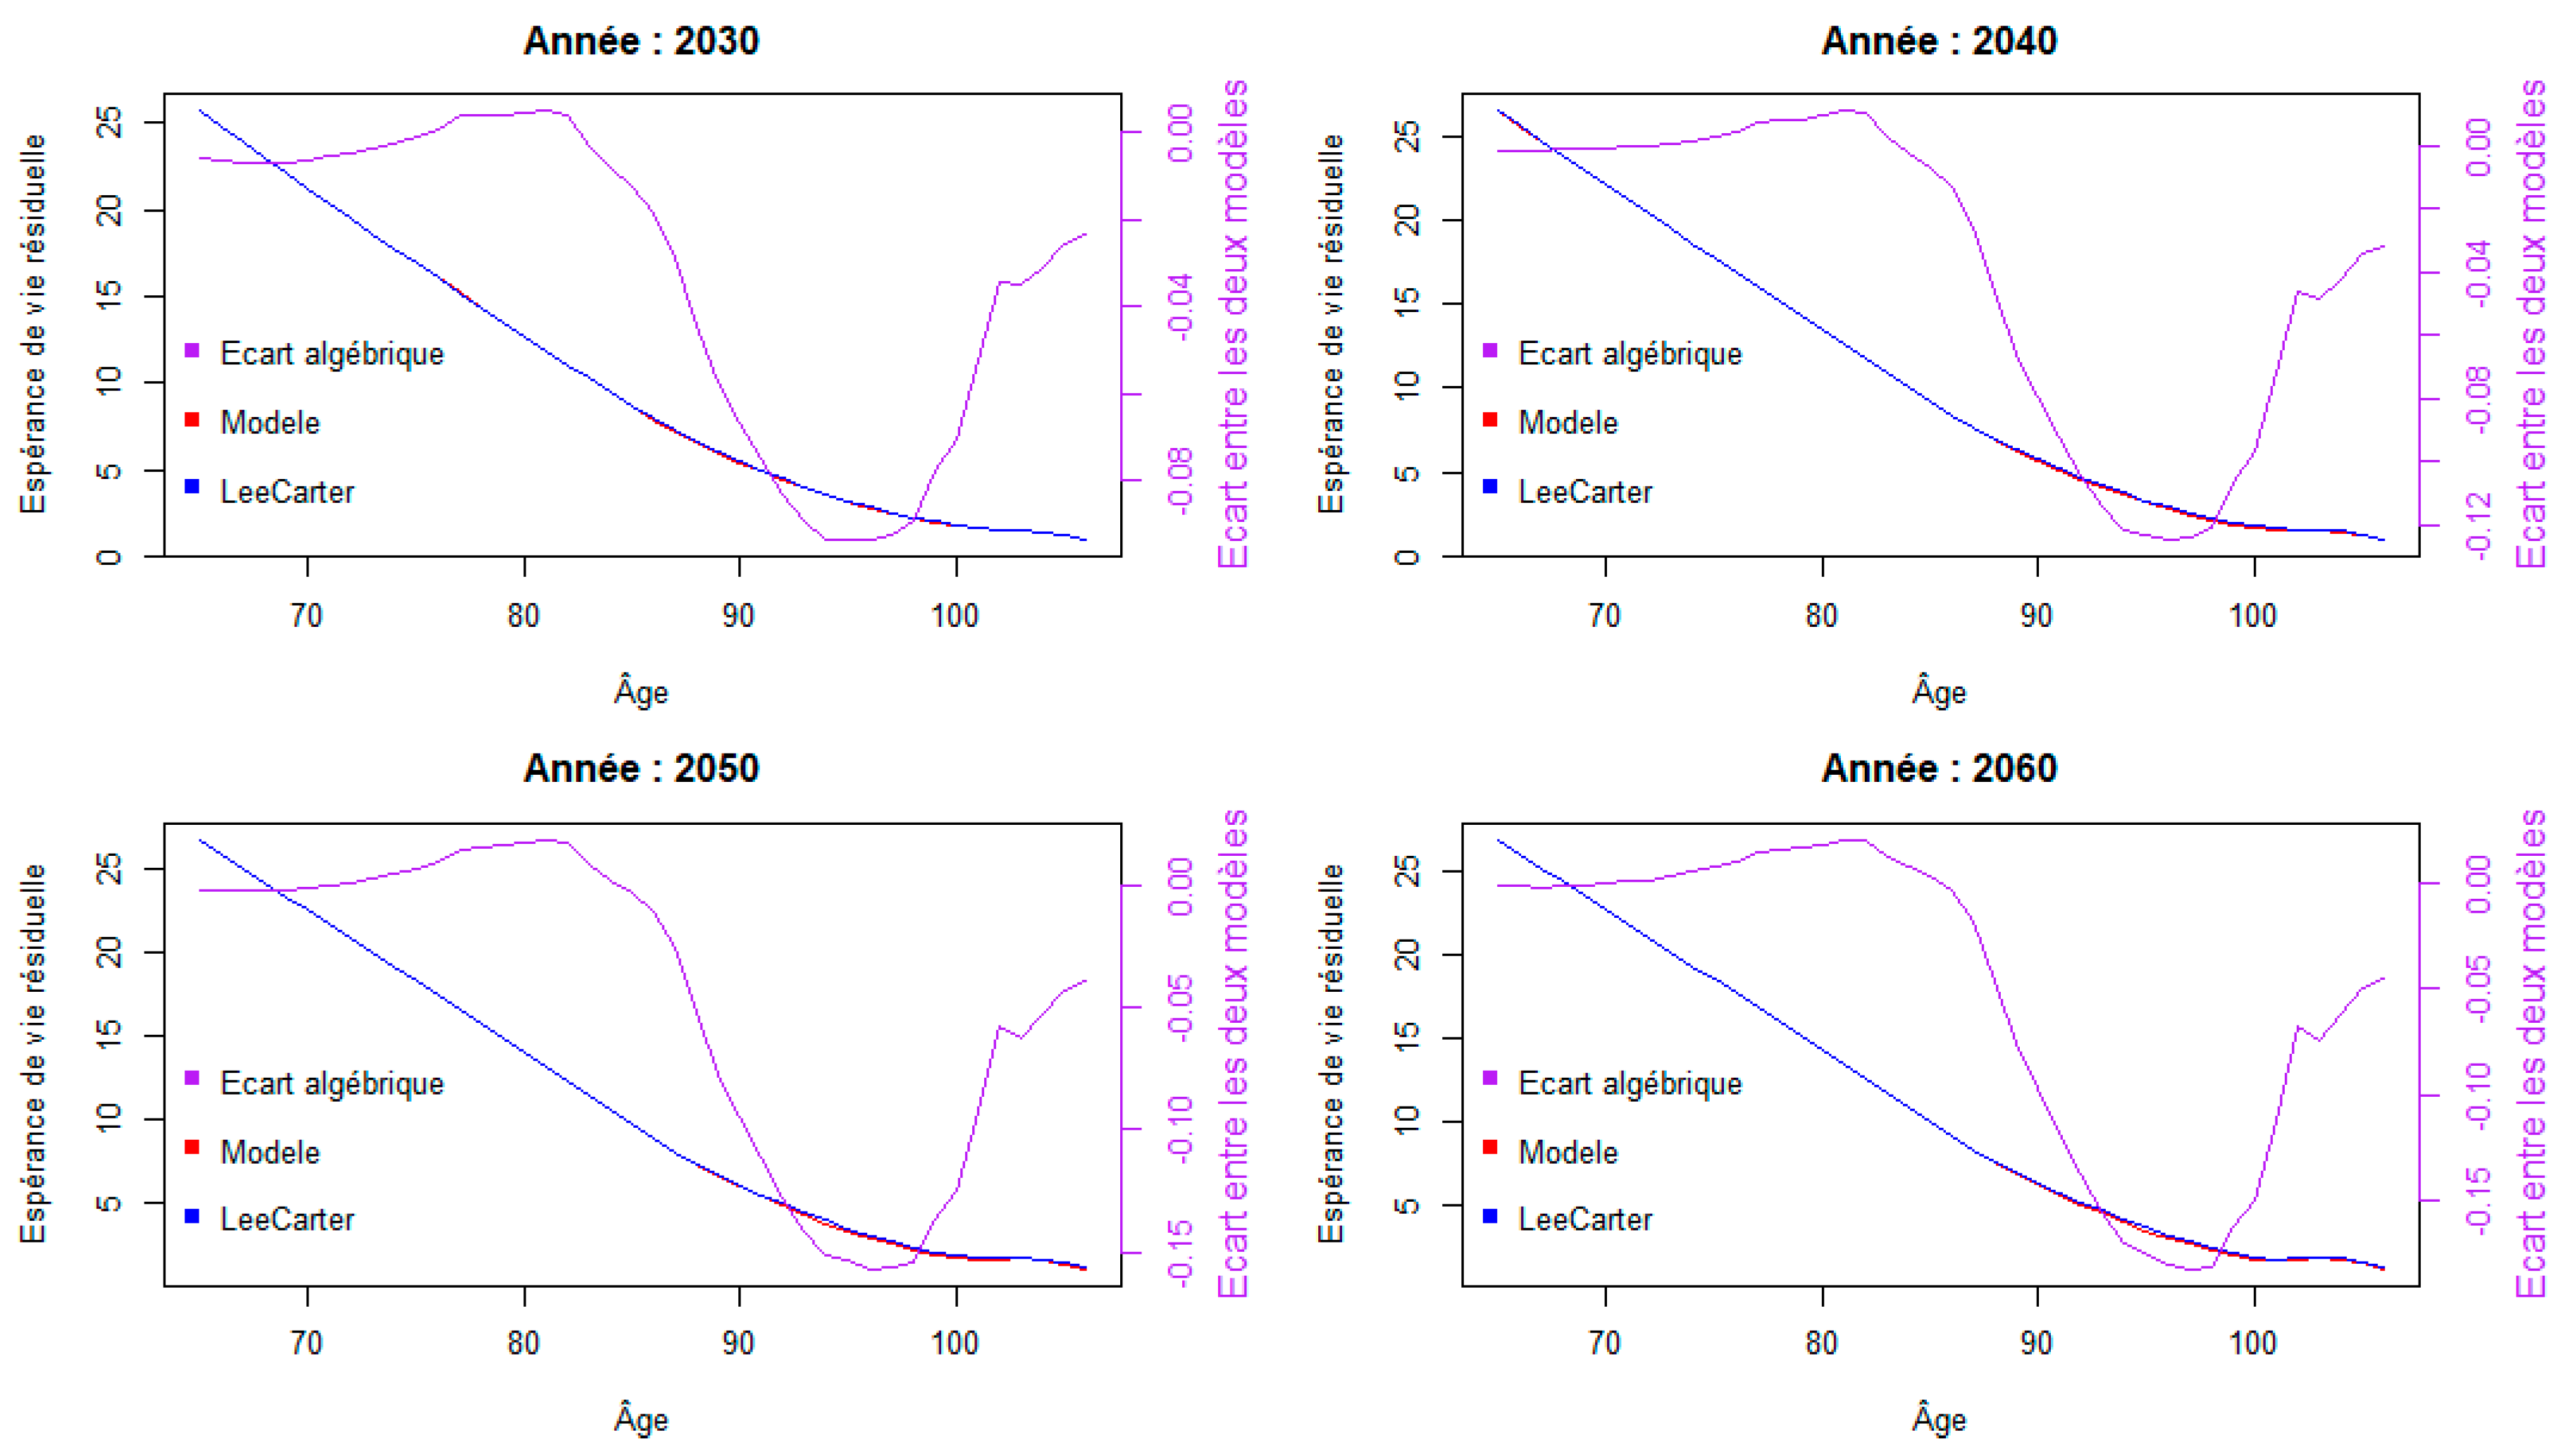
Figure 10.
Prospective residual life expectancy by year.
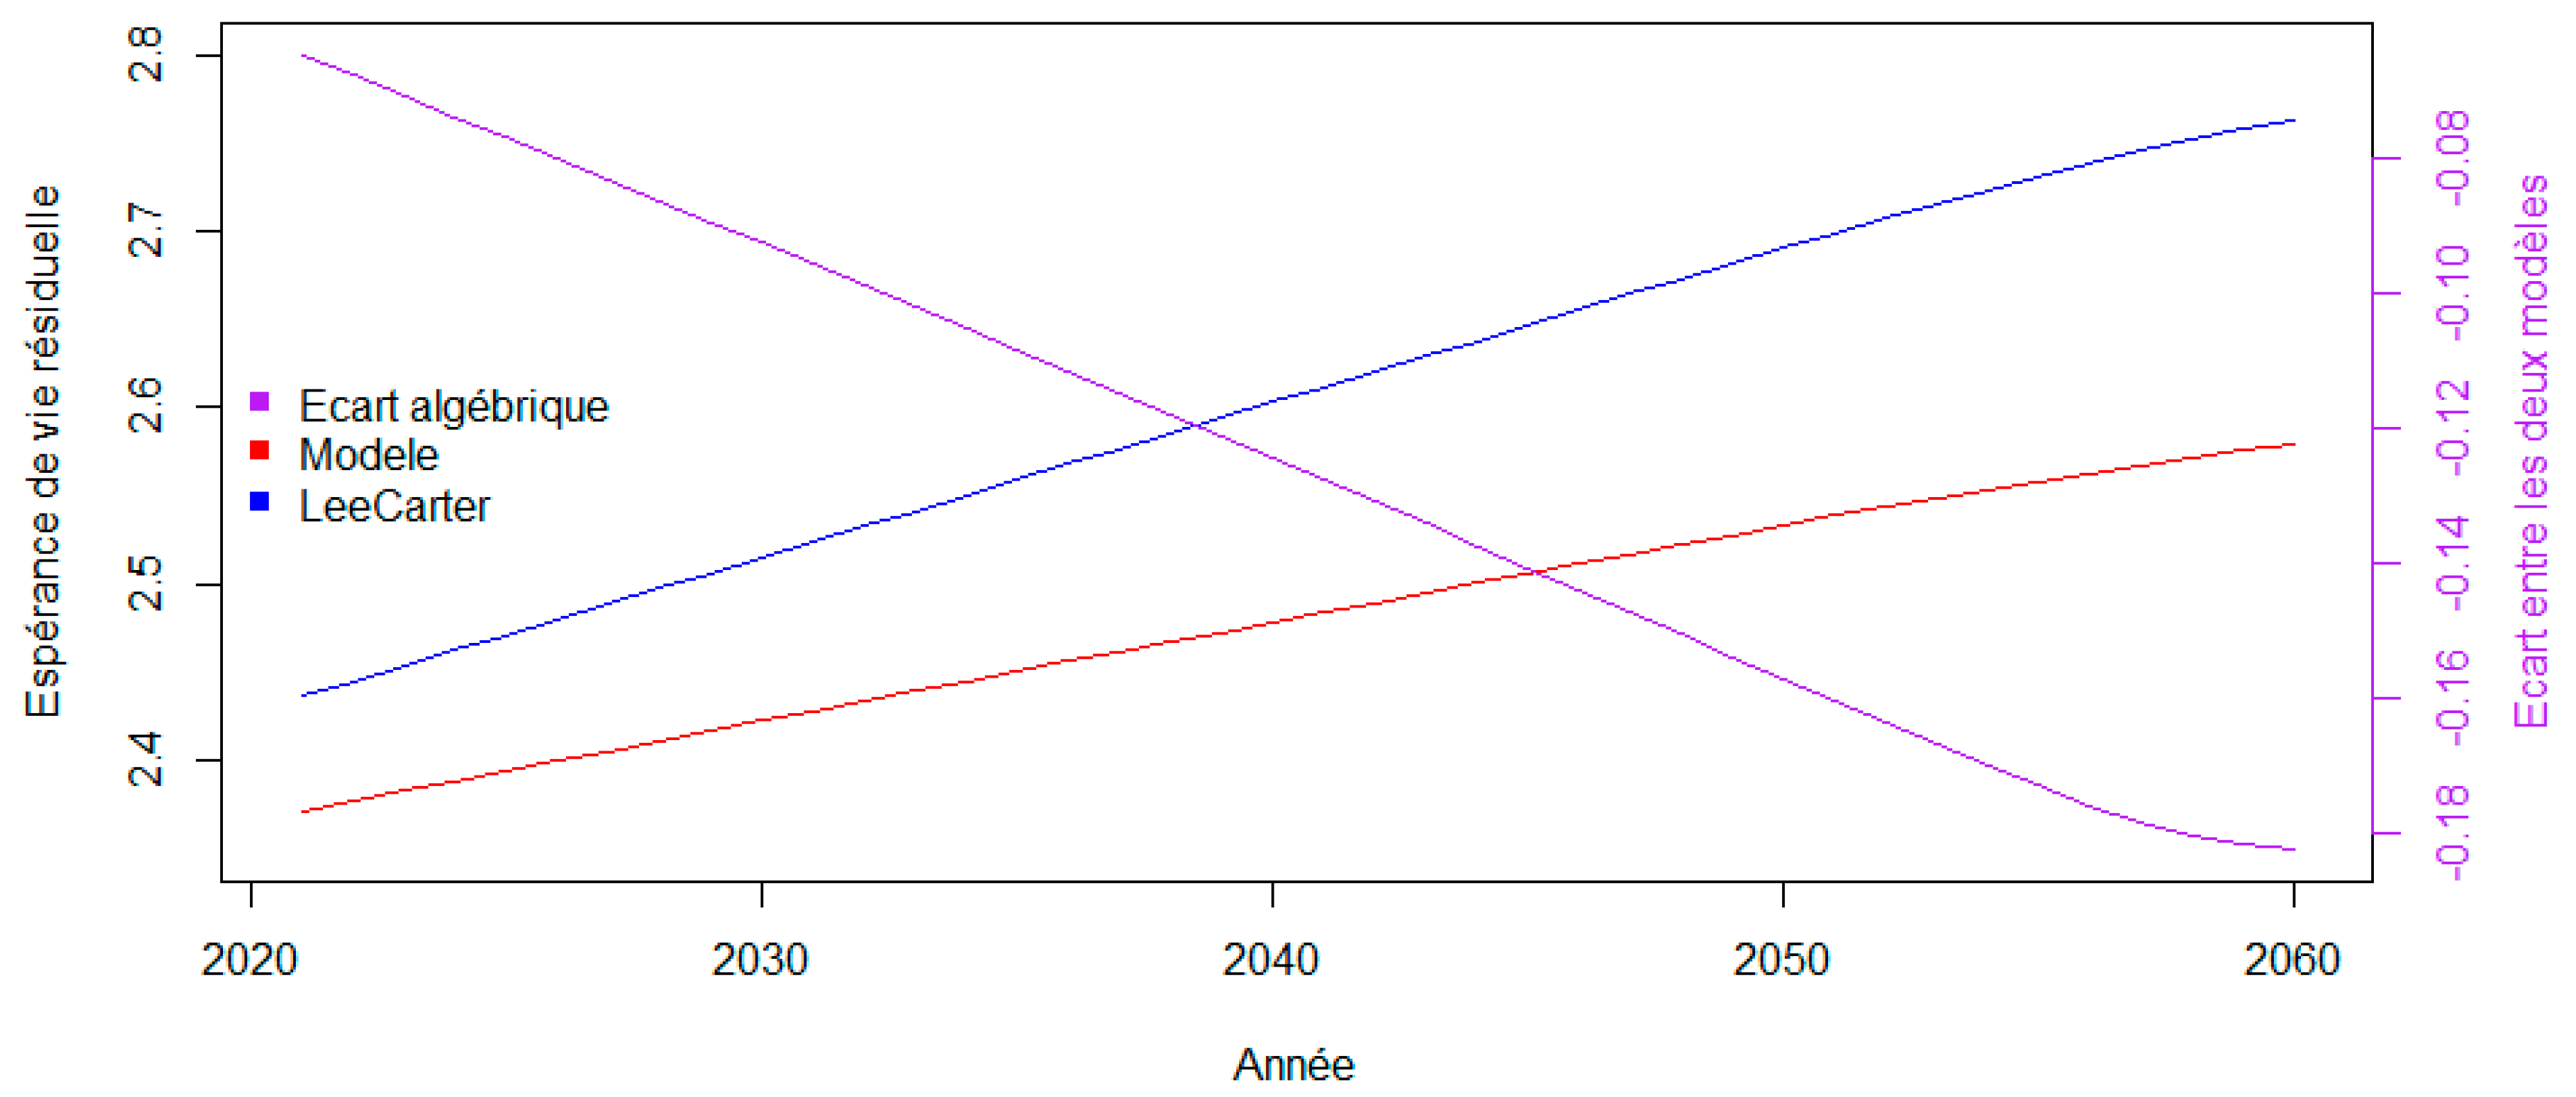
Below is an enlargement for age 96 with the algebraic difference between the two models:
Figure 11.
Trend in prospective residual life expectancy by year at age 96.
d. Sensitivity to Fragility Parameter
The volatility of fragility is estimated at 4.3%; however, over a longer period, this parameter can be higher, for example (https://www.ressources-actuarielles.net/C1256F13006585B2/0/39B54166464089AFC12572B0003D88C2/$FILE/20230921_FP.pdf?OpenElement) from 1982 to 2022, it comes out at 5.5%.
With this level of volatility, we note that ; 9% being the excess mortality rate (https://actudactuaires.typepad.com/laboratoire/2021/03/mortalit%C3%A9-en-france-en-2020-suite.html) for the year 2020, we can deduce that the probability of observing excess mortality at this level is of the order of 5%. Furthermore, , which corresponds to the mortality shock for the “mortality” risk module of the delegated regulation.
On the basis of the central table adjusted above, the prospective residual life expectancies associated with a volatility coefficient of 5.5% are recalculated using
which leads to the following results:
Figure 12.
Evolution of prospective residual life expectancies from age 65 to 105 for selected years, with a new volatility coefficient.
Figure 12.
Evolution of prospective residual life expectancies from age 65 to 105 for selected years, with a new volatility coefficient.
There is no significant difference between the two models with this new volatility setting.
e. Consequences for the Capital Requirement of an Annuity Plan
The presence of the frailty factor therefore has no material impact on central tendency indicators (mortality forces, residual life expectancies, etc.).
However, the random nature of the mortality distribution in a given year has consequences for the assessment of the capital required to protect against adverse deviations in mortality. In the specific context of a life annuity plan, we are therefore led, following a logic analogous to that of the Solvency 2 standard, to consider the 99.5% quantile of the distribution of residual life expectancies induced by frailty. For each age from 60 to 100, we obtain the following results for the ratio between this quantile and the expectation:
Figure 13.
Ratio between 99.5% quantile and expectation (SCR).
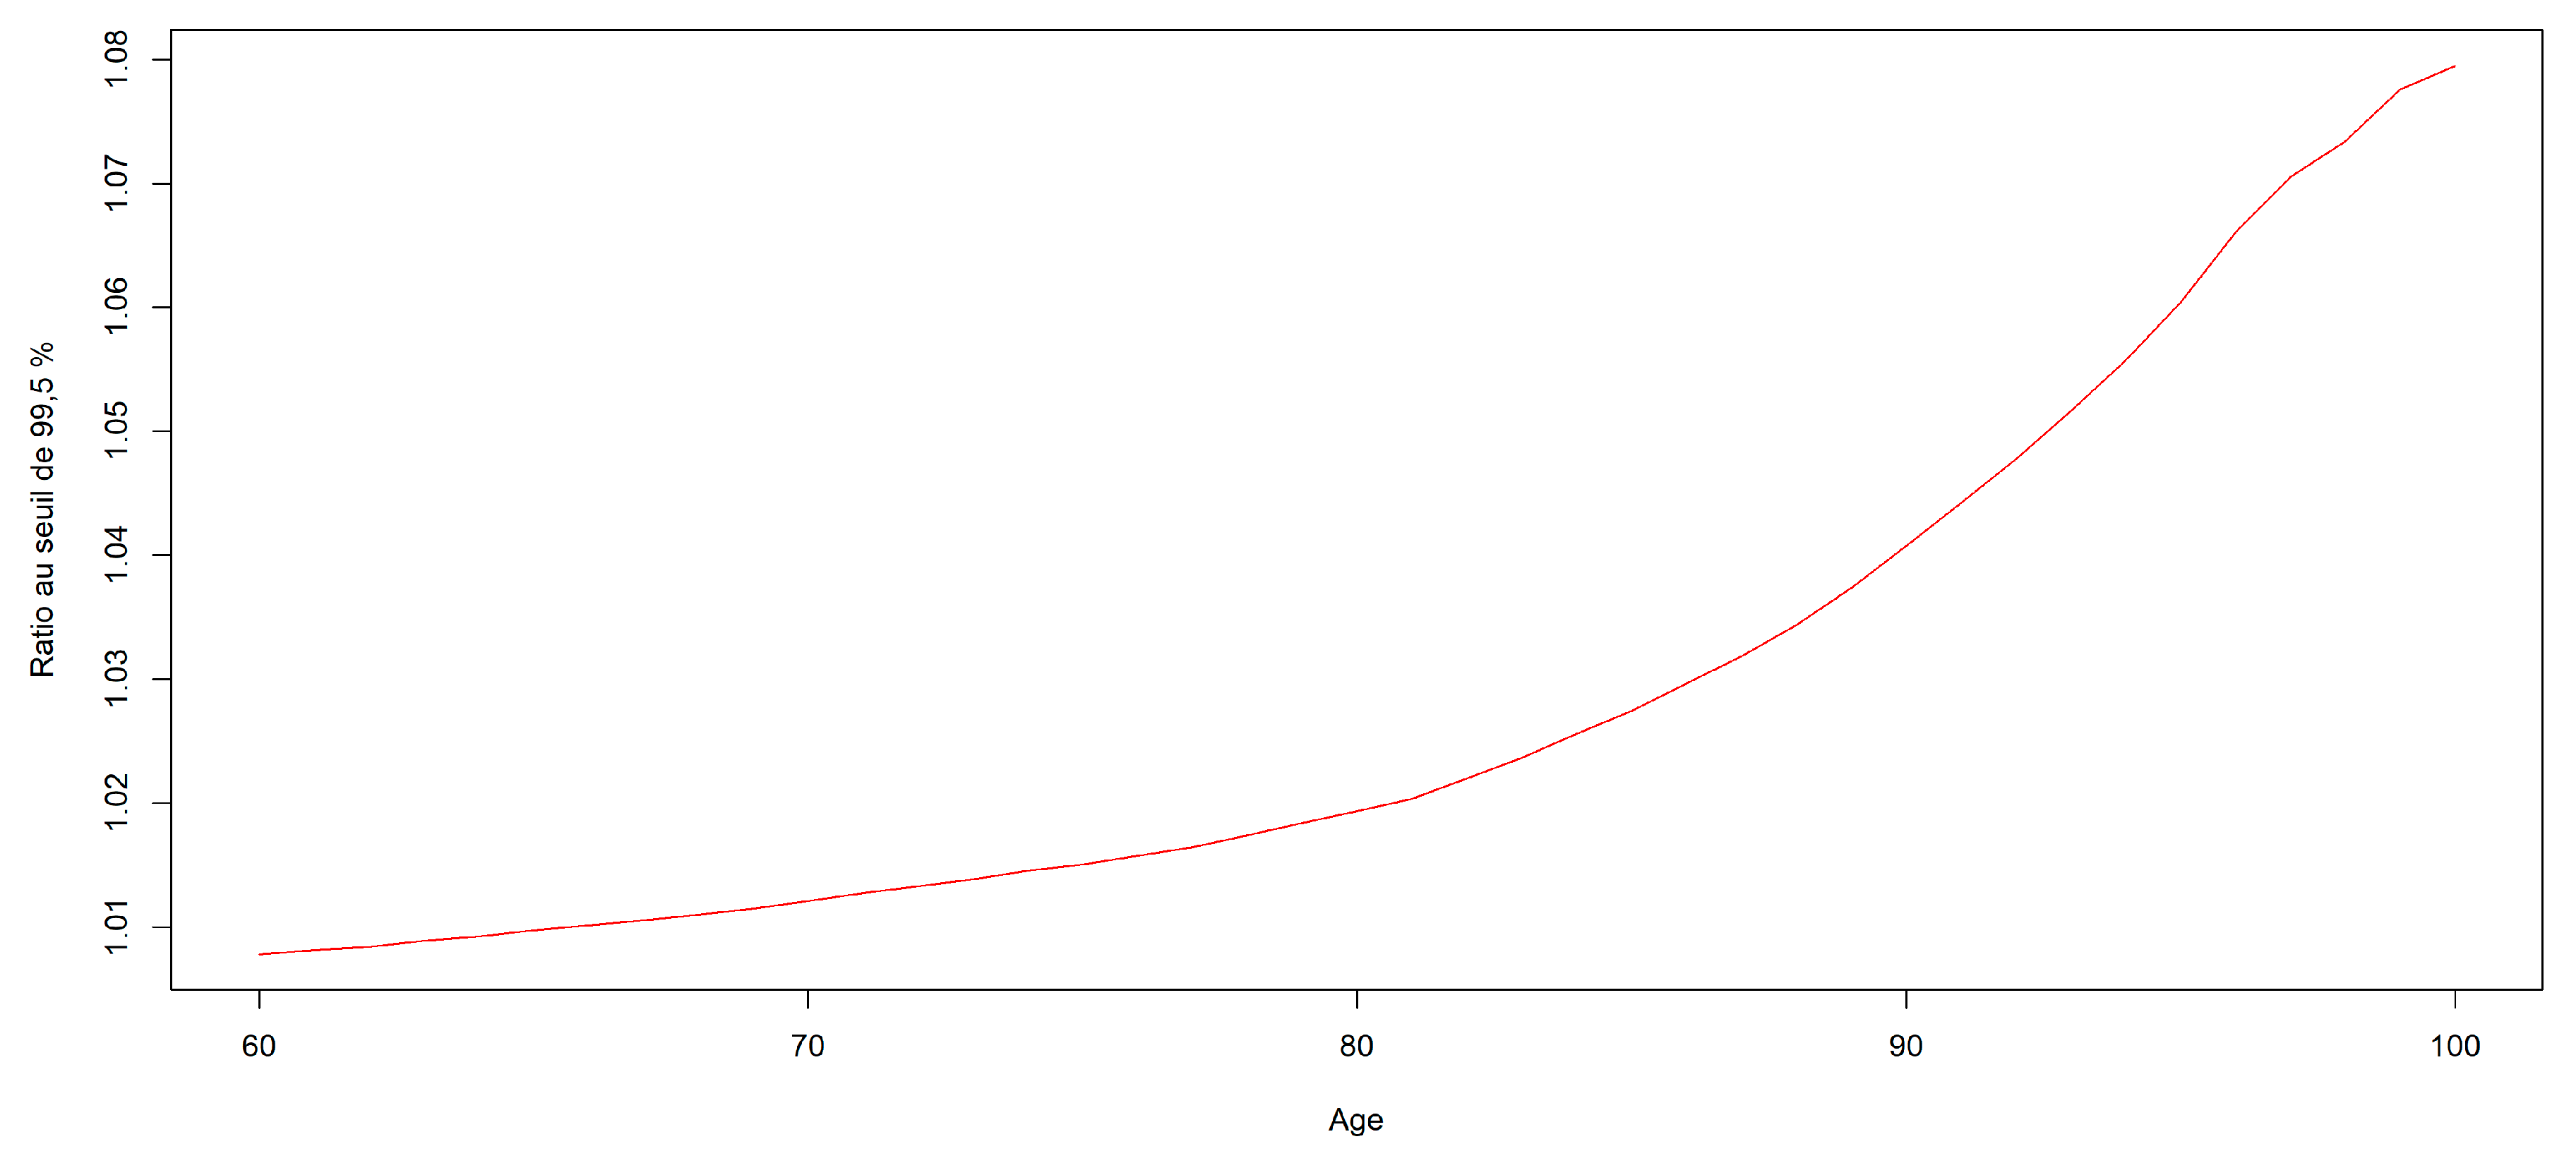
Weighted by the age structure of the French population, the average ratio is around 101.3%.
For its part, the delegated regulation (EU Delegated Regulation n°2015/35: https://eur-lex.europa.eu/legal-content/FR/TXT/?uri=CELEX:32015R0035) imposes a 20% discount on death rates when calculating the SCR associated with longevity risk (cf. art. 138 of delegated regulation EU n°2015/35), which leads to a capital requirement equal to 10% of the expectation.
This means that the volatility observed in annual death rates explains around 12% of the longevity SCR.
4. Conclusions and Discussion
The use of a Gamma frailty model enables us to correctly account for the annual variations in mortality levels observed throughout France.
Incorporating these variations into the fitting of a forward-looking log-Poisson model poses no major difficulty, and a two-stage parameter estimation process enables us to use conventional likelihood maximization algorithms.
The results obtained show that the impact of this additional volatility is negligible on the central tendency indicators.
On the other hand, there is a material impact on the capital requirement associated with longevity risk, with just under 15% of this requirement being induced by the presence of this volatility. The remainder is associated with uncertainty about the trend in death rates.
Thus, while the main hazard associated with the construction of a prospective mortality table remains the uncertainty attached to the determination of the trend (see Juillard et al. [2008] and Juillard and Planchet [2006] for detailed analyses on this point), taking into account these short-term fluctuations in mortality levels provides a better understanding of the determinants of longevity risk.
Appendix A
Table A1.
Calibrated model coefficients.
| Alpha | |||||||||||||
|---|---|---|---|---|---|---|---|---|---|---|---|---|---|
| Age | Model studied |
LC reference model |
Age | Model studied |
LC reference model |
Age | Model studied |
LC reference model |
|||||
| 0 | -5,6542 | -5,6553 | 36 | -7,0173 | -7,0186 | 72 | -4,0422 | -4,0456 | |||||
| 1 | -7,3447 | -7,3457 | 37 | -6,9390 | -6,9396 | 73 | -3,9592 | -3,9625 | |||||
| 2 | -8,2790 | -8,2804 | 38 | -6,8474 | -6,8480 | 74 | -3,8668 | -3,8713 | |||||
| 3 | -8,6679 | -8,6695 | 39 | -6,7630 | -6,7633 | 75 | -3,7867 | -3,7882 | |||||
| 4 | -8,9672 | -8,9721 | 40 | -6,6729 | -6,6733 | 76 | -3,6851 | -3,6862 | |||||
| 5 | -9,0765 | -9,0803 | 41 | -6,5862 | -6,5867 | 77 | -3,5790 | -3,5803 | |||||
| 6 | -9,1958 | -9,2028 | 42 | -6,4878 | -6,4880 | 78 | -3,4774 | -3,4791 | |||||
| 7 | -9,2892 | -9,2924 | 43 | -6,3872 | -6,3877 | 79 | -3,3674 | -3,3679 | |||||
| 8 | -9,4087 | -9,4124 | 44 | -6,2849 | -6,2854 | 80 | -3,2163 | -3,2216 | |||||
| 9 | -9,3935 | -9,4009 | 45 | -6,1800 | -6,1803 | 81 | -3,0838 | -3,0881 | |||||
| 10 | -9,4223 | -9,4329 | 46 | -6,0917 | -6,0922 | 82 | -2,9510 | -2,9556 | |||||
| 11 | -9,3577 | -9,3662 | 47 | -5,9813 | -5,9817 | 83 | -2,8178 | -2,8236 | |||||
| 12 | -9,2768 | -9,2809 | 48 | -5,8840 | -5,8845 | 84 | -2,6937 | -2,7014 | |||||
| 13 | -9,1674 | -9,1742 | 49 | -5,7947 | -5,7952 | 85 | -2,5725 | -2,5850 | |||||
| 14 | -8,9411 | -8,9443 | 50 | -5,7068 | -5,7077 | 86 | -2,4381 | -2,4498 | |||||
| 15 | -8,6907 | -8,6949 | 51 | -5,6157 | -5,6166 | 87 | -2,3015 | -2,3126 | |||||
| 16 | -8,4690 | -8,4721 | 52 | -5,5399 | -5,5411 | 88 | -2,1619 | -2,1733 | |||||
| 17 | -8,2022 | -8,2047 | 53 | -5,4596 | -5,4605 | 89 | -2,0266 | -2,0390 | |||||
| 18 | -7,9805 | -7,9814 | 54 | -5,3712 | -5,3722 | 90 | -1,8871 | -1,9001 | |||||
| 19 | -7,7424 | -7,7441 | 55 | -5,2853 | -5,2866 | 91 | -1,7522 | -1,7651 | |||||
| 20 | -7,6642 | -7,6654 | 56 | -5,2062 | -5,2078 | 92 | -1,6216 | -1,6351 | |||||
| 21 | -7,6042 | -7,6051 | 57 | -5,1270 | -5,1289 | 93 | -1,4936 | -1,5072 | |||||
| 22 | -7,5935 | -7,5952 | 58 | -5,0598 | -5,0611 | 94 | -1,3657 | -1,3777 | |||||
| 23 | -7,5824 | -7,5837 | 59 | -4,9902 | -4,9925 | 95 | -1,2453 | -1,2594 | |||||
| 24 | -7,5520 | -7,5540 | 60 | -4,9156 | -4,9178 | 96 | -1,1239 | -1,1367 | |||||
| 25 | -7,5513 | -7,5531 | 61 | -4,8551 | -4,8570 | 97 | -1,0154 | -1,0262 | |||||
| 26 | -7,5195 | -7,5211 | 62 | -4,7853 | -4,7877 | 98 | -0,9056 | -0,9177 | |||||
| 27 | -7,4982 | -7,4995 | 63 | -4,7165 | -4,7182 | 99 | -0,8059 | -0,8166 | |||||
| 28 | -7,4795 | -7,4816 | 64 | -4,6552 | -4,6571 | 100 | -0,7093 | -0,7208 | |||||
| 29 | -7,4393 | -7,4409 | 65 | -4,5875 | -4,5894 | 101 | -0,6286 | -0,6345 | |||||
| 30 | -7,3880 | -7,3899 | 66 | -4,5141 | -4,5163 | 102 | -0,5389 | -0,5481 | |||||
| 31 | -7,3594 | -7,3607 | 67 | -4,4558 | -4,4580 | 103 | -0,4581 | -0,4679 | |||||
| 32 | -7,3008 | -7,3012 | 68 | -4,3774 | -4,3802 | 104 | -0,4095 | -0,4185 | |||||
| 33 | -7,2536 | -7,2544 | 69 | -4,2982 | -4,3005 | 105 | -0,4625 | -0,4652 | |||||
| 34 | -7,1764 | -7,1771 | 70 | -4,2170 | -4,2209 | ||||||||
| 35 | -7,1106 | -7,1110 | 71 | -4,1381 | -4,1415 | ||||||||
| Beta | |||||||||||||
| Age |
Model studied |
LC reference model |
Age |
Model studied |
LC reference model |
Age |
Model studied |
LC reference model |
|||||
| 0 | 0,0033 | 0,0033 | 36 | 0,0120 | 0,0120 | 72 | 0,0070 | 0,0071 | |||||
| 1 | 0,0115 | 0,0115 | 37 | 0,0115 | 0,0115 | 73 | 0,0070 | 0,0071 | |||||
| 2 | 0,0114 | 0,0114 | 38 | 0,0123 | 0,0123 | 74 | 0,0075 | 0,0077 | |||||
| 3 | 0,0118 | 0,0117 | 39 | 0,0119 | 0,0118 | 75 | 0,0090 | 0,0091 | |||||
| 4 | 0,0130 | 0,0131 | 40 | 0,0129 | 0,0129 | 76 | 0,0094 | 0,0094 | |||||
| 5 | 0,0121 | 0,0118 | 41 | 0,0134 | 0,0135 | 77 | 0,0097 | 0,0097 | |||||
| 6 | 0,0097 | 0,0102 | 42 | 0,0140 | 0,0140 | 78 | 0,0096 | 0,0097 | |||||
| 7 | 0,0145 | 0,0146 | 43 | 0,0137 | 0,0137 | 79 | 0,0099 | 0,0098 | |||||
| 8 | 0,0119 | 0,0121 | 44 | 0,0135 | 0,0136 | 80 | 0,0136 | 0,0129 | |||||
| 9 | 0,0126 | 0,0127 | 45 | 0,0132 | 0,0133 | 81 | 0,0139 | 0,0134 | |||||
| 10 | 0,0144 | 0,0138 | 46 | 0,0136 | 0,0137 | 82 | 0,0141 | 0,0137 | |||||
| 11 | 0,0114 | 0,0118 | 47 | 0,0128 | 0,0127 | 83 | 0,0142 | 0,0137 | |||||
| 12 | 0,0165 | 0,0162 | 48 | 0,0122 | 0,0122 | 84 | 0,0115 | 0,0107 | |||||
| 13 | 0,0143 | 0,0142 | 49 | 0,0108 | 0,0108 | 85 | 0,0083 | 0,0073 | |||||
| 14 | 0,0151 | 0,0151 | 50 | 0,0106 | 0,0106 | 86 | 0,0065 | 0,0057 | |||||
| 15 | 0,0155 | 0,0151 | 51 | 0,0099 | 0,0099 | 87 | 0,0059 | 0,0054 | |||||
| 16 | 0,0180 | 0,0182 | 52 | 0,0093 | 0,0093 | 88 | 0,0056 | 0,0052 | |||||
| 17 | 0,0171 | 0,0171 | 53 | 0,0093 | 0,0093 | 89 | 0,0057 | 0,0054 | |||||
| 18 | 0,0185 | 0,0187 | 54 | 0,0095 | 0,0094 | 90 | 0,0051 | 0,0049 | |||||
| 19 | 0,0183 | 0,0180 | 55 | 0,0093 | 0,0092 | 91 | 0,0049 | 0,0048 | |||||
| 20 | 0,0170 | 0,0169 | 56 | 0,0082 | 0,0080 | 92 | 0,0044 | 0,0046 | |||||
| 21 | 0,0158 | 0,0158 | 57 | 0,0082 | 0,0081 | 93 | 0,0039 | 0,0041 | |||||
| 22 | 0,0146 | 0,0146 | 58 | 0,0067 | 0,0066 | 94 | 0,0026 | 0,0030 | |||||
| 23 | 0,0156 | 0,0156 | 59 | 0,0061 | 0,0059 | 95 | 0,0023 | 0,0027 | |||||
| 24 | 0,0132 | 0,0134 | 60 | 0,0050 | 0,0049 | 96 | 0,0016 | 0,0024 | |||||
| 25 | 0,0126 | 0,0127 | 61 | 0,0042 | 0,0041 | 97 | 0,0008 | 0,0014 | |||||
| 26 | 0,0113 | 0,0115 | 62 | 0,0039 | 0,0038 | 98 | -0,0005 | 0,0004 | |||||
| 27 | 0,0111 | 0,0112 | 63 | 0,0040 | 0,0039 | 99 | -0,0013 | -0,0006 | |||||
| 28 | 0,0107 | 0,0108 | 64 | 0,0042 | 0,0042 | 100 | -0,0002 | -0,0001 | |||||
| 29 | 0,0088 | 0,0088 | 65 | 0,0038 | 0,0038 | 101 | 0,0018 | 0,0022 | |||||
| 30 | 0,0103 | 0,0102 | 66 | 0,0046 | 0,0046 | 102 | 0,0044 | 0,0047 | |||||
| 31 | 0,0111 | 0,0110 | 67 | 0,0050 | 0,0051 | 103 | 0,0046 | 0,0048 | |||||
| 32 | 0,0107 | 0,0106 | 68 | 0,0047 | 0,0047 | 104 | 0,0046 | 0,0053 | |||||
| 33 | 0,0105 | 0,0104 | 69 | 0,0059 | 0,0059 | 105 | 0,0046 | 0,0051 | |||||
| 34 | 0,0106 | 0,0105 | 70 | 0,0055 | 0,0055 | ||||||||
| 35 | 0,0114 | 0,0113 | 71 | 0,0063 | 0,0064 | ||||||||
| Kappa | |||||||||||||
| Age |
Model studied |
LC reference model |
Age |
Model studied |
LC reference model |
||||||||
| 2000 | 24,4565 | 24,4761 | 2030 | -43,8008 | -43,8043 | ||||||||
| 2001 | 24,4627 | 24,5265 | 2031 | -45,9908 | -45,9945 | ||||||||
| 2002 | 21,2073 | 21,2070 | 2032 | -48,1809 | -48,1847 | ||||||||
| 2003 | 18,4710 | 18,4083 | 2033 | -50,3709 | -50,3750 | ||||||||
| 2004 | 10,9651 | 10,9513 | 2034 | -52,5610 | -52,5652 | ||||||||
| 2005 | 9,4399 | 9,4231 | 2035 | -54,7510 | -54,7554 | ||||||||
| 2006 | 6,0386 | 6,0366 | 2036 | -56,9410 | -56,9456 | ||||||||
| 2007 | 3,1599 | 3,1578 | 2037 | -59,1311 | -59,1358 | ||||||||
| 2008 | 1,4649 | 1,4631 | 2038 | -61,3211 | -61,3260 | ||||||||
| 2009 | 1,6981 | 1,6984 | 2039 | -63,5112 | -63,5163 | ||||||||
| 2010 | -1,1863 | -1,1865 | 2040 | -65,7012 | -65,7065 | ||||||||
| 2011 | -4,7123 | -4,7140 | 2041 | -67,8912 | -67,8967 | ||||||||
| 2012 | -6,6593 | -6,6691 | 2042 | -70,0813 | -70,0869 | ||||||||
| 2013 | -8,5651 | -8,5639 | 2043 | -72,2713 | -72,2771 | ||||||||
| 2014 | -12,6304 | -12,6243 | 2044 | -74,4614 | -74,4673 | ||||||||
| 2015 | -9,8526 | -9,8338 | 2045 | -76,6514 | -76,6575 | ||||||||
| 2016 | -13,5803 | -13,5743 | 2046 | -78,8414 | -78,8478 | ||||||||
| 2017 | -15,8335 | -15,8386 | 2047 | -81,0315 | -81,0380 | ||||||||
| 2018 | -15,6887 | -15,6650 | 2048 | -83,2215 | -83,2282 | ||||||||
| 2019 | -16,4993 | -16,4493 | 2049 | -85,4116 | -85,4184 | ||||||||
| 2020 | -16,1564 | -16,2296 | 2050 | -87,6016 | -87,6086 | ||||||||
| 2021 | -24,0904 | -24,0924 | 2051 | -89,7916 | -89,7988 | ||||||||
| 2022 | -26,2805 | -26,2826 | 2052 | -91,9817 | -91,9891 | ||||||||
| 2023 | -28,4705 | -28,4728 | 2053 | -94,1717 | -94,1793 | ||||||||
| 2024 | -30,6606 | -30,6630 | 2054 | -96,3618 | -96,3695 | ||||||||
| 2025 | -32,8506 | -32,8532 | 2055 | -98,5518 | -98,5597 | ||||||||
| 2026 | -35,0406 | -35,0435 | 2056 | -100,7418 | -100,7499 | ||||||||
| 2027 | -37,2307 | -37,2337 | 2057 | -102,9319 | -102,9401 | ||||||||
| 2028 | -39,4207 | -39,4239 | 2058 | -105,1219 | -105,1304 | ||||||||
| 2029 | -41,6108 | -41,6141 | 2059 | -107,3120 | -107,3206 | ||||||||
| 2060 | -109,5020 | -109,5108 | |||||||||||
References
- Agalva E., Blanpain N. [2021] Projections de population 2021-2070, Insee Résultats.
- Bongaarts J. [2004] “Long-range trends in adults mortality: Models and projection methods”, Population Council. [CrossRef]
- Brouhns N., Denuit M., Vermunt J.K. [2002] A Poisson log-bilinear regression approach to the construction of projected lifetables, Insurance, Mathematic and Economics, vol. 31. [CrossRef]
- Currie I.; Durban M.; Eilers P. [2003] Using P-splines to extrapolate two-dimensional Poisson data, Proceedings of 18th International Workshop on Statistical Modelling, Leuven, Belgium.
- Debonneuil E. [2015] Parametric age-dependent mortality model, for applications to retirement portfolios, Actuary’s Thesis, ISFA.
- Guilbaud C. [2018] Nouveaux modèles d’analyse et de projection de la mortalité, application a la population française, Mémoire d’actuaire, Dauphine.
- Guette V. |2010] La prise en compte des catastrophes dans la modélisation de la mortalité, Actuary thesis, ISFA.
- Juillard M., Planchet F., Thérond P.E. [2008] “Perturbations extrêmes sur la dérive de mortalité anticipée”, Assurances et gestion des risques, Vol. 76 (3).
- Juillard M., Planchet F. [2006] “Mesure de l’incertitude tendancielle sur la mortalité - application à un régime de rentes”, Assurances et gestion des risques, Vol. 75 (3). [CrossRef]
- Lee R. D., Carter L. [1992] “Modeling and forecasting us mortality”, Journal of the American statistical association 87(419), 659{671. [CrossRef]
- Planchet F., Thérond P.E. [2011] Modélisation statistique des phénomènes de durée - applications actuarielles, Paris : Economica.
- Robben J., Antonio K. [2023] Catastrophe risk in a stochastic multi-population mortality model, Working Paper. 2023; arXiv:2306.15271.
- Thatcher A.R. [1999] The Long-term Pattern of Adult Mortality and the Highest Attained Age, Journal of the Royal Statistical Society, 162, Part 1: 5-43. [CrossRef]
- Vaupel J. W., Manton K., Stallard E. [1979] “The impact of heterogeneity in individual frailty on the dynamics of mortality”, Demography, 16, pp. 439-454. [CrossRef]
- Ghalanos A. Theussl S. [2015] “Rsolnp: General Non-Linear Optimization”, https://cran.r-project.org/package=Rsolnp.
- Hyndman R. [2023] “demography: Forecasting Mortality, Fertility, Migration and Population Data”, https://cran.r-project.org/package=demography.
Disclaimer/Publisher’s Note: The statements, opinions and data contained in all publications are solely those of the individual author(s) and contributor(s) and not of MDPI and/or the editor(s). MDPI and/or the editor(s) disclaim responsibility for any injury to people or property resulting from any ideas, methods, instructions or products referred to in the content. |
© 2024 by the authors. Licensee MDPI, Basel, Switzerland. This article is an open access article distributed under the terms and conditions of the Creative Commons Attribution (CC BY) license (http://creativecommons.org/licenses/by/4.0/).
Copyright: This open access article is published under a Creative Commons CC BY 4.0 license, which permit the free download, distribution, and reuse, provided that the author and preprint are cited in any reuse.


