

Submitted:
27 July 2023
Posted:
28 July 2023
You are already at the latest version
Abstract
Stochastic mortality models seek to forecast future mortality rates; thus, apparently the objective variable should be the mortality rate expressed in the original scale. However, the performance of stochastic mortality models - in terms, that is, of their goodness-of-fit and prediction accuracy - is often based on the logarithmic scale of the mortality rate. In this article, we examine whether the same forecast outcomes are obtained when the performance of mortality models is assessed based on the original and log scales of the mortality rate. We compare four different stochastic mortality models: the original Lee-Carter model, the Lee-Carter model with (log-)normal distribution, the Lee-Carter model with Poisson distribution and the median Lee-Carter model. We show that the preferred model will depend on the scale of the objective variable, the selection criteria measure and the range of ages analysed.
Keywords:
Longevity risk
; stochastic mortality models
; Lee-Carter
; model selection
1. Introduction
Human longevity has steadily increased over the last 150 years. During the first half of that period, improvements in life expectancy were mainly attributable to the reduction in infant mortality; in the second half, improvements have been mainly driven by a fall in the mortality rates of the elderly (Wilmoth 2000). Increasing human longevity and ageing represent a major challenge with implications at many societal levels, including rising pressure on healthcare and welfare systems and a declining labour force relative to the overall population. In response, actuaries and demographers have paid increasing attention to the modelling and projection of mortality rates.
One of the most influential approaches to the stochastic modelling of future mortality has undoubtedly been the parametric non-linear regression model developed by Lee and Carter (1992). In the Lee-Carter (LC) model, the mortality rate is estimated by means of a non-linear combination of age and period parameters. Many subsequent attempts at developing mortality models have drawn inspiration from the LC model, including, but not limited to, Brouhns et al. (2002); Currie et al. (2004); Renshaw and Haberman (2003, 2006); Cairns et al. (2006) and Plat (2009). Following the introduction of the concept of mortality coherence by Li and Lee (2005) to indicate that mortality rates of related populations should not diverge infinitely, many articles have extended the LC model to focus, specifically, on such coherence. Mortality coherence of related populations has, thus, been considered in terms of gender (Li et al. 2021,Li 2013,Li et al. 2016,Yang et al. 2016,Pitt et al. 2018,Wong et al. 2020) and the countries constituting a given region (Enchev et al. 2017,Biffis et al. 2017,Chen and Millossovich 2018,Scognamiglio 2022). A related line of research, here, is that of age coherence, in which efforts are made to ensure that long-term predictions do not diverge infinitely among ages (Chang and Shi 2022,Li and Lu 2017,Gao and Shi 2021,Li and Shi 2021).
This burgeoning of models and construction procedures, however, has introduced another element to the study of future mortality, namely that of model selection. Indeed, various frameworks have been proposed to construct and select the most suitable model in the trade-off between complexity and parsimony (SriDaran et al. 2022,Hunt and Blake 2014,Barigou et al. 2021). The construction of the optimal model typically involves selecting a base (reference) model and deciding whether to incorporate additional parameters or functions under certain selection criteria. Alternative stochastic mortality models can be used as reference in the construction of the optimal mortality model. Here, most LC model extensions define the reference mortality model assuming a Gaussian error structure of the log mortality rates (Chang and Shi 2022,Li and Lu 2017,Gao and Shi 2021,Li and Shi 2021,SriDaran et al. 2022) or a Poisson distribution of deaths (Li et al. 2021,Li 2013,Li et al. 2016,Yang et al. 2016,Pitt et al. 2018,Wong et al. 2020,Enchev et al. 2017,Chen and Millossovich 2018,Hunt and Blake 2014,Barigou et al. 2021). A less common option for the reference mortality model is to assume a binomial distribution of annual death probabilities (Atance et al. 2020).
One issue that has not received sufficient research is the impact the selection criteria might have on the model selection decision. As Atance et al. (2020) stress, there is no single criterion for evaluating the goodness-of-fit and the prediction accuracy of stochastic mortality models. Selection criteria frequently rely on measures based on squared errors (Enchev et al. 2017,Chang and Shi 2022,Li and Lu 2017,Gao and Shi 2021,Li and Shi 2021, absolute errors Li et al. 2021,Li et al. 2016), maximum likelihood (Yang et al. 2016,Pitt et al. 2018) or in a combination of these measures (Li 2013,Wong et al. 2020,Chen and Millossovich 2018,Atance et al. 2020). Additionally, even the same selection criteria measures are often defined based on either mortality rate predictions (estimates) (Chen and Millossovich 2018,Atance et al. 2020) or log mortality rate predictions (estimates) (Li and Lee 2005,Li et al. 2021,Wong et al. 2020,Enchev et al. 2017,Chang and Shi 2022,Li and Lu 2017,Gao and Shi 2021,Li and Shi 2021). Elsewhere, others have used a combination of measures based on mortality rates expressed on both original and log scales (Li 2013,Li et al. 2016).
The goal of the present article is to evaluate the implications of choosing selection criteria measures for the reference LC stochastic model based on either mortality rates or log mortality rates. The model selection measures used in this study are based on squared and absolute errors. To undertake this evaluation, we analyse the performance of stochastic reference mortality models, for a set of countries, in terms of their goodness-of-fit and prediction accuracy when the selection measures are based on either original mortality rates or log mortality rates. In so doing, we compare four alternative reference mortality models: namely, the original LC model (LC), the LC model with (log-)normal distribution (LN-LC), the LC model with Poisson distribution (P-LC) and the median LC model (M-LC).
Reference stochastic mortality models are rarely compared in the literature. Claims have been made to the effect that the Poisson assumption provides a more rigorous statistical framework for analysing mortality data and that counting random variables is a more natural choice than that of modelling the death rate (Li 2013,Wong et al. 2020,Cairns et al. 2009). However, Gaussian and Poisson LC models have not been compared to date in terms of their goodness-of-fit and prediction accuracy, with the exception of Brouhns et al. (2002), who compared the two models solely in terms of the goodness-of-fit of Belgian mortality rates, concluding that the Poisson LC model performed better for ages above 90. Here, by comparing the use of selection criteria measures based on mortality rates in either the original or log scales, we seek to determine if the preference for the Gaussian or Poisson assumption is conditional on the scale involved. While Santolino (2020) introduced the LC quantile stochastic model to estimate the quantiles of the log mortality rate, here, we focus our attention on the median LC model as a specific version of the LC quantile model that models the median log mortality rate (Santolino 2021). Recall that the mean is the value that minimizes the squared error while the median minimizes the absolute error. Thus, we also seek to determine whether the median LC model is the preferred choice when absolute error based selection measures are used in both the log and original scales.
Finally, we also examine whether the selection of the preferred reference mortality model also depends on the interval of ages considered. In the actuarial field, the mortality patterns of greatest interest are often those manifest at more advanced ages. Most life insurance products are defined so as to provide longevity protection, given that individuals receiving a lifetime income may live longer than accounted for in the valuation of the provision of insurer liabilities (longevity risk). Annuities are usually deferred to retirement. Pension funds and annuity providers need to effectively manage the longevity risk to which they are exposed for future improvements in mortality at the ages at which periodic payments are made (OECD 2014). In this study, therefore, we analyse the performance of the four reference mortality models under the alternative selection criterion measures at ages both below and above 50 years old.
The rest of this article is structured as follows. In Section (Section 2) we introduce our notation. Our motivation for the study is provided in Section (Section 3). Stochastic parametric mortality models are described in Section (Section 4). We present an application in Section (Section 5). The analysis is illustrated for a population divided in age intervals in Section (Section 6). Finally, a discussion is provided in Section (Section 7).
2. Notation
Let the random variable denote the number of deaths in a population at age x and calendar year t, and . The central rate of mortality is defined as , where is the central exposed to risk at age x in year t. The estimated and predicted central rates of mortality are denoted as and , respectively.
Two measures have been preferred in the literature to compare fitted and predicted values: the sum of the squared error and the sum of the absolute percentage error (or their respective mean values). The sum of the squared error in log scale () is defined as
and the sum of the absolute percentage error in log scale () as
These measures can be defined to evaluate prediction accuracy as follows. Let us consider that data until the calendar year were used to calibrate mortality models, for . The sum of the squared predicted error in log scale () is defined as
and the sum of the absolute percentage predicted error in log scale () as
In line with Li and Lee (2005) who proposed to use the explanation ratio to compare models, here, we use this ratio to evaluate the prediction accuracy of our models. If we consider that for , the explanation ratio in log scale can be defined as
Equivalent measures can be derived for mortality rates in the original scale. The sum of the squared error () is defined as
the sum of the absolute percentage error () as
the sum of the squared predicted error () as
and the sum of the absolute percentage predicted error () as
Finally, the explanation ratio R can be defined as
A review of these and other selection measures used in the literature, including the mean absolute error, is provided by Atance et al. (2020).
3. Motivation
To illustrate differences in the analysis of mortality rates in log scale and in the original scale, we consider the 2020 mortality rate of the Spanish male population for ages between 0 and 100 years. Data are obtained from the Human Mortality Database (HMD 2023). Let us assume that two stochastic mortality models were used to forecast the mortality rates for Spanish males. Model A predicted a higher mortality rate for each age below that of 50 and a higher rate for each age above 50. In contrast, model B predicted a higher mortality rate for each age below that of 50 and a higher mortality rate for each age above 50. Figure 1 shows the mortality rate predictions made by the two models and the observed Spanish male mortality rate - on the left, as represented in logarithmic scale; on the right, as represented in the original scale.
Figure 1 (left) shows that both model predictions are equally acceptable; however, their prediction accuracy differs when mortality rates in the original scale are analysed (Figure 1, right). When squared errors of the log mortality rates are compared, the SSPEL of models A and B take the same value (); thus, the choice of model is indifferent. However, the prediction accuracy of both models differs when the sum of the squared error of mortality rates in the original scale is analysed. In this case model A is preferred: SSPE of model A vs. SSPE of model B However, the opposite holds if the sum of the absolute percentage error is analysed. Prediction accuracy is different in log scale: SAPPEL of model A vs. SAPPEL of model B Thus, model A would be preferred. However, the choice of models is indifferent when the sum of the absolute percentage error is compared in the original scale: SAPPE of both models A and B
4. Stochastic mortality models
4.1. Lee-Carter stochastic mortality model
The original Lee-Carter mortality model, introduced in 1992, can be defined as follows (Lee and Carter 1992):
where and are the specific age parameters and the time-varying index, and . Finally, the error has mean 0 and variance . Within this framework, infinite solutions exist. For any scalars c and d, the following transformations give unaltered fitted values. To overcome the lack of identifiability, Lee and Carter (1992) proposed two constraints and .
The conditional expectation in (1) is equal to
The expectation is the value that minimizes the sum of squared errors. One strategy for estimating the parameters is to minimize the squared residuals; however, this model cannot be directly estimated by ordinary least squares because the right-hand side of equation (1) is not linear with the parameters. To estimate the coefficients, Lee and Carter (1992) proposed the application of singular value decomposition (SVD), that is, decomposing the matrix of log mortality rates once the average over time of log age-specific rates has been subtracted. By so doing it, a vector of coefficient estimates is obtained, . Note that, in general, it does not hold that The authors suggested recalibrating by iterative processes to match the estimated number of deaths with the observed number of deaths in period t,
where is the observed number of deaths in period t and at age x. The motivation for this second-stage estimate is to avoid sizeable discrepancies between the numbers of predicted and actual deaths which are likely to occur because the first step is based on logarithms of death rates (Lee and Carter 1992,Brouhns et al. 2002). In this study, we consider the original LC model (without second-stage recalibration) for purposes of comparison with the LC model with lognormal error distribution (see Section 4.2).
4.2. Lee-Carter model with known parametric distribution
The error term in (1) is often assumed to be normal distributed. In that case, it holds that is normal distributed with and variance , i.e. . This is equivalent to assuming that is lognormal distributed as follows,
with and variance .
Brouhns et al. (2002) reported that the logarithm of the observed mortality rates was much more variable at older ages and suggested modelling the number of deaths by means of a non-linear Poisson regression model with exposure-to-risk. The Poisson Lee-Carter model proposed by Brouhns et al. (2002) is represented as a generalized non-linear regression model as follows:
- The random component
where or, equivalently, .
- The systemic component
- The link function
In the case of the Poisson regression, the canonical link function g is the logarithmic function, so
or, equivalently,
Renshaw and Haberman (2006) showed that maximum likelihood estimates may be obtained under the Gaussian and Poisson structures using an iterative process. The quasi-Poisson non-linear regression is often used to account for the overdispersion of deaths. The extra dispersion parameter of the qausi-Poisson can be calculated separately from the deviance function (Wong et al. 2020). Currie (2016) showed that many common mortality models can be expressed in the standard terminology of generalized linear or non-linear models. Villegas et al. (2018) defined a unified framework of stochastic mortality which they refer to as generalized age-period-cohort (GAPC) stochastic mortality models, taking their inspiration from the definition of age-period-cohort models proposed by Hunt and Blake (2015), with the Poisson Lee-Carter model being identified as a particular case. These first authors developed the R package StMoMo to fit GAPC models using maximum log-likelihood.
Remark 1.
Assuming that is lognormal distributed with and variance is equivalent to assuming that is lognormal distributed with and variance . Likelihood selection measures, such as the Akaike information criterion (AIC) and the Bayesian information criterion (BIC), can be used for the lognormal and Poisson LC models. However, those measures should be used with caution when comparing the Poisson and lognormal deaths framework, since they involve a discrete and a continuous random variable, respectively.
4.3. Median Lee-Carter model
Let Y be a continuous random variable with finite expectation and cumulative distribution function defined by . The inverse function of is known as quantile function, Q. The quantile of order is defined as where . Santolino (2020) introduced the quantile Lee-Carter model equivalent to expression (1). Let us consider the following expression for the log mortality rate:
where superscript indicates the -quantile associated with the parameters. The error has -quantile equal to 0, . Thus, the quantile Lee-Carter model is defined as:
As in the case of the mean Lee-Carter regression model, to overcome the lack of identifiability, two constraints are established, namely and . The median case was investigated by Santolino (2021), i.e., . In the same way as the mean is the value that minimizes the sum of squared deviations, the median minimizes the sum of absolute deviations. The parameters of median LC regression can be estimated by least absolute techniques (Santolino 2020,Santolino 2021).
Median regression has many of the appealing properties of the ordinary sample median (Koenker 2005). Least absolute regression estimates are less sensitive to the presence of outliers than are ordinary least square regression estimates. Santolino (2021) showed that this feature is particularly appealing in the context of mortality rates since outliers are often observed (wars, pandemics, etc.). Another appealing property is that the median regression is stable under monotonic transformations. For any monotone function g, it holds that , so . Therefore, unlike in the original LC framework (Lee and Carter 1992), in the M-LC model a second-stage estimate would not be required. This second property is partially evaluated in this study since the log mortality rate is modelled in the M-LC design and the selection measures are based on the mortality rate in the log and original scales.
5. Application
To evaluate the models’ goodness-of-fit and prediction accuracy, the mortality rate of the male population in the age range was considered for a set of countries. Data were obtained from the Human Mortality Database (HMD 2023). In selecting the interval of years for each country, we chose the most recent period - with a minimum interval length of sixty years and a maximum of one hundred - for which complete mortality rates are available. Calendar years with null mortality rates for ages in the range were excluded since log mortality rates cannot deal with zeros. An alternative would have been to consider null mortality rates as missing values and to use statistical techniques to impute values (Scognamiglio 2022). However, we opted to exclude these calendar years to avoid any impact on our results attributable to the application of imputation techniques. Nine countries were compared (in parentheses the period considered in our analysis): Austria (), Belgium (), Canada (), France (), Italy (), Japan (), Spain (), UK () and USA (). The rest of the countries for which information was available presented null mortality rates for ages in the 0-100 range in at least one year in the last sixty and, so, were not included in the analysis.
5.1. Goodness-of-fit
The sum of squared errors for the nine countries when evaluating their respective mortality rates in logarithmic () and original scale () are shown in Table 1. The stochastic mortality model providing the lowest goodness-of-fit value is highlighted in bold for each country. In the logarithmic scale, the minimum sum of squared errors is observed for the LC with lognormal distribution (LN-LC) followed by the original LC model. When the sum of squared errors is analysed in the original scale (), the best fit is again provided by the LN-LC, but it is now followed by the P-LC and M-LC. The original LC framework would be our least preferred of the four when the sum of squared errors is evaluated in the original scale.
The sum of the absolute percentage error for the nine countries when the mortality rate was evaluated in the logarithmic () and original scales () are shown in Table 2. The lowest SAPEL value is provided by the M-LC model for six countries, so we would select this as our reference model when the minimum SAPEL criterion is applied. The other three models perform similarly in terms of SAPEL. When the minimum SAPE criterion is applied, the M-LC model would also be selected. In this case, the second best fit is provided by the original LC modelling approach.
5.2. Prediction accuracy
Stochastic mortality models seek to forecast future mortality; thus, their prediction accuracy is often more important than a particular model’s goodness-of-fit. The four mortality models compared herein have just one time dependent parameter: that is, the time-varying index in the LC, LN-LC and P-LC models and in the M-LC model. In other words, the dynamics of the mortality rates are captured by the set of estimated mortality indexes and , . Time-series techniques are used to project mortality indexes. For comparative purposes, in all cases, estimated mortality indexes are assumed to follow an autoregressive integrated moving average with drift, ARIMA().
To evaluate the models’ prediction accuracy, the following approach was followed. Model parameters were estimated with mortality data until calendar year 1990 and the model was then projected until either calendar year 2020 or the last year for which mortality data were available1. The sum of the squared prediction error and absolute percentage prediction error were computed in the logarithmic scale, and , and in the original scale, and . An additional year was then included in the model estimation, so that their parameters were estimated with mortality data until 1991. Mortality projections were made to the last year for which data were available and prediction errors were computed. The process was repeated with an additional year being included each time in the model estimation. In the last step, the parameters were estimated with mortality data up to and including the penultimate calendar year for which mortality data were available and, thus, mortality was projected one year ahead.
Table 3 displays in percentage terms the number of times that each model performed best in terms of the minimum squared prediction error and the absolute percentage prediction error in log and original scales. When prediction accuracy is evaluated in terms of the lowest squared prediction error in log scale, the LN-LC model performed best (), followed by the LC model () and the M-LC model (). However, the lowest sum of absolute prediction percentage error in log scale was most frequently obtained by the M-LC model (), closely followed by the P-LC model (). When prediction accuracy is evaluated in terms of the lowest sum of the squared prediction error in the original scale, the P-LC model performed best (). The P-LC model also recorded the best performance in terms of obtaining the lowest sum of the absolute percentage prediction error, but now closely followed by the M-LC model ( and , respectively).
While Table 3 provides information as to just how often a model performed best in terms of the lowest selection measure value, it says nothing about how accurate the prediction was. Table 4 addresses this by showing the average explanation ratio for the four models in the log scale and the original scale On average, the explanation ratio in log scale for both the LC and LN-LC models was , followed by the M-LC () and, finally, the P-LC model with the lowest mean explanation ratio . In the original scale, the order of performance of the models is inverted. Here, the best mean explanation ratio is obtained by the P-LC model (), followed by the M-LC model () and, finally, the LN-LC and LC models had the lowest mean explanation ratios ( and , respectively).
6. Analysis by age interval
Actuarial practitioners are typically interested in mortality patterns in advanced ages given their impact on life insurance pricing and provisions. In this section, we analyse the performance of the four reference mortality models when employing alternative selection criterion measures for young and old populations. Mortality models are fitted for all ages, but the computation of model selection measures is made by differentiating the population into two age intervals: 0-50 years (young) and 51-100 years (old). Our goal is to analyse whether model selection is dependent on the age interval considered.
Goodness-of-fit tables for the young and old populations are provided in the Appendix A. Based on the lowest sum of the squared error for the young population, the LC model for mortality rates was preferred in log scale and the P-LC model in the original scale. However, based on the absolute percentage error for the young population, the M-LC and LC models performed best in terms of presenting the lowest SAPEL and SAPE. In the case of the old population, the preferred model was the P-LC on the basis of the SSEL, the SAPEL and the SAPE goodness-of-fit measures. When considering the SSE, then the LN-LC model was the preferred model for the old population.
Model prediction accuracy results are shown separately for the young and old populations (Table 5 and Table 6). Table 5 reports in percentage terms the number of times each mortality model performed best in terms of minimum squared prediction error and absolute percentage prediction error in log and original scales, differentiating by age group. For the population under 50, the mortality model providing the best prediction most frequently was the LC model, followed closely by the LN-LC and M-LC models. In contrast, the P-LC model rarely provided the best prediction in the age range 0 to 50, regardless of the prediction measure considered. However, for the population aged 51-100, the P-LC model provided the highest degree of prediction accuracy with largely overlapping values for all prediction measures.
Finally, Table 6 shows the average of the explanation ratio in log scale and original scale, differentiating between the young and old populations. The LC model was the model with the highest explanation ratio on average in log scale for the population aged under 50, closely followed by the LN-LC and the M-LC models. In contrast, the explanation ratio of the P-LC model is notably lower . The distance, however, is shortened when the explanation ratio is analysed in the original scale for this young population. Now, the highest mean explanation ratio is obtained by the LN-LC model , closely followed by the LC , M-LC and P-LC models .
When analysing the prediction accuracy for the population aged 51 and over, the highest explanation ratio on average was obtained by the P-LC model in both log scale and original scale . The performance of the other three mortality models in terms of the mean explanation ratio was notably worse in both log and original scales. In log scale, the second best model in terms of the mean explanation ratio was the LN-LC model , followed by the LC and M-LC models . In the original scale, the second best model was the M-LC model , followed by the LN-LC and M-LC models .
7. Discussion
Goodness-of-fit and prediction accuracy measures are usually defined in terms of the sum of squared errors and the sum of absolute percentage errors. In the case of mortality modelling, these measures may be defined for mortality rates in log scale or in the original scale. When our primary interest lies in the performance of mortality models for age ranges that present relatively low mortality rates, selection measures need to assess relative rather than absolute variations in estimations/predictions. In this case, the selected measures should be the sum of squared errors in log scale and the sum of absolute percentage errors in the original scale. In contrast, the sum of squared errors in the original scale and the sum of absolute percentage errors in log scale should be selected when the performance of mortality models for age ranges that present relatively high mortality rates is our priority.
This distinction between selection measures defined on the basis of mortality rates in either log or original scales is relevant because of the marked differences in mortality rates with age. For instance, in 2020, in the case of the Spanish male population, the mortality rate of a 5-year-old boy was approximately 36 times lower than that of a 50-year-old male, 430 times lower than that of a 75-year-old male and 2,429 times lower than that of a 90-year-old male (Figure 1). This means that conclusions may diverge when the analysis is conducted based on selection measures defined with mortality rates on log scale, on the one hand, and with mortality rates on the original scale, on the other.
In terms of goodness-of-fit, we conclude that the best performance is provided by the LC model with lognormal distribution when selection measures are based on squared errors, regardless of the scale of the mortality rates. In logarithmic scale, the performances of the original LC model and the LN-LC model are similar, but the latter is clearly preferred to the original LC when the squared error selection measure is based on mortality rates in the original scale. In fact, both the Poisson LC model and the median LC model are preferred to the original LC model when goodness-of-fit is evaluated based on squared errors in the original scale. The LN-LC model takes into account that the expected mortality rate is higher than the exponential of the mean of the log mortality rate. That is, the Gaussian (lognormal) error distribution for mortality rates in log (original) scale seems adequate when the purpose is to minimize squared errors. Goodness-of-fit measures are often based on the absolute percentage error (Li et al. 2021,Li et al. 2016) and, here, when the selection criterion is the minimum absolute percentage error, the best performance was obtained by the M-LC model in both log and original scales.
The parameters of the LN-LC and the P-LC models were estimated by maximum likelihood, whereas the parameters of the original LC model were estimated by least square optimization techniques and those of the M-LC model by least absolute optimization techniques. In the case of the original LC model, the conditional mean of the log mortality rate is estimated; in the case of the M-LC model, the conditional median of the log mortality rate is computed. In general, the mean of the log does not match the log of the mean; yet, the median of the log does match the log of the median. The M-LC model performs better than the original LC model in terms of goodness-of-fit when selection measures based on absolute errors are used, but also when the selection measure is the sum of squared errors in the original scale. Thus, least absolute optimization algorithms can be an interesting alternative to least square optimization algorithms to estimate the parameters of the LC model when we are interested in ages with relatively high mortality rates.
Stochastic mortality models serve to predict future mortality; hence, the interest in evaluating the prediction accuracy of such models. When the models’ prediction error is considered in the original scale, the most accurate predictions are obtained most often by the P-LC model. The superior performance of the P-LC model is particularly evident when prediction accuracy is evaluated in terms of the squared prediction error. When the prediction error is evaluated in log scale, the best performance is provided by the LN-LC model in terms of the squared prediction error and the M-LC model in terms of the absolute percentage predicted error. Unlike the squared prediction error in log scale, the absolute percentage prediction error in log scale penalizes prediction errors in ages associated with high mortality rates.
Mortality patterns in advanced ages attract particular attention in actuarial research given their relevance for insurance products. When considering an old population (aged 51 and over), the best fit is provided by the P-LC model when the selection criteria are defined in log scale, but also when the criteria are based on the absolute percentage error in the original scale. This means the Poisson LC should be selected if our primary concern is goodness-of-fit for a population at advanced ages. This outcome is in line with Brouhns et al. (2002), who showed that the P-LC model performed better than the original LC model at the most advanced ages (over 90) in the Belgian population in terms of the proportion of the variance accounted for by the model. However, here, unlike in Brouhns et al. (2002), we compare the prediction accuracy for different age intervals. The preference for the Poisson model becomes more explicit when the prediction accuracy is analysed for the old population (aged 51-100). In this case, all the prediction accuracy measures considered in this study show the performance of the P-LC model to be superior to that of the other models.
In short, in terms of goodness-of-fit, mortality models that perform well in log scale also perform adequately in the original scale. In general, the LC model based on the lognormal distribution is preferred to those based on squared errors, while the M-LC model is the preferred model based on absolute errors. These two models are also preferred when prediction accuracy is analysed in log scale. However, the Poisson LC model is unreservedly the one selected when prediction accuracy is analysed in the original scale, the reason being that the P-LC model performs particularly well in terms of both goodness-of-fit and prediction accuracy in the interval of ages marked by high mortality rates (population aged over 51). Yet, for the population aged 50 and under, the P-LC model performs worse in terms of both goodness-of-fit and prediction accuracy than the other models. However, even though it is the model with the poorest prediction accuracy, its explanation ratio in the original scale for this age interval is very high (). The explanation for this lies in the fact that the Poisson model does not perform as well as the other three models at ages associated with infinitesimal mortality rates.
8. Conclusions
In this article, we have evaluated the implications of using different selection criteria measures when seeking to choose the most suitable stochastic mortality model. We show that least absolute optimization techniques constitute an interesting alternative to least square algorithms for estimating the parameters of stochastic mortality models when our interest lies in the fitting of mortality rates expressed in the original scale. We also provide solid arguments for selecting the Poisson LC model when the main concern is for the prediction accuracy of mortality rates in advanced ages (51 and over). This result has important implications, since while the Poisson assumption has traditionally been considered to provide a rigorous statistical framework, the prediction accuracy of Gaussian and Poisson LC models have rarely been compared.
To conclude, this study provides an enhanced awareness of the implications of using different selection criteria measures in terms of their impact on the performance of mortality models. Indeed, we show that models that provide a good fit or a good prediction performance in log scale may well be inadequate in the original scale, and vice versa. Some measures are better suited to mortality estimations/predictions at ages with relatively low mortality rates, while others perform better at ages with relatively high mortality rates. The use of one selection measure or another ultimately depends on the preferences of the decision makers, but they must be aware that the mortality model they select might be conditioned on the measure used in conducting the evaluation.
Funding
The Spanish Ministry of Science and Innovation supported this study under the grant PID2019-105986GB-C21.
Conflicts of Interest
The author declares no conflict of interest.
Appendix A

Table A1.
Model fit statistics. Sum of squared error when mortality rate was evaluated in logarithmic and original scale for population aged 50 or younger.
Table A1.
Model fit statistics. Sum of squared error when mortality rate was evaluated in logarithmic and original scale for population aged 50 or younger.
| Mortality rate in log scale | Mortality rate in original scale | |||||||
|---|---|---|---|---|---|---|---|---|
| (SSEL) | (SSE×100) | |||||||
| LC | LN-LC | PLC | MLC | LC | LN-LC | PLC | MLC | |
| AUSTRALIA | 158.41 | 158.47 | 337.19 | 188.80 | 0.14 | 0.13 | 0.33 | 0.21 |
| BELGIUM | 164.39 | 164.44 | 266.92 | 176.85 | 0.40 | 0.44 | 0.26 | 0.65 |
| CANADA | 96.45 | 96.46 | 299.97 | 107.60 | 0.44 | 0.40 | 0.23 | 0.34 |
| FRANCE | 166.41 | 166.55 | 435.10 | 206.31 | 7.85 | 8.05 | 4.28 | 4.78 |
| ITALY | 69.67 | 69.66 | 142.87 | 90.19 | 0.11 | 0.11 | 0.09 | 0.39 |
| JAPAN | 53.40 | 53.42 | 160.02 | 71.70 | 0.45 | 0.46 | 0.12 | 0.37 |
| SPAIN | 176.89 | 176.88 | 323.89 | 201.83 | 7.64 | 8.06 | 1.59 | 6.92 |
| UK | 122.09 | 122.10 | 895.18 | 132.45 | 0.46 | 0.49 | 0.32 | 0.45 |
| US | 45.22 | 45.14 | 93.44 | 52.55 | 0.14 | 0.14 | 0.12 | 0.14 |
Table A2.
Model fit statistics. Sum of absolute percentage error when mortality rate was evaluated in logarithmic and original scale for population aged 50 or younger.
Table A2.
Model fit statistics. Sum of absolute percentage error when mortality rate was evaluated in logarithmic and original scale for population aged 50 or younger.
| Mortality rate in log scale | Mortality rate in original scale | |||||||
|---|---|---|---|---|---|---|---|---|
| (SAPEL) | (SAPE) | |||||||
| LC | LN-LC | PLC | MLC | LC | LN-LC | PLC | MLC | |
| AUSTRALIA | 105.87 | 105.89 | 143.15 | 112.04 | 710.12 | 722.26 | 944.90 | 745.26 |
| BELGIUM | 82.72 | 82.74 | 101.85 | 82.48 | 594.93 | 605.71 | 703.29 | 592.06 |
| CANADA | 83.84 | 83.84 | 113.66 | 84.32 | 536.47 | 544.17 | 706.55 | 542.81 |
| FRANCE | 107.51 | 107.57 | 177.62 | 107.10 | 622.32 | 635.39 | 1094.37 | 601.21 |
| ITALY | 50.19 | 50.20 | 60.57 | 52.96 | 349.61 | 353.89 | 424.91 | 352.65 |
| JAPAN | 51.99 | 52.00 | 79.43 | 55.26 | 343.28 | 347.60 | 513.21 | 344.61 |
| SPAIN | 121.34 | 121.33 | 155.23 | 118.12 | 717.83 | 732.95 | 960.75 | 679.00 |
| UK | 93.61 | 93.61 | 206.10 | 90.58 | 602.39 | 612.84 | 1315.15 | 587.47 |
| US | 55.68 | 55.63 | 77.69 | 55.88 | 340.87 | 343.06 | 488.68 | 334.36 |
Table A3.
Model fit statistics. Sum of squared error when mortality rate was evaluated in logarithmic and original scale for population aged 51 and over.
Table A3.
Model fit statistics. Sum of squared error when mortality rate was evaluated in logarithmic and original scale for population aged 51 and over.
| Mortality rate in log scale | Mortality rate in original scale | |||||||
|---|---|---|---|---|---|---|---|---|
| (SSEL) | (SSE) | |||||||
| LC | LN-LC | PLC | MLC | LC | LN-LC | PLC | MLC | |
| AUSTRALIA | 123.80 | 123.04 | 82.76 | 120.50 | 6.46 | 6.25 | 6.02 | 6.27 |
| BELGIUM | 70.24 | 69.37 | 53.67 | 71.72 | 8.52 | 8.48 | 8.62 | 8.56 |
| CANADA | 84.93 | 84.42 | 59.27 | 86.28 | 2.57 | 2.49 | 2.53 | 2.52 |
| FRANCE | 72.36 | 71.74 | 39.29 | 62.65 | 9.99 | 9.26 | 9.84 | 9.52 |
| ITALY | 17.25 | 17.06 | 10.09 | 12.44 | 1.27 | 1.24 | 1.34 | 1.29 |
| JAPAN | 42.72 | 42.42 | 30.86 | 42.36 | 4.29 | 4.14 | 4.24 | 4.49 |
| SPAIN | 70.44 | 67.08 | 59.08 | 65.76 | 5.55 | 4.46 | 4.69 | 4.51 |
| UK | 125.82 | 125.43 | 41.00 | 144.06 | 4.47 | 4.43 | 3.94 | 4.36 |
| US | 27.41 | 27.33 | 14.93 | 30.81 | 0.48 | 0.46 | 0.47 | 0.49 |
Table A4.
Model fit statistics. Sum of absolute percentage error when mortality rate was evaluated in logarithmic and original scale for population aged 51 and over.
Table A4.
Model fit statistics. Sum of absolute percentage error when mortality rate was evaluated in logarithmic and original scale for population aged 51 and over.
| Mortality rate in log scale | Mortality rate in original scale | |||||||
|---|---|---|---|---|---|---|---|---|
| (SAPEL) | (SAPE) | |||||||
| LC | GLC | PLC | MLC | LC | GLC | PLC | MLC | |
| AUSTRALIA | 330.22 | 327.48 | 257.04 | 293.24 | 639.26 | 643.88 | 464.75 | 587.85 |
| BELGIUM | 347.65 | 378.53 | 369.10 | 361.45 | 361.35 | 363.33 | 291.68 | 337.48 |
| CANADA | 231.87 | 231.17 | 192.84 | 218.62 | 538.40 | 538.74 | 420.72 | 511.58 |
| FRANCE | 586.79 | 556.83 | 611.27 | 607.44 | 470.09 | 480.73 | 306.56 | 412.75 |
| ITALY | 125.26 | 124.47 | 114.93 | 115.64 | 178.49 | 180.66 | 128.35 | 137.94 |
| JAPAN | 210.45 | 207.38 | 188.78 | 185.57 | 294.65 | 295.71 | 222.09 | 255.53 |
| SPAIN | 311.10 | 283.89 | 260.87 | 276.53 | 457.56 | 465.94 | 399.40 | 427.17 |
| UK | 343.64 | 346.19 | 238.46 | 322.75 | 675.86 | 684.58 | 357.78 | 662.02 |
| US | 118.42 | 117.85 | 91.54 | 109.91 | 282.10 | 281.60 | 203.50 | 265.35 |
References
- Wilmoth, J. 2000. Demography of longevity: past, present, and future trends. Experimental Gerontology 35: 1111–1129. [Google Scholar] [CrossRef] [PubMed]
- Lee, R.D., and L.R. Carter. 1992. Modeling and Forecasting U. S. Mortality. Journal of the American Statistical Association 87: 659–671. [Google Scholar]
- Brouhns, N., M. Denuit, and J. Vermunt. 2002. A Poisson Log-Bilinear Regression Approach to the Construction of Projected Life Tables. Insurance: Mathematics and Economics 31: 373–393. [Google Scholar] [CrossRef]
- Currie, I.D., M. Durban, and P.H. Eilers. 2004. Smoothing and forecasting mortality rates. Statistical Modelling 4: 279–298. [Google Scholar] [CrossRef]
- Renshaw, A., and S. Haberman. 2003. On the Forecasting of Mortality Reduction Factors. Insurance: Mathematics and Economics 32: 379–401. [Google Scholar] [CrossRef]
- Renshaw, A., and S. Haberman. 2006. A Cohort-Based Extension to the Lee-Carter Model for Mortality Reduction Factors. Insurance: Mathematics and Economics 38: 556–570. [Google Scholar] [CrossRef]
- Cairns, A.J.G., D. Blake, and K. Dowd. 2006. A Two-Factor Model for Stochastic Mortality with Parameter Uncertainty: Theory and Calibration. Journal of Risk and Insurance 73: 687–718. [Google Scholar] [CrossRef]
- Plat, R. 2009. On stochastic mortality modeling. Insurance: Mathematics and Economics 45: 393–404. [Google Scholar] [CrossRef]
- Li, N., and R. Lee. 2005. Coherent mortality forecasts for a group of populations: An extension of the Lee-Carter method. Demography 42: 575–594. [Google Scholar] [CrossRef]
- Li, J., M. Lee, and S. Guthrie. 2021. A double common factor model for mortality projection using best-performance mortality rates as reference. ASTIN Bulletin: The Journal of the IAA 51: 349–374. [Google Scholar] [CrossRef]
- Li, J. 2013. A Poisson common factor model for projecting mortality and life expectancy jointly for females and males. Population Studies 67: 111–126. [Google Scholar] [CrossRef] [PubMed]
- Li, J., L. Tickle, and N. Parr. 2016. A multi-population evaluation of the Poisson common factor model for projecting mortality jointly for both sexes. J Pop Research 33: 333–360. [Google Scholar] [CrossRef]
- Yang, B., J. Li, and U. Balasooriya. 2016. Cohort extensions of the Poisson common factor model for modelling both genders jointly. Scandinavian Actuarial Journal 2016: 93–112. [Google Scholar] [CrossRef]
- Pitt, D., J. Li, and T.K. Lim. 2018. Smoothing Poisson common factor model for projecting mortality jointly for both sexes. ASTIN Bulletin: The Journal of the IAA 48: 509–541. [Google Scholar] [CrossRef]
- Wong, K., J. Li, and S. Tang. 2020. A modified common factor model for modelling mortality jointly for both sexes. J Pop Research, 181–212. [Google Scholar] [CrossRef]
- Enchev, V., T. Kleinow, and A.J.G. Cairns. 2017. Multi-population mortality models: fitting, forecasting and comparisons. Scandinavian Actuarial Journal 2017: 319–342. [Google Scholar] [CrossRef]
- Biffis, E., Y. Lin, and A. Milidonis. 2017. The cross-section of Asia-Pacific mortality dynamics: implications for longevity risk sharing. Journal of Risk and Insurance 84: 515–532. [Google Scholar] [CrossRef]
- Chen, R., and P. Millossovich. 2018. Sex-specific mortality forecasting for UK countries: a coherent approach. Eur. Actuar. J., 69–95. [Google Scholar] [CrossRef]
- Scognamiglio, S. 2022. Calibrating the Lee-Carter and the Poisson Lee-Carter models via Neural Networks. ASTIN Bulletin: The Journal of the IAA 52: 519–561. [Google Scholar] [CrossRef]
- Chang, L., and Y. Shi. 2022. Forecasting mortality rates with a coherent ensemble averaging approach. ASTIN Bulletin: The Journal of the IAA, 1–27. [Google Scholar] [CrossRef]
- Li, H., and Y. Lu. 2017. Coherent forecasting of mortality rates: A sparse vector-autoregression approach. ASTIN Bulletin: The Journal of the IAA 47: 563–600. [Google Scholar] [CrossRef]
- Gao, G., and Y. Shi. 2021. Age-coherent extensions of the Lee-Carter model. Scandinavian Actuarial Journal 2021: 998–1016. [Google Scholar] [CrossRef]
- Li, H., and Y. Shi. 2021. Mortality Forecasting with an Age-Coherent Sparse VAR Model. Risks 9. [Google Scholar] [CrossRef]
- SriDaran, D., M. Sherris, A.M. Villegas, and J. Ziveyi. 2022. A group regularisation approach for constructing generalised age-period-cohort mortality projection models. ASTIN Bulletin: The Journal of the IAA 52: 247–289. [Google Scholar] [CrossRef]
- Hunt, A., and D. Blake. 2014. General procedure for constructing mortality models. North American Actuarial Journal 18: 116–138. [Google Scholar] [CrossRef]
- Barigou, K., S. Loisel, and Y. Salhi. 2021. Parsimonious Predictive Mortality Modeling by Regularization and Cross-Validation with and without Covid-Type Effect. Risks 9. [Google Scholar] [CrossRef]
- Atance, D., A. Debón, and E. Navarro. 2020. A Comparison of Forecasting Mortality Models Using Resampling Methods. Mathematics 8. [Google Scholar] [CrossRef]
- Cairns, A.J.G., D. Blake, K. Dowd, G.D. Coughlan, D. Epstein, A. Ong, and I. Balevich. 2009. A Quantitative Comparison of Stochastic Mortality Models Using Data From England and Wales and the United States. North American Actuarial Journal 13: 1–35. [Google Scholar] [CrossRef]
- Santolino, M. 2020. The Lee-Carter quantile mortality model. Scandinavian Actuarial Journal 2020: 614–633. [Google Scholar] [CrossRef]
- Santolino, M. 2021. Median bilinear models in presence of extreme values. SORT-Statistics and Operations Research Transactions 45: 163–180. [Google Scholar] [CrossRef]
- OECD. 2014. Mortality Assumptions and Longevity Risk: Implications for pension funds and annuity providers. OECD Publishing: p. 192. [Google Scholar] [CrossRef]
- HMD. 2023. Human Mortality Database. University of California, Berkeley (USA), and Max Planck Institute for Demographic Research (Germany). Available online: www.mortality.org.
- Currie, I.D. 2016. On fitting generalized linear and non-linear models of mortality. Scandinavian Actuarial Journal 2016: 356–383. [Google Scholar] [CrossRef]
- Villegas, A.M., V.K. Kaishev, and P. Millossovich. 2018. StMoMo: An R Package for Stochastic Mortality Modeling. Journal of Statistical Software 84: 1–38. [Google Scholar] [CrossRef]
- Hunt, A., and D. Blake. On the Structure and Classification of Mortality Models. Pension Institute 2015. Working paper.
- Koenker, R. 2005. Quantile Regression. Econometric Society Monographs, Cambridge University Press. [Google Scholar] [CrossRef]
| 1 | In the cases of Italy and Japan, this was 2019 and 2021, respectively. |
Figure 1.
Illustration of mortality rate predictions made by Model A and Model B in log and original scales for Spanish male population in 2020
Figure 1.
Illustration of mortality rate predictions made by Model A and Model B in log and original scales for Spanish male population in 2020
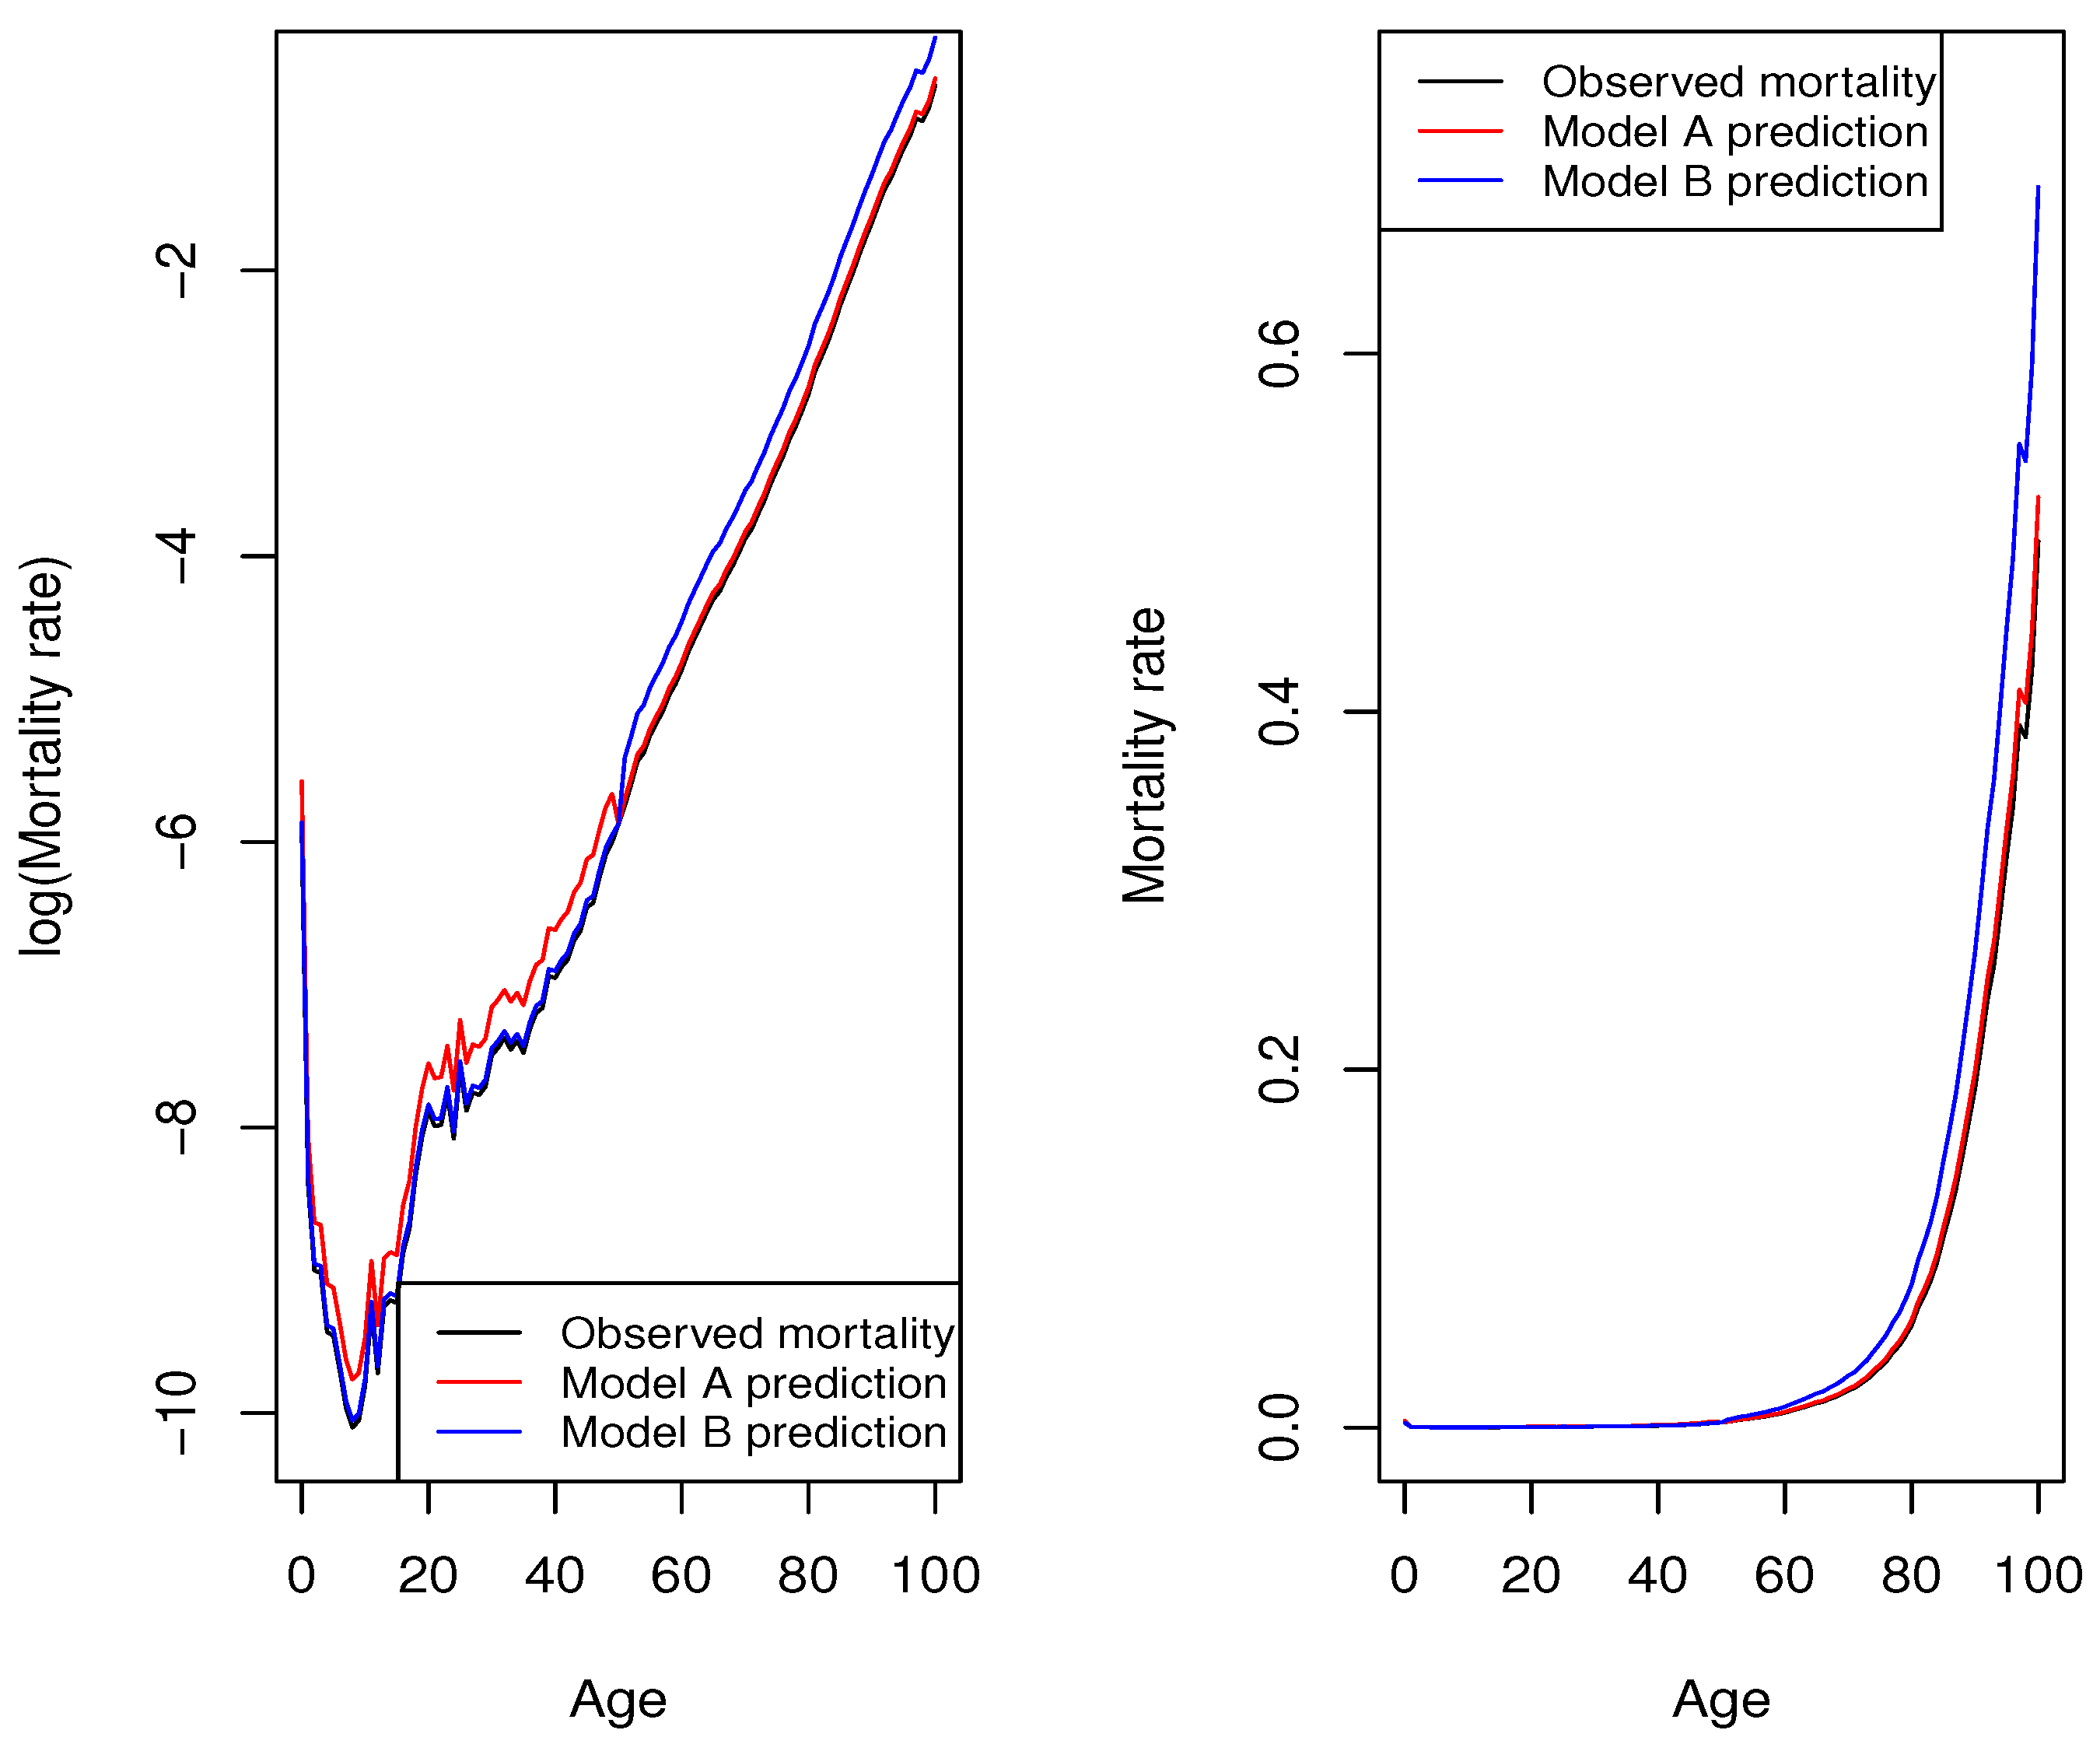
Table 1.
Model fit statistics. Sum of squared error when mortality rate is evaluated in logarithmic () and original scales ().
Table 1.
Model fit statistics. Sum of squared error when mortality rate is evaluated in logarithmic () and original scales ().
| Mortality rate in log scale | Mortality rate in original scale | |||||||
|---|---|---|---|---|---|---|---|---|
| (SSEL) | (SSE) | |||||||
| LC | LN-LC | P-LC | M-LC | LC | LN-LC | P-LC | M-LC | |
| AUSTRALIA | 282.22 | 281.51 | 419.95 | 309.30 | 6.46 | 6.25 | 6.02 | 6.27 |
| BELGIUM | 234.63 | 233.81 | 320.58 | 248.57 | 8.53 | 8.49 | 8.63 | 8.57 |
| CANADA | 181.39 | 180.88 | 359.24 | 193.88 | 2.57 | 2.50 | 2.54 | 2.53 |
| FRANCE | 238.77 | 238.29 | 474.36 | 268.95 | 10.16 | 9.34 | 9.88 | 9.57 |
| ITALY | 86.91 | 86.72 | 152.97 | 102.63 | 1.28 | 1.24 | 1.34 | 1.30 |
| JAPAN | 96.11 | 95.84 | 190.87 | 114.07 | 4.30 | 4.15 | 4.24 | 4.49 |
| SPAIN | 247.33 | 243.97 | 382.97 | 267.59 | 5.63 | 4.54 | 4.71 | 4.58 |
| UK | 247.91 | 247.53 | 936.17 | 276.50 | 4.48 | 4.43 | 3.95 | 4.36 |
| US | 72.62 | 72.47 | 108.37 | 83.36 | 0.49 | 0.46 | 0.47 | 0.49 |
Table 2.
Model fit statistics. Sum of absolute percentage error when mortality rate is evaluated in logarithmic () and original scales ().
Table 2.
Model fit statistics. Sum of absolute percentage error when mortality rate is evaluated in logarithmic () and original scales ().
| Mortality rate in log scale | Mortality rate in original scale | |||||||
|---|---|---|---|---|---|---|---|---|
| (SAPEL) | (SAPE) | |||||||
| LC | LN-LC | P-LC | M-LC | LC | LN-LC | P-LC | M-LC | |
| AUSTRALIA | 436.09 | 433.37 | 400.20 | 405.28 | 1349.38 | 1366.15 | 1409.66 | 1333.12 |
| BELGIUM | 430.36 | 461.27 | 470.95 | 443.97 | 956.28 | 969.04 | 994.97 | 929.54 |
| CANADA | 315.71 | 315.01 | 306.50 | 302.93 | 1074.87 | 1082.81 | 1127.27 | 1054.39 |
| FRANCE | 694.30 | 664.41 | 788.89 | 714.54 | 1096.32 | 1116.12 | 1400.93 | 1013.96 |
| ITALY | 175.45 | 174.67 | 175.51 | 168.60 | 528.11 | 534.55 | 553.25 | 490.59 |
| JAPAN | 262.43 | 259.38 | 268.22 | 240.83 | 637.93 | 643.31 | 735.30 | 600.13 |
| SPAIN | 432.43 | 405.22 | 416.09 | 394.65 | 1175.39 | 1198.93 | 1360.14 | 1106.17 |
| UK | 437.25 | 439.80 | 445.46 | 413.34 | 1278.28 | 1297.43 | 1672.93 | 1249.48 |
| US | 174.10 | 173.48 | 169.23 | 165.79 | 622.97 | 624.67 | 692.18 | 599.71 |
Table 3.
Comparison of prediction accuracy. Percentage of times the mortality model performed best in terms of the lowest value of the selection measure.
Table 3.
Comparison of prediction accuracy. Percentage of times the mortality model performed best in terms of the lowest value of the selection measure.
| Mortality rate in log scale | Mortality rate in original scale | |||||||
|---|---|---|---|---|---|---|---|---|
| LC | LN-LC | P-LC | M-LC | LC | LN-LC | P-LC | M-LC | |
| SSPEL | SSPE | |||||||
| 23.25% | 47.23% | 6.64% | 22.8% | 4.42% | 8.49% | 84.87% | 6.27% | |
| SAPPEL | SAPPE | |||||||
| 6.64% | 19.19% | 35.79% | 38.38% | 28.41% | 2.58% | 36.16% | 32.84% | |
Table 4.
Comparison of prediction accuracy. Average of the explanation ratio in log scale (RL) and original scale (R)
Table 4.
Comparison of prediction accuracy. Average of the explanation ratio in log scale (RL) and original scale (R)
| Mortality rate in log scale | Mortality rate in original scale | |||||||
|---|---|---|---|---|---|---|---|---|
| LC | LN-LC | P-LC | M-LC | LC | LN-LC | P-LC | M-LC | |
| Average of | Average of | |||||||
| 93.07% | 93.07% | 83.88% | 92.37% | 80.26% | 80.87% | 89.60% | 84.24% | |
Table 5.
Comparison of prediction accuracy for population aged 50 or younger and population aged 51 and over. Percentage of times the mortality model showed the best performance (lowest value of the selection measure).
Table 5.
Comparison of prediction accuracy for population aged 50 or younger and population aged 51 and over. Percentage of times the mortality model showed the best performance (lowest value of the selection measure).
| Mortality rate in log scale | Mortality rate in original scale | |||||||
|---|---|---|---|---|---|---|---|---|
| LC | LN-LC | P-LC | M-LC | LC | LN-LC | P-LC | M-LC | |
| Age | SSPEL | SSPE | ||||||
| Under 50 | 42.80% | 31.73% | 1.84% | 23.61% | 39.48% | 34.69% | 2.21% | 23.61% |
| 51 and over | 1.48% | 0.74% | 95.57% | 2.21% | 4.42% | 8.49% | 80.81% | 6.27% |
| SAPPEL | SAPPE | |||||||
| Under 50 | 40.59% | 27.31% | 2.21% | 29.89% | 33.57% | 33.21% | 7.38% | 25.83% |
| 51 and over | 1.84% | 1.84% | 91.51% | 4.80% | 0.74% | 1.10% | 96.68% | 1.48% |
Table 6.
Comparison of prediction accuracy for population aged 50 or younger and population aged 51 and over. Average of the explanation ratio in log scale (RL) and original scale (R)
Table 6.
Comparison of prediction accuracy for population aged 50 or younger and population aged 51 and over. Average of the explanation ratio in log scale (RL) and original scale (R)
| Mortality rate in log scale | Mortality rate in original scale | |||||||
|---|---|---|---|---|---|---|---|---|
| LC | LN-LC | P-LC | M-LC | LC | LN-LC | P-LC | M-LC | |
| Age | Average of | Average of | ||||||
| Under 50 | 94.71% | 94.70% | 81.43% | 94.38% | 99.38% | 99.39% | 98.76% | 99.32% |
| 51 and over | 86.11% | 86.16% | 92.95% | 83.92% | 80.02% | 80.63% | 89.49% | 80.64% |
Disclaimer/Publisher’s Note: The statements, opinions and data contained in all publications are solely those of the individual author(s) and contributor(s) and not of MDPI and/or the editor(s). MDPI and/or the editor(s) disclaim responsibility for any injury to people or property resulting from any ideas, methods, instructions or products referred to in the content. |
© 2020 by the author. Licensee MDPI, Basel, Switzerland. This article is an open access article distributed under the terms and conditions of the Creative Commons Attribution (CC BY) license (https://creativecommons.org/licenses/by/4.0/).
Copyright: This open access article is published under a Creative Commons CC BY 4.0 license, which permit the free download, distribution, and reuse, provided that the author and preprint are cited in any reuse.


