Submitted:
02 January 2024
Posted:
04 January 2024
Read the latest preprint version here
Abstract
In the context of global warming and increasing scarcity of fresh water resources, it becomes siginificant to evaluate the contribution and evolution of non-rainfall waters such as dew. This study therefore evaluates the relative dew and rain contributions in three sites in south-western of Madagascar (Ifaty, Toliara and Andremba), a semi-arid region which suffers of a strong water deficit. The studied period is 1991 – 2023, with extrapolation to 2033. Dew is calculated from meteo data using a well-established energy model. The extrapolation uses an artificial neural network approach. While the yearly dew/rain ratio remains modest (3-4%) dew forms regularly (2-3 days in average between events), in contrast to rain (10-15 days). The evolutions of dew and rain are similar, with an increase from 1991 to 2000, a decrease up to 2018 and a further increase till 2033. These oscillations follow the Indian Ocean dipole variations and should be influenced by the climate change. Dew contribution to the water balance is important during the dry season (Apr.-Oct.), up to 80%. Dew therefore appears to be a reliable and sustainable resource for plants, small animals and population, especially during droughts.
Keywords:
dew water
; rain water
; dew rain correlations
; climate change
; Madagascar
1. Introduction
Dew is a ubiquitous phenomenon in nature where it forms during calm and clear nights on grass, crops, and the top of the canopy. Dew is the result of the dropwise condensation of the atmosphere water vapor [1,2,3,4] when a surface exposed to the nocturnal sky cools enough to reach the dew point temperature. Cooling is due to the negative balance between the radiation emitted by the surface and radiation received by the atmosphere. The corresponding power, on the order of 50 – 100 W.m-2, limits the dew yield to about 1 L.m-2.d-1. Practically, dew forms when the difference between the dew point temperature and air temperature is less than a few degrees, corresponding to a relative humidity higher than 70 – 80% [5]. The maximum measured dew yield is at the moment 0.8 L.m-2.d-1 [6].
Dew contribution can be vital for some plants and animals, during drought episodes in humid areas and in semiarid and arid regions [4,7,8,9,10]. Yearly dew can contribute within 9% -23% of rainfalls in some arid areas [8,11]. In arid regions or during droughts dew is helpful for the survival of plants, giving nightly moisture [12,13], which is absorbed by leaves through plant stomata or special physical features as e.g., in aerial vegetation [2,14,15]. Dew could increase leave photosynthesis [16] and improve the efficiency of water use by plants [2,17].
Dew participates in some atmospheric chemical processes, such as diurnal and nocturnal cycles of nitrite oxides [4,18,19,20,21]. Small animals, such as insects [22,23] also rely on dew and non-rainfall water. The survival of horses in Namibia when abandoned after the First World War was rumored to be due to them licking dew that had formed on the train tracks.
In the context of global warming and rarefaction of fresh water, dew can thus be considered as a new source of water in those areas where fresh water, from rain or other sources, is lacking. Dew water can be collected by population on special collecting devices of planar or hollow shapes [4]. Water can be used for agriculture or serve for human consumption once disinfected to ensure safe drinking. The quality of dew water indeed quite generally meets the requirements of the World Health Organization (see e.g., [4,18,24]).
It happens that the lack of water is particularly important in the south-western region of Madagascar, whose main city is Toliara, capital of the region. This area is a semi-arid region, with a rainy period lasting chiefly on only two months (January and February). This region is thus not spared by water shortage since only 29% of the local population has access to drinking water [25,26]. Apart from its aridity, Toliara has the highest temperature in all of Madagascar [27]. However, the air relative humidity is relatively important, twice as high as that recorded in Sahelian regions [28]. As a matter of fact, dew data obtained by [29] for 18 months (Apr. 2013-Sept. 2014) in the same coastal south-western region of Madagascar (Efoetsy) corresponded to near 20% of the yearly rainfall. The main conclusion shows that dewfall in this area can play a non-negligible role in the annual water balance and provides a supplementary source of fresh water during the non-rainy season.
With the global climate change dew exhibits different evolution in different regions. For instance, dew frequency decreased by 5.2 days per decade from 1961 to 2010 in China due to surface warming and corresponding decrease in relative humidity (Dou et al., 2021). More important, the decrease of dew frequency in arid regions of China (50%) is larger than found in the semi-humid and humid regions (40% and 28%) [12]. The same trend is observed in west North Africa between 2005–2020 and predicted for 2020–2100 by using the low and high emissions climatic models [30]. With the global climate change, dew in different regions exhibits different tendencies, whose characteristics are required to predict the future changes in dew evolution.
It is thus the object of this paper to precisely quantify the contribution of dew and rain to the annual water balance in the semi-arid region of south-western Madagascar and evaluate its evolution during the period 1991-2020, and later from 2021 to 2030 by extrapolating the data. The dew yield is obtained from an energy balance model that uses only a few meteorological parameters [31]. In addition, direct measurements by [29] give elements of comparison between the calculated and measured data. Interpolation in 2021-2030 is obtained by using an artificial neural network and verification was made by comparing the actual and projected data in the period 2021-2022.
The paper is organized as follows. After having described the methods concerning the calculation of dew yields and the procedures of extrapolation of dew and rain data, one analyzes and discuss the evolution of dew, rain and their relative frequency and contribution in the period 1991-2020, with extrapolation to 2021-2030.
2. Materials and Methods
2.1. Studied Sites
At the global level, Madagascar is ranked 14th on the lack of access to basic water [26]. Access to drinking water is a major challenge. In 2022, only 54.4% of the Malagasy population had access to water [32]. The main factor of this water deficiency is due to the climate change. Major drought events are getting worse over time and the recharge of the aquifers is not covering the city’s water needs.
Toliara is located on the south-western coast of Madagascar (23° 23’ 0” S; 43° 44’ 0.001” E, 9 m asl), at the North of the Saint Augustin Bay (Figure 1). This city is the capital of the Atsimo Andrefana region. The Köppen Geiger climate classification in this area is Bsh (midlatitude steppe and desert climate). The urban area of Toliara is limited in the north by the river Fiherenana and the district of Mitsinjo Betanimena, to the South by the fishermen’s village Ankilibe, to the East by the district of Betsinjaka and to the West by the Mozambique Channel. The Fiherenana River is the only water resource that irrigates the plain located downstream from Miary. Toliara is part of the limestone domain of the southwest of Madagascar. The aspect of the soil is generally dominated by calcareous and sandy soil [33].
Two other sites, with same climate, are considered. One is close to Toliara, such as the small coastal city of Ifaty (43°6 East and 23° South, 80 m asl), 27 kilometers NNE from Toliara. Another is further from Toliara, as Andremba (44°19 East, 23°29 South), more inland (60 km from the sea, 260 m asl, 81 km SSE from Toliara). In addition, calculated dew data will be compared to some measurements performed in the coastal village of Efoetsy (2 km from the sea, 10 m asl; 83 km S from Toliara).
The population in the Toliara area uses different sources of water such as the Fiherenana River, wells and public fountains. According to [25], 35.90% of the population in the city of Toliara is very highly vulnerable to water insufficiency, 25.64% shows high vulnerability, 28.21% exhibits average vulnerability and 10.25% weakly vulnerable.
The average annual temperature is 23.9°C. The warmest month is January with a mean temperature of 27.8°C. The coolest month is July, with an average temperature of 20.6°C. The mean annual amount of precipitation in Toliara is 342.9 mm. The month with the most precipitation is January with 73.7 mm of precipitation in average. The month with the least precipitation is July with an average of 5.1 mm [36]. One of the particularities of the southwestern region of Madagascar is the abundance of humidity in the air. It has been proven that the value of relative air humidity RH in the southwestern part of Madagascar is twice as high than those recorded in the Sahelian zone (mean RH: 77%; min: 12%; max: 100% [37]). The air relative humidity varies from season to season; it is maximum during the hot and humid months (Nov. – Mar., the rainy season) and minimal during the cool and dry period (Apr. - Oct., the dry season).
The weather data used in this study comes from the ERA5-Land database, which is re-analyzed atmospheric data produced by the ECMWF’s Copernicus Climate Change Service. The spatial coverage of these data is 9 km and is in reduced Gaussian grid. The data spans from January 1991 to July 2023, with a one-hour time step. The following information is provided: relative air humidity, air temperature, dew point temperature, cloud cover, and wind speed. As the Toliara’s pluviometer is the only operational pluviometer in the southwestern part of Madagascar, all rain data are derived from the ERA5-Land database [38]. In this database, when the site does not have direct observations, as e.g. for Andremba, data are the result of extrapolations or interpolations in order to combine them with models outputs. The data of rain used here are all daily-analyzed data. Note that the same rain data are considered for the Ifaty and Toliara sites due to their close vicinity.
2.2. Dew Evolution
2.2.1. Energy Model
In order to compute the dewfall potential, an energy balance (or “physical”) model developed by [31] is used. The model needs only a few classical meteorological data: Ta (°C), RH (%) or dew point temperature Td (°C), cloud cover (N, oktas), wind speed at 10 m elevation (V10, m.s-1). Dew yields (mm. ∆t-1) are calculated on a time step ∆t from the following formulation:
The numerical factor ∆t/12 = 1/12 corresponds here to the data time step ∆t = 1h. Events with > 0 correspond to condensation and < 0 to evaporation. The latter are rejected. The quantity HL represents the convective heat losses between air and condenser, with a cut-off for wind speed V > V0 = 4.4 m.s-1 where condensation vanishes. HL = 0 if V > V0. When V ≤ V0, HL is expressed as:
The quantity RE in Equation (1) is the available cooling energy by radiative deficit. Depending on the water content of air (measured by Td, in °C), the site elevation H (in km) and the cloud cover N (in oktas), RE is evaluated by the following expression:
Daily time series corresponding to > 0 are built after removing all data where rain events are present. The calculated cumulative yields can then be obtained on daily, monthly or yearly bases.
2.2.2. Perceptron Analysis for Extrapolation
Multi-Layer Perceptron Artificial Neural Networks (MLP-ANN) is a type of artificial neural network inspired by the functioning of the human brain. They are currently used to predict meteorological variables such as solar radiation prediction [39], rainfall / evapotranspiration [40], air quality monitoring [41] or temperature [42]. The multi-layer perceptron is a set of interconnected neurons [43,44,45,46]. Information flows from input to output without backtracking [47]. It is composed of three distinct layers (Figure 2). The first layer or the input layer is formed by the input data: Ta (°C), Td (°C), RH (%), V (m.s-1) and N (oktas). These data are introduced in the MLP-ANN on a monthly basis. The second layer is the hidden layer to prepare the data using linear activation functions in their neuron to present it in the last layer, the output layer, which represents the dew yield h (mm.mth-1) output.
For the MLP-ANN network, a back-propagation algorithm is used. The back-propagation algorithm consists in forward-flowing the input data until a network-calculated input is obtained, and then comparing the calculated output to the known actual output. The weights are modified such that at the next iteration the error made between the calculated output is minimized. Taking into consideration the presence of the hidden layers, the error is back propagated backwards to the layer input while changing the weights. The process is repeated on all the data until the output error can be considered as negligible [47]. The multi-layer perceptron can give a projection from 2021 to 2030. The corresponding approach is summarized in Figure 3.
3. Results
3.1. Comparison with Direct Measurements
In order to determine the level of accuracy of the calculation of dew yields, the calculated data are compared with the measurements of Hanisch et al. [29] in Figure 4. The measurements were carried out between April 2013 and September 2014 at Efoetsy (2 km from the sea, 10 m asl; 83 km south from Toliara) and between April 2013 and August 2013 at Andremba, more inland (60 km from the sea, 260 m asl). In Figure 4 one sees that the few data of measured volumes in Andremba exhibit a larger yield than the calculated values, on order 2.5 times. There are no meteo data available in Efoetsy and the closer site is Toliara. The measured values in Efoetsy are about three times the calculated values in Toliara. Such measured large yields in Andremba and Efoetsy can be understood by the contribution of fog and mist that adds to dew. Such events were indeed observed when by [49] when discussing the data. The relative humidity during the night is undeniably quite large in Efoetsy and Andremba (RH = 100%), which favors the formation of radiative fog and the occurrence of mist. As a matter of fact, the typical evolution of dew mass during the night as shown in Hanisch et al. [29] exhibits an acceleration after midnight, which is the signature of fog and mist deposing on the dew collector. This behavior is typical in coastal areas and was analyzed by [50]. Since the calculation from meteo data ignores the fog and mist events that should occur, it gives less condensation volume.
3.2. Dew Evolution
3.2.1. Years 1991-2023
Figure 5 reports the dew yield evolution (in mm.yr-1) for the three sites as calculated from the model Equation (1). On first sees that the overall evolutions are the same, presenting an increase of about 22% from 1991 to 2000, a decrease of near 35% from 2000 to 2018 and a subsequent increase from 2018 to 2023 of 20%. The mean dew rate during all the period gives for Ifaty a value of 1.68 mm.mth-1 with a standard deviation (SD) of 0.49 mm.mth-1, for Toliara the mean is 1.16 mm.mth-1 with SD = 0.40 mm.mth-1 and for Andremba, the mean is 1.19 mm.mth-1 with SD = 0.56 mm.mth-1. One will see in Section 3.3.1 (Figure 9) that the rain behavior is similar. Since rain determines (with evaporation from sea water) the level of RH in the air, it is thus natural that dew follows an evolution similar to rain.
The dates of change of dew rate are corroborated in Figure 6 where are reported the dew yields with respect to the year of calculation in ascending order, for the dry (Apr.-Oct.) and rainy seasons (Nov.-March). For Ifaty the minimum rate is 5.8 mm.season-1 (rainy season 2019) and the maximum is 16 mm.season-1 (dry season 1996). For Toliara the results are quite comparable, with a minimum rate is 3.5 mm.season-1 (rainy season 2019) and the maximum is 12 mm.season-1 (dry season 1996). Concerning Andremba, the results are also similar, with a minimum rate of 2.5 mm.season-1 (rainy season 2021) and a maximum of 12 mm.season-1 (dry season 2011).
The number of days without dew events is an important parameter as many plants and small animals suffer when no water is available during a long period. Histogram of the data for all the period are reported in Figure 6 for both dry and rainy seasons.
According to Figure 6, dew forms regularly during all seasons, with a dew amplitude larger during the dry seasons (Figure 6) for all sites. The ratio of dry/rainy dew amplitudes is about 1.5 in Ifaty and Toliara and near 1.3 in Andremba.
The Figure 6 data can be fitted to an exponential decay (Equation (4)) where f is the frequency of events showing the number Nc of consecutive days without dew:
In this Equation (4), is a typical number of events and is a typical number of consecutive days without dew. For all sites, is larger in the dry seasons (~ 600) than in the rainy season (~400). The number keeps similar values for dry and rainy seasons, on the order of 2 days without dew (minimum 1.84 days during the rainy season in Ifaty, maximum 2.76 days during the dry season in Andremba).
The evolution of consecutive days without dew events is reported in Figure 8 for the dry and rainy seasons in Ifaty, Toliara and Andremba. The values and general tendencies are the same for all sites. One observes that, as expected, the number of consecutive days without events is larger during the dry when compared to the rainy season. The smaller number in the rainy season is due to the larger humidity. The evolution between 1991 and 2009 of consecutive days without dew events is similar in the dry and rainy season, showing, in spite of large yearly variations, an increase on the order of 25% for all sites. The change of behavior is more pronounced after year 2000. The fact that the mean number of days without dew are close together in the dry and rainy season confirms the fact that dew forms regularly all over the year.
3.2.2. Extrapolation for Years 2021-2030
- a)
- Verification with 2022-2023 data
The data from 1991-2022 are extrapolated to the period 2022-2033 according to the procedure using MLP-ANN as described in Section 2.2.2. In order to assess the quality of the extrapolation, the data calculated from the MLP-ANN network are compared to the actual data between Aug. 2022 and Jul. 2023. The insets in Figure 5 compare the monthly dew yields from the extrapolation and the calculations with the actual meteo data using Equation (1). During these 12-months period, one observes that the MLP extrapolation agrees quite well with the data of the physical model estimation.
- b) Extrapolation 2021-2030
Extrapolated dew yields data are calculated on the 2022-2033 period on a monthly basis using the algorithm described in section 2.2.2. The average yield as shown in Figure 5 shows, when compared to the 1991-2022 period, either a constant increase (Toliara: +15%) and to a lesser extent, Ifaty: +10%) or a stagnation (Andremba).
3.3. Rain Evolution
3.3.1. Years 1991-2022
The evolution of rainfall in the period is shown in Figure 9 for Toliara and Ifaty (same data, see Section 2.1) and Andremba. Without surprises, the rain amplitude and rain evolution are similar in all sites. One notes the differences in yearly dry and rainy seasons (analyzed below in Figure 10) and large peaks related to cyclone events. The trends are the following. One observes between 1991 and 2000 an important rise from ~ 25 to ~ 60 mm.mth-1, then a long decrease until 2018-2020 with two periods of relative rise around 2005 and 2015 to reach nearly the same value than in 1991 (25 mm.mth-1). The period 2021-2023 and the extrapolation to 2033 corresponds to a rise, with about the same mean value 60 mm.mth-1 as in 2000. As noted in Section 3.2.1 (Figure 5), dew is seen to follow an evolution similar to rain, the latter providing (with evaporation from sea water) a large fraction of relative humidity needed to condense water vapor from the atmosphere [51].
Figure 10 presents the rainfall yields in the dry season (Apr.-Oct.) and rainy season (Nov.-Mar.). There is obviously a large difference in precipitations.
The minimum rainfall is ~ 18 mm in 2021 (dry season) and the maximum is 850 mm in 1998 (Andremba) and 2022 (Ifaty-Toliara). The mean precipitation rate in the dry season is 61 mm.season-1 and it is 485 mm.season-1 for the rainy season.
As for dew (see Section 3.2.1), the frequency of consecutive rainy days without rain can be well represented by an exponential (Equation (4); Figure 11). For all sites, is much larger in the rainy seasons (~ 300-350) than in the dry season (~ 45-100). Unsurprisingly, the average number of days without rain is also much greater in the dry season (6-10 days) than in the rainy seasons (~ 2.45 days).
The evolution of consecutive rainy days without rain Nc, is reported in Figure 12 for the dry season (Apr. - Oct.) and the rainy season (Nov. - March). One obviously observes a much smaller Nc during the rainy season. In spite of large data scatter, inherent to meteorological phenomena, one sees that Nc in the rainy season weakly decreases from 1991 to 2005 (~ 4.3 days in 1991 and ~ 3.7 days in 2005) and weakly increases from 2005 to 2023 (~ 3.7 days in 2005 and ~ 5 days in 2023). This behavior is the opposite of the rainfall volume evolution (see section Section 3.3.1), the larger consecutive rainy days without rain logically corresponding to the smaller rainfall volumes. During the dry season, one obviously observes a much larger number of days between consecutive rain falls (about three times), with a general decrease, more marked at Ifaty Toliara (from 14 days in 1991 to 11 days in 2023) than in Andremba (from 10 days in 1991 to 9 days in 2023).
3.3.2. Extrapolation 2021-2030
- a)
- Verification with 2021-2022 data
The extrapolated monthly rainfalls were calculated according to the algorithm presented in Figure 3 for 2022-2033 (see Figure 9). One observes (insets of Figure 9) that the MLP-ANN extrapolation gives values in reasonable agreement with the measured data.
- b) Evolution 2022-2033
Figure 9 shows that, after an increase in the period 2021-2023, the extrapolation to 2033 confirms the rise in dewfall volumes, with about the same mean value 60 mm.mth-1 as in 2000.
3.4. Dew-Rain Ratios
In order to determine the contribution of dew in the global water balance, a dew/rain ratio can be defined as:
where is the volume of rainfall calculated on the same time period as the dew yield . This factor exhibits quite large variations because in some months = 0, thus making the contribution of dew the only input in the water balance. In order to average these variations, one will consider either the yearly mean
or the dry or rainy season means
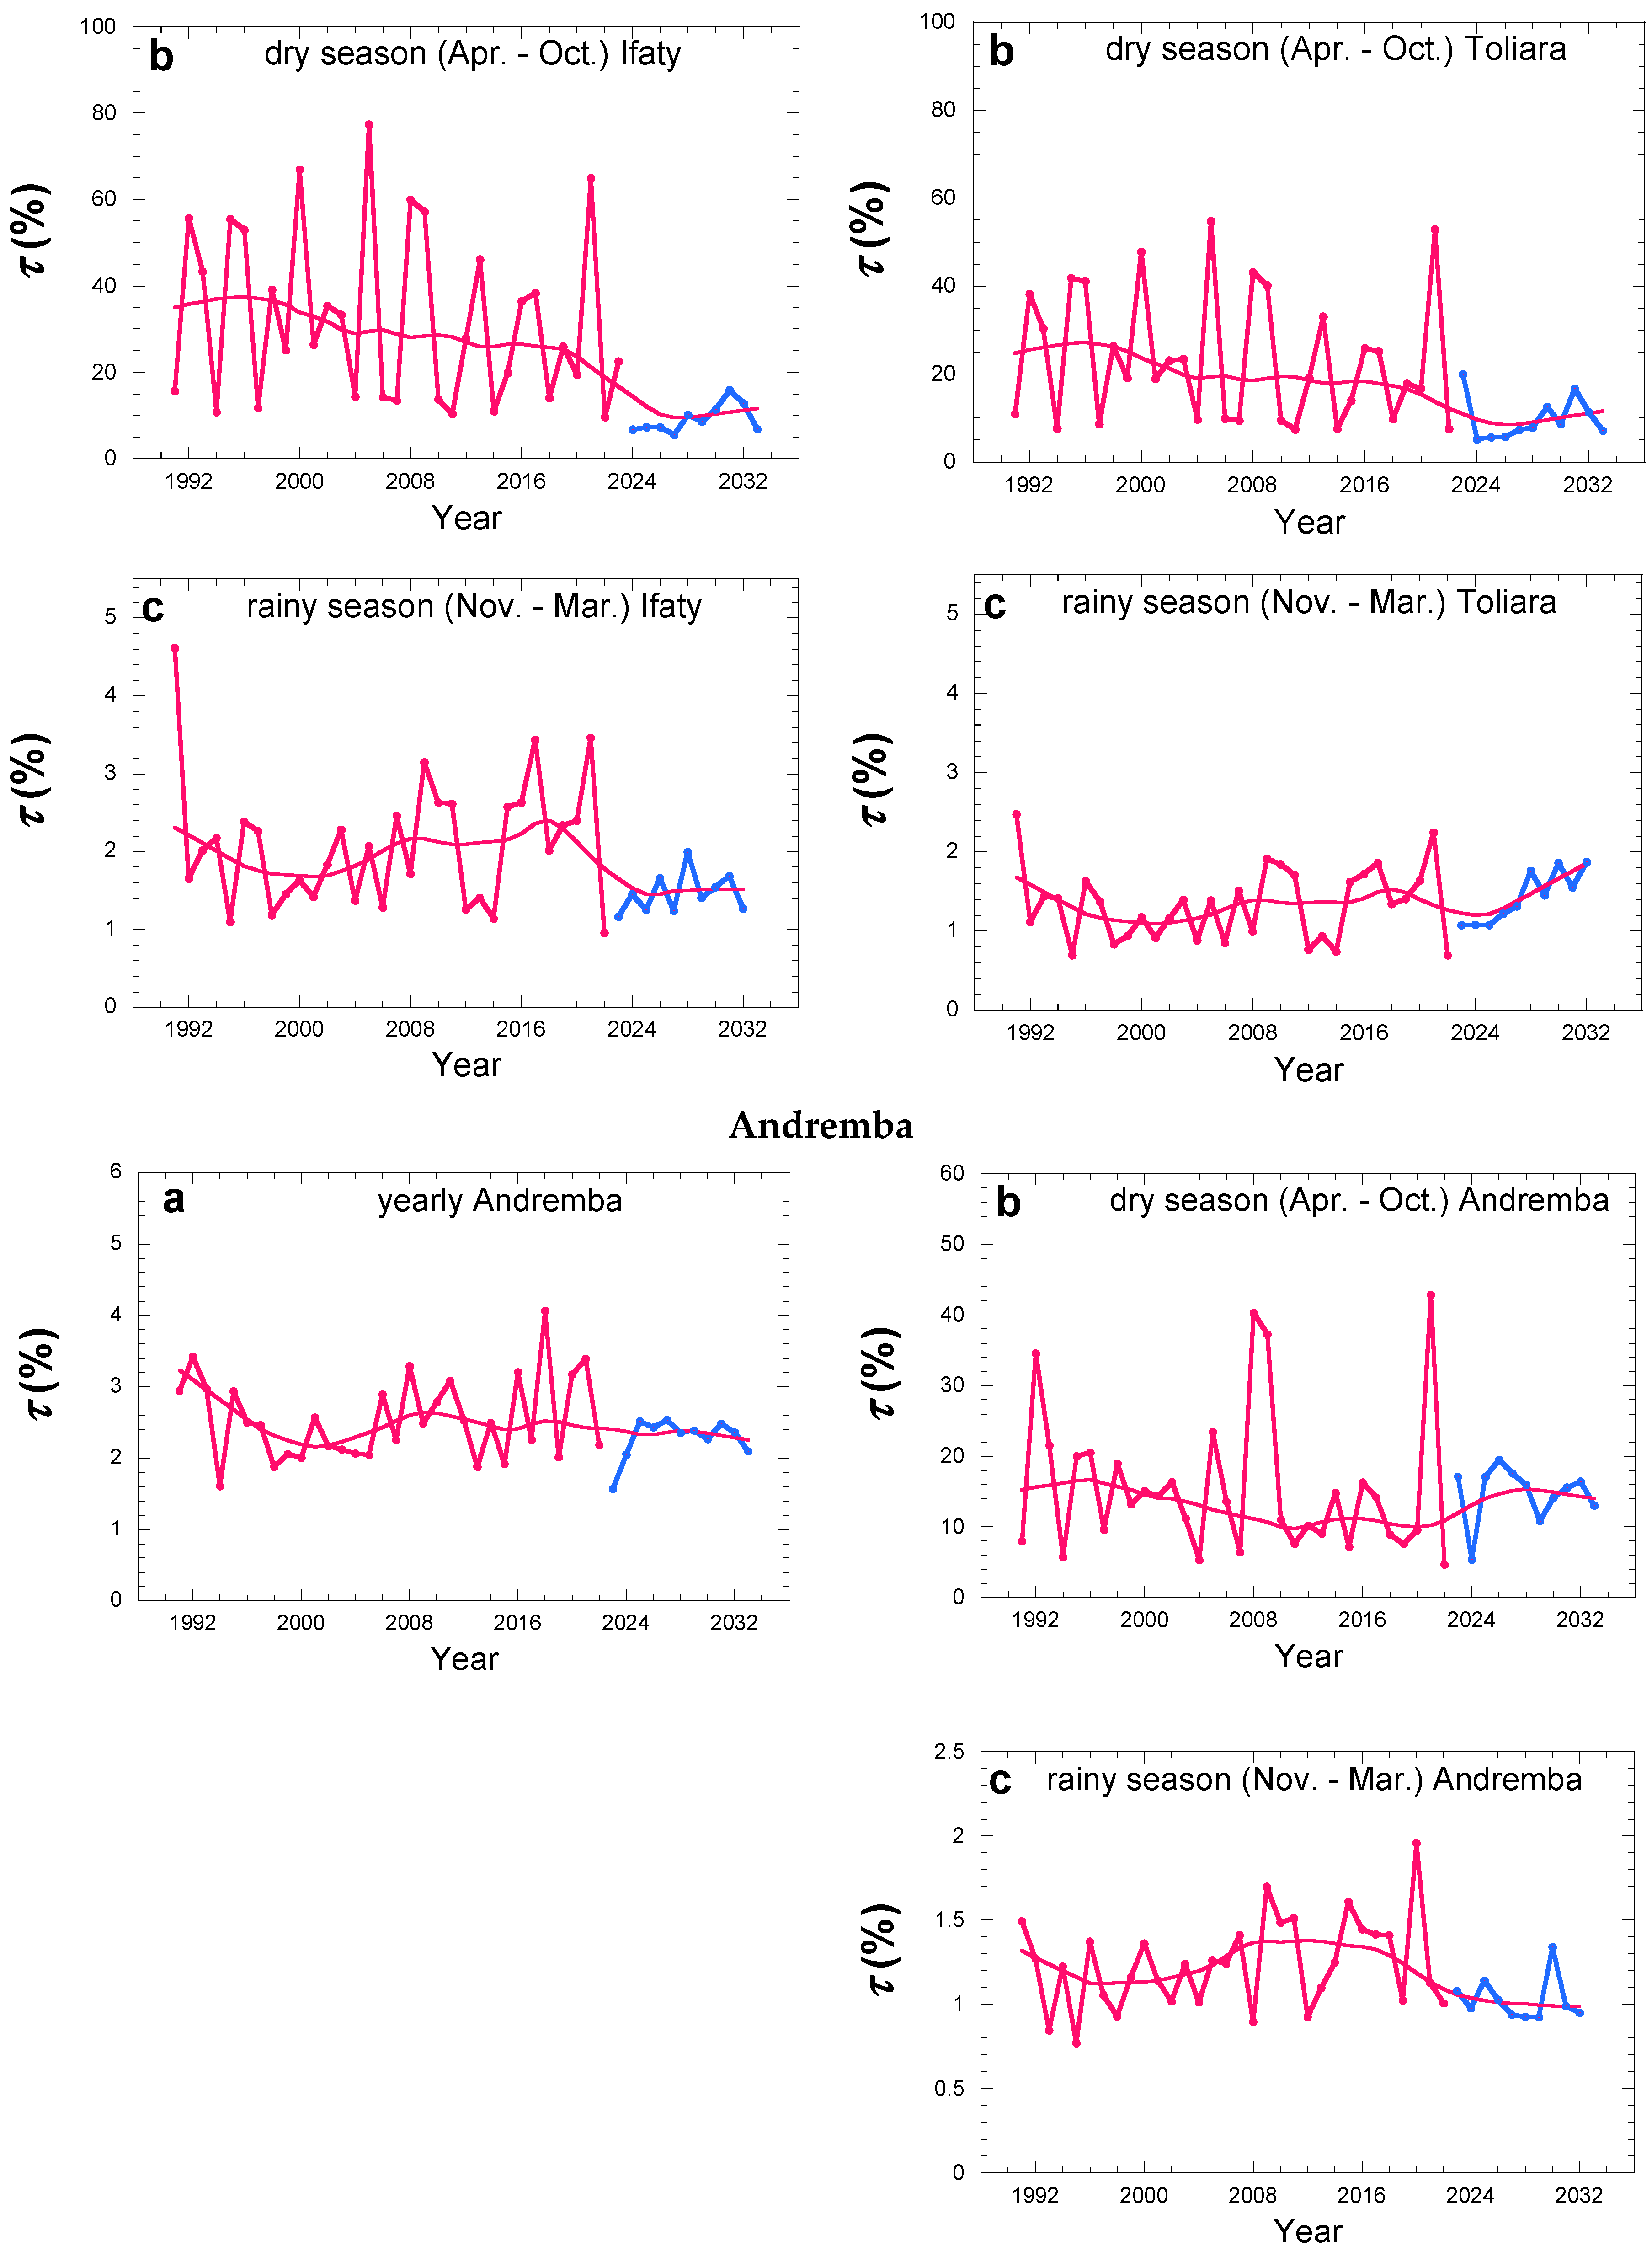
The results are shown in Figure 13 for the three studied sites. Concerning the yearly season, the evolution is the opposite of dew and rain evolutions, with a decrease of ~ 30% from 1991 to 2000, an increase of ~ 30% from 2000 to 2018, a decrease from 2018 to 2023 of 30% and a subsequent weak increase of ~ 10%. The mean values with SD in the period 1991-2033 are (Ifaty) 4.0% 1.3, (Toliara) 2.9% 0.8 and (Andremba) 2.5% 0.5. The ratio in the rainy season follows similar behavior but with nearly half mean values: (Ifaty) 1.9% 0.8, (Toliara) 1.3% 0.4 and (Andremba) 1.2% 0.3. The evolution behavior in the dry season is less pronounced but compatible with what is observed in the rainy season. The mean values become significantly larger, with (Ifaty) 27% 20, (Toliara) 20% 20 and (Andremba) 15% 9.
In Section 3.2.1 (dew) and Section 3.3.1 (rain) the similarity of behavior of dew and rain evolution was noted. However, the amplitude of variation of rain being larger than that of dew, the overall behavior of the dew/rain ratio is thus seen to behave inversely to dew and rain evolution, which explains the observation of Figure 13, particularly clear for the yearly and rainy seasons.
The yearly values are relatively low, but with the contributions of fog and mist in the coastal areas (Efoetsy, Andremba, see Section 3.1 and Figure 4) the non-rainfall contributions can reach three times the dew amount. Contributions up to 10% could therefore be attained, which is a considerable contribution. As a matter of fact, the value τ = 19% was measured in average for a 18-month period by [29] at Efoetsy. Concerning the only dry season, mean values as large as 27% are observed with regular peaks as large as 80%. With the contribution of fog and mist, the mean value might rise to 80%.
4. General Discussion
The first result of this study is the recognition that on a rather small area ( ~ 100 × 60 km2) dew yields can vary much than rain volumes. For instance, dew varies by 50% between Toliara and Ifaty that are distant of 27 km, and is nearly the same in Toliara and Andremba 60 km distant. In contrast, rain keeps nearly the same values in those three sites. This observation is due to the process of formation of dew, which is a function of quite local values of relative humidity, air flows (wind) and cloud cover, in contrast to rain, which forms in the upper regions of atmosphere and is convected on large distances before falling an a large area.
Another result is the finding that the evolutions of dew and rain are similar. The reason can be found in the variation of local relative humidity, which governs the dew yield and increases with increasing rainfall. The evolution is non-monotonous, with increase from 1991 to 2000, a decrease up to 2018 and a further increase till 2033. The evolution of rain is known to follow the ocean surface temperature, which undergoes periodic oscillations known as Indian Ocean Dipole (IOD, see e.g. [52]). The IOD is negative when the water surface temperature of the Indian Ocean is below normal in the west and above normal in the east. When a negative IOD is observed then in the central-western tropical Indian Ocean the precipitation is below normal while in the eastern tropical Indian Ocean and in the western tropical Pacific Ocean the precipitations are higher than normal. Extreme IOD events (droughts, floods and hurricanes) are likely to increase in the future as a result of the climate change. These events have a tendency to relate with El Niño events.
In terms of water content, dew forms much more regularly than rain. The number of consecutive days without dew is the same in the dry and rainy seasons (2-3 days). It is much larger for rain, in the dry season (10-15 days) and even in the rainy season (3-5 days). Although the dew yield remains modest (1-2 mm.mth-1) when compared to rain (~ 30 mm.mth-1), corresponding to yearly mean contribution of 3-4%, its contribution during the dry season can be much larger, up to ~ 30% in average, with regular peaks up to 80% . Its evolution is opposite of rain and dew, due to the larger influence of rain variation in the ratio dew/rain. One notes that the contribution of collected fog and mist can increase by a factor 3 this contribution, as seen in Efoetsy on the coast and Andremba.
5. Conclusions
Dew yields were calculated in three sites, Ifaty, Toliara and Andremba (Madagascar) between 1991 and 2023 from meteo data thanks to an energy equation. The region has a mid-latitude steppe and desert climate characterized by high humidity, which favors dew formation. When combined with rainfalls, the evolution of dew and rain and their relative importance can be determined in the period. The data are extrapolated from 2023 to 2033 by using an artificial neural network.
The evolution of dew and rain is found similar and in agreement with the variations of the IOD ocean surface temperature. One observes an increase from 1991 to 2000, a decrease up to 2018 and a further increase till 2033.
The contribution of dew with respect to rain is found rather weak when averaged on a year, about 3-4%. However, dew forms very regularly all over the year, which makes its contribution very large during the dry season (Apr.-Oct.). the mean value can reach ~ 30% and peaks are on order of 80%, due to the conjunction of higher dew yield and lower rainfalls. The values calculated for dew in this work (mean value about 1-2 mm.mth-1) are conservative. The measured non-rainfalls indeed exhibit much larger yields, on order three times larger. On the Madagascar coast, fog and mist indeed add to dew and considerably increase the contribution of non-rainfall water.
The number of consecutive days without rain or dew is an important factor for the vegetation and in general for animals and human population. The mean number of consecutive days without rain is on order 3-5 days during the rainy season and much larger during the dry season (10-15 days). In contrast, dew is regular all over the year (number of consecutive days without dew is in average 2-3 days), which makes dew a reliable source of water for plants, animals and population.
The evolution of the dew and rain water resources is related to the the ocean surface temperature governed by the Indian Ocean Dipole. Its variations, alike El Niño, are subjected with the climate changes. In particular, extreme events (droughts, floods and hurricanes) are expected to increase in the future.
Author Contributions
Conceptualization, D.B. and M.M.; Formal analysis, M.M. and D.B.; Funding acquisition, A.R. and D.B.; Methodology, A.R., M.M., D.B., Resources, A.R.; Writing— original draft, M.M. and D.B. All authors have read and agreed to the published version of the manuscript.
Funding
No funding.
Institutional Review Board Statement
Not applicable.
Informed Consent Statement
Not applicable.
Data Availability Statement
Data can be given on request at daniel.beysens@espci.fr.
Conflicts of Interest
The authors declare no conflict of interest.
References
- Monteith, J. L., 1957. Dew. Q. J. R. Meteorol. Soc. 83, 322–341.
- Monteith, J. L., Unsworth, M. H., 1990. Principles of Environmental Physics. Plants, Animals, and the Atmosphere, 4th Edn, Academic Press, Oxford.
- Beysens, D. Dew nucleation and growth. C. R. Phys. 2006, 7, 1082. [Google Scholar] [CrossRef]
- Beysens, D. Dew Water. River Publishers, 2018, Gistrup.
- Dahliou, D., Laarabi, B., Barhdadi, A. Review on dew water effect on soiling of solar panels: Towards its enhancement or mitigation. Sustainable Energy Tech. and Assessments 2022, 49, 101774. [CrossRef]
- Kabela, E.D., Hornbuckle, B.K., Cosh, M.H., Anderson, M.C., Gleason, M.L. Dew frequency, duration, amount, and distribution in corn and soybean during SMEX05. Agric. For. Meteorol. 2009, 149, 11–24. [CrossRef]
- Jacobs, A. F. G., Heusinkveld, B. G. and Berkowicz, S. M. Dew deposition and drying in a desert system: a simple simulation model. J. Arid Environ. 1999, 42, 211–222. [CrossRef]
- Uclés, O., Villagarcia, L., Moro, M. J., Canton, Y. and Domingo, F. Role of dewfall in the water balance of a semiarid coastal steppe ecosystem. Hydrol. Process. 2014, 28, 2271–2280. [CrossRef]
- Wang, L., Kaseke, K. F. and Seely, M. K., 2017. Effects of non-rainfall water inputs on ecosystem functions. Water 4, e1179.
- Charnès, A., Cooper, W. W. and Rhodes, E. Measuring the efficiency of decision-making units. Eur. J Operational Res. 1978, 2, 429–444. [CrossRef]
- Malek, E., McCurdy, G. and Giles, B. Dew contribution to the annual water balances in semi-arid desert valleys. J. Arid Environ. 1999, 42, 71–80. [CrossRef]
- Dou, Y., Quan, J., Jia, X., Wang, Q. and Liu, Y. Near-Surface Warming Reduces Dew Frequency in China. Geophys. Res. Lett. 2021, 48, e2020GL091923. [CrossRef]
- Steinberger, Y., Loboda, I. and Garner, W. The Influence of Autumn Dewfall on Spatial and Temporal Distribution of Nematodes in the Desert Ecosystem. J. Arid Environ. 1989, 16, 177–183. [CrossRef]
- Gerlein-Safdi, C., Koohafkan, M.C., Chung, M., Rockwell, F.E., Thompson, S., Caylor, K.K. Dew deposition suppresses transpiration and carbon uptake in leaves. Agric. Forest Meteorol. 2018, 259, 305–316. [CrossRef]
- Berry, Z. C., Emery, N. C., Gotsch, S. G. and Goldsmith, G. R. Foliar water uptake: Processes, pathways, and integration into plant water budgets. Plant Cell Environ. 2019, 42, 410–423. [CrossRef] [PubMed]
- Zhuang, Y., Ratcliffe, S. Relationship between dew presence and Bassia dasyphylla plant growth. J. Arid Land 2012, 4, 11–18. [CrossRef]
- Ben-Asher, J., Alpert, P. and Ben-Zyi, A. Dew is a major factor affecting vegetation water use efficiency rather than a source of water in the eastern Mediterranean area. Water Resour. Res. 2010, 46, W10532.
- Tomaszkiewicz, M., Najm, M. A., Beysens, D., Alameddine, I., El-Fadel, M. Dew as a Sustainable Non-Conventional Water Resource: A Critical Review. Environ. Rev. 2015, 23, 1–18.
- Acker, K., Moeller, D., Auel, R., Wieprecht, W., Kalaß, D. Concentrations of nitrous acid, nitric acid, nitrite and nitrate in the gas and aerosol phase at a site in the emission zone during ESCOMPTE 2001 experiment. Atmos. Res, 74.
- Rubio, M. A., Lissi, E., Villena, G. Nitrite in rain and dew in Santiago City, Chile. Its possible impact on the early morning start of the photochemical smog. Atmos. Environ. 2002, 36, 293–297. [CrossRef]
- Rubio, M. A., Lissi, E., Villena, G. Factors determining the concentration of nitrite in dew from Santiago, Chile. Atmos. Environ. 2008, 42, 7651–7656. [CrossRef]
- Hamilton, W.J., Seely, M.K. Fog basking by the Namib Desert beetle, Onymacris unguicularis. Nature 1976, 262, 284–285. [CrossRef]
- Seely, M., Henschel, J.R. and Hamilton III, W.J. Long-term data show behavioural fog collection adaptations determine Namib Desert beetle abundance. South African J. Sci. 2005, 101, 570.
- Kaseke, K.F., Wang, L. Fog and dew as potable water resources: maximizing harvesting potential and water quality concerns. GeoHealth 2018, 2, 327–332. [CrossRef]
- Randriatsitohaina, J.B., Raniriketra, C., Mara, T., Champin, L., Taïbi, A.N., Razakamanana, T. and Fleurant, C. Vulnérabilité de Toliara face à l’insuffisance en eau, région Sud-Ouest de Madagascar. Madamines 2018, 1, 29–52.
- Sector Minister’s meeting, The Madagascar Country Brief, 4-5 April 2019, San José, Costa Rica.
- Raholijao, N., Arivelo, T.A., Rakotomavo, Z.A.P.H., Voahangin-dRakotoson, D., Srinivasan, G., Shanmugasundaram, J., Dash, I. and Qiu, J., 2019. Les tendances climatiques et les futurs changements climatiques a Madagascar-2019. Government of Madagascar, Antananarivo, Madagascar [online] URL: https://www. primature. gov. mg/cpgu/wp-content/uploads/2019/11/Publication_FR_09_Sept_Version_Finale. pdf.
- Grouzis, M., Le Sud-Ouest de Madagascar. Paris, France: Institut de Recherche pour le Développement. Rapport sur le programme de recherché de Gestion des Espaces Ruraux et Environnement à Madagascar (1996-2002), 2004.
- Hanisch, S., Lohrey, C., Buerkert, A. Dewfall and its ecological significance in semi-arid coastal south-western Madagascar. J. Arid Env. 2015, 121, 24–31. [CrossRef]
- Muselli, M., Lekouch, I., Beysens, D. Physical and chemical characteristics of dew and rain in north-west Africa with focus on Morocco: Past and future evolution (2005 – 2100). Atmos 2022, 13-12.
- Beysens, D. Estimating dew yield worldwide from a few meteo data. Atmospheric Research 2016, 167, 146–155; Corrigendum:. Atm. Res. 2016, 167, 146–155.
- Communiqué de la Présidence de la République de Madagascar sur le projet d’amélioration de l’accès en eau potable, 15 juin 2022. Available online: https://www.presidence.gov.mg/actualites/1604-madagascar-220-millions-de-dollars-pour-ameliorer-l-acces-a-l-eau-et-a-l’assainissement-de-base.htmlhttps://www.presidence.gov.mg/actualites/1604-madagascar-220-millions-de-dollars-pour-ameliorer-l-acces-a-l-eau-et-a-l’assainissement-de-base.html.
- Moriste, D., 2010. Biodiversité des haies vives dans la région de Toliara. Rapport de Licence, Faculté des Sciences, Université de Toliara.
- Nations Online Project, 2022. Available online: https://www.google.com/url?sa=i&url=https%3A%2F%2Fwww.nationsonline.org%2Foneworld%2Fmap%2Fmadagascar_map.htm&psig=AOvVaw1MWvWQQTxAm1k8rFdjE65H&ust=1673779532637000&source=images&cd=vfe&ved=0CA8QjRxqFwoTCLi62NjwxvwCFQAAAAAdAAAAABAEhttps://www.google.com/url?sa=i&url=https%3A%2F%2Fwww.nationsonline.org%2Foneworld%2Fmap%2Fmadagascar_map.htm&psig=AOvVaw1MWvWQQTxAm1k8rFdjE65H&ust=1673779532637000&source=images&cd=vfe&ved=0CA8QjRxqFwoTCLi62NjwxvwCFQAAAAAdAAAAABAE (accessed on 12 January 2023).
- Mapcarta. https://mapcarta.com/14494606https://mapcarta.com/14494606, accessed on February 2023.
- Weather Base. https://www.weatherbase.com/weather/weather- summary.php3?s=16176&cityname=Toliara, Madagascar. (accessed on 4 February 2022).
- Rasoafaniry, A., 2022. Etude de la contribution de la rosée sur l’adduction en eau dans la commune urbaine de Toliara, Rapport de Master, Ecole Supérieure Polytechnique d’Antananarivo, Madagascar.
- ERA5-Land. Available online: https://confluence.ecmwf.int/plugins/servlet/mobile?contentId=140385202#content/view/140385202 (accessed on 1 December 2023).
- Alani, A.E., Abraim, M., Ghennioui, H., Ghennioui, A., Ikenbi, I., Dahr, F.E. Short term solar irradiance forecasting using sky images based on a hybrid CNN–MLP model. Energ Reports 2021, 7, 888–900. [CrossRef]
- Hunasigi, P., Jedhe, S., Mane, M., Patil-Shinde, V. Multilayer perceptron neural network based models for prediction of the rainfall and reference crop evapotranspiration for sub-humid climate of Dapoli, Ratnagiri District, India. Acta Ecologica Sinica 2023, 43, 154–201. [CrossRef]
- Das, B., Dursun, O.O., Toraman, S. Prediction of air pollutants for air quality using deep learning methods in a metropolitan city. Urban climate 2022, 46, 101291. [CrossRef]
- Rodriguez, F., Genn, M., Fontan, L., Galarza, A., 2021. Very short-term temperature forecaster using MLP and N-nearest stations for calculating key control parameters in solar photovoltaic generation. Sustainable Energy Technologies and Assessments 45, 101085.
- Lindholm, A., Wahlström, N., Lindsten, F. and Schön, T.B., 2019. Supervised machine learning. Department of Information Technology, Uppsala University: Uppsala, Sweden, p.112.
- Kassambara, A., 2018. Machine learning essentials: Practical guide in R. Edition 1.(stdha.com/English).
- Touzet, C. Les réseaux de neurones artificiels, introduction au connexionnisme : Cours, exercices et travaux pratiques. Ec2, 1992, collection de l’EERIE. hal-01338010.
- Abadi, M. Réalisation d’un réseau de neurones ”SOM” sur une architecture matérielle adaptable et extensible à base de réseaux sur puce ”NoC”. Université de Lorraine; Université du Centre (Sousse, Tunisie), 2018. Available online: https://tel.archives-ouvertes.fr/tel-01868313https://tel.archives-ouvertes.fr/tel-01868313.
- Parizeau, M., 2004. Le perceptron multicouche et son algorithme de rétropropagation des erreurs. Département de génie électrique et de génie informatique, Université de Laval.
- Hopfield, J.J. Neural networks and physical systems with emergent collective computational abilities. In Proceedings of the national academy of sciences 1982, 79, 2554–2558. [Google Scholar] [CrossRef] [PubMed]
- Buerkert, A. Private communication, 2023.
- Meunier, D., Beysens, D. Dew, fog, drizzle and rain Water in Baku (Azerbaijan). Atmos. Res. 2016, 178, 65–72.
- Huang, B., Su, T., Zhi, R., Zhang, Z., Shen, H., Wu, Y., Feng, T. Synergistic effect of El Niño Southern oscillation and subtropical Indian Ocean Dipole on Southern China winter precipitation. Atmos. Res. 2023, 293, 106928. [CrossRef]
- IOD, 2023. Available online: http://la.climatologie.free.fr/iod/iod.htm (accessed on 1 December 2023).
Figure 1.
Map of Madagascar with the different sites involved in this study (from [34]). Inset: Area where dew measurements were calculated and/or collected. Details are highlighted in red boxes (from [35]).
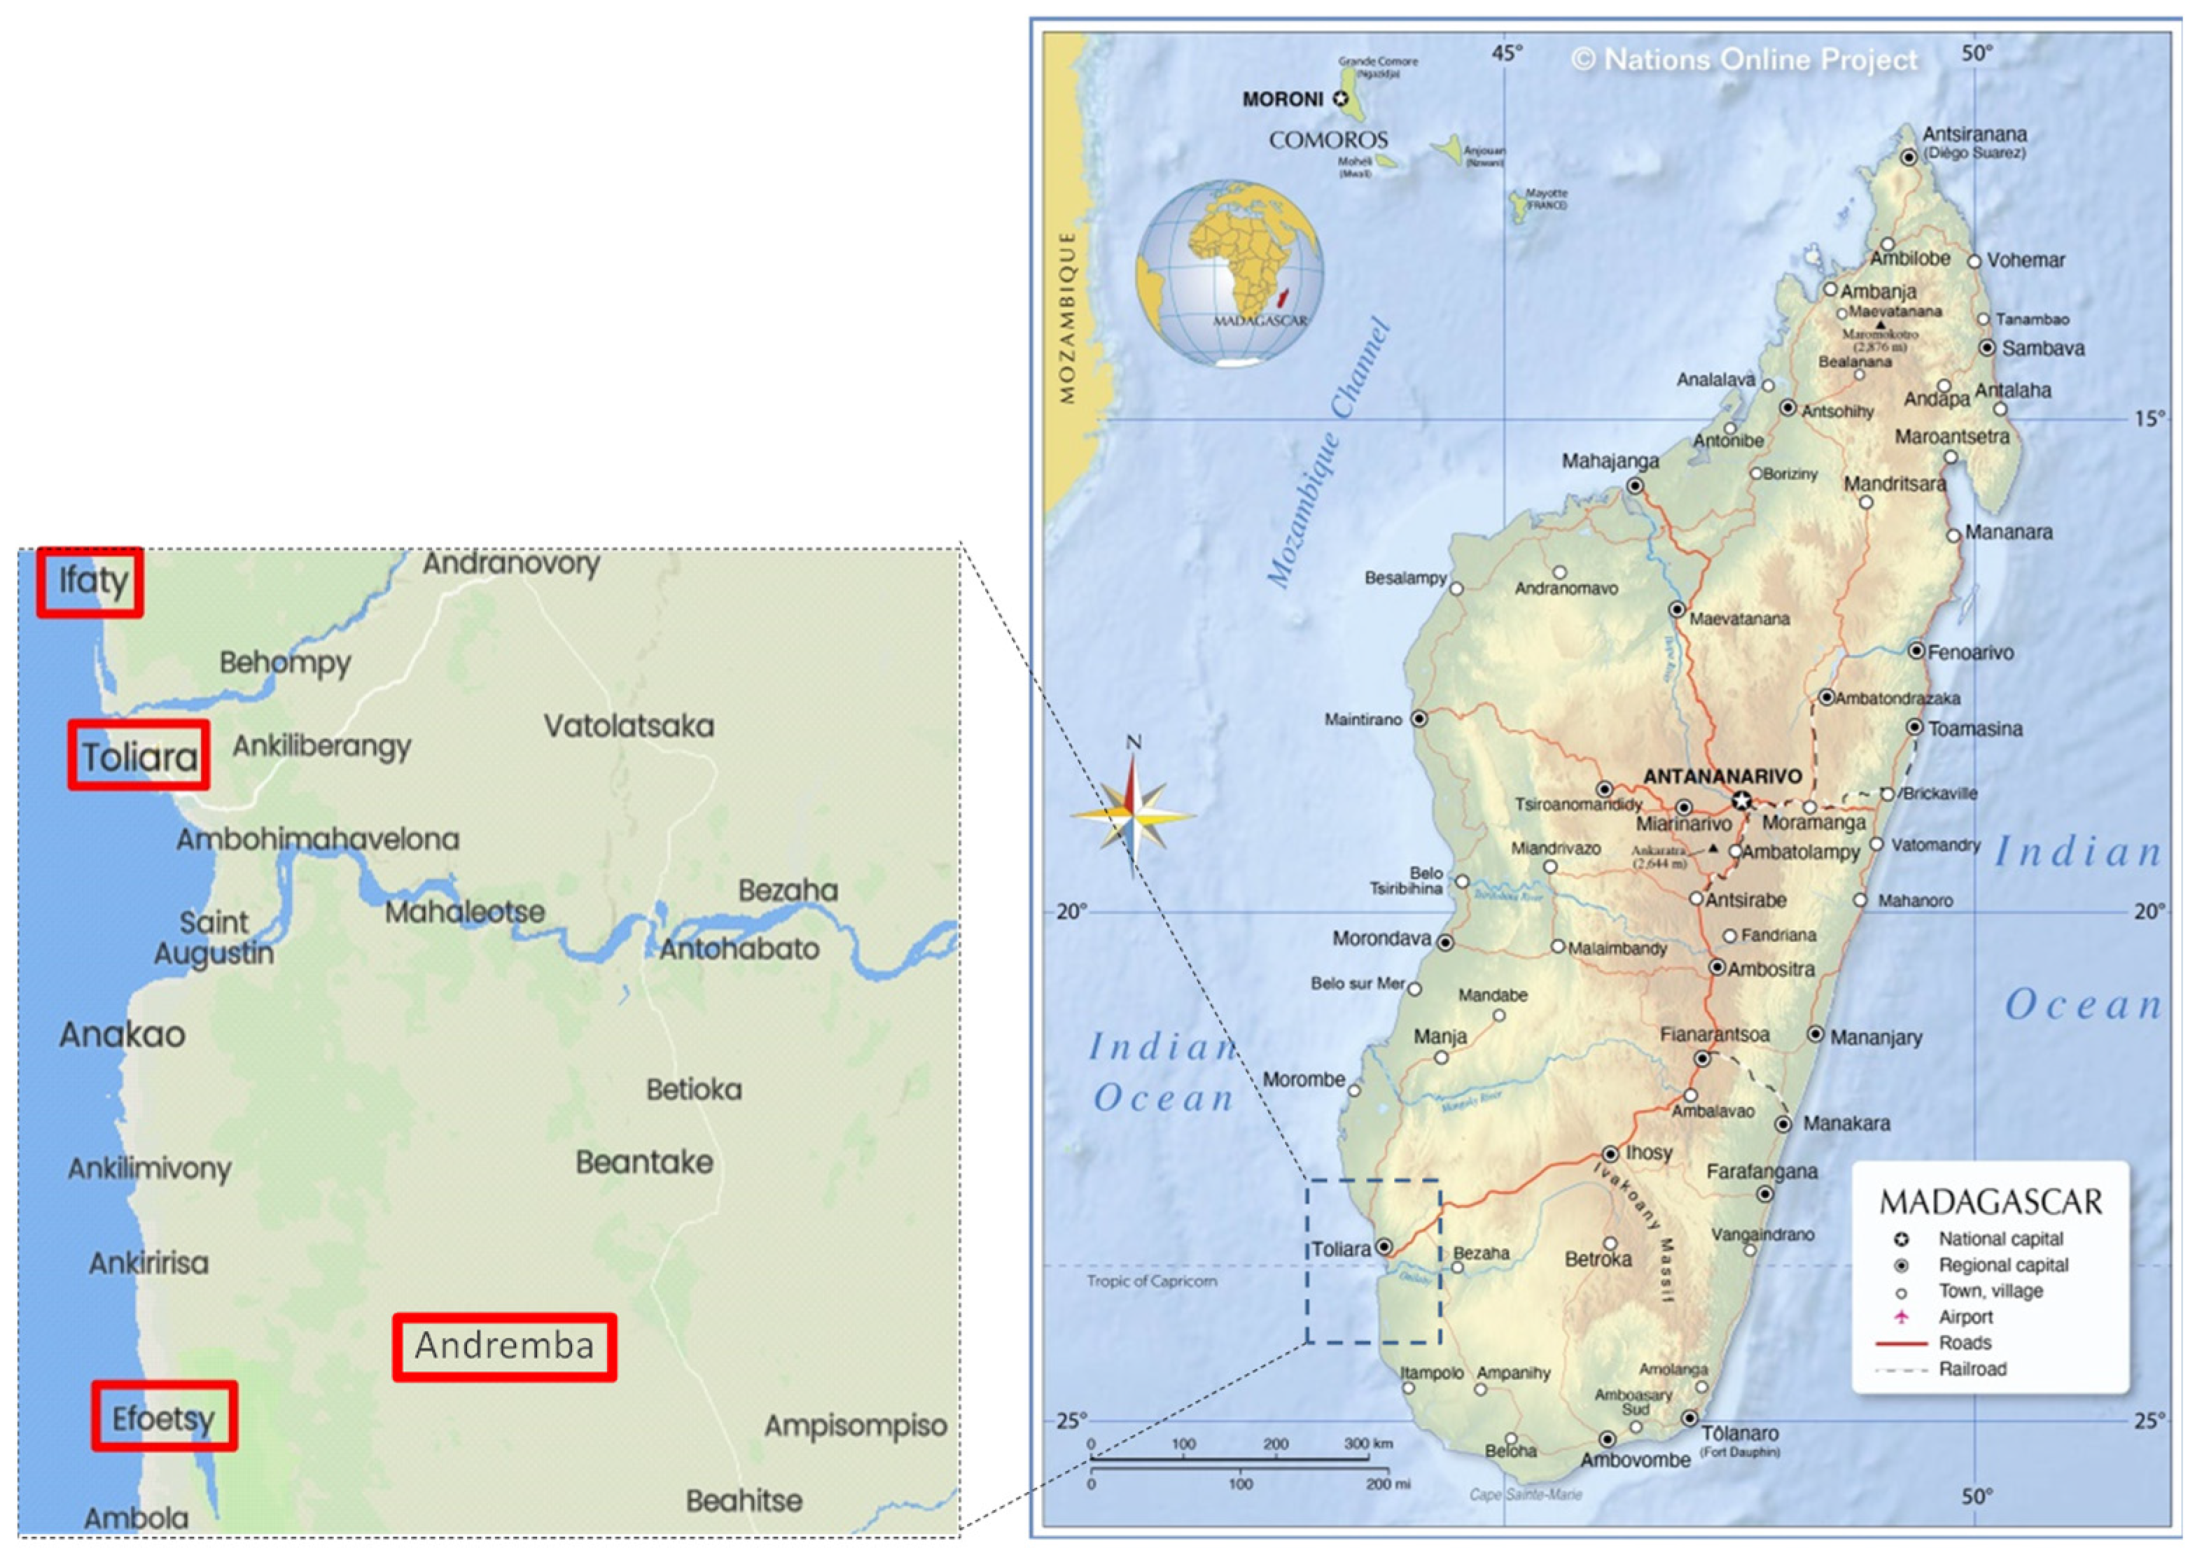
Figure 2.
MLP-ANN configurations for monthly dew yields prediction. When using a MLP-ANN, it is customary to add a value “1” called ‘neuron bias’ to the input of a neuron. The bias is a kind of local weight that is used in several activation functions [48].
Figure 2.
MLP-ANN configurations for monthly dew yields prediction. When using a MLP-ANN, it is customary to add a value “1” called ‘neuron bias’ to the input of a neuron. The bias is a kind of local weight that is used in several activation functions [48].
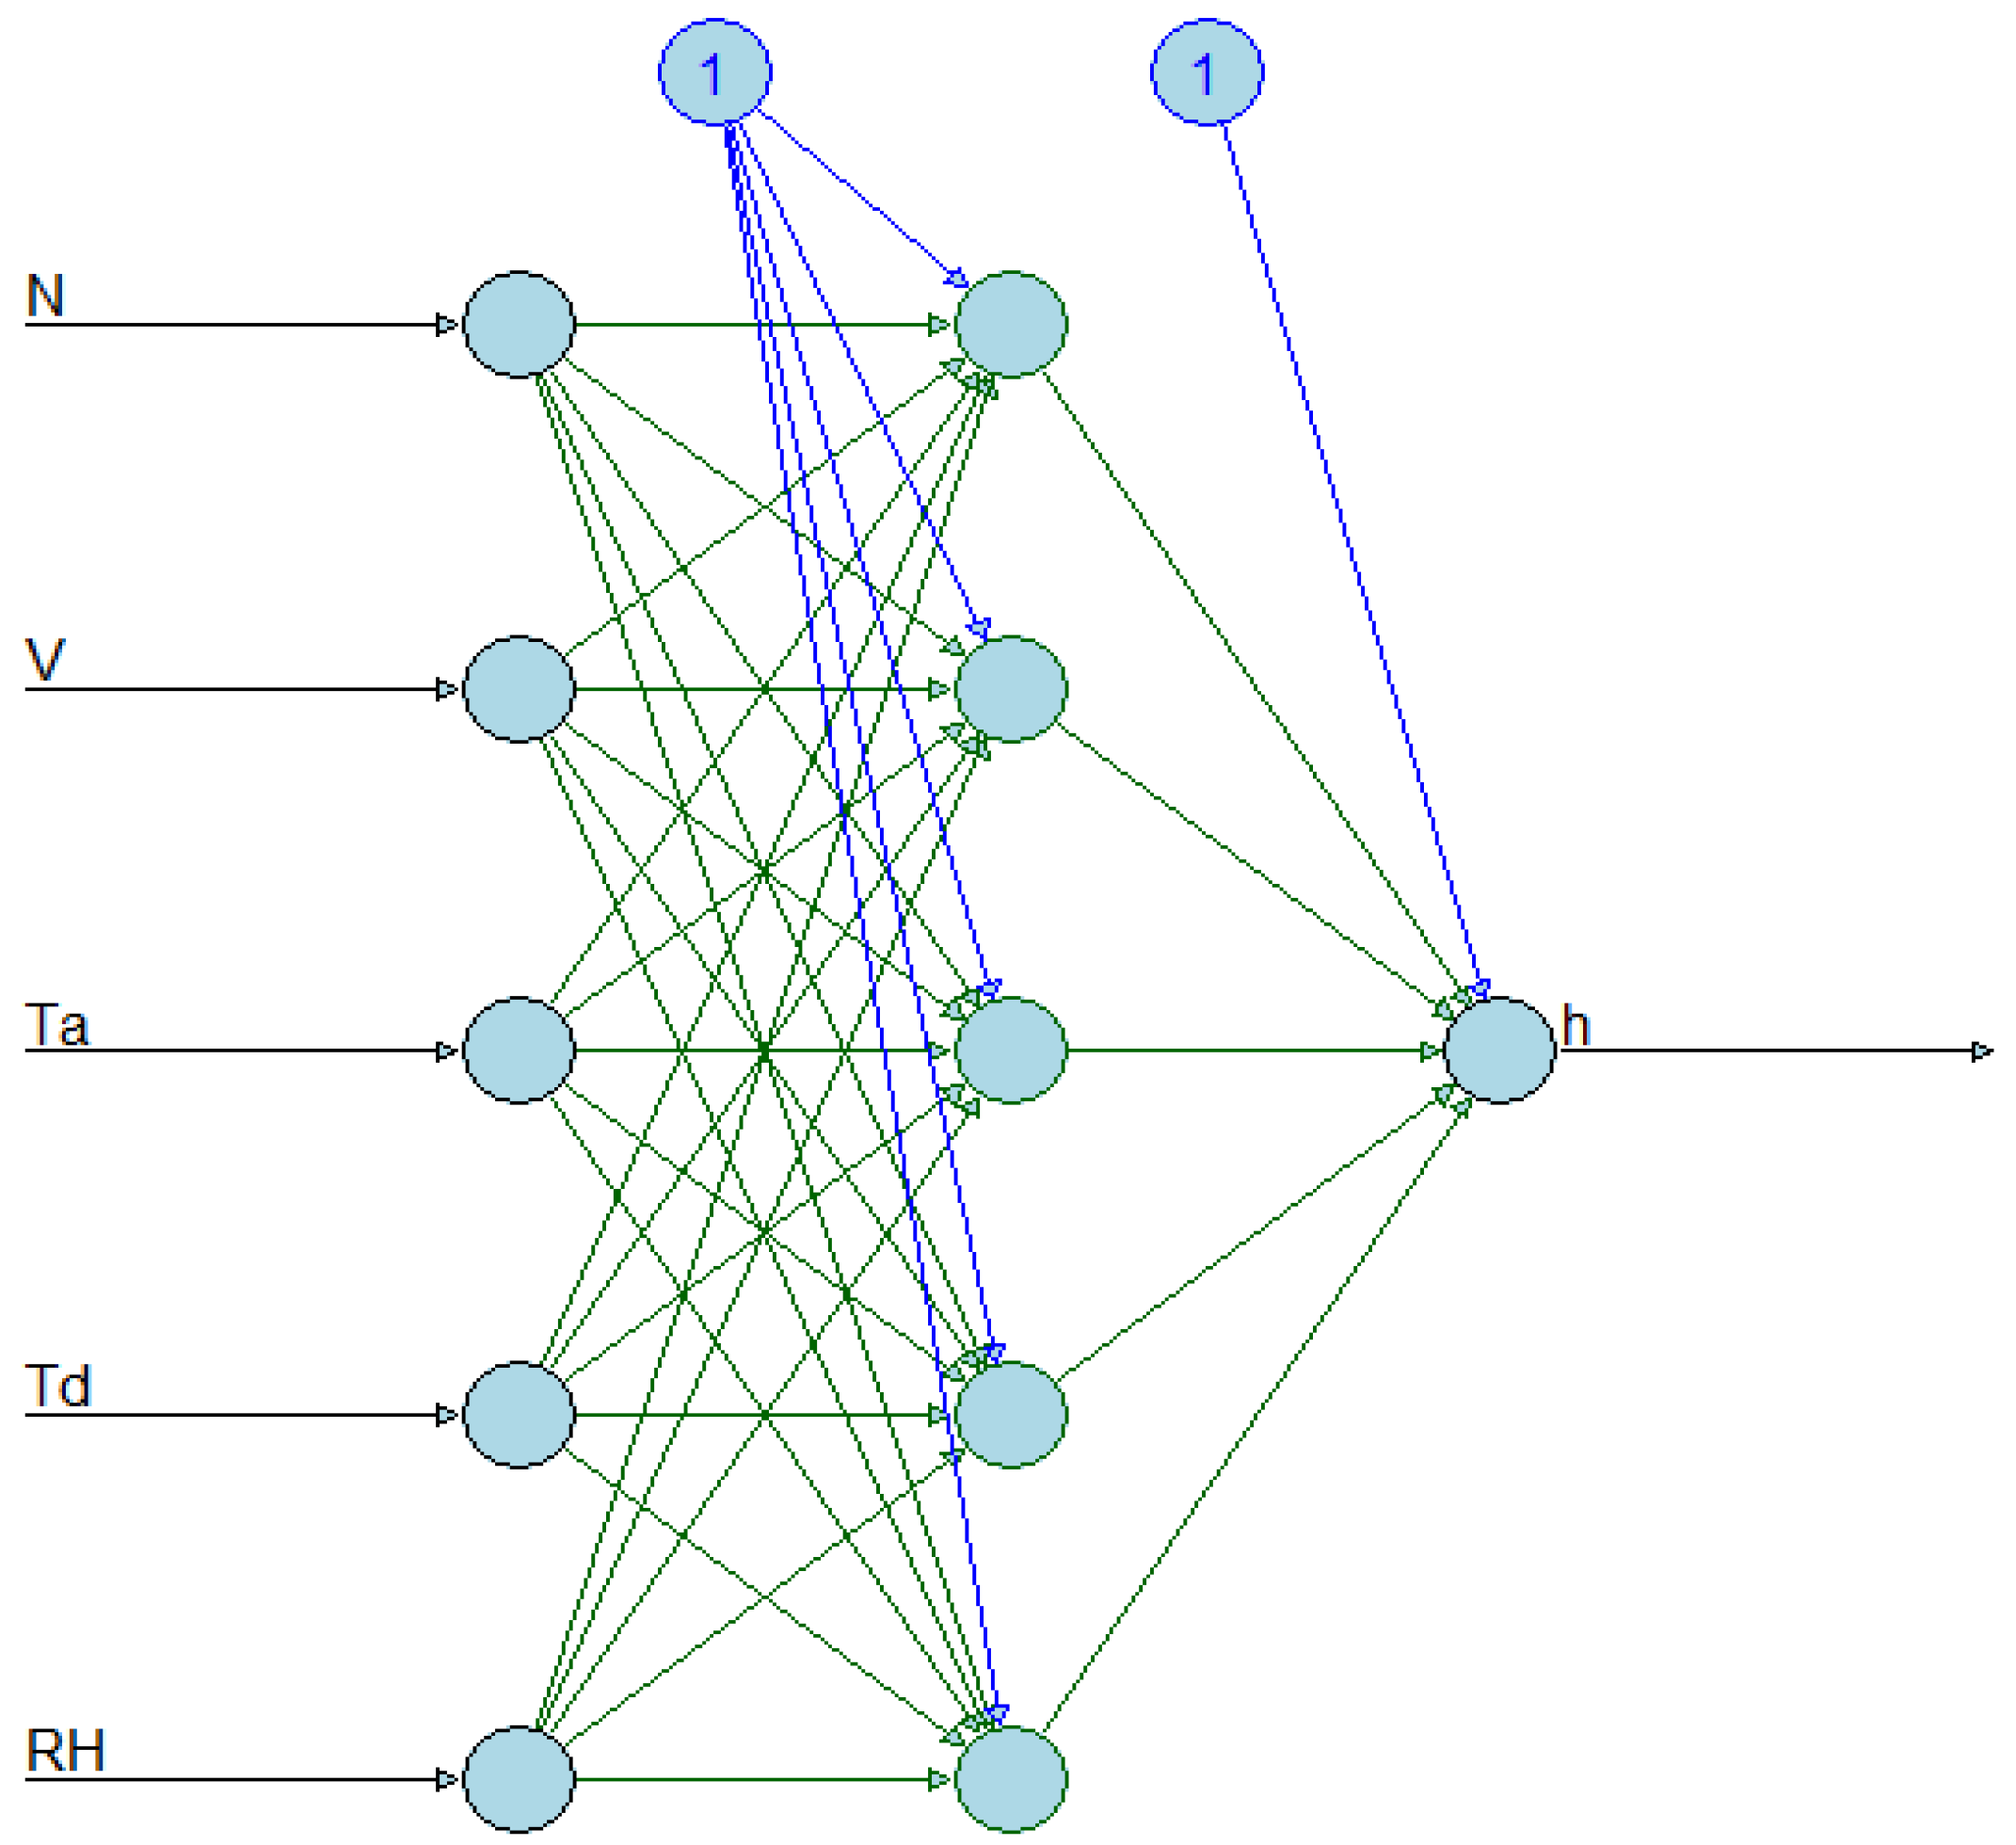
Figure 3.
Algorithm for dew yields prediction.
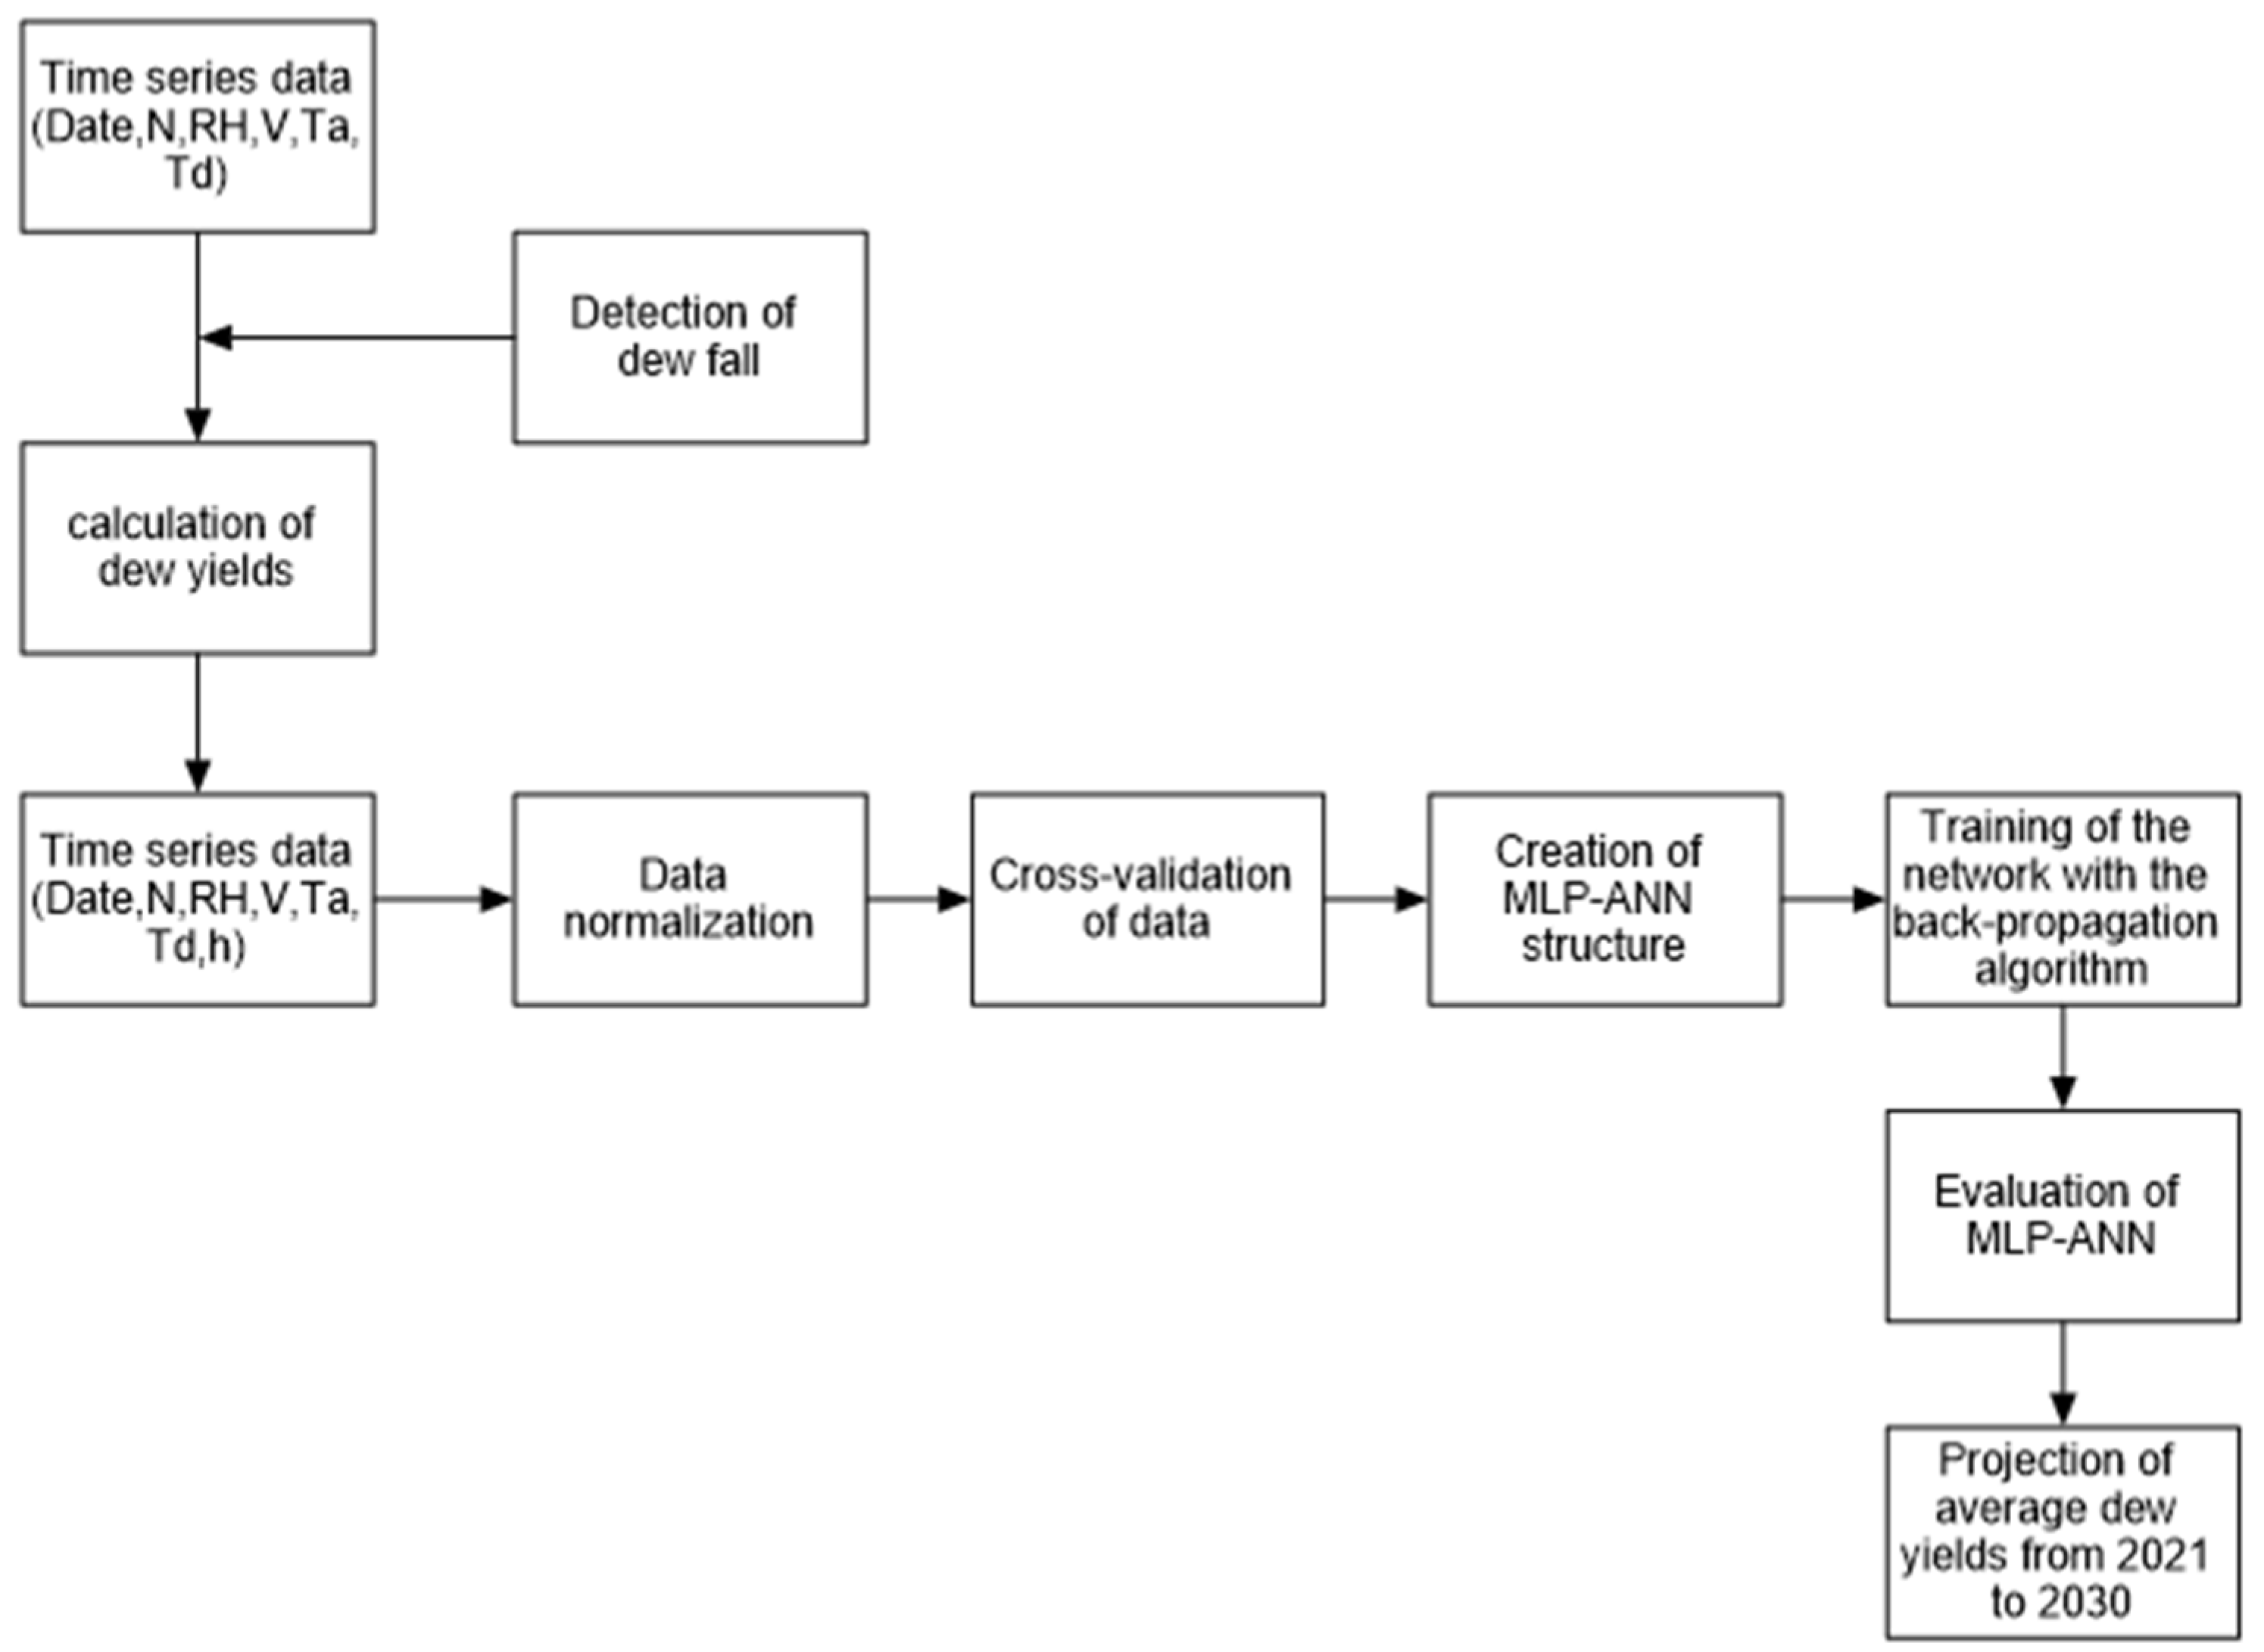
Figure 4.
Summed values of dew yield h (mm) between Apr. 2013 and Sept. 2014. Calculated values (this work) are from meteo data in Ifaty (pink diamonds), Toliara (inverted green triangles) and Amdremba (cyan triangles). Measurement data from [29] are in Efoetsy (black circles) and in Amdremba (blue squares).
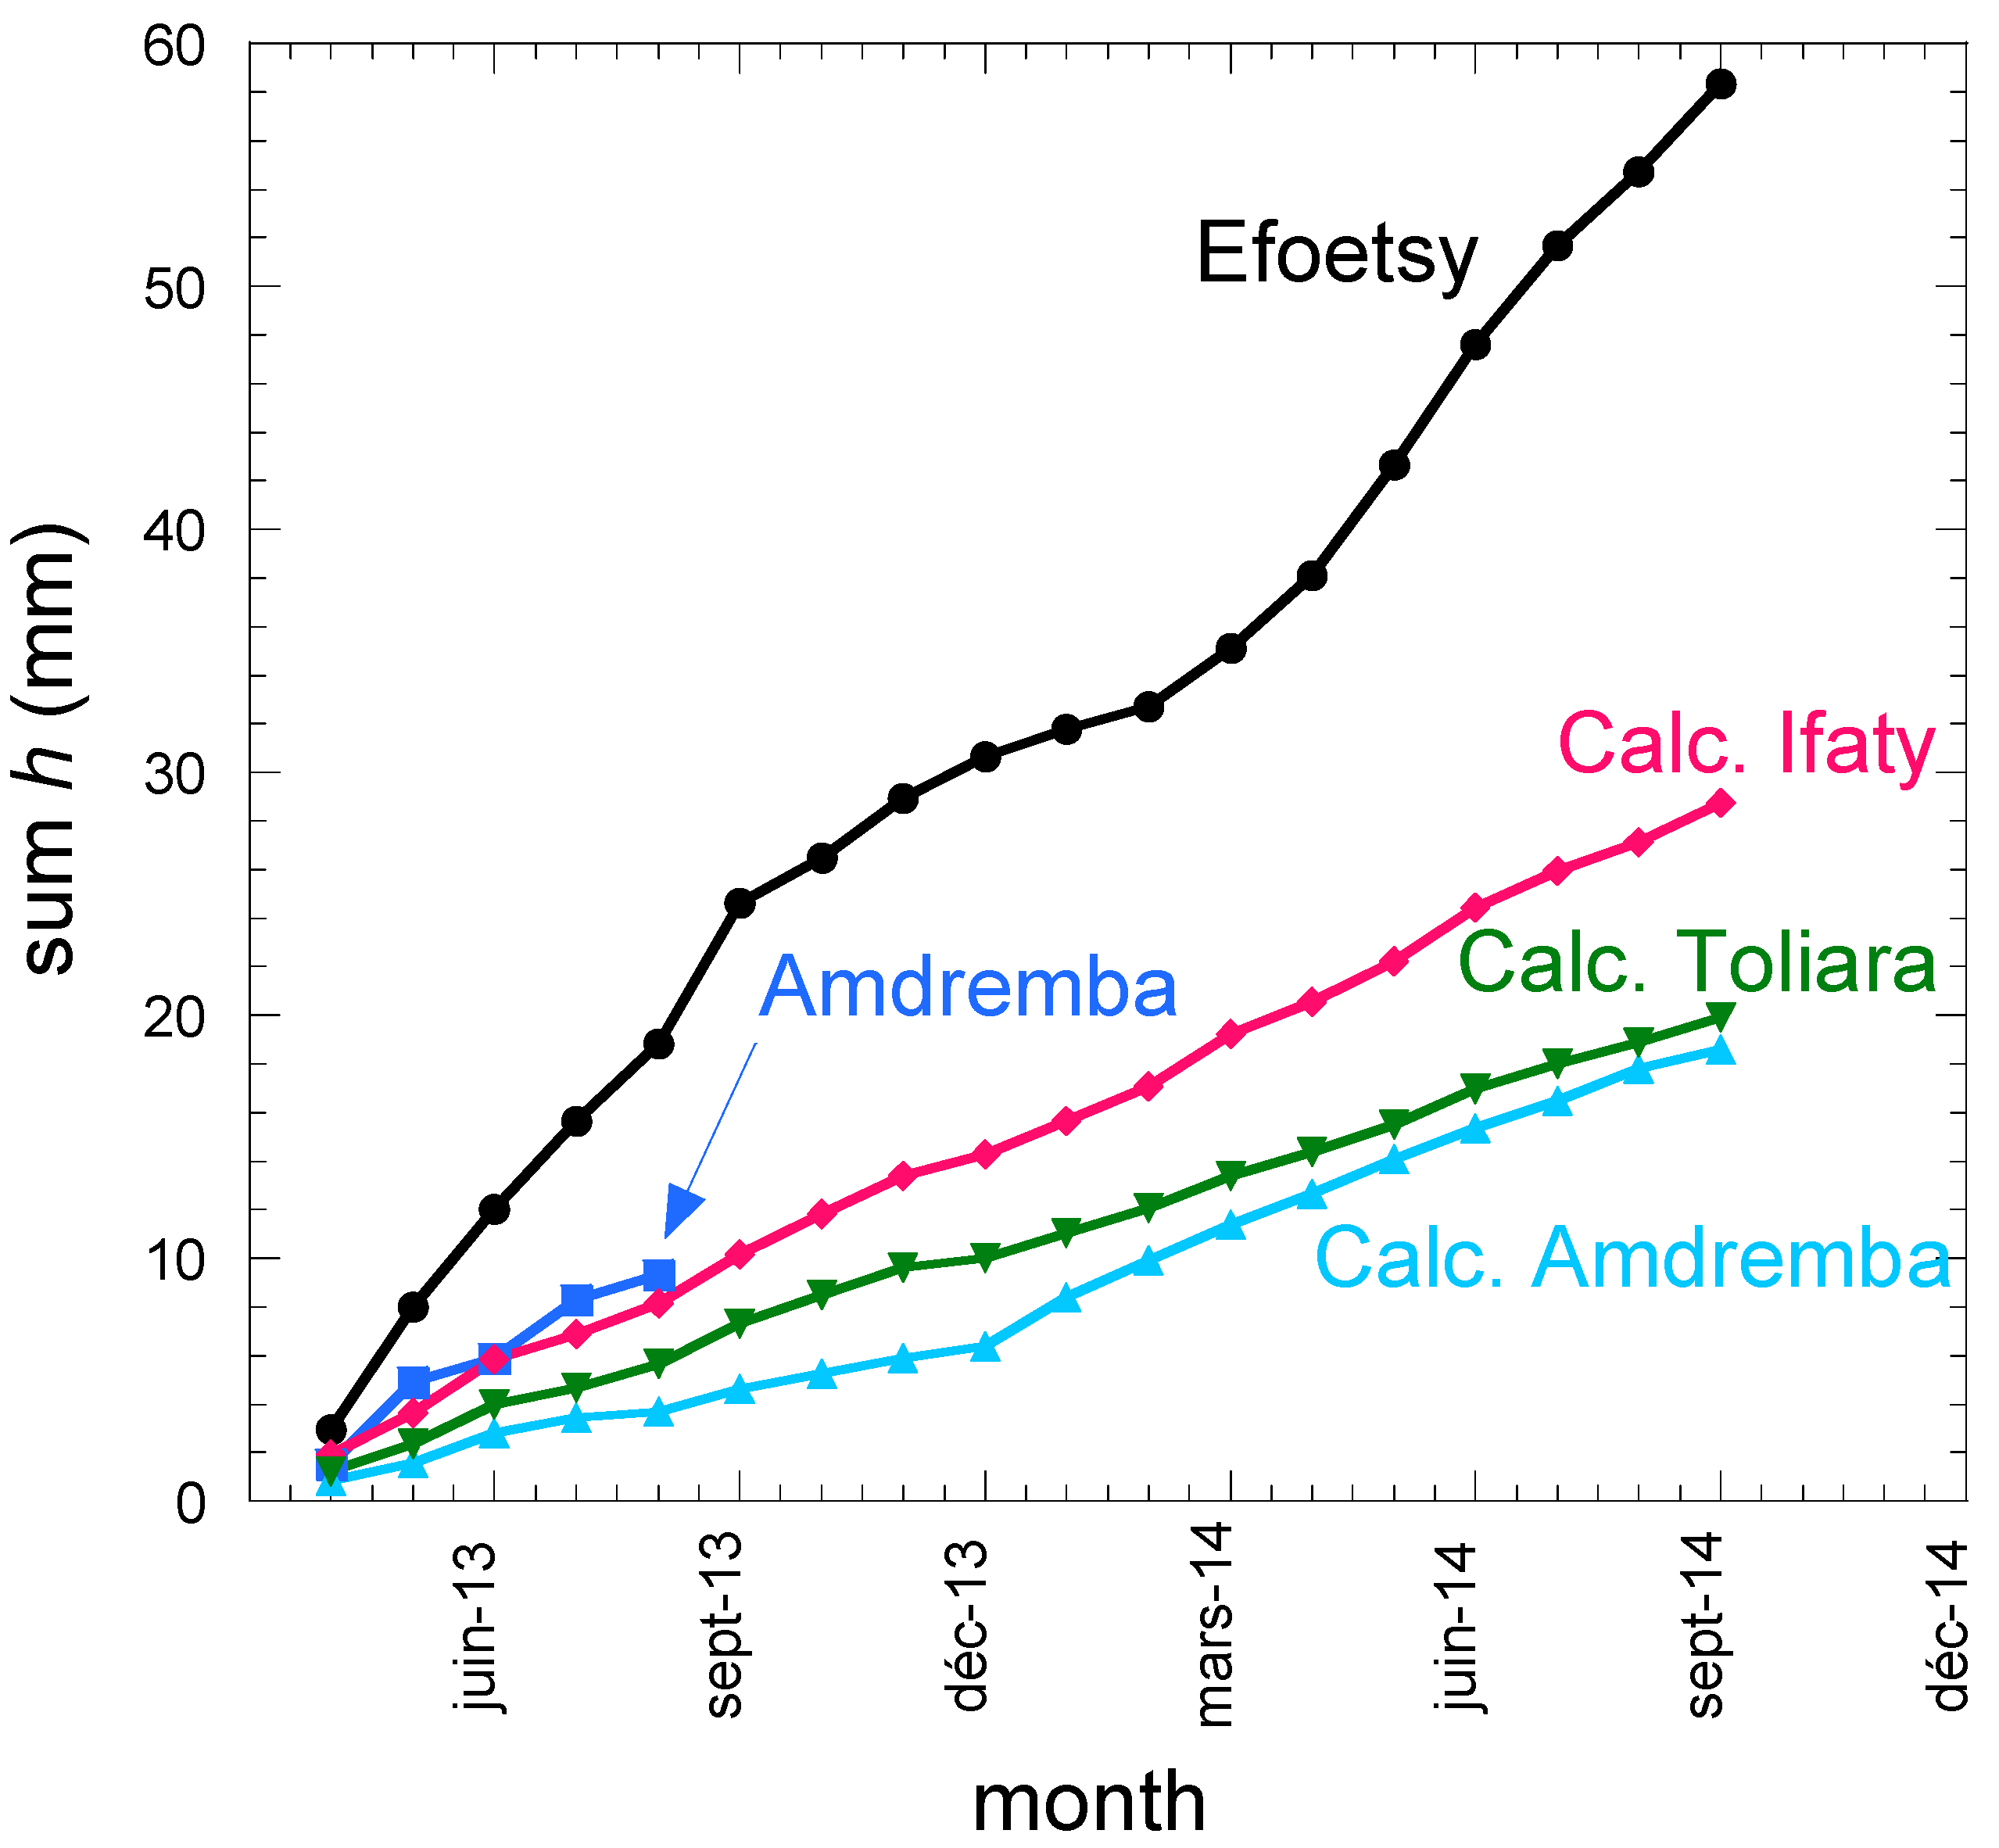
Figure 5.
Evolution of the monthly dew yields h in mm.mth-1 calculated in Ifaty. Grey lines: 01-1991-07-2023 data; blue lines: 08-2022-07-2033 extrapolated data, see section Section 3.3.2; red dots: 08-2022-07-2023 validation period data. The bold blue curve is a smoothing of the data.
Figure 5.
Evolution of the monthly dew yields h in mm.mth-1 calculated in Ifaty. Grey lines: 01-1991-07-2023 data; blue lines: 08-2022-07-2033 extrapolated data, see section Section 3.3.2; red dots: 08-2022-07-2023 validation period data. The bold blue curve is a smoothing of the data.
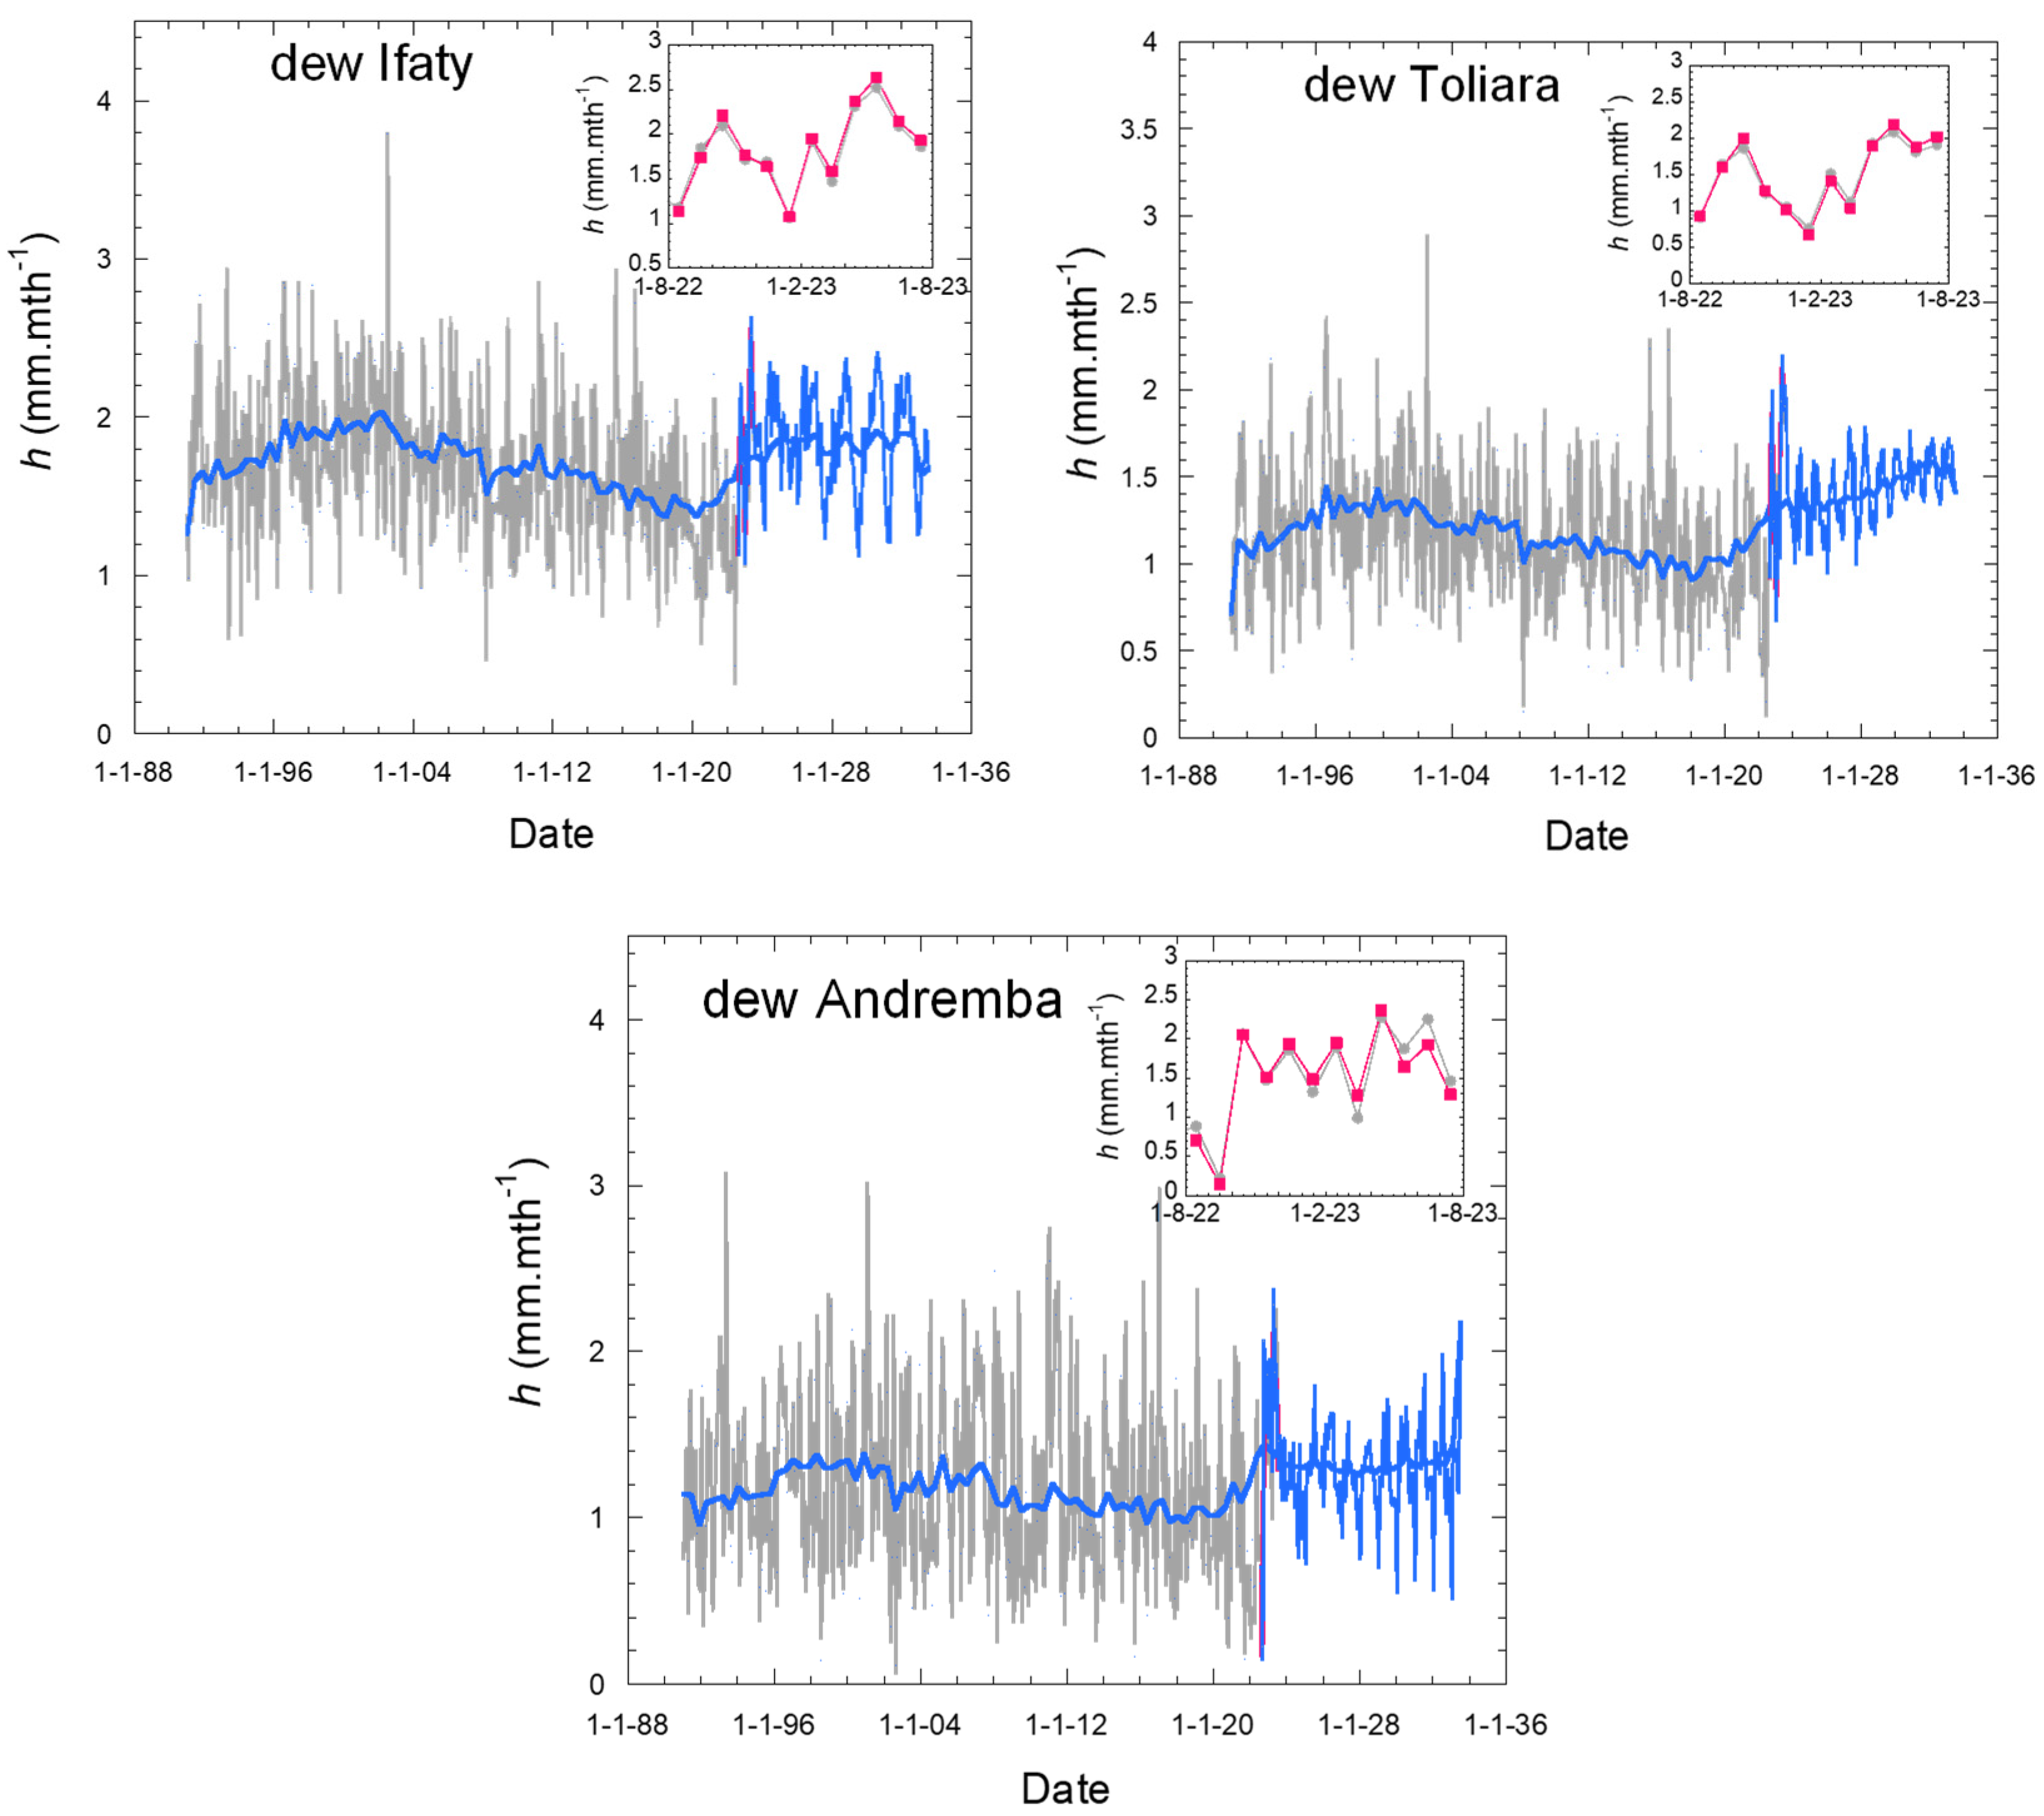
Figure 6.
Dew yield in the dry (Apr. - Oct.) and rainy (Nov. - Mar.) seasons between 1991 and 2023 sorted with respect to years. (a) Ifaty, (b) Toliara and (c) Andremba.
Figure 6.
Dew yield in the dry (Apr. - Oct.) and rainy (Nov. - Mar.) seasons between 1991 and 2023 sorted with respect to years. (a) Ifaty, (b) Toliara and (c) Andremba.
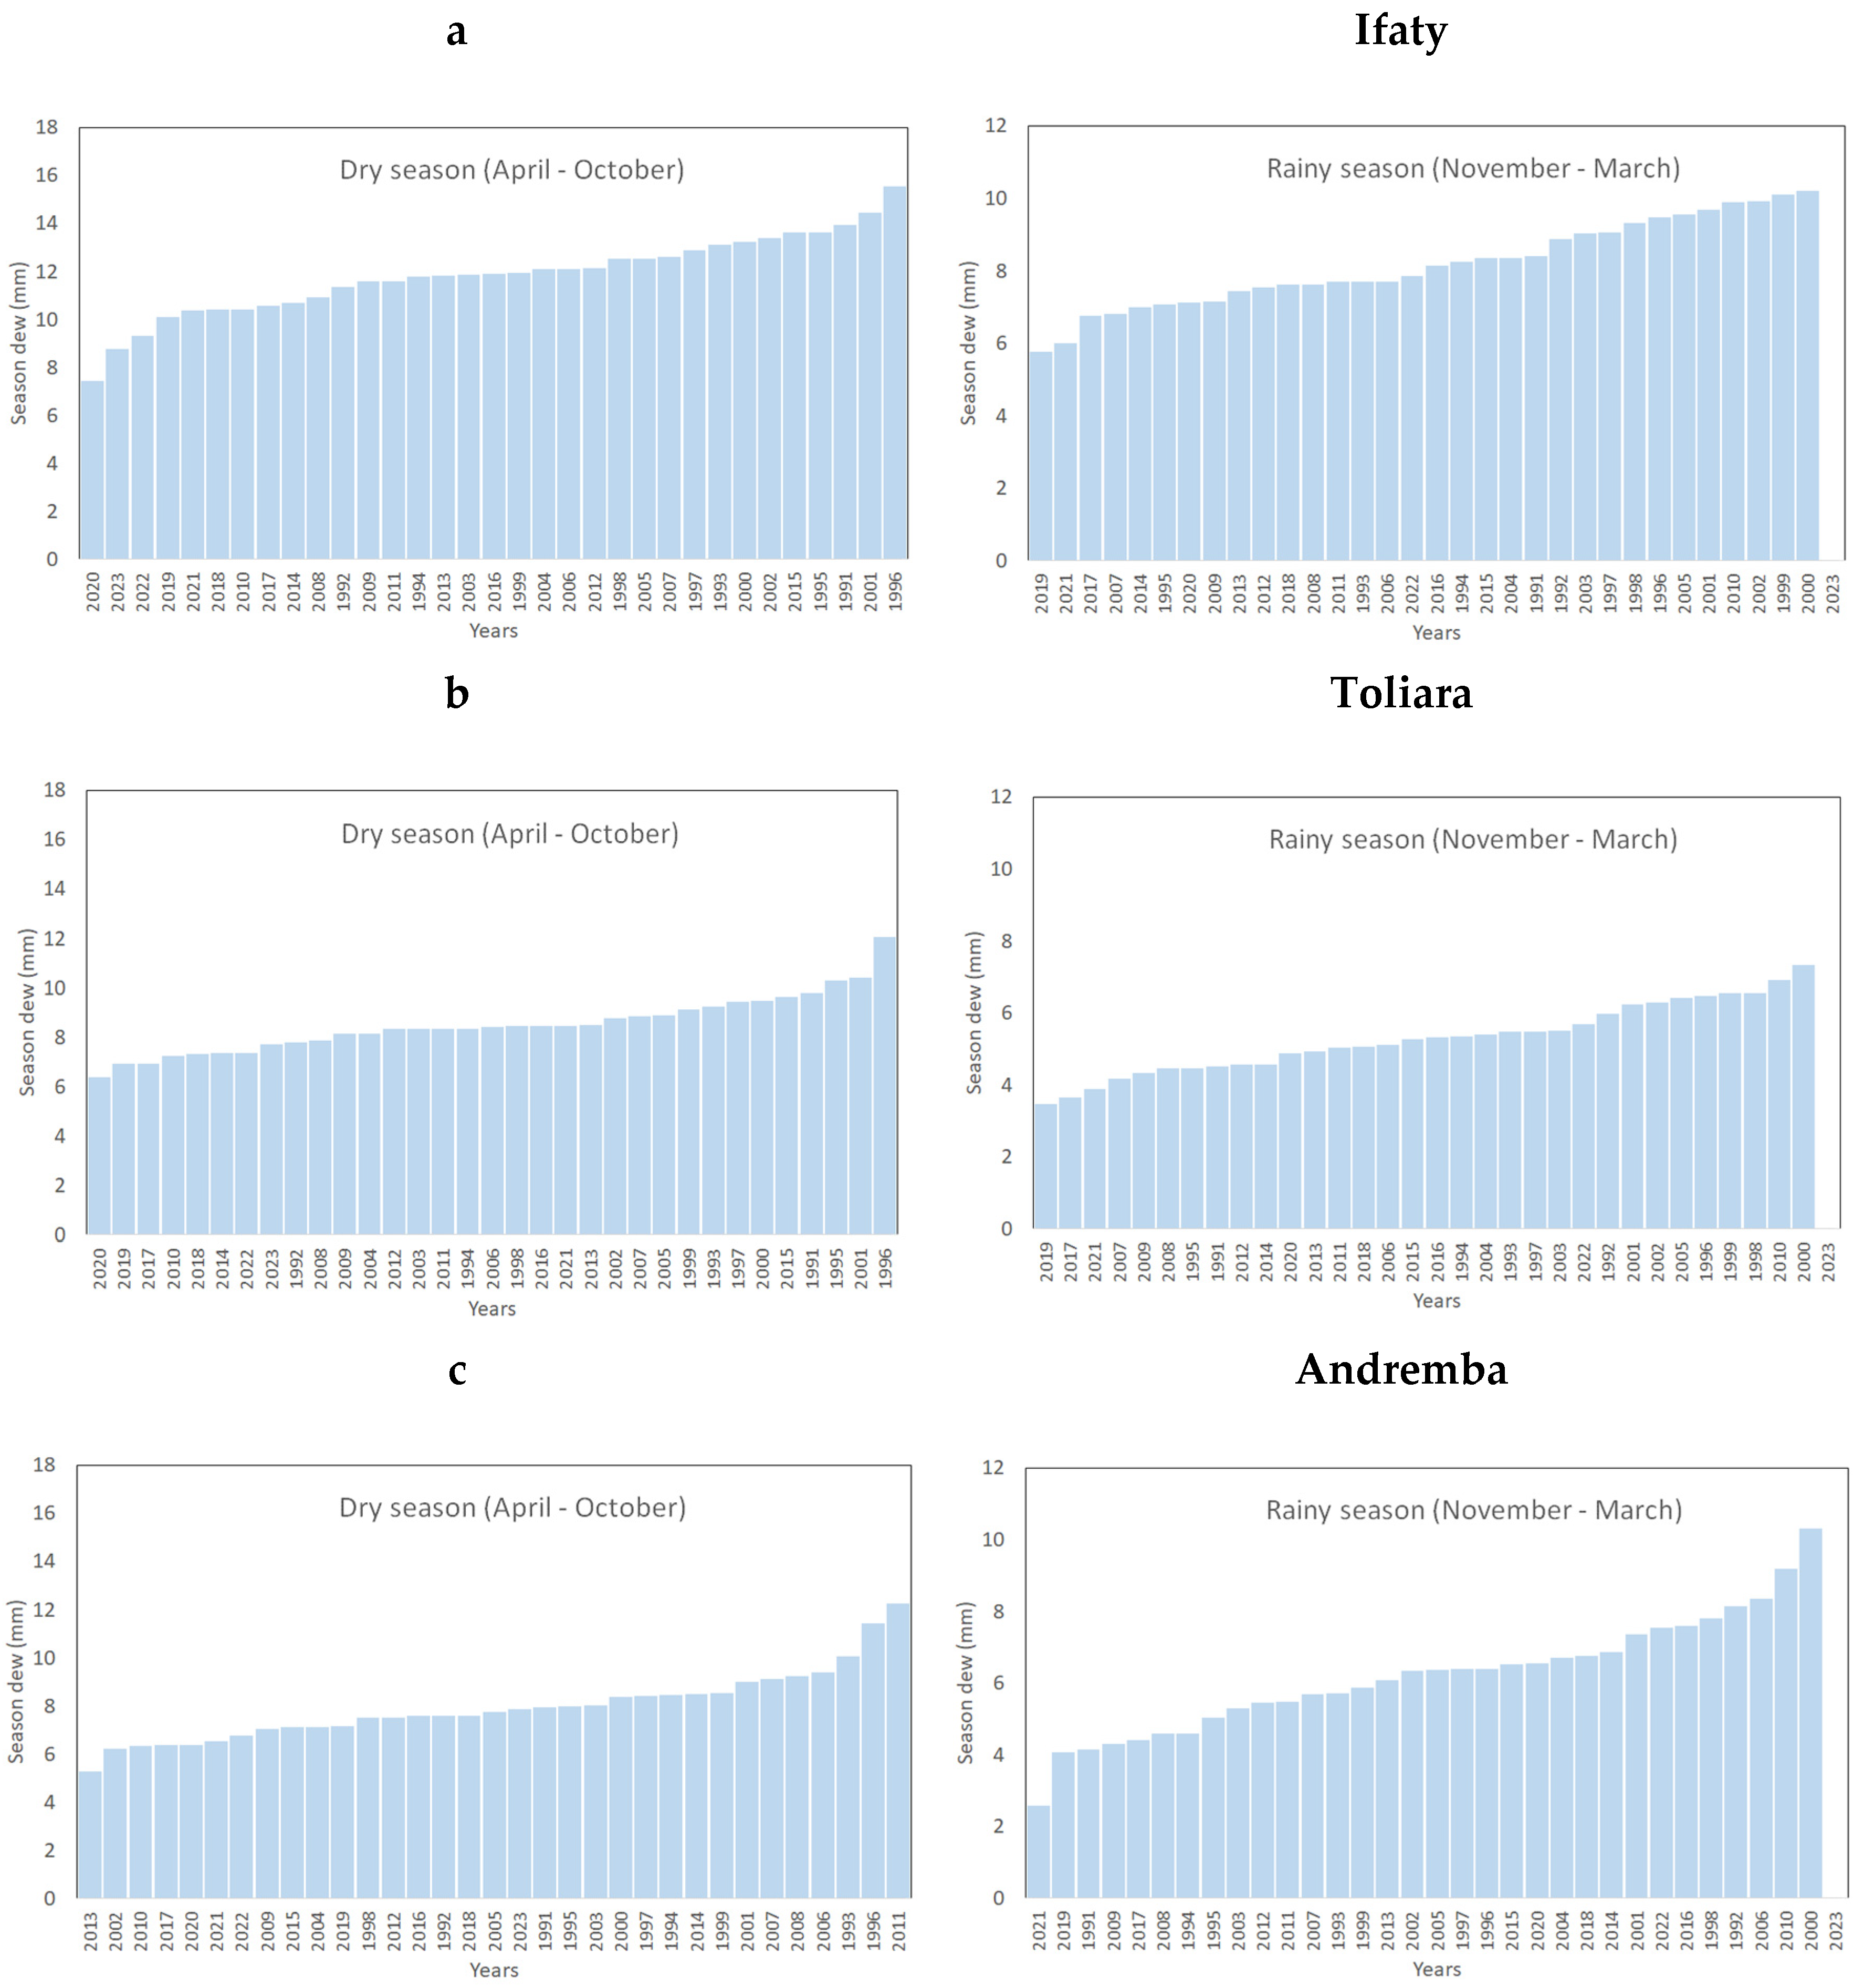
Figure 7.
Frequency of events showing Nc consecutive days without dew in the dry (Apr. - Oct.) and rainy (Nov. - Mar.) seasons for the whole period 1991-2023 (semi-log plot). Red circles and lines: dry season; blue squares and lines: rainy season. (a) Ifaty, (b) Toliara and (c) Andremba.
Figure 7.
Frequency of events showing Nc consecutive days without dew in the dry (Apr. - Oct.) and rainy (Nov. - Mar.) seasons for the whole period 1991-2023 (semi-log plot). Red circles and lines: dry season; blue squares and lines: rainy season. (a) Ifaty, (b) Toliara and (c) Andremba.
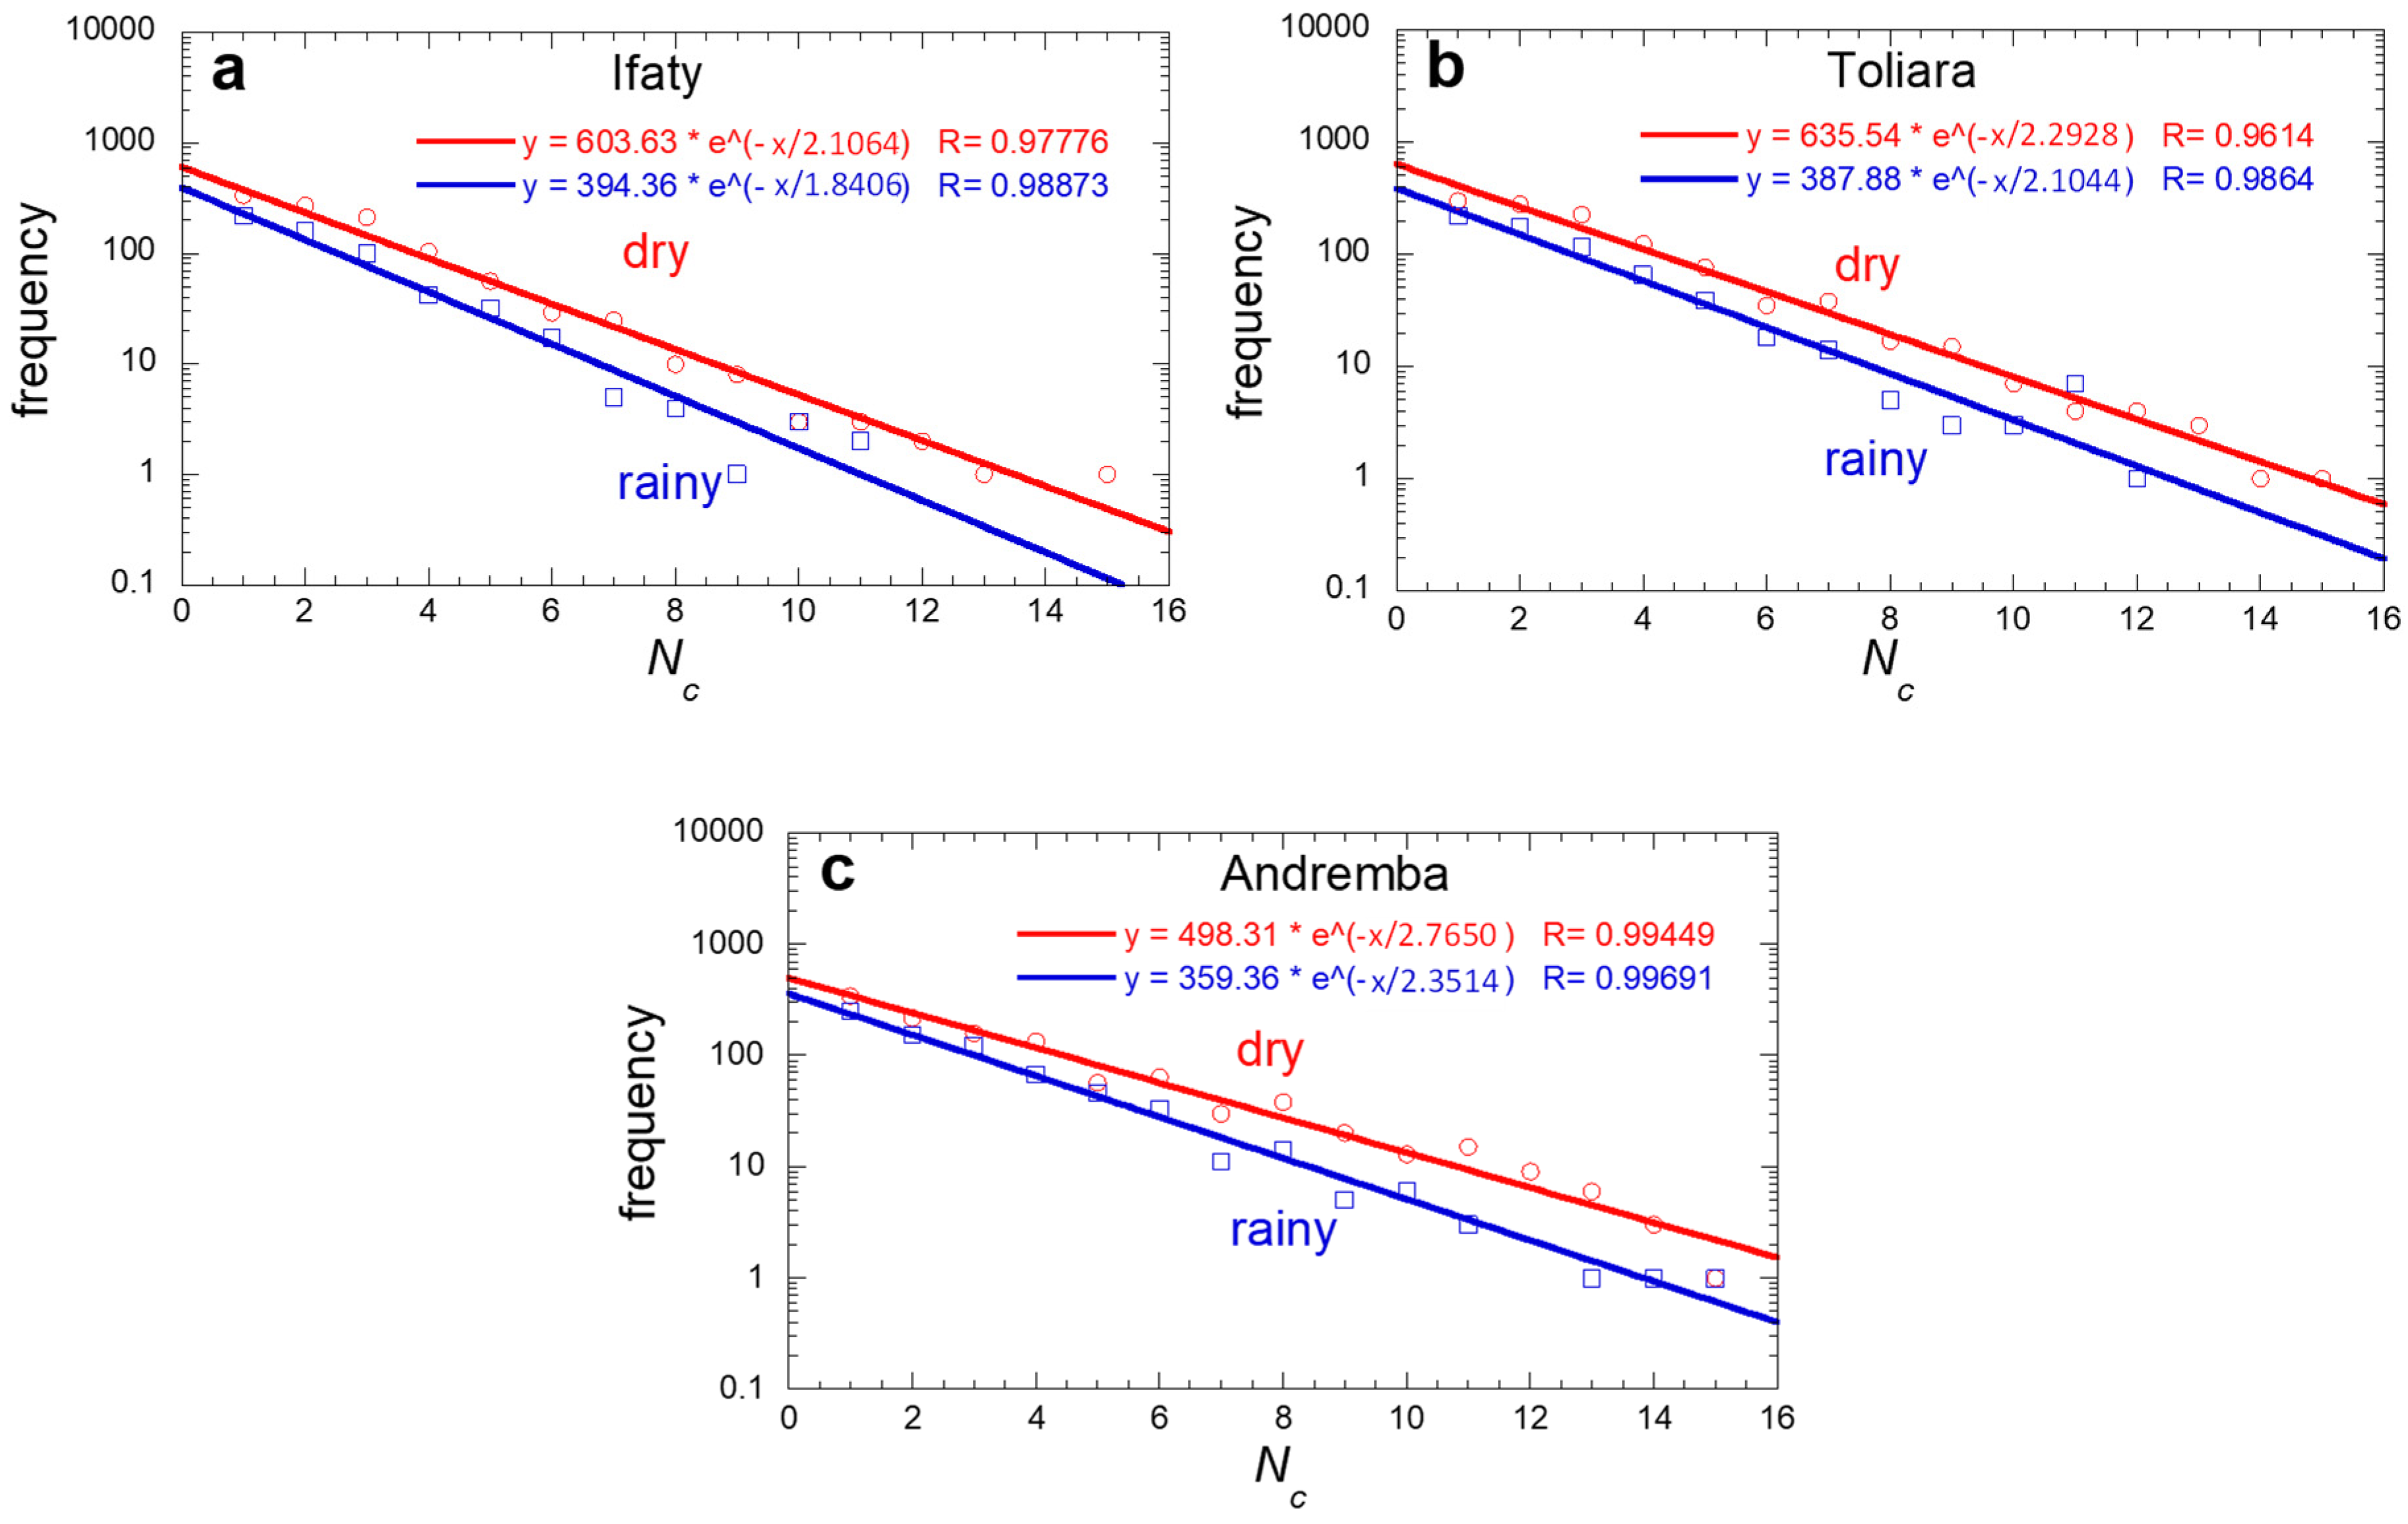
Figure 8.
Evolution of the typical number of consecutive days without dew, Nc, for the dry season (Apr.-Oct., red circles) and the rainy season (Nov.-March, blues squares). The full and interrupted curves are smoothening functions.
Figure 8.
Evolution of the typical number of consecutive days without dew, Nc, for the dry season (Apr.-Oct., red circles) and the rainy season (Nov.-March, blues squares). The full and interrupted curves are smoothening functions.
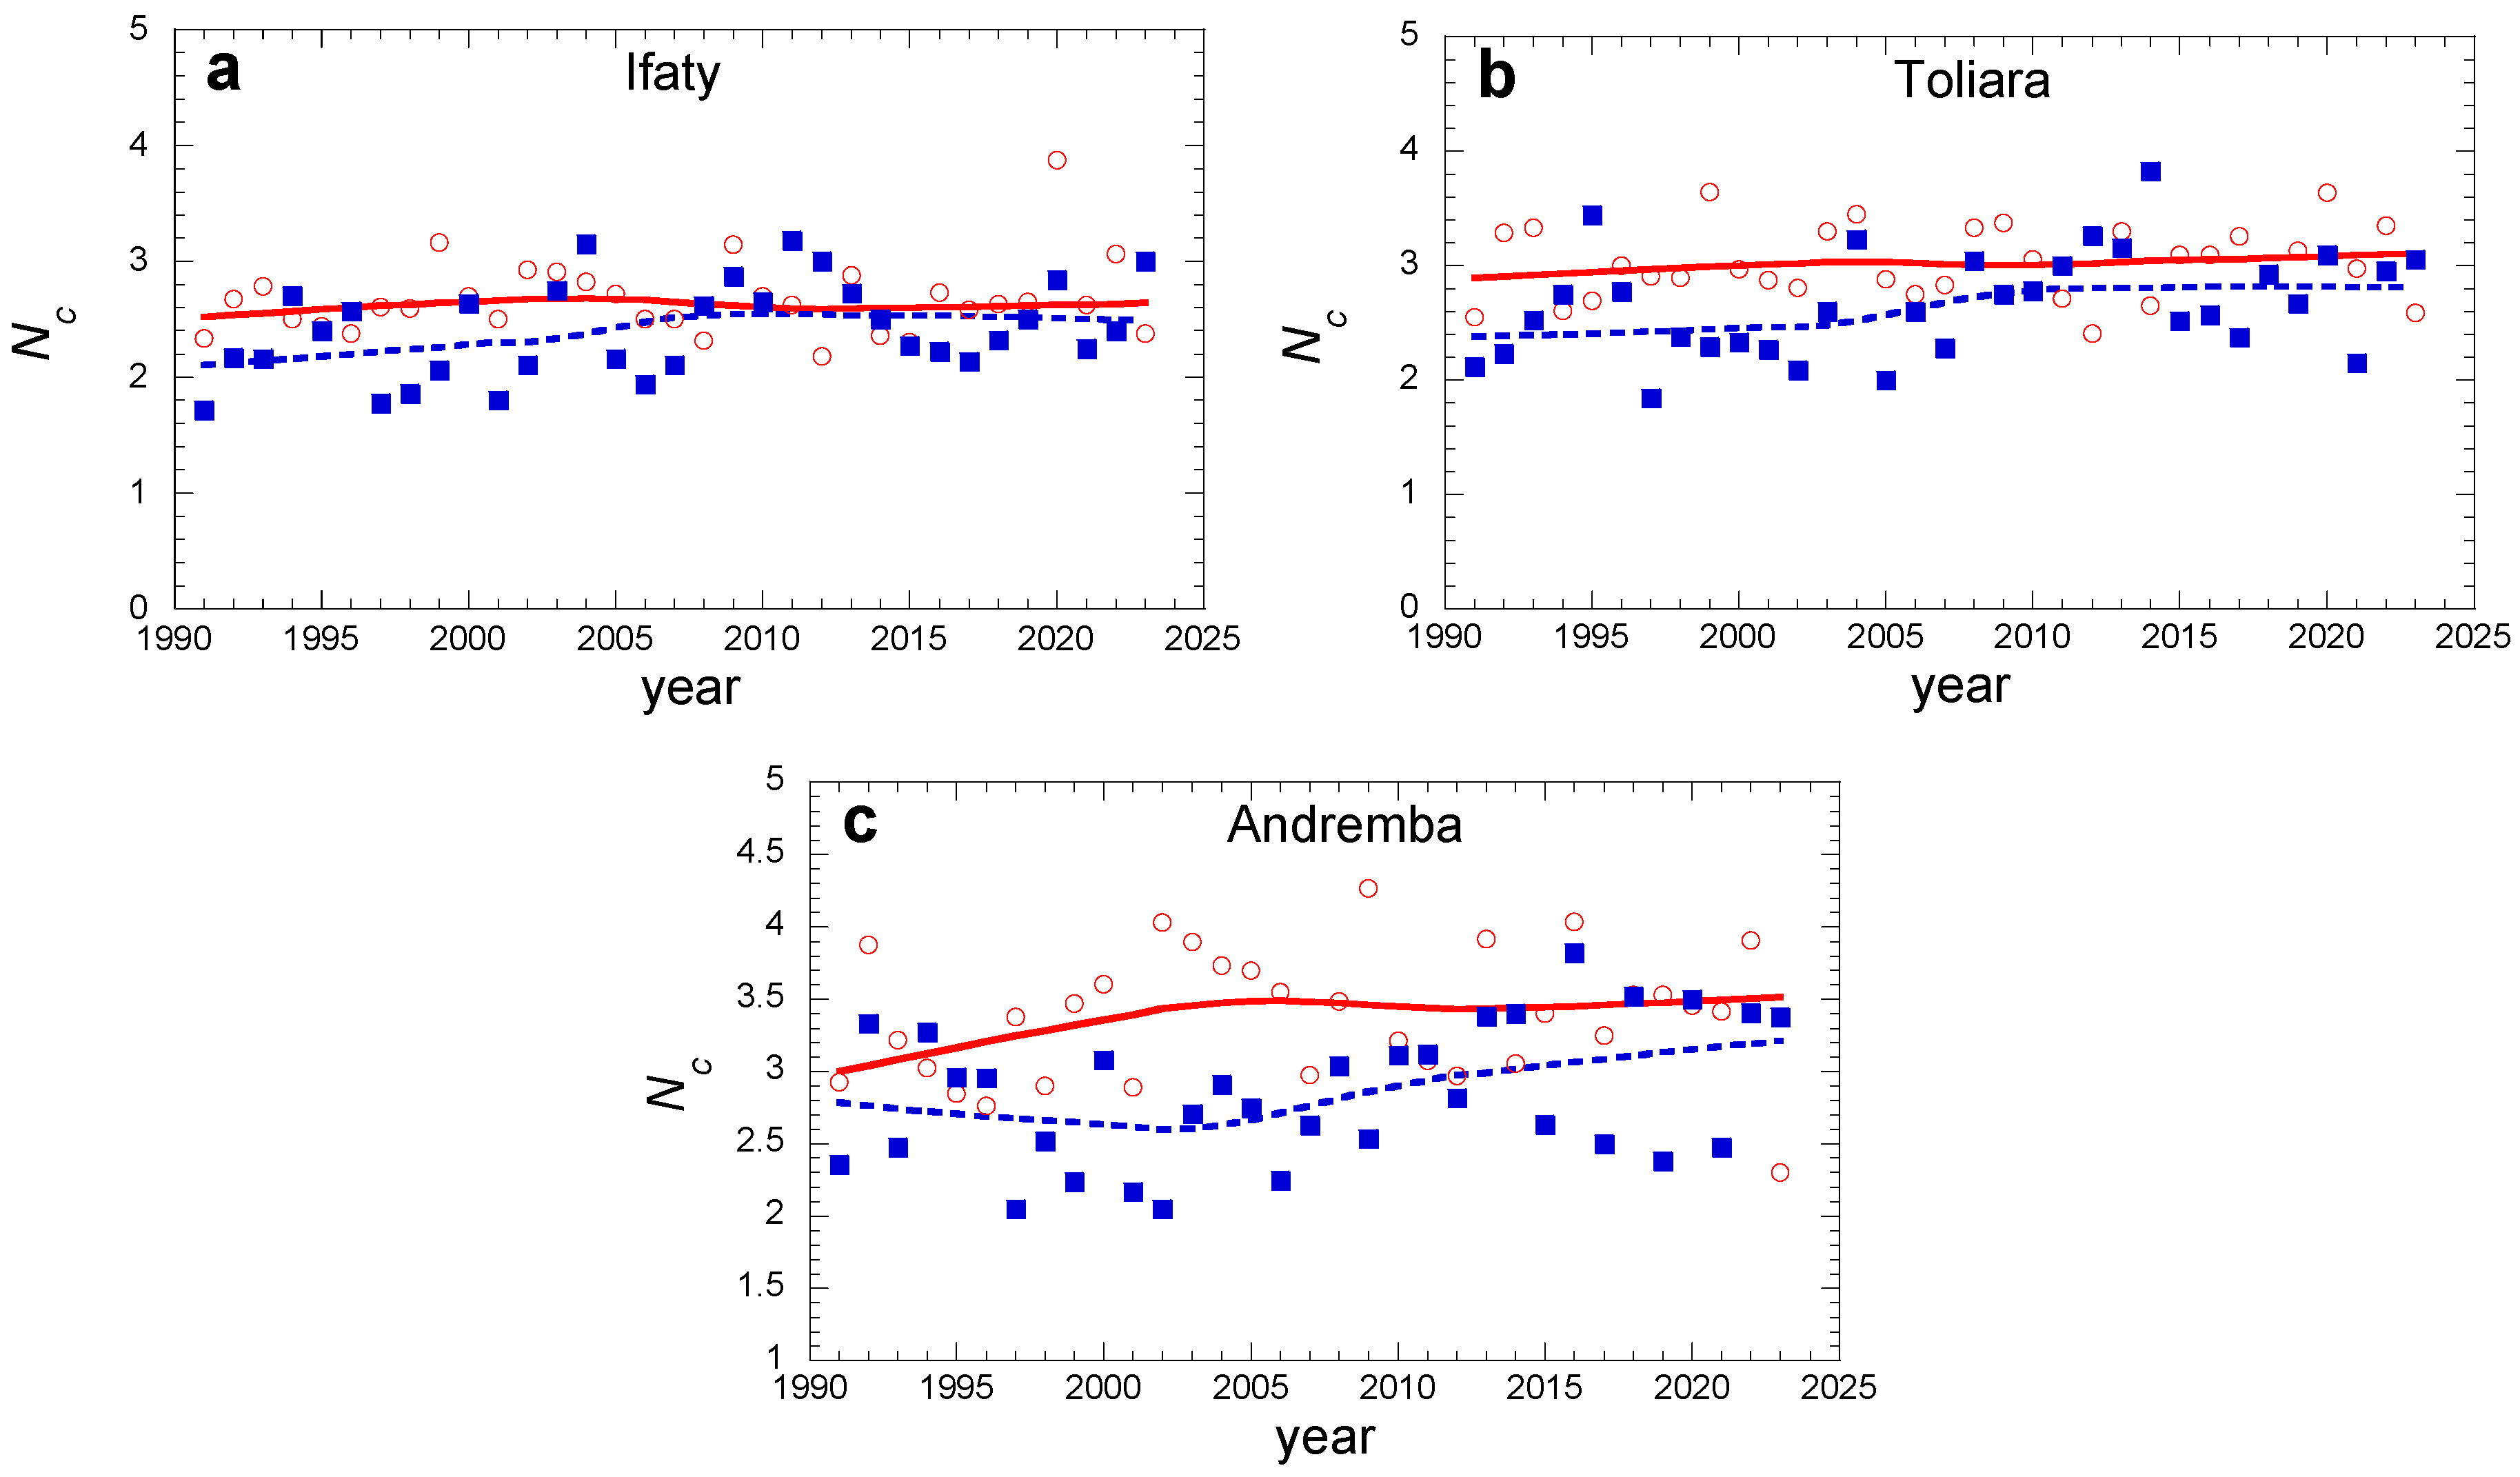
Figure 9.
Evolution of the monthly rainfalls. Grey data are from meteo data (1991-2022) and blue data are extrapolations from the MLP-ANN model (2023-2033) with overlap data (Aug. 2022-July 2023) in red (see Section 3.3.2 below).
Figure 9.
Evolution of the monthly rainfalls. Grey data are from meteo data (1991-2022) and blue data are extrapolations from the MLP-ANN model (2023-2033) with overlap data (Aug. 2022-July 2023) in red (see Section 3.3.2 below).
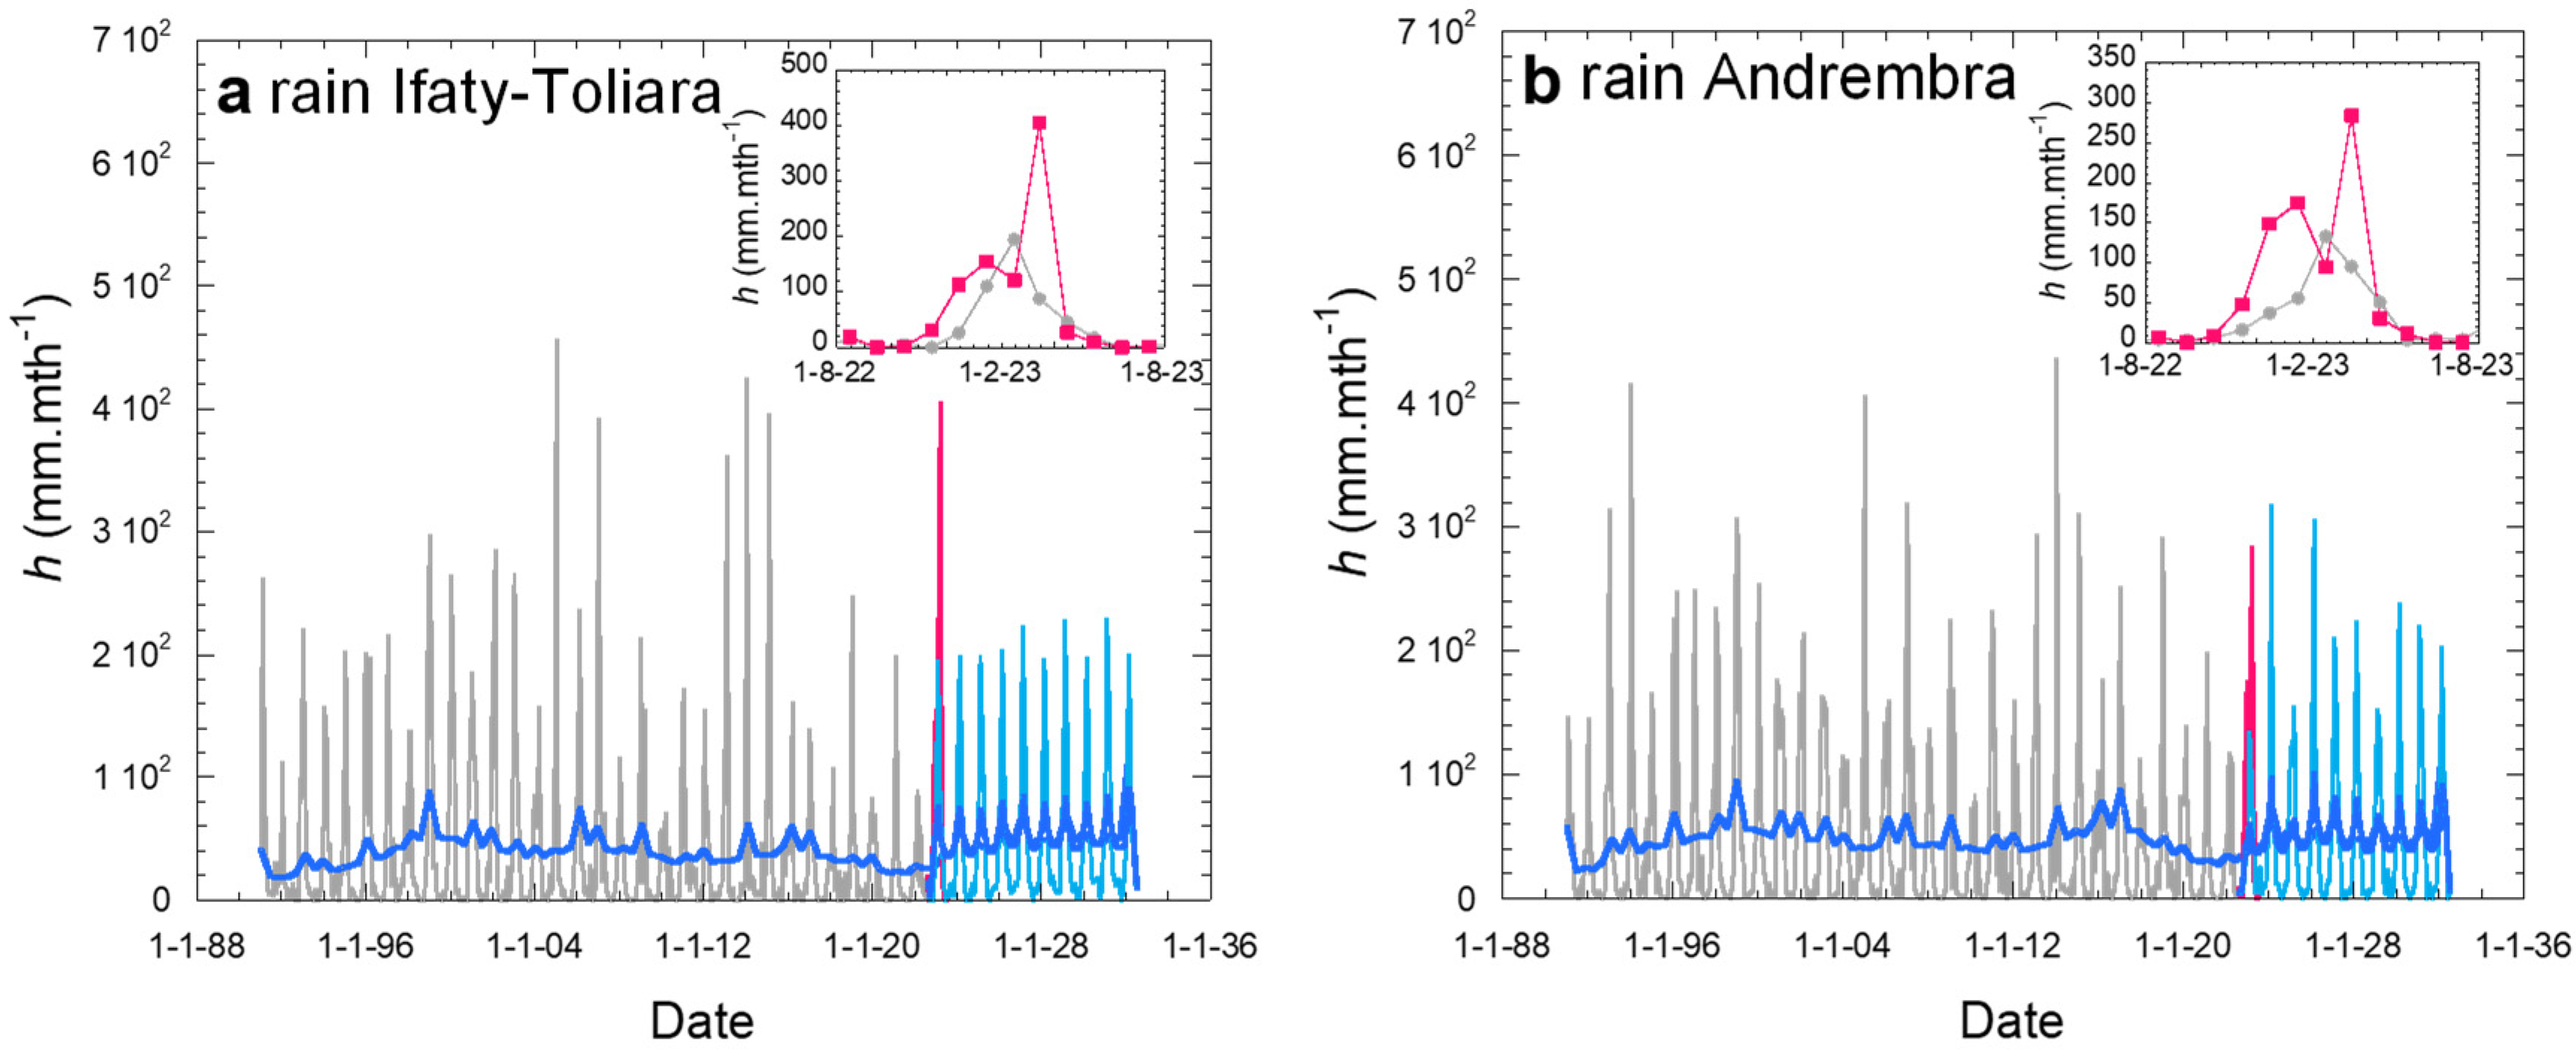
Figure 10.
Analyses of rainfall for the 1991-2022 period. (a) During the dry season (Apr.-Oct.) presented in ascending order. (b) Same, for the rainy season (Nov.-March). The anomalous large rate corresponds to the Ernest cyclone on Jan. 22, 2005.
Figure 10.
Analyses of rainfall for the 1991-2022 period. (a) During the dry season (Apr.-Oct.) presented in ascending order. (b) Same, for the rainy season (Nov.-March). The anomalous large rate corresponds to the Ernest cyclone on Jan. 22, 2005.
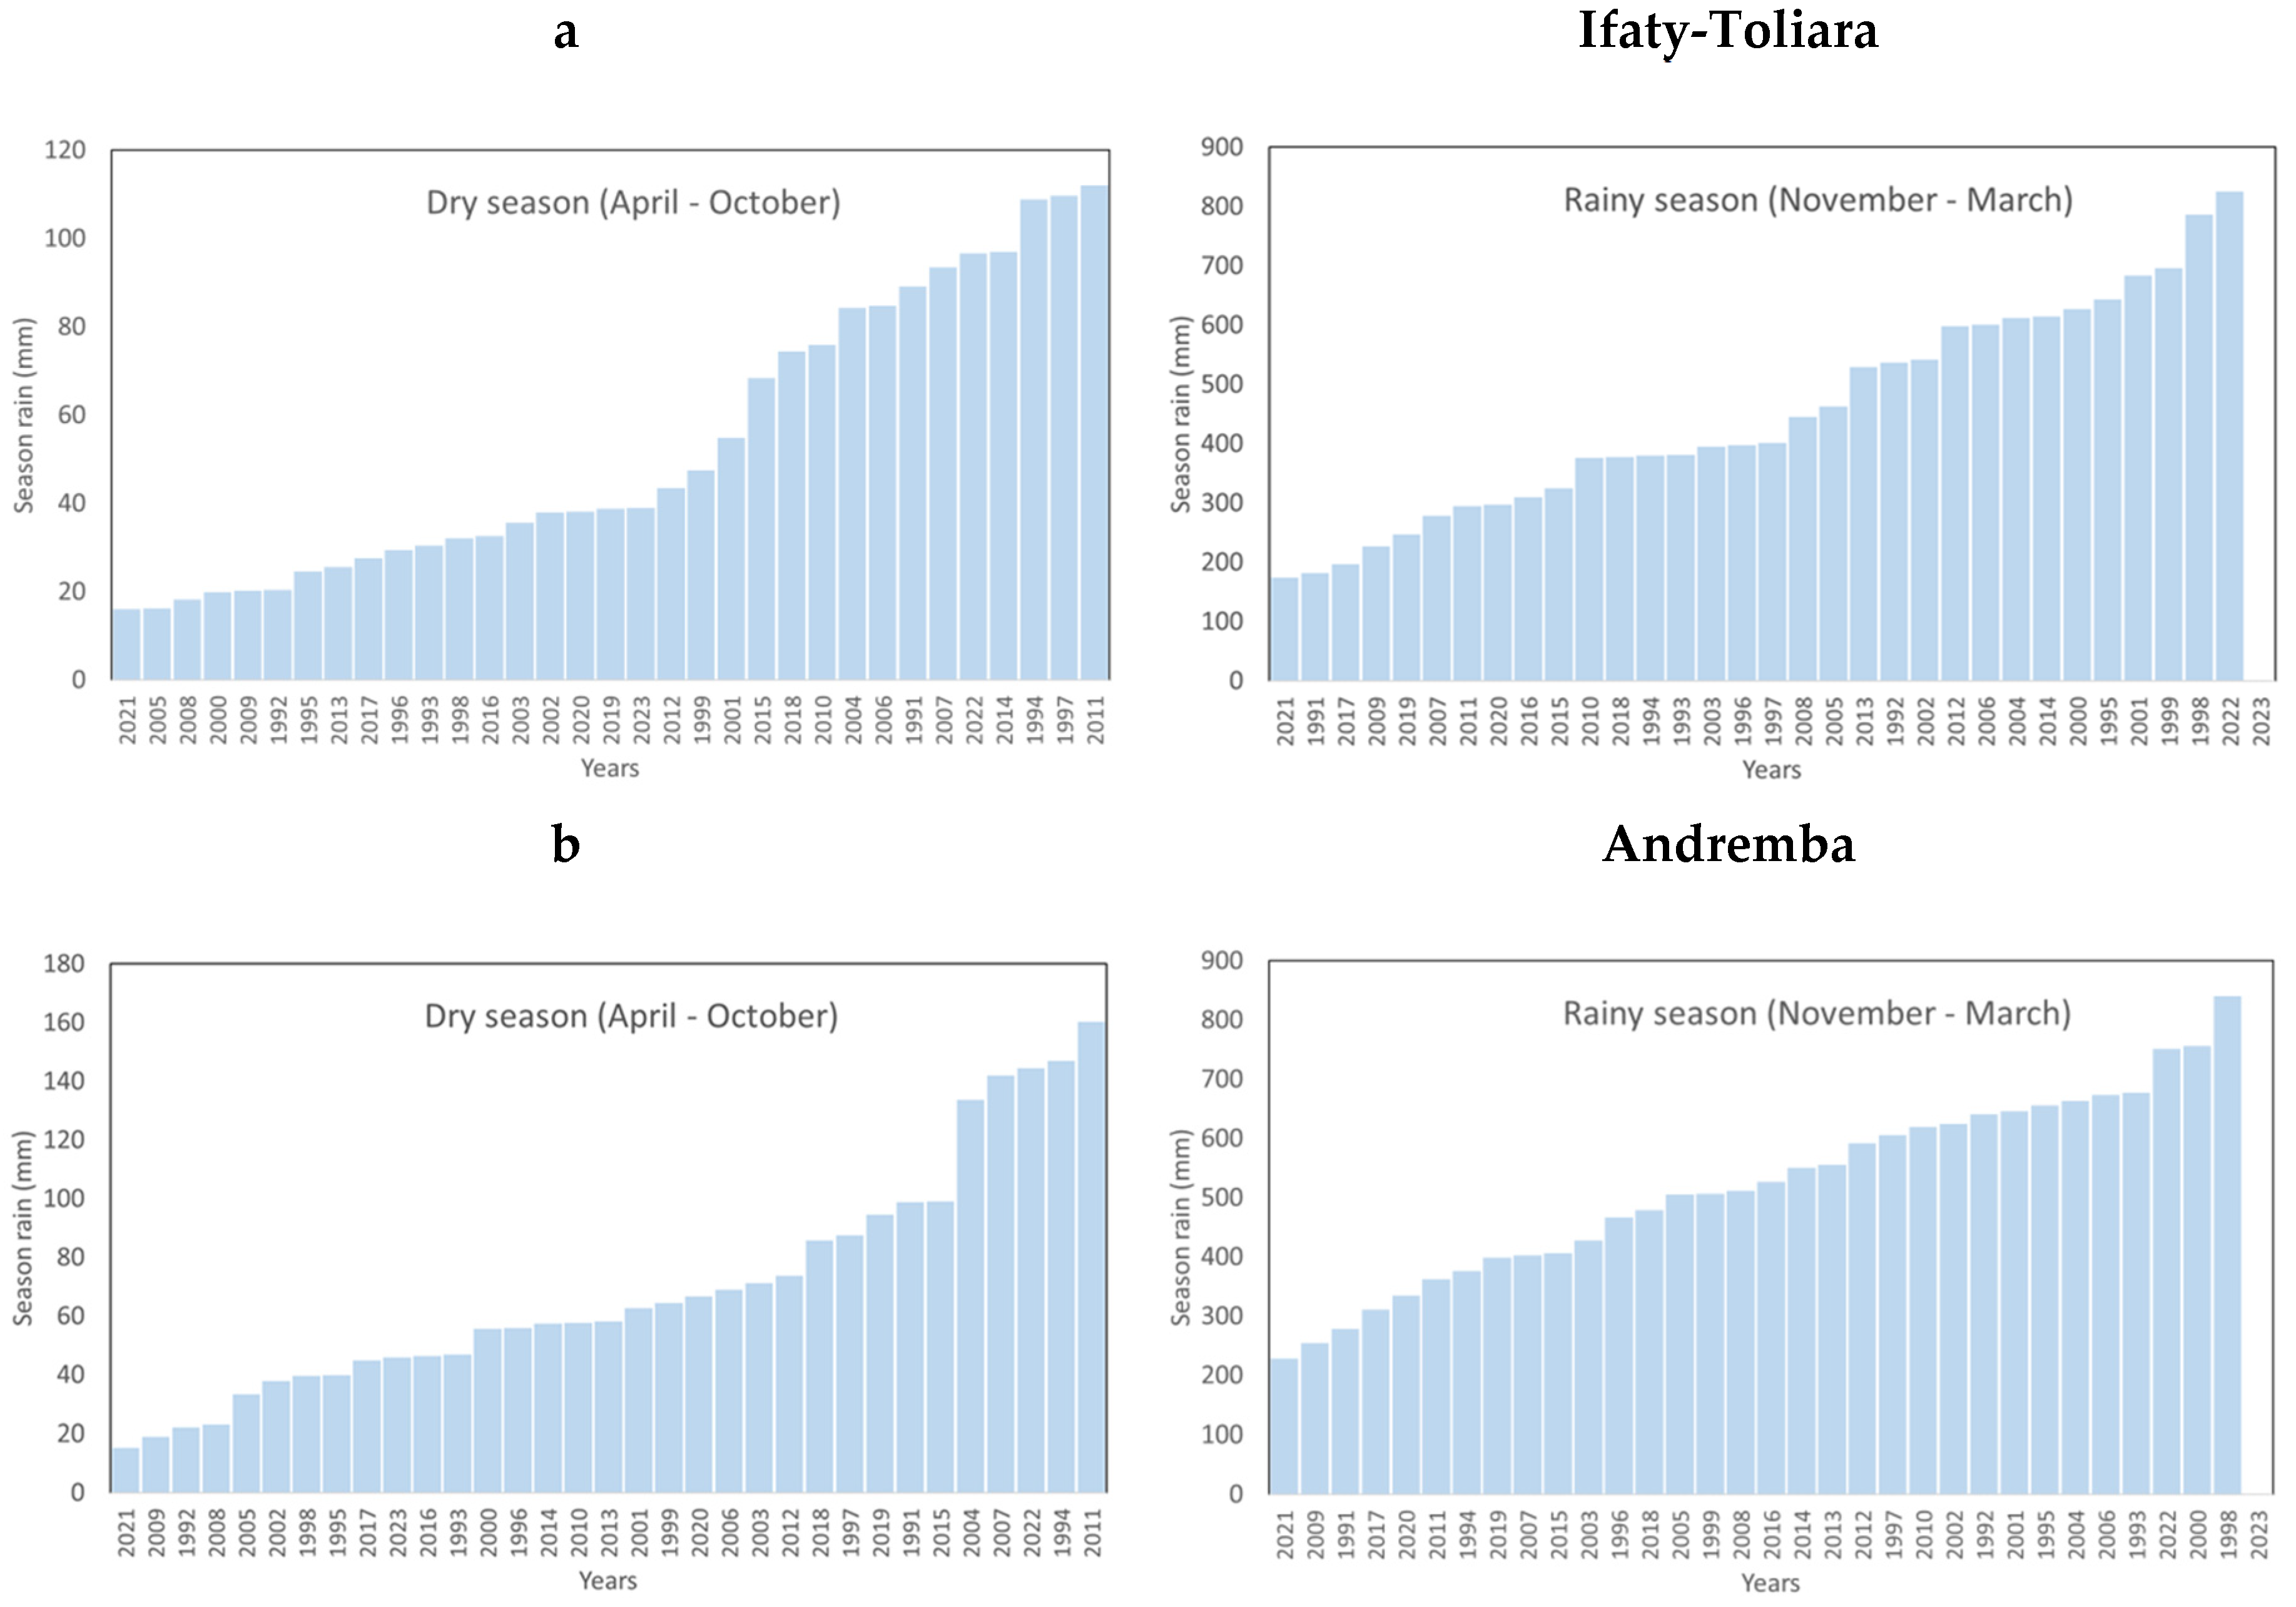
Figure 11.
Frequency of events showing Nc consecutive days without rain in the dry (Apr. - Oct.) and rainy (Nov. -Mar.) seasons for the whole period 1991-2023 (semi-log plot). Red circles and lines: dry season; blue squares and lines: rainy season. (a) Ifaty and Toliara, (b) Andremba.
Figure 11.
Frequency of events showing Nc consecutive days without rain in the dry (Apr. - Oct.) and rainy (Nov. -Mar.) seasons for the whole period 1991-2023 (semi-log plot). Red circles and lines: dry season; blue squares and lines: rainy season. (a) Ifaty and Toliara, (b) Andremba.
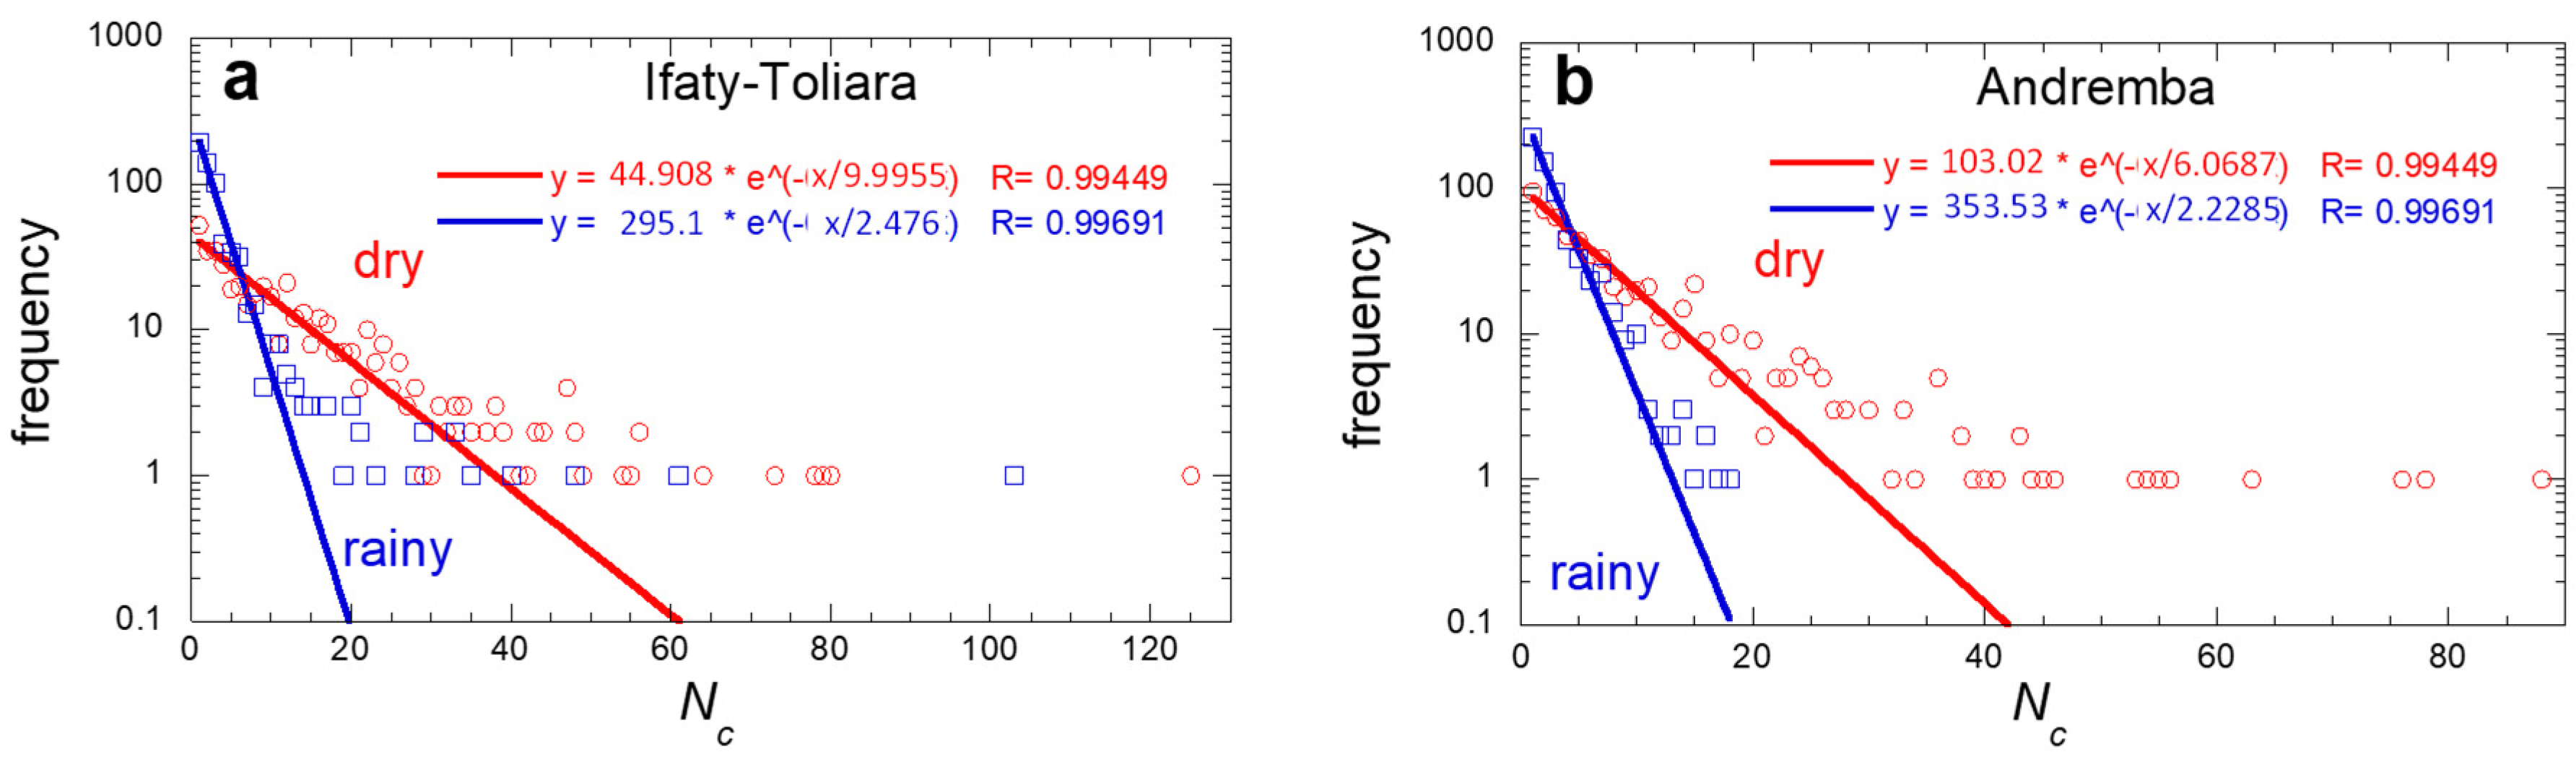
Figure 12.
Evolution of the typical number of consecutive days without rain, Nc, for the dry season (Apr.-Oct., red circles) and the rainy season (Nov.-March, blues squares). The full and interrupted curves are smoothening functions.
Figure 12.
Evolution of the typical number of consecutive days without rain, Nc, for the dry season (Apr.-Oct., red circles) and the rainy season (Nov.-March, blues squares). The full and interrupted curves are smoothening functions.
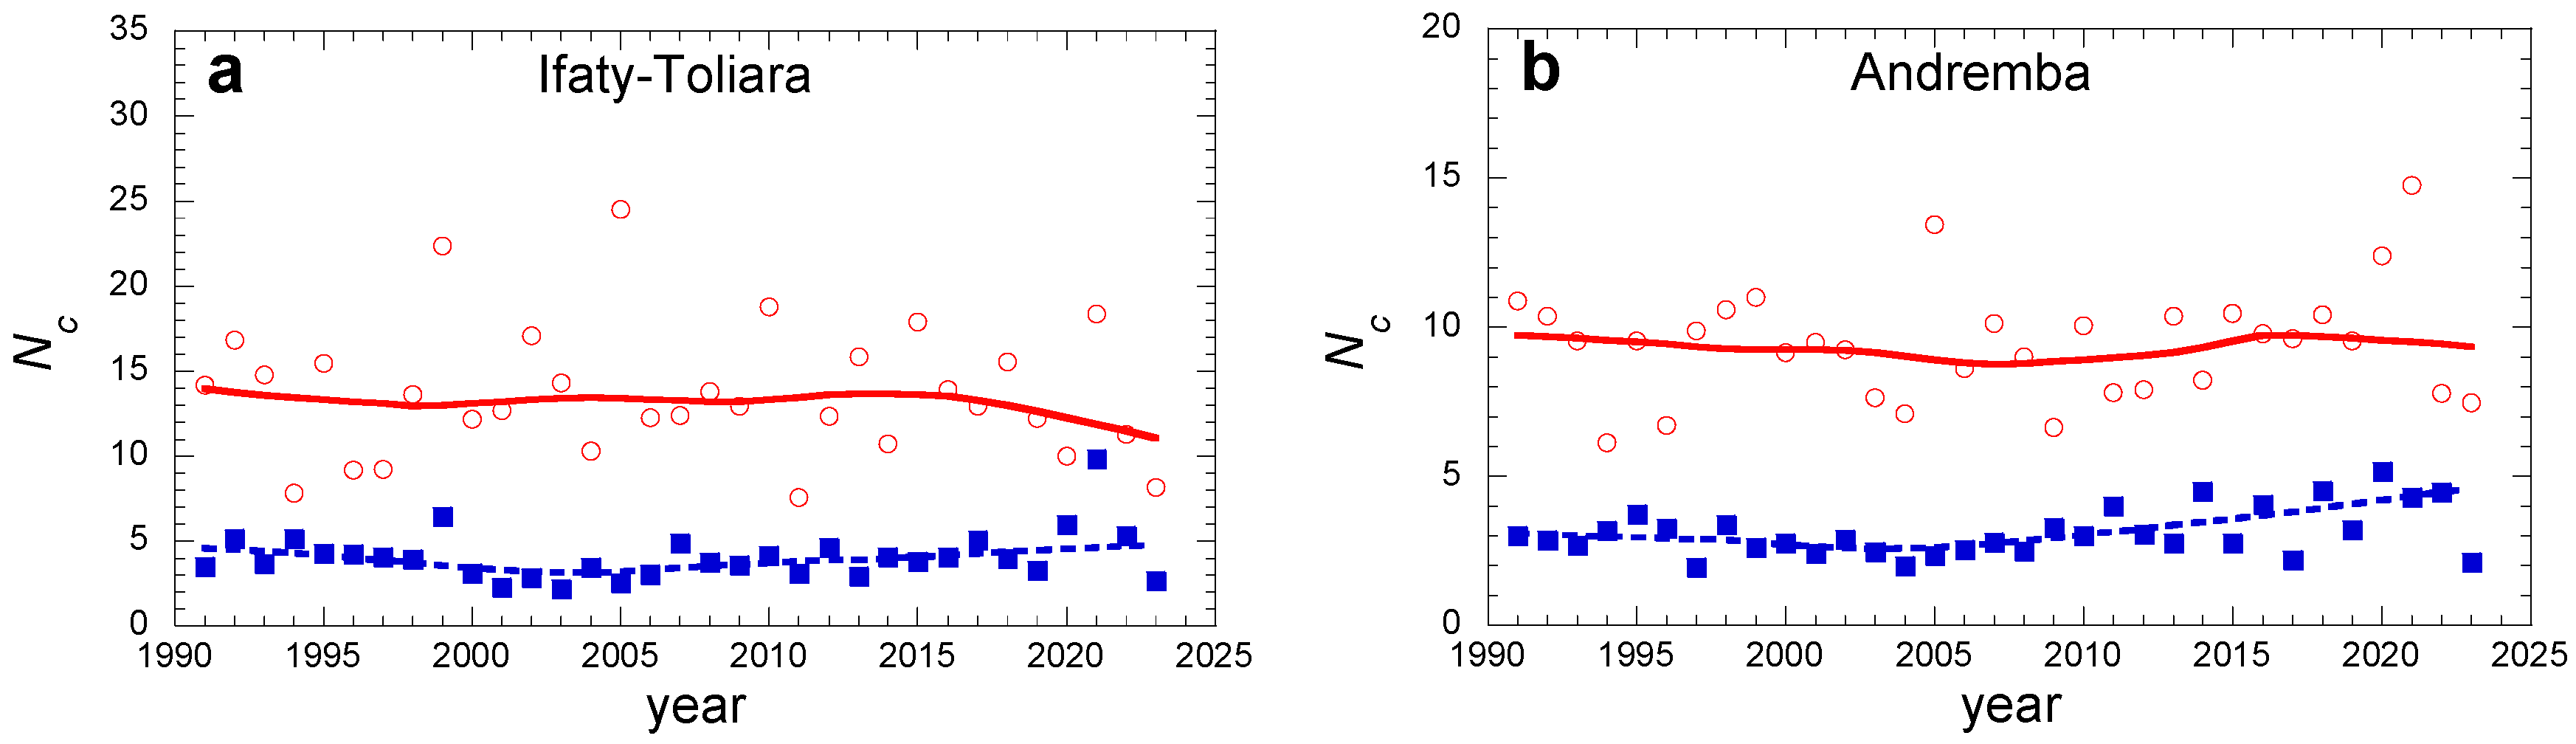
Figure 13.
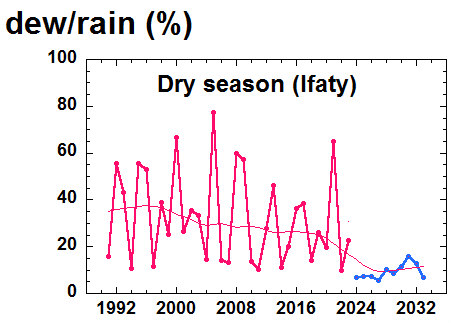
Evolution of the dew/rain ratio τ for the three sites Ifaty, Toliara and Andremba. (a) Yearly data, (b) dry season (Apr.-Oct.) and (c) rainy season (Nov. – Mar.) seasons. Red curve: 1991-2022; blue curve: extrapolation 2023-2033; red curve: 2021-2030.
Figure 13.
Evolution of the dew/rain ratio τ for the three sites Ifaty, Toliara and Andremba. (a) Yearly data, (b) dry season (Apr.-Oct.) and (c) rainy season (Nov. – Mar.) seasons. Red curve: 1991-2022; blue curve: extrapolation 2023-2033; red curve: 2021-2030.

Disclaimer/Publisher’s Note: The statements, opinions and data contained in all publications are solely those of the individual author(s) and contributor(s) and not of MDPI and/or the editor(s). MDPI and/or the editor(s) disclaim responsibility for any injury to people or property resulting from any ideas, methods, instructions or products referred to in the content. |
© 2024 by the authors. Licensee MDPI, Basel, Switzerland. This article is an open access article distributed under the terms and conditions of the Creative Commons Attribution (CC BY) license (http://creativecommons.org/licenses/by/4.0/).
Copyright: This open access article is published under a Creative Commons CC BY 4.0 license, which permit the free download, distribution, and reuse, provided that the author and preprint are cited in any reuse.


