

Submitted:
30 December 2023
Posted:
03 January 2024
You are already at the latest version
Abstract
The following article presents an analysis of the impact of the Environmental, Social and Governance-ESG determinants on Hospital Emigration to Another Region-HEAR in the Italian regions in the period 2004-2021. The data are analysed using Panel Data with Random Effects, Panel Data with Fixed Effects, Pooled Ordinary Least Squares-OLS, Weighted Least Squares-WLS, and Dynamic Panel at 1 Stage. Results show that HEAR is negatively associated to E, positively to S and negatively associated to the G within the ESG model. The data were subjected to clustering with a k-Means algorithm optimized with the Silhouette coefficient. The optimal clustering with k=2 is compared to the sub-optimal cluster with k=3. The results suggest a negative relationship between the resident population and hospital emigration at regional level. Finally, a prediction is proposed with machine learning algorithms classified based on statistical performance. The results show that the Artificial Neural Network-ANN algorithm is the best predictor. The ANN predictions are critically analyzed in light of health economic policy directions.
Keywords:
Analysis of Health Care Markets
; Health Behaviors
; Health Insurance
; Public and Private
; Health and Inequality
; Health and Economic Development
; Government Policy
; Regulation
; Public Health
1. Introduction
The following article analyzes the topic of patient mobility within the Italian regions. The analyzed data were acquired from ISTAT-BES. ISTAT-BES refers to the principles of the Sustainable Development Goals-SDGs. The ISTAT-BES variables have been reworked to highlight the three components E-Environmental, S-Social, and G-Governance of the ESG model. The issue of hospital migration of patients is becoming increasingly relevant in the Italian regions. In fact, the Italian regions are characterized by significant gaps from the point of view of per capita income, and also by the degree of socio-cultural sophistication of the production organizations and institutions operating at a regional level. It follows that there is a continuous violation of the principle of equality of Italian citizens in access to health services. This socio-economic and institutional condition leads Italian citizens to experience forms of hospital migration. The issue of patient mobility could become increasingly relevant in the future due to the presence of strong independence and autonomist movements present in the northern regions as in the case of the Northern League, which are calling for a true secession between Lombardy, Veneto and Emilia Romagna and the rest of the country . It must be considered that hospital migration is not only due, in general, to economic-social issues, but also to issues of quality and supply of healthcare services. In fact, the regions of Northern Italy tend to offer better health services and push southern citizens to migrate for health reasons. Finally, this migration increasingly concerns not only patients, but also doctors and nurses who move from the South to the North to have better career and work opportunities.
Furthermore, it must be considered that the interregional hospital migration of southern patients towards Northern Italy also produces a significant transfer of financial resources from the poor regions of Southern Italy to the rich regions of Northern Italy, increasing the level of territorial inequality in access to the healthcare system. Finally, healthcare migration is part of a broader macro-phenomenon detected at a national level, namely the low level of healthcare spending as a percentage of GDP, especially when compared with the similar levels of the most efficient European countries such as France and Germany. The resulting picture is therefore of a health system which has strongly desired the regionalization of the provision of health services, and which has nevertheless failed to guarantee equality in access to health services, causing significant social, economic and financial costs both for the citizens and for the regional institutions that must reimburse patient mobility. The sparsely populated regions such as Basilicata and Molise deserve a special case apart. In fact, for these regions it is very difficult to organize universal healthcare that can fully correspond to the needs of the population. In fact, the small Italian regions tend to be at the top in terms of hospital migration. The future of Italian healthcare is therefore very uncertain, both due to the presence of strong tensions on the fiscal autonomy of the northern regions, and due to the insufficiency of financial resources dedicated to the healthcare system of the southern regions. It is probable that in the absence of future interventions to restructure the healthcare system, the healthcare inequality between the southern regions and the northern regions will become increasingly accentuated with a significant impact in terms of quality of life.
Furthermore, hospital migration offers further incentives to stimulate healthcare investment in the Northern regions and disinvestment in the Southern regions. In the future, therefore, the gap between North and South, in terms of access to healthcare, could be unbridgeable, also due to the migration of doctors and nurses from South to North.
The article continues as follows: the second section analyses the literature relating to patent mobility with a focus on the condition of European countries and Italy, the third section presents the econometric model which allows verifying the impact of ESG variables in determining of the HEAR levels, the fourth section shows the clustering with k-Means algorithm optimized with the Silhouette coefficient, the fifth section highlights the prediction results through a comparison with eight machine-learning algorithms, the sixth sections presents the conclusions.
2. Literature Review
Below is an analysis of the literature that takes into consideration patient migration in Europe and in Italy. However, there is also a nod to patient migration in China's large populous cities. Finally, what according to the literature are the motivations that push patients to seek better care in other regions or other countries are highlighted. In general, however, we can underline that patient migration tends to be a widespread phenomenon within nations between areas that have different health service facilities. However, patient mobility at an international level remains marginal.
Patient Mobility in Europe. The migration of patients between various European states for healthcare reasons raises both ethical and financial questions. There are ethical issues related to the need to guarantee all European citizens access to the best care even when it can be administered in other countries. There are also financial issues, as countries that have advanced healthcare systems must also bear the healthcare cost of offering treatment to European citizens from less fortunate countries [1]. Despite the existence of European directives that facilitate cross-border migration for health and treatment reasons, data shows that cases of patient migration at an intra-European level remain scarce [2]. Patient tourism, which is common in Asia and the United States, is also becoming widespread in Europe. However, the structure of this market is still uncertain, especially as regards the presence of agencies specialized in organizing patient tourism trips. Furthermore, absolutely new for the European market is the possibility of a mobility of medical-health personnel as a result of the development of health tourism [3]. The possibility for European patients to be treated in any European country regardless of their country of residence raises important issues that need to be resolved. In particular, there are legal, financial, administrative and organizational issues that must be resolved to enable efficient intra-community hospital migration. To this end, the creation of a European institution with control and coordination purposes could allow European citizens to be more likely to effectively use the right to healthcare mobility in Europe [4]. The presence of private hospitals and the possibility of increasing patient mobility at a European level increases the efficiency of public healthcare systems. It is in fact possible to notice, thanks to the privatization of hospitals and healthcare migration, a reduction in waiting lists and a reduction in healthcare costs [5]. Patient mobility in France at an interregional level is increased between 2014 and 2019 from 22.9% to 24.6%. The possibility of patent mobility between European nations poses legal and financial issues that have only been partially resolved with European legislation and the rulings of the European judiciary [6,7,8,9].Patient mobility in Spain is positively associated to income and the quality of health services [10]. The mobility of doctors and nurses is greater than patient mobility in Europe, even if only patient mobility has been considered relevant in the European legislation [11]. Service availability, poor quality and the regulatory systems are the main drivers of patient mobility in regional and public oriented healthcare systems i.e. Italy and Spain [12]. Patients move from low income regions to high-income regions in Turkey, to have access to better healthcare [13]. Patient mobility is very low considering among Norway, Sweden, Denmark and Finland [14].
Patient Mobility in Italy. Patient mobility tends to grow in connection with the severity of healthcare conditions. For this reason, it is necessary to calculate the incidence of extreme health phenomena in order to calculate the capacity of hospitals and regional health systems to take care of hospital migration. It is therefore possible to connect the capacity of hospitals to offer healthcare services with the structured demand that brings together both the regional and interregional dimensions to calculate the efficiency of healthcare facilities [15]. Lombardy is a leading region in healthcare emigration [16]. n 2009 patient mobility for aortic valve replacement operations was equal to 13.6% in Italy. Patients move from southern to northern regions. Patient mobility also has the consequence of transfer financial resources from poor regions to rich regions [17]. In the medium to long term, the regions of southern Italy may be incapable of offering adequate health services to the population by promoting patient mobility toward the North, in the absence of an equalization intervention by the central government [18].
Intercity Patient Mobility. In the case of very populous cities, such as in China for example, it is possible to verify an inefficient geographical distribution of hospital structures and services compared to the population. It is possible to use machine-learning tools to efficiently model the allocation of hospital resources within the territory of cities to best meet the needs of the population [19].
Patient Mobility Choice. Patient mobility can depend on a series of socio-economic reasons or also connected to the ability of health systems to offer services corresponding to users' needs. Patient mobility tends to grow with the reduction of waiting lists, the growth in the quality of services, and access to advanced technologies. Patient mobility decreases with age and socio-economic status [20]. Considering hospital migration in the Italian regions, it is possible to note that one of the reasons that push patients to migrate is hospital specialization and the performance of neighbouring regions. Furthermore, the choice to emigrate for health reasons also depends on income factors, performance and technology [21]. There are four reasons that support the choice of hospital migration, namely: lower financial costs, possibility of also having access to complementary services not offered in the place of residence, improvement in the quality of care, offer of public financial resources to support healthcare migration. These motivations are common in a comparative study of the USA, Mexico and Europe [22]. Location of physicians can have a relevant role in determining patent mobility [23]. There is a positive relationship between patent mobility and the reduction of waiting times [24]. Patient mobility increases with the reduction of costs and the increase in the level of competition among providers, as a study in six European countries shows [25]. The development of geographical areas specializing in the provision of health services can be associated with the development of the patent mobility sector at a global level [26].
3. Econometric Models for the Estimation of the Impact of the ESG Determinants on the on Hospital Emigration at a Regional Level
Below we present an econometric analysis aimed at estimating ESG factors in determining hospital emigration in Italian regions. The analysed data were acquired by ISTAT-BES. The econometric techniques used are indicated below: Panel Data with Fixed Effects, Panel Data with Random Effects, Pooled Ordinary Least Squares-OLS, Weighted Least Squares-WLS, and Dynamic Panel at 1 Stage. To arrive at the overall estimate of the ESG effect on the value of HEAR we carried out a breakdown of the variables from the ISTAT-BES database into the E-Environment, S-Social and G-Governance-ESG components. We then estimated 3 different econometric equations to distinguish the impact of E, S and G on the value of HEAR. Subsequently, the results obtained were aggregated to estimate the overall impact of ESG on HEAR. Our analysis method therefore allows us to distinguish within the ISTAT-BES model based on the macro-categories E, S and G. Subsequently, the value of the relationship between the individual components E, S and G on the value of HEAR is estimated. Finally, the overall value of the impact of ESG on HEAR is calculated. Therefore, through a process of de-composition and re-composition it is possible on the one hand to identify the impact of the individual E, S and G components on HEAR and on the other hand to calculate the value of the overall impact of ESG on HEAR.
3.1. The Estimation of the Impact of the E-Component within the ESG Model on HEAR
Below we present the estimate of the value of the impact of the E-Component on HEAR. In particular, the following equation was estimated, namely:
Where and .
The equation was estimated through the use of the following econometric techniques: Pooled OLS, Panel Data with Fixed Effects, Panel Data with Random Effects, Weighted Least Squares-WLS and 1-Step Dynamic Panel. The variables analyzed in the model are reported in Table 1.
We find that the level of HEAR is positively associated to:
- DLP: it is the percentage of people aged 14 and over who declare that the landscape of the place where they live is affected by evident degradation out of the total of people aged 14 and over. There is a positive relationship between the value of HEAR and the value of DLP. Regions in which landscape conditions are worse tend to be characterized by greater hospital emigration.
- DWIP: represents the number of days of the year in which the daily cumulative precipitation exceeds or equals the value of 50 mm. There is a positive relationship between the value of HEAR and the value of DWIP. Regions with high levels of daily precipitation also have higher levels of hospital emigration.
- PA: is the percentage of the earth's surface covered by terrestrial natural protected areas included in the official list of protected areas or belonging to the Natura 2000 network. The regions in which there is a growth in protected areas tend to also be the regions in which there is it is an increase in hospital emigration. It should be considered that the regions that have the greatest hospital emigration are the Italian regions with low populations, where a significant part of the territory appears to be devoid of urbanisation.
- SSC: represents the percentage of authorized bathing coasts on the total coastline according to current legislation. There is a positive relationship between the value of the percentage of bathing coasts and the value of hospital emigration. The regions that have a greater supply of bathing coasts also have a greater supply of hospital migration.
- AUG: represents the value of square meters of urban greenery per inhabitant in provincial capitals/metropolitan cities. There is a positive relationship between the value of square meters of urban greenery per inhabitant and the value of hospital emigration. The value of hospital emigration tends to grow with the urban greenery detected in metropolitan areas.
- TMW: is a variable that considers the percentage of municipal waste sent to landfill compared to the total municipal waste produced. There is a positive relationship between the value of TMW and the value of HEAR. The regions in which the value of municipal waste in landfill tends to increase are also regions in which the value of hospital emigration tends to increase.
We find that the level of HEAR is negatively associated to:
- CLD: is a variable that considers the percentage of people 14 years and older who list landscape damage caused by excessive building construction as one of the five most concerning environmental problems among all people 14 years and older. There is a negative relationship between the CLD value and the HEAR value. Regions that have a higher level of concern about landscape deterioration tend to have lower hospital emigration.
- DIHP: is the number of days in the year in which the maximum temperature is above the 90th percentile of the distribution in the reference climatological period (1981-2010), for at least six consecutive days. There is a positive relationship between the DIHP value and the HEAR value. Regions that have high levels of DIHP also have high levels of HEAR.
The estimated econometric results have been summarized in the following Table 2.
To estimate the overall value of the E-component on HEAR we calculated the average of each variable considering the values obtained respectively through the five econometric models analyzed.
However, before carrying out the final calculation it is necessary to adjust the results obtained to highlight the positive or negative relationship with respect to the environmental dimension. The corrections are indicated in the following table 3. In table 3, column A represents the absolute value of the average of the coefficients estimated in the econometric model. Column B considers the correction or assigns a + or – value based on whether the increase or reduction of the variable analyzed is positively or negatively associated with the improvement of the environmental condition. Finally, column C is made up of C=A*B and constitutes the Corrected Value. The values of column C are added to calculate the aggregate amount of environmental variables corrected in determining the aggregate E intended as a component of the ESG model (Table 3).
Specifically, the following formula has been calculated:
Where:
Therefore, by analyzing the aggregate impact of E variables on the overall HEAR value, it is possible to verify that there is a negative relationship between the aggregate value of E variables and hospital migration. This negative relationship is mainly due to four variables, namely: days with extremely intense precipitation, dissatisfaction with the landscape of the place of living, index of duration of hot periods, concern for the deterioration of the landscape. On the contrary, the value of the variables that are positively associated with the environment appears to be marginal as indicated by the value of the following variables, namely: protected areas, disposal of urban waste in landfill, sea coasts suitable for bathing, availability of urban greenery. It therefore follows that, considering the variable E as an aggregate of the variables analysed, the existence of a negative relationship between the value of hospital emigration and the value of the environment is verified. That is, hospital emigration tends to increase in the reduction of environmental sustainability at a regional level.
3.2. The Estimation of the S-Social Component within the ESG Model on the Value of HEAR
Below we analyze the impact of a set of variables relating to the S-Social component of the ESG model on the value of hospital emigration. The analyzed data refers to the ISTAT-BES database. The econometric techniques used are indicated below: Panel Data with Fixed Effects, Panel Data with Random Effects, Pooled OLS, Weighted Least Squares-WLS. Specifically, the following equation was estimated:
Where and . The list of variables used in the model are showed in Table 4.
We found that the level of HEAR is positively associated to:
- TU: is the percentage of recent high school graduates who enrol at university for the first time in the same year in which they obtained their high school diploma (cohort-specific rate). There is a positive relationship between the value of TU and the value of HEAR. Regions that have a high level of recent high school graduates also have higher levels of HEAR.
- LPE: Percentage of employees with an hourly wage lower than 2/3 of the median wage out of total employees. There is a positive relationship between the value of low-paid employees and the value of HEAR. Regions that have a high number of low-paid employees also have a high level of hospital emigration.
- RIPD: Number of fatal accidents and those with permanent disability among the total employed (net of the armed forces) per 10,000. There is a positive relationship between the number of fatal accidents and those resulting in permanent disability and the HEAR value in the Italian regions. Specifically, it is possible to note that regions that have higher levels of RIPD also have high levels of HEAR.
- ROP: is the percentage of people living in families with an equivalent net income below the poverty risk threshold, set at 60% of the median of the individual distribution of equivalent net income. The income reference year is the calendar year preceding the survey year. There is a positive relationship between the ROP value and the HEAR value. Regions that have high ROP values also have high HEAR values.
- EPIHC: is the percentage of elderly people treated in integrated home care out of the total resident elderly population (65 years and over). There is a positive relationship between the EPIHC value and the HEAR value. Regions where there are more elderly people treated in integrated home care have higher levels of hospital migration.
We also found that the level of HEAR is negatively associated with:
- EX: is the percentage of people aged 18-24 with a maximum of a lower secondary school diploma (middle school diploma), who do not possess regional professional qualifications obtained in courses lasting at least 2 years and not included in an education or training course out of the total people aged between 18 and 24. There is a negative relationship between the value of EX and the value of HEAR. Regions where early exit from the school system is lower have higher levels of HEAR value.
- ER: is the percentage of employed people aged between 20 and 64 in the population aged 20-64. There is a negative relationship between the value of employed people and the value of hospital emigration. Regions where the value of hospital emigration tends to increase tend to have a reduced level of employment.
- GPT: is the percentage of general practitioners with a number of patients exceeding the maximum threshold of 1500 patients envisaged by the contract for general practitioners. There is a negative relationship between the GPT value and the HEAR value. The regions where the number of doctors with a maximum threshold of 1500 assisted decreases are associated with a growth in the value of HEAR
- DRs: it represents the number of doctors per 1,000 inhabitants. There is a negative relationship between the value of DRs and the value of HEAR. The regions where the number of doctors decreases are characterized by an increasing value of hospital emigration.
The econometric estimations are showed in Table 5.
The results obtained from the econometric estimates presented are considered in their average value. The average value is then arranged in the sense of absolute value. A correction is applied to this absolute value by multiplying the same value by +1 or -1 based on whether the observed variable is positively or negatively associated with an improvement in the social condition detected at a regional level. Finally, the absolute value multiplied by the correction offers the correct value that is considered to determine the overall amount of the impact of S, understood as a component of the ESG models, on the HEAR variable (Table 6).

Table 6.
Variables, Coefficients in Absolute Value, Correction, Corrected Value and Aggregate S.
| Table 6. Variables, Coefficients in Absolute Value, Correction, Corrected Value and Aggregate S-Social Component within the ESG model | |||
|---|---|---|---|
| Variable | (A) Absolute Value | (B) Correction | (C=A*B) Corrected Value |
| TU | 0,045 | 1 | 0,045 |
| EX | 0,205 | -1 | -0,205 |
| ER | 0,107 | 1 | 0,107 |
| LPE | 0,083 | -1 | -0,083 |
| RIPD | 0,368 | -1 | -0,368 |
| ROP | 0,124 | -1 | -0,124 |
| EPIHC | 0,513 | 1 | 0,513 |
| GPT | 0,085 | -1 | -0,085 |
| DRs | 0,539 | 1 | 0,539 |
| Sum i.e. aggregate S-Social Component in the ESG model | 0,339 | ||
Where:
Considering the results we can verify that there is a positive relationship between the value of HEAR and the aggregate value of S. The variables that significantly contribute to determining the positive relationship are: transition to university, employment rate, elderly people treated in integrated home care, doctors. These positive values exceed the quantitative determinations of the variables that are negatively associated with HEAR, within the aggregate S, i.e. Early exit from the education and training system, low-paid employees, rate of fatal accidents and permanent disability, risk of poverty , general practitioners with a number of patients above the threshold. For these reasons it appears that the aggregate value of S on HEAR is positive.
3.3. The Estimation of the G-Governance Component Within the ESG Model on the Value of HEAR
Below we analyse the value of the impact of the variables relating to the G-Governance component within the ESG model on the value of the HEAR variable. The data used were acquired by ISTAT-BES. The following econometric models were applied namely: Panel Data with Fixed Effects, Panel Data with Random Effects, Pooled OLS, 1-Step Dynamic Panel. In particular we estimated the following equation:
Where and . A list of variables is showed in Table 7.
Results show that the level of HEAR is positively associated to:
- PYCK: represents the number of pickpocketing victims per 1,000 inhabitants. The number of victims is calculated using the data of the victims who reported the pickpocketing to the police, corrected with the number of victims who did not report, obtained from the Citizen Security Survey, through a specific corrective factor for the distribution geographical and by sex and age groups. There is a positive relationship between the value of PYCK and the value of HEAR. The regions that have a higher prevalence of pickpocketing are also the regions that have a higher hospital emigration value.
- PDAL: represents the presence of elements of degradation in the area where you live: Percentage of people aged 14 and over who often see elements of social and environmental degradation in the area where they live (they often see at least one element of degradation among the following (people who use drugs, people who deal drugs, acts of vandalism against public property, prostitutes looking for clients) out of the total number of people aged 14 and over. There is a positive relationship between the value of degradation and the value of HEAR. The regions which have a higher level of degradation also have a higher level of hospital emigration.
- PYCC: is the percentage of people aged 14 and over who have non-cohabiting relatives (in addition to parents, children, brothers, sisters, grandparents, grandchildren), friends or neighbors to rely on out of the total number of people aged 14 and over. There is a positive relationship between the value of PYCC and the value of HEAR. Regions where the level of people to rely on tends to grow also have a higher level of hospital emigration.
- DCP: is the average effective duration in days of proceedings resolved before ordinary courts. There is a positive relationship between the value of DCP and the value of HEAR at the regional level. The regions in which the length of judicial proceedings increases are also the regions characterized by a high level of HEAR.
Results also show that the level of HEAR is negatively associated to:
- RIU: represents the Percentage of people aged 11 and over who used the Internet at least once a week in the 3 months before the interview. There is a negative relationship between the value of RIU and the value of HEAR. The regions in which the population uses the internet less frequently are also the regions with the greatest hospital emigration.
- AAIP: is the average age of parliamentarians in the Senate and the House. Senators and deputies elected in foreign constituencies and senators for life are excluded. Regions that have a lower level of AAP also have a higher level of HEAR. That is, as the age of deputies and senators increases, the value of hospital emigration decreases.
- MIG: is the migration rate of Italians (25-39 years) with qualifications of tertiary study, calculated as the ratio between the migratory balance (difference between registered and canceled for transfer of residence) and residents with title of tertiary study (undergraduate, AFAM, doctorate). Values for Italy they only include movements to/from abroad, for the divisional values the inter-departmental movements. There is a negative relationship between the mobility of Italian graduates and the value of hospital emigration. In fact, the regions in which the mobility of Italian graduates decreases tends to increase hospital emigration.
- CW10: represents the amount of companies with at least 10 employees with web sales to end customers. There is a negative relationship between the CW10 value and the HEAR value. In regions where the number of companies with at least 10 employees with web sales decreases, the value of hospital emigration increases.
The results of the econometric estimations are showed in Table 8.
We can see that the value of HEAR is negatively associated with the aggregate value of the G-Governance component within the ESG model. To determine this value we first considered the absolute value of the average of the econometric estimates made (Column A, Table 9). We then applied a correction based on whether the variable was positively or negatively associated with improving the value of governance (Column B, Table 9). Finally, we considered the absolute value with the correction (Column C, Table 9). The data is summarized in the Table 9.
In particular, it is possible to verify that:
Where
3.4. Aggregate effect of ESG variables on HEAR among Italian Regions
Nell’analisi seguente proponiamo un’aggregazione dei valori per calcolare l’impatto complessivo delle variabili ESG sulla variabile ESG.
Therefore we can verify that the value of HEAR tends to be positively associated with the aggregate value of the variables of the S-Social component and negatively associated with the aggregate value of the variables of the E-Environmental and G-Governance components, within the ESG model. The overall impact of ESG on HEAR is negative. That is, hospital emigration tends to increase in the reduction of the ESG value at a regional level. It is necessary to consider that this value depends above all on the E and G components. From which it follows that certainly in the regions in which there is a worsening of the environmental condition and a worsening of governance there is also a growth in the value of hospital emigration. The S-Social component is instead positively associated with the HEAR value. That is, in regions characterized by good social conditions there is a growth in hospital emigration. However, the overall aggregate value is negative, demonstrating that an improvement in the ESG condition tends to produce a reduction in hospital migration. It follows that the regions that manage to intervene with an increase in ESG-oriented policies, especially in the environmental and governance dimensions, tend to have reduced levels of hospital emigration.
4. Clusterization with k-Means algorithm optimized with the Silhouette coefficient
Below we present a clustering with k-Means algorithm optimized with the Silhouette coefficient. Since the k-Means algorithm is an unsupervised algorithm, it is necessary to identify a criterion that can be used to choose the optimal number of k. In the case presented below, the Silhouette Coefficient was chosen. The Silhouette Coefficient varies from -1 to 1 and assigns a value to each k. The k with a higher Silhoeutte Coefficient value is chosen as the optimal value. In the analyzed case, two clusters composed as indicated below are identified:
- Cluster 1: Sicily, Friuli Venezia Giulia, Tuscany, Veneto, Emilia Romagna, Piedmont, Puglia, Lazio, Sardinia, Campania, Lombardy, Trentino Alto Adige, Umbria, Marche, Liguria;
- Cluster 2: Basilicata, Molise, Calabria, Valle d'Aosta, Abruzzo.
The clusters can be evaluated based on the average value. That is, clusters that have a higher mean value are dominant compared to other clusters. In the case analyzed the average value of cluster 2 tends to be high compared to the value of Cluster 1. It follows that the citizens of Cluster 2 have much higher levels of hospital emigration than the citizens of Cluster 1. It is possible to note that the Cluster 2 is made up of 4 southern regions and the Aosta Valley. The regions that make up Cluster 1 are regions of Central-Northern Italy with the sole exception of Puglia, Sardinia and Campania. However, although clustering with k=2 is to be preferred on the basis of the Silhouette coefficient, it also presents significant limitations from a metric point of view. In fact, 15 Italian regions out of 20, i.e. 75% of the observed sample, are allocated within the same cluster, i.e. Cluster 1. This is a condition that manifests a certain inefficiency as among the 15 regions that are part of the In Cluster 1 there are some that present significant differences from a socio-economic and demographic point of view (Figure 1).
Therefore, to obtain a result that presents a greater level of redistribution of the regions within the variables it is possible to increase the value of k=3. With k=3 the value of the Silhouette Coefficient is still positive and appears to be the best result after the optimal result of k=2. In fact, while the value of the Silhouette Coefficient with k=2 is equal to 0.640, the value of the Silhouette Coefficient with k=3 is equal to 0.563. Therefore, by setting k=3 it is possible to obtain the following three-cluster structure, namely:
- Cluster 1: Tuscany, Friuli Venezia Giulia, Veneto, Emilia Romagna, Sicily, Sardinia, Piedmont, Lombardy, Lazio, Puglia, Campania;
- Cluster 2: Basilicata, Molise, Valle d'Aosta, Calabria;
- Cluster 3: Liguria, Marche, Umbria, Abruzzo, Trentino Alto Adige.
Through the analysis of the average of the clusters it is possible to identify an ordering of the clusters. In the case of k=3 it turns out that Cluster 2>Cluster 3>Cluster 1. The dominant Cluster is Cluster 2 made up of 3 southern regions and the Aosta Valley. Followed by the Cluster, which is very heterogeneous from a geographical point of view, and is made up of both southern regions, such as Abruzzo, and central Italy, such as Marche and Umbria and also northern regions such as Liguria and Trentino Alto Adige. However, we can see that there is a negative relationship between the average population of the clusters and the HEAR value at the cluster level. In fact, by calculating the average of the population of the cluster regions in 2023 it is possible to note that: the average of the Cluster 2 regions is equal to 697,689, the average of the Cluster 3 regions is equal to 1,236,555, and the average of Cluster 1 is equal to 4,534,290. That is, hospital emigration tends to grow with the reduction of the population. Particularly in regions with low populations such as the Cluster 2 regions, the value of hospital emigration tends to be maximum. On the contrary, in regions with a high population, as in the case of Cluster 1 regions, the value of hospital emigration tends to decrease. To verify this intuition it is possible to plot the value of HEAR 2021 against the value of the population of the Italian regions in 2021. The data suggests the presence of a negative relationship between the value of hospital emigration and the population resident in the Italian regions (Figure 2).
From the analysis of the clustering with the k-Means algorithm, it is therefore clear that there is a condition in the Italian regions based on a significant inequality induced by the differentials of the resident population. That is, regions that have a larger resident population also have greater opportunities and resources to make their healthcare system more efficient with respect to demographic needs. On the contrary, regions that have a smaller population also have fewer possibilities and resources to invest in the regional healthcare system and offer adequate services to residents. It therefore follows that regions that have a population of less than 1.5 million inhabitants tend to be subjected to significant hospital emigration. The only two regions with a population close to 1.5 million inhabitants and which remain within Cluster 1, i.e. the Cluster with the lowest hospital emigration, both in the case of k=2 and in the case of k=3, are Sardinia and Friuli Venezia Giulia. However, it is possible to note that both Sardinia and Friuli Venezia Giulia are two regions with special administrative autonomy. The presence of Sardinia and Friuli Venezia Giulia in the cluster with low hospital emigration, i.e. in Cluster 1, could be due on the one hand to the managerial capabilities of the regional ruling class and on the other hand to the ability to use the opportunities offered by special administrative autonomy
Ranking of the regions by value of healthcare emigration in 2021. Molise is in first place by value of healthcare emigration in 2021 with an amount of 29.2 units, followed by Basilicata with 26.9 units and Calabria with 20.8 units. In the middle of the table are Campania with a hospital emigration value of 9.2 units, followed by Trentino Alto Adige with a value of 8.5 and Puglia with an amount of 8.4 units. Sardinia closes the ranking with a value of 5.5 units, followed by Emilia Romagna with an amount of 5.1 units and Lombardy with a value of 4.9 units (Figure 3).
Ranking of the Italian regions by percentage change in the value of hospital emigration between 2004 and 2021. Abruzzo is in first place for the value of the percentage change in hospital emigration with a value equal to +53.60%, going from an amount from 9.70 units in 2004 up to 14.90 units in 2021 or equal to an amount of 5.20 units. Calabria follows with a variation equal to +44.40% corresponding to a variation from an amount of 14.40 units up to 20.80 units or equal to 6.40 units. In third place is Molise with a variation equal to +39.70% corresponding to a variation from an amount of 20.90 units in 2004 up to a value of 29.20 units in 2021 corresponding to an amount of 8.30 unit. In the middle of the table are Veneto with a value of +15.70% corresponding to a variation from an amount of 5.10 units in 2004 up to a value of 5.90 units in 2021 or equal to an amount of 0.80 unit. Puglia follows with an amount equal to +13.50% corresponding to a variation from an amount of 7.40 units in 2004 up to a value of 8.40 units in 2021 or equal to +1.00 units. Umbria is in eleventh place with a variation equal to 12.10% corresponding to a variation from an amount of 10.70 units in 2004 up to a value of 12.00 units in 2021 (Figure 4).
Trentino Alto Adige closes the ranking with -19.00% corresponding to a variation from 10.50 units in 2004 up to a value of 8.50 units in 2021 or equal to -2.00 units. Piedmont follows with a value of -25.00% corresponding to a variation from an amount of 8.40 units up to a value of 6.30 units. Valle d'Aosta closes the ranking with a variation equal to -30.30% corresponding to a variation from 22.10 units up to 15.40 units or equal to -6.70 units. On average, the value of hospital migration decreased from an amount of 10.10 units to a value of 11.28 units or equal to a value of 1.18 units equal to 11.63%.
5. Prediction with Machine Learning Algorithms for the Estimation of the Future Value of Hospital Migration
Below we present an analysis through the application of machine learning algorithms for predicting the future value of hospital migration. The algorithms were trained using 70% of the data while the remaining 30% was used for the actual prediction. The algorithms are analyzed through performance analysis from a statistical point of view, i.e. maximization of the R^2 and minimization of Mean Absolute Error-MAE, Mean Squared Error-MSE, and Root Mean Squared Error-RMSE. The statistical indicators were calculated as follows:
- R Squared
- Mean Average Error
- Mean Squared Error==
- Root Mean Squared Error==
where is the true value, predicted value, and , n=sample size (Figure 5).
Each algorithm is given a vote within the ranking of the statistical indicators analysed. The individual placements within the individual rankings are added. The algorithm that shows lower levels in terms of overall payoff also turns out to be the most efficient algorithm from a predictive point of view. The following ordering of the clusters is then identified:
- ANN-Artificial Neural Network with a payoff value of 4;
- Simple Regression Tree with a payoff value of 8;
- PNN-Probabilistic Neural Network with a payoff value of 14;
- Random Forest and Gradient Boosted Tree with a payoff value of 17;
- Tree Ensemble with a payoff value of 24;
- Polynomial Regression with a payoff value of 28;
- Linear Regression with a payoff value of 32.
A synthesis of the main results is indicated in the Table 10.
Therefore, by applying the ANN-Artificial Neural Network algorithm it is possible to predict the future trend of the variable analysed or relating to hospital emigration. From the point of view of predictions we can note that there are regions for which a growth in the value of hospital emigration is expected and regions for which a reduction in hospital emigration is instead expected. Hospital emigration is predicted to grow in Lazio with a value equal to 41.76% corresponding to a variation from an amount of 7.1 units up to a value of 10.06 units or equal to a variation of 2.96 units. Followed by Piedmont with +32.76%, Calabria with +21.71%, Sicily with +20.75%, Valle d'Aosta with a value of 9.03%, Marche with 8.51%, Tuscany with 7, 32%, Umbria 3.08%, Veneto 2.44%. The regions in which a reduction in the value of hospital migration is predicted are: Liguria with -1.66%, Basilicata with -1.99%, Molise with -7.9%, Sardinia with -8.00%, Puglia with - 9.03%, Friuli Venezia Giulia with -13.51%, Abruzzo with -16.99%, Campania with -25.99%, Trentino Aldo Adige with -36.49%, Emilia Romagna with -37.5% (Figure 6).
Critical analysis of predictions. Analysing the predictions produced by the algorithm it is necessary to ask ourselves whether they actually make sense when compared to the real conditions of the Italian regions in terms of hospital healthcare provision. For example, it is very unlikely that the value of hospital emigration will decrease in Molise. In fact, Molise is one of the small regions that have very high levels of hospital emigration and this value will probably continue to be high in the future. Another predicted value that appears difficult to justify is Calabria. In fact, for Calabria the ANN algorithm predicts growth from an amount of 20.8 units up to a value of 25.32 units or a growth of 21.71%. Calabria is one of the Italian regions with the highest level of hospital emigration and although this value will certainly remain high in the future, it is very unlikely that it will grow by 21.71% as predicted by the ANN algorithm. A further case to be critically analyzed is Campania: the value of hospital emigration is predicted to decrease by 25.99%, going from 9.2 to 6.81. It is very unlikely that the reduction in hospital emigration will decrease by 25.99%, especially due to economic policies that tend to reduce the amount of healthcare spending as a percentage of GDP. For similar reasons, it is very unlikely that there will be a reduction in the value of hospital emigration in Trentino Alto Adige and Emilia Romagna. For these regions the algorithm predicts a reduction of 36.49% for Trentino Alto Adige and 37.50% for Emilia Romagna respectively. Finally, the average value of hospital emigration among the Italian regions is predicted to decrease even if at a marginal level or equal to -0.39%. However, it is very likely that there will be a growth in the average value of hospital emigration in the Italian regions due to the reduction in healthcare spending which could generate a further growth in the gap between Northern and Southern Italy in terms of distribution of public resources and access to the system healthcare. Therefore it is necessary to underline that the ANN algorithm is the best predictor based on the metric indicators presented. However, the results obtained must be subjected to further qualitative analyzes and must also be interpreted in light of health economic policies which are increasingly oriented towards reducing public spending as a percentage of GDP. In fact, considering the trend of Italian public spending, it is very probable that the value of hospital emigration in the Italian regions will grow significantly in the future.
6. Conclusions
This article addressed the issue of hospital migration in Italian regions in the context of the ESG model inspired by SDGs policies. A complex econometric analysis was presented aimed at first verifying the impact of the individual components E, S and G in determining the level of patient migration. Subsequently, the aggregate impact of ESG in determining HEAR was also calculated. The results show that hospital migration tends to be inversely related to ESG factors. Therefore, regions that have high ESG scores also tend to have a low level of patient migration. Conversely, regions that have low levels of ESG tend to have higher patient migration. Subsequently, clustering was carried out with the k-Means algorithm to capture the elements of the regional distribution of patient migration. The results show a significant inequality between the southern regions and the northern regions. That is, the southern regions tend to have higher levels of patient migration than the northern regions. However, some role must also be recognized to demographic aspects: that is, sparsely populated regions tend to have increasing levels of patient migration. Finally, a prediction is presented by comparing eight different machine learning algorithms evaluated based on their ability to maximize the R-squared and minimize the value of statistical errors. The analysis shows that the most efficient algorithm is the ANN. The ANN predicts a reduction in patient migration. However, in the discussion of the results this prediction is contested as unlikely to be probable, not for metric-statistical reasons, but rather for political-institutional motivations. In fact, the political economic conditions and institutional reforms that could lead to fiscal independence of the North-East regions compared to the rest of Italy could lead to a significant growth in hospital migration from South to North. It is therefore necessary for the policy maker to take considering the possibility of reorganizing healthcare in order to guarantee access to healthcare while reducing regional inequalities.
References
- M. Frischhut and R. Levaggi, "Patient mobility in the context of austerity and an enlarged EU: the European Court of justice's ruling in the Petru case," Health Policy, vol. 119, no. 10, pp. 1293-1297, 2015. [CrossRef]
- N. Azzopardi-Muscat, R. Baeten, T. Clemens, T. Habicht, I. Keskimäki, I. Kowalska-Bobko and E. van Ginneken, "The role of the 2011 patients' rights in cross-border health care directive in shaping seven national health systems: Looking beyond patient mobility.," Health Policy, vol. 122, no. 3, pp. 279-283., 2018. [CrossRef]
- P. Carrera and N. Lunt, "A European perspective on medical tourism: the need for a knowledge base," International Journal of Health Services , vol. 40, no. 3, pp. 469-484, 2010. [CrossRef]
- G. Berki, "Cross-border patient mobility: the Legal Framework of obtaining healthcare abroad within the European Union: a patient’s perspective," Doctoral dissertation Ghent University, 2015. [CrossRef]
- D. A. Andritsos and C. S. Tang, "Introducing competition in healthcare services: The role of private care and increased patient mobility," European Journal of Operational Research, vol. 234, no. 3, pp. 898-909, 2014. [CrossRef]
- Kaufmann, "Legal Instruments and Cross-Border Patient Mobility," in Unionsbürgerschaft und Patientenfreizügigkeit Citoyenneté Européenne et Libre Circulation des Patients EU Citizenship and Free Movement of Patients, 2014, pp. 25-30.
- S. L. Greer and S. Rauscher, "Destabilization rights and restabilization politics: policy and political reactions to European Union healthcare services law," Journal of European Public Policy, vol. 18, no. 2, pp. 220-240, 2011. [CrossRef]
- K. Veitch, "Juridification, medicalisation, and the impact of EU Law: Patient mobility and the allocation of scarce NHS resources," Medical law review, vol. 20, no. 3, pp. 362-398, 2012. [CrossRef]
- M. Krajewski, "Patient mobility beyond Calais: health services under WTO law," Health Care and EU Law, pp. 453-478, 2011. [CrossRef]
- D. Cantarero, "Health care and patients’ migration across Spanish regions," The European Journal of Health Economics, vol. 7, pp. 114-116, 2006. [CrossRef]
- Glinos, "Worrying about the wrong thing: patient mobility versus mobility of health care professionals," Journal of Health Services Research & Policy, vol. 17, no. 4, pp. 254-256, 2012. [CrossRef]
- Ricci, E. Barzan and F. Longo, "How to identify the drivers of patient inter-regional mobility in beveridgean systems? Critical review and assessment matrix for policy design & managerial interventions.," Health Services Management Research, vol. 34, no. 4, 2021. [CrossRef]
- S. A. N. Sayın and S. Delil, "Beyond a Health-Related Issues: Socioeconomic Determinants of Patient Mobility in Turkey," Hacettepe Üniversitesi İktisadi ve İdari Bilimler Fakültesi Dergisi, vol. 39, no. 1, pp. 121-131, 2021.
- K. G. Hem, B. Kalseth and A. Wilson, "Patient mobility in the Nordic Countries-Volume and obstacles," Nordic Council of Ministers, 2011.
- G. Messina, S. Forni, F. Collini, C. Quercioli and N. Nante, "Patient mobility for cardiac problems: a risk-adjusted analysis in Italy," BMC health services research, vol. 13, pp. 1-9, 2013. [CrossRef]
- G. Messina, N. Vigiani, L. Lispi and N. & Nante, " Patient migration among the Italian regions in 2003.," Italian Journal of Public Health, vol. 5, no. 1, 2008. [CrossRef]
- G. Fattore, G. Petrarca and A. Torbica, "Traveling for care: Inter-regional mobility for aortic valve substitution in Italy," Health Policy, vol. 117, no. 1, pp. 90-97, 2014. [CrossRef]
- De Nicola, S. Gitto and P. Mancuso, "A two-stage DEA model to evaluate the efficiency of the Italian health system," MPRA Paper, no. 68690, 2011.
- J. Ding, C. Yang, Y. Wang, P. Li, F. Wang, Y. Kang and L. Zhang, "Influential factors of intercity patient mobility and its network structure in China," Cities, vol. 132, no. 103975, 2023. [CrossRef]
- Aggarwal, D. Lewis, M. Mason, R. Sullivan and J. van der Meulen, "Patient mobility for elective secondary health care services in response to patient choice policies: a systematic review," Medical Care Research and Review, vol. 74, no. 4, pp. 379-403, 2017. [CrossRef]
- S. Balia, R. Brau and E. Marrocu, "Interregional patient mobility in a decentralized healthcare system," Regional Studies, vol. 52, no. 3, pp. 388-402, 2018. [CrossRef]
- M. J. Laugesen and A. Vargas-Bustamante, "A patient mobility framework that travels: European and United States–Mexican comparisons," Health Policy, vol. 97, no. 2-3, pp. 225-231, 2010. [CrossRef]
- M. Irlacher, D. Pennerstorfer, A. T. Renner and F. Unger, "Modeling inter-regional patient mobility: Does distance go far enough?," 2021.
- Bjorvatn and A. Ma, "Patient mobility and public hospital waiting time. Four Essays on Health Care Reforms in Norway," in PhD Dissertation. University of Bergen, 2011.
- A. Glinos, R. Baeten and H. Maarse, "Purchasing health services abroad: practices of cross-border contracting and patient mobility in six European countries," Health Policy, vol. 95, no. 2-3, pp. 103-112, 2010. [CrossRef]
- T. Mainil, F. Van Loon, K. Dinnie, D. Botterill, V. Platenkamp and H. Meulemans, "Transnational health care: from a global terminology towards transnational health region development," Health Policy, vol. 108, no. 1, pp. 37-44, 2012. [CrossRef]
Figure 1.
By optimizing the k-Means algorithm with the Silhouette coefficient it is possible to verify that the optimal k value is k=2. By calculating the average of the individual clusters it is possible to verify which of the clusters has a dominant value of the observed variable. In the case presented, the average of Cluster 2 is higher than the average of Cluster 1. The following ordering of the Clusters therefore derives: Cluster 2>Clusters 1.
Figure 1.
By optimizing the k-Means algorithm with the Silhouette coefficient it is possible to verify that the optimal k value is k=2. By calculating the average of the individual clusters it is possible to verify which of the clusters has a dominant value of the observed variable. In the case presented, the average of Cluster 2 is higher than the average of Cluster 1. The following ordering of the Clusters therefore derives: Cluster 2>Clusters 1.
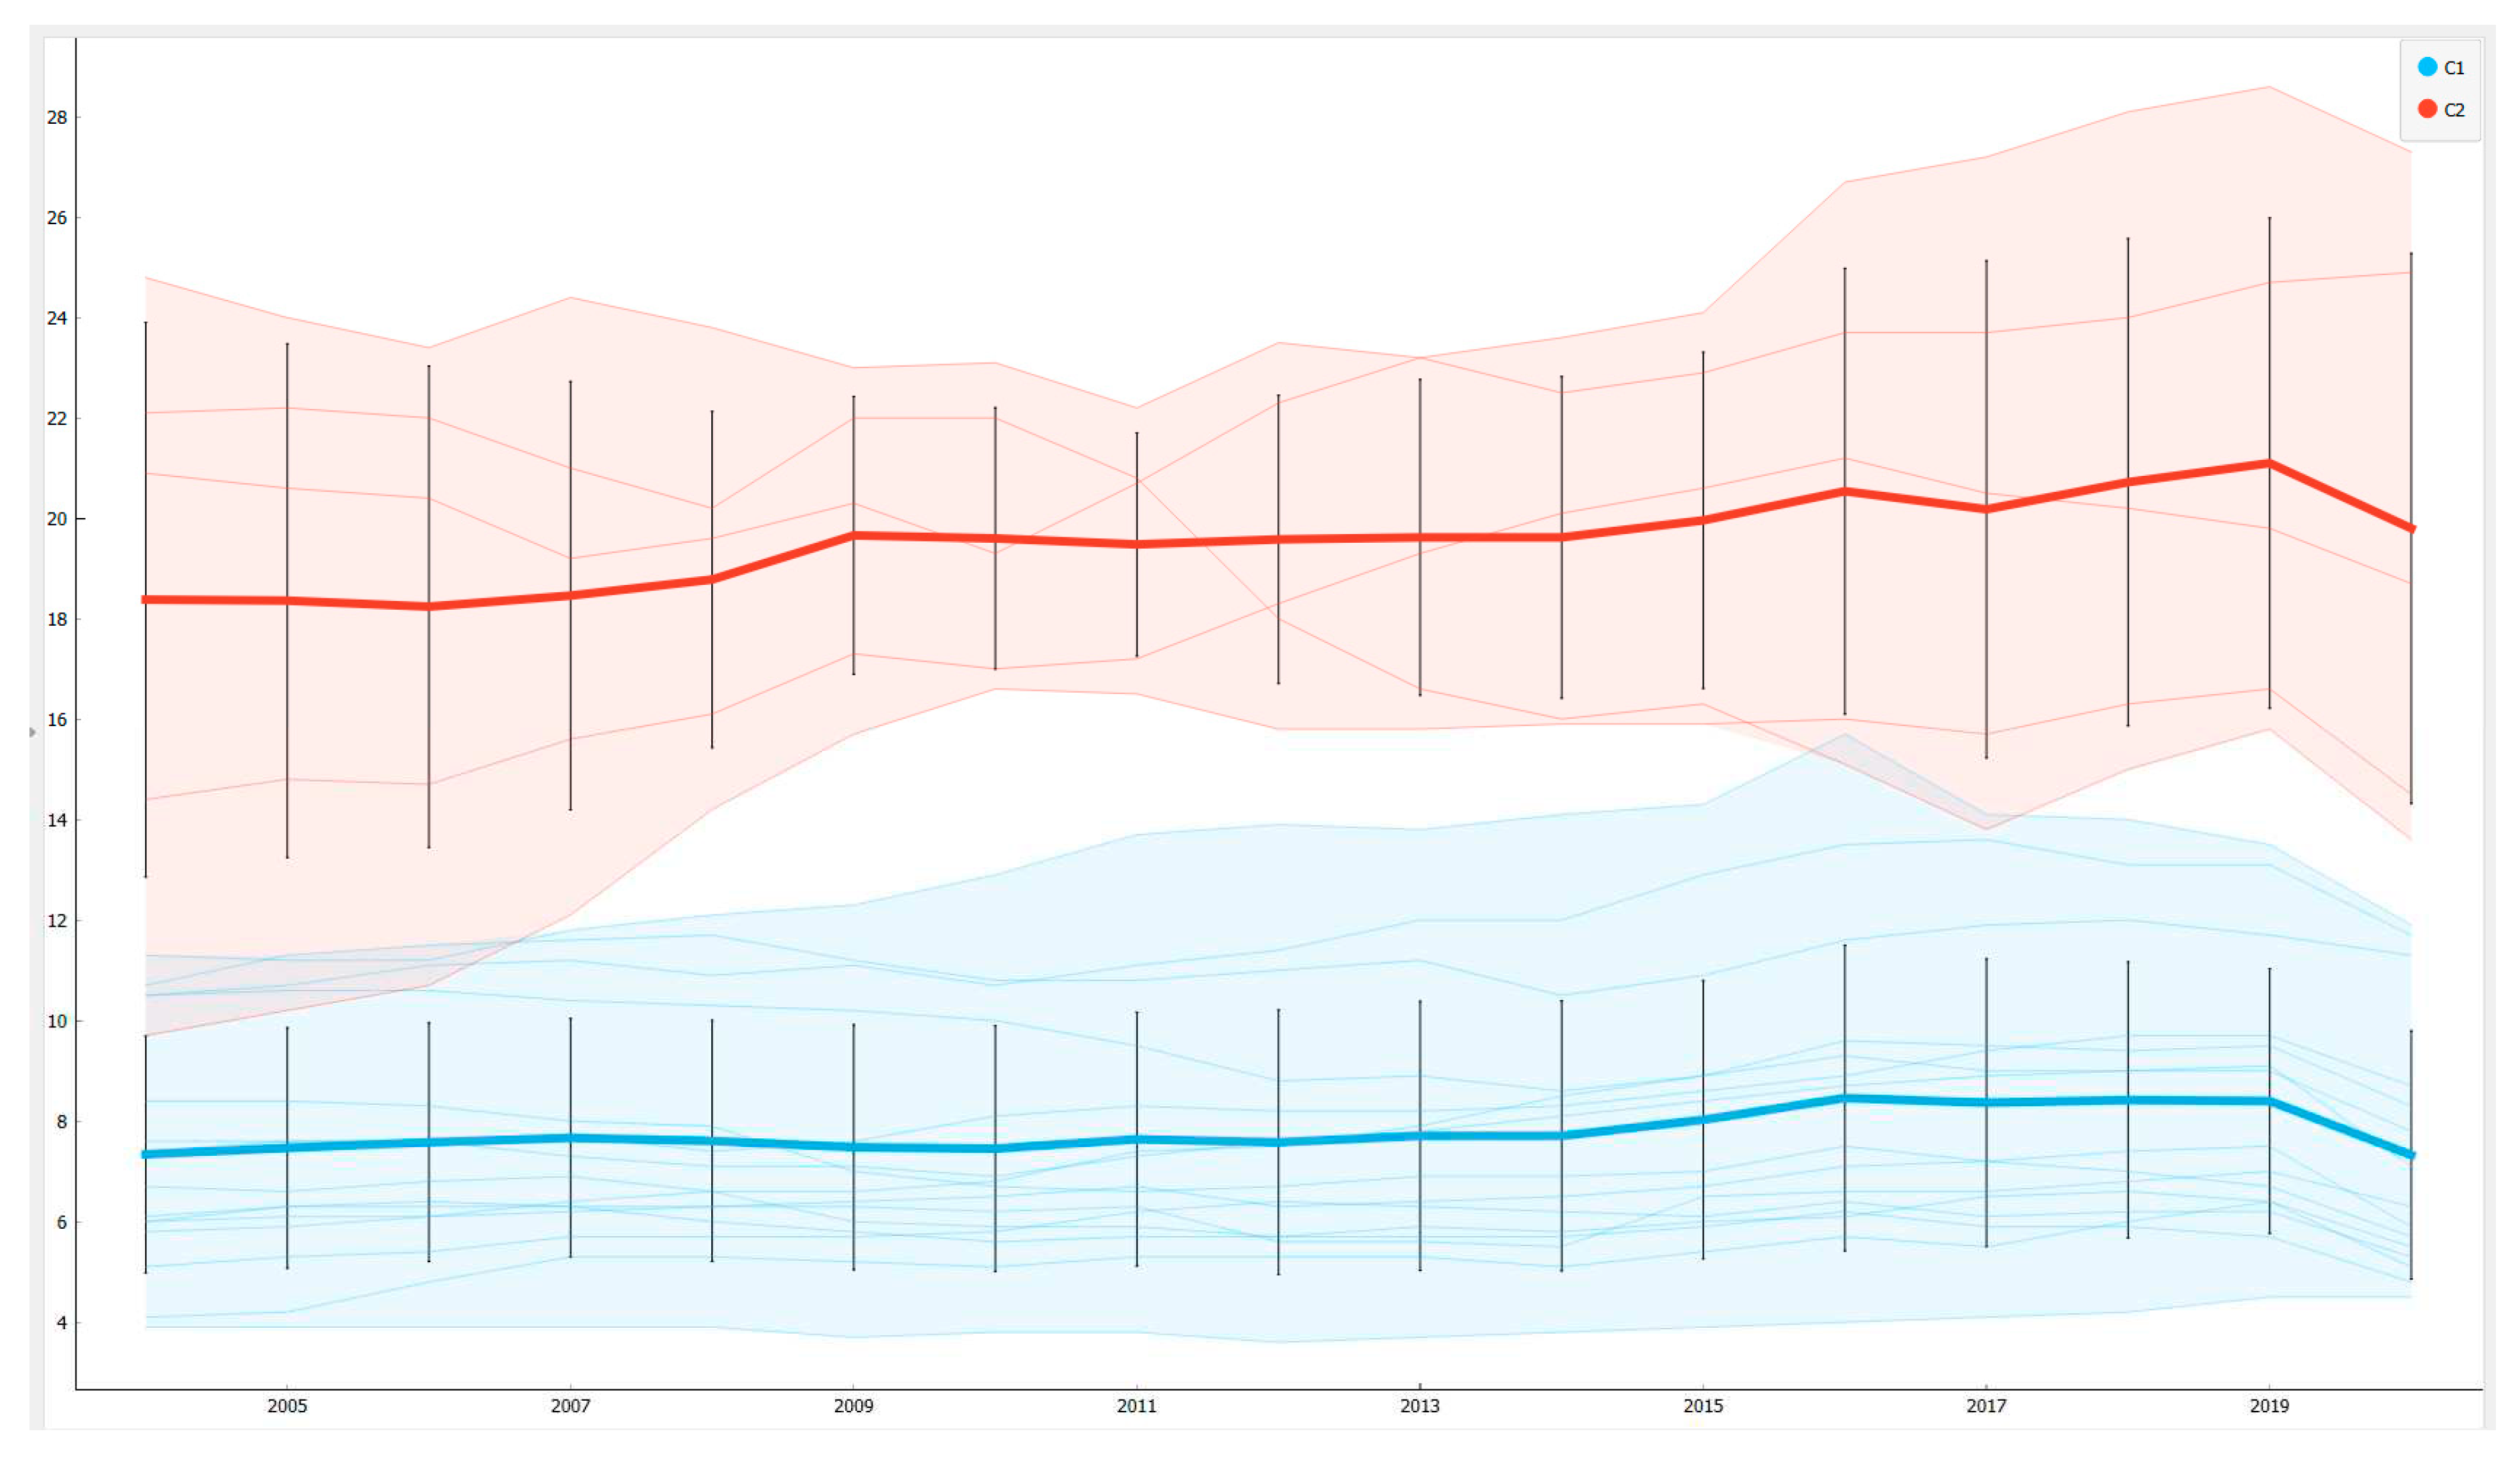
Figure 2.
The negative relationship between the value of hospital emigration and the value of the resident population in 2021. Regions that have a smaller population tend to be characterized by a growth in hospital migration.
Figure 2.
The negative relationship between the value of hospital emigration and the value of the resident population in 2021. Regions that have a smaller population tend to be characterized by a growth in hospital migration.
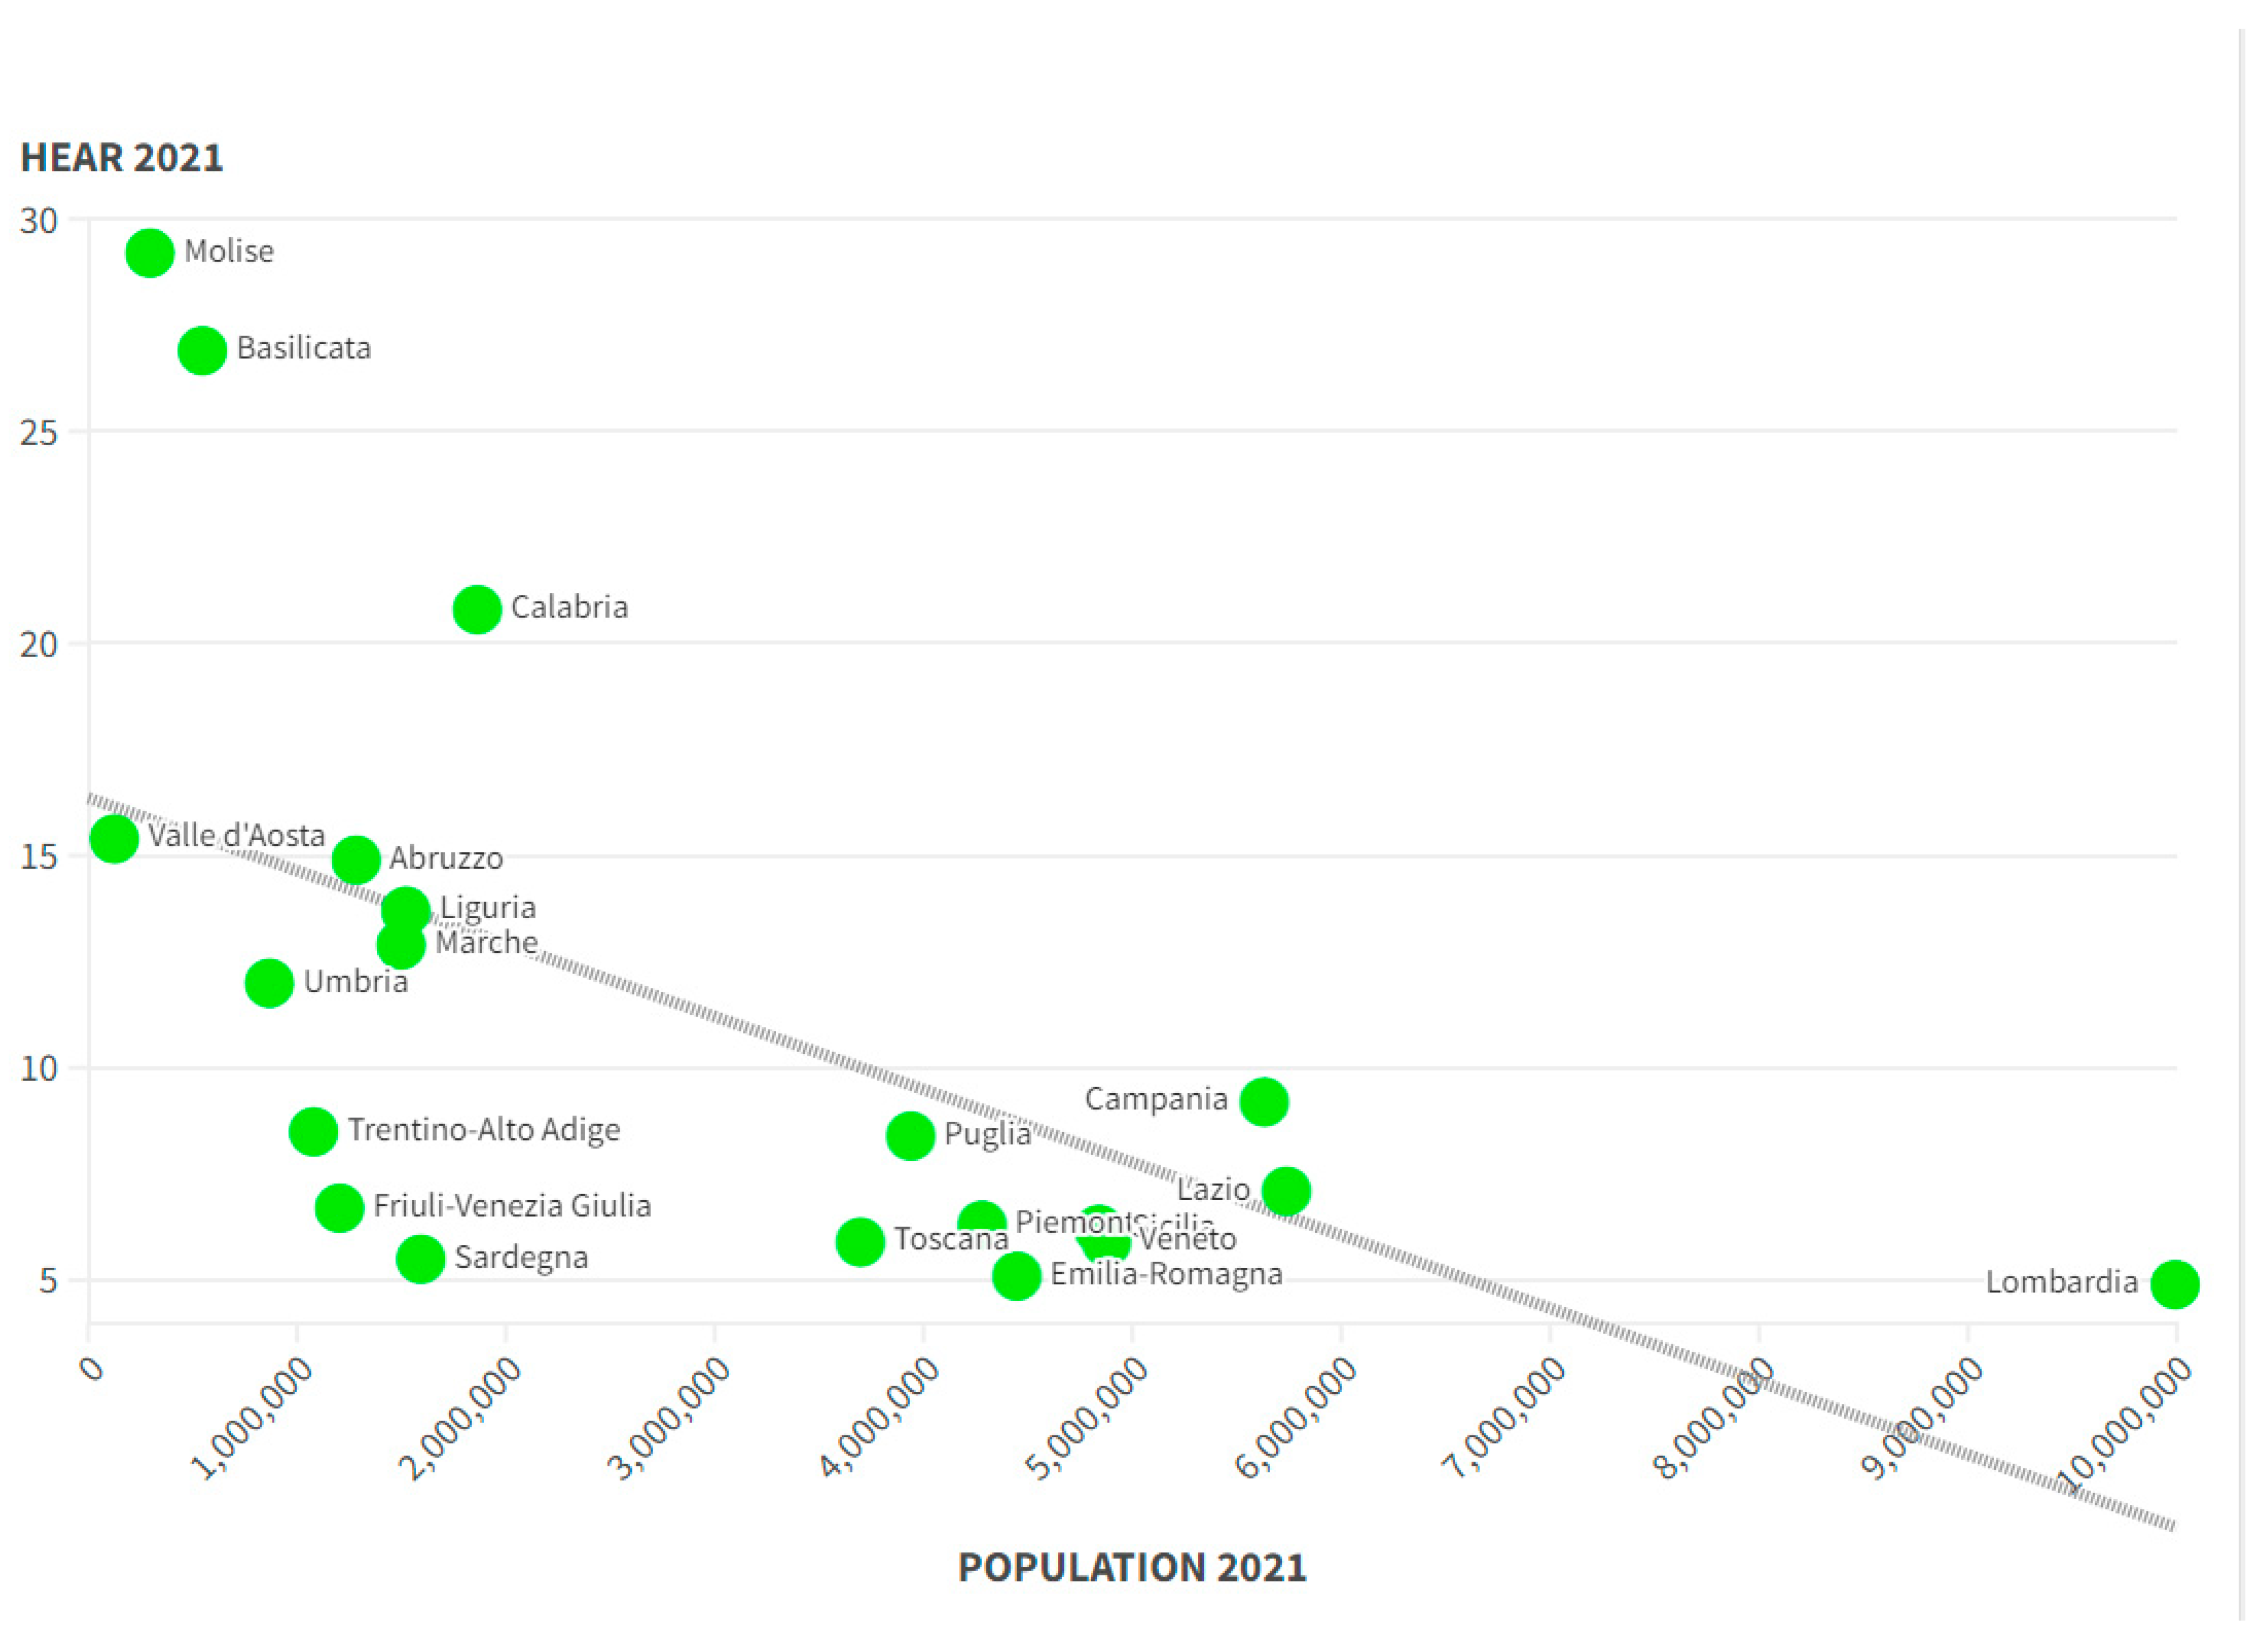
Figure 3.
Value of Hospital Emigration in 2021 in the Italian Regions. Source: ISTAT-BES.
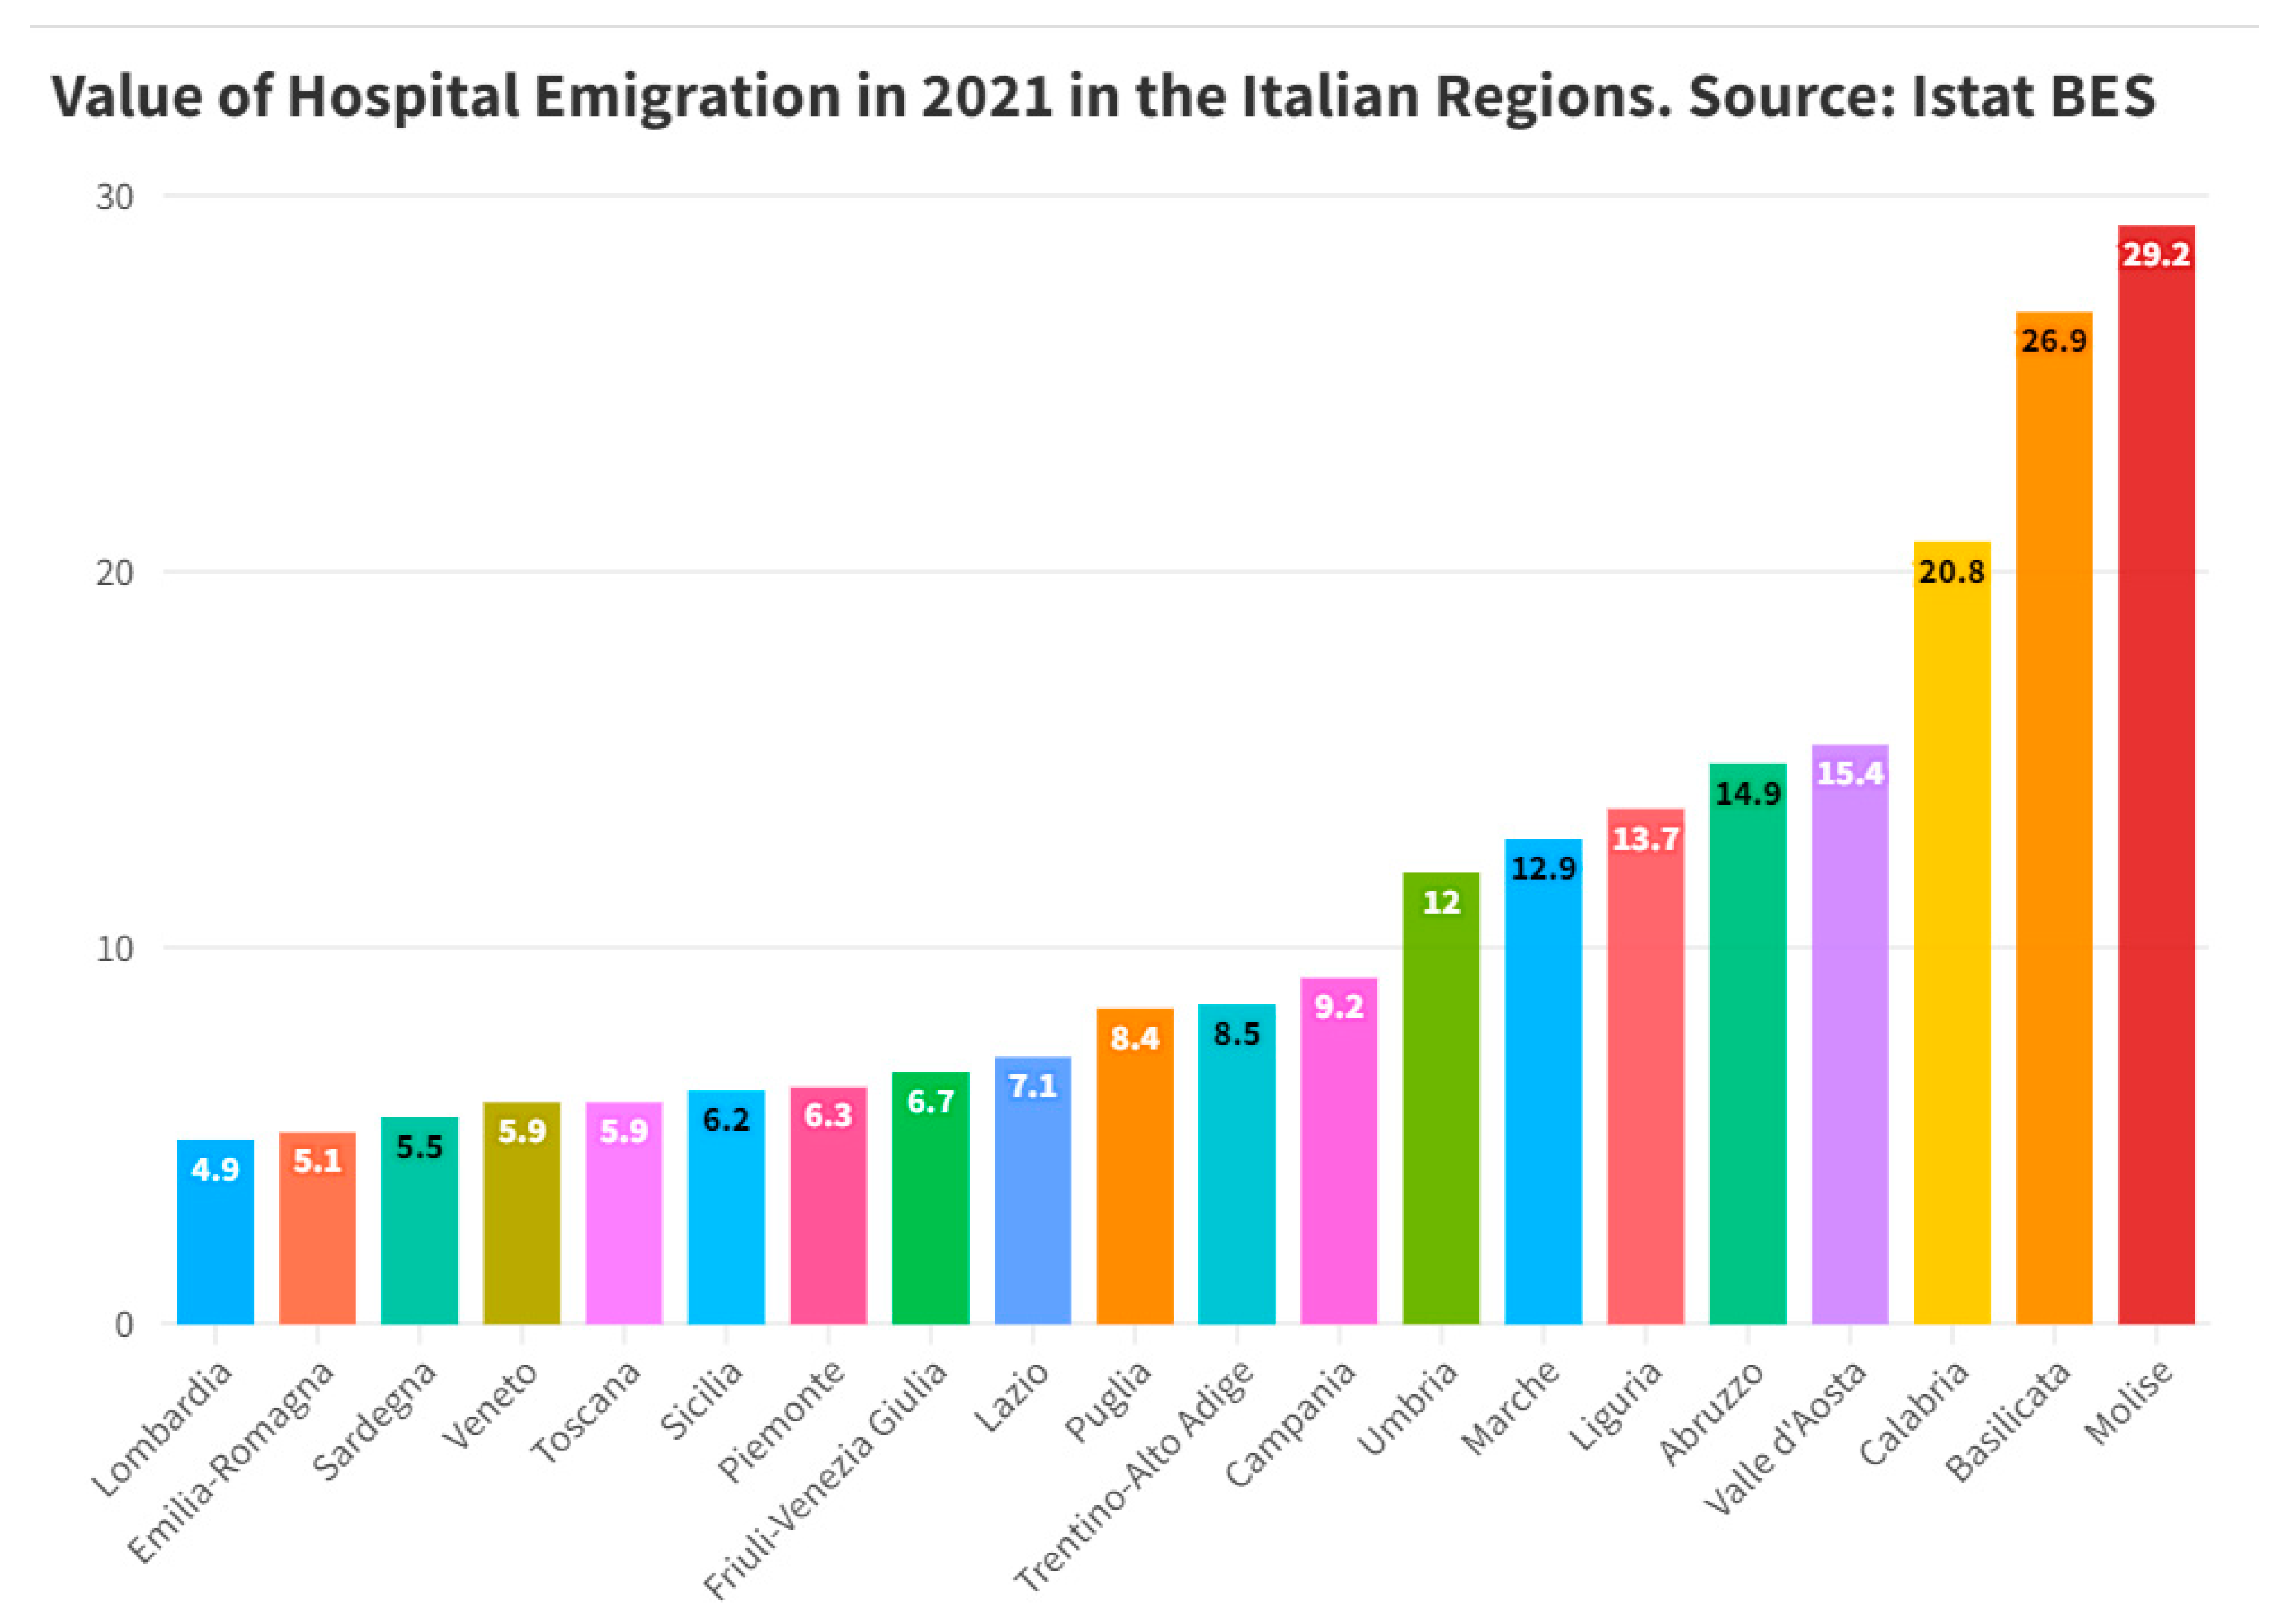
Figure 4.
Percentage and absolute change in the value of hospital migration between 2004 and 2021 in the Italian regions. Source: ISTAT-BES.
Figure 4.
Percentage and absolute change in the value of hospital migration between 2004 and 2021 in the Italian regions. Source: ISTAT-BES.
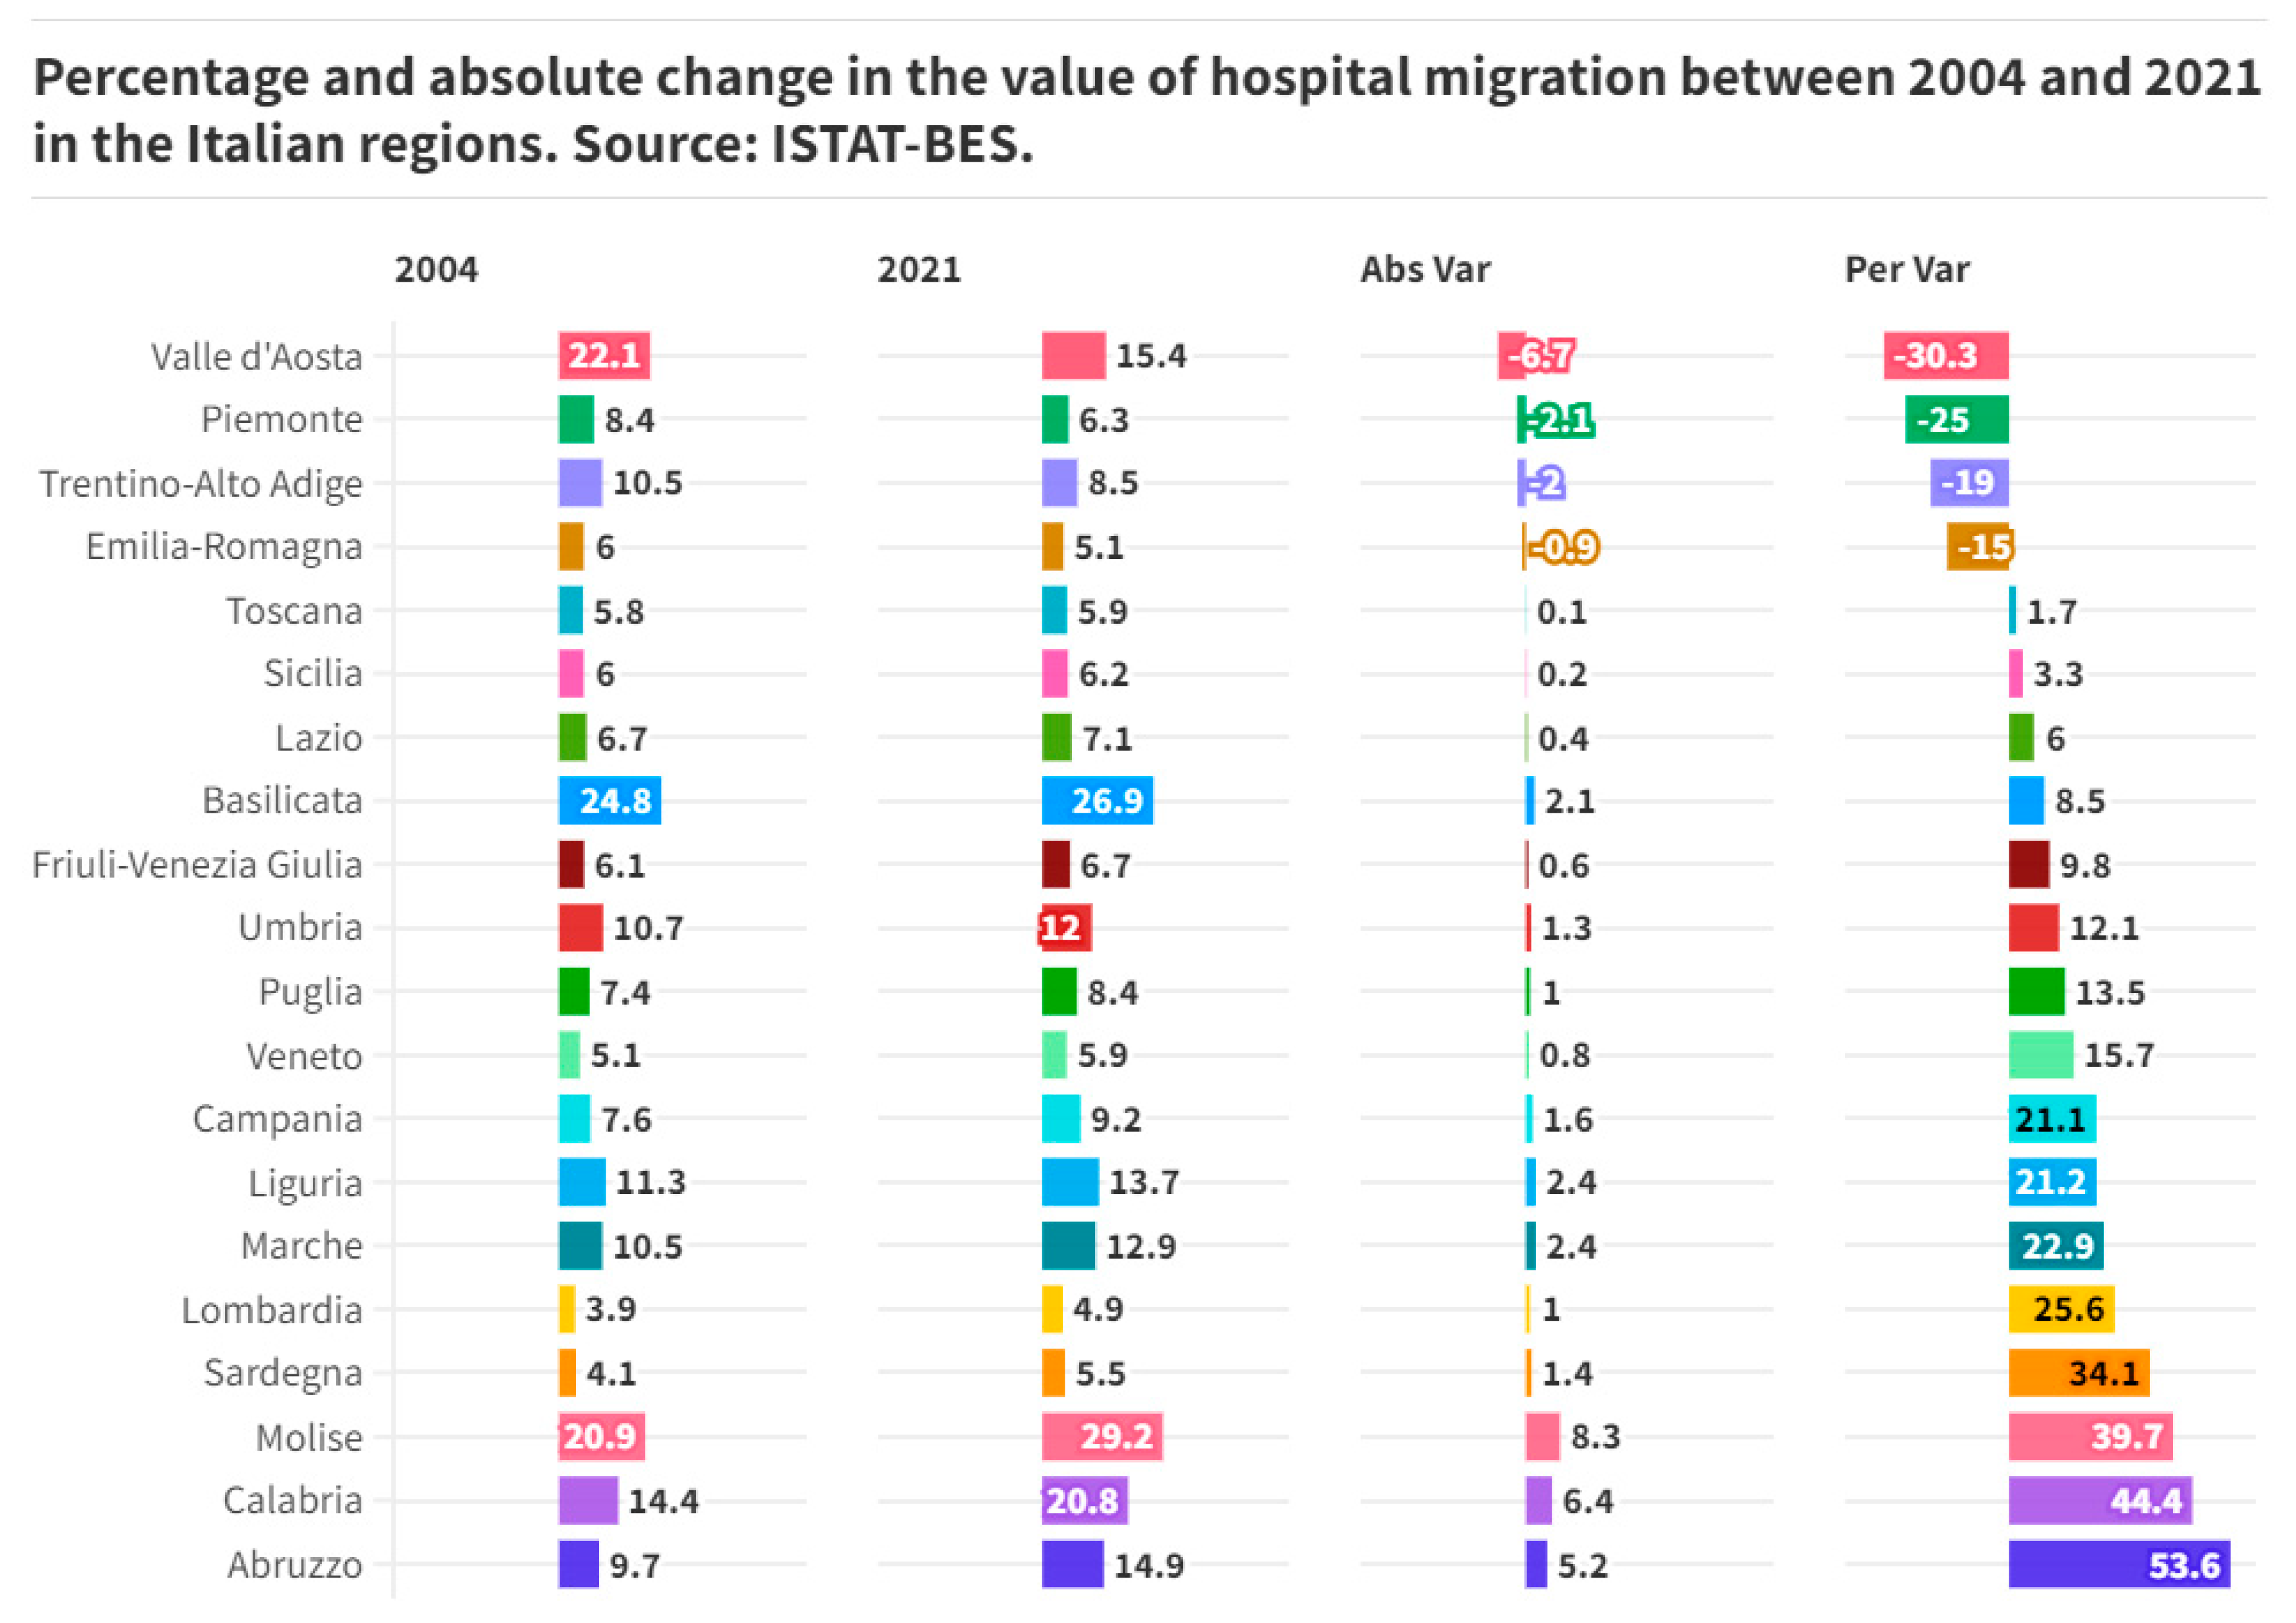
Figure 5.
Statistical Measures for the evaluation of the best predictive machine learning algorithm.
Figure 5.
Statistical Measures for the evaluation of the best predictive machine learning algorithm.
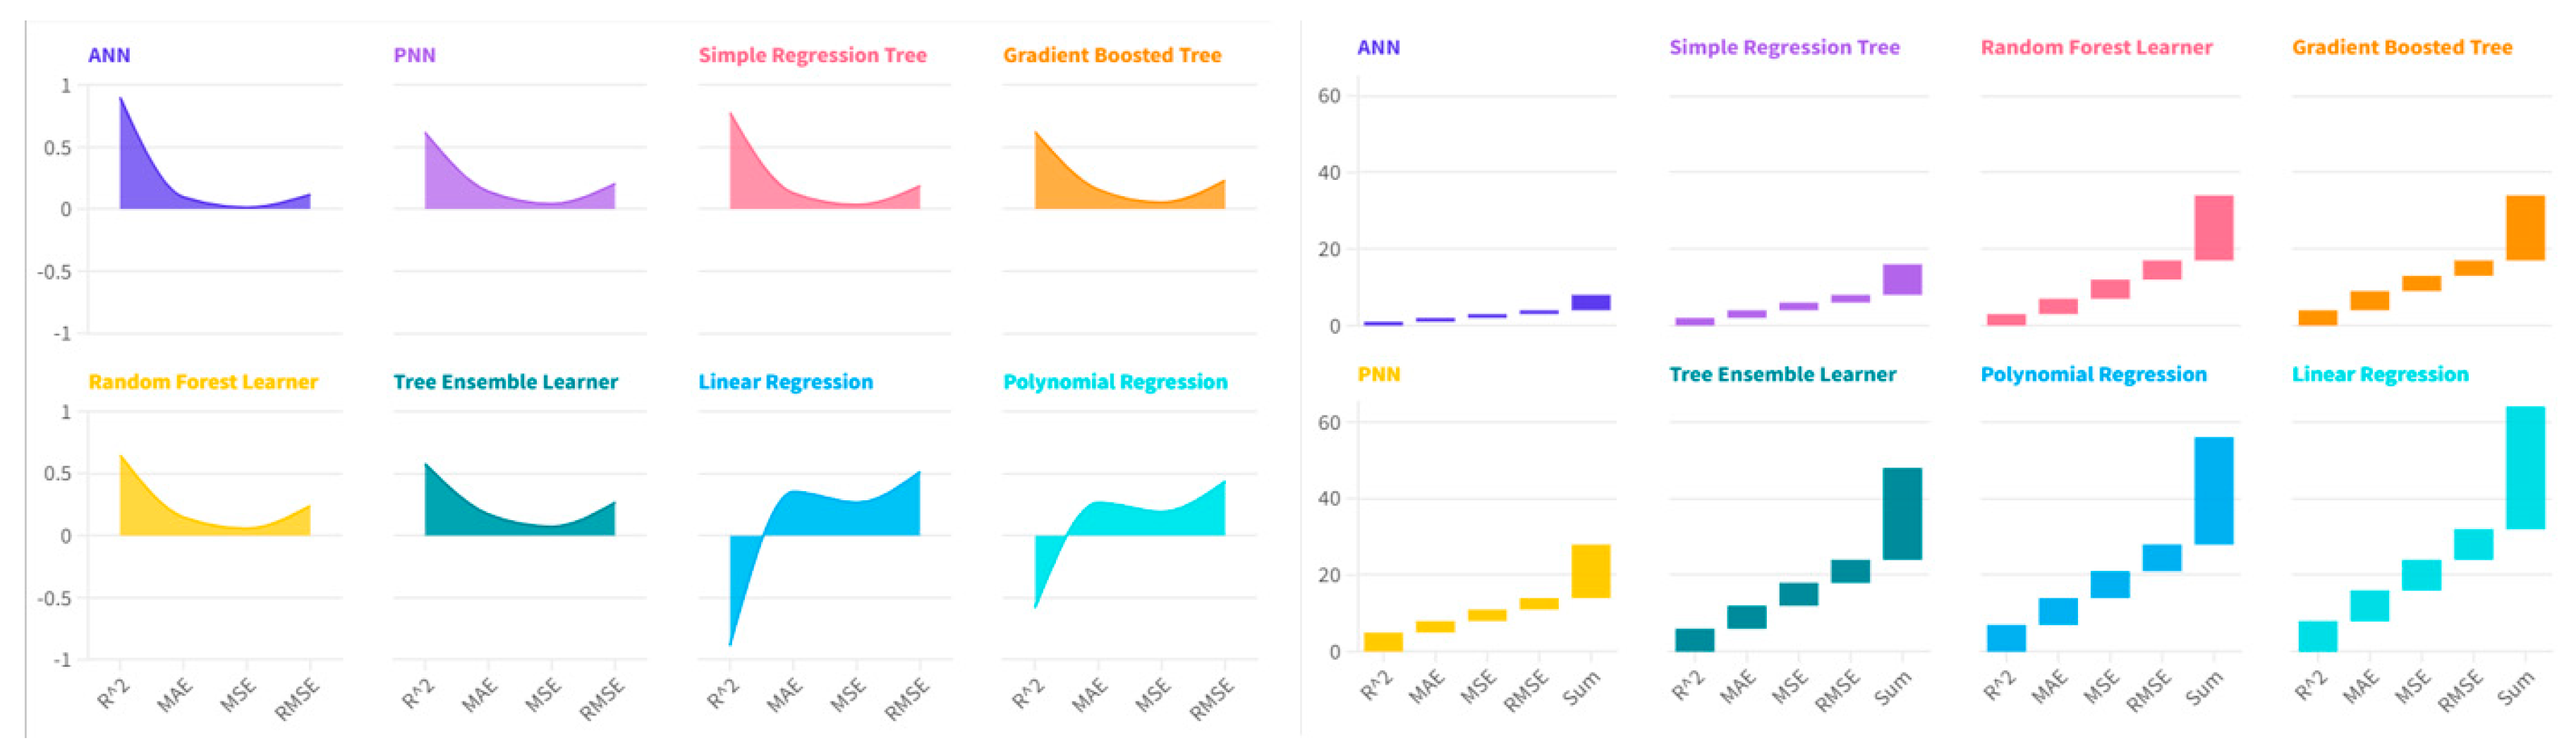
Figure 6.
Summary of the productions and of the absolute and percentage variations of the predicted values with the ANN-Artificial Neural Network algorithm.
Figure 6.
Summary of the productions and of the absolute and percentage variations of the predicted values with the ANN-Artificial Neural Network algorithm.
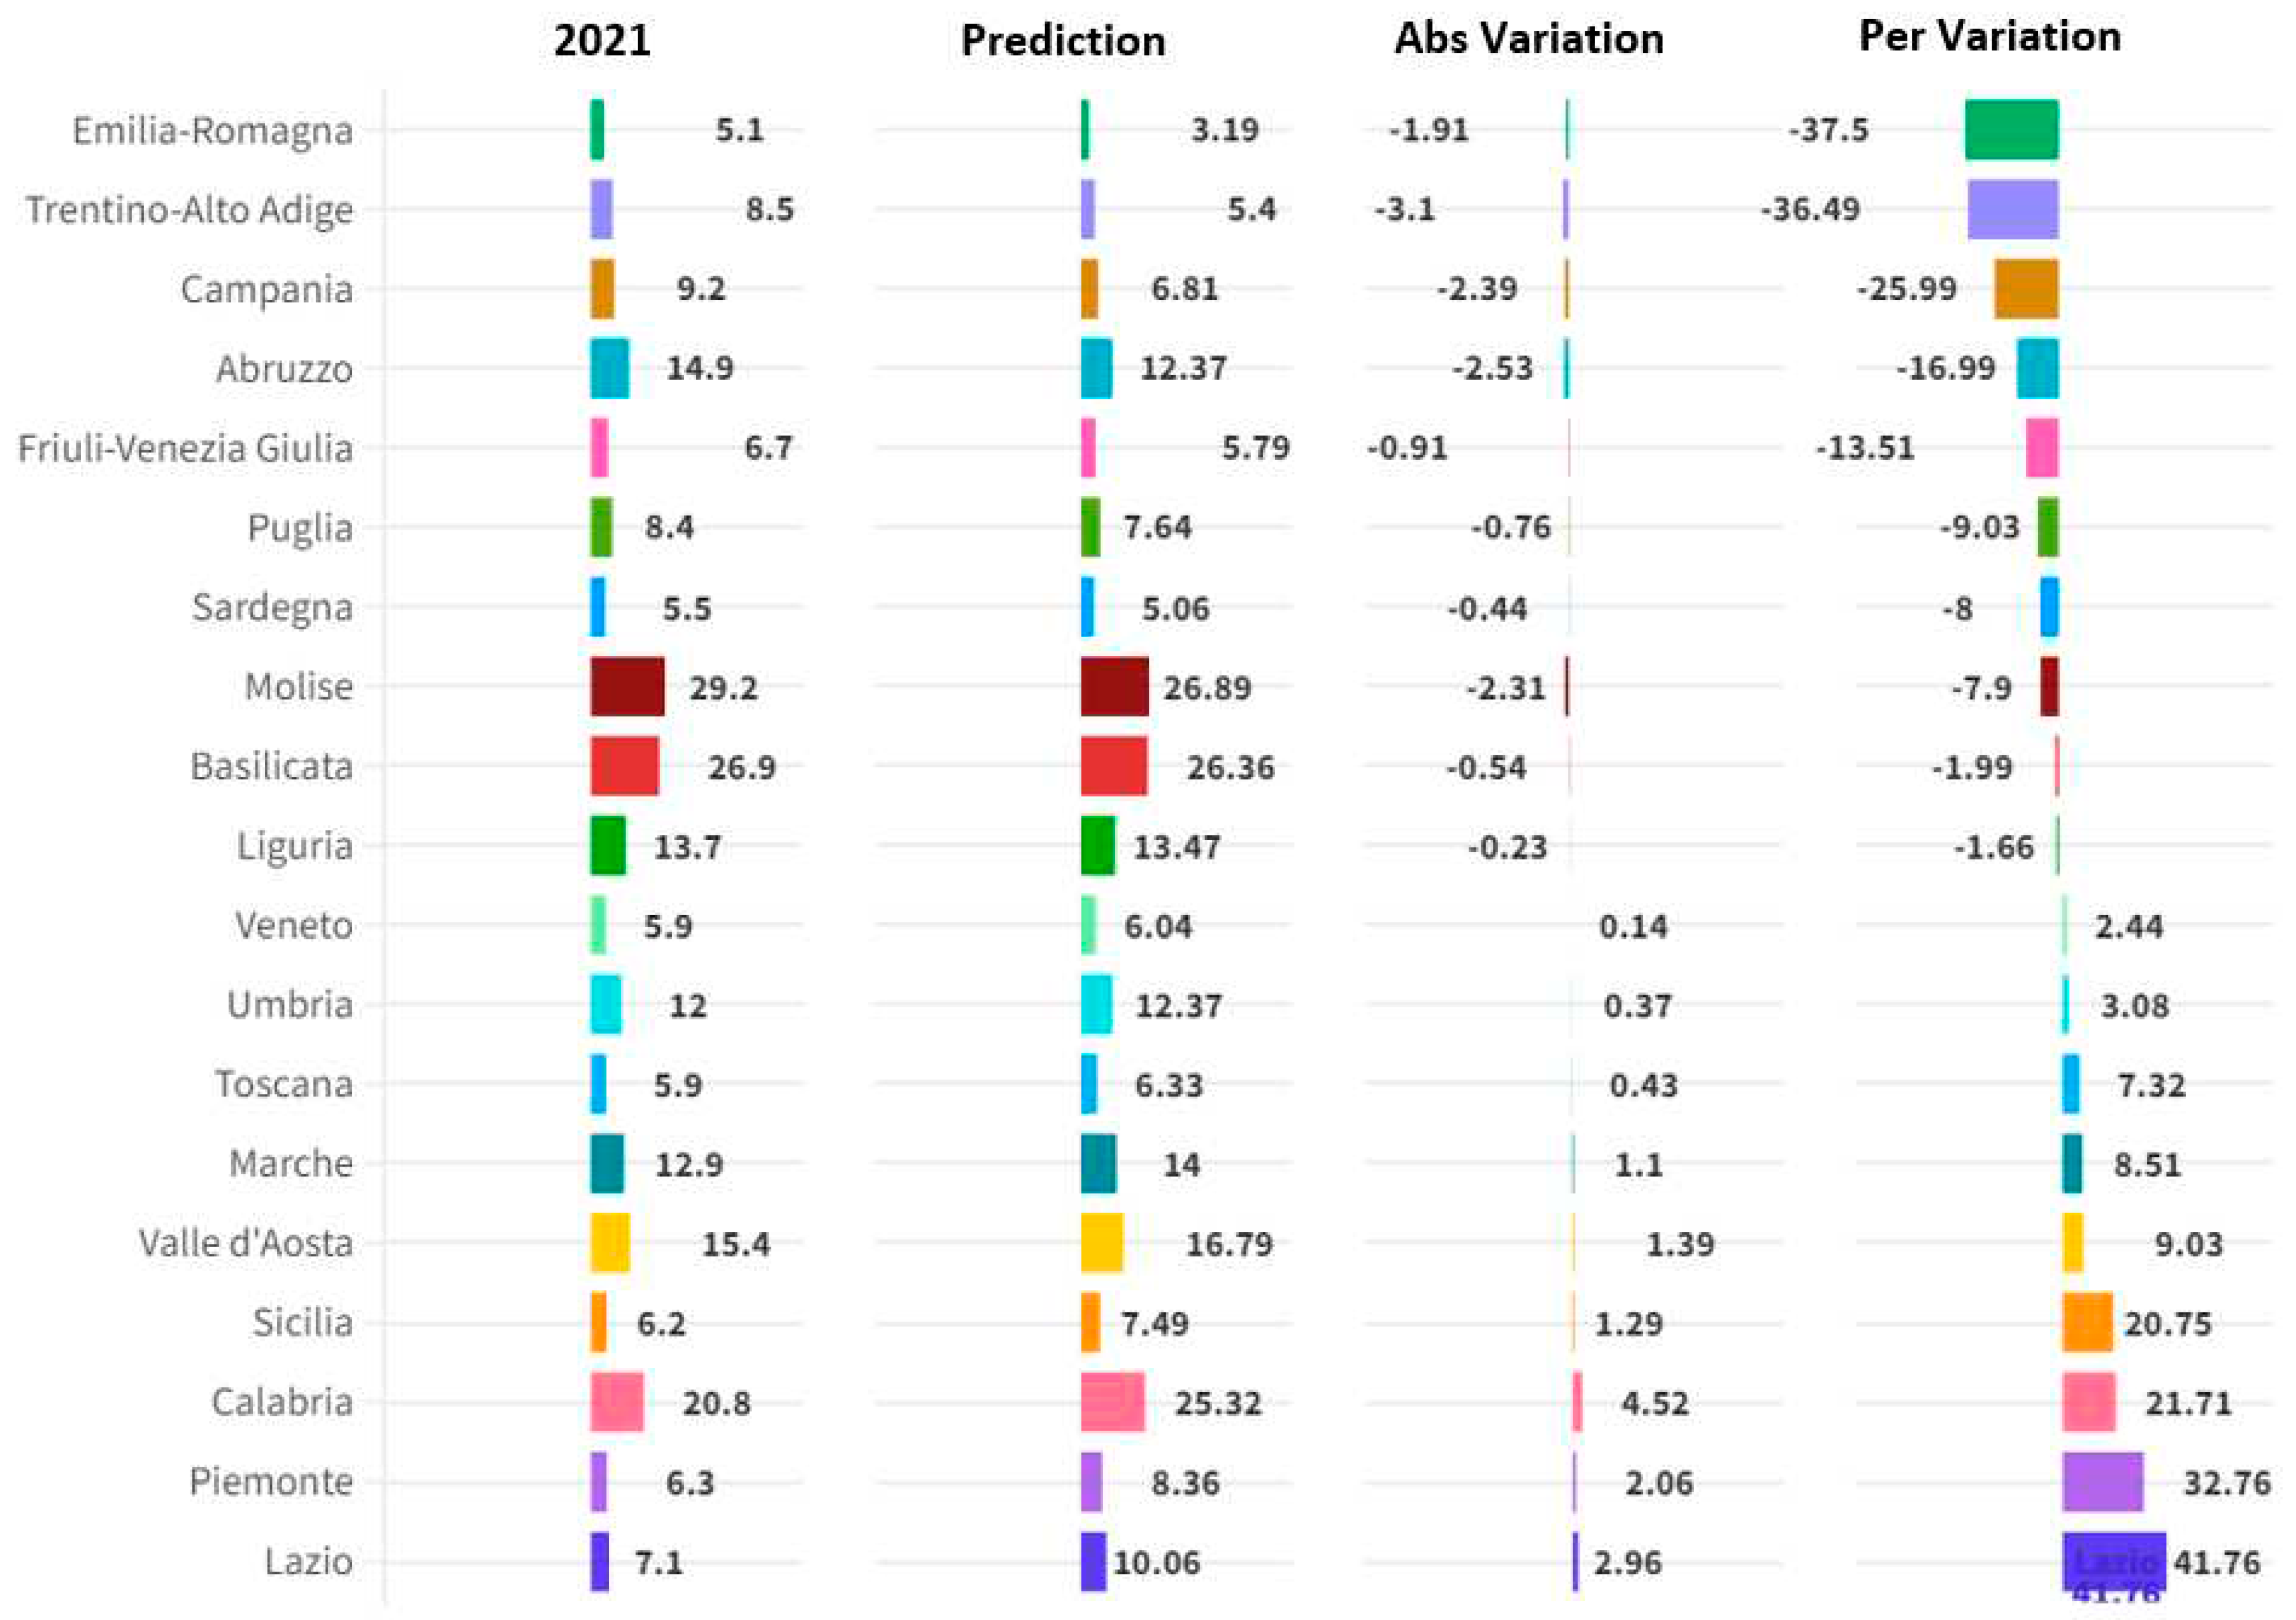
Table 1.
Definition of Variables used for the Estimation of the Impact of E-Environmental on ESG.
| Table 1. Definition of Variables used for the Estimation of the Impact of S-Social Component of the ESG Model on HEAR. | ||
| Variables | Label | Definition |
| HEAR | Percentage ratio between hospital discharges in regions other than that of residence and the total of the resignations of residents in the region. Data yes refer only to hospital admissions under the ordinary "acute" regime (admissions to wards are excluded of “spinal unit”, “functional recovery and rehabilitation”, “neuro-rehabilitation” and “long-term care”). | |
| DLP | Percentage of people aged 14 and over who declare that the landscape of the place they live is affected by evident degradation out of the total number of people aged 14 and over. | |
| CLD | Percentage of people aged 14 and over who list landscape damage caused by excessive building construction as one of the five most worrying environmental problems among all people aged 14 and over. | |
| DIHP | Number of days in the year in which the maximum temperature is above the 90th percentile of the distribution in the reference climatological period (1981-2010), for at least six consecutive days. | |
| DWIP | Number of days of the year in which the daily cumulative precipitation exceeds or equals the value of 50 mm | |
| PA | Percentage of land surface covered by terrestrial protected natural areas included in the official list of protected areas (Euap) or belonging to the Natura 2000 network. | |
| SSC | Percentage of authorized bathing coasts out of the total coastal line in accordance with current regulations. | |
| AUG | Square meters of urban greenery per inhabitant in provincial capitals/metropolitan cities | |
| TMW | Percentage of municipal waste sent to landfill out of your total municipal waste produced | |
Table 2.
Estimation of the impact of a set of E-Environmental Variables on HEAR in the Italian Regions.
Table 2.
Estimation of the impact of a set of E-Environmental Variables on HEAR in the Italian Regions.
| Table 2. Estimation of the impact of a set of E-Environmental Variables on HEAR in the Italian Regions | |||||||||||
| Label | Costant | DLP | CLD | DIHP | DWIP | PA | SSC | AUG | TMW | HEAR(-1) | |
| Pooled OLS | Coefficient | 416.792 | 0,1533 | -0,2344 | -0,0789 | 0,9710 | 0,1105 | 0,0304 | 0,0294 | 0,1059 | |
| Standard Error | 0,86048 | 0,0381703 | 0,0693291 | 0,0322522 | 0,363865 | 0,0304787 | 0,010977 | 0,0043254 | 0,0127216 | ||
| P-Value | *** | *** | *** | ** | *** | *** | *** | *** | *** | ||
| Fixed Effetcs | Coefficient | 670.649 | 0,174227 | -0,149582 | -0,15318 | 0,810497 | 0,0945813 | 0,0250628 | 0,014449 | 0,0614004 | |
| Standard Error | 0,64187 | 0,0217315 | 0,0344709 | 0,0157339 | 0,186266 | 0,0139043 | 0,00535608 | 0,0026566 | 0,0104031 | ||
| P-Value | *** | *** | *** | *** | *** | *** | *** | *** | *** | ||
| Random Effects | Coefficient | 659.719 | 0,175575 | -0,151357 | -0,15119 | 0,808873 | 0,0948203 | 0,02513 | 0,014723 | 0,0632662 | |
| Standard Error | 126.334 | 0,0214795 | 0,0343031 | 0,0156264 | 0,185275 | 0,0138514 | 0,00533208 | 0,0026324 | 0,0101938 | ||
| P-Value | *** | *** | *** | *** | *** | *** | *** | *** | *** | ||
| WLS | Coefficient | 224.667 | 0,179609 | -0,117543 | -0,0664484 | 0,601359 | 0,0868386 | 0,0237659 | 0,0238557 | 0,125797 | |
| Standard Error | 0,34795 | 0,0220068 | 0,0312007 | 0,0143309 | 0,160153 | 0,0168692 | 0,00549812 | 0,0029613 | 0,00645198 | ||
| P-Value | *** | *** | *** | *** | *** | *** | *** | *** | *** | ||
| 1-step dynamic panel | Coefficient | 0,158131 | -0,12188 | -0,132228 | 0,685698 | 0,083999 | 0,0170386 | 0,0201742 | 0,0931704 | 0,202953 | |
| Standard Error | 0,0269863 | 0,029405 | 0,0201817 | 0,202151 | 0,010533 | 0,00637014 | 0,005257 | 0,0171233 | 0,236419 | ||
| P-Value | *** | *** | *** | *** | *** | *** | *** | *** | |||
| Average | 0,1681746 | -0,1549474 | -0,11638172 | 0,7754932 | 0,09414404 | 0,0242705 | 0,0205189 | 0,0899006 | |||
Table 3.
Variables, Coefficients in Absolute Value, Correction, Corrected Value.
| Table 3. Variables, Coefficients in Absolute Value, Correction, Corrected Value and Aggregate E | |||
| Variable | (A) Absolute Value | (B) Correction | (C=A*B) Corrected Value |
| DLP | 0,78 | -1,00 | -0,78 |
| CLD | 0,17 | -1,00 | -0,17 |
| DIHP | 0,09 | 1,00 | 0,09 |
| DWIP | 0,09 | 1,00 | 0,09 |
| PA | 0,02 | 1,00 | 0,02 |
| SSC | 0,02 | 1,00 | 0,02 |
| AUG | 0,12 | -1,00 | -0,12 |
| TMW | 0,15 | -1,00 | -0,15 |
| Sum i.e. aggregate E | -0,98 | ||
Table 4.
Definition of Variables used for the Estimation of the Impact of E-Environmental on HEAR.
| Table 4. Definition of Variables used for the Estimation of the Impact of S-Social component of the ESG Model on HEAR | ||
| Variables | Label | Definition |
| HEAR | Percentage ratio between hospital discharges in regions other than that of residence and the total of the resignations of residents in the region. Data yes refer only to hospital admissions under the ordinary "acute" regime (admissions to wards are excluded of “spinal unit”, “functional recovery and rehabilitation”, “neuro-rehabilitation” and “long-term care”). | |
| TU | Percentage of recent high school graduates who enrol at university for the first time in the same year in which they obtained their upper secondary school diploma (cohort specific rate). Those enrolled in Higher Technical Institutes, Institutes of Higher Artistic, Musical and Dance Education, Higher Schools for Linguistic Mediators and foreign universities are excluded. | |
| EX | Percentage of people aged 18-24 with at most a lower secondary school diploma (middle school diploma), who do not possess regional professional qualifications obtained in courses lasting at least 2 years and not included in an education or training course out of the total number of people aged 18-24. | |
| ER | Percentage of employed people aged 20-64 in the population aged 20-64. | |
| LPE | Percentage of employees with an hourly wage lower than 2/3 of the median wage out of total employees. | |
| RIPD | Number of fatal accidents and those resulting in permanent disability among the total employed (net of the armed forces) per 10,000. | |
| ROP | Percentage of people living in families with an equivalent net income below a poverty risk threshold, set at 60% of the median of the individual distribution of equivalent net income. The income reference year is the calendar year preceding the survey year. | |
| EPIHC | Percentage of elderly people treated in integrated home care out of the total resident elderly population (65 years and over). | |
| GPT | Percentage of general practitioners with a number of patients exceeding the maximum threshold of 1500 patients envisaged by the contract for general practitioners. | |
| DRs | Number of doctors per 1,000 inhabitants. | |
Table 5.
Estimation of the impact of a set of S-Social Variables on HEAR in the Italian Regions.
| Table 5. Estimation of the impact of a set of S-Social Variables on HEAR in the Italian Regions | |||||||||||
| Constant | TU | EX | ER | LPE | RIPD | ROP | EPIHC | GPT | DRs | ||
| Fixed-effects | Coefficient | 707.280 | 0,034 | -0,073 | -0,111 | 0,040 | 0,308 | 0,184 | 0,460 | -0,020 | -0,435 |
| Standard Error | 0,676 | 0,006 | 0,031 | 0,014 | 0,017 | 0,039 | 0,036 | 0,087 | 0,011 | 0,087 | |
| P-value | *** | *** | ** | *** | ** | *** | *** | *** | * | *** | |
| Pooled OLS | Coefficient | 116.305 | 0,062 | -0,386 | -0,112 | 0,102 | 0,480 | 0,073 | 0,560 | -0,164 | -0,706 |
| Standard Error | 0,938 | 0,020 | 0,105 | 0,049 | 0,059 | 0,131 | 0,036 | 0,288 | 0,025 | 0,287 | |
| P-value | *** | *** | *** | ** | * | *** | ** | * | *** | ** | |
| Random-effects | Coefficient | 714.110 | 0,034 | -0,075 | -0,111 | 0,040 | 0,309 | 0,180 | 0,461 | -0,021 | -0,435 |
| Standard Error | 144.201 | 0,006 | 0,031 | 0,014 | 0,017 | 0,039 | 0,035 | 0,087 | 0,011 | 0,087 | |
| P-value | *** | *** | ** | *** | ** | *** | *** | *** | * | *** | |
| WLS | Coefficient | 104.708 | 0,052 | -0,289 | -0,098 | 0,152 | 0,377 | 0,059 | 0,573 | -0,139 | -0,583 |
| Standard Error | 0,590 | 0,013 | 0,095 | 0,037 | 0,042 | 0,094 | 0,028 | 0,202 | 0,017 | 0,195 | |
| P-value | *** | *** | *** | *** | *** | *** | ** | *** | *** | *** | |
| Average | 0,045 | -0,206 | -0,108 | 0,083 | 0,368 | 0,124 | 0,513 | -0,086 | -0,540 | ||
Table 7.
The Variables Used for the Estimation of the Impact of G-Governance Component within the ESG model on HEAR.
Table 7.
The Variables Used for the Estimation of the Impact of G-Governance Component within the ESG model on HEAR.
| Table 7. The Variable Used for the Estimation of the Impact of G-Governance Component within the ESG model on HEAR | ||
| Variable | Label | Definition |
| HEAR | Percentage ratio between hospital discharges in regions other than that of residence and the total of the resignations of residents in the region. Data yes refer only to hospital admissions under the ordinary "acute" regime (admissions to wards are excluded of “spinal unit”, “functional recovery and rehabilitation”, “neuro-rehabilitation” and “long-term care”). | |
| PYCC | Percentage of people aged 14 and over who have non-cohabiting relatives (in addition to parents, children, brothers, sisters, grandparents, grandchildren), friends or neighbors to rely on out of the total number of people aged 14 and over. | |
| AAIP | Average age of parliamentarians in the Senate and the House. Senators and deputies elected in foreign constituencies and senators for life are excluded. | |
| DCP | Actual average duration in days of proceedings settled in ordinary courts. | |
| PYCK | Victims of pickpocketing per 1,000 inhabitants. The number of victims is calculated using data on victims who reported pickpocketing to the police, corrected with the number of victims who did not report taken from the Citizen Security Survey, through a specific correction factor for geographical distribution and a by sex and age group. | |
| PDAL | Presence of elements of degradation in the area where you live: Percentage of people aged 14 and more than that they often see elements of social degradation and environmental in the area in which they live (they often see at least one element of degradation among the following: people who take drugs, people who deal drugs, acts of vandalism against public property, prostitutes looking for clients) out of the total number of people 14 years and older. | |
| MIG | Migration rate of Italians (25-39 years) with qualifications of tertiary study, calculated as the ratio between the migratory balance (difference between registered and canceled per transfer of residence) and residents with title of tertiary study (undergraduate, AFAM, doctorate). Values for Italy they only include movements to/from abroad, for the divisional values the inter-departmental movements. |
|
| RIU | Percentage of people aged 11 and over who used the Internet at least once a week in the 3 months preceding the interview. | |
| CW10 | Percentage of companies with at least 10 employees who sold via the web to end customers (B2C) during the previous year. From the survey year 2021, economic activities from division 10 to 82 are considered based on the new Ateco 2007 classification (excluding the K-Financial and insurance activities section). From the same year of survey, the unit of analysis for which the estimates are provided is the enterprise, i.e. a statistical unit that can be made up of one or more legal units | |
Table 8.
Estimation of the impact of a set of G-Governance Variables on HEAR in the Italian Regions.
Table 8.
Estimation of the impact of a set of G-Governance Variables on HEAR in the Italian Regions.
| Table 8. Estimation of the impact of a set of G-Governance Variables on HEAR in the Italian Regions | |||||||||||
| const | A35 | A49 | A50 | A54 | A62 | A102 | A103 | A106 | A118(-1) | ||
| Fixed Effects | Coefficient | 9,517 | 0,020 | -0,075 | 0,002 | 0,318 | 0,118 | -0,078 | -0,029 | -0,164 | |
| Standard Error | 0,646 | 0,006 | 0,008 | 0,001 | 0,104 | 0,041 | 0,020 | 0,014 | 0,042 | ||
| P-Value | *** | *** | *** | *** | *** | *** | *** | ** | *** | ||
| Pooled OLS | Coefficient | 14,087 | 0,030 | -0,051 | 0,005 | -0,524 | -0,153 | -0,151 | -0,046 | -0,272 | |
| Standard Error | 0,928 | 0,012 | 0,018 | 0,001 | 0,096 | 0,076 | 0,041 | 0,027 | 0,078 | ||
| P-Value | *** | ** | *** | *** | *** | ** | *** | * | *** | ||
| Random-effects | Coefficient | 9,793 | 0,020 | -0,074 | 0,003 | 0,263 | 0,111 | -0,080 | -0,030 | -0,170 | |
| Standard Error | 1,541 | 0,006 | 0,008 | 0,001 | 0,101 | 0,041 | 0,020 | 0,014 | 0,042 | ||
| P-Value | *** | *** | *** | *** | *** | *** | *** | ** | *** | ||
| 1-step dynamic panel | Coefficient | 0,019 | -0,074 | 0,003 | 0,339 | 0,144 | -0,090 | -0,075 | -0,084 | 0,042 | |
| Standard Error | 0,004 | 0,008 | 0,001 | 0,090 | 0,036 | 0,026 | 0,018 | 0,043 | 0,282 | ||
| P-Value | *** | *** | ** | *** | *** | *** | *** | ** | |||
Table 9.
Variables, Coefficients in Absolute Value, Correction, Corrected Value and Aggregate G-Governance component of the ESG model.
Table 9.
Variables, Coefficients in Absolute Value, Correction, Corrected Value and Aggregate G-Governance component of the ESG model.
| Table 9. Variables, Coefficients in Absolute Value, Correction, Corrected Value and Aggregate G | |||
| Variable | (A) Absolute Value | (B) Correction | (C=A*B) Corrected Value |
| PYCC | 0,02232 | 1 | 0,02232 |
| AAIP | 0,06848 | -1 | -0,06848 |
| DCP | 0,00313 | -1 | -0,00313 |
| PYCK | 0,09884 | -1 | -0,09884 |
| PDAL | 0,05484 | -1 | -0,05484 |
| MIG | 0,09985 | -1 | -0,09985 |
| RIU | 0,04469 | 1 | 0,04469 |
| CW10 | 0,17244 | 1 | 0,17244 |
| Sum i.e Aggregate of G-Governance Component in the ESG Model | -0,08569 | ||
Table 10.
Ranking of Algorithm based on R-Squared and Statistical Errors.
| Table 10. Ranking of Algorithm based on R-Squared and Statistical Errors | |||||
| Rank | Algorithm | R^2 | Rank | Algorithm | MAE |
| 1 | ANN | 0,89873602 | 1 | ANN | 0,09575690 |
| 2 | Simple Regression Tree | 0,77482712 | 2 | Simple Regression Tree | 0,12774991 |
| 3 | Random Forest | 0,64911065 | 3 | PNN | 0,14150943 |
| 4 | Gradient Boosted Tree | 0,62345938 | 4 | Random Forest | 0,14750328 |
| 5 | PNN | 0,61640170 | 5 | Gradient Boosted Tree | 0,15713445 |
| 6 | Tree Ensemble | 0,57616954 | 6 | Tree Ensemble | 0,17117808 |
| 7 | Polynomial Regression | -0,58300061 | 7 | Polynomial Regression | 0,26507937 |
| 8 | Linear Regression | -0,88659051 | 8 | Linear Regression | 0,35265700 |
| Rank | Algorithm | MSE | Rank | Algorithm | RMSE |
| 1 | ANN | 0,01364000 | 1 | ANN | 0,11679040 |
| 2 | Simple Regression Tree | 0,03461694 | 2 | Simple Regression Tree | 0,18605629 |
| 3 | PNN | 0,04210825 | 3 | PNN | 0,20520294 |
| 4 | Gradient Boosted Tree | 0,05306425 | 4 | Gradient Boosted Tree | 0,23035680 |
| 5 | Random Forest | 0,05698106 | 5 | Random Forest | 0,23870705 |
| 6 | Tree Ensemble | 0,07121187 | 6 | Tree Ensemble | 0,26685551 |
| 7 | Polynomial Regression | 0,19079365 | 7 | Polynomial Regression | 0,43679933 |
| 8 | Linear Regression | 0,26464250 | 8 | Linear Regression | 0,51443416 |
Disclaimer/Publisher’s Note: The statements, opinions and data contained in all publications are solely those of the individual author(s) and contributor(s) and not of MDPI and/or the editor(s). MDPI and/or the editor(s) disclaim responsibility for any injury to people or property resulting from any ideas, methods, instructions or products referred to in the content. |
© 2024 by the authors. Licensee MDPI, Basel, Switzerland. This article is an open access article distributed under the terms and conditions of the Creative Commons Attribution (CC BY) license (http://creativecommons.org/licenses/by/4.0/).
Copyright: This open access article is published under a Creative Commons CC BY 4.0 license, which permit the free download, distribution, and reuse, provided that the author and preprint are cited in any reuse.


