
Submitted:
02 September 2023
Posted:
05 September 2023
You are already at the latest version
Abstract
In the following article, we analyse the determinants of the number of physicians in the context of ISTAT BES-Benessere Equo Sostenibile data among twenty Italian regions in the period 2004-2022. We apply Panel Data with Random Effects, Panel Data with Fixed Effects, and Pooled OLS-Ordinary Least Squares. We found that the number of Physicians among Italian regions is positively associated, among others, to “Trust in the Police and Firefighters”, “Net Income Inequality”, and negatively associated, among others, to “Research and Development Intensity” and “Soil waterproofing by artificial cover”. Furthermore, we apply the k-Means algorithm optimized with the Silhouette Coefficient and we find the presence of two clusters. Finally, we confront eight different machine-learning algorithms to predict the future value of physicians and we find that the PNN-Probabilistic Neural Network is the best predictive algorithm.
Keywords:
analysis of health care markets
; health behaviors
; health insurance
; public and private
; health and inequality
; health and economic development
; government policy • regulation • public health
1. Introduction-Research Question
In the following article we analyze the value of physicians for 1000 people-PHY in the Italian regions between 2004 and 2022. The data used refer to the ISTAT-BES database. The Covid 19 pandemic has highlighted the centrality of the value of PHY for the efficiency and resilience of national health systems. However, we have chosen to consider the value of PHY in connection with the ISTAT-BES variables, i.e. a set of variables that are able to capture social, environmental and governance elements, as well as mere economic analysis. We therefore tried to verify whether the value of PHY in the Italian regions tends to change with the presence of a set of socio-economic, environmental and governance variables. In fact, it is very probable that changes in social capital, in trust in institutions, as well as in respect for the environment, as well as modifications in income inequality and per capita income could have an impact on the determination of the number of PHY. Our analysis therefore also fits into the context of ESG-Environmental, Social and Governance studies, in application of the UN SDGs-Sustainable Development Goals principles. The article continues as follows: the second section briefly analyzes the scientific literature, the third section presents the econometric analysis, the fourth section contains the clustering with k-Means algorithm, the fifth section presents the prediction with machine learning algorithms, the sixth section concludes. The appendix contains further tables, graphs and statistical results.
2. Literature Review
Below we analyze some articles relating to the scientific literature that afford the question of the role of physicians for 1000 people in three contexts: during the covid-19, as a tool for developing the health system and in relations with economic growth at the country level.
Physicians and Covid-19. The pandemic has put a strain on the health systems of both high-income and low-income countries. Every country during the pandemic has discovered its weaknesses in the health system. The countries with a greater number of physicians per 1000 people have had a greater capacity to respond appropriately to the Covid 19 pandemic. However, some countries such as South Korea, for example, have managed to make up for the lack of physicians with the use of new technology, with good results. African and Asian countries, on the contrary, have had problems both in implementing new technologies to fight the pandemic and in offering the population an adequate level of medical care. The level of physicians for 1000 people is an essential variable to evaluate ability of the national health care system to react to extreme events such as the Covid-19 pandemic. In Europe there are 1,8 millions of physicians, on average there are 3.6 physicians per 1000 people; 55% of physicians in Italy are over 55 years old. The Covid-19 pandemic has showed the fragilities of the European healtcare system [1]. In Israel there are 3.3 physicians per 1000 people, a number that has helped the country to react appropriately during the Covid-19 pandemic [2]. South Korea has a lower number of physicians for 1000 people in respect to Italy; nonetheless South Korea has perfomed better then Italy during the Covid-19 pandemics thanks to the massive application of digital technology as a tool for public health [3]. The number of physicians and non-physicians providers in African countries during the pandemics has been equal to 2.42 per 100,000 people [4]. During the pandemic the average value of physicians per 1000 people was 1.81 at world level [5]. The number of physicians for 1000 people in Asia is insufficient to face healthcare crisis as in the case of the Covid-19 pandemic [6]. During the Covid-19 pandemic the number of physicians for 1000 people in the Democratic Republic of Congo was 0.1, an insufficient number that has worsened the strenght of the country in reacting to the pandemic [7]. The number of physicians for 1000 people has had little predictive power in preventing the worsening of the efficienty of healthcare systems during the Covid 19 pandemic [8]. The shortage of physicians in rural areas of Kansas has worsened the reaction of the healthcare system to react to Covid 19 pandemic [9]. The number of physicians for 1000 people is negatively associated to the Case Fatality Rate-CFR in the case of Covid 19 [10].
Physicians and the performance of healthcare sector. The number of physicians per 1000 people has a broader impact on the efficiency of the national health system. Some countries that have a higher number of physicians per 1000 people also have a better chance of fighting diseases or of promoting technological innovation in the health sector. The number of physicians per 1000 people is therefore an essential element to allow the successful application of both basic and advanced health economic policies thanks to the application of digital technologies and new discoveries in the medical-scientific field. The number of the physicians for 1000 people is an essential variable to estimate the efficiency of the healthcare sector in China [11]. There are 0.19 physicians for 1000 people in Malawi, while the World Health Organization-WHO prescribes at least 2.5 physicians for 1000 people [12]. Canada has 2.8 physicians for 1000 people; this number is considered insufficient to implemenet efficiently high-tech tools as requested in the telemedicine, especially in comparison with other countries such as Germany, Switzerland and Scandinavian countries, which have a greater number of physicians for 1000 people [13]. The increase in the number of physicians for 1000 people is negatively associated to the level death rate for rotavirus [14]. The shortage of physicians and healthcare workers in Africa can be associated to the lack of medical education and medical schools’ capacity i.e. a condition that negatively contribute to the increase of healthcare system in the continent [15]. The increase in the number of physicians for 1000 people is insufficient to reduce infant mortality in Bangladesh [16]. The increase of physicians for 1000 people is positively associated with the probability of being treated and controlled for cardiovascular disease in a set of 44 lower and middle income countries [17]. Due to the insufficient number of physicians per 1000 people in India, patients refers to pharmacy for medication creating the necessity to provide extra-skills for pharmacy employees [18].
Physicians and economic growth. The growth in the number of physicians per 1000 people is positively connected with economic growth. The relationship between PHY and economic growth can be better understood considering that physicians represent a highly qualified human capital. The economies that tend to increase human capital are also those that are more likely to develop the knowledge economy and therefore to access higher levels of per capita income and the production of added value. The growth in the number of physicians per 1,000 people therefore indicates the transition of the economies to the advanced tertiary sector and therefore to the ranks of countries with increasing per capita income. The number of physicians for 1000 people is positively associated to economic growth at world level [19]. The increase of the number of physicians is positively associated to economic growth in a set of 185 countries in the period 2006-2015; furthermore the effect of the increase in the number of physicians on economic growth is greater then the impact of foreing direct investments and access to electricity [20].

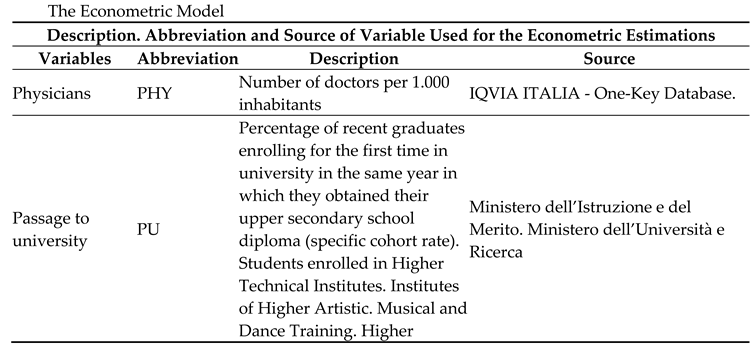
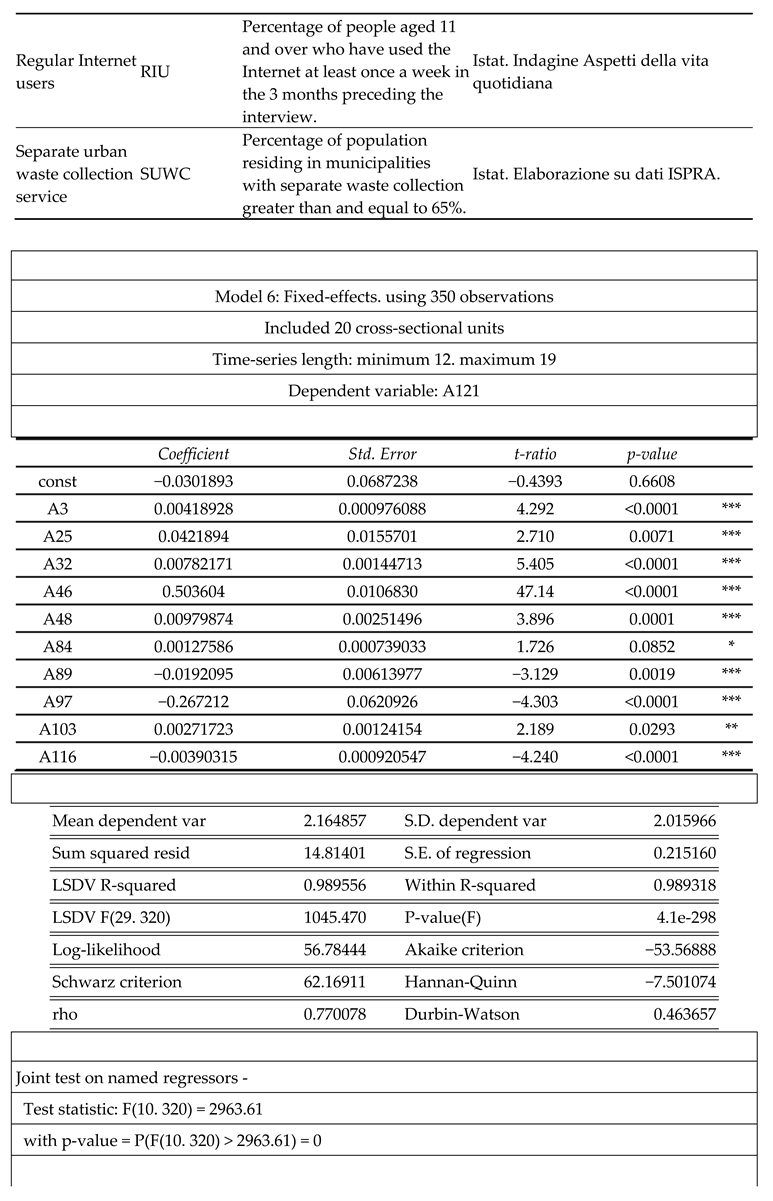
3. The Econometric Model for the Estimation of the Socio-Economic Determinants of Physicians Among Italian Regions
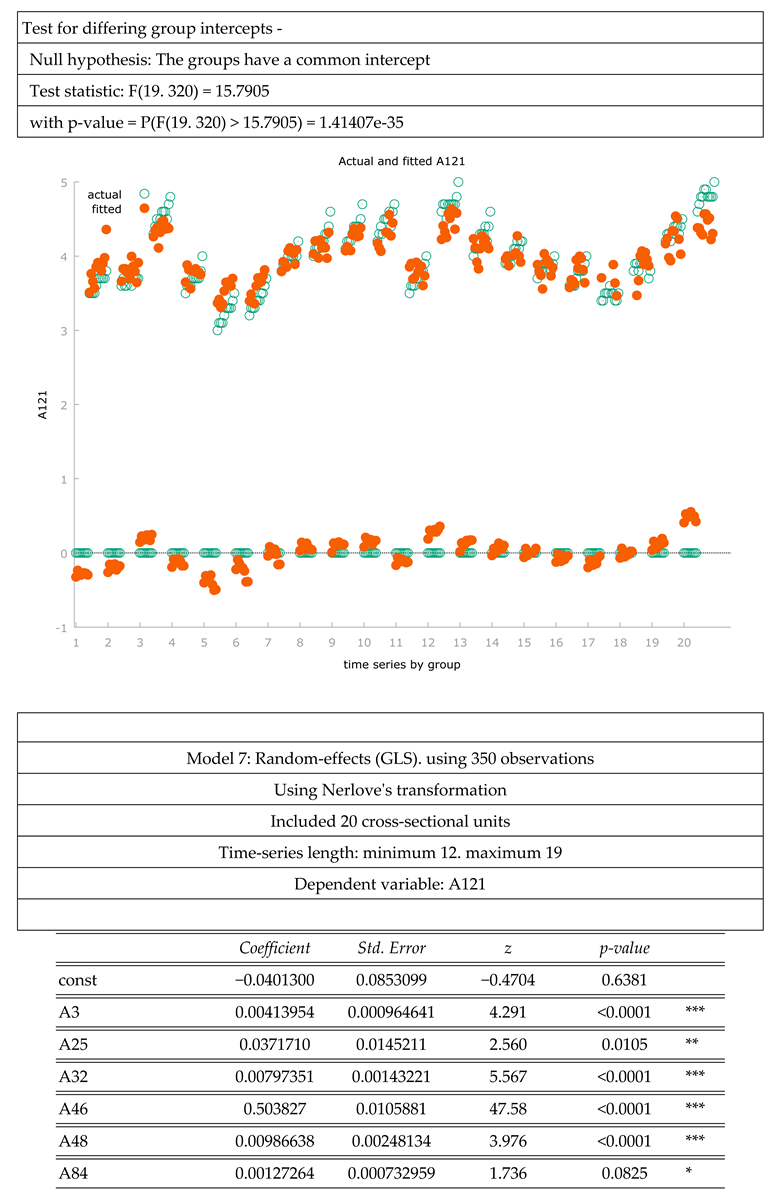
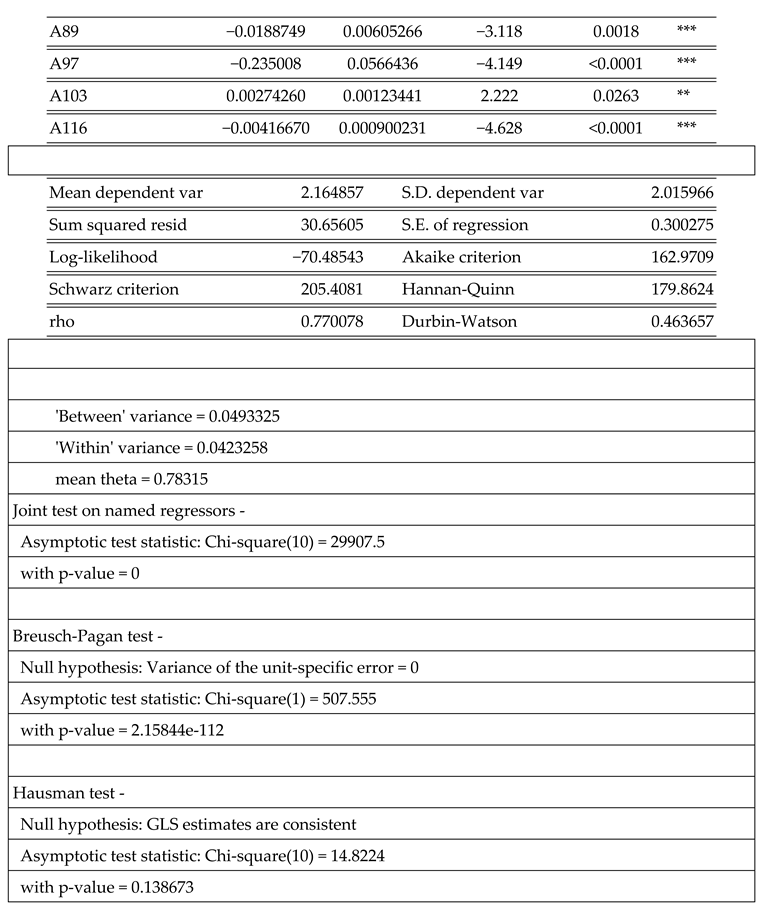
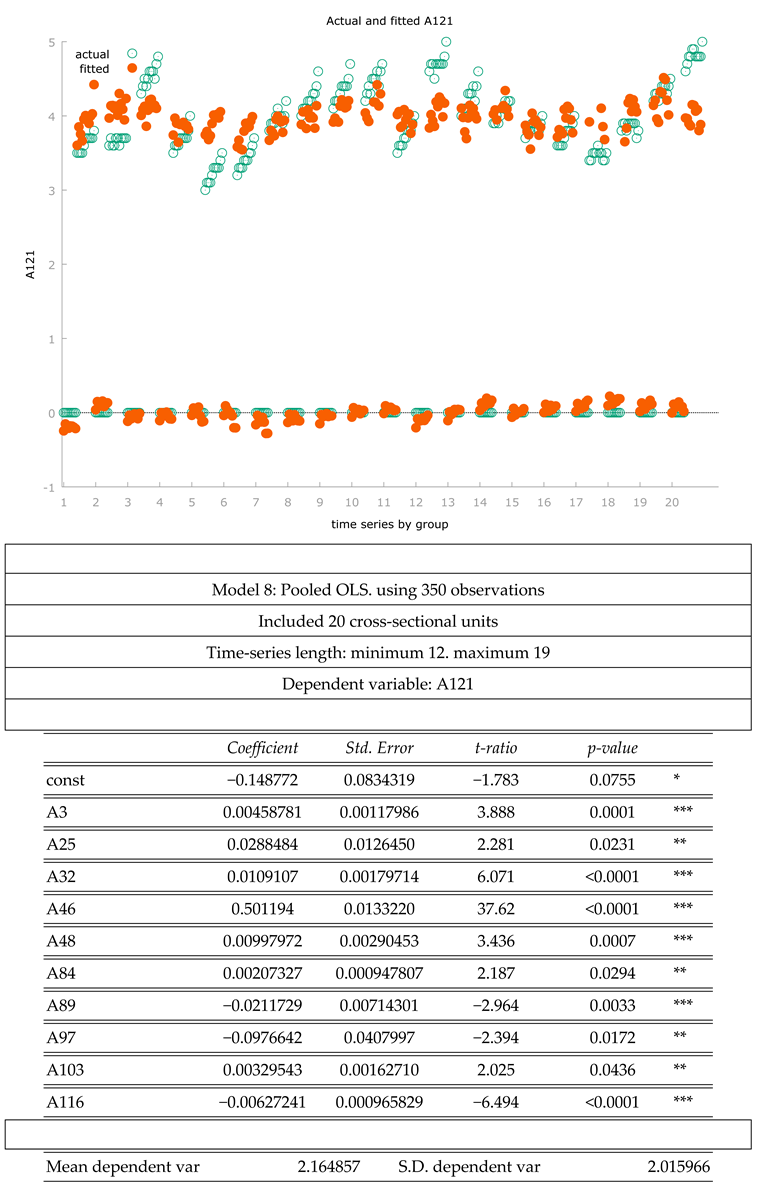
Below we estimated the value of physicians through the application of a set of econometric techniques, namely: Panel Data with Fixed Effects, Panel Data with Random Effects, and Pooled OLS. The data used refer to the ISTAT-BES database. The data refers geographically to the 20 Italian regions, and temporally to the period between 2004 and 2020. In particular, we have estimated the following equation:
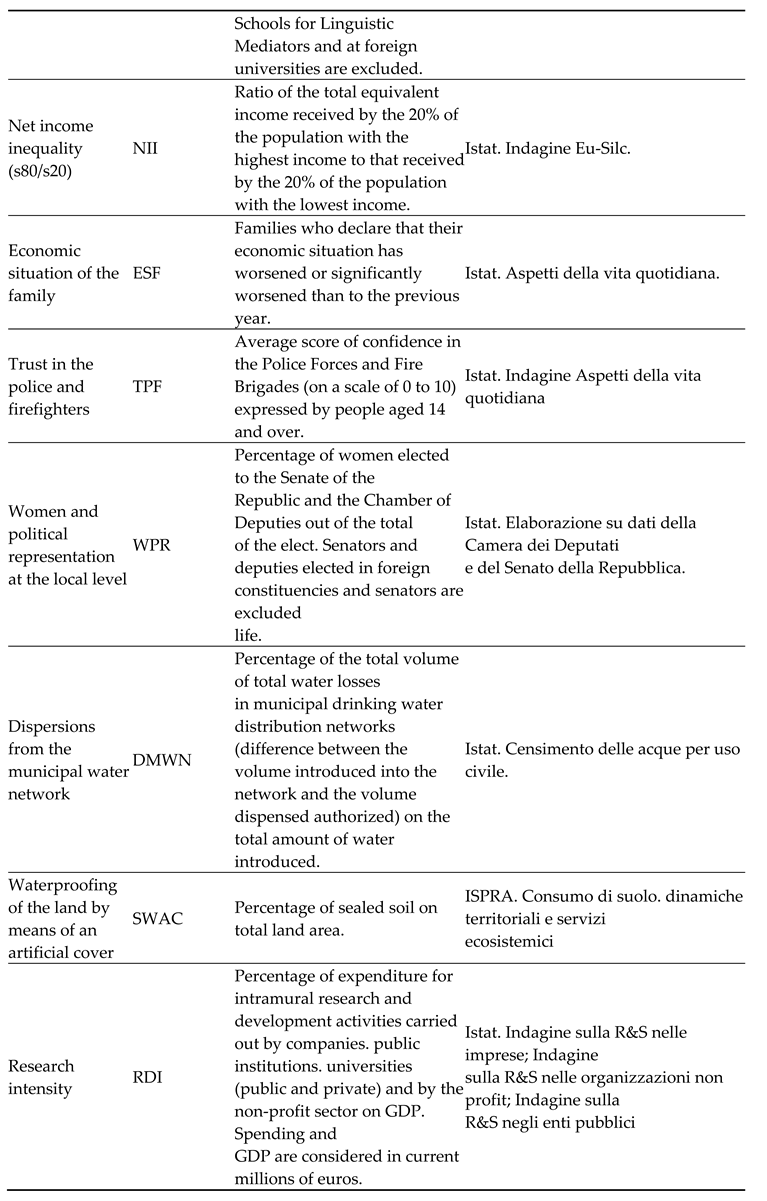
We found that the level of physicians is positively associated to:
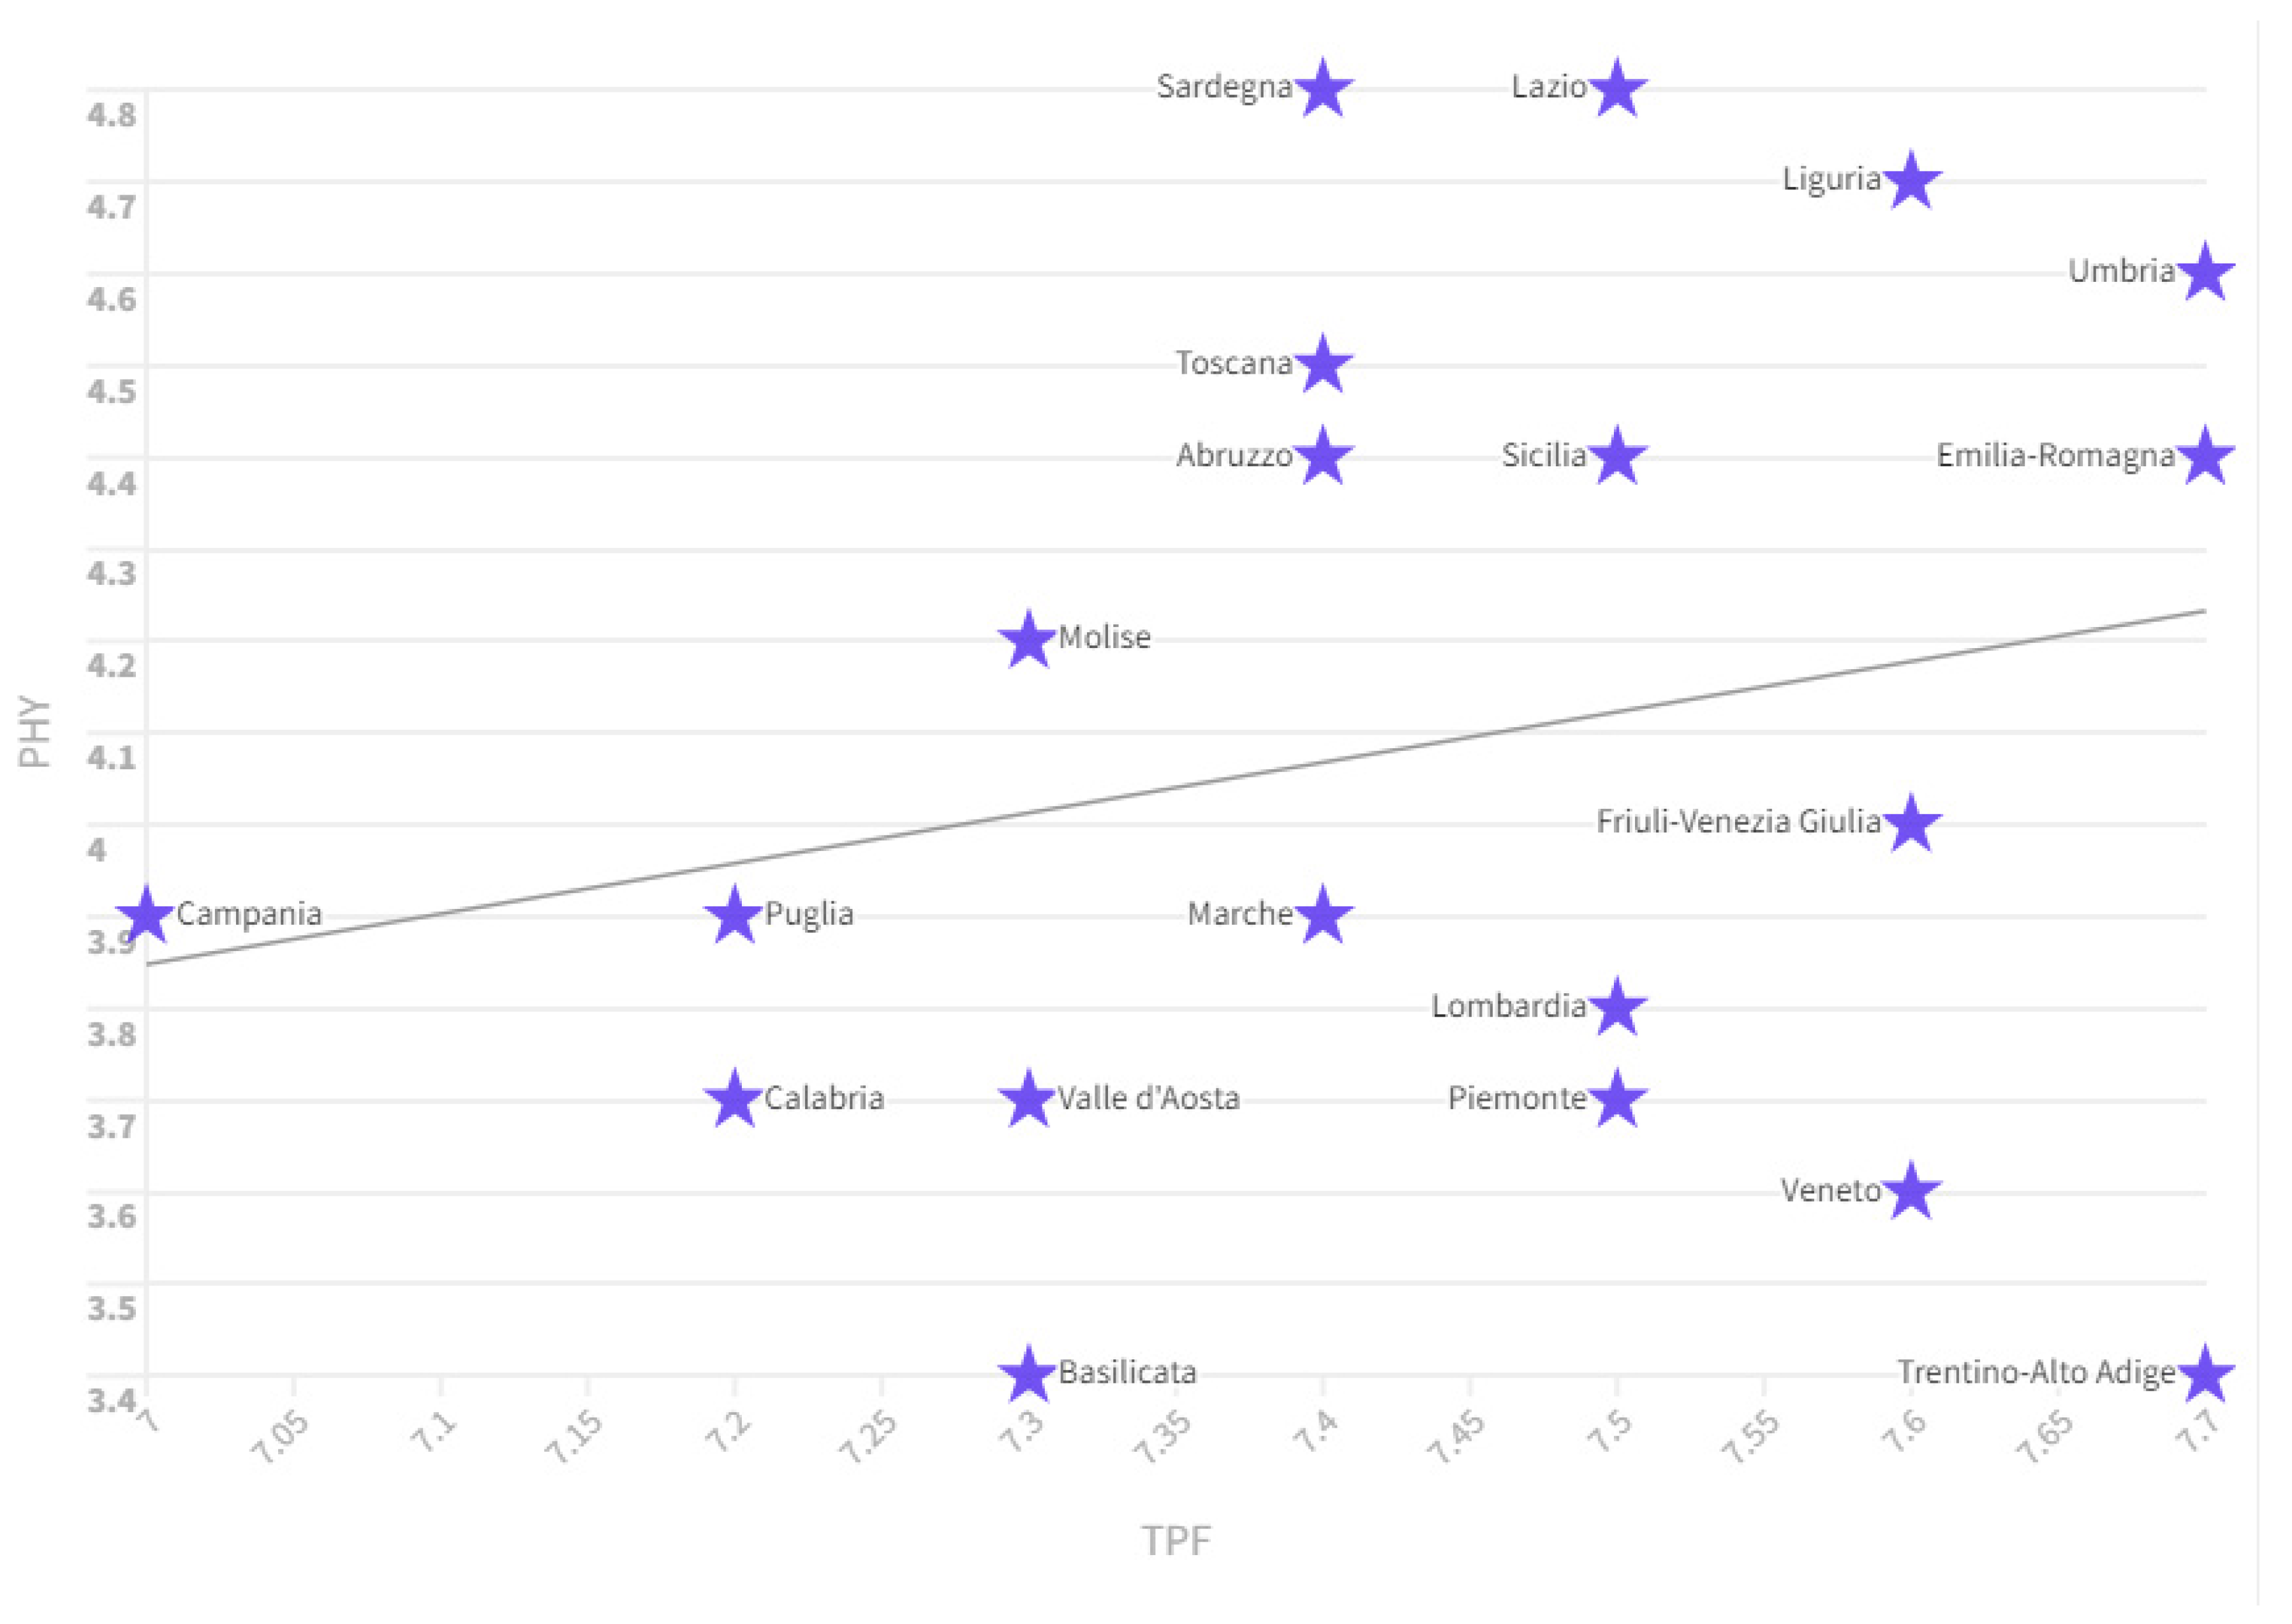
- TPF: it is the average score of confidence in the Police Forces and Fire Brigades (on a scale of 0 to 10) expressed by people aged 14 and over. Data shows that the prevalence of physicians increases as trust in law enforcement and firefighters increases. In fact, if we consider the value of PHY and TPF in 2021 we can see that the countries that are in the first places in terms of TPF value also have high PHY values such as Emilia Romagna which has a TPF value of 7, 7 and PHY equal to 4.4, Umbria with a TPF value equal to 7.7 and PHY equal to 4.4, Liguria with TPF equal to 7.6 and PHY equal to 4.7, Friuli Venezia Giulia with TPF equal to 7.6 and PHY equal to 4. It follows that the countries where the population has greater respect for the forces of order also have a higher number of physicians. In this case, the TPF variable can be understood as the population's ability to comply with the laws or as a manifestation of the Rule of Law. Notoriously, the growth in the value of Rule of Law is also a tool capable of increasing economic development, economic growth with beneficial effects also on human capital and therefore on high-profile professions, such as, for example, in the case of physicians.
Figure 1.
Relationship between PHY and TPF in 2021. Source: ISTAT-BES.
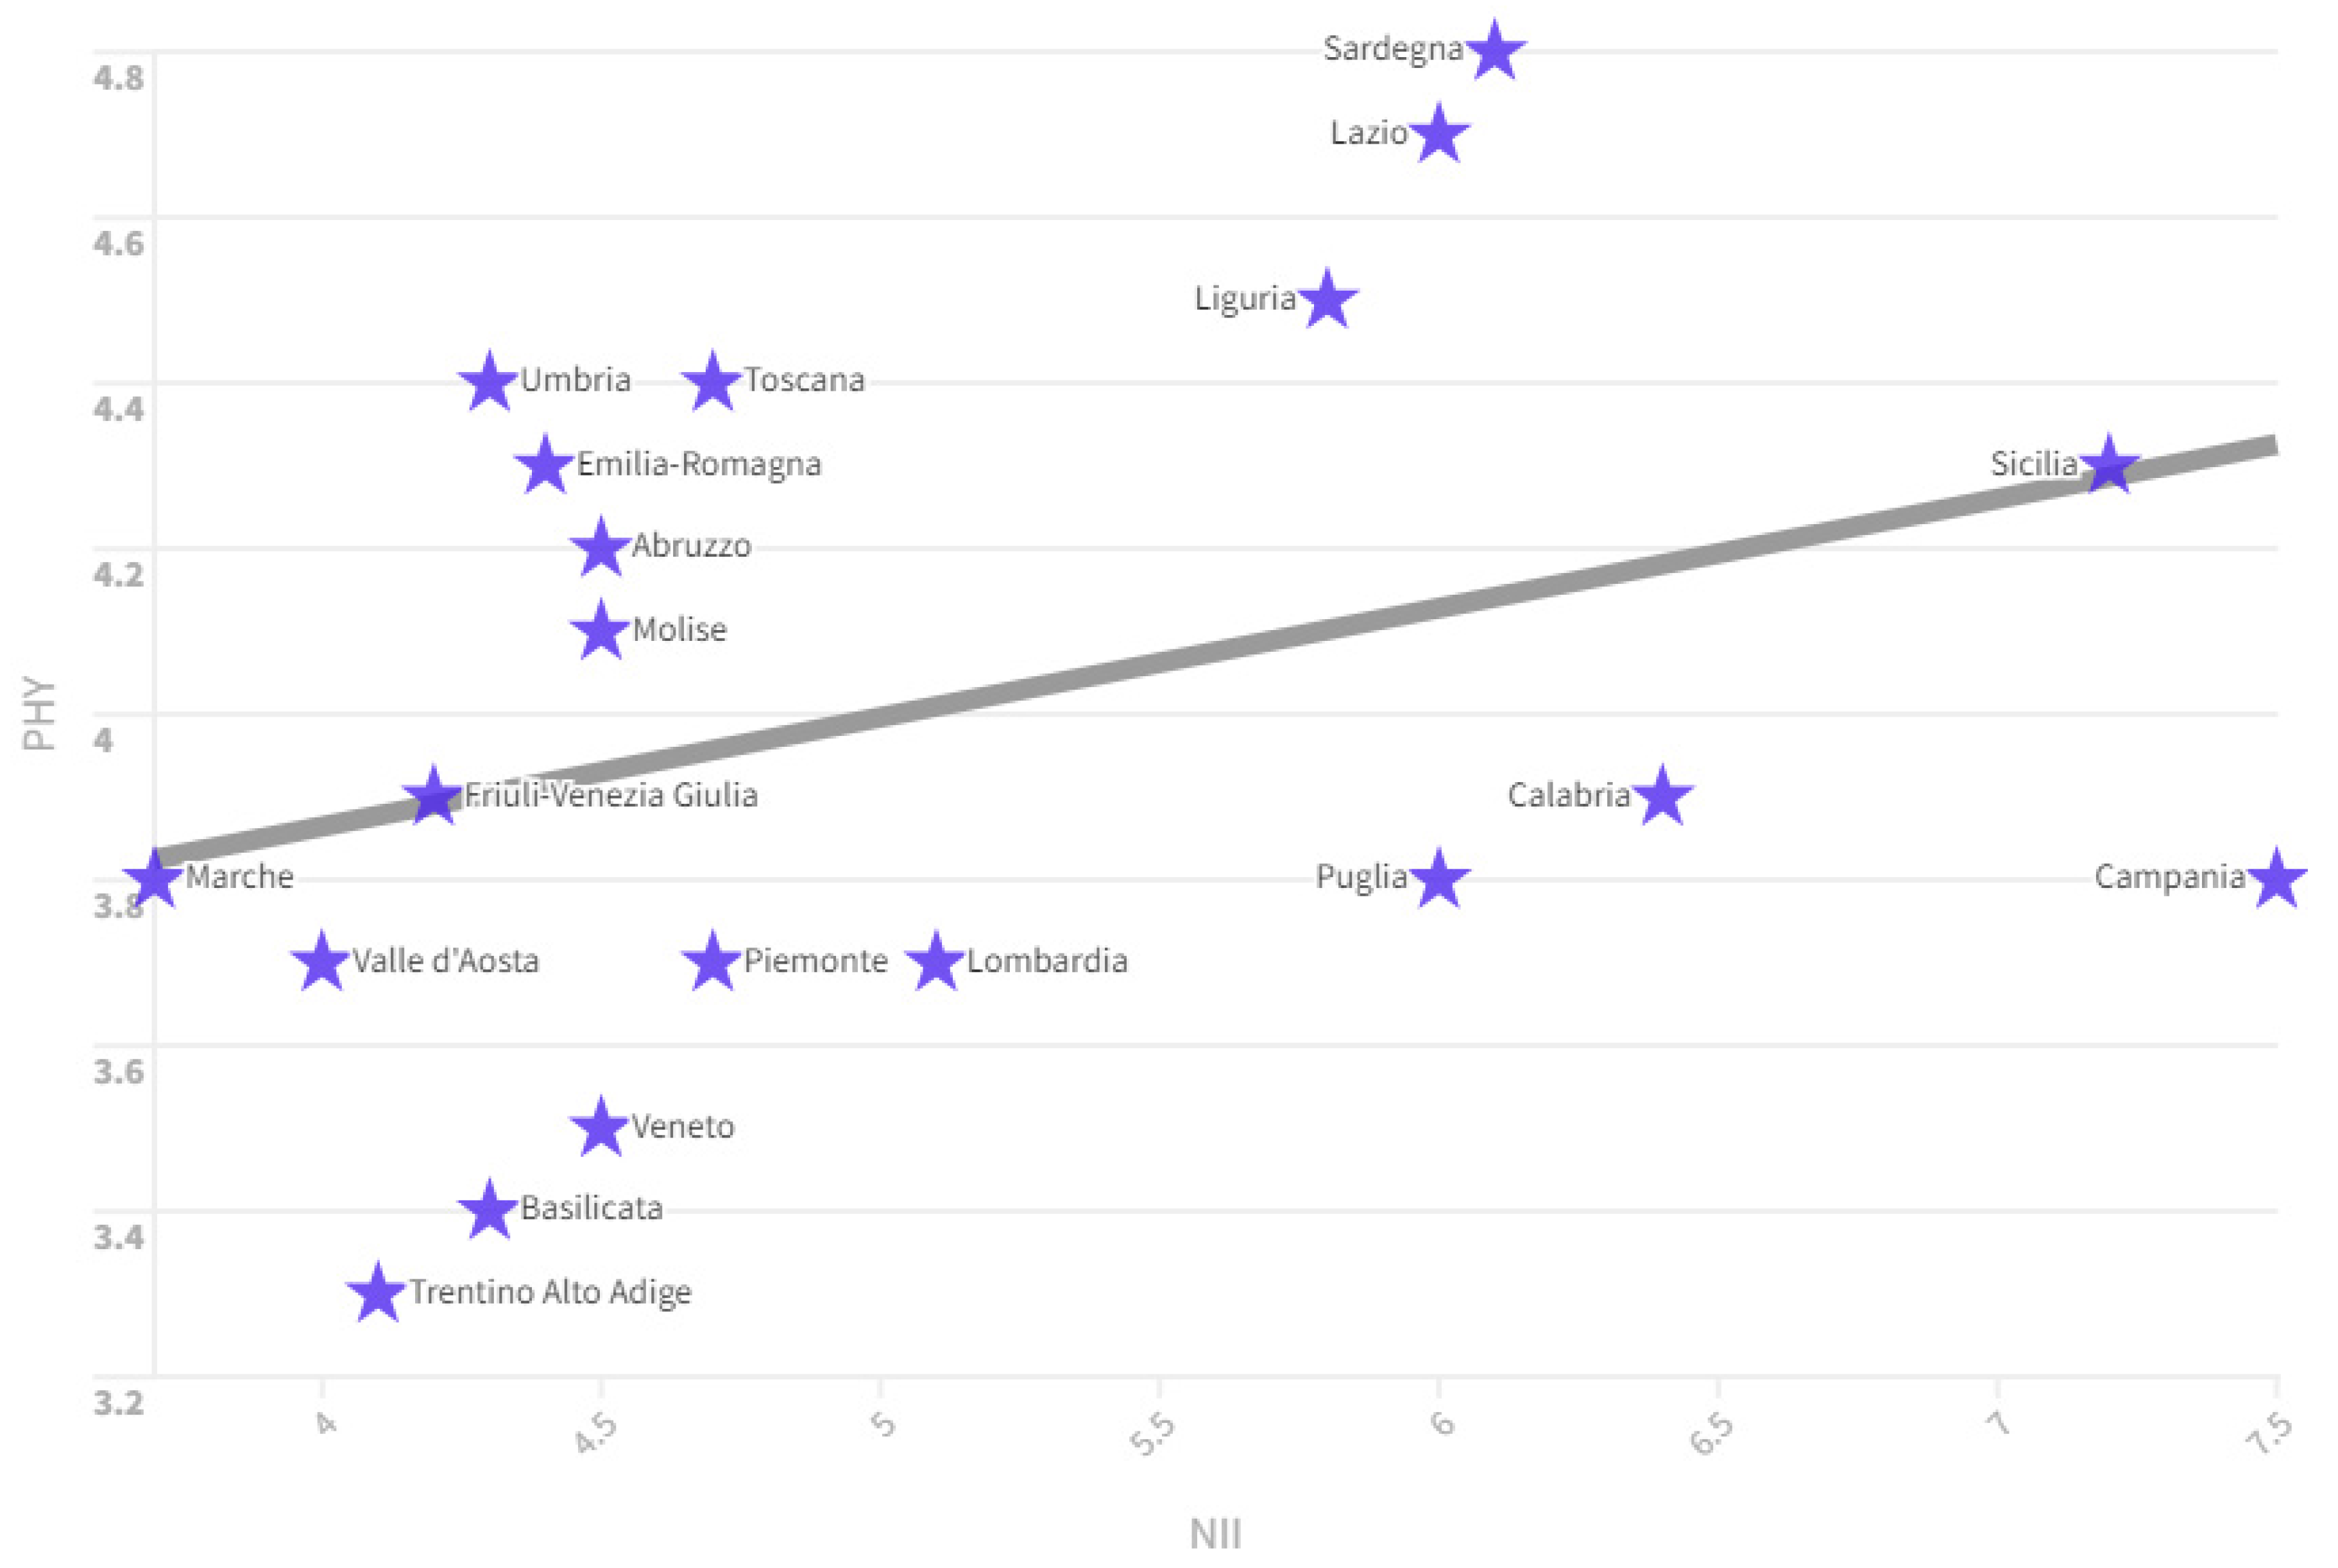
- NII: is the ratio between the total equivalent income received by the 20% of the population with the highest income and that received by the 20% of the population with the lowest income. There is a positive relationship between the NII value and the PHY value. The regions in which there is greater inequality are also those, which have the greatest PHY value. For example, considering the year 2020 we can see that the regions that have high NII levels also have high PHY levels such as Sicily which has a NII value of 7.5 and a PHY value of 4.3 , Sardinia which has a NII value equal to 6.1 and PHY equal to 4.8, Lazio with a PHY value equal to 6 and NII equal to 4.7, Liguria with NII equal to 5.8 and PHY equal to 5.8. Ratio between the total equivalent income received by the 20% of the population with the highest income and that received by the 20% of the population with the lowest income. There is a positive relationship between the NII value and the PHY value. The regions in which there is greater inequality are also those, which have the greatest PHY value. For example, considering the year 2020 we can see that the regions that have high NII levels also have high PHY levels such as Sicily which has a NII value of 7.5 and a PHY value of 4.3, Sardinia which has a NII value equal to 6.1 and PHY equal to 4.8, Lazio with a PHY value equal to 6 and NII equal to 4.7, Liguria with NII equal to 5.8 and PHY equal to 5.8. There are economic reasons that could motivate the fact that the regions where there is less inequality, which are also the regions with higher per capita income, have fewer physicians. In fact, regions where there is less inequality are more dynamic from an economic point of view and it is likely that the population chooses career paths different from those of medical science. In fact, in the most dynamic economies, it is highly probable that there are many professionals, entrepreneurs and managers who can easily exceed the income of physicians. The population residing in regions with lower inequality and higher per capita income therefore has fewer incentives to invest in the arduous course of study necessary to become physicians. Conversely, in regions where there is greater inequality, which are also the poorest regions in terms of per capita income, there is likely to be more incentive to move towards the medical profession, which is considered relevant from an income point of view.
Figure 2.
Relationship between PHY and NII in 2020. Source: ISTAT-BES.
- WPR: it is the percentage of women elected to the Senate of the Republic and the Chamber of Deputies out of the total of the elect. Senators and deputies elected in foreign constituencies and senators are excluded from life. There is a positive relationship between the WPR value and the PHY value in the Italian regions in the period between 2004 and 2022. In fact, if we look at the regions that have the highest level of WPR in 2022, we can see that they also have high levels of PHY, for example Friuli Venezia Giulia with a WPR value equal to 50 and a PHY value equal to 4.2, Emilia Romagna with a WPR value equal to 48.8 and a PHY value equal to 4.6, Sicily with a WPR value of 39.6 and a PHY value of 4.5, Abruzzo with a WPR value of 38.5 and a PHY value of 4.6, Tuscany with a WPR value equal to 36.1 and a PHY value equal to 4.7 and an Umbria with a WPR value equal to 33.33 and a PHY value equal to 4.7.
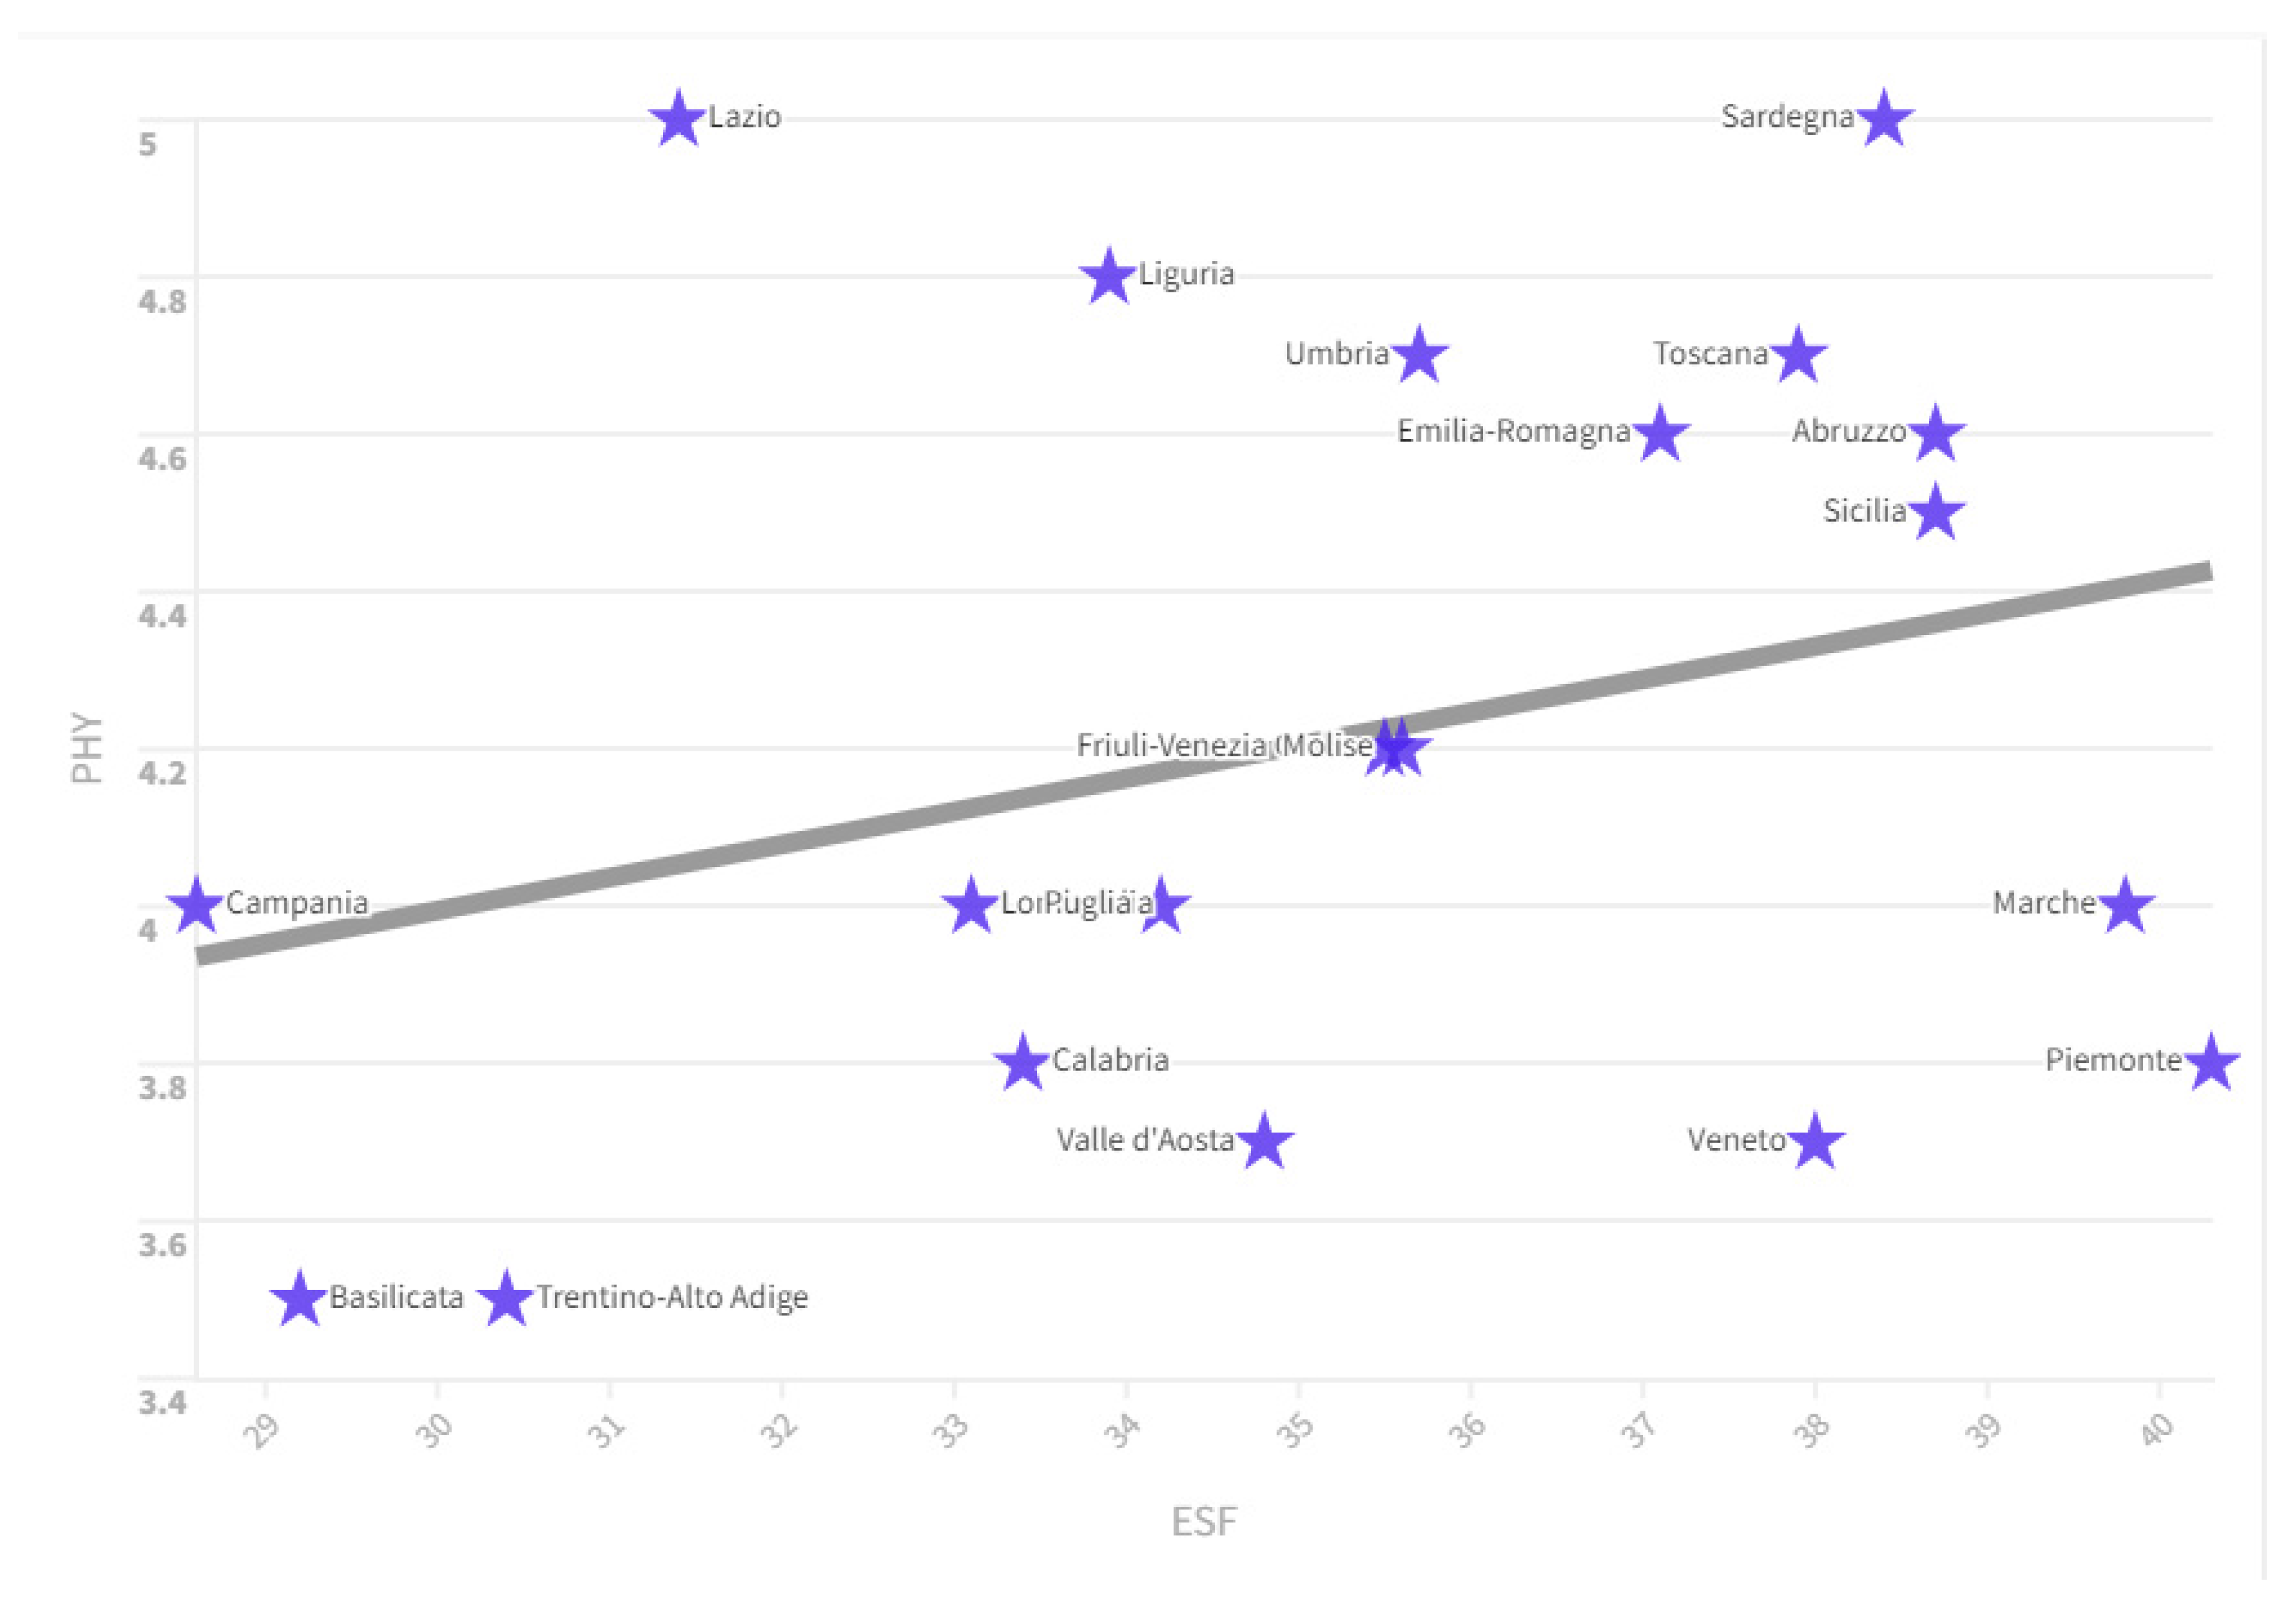
- ESF: represents the families who declare that their economic situation has worsened or significantly worsened than to the previous year. There is a positive relationship between the ESF value and the PHY value. Specifically we see that countries that have high values in terms of ESF also have a high value of PHY. In fact, if we consider the ranking of Italian regions by ESF value, we can see that the regions that have high levels of ESF also have high levels of PHY. For example in 2022, the ESF value in Abruzzo was equal to an amount of 38.7 with a PHY value equal to 4.60, Sicily with an ESF value 38.7 and a PHY value equal to 4, 50, Sardinia with ESF equal to 38.4 and PHY equal to an amount of 5.00, Tuscany with an ESF amount equal to 37.9 and a PHY value equal to an amount of 4.70. The regions of Italy where families suffer the most also have a higher number of physicians per 1,000 inhabitants.
Figure 3.
Relationship between PHY and ESF in the Italian regions. Source: ISTAT-BES.
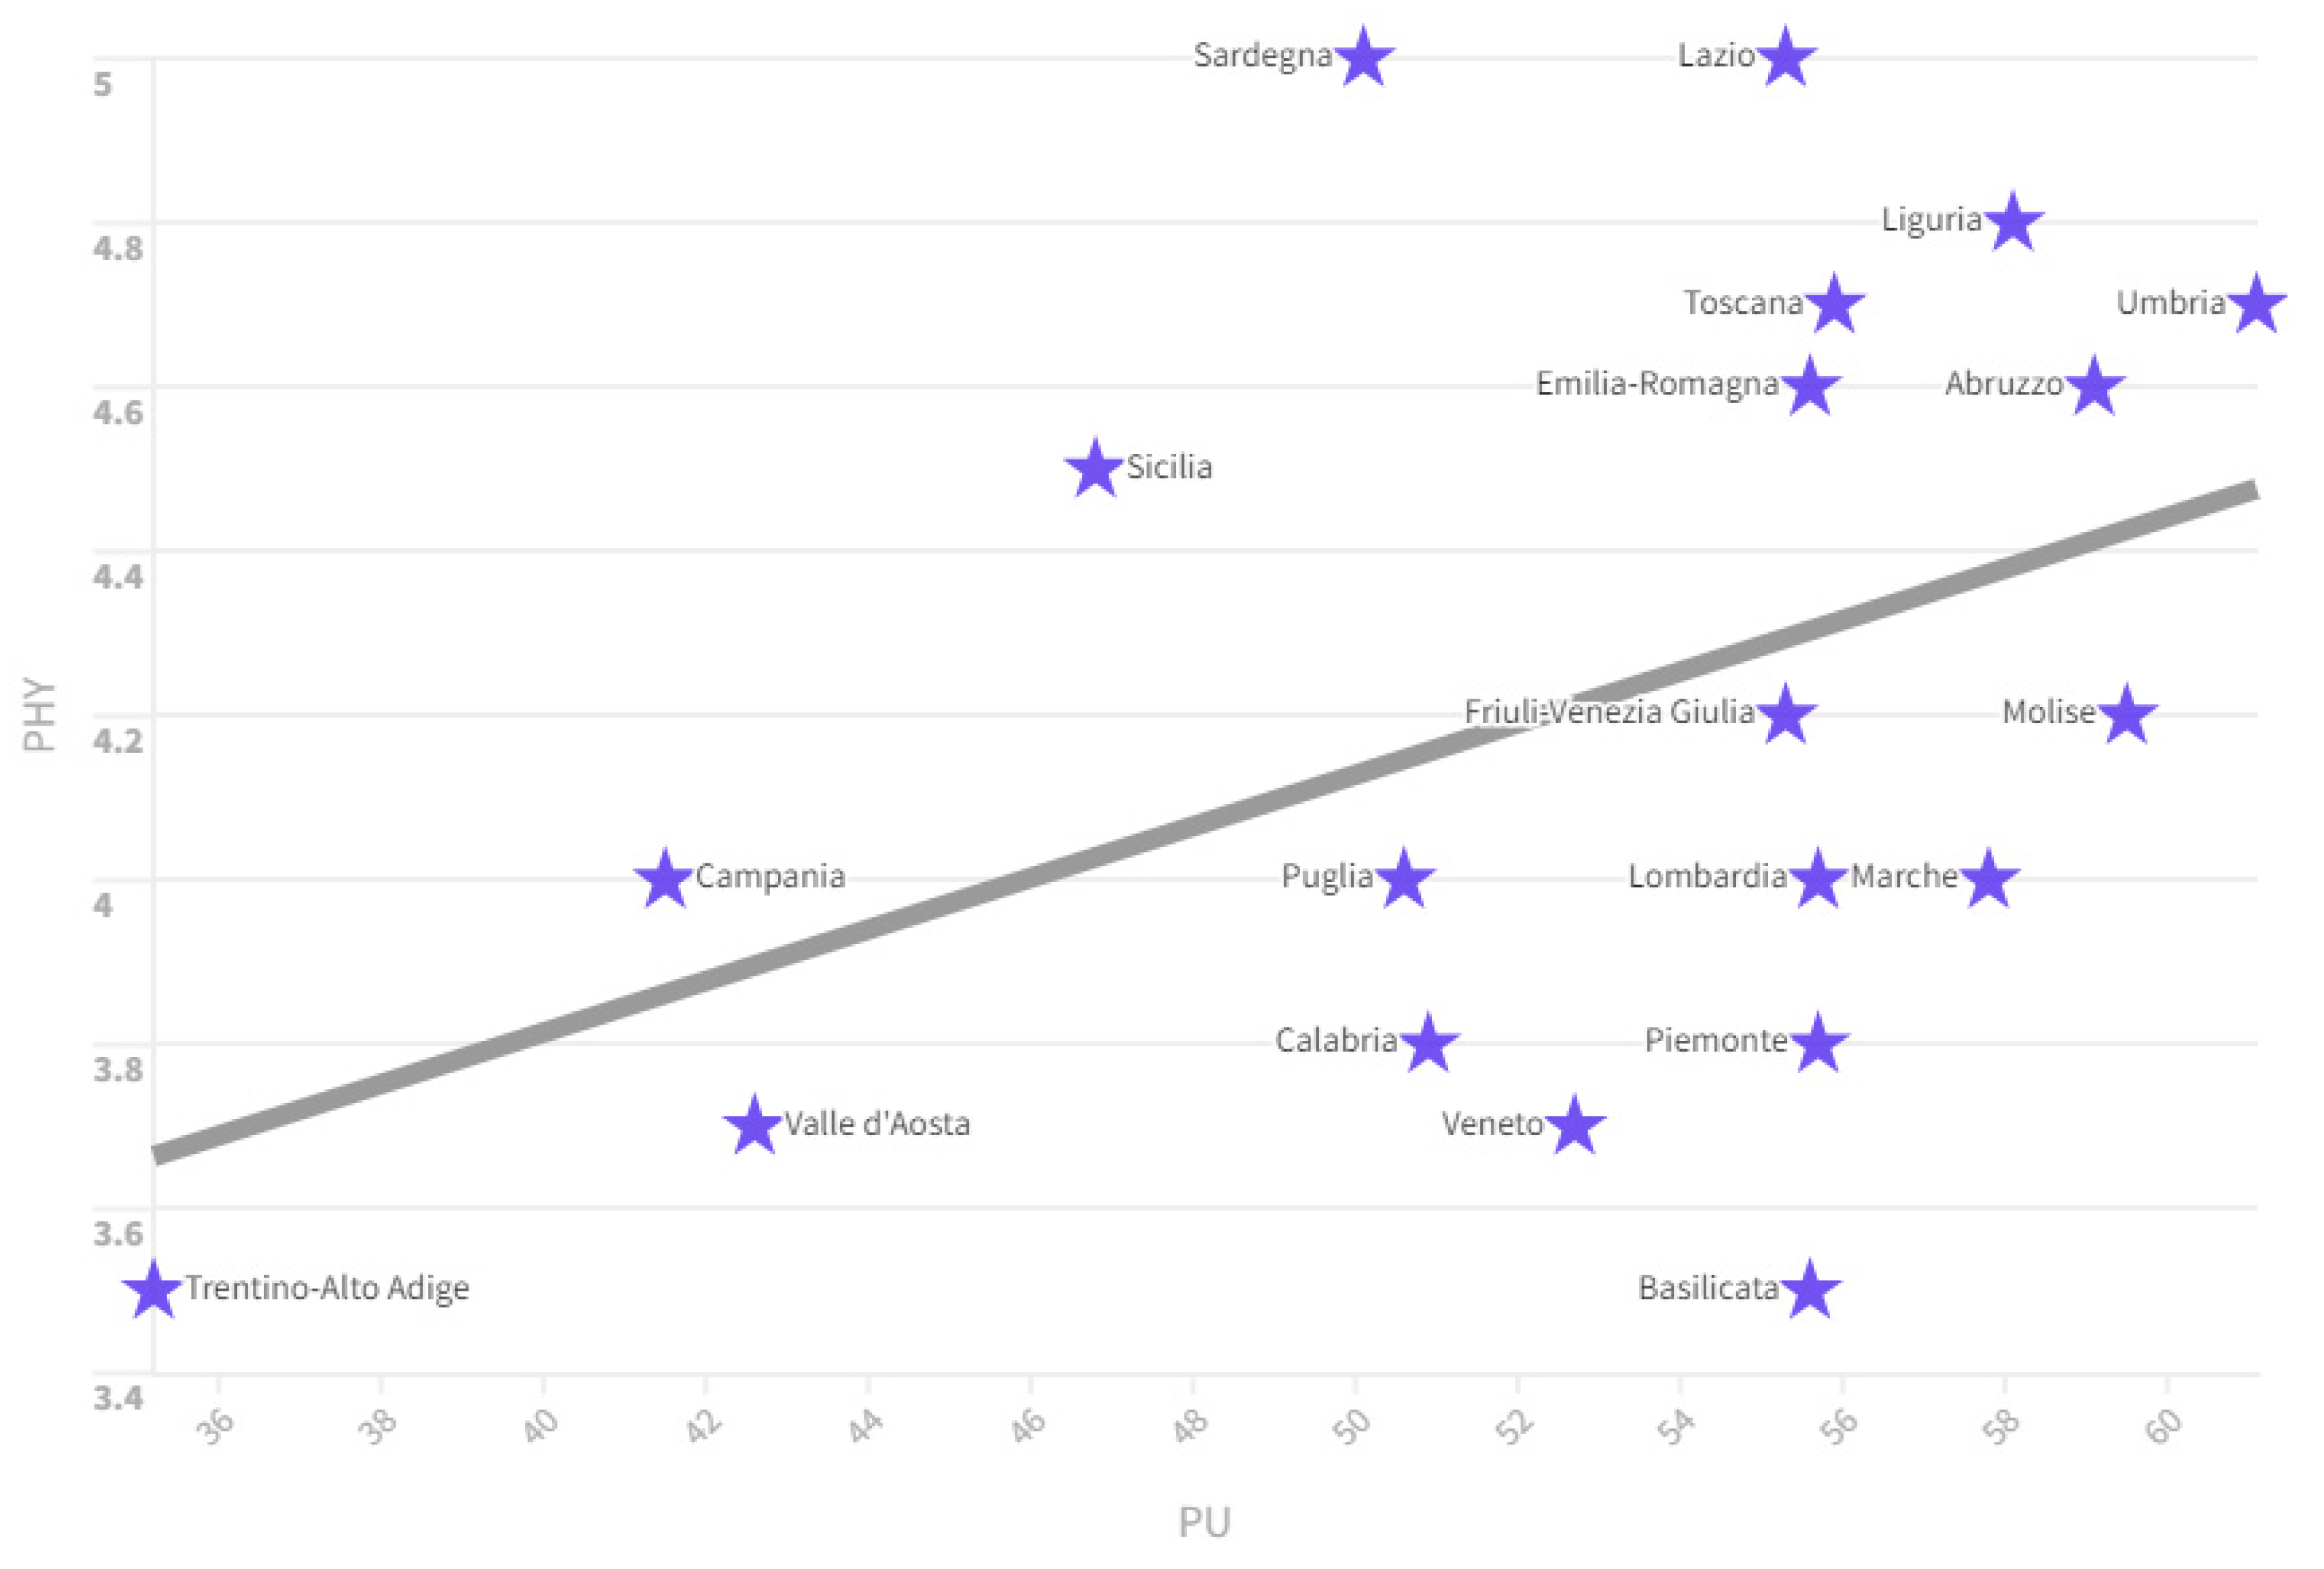
- PU: is the percentage of recent graduates enrolling for the first time in university in the same year in which they obtained their upper secondary school diploma (specific cohort rate). Students enrolled in Higher Technical Institutes, Institutes of Higher Artistic, Musical and Dance Training, Higher Schools for Linguistic Mediators and at foreign universities are excluded. There is a positive relationship between the PU value and the PHY value in the Italian regions between 2004 and 2022. In fact, if we look at the ranking of the regions by PU value, we notice that they also have high PHY values in 2020 For example Umbria has a PU value equal to an amount of 61.1 and a PHY value equal to 4.4, Molise has a PU value equal to 59.5 and a PHY value equal to 4 ,1, Abruzzo has a PU value of 59.1 and a PHY value of 4.2, Liguria has a PU value of 58.1 and a PHY value of 4.5, Tuscany with a PU value of 55.9 and a PHY value of 4.4. We note that the Italian regions with the highest per capita income have low average PU values. For example: Trentino Alto Adige has a PU value equal to an amount of 35.2, Friuli Venezia Giulia 55.3, Veneto 52.7, Piedmont and Lombardy 55.7. It is highly probable that the regions that have higher per capita incomes have a reduced PU value due to the presence of a labor market that offers young people good alternatives to studying. On the contrary, in regions with medium-low per capita incomes, access to university is considered necessary due to the lack of valid alternatives in the labor market for young people. Obviously, this dynamic is also reflected in the number of physicians who tend to decrease with the increase in per capita income and the reduction in the value of PU.
Figure 4.
Relationship between PU and PHY in 2020.
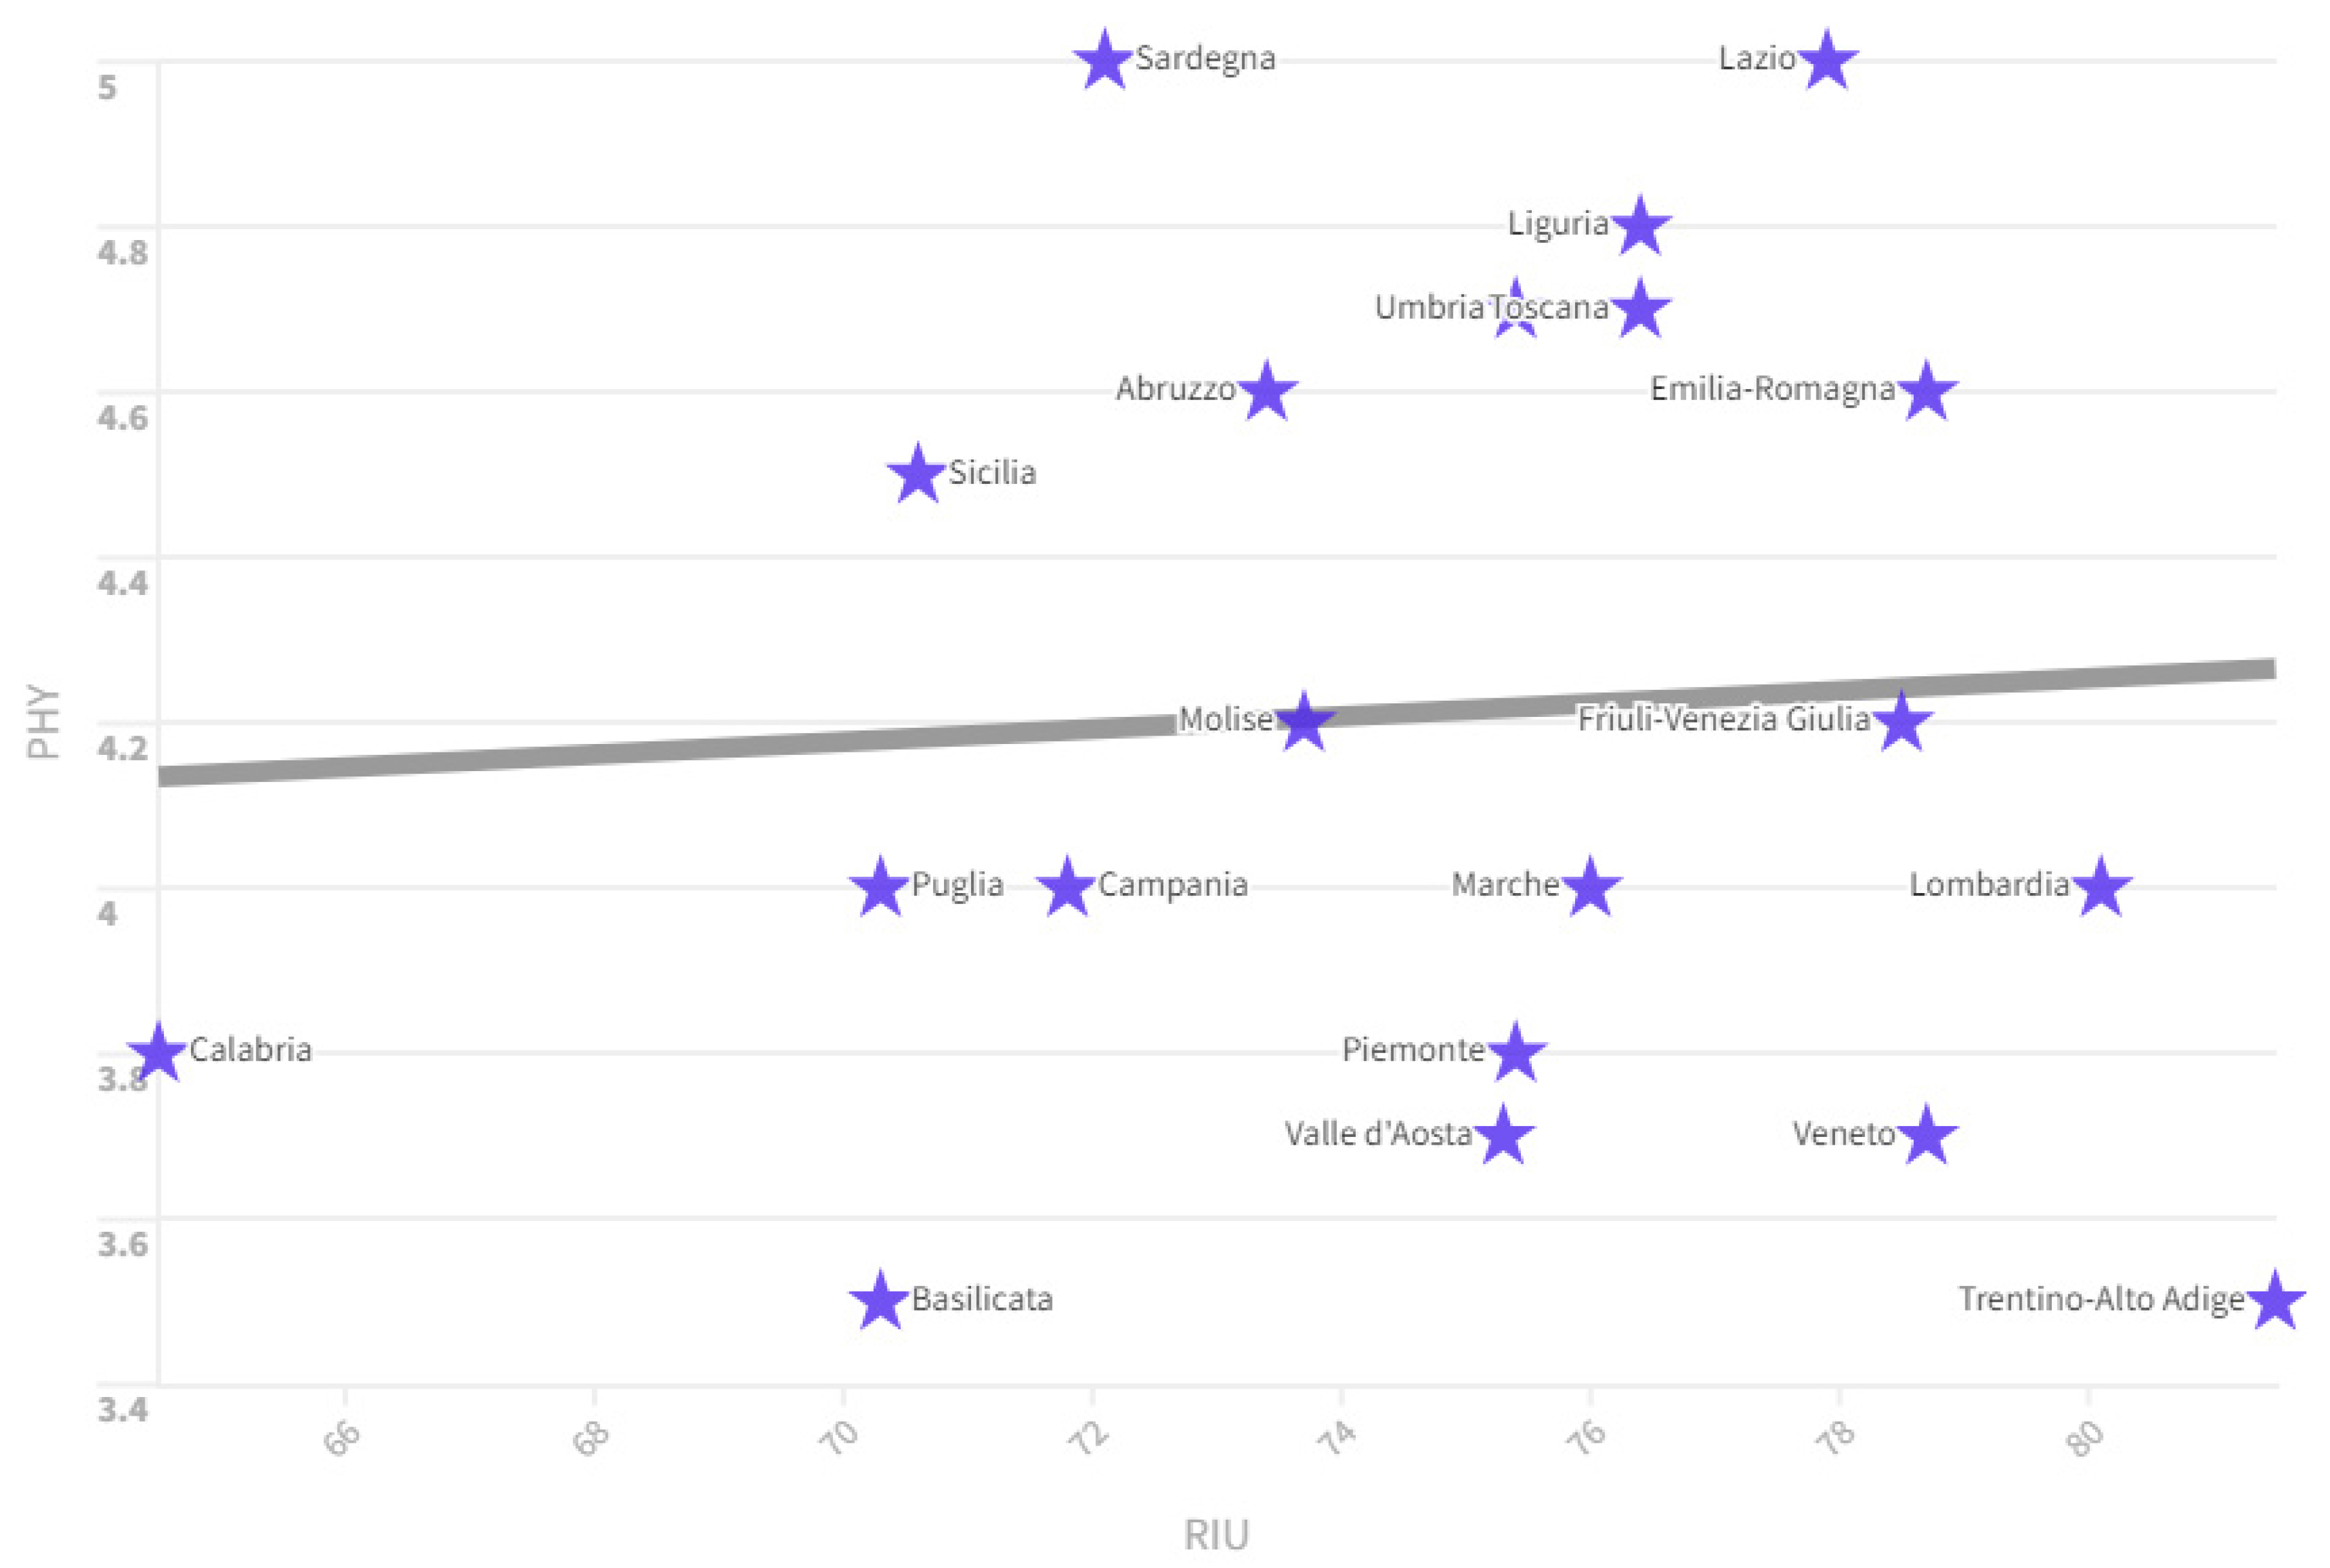
- RIU: is the percentage of people aged 11 and over who have used the Internet at least once a week in the 3 months preceding the interview. There is a positive relationship between the RIU value and the PHY value. In fact, if we look at the ranking of regions by RIU value in 2022, we can see that the regions that have high levels of RIU also have high levels of PHY. For example, Lombardy has an RIU value of 80.1 and a PHY value of 4, Emilia Romagna has an RIU value of 78.7 and a PHY value of 4.6, Friuli Venezia Giulia has an RIU value of 78.5 and a PHY value of 4.2, Liguria has a value of 76.4 and a PHY value of 4.8, and Tuscany with a value of RIU with 76.4 and a PHY value of 4.7.
Figure 5.
The positive relationship between PHY and RIU in 2022.
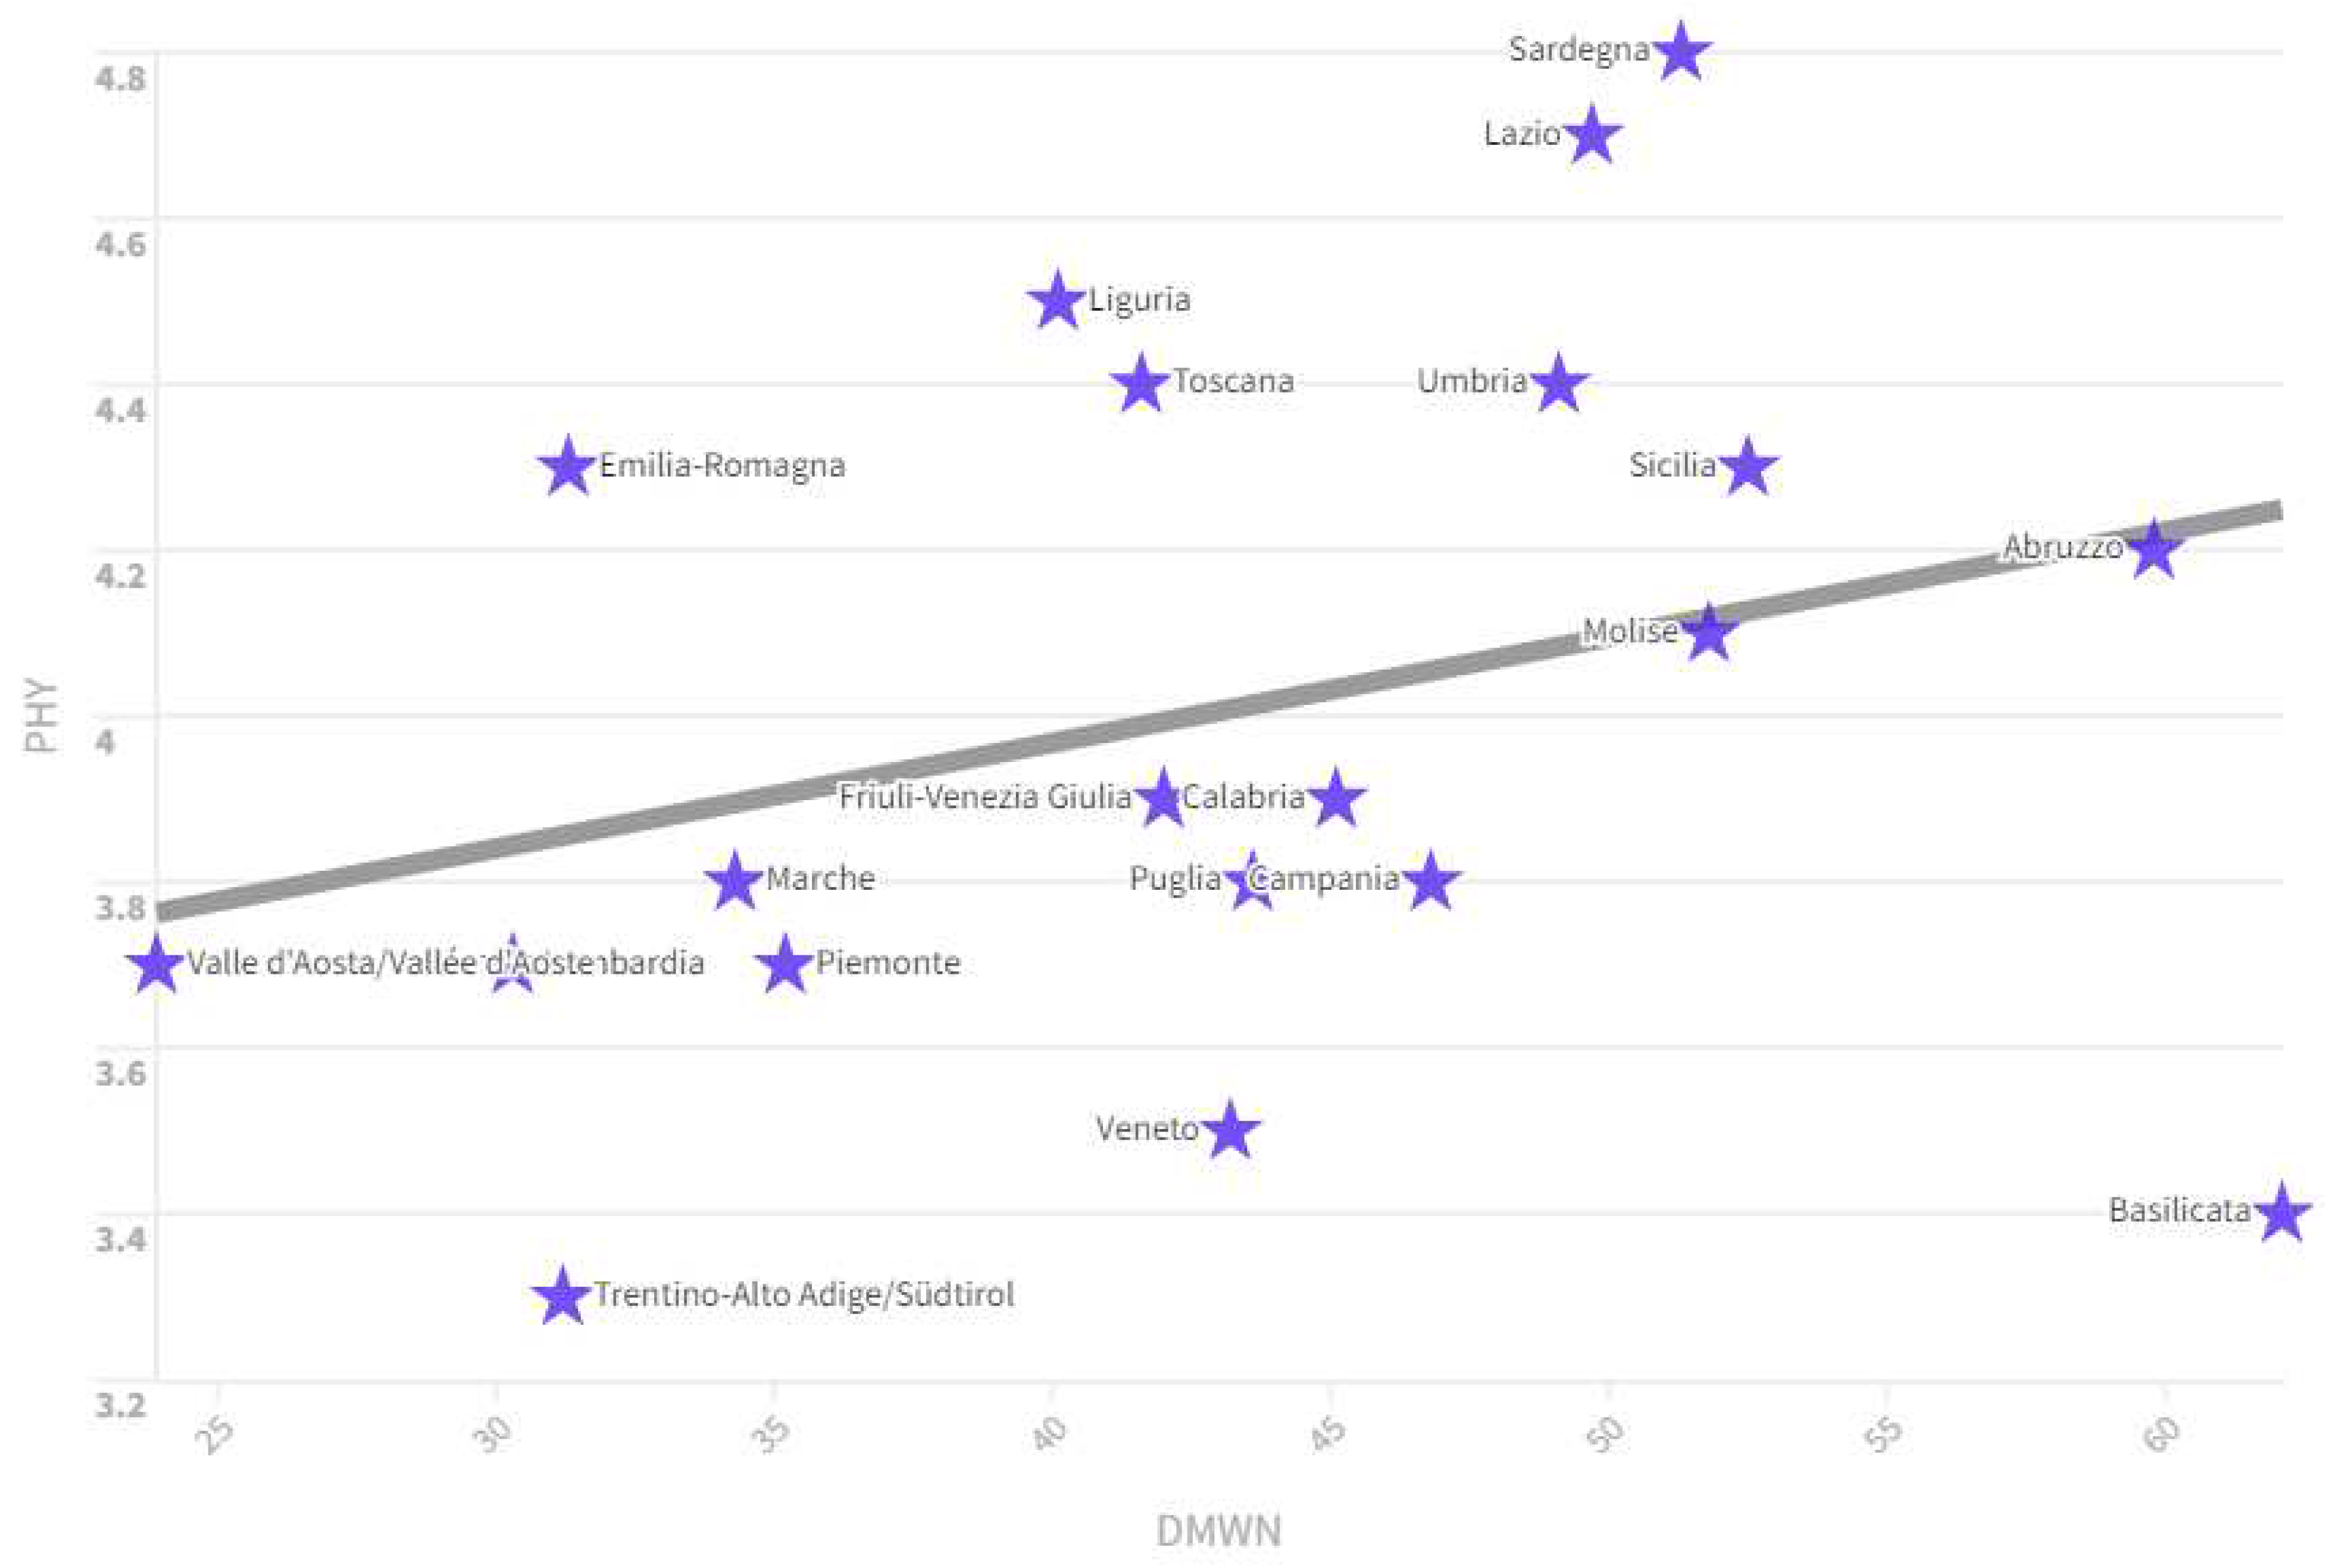
- DMWN: is the percentage of the total volume of total water losses in municipal drinking water distribution networks (difference between the volume introduced into the network and the volume dispensed authorized) on the total amount of water introduced. There is a positive relationship between the DMWN value and the PHY value. This relationship can be understood by considering, for example, the ranking of Italian regions by DMWN value in 2020. Regions that have high levels of DMWN also have high levels of PHY. For example: Abruzzo has a DMWN value of 59.8 and a PHY value of 4.2, Sicily has a DMWN value of 52.5 and a PHY value of 4.3, the Molise has a DMWN value of 51.8 and a PHY value of 4.1, Sardinia has a DMWN value of 51.3 and a PHY value of 4.8, Lazio has a of DMWN equal to 49.7 and a PHY value equal to 4.7, Umbria has a DMWN value equal to 49.1 and a PHY value equal to 4.4. Regions with high DMWN values are regions with low average per capita incomes. Regions that have medium-low per capita incomes also have a declining PHY value. The reason is connected to the low efficiency of the regions that have high values of DMWN and PHY.
Figure 6.
Relationship between PHY and DMWN in Italian regions. Source: Istat-BES.
We also found that the level of physicians is negatively associated to:
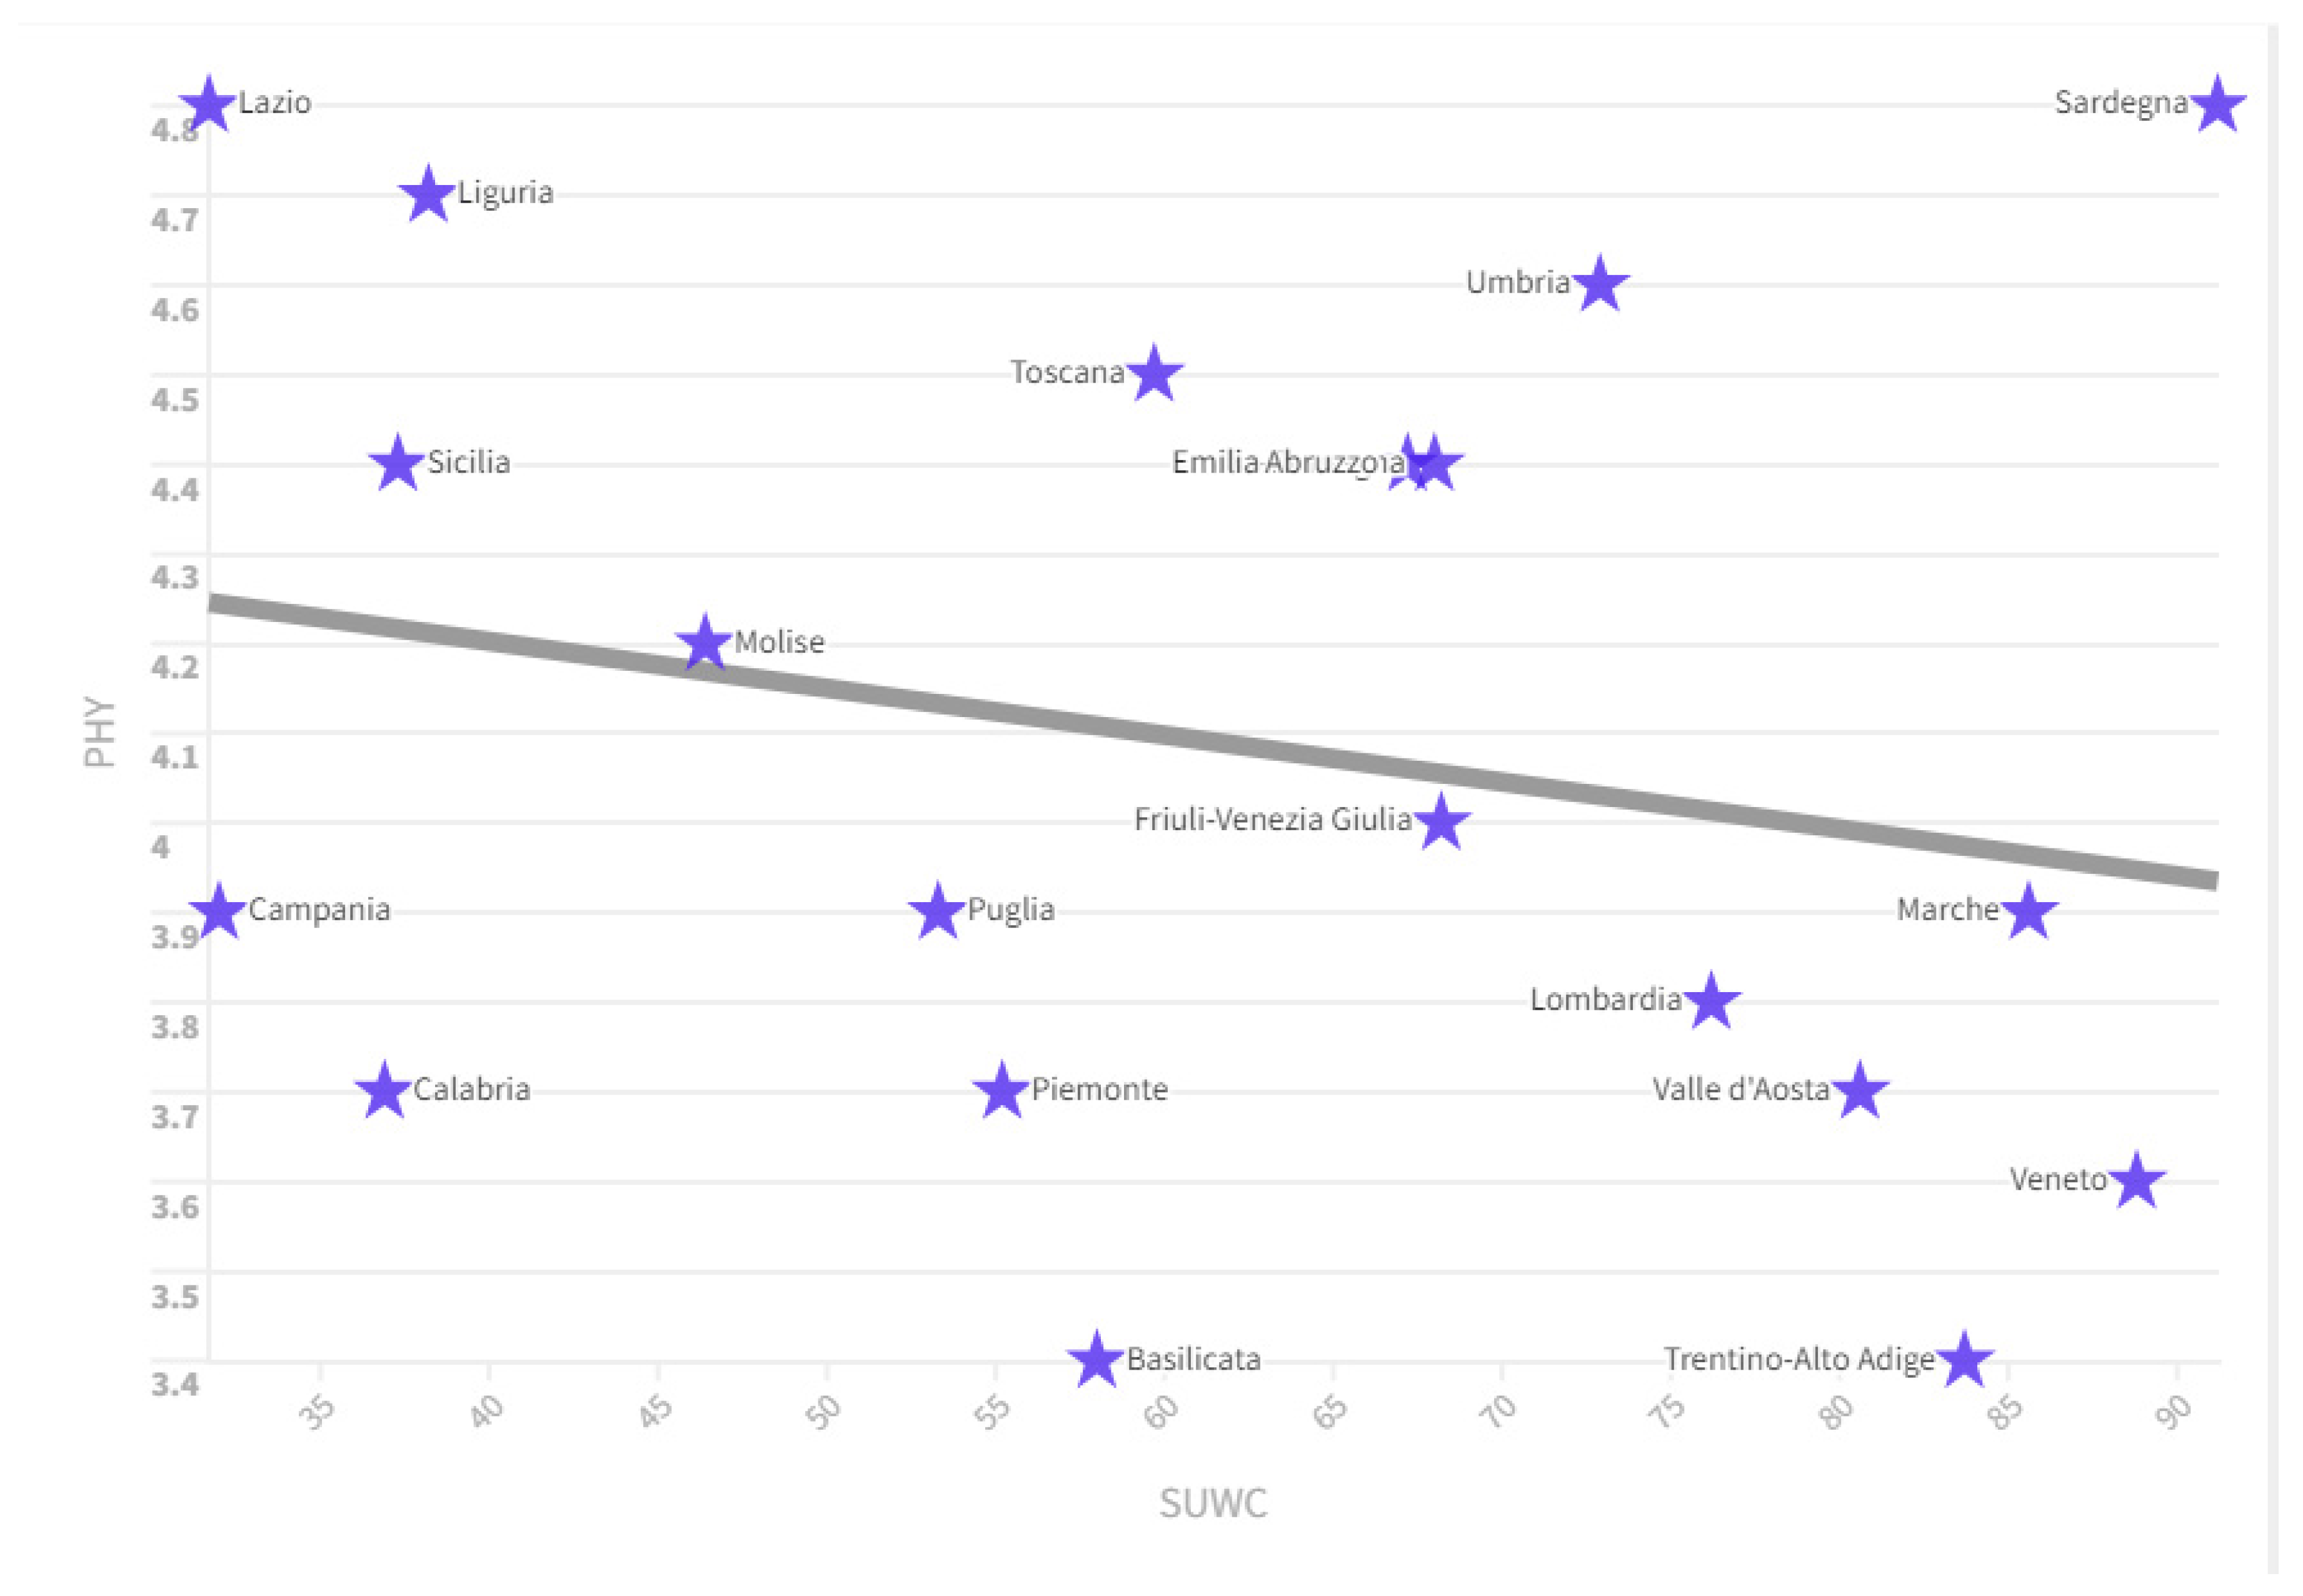
- SUWC: is the percentage of the population residing in the municipalities with separate waste collection greater than and equal to 65%. There is a negative relationship between the SUWC value and the level of PHY. In fact, we can see that in the ranking of regions by SUWC value there are many regions that have low average PHY values. For example, Veneto has a SUWC value equal to an amount of 88.8 and a PHY value equal to 3.6, in the Marches the SUWC value is equal to an amount of 85.6 and a PHY value equal to a value of 3.9, Trentino Alto Adige with a SUWC value equal to an amount of 83.7 and a PHY value equal to 3.4, Valle d'Aosta with a SUWC value equal to 83.7 and a PHY value equal to 3.7, Lombardy with a SUWC value equal to 76.2 and a PHY value equal to 3.8 units. Separate collection tends to be higher within regions that have higher per capita income. These regions with high per capita income also have medium-low values in terms of the presence of physicians. This relationship could be because the Rule of Law is higher in regions with medium-high per capita income. Furthermore, the greater efficiency of the labour market could induce many young people to seek out remunerative professions other than those connected with medical science.
Figure 7.
Relationship between PHY and SUWC in 2021. Fonte: ISTAT-BES.
- SWAC: is the percentage of sealed soil on the total area. There is a positive relationship between the PHY value and the SWAC value in 2021. Countries that have a high SWAC level also have a high PHY level such as for example Lombardy with a SWAC value of 12.37 and a PHY value of 3.8, followed by Veneto with a SWAC value of 11.93 and a PHY value of 3.6, Campania with a SWAC value of 20.54 and a PHY value equal to 3.9, Puglia with a SWAC value equal to 8.2 and a PHY value equal to 3.9, Piedmont with a SWAC value equal to 6.98 and a PHY value equal to an amount by 3.7.
- RDI: is the percentage of expenditure on intramural research and development carried out by companies, public institutions, universities (public and private) and by the non-profit sector on GDP. Expenditure and GDP are considered in current millions of euros. There is a negative relationship between the value of SI and the value of PHY. Regions that spend more on R&D have fewer PHY. In fact, we note that there are many regions in which the RDI value is high while the PHY value is low, as an example, in 2020: Piedmont with RDI equal to 2.33 and PHY equal to 3.7, Friuli Venezia Giulia with RDI equal to 1.74 and PHY equal to 3.9, Veneto with RDI equal to 1.38 and PHY equal to 3.5, Lombardy with RDI equal to 1.5 and PHY equal to 3.7, Campania with RDI equal at 1.34 and PHY equal to 3.8, Trentino Alto Adige with an RDI value equal to 1.21 and a PHY value equal to 3.3. The regions that invest more in terms of research and development are the same ones that also have a higher per capita income, a more efficient labor market and a lower number of physicians.
In summary, we can note that the distribution of physicians in the Italian regions tends to be greater in the central-southern regions than in the central-northern regions. This result may appear paradoxical and counterfactual. In fact, the presence of physicians should grow with per capita income, as with per capita income, expenditure on health and the incentives offered to people who undertake a training course in the medical field should also grow. However, the opposite happens. This particular distribution of Italian physicians among regions who tend to grow with the reduction of per capita income also explains some phenomena such as for example the positive relationship between PHY and ESF and between PHY and NII. The number of physicians grows with the poverty of families and with income inequalities precisely because the concentration of physicians tends to be greater in the central-southern regions, that have low per capita income, and tends to be reduced in the central-northern ones, which have high per capita income.
4. Rankings, Variations and k-Means Clusterization of PHY
Below we analyse the distribution of physicians in the Italian regions, also analysing the inter-period variations and proposing clustering with the k-Means algorithm. Such an analysis is needed to understand regions with high numbers of physicians and to identify rates of change and clustering across regions.
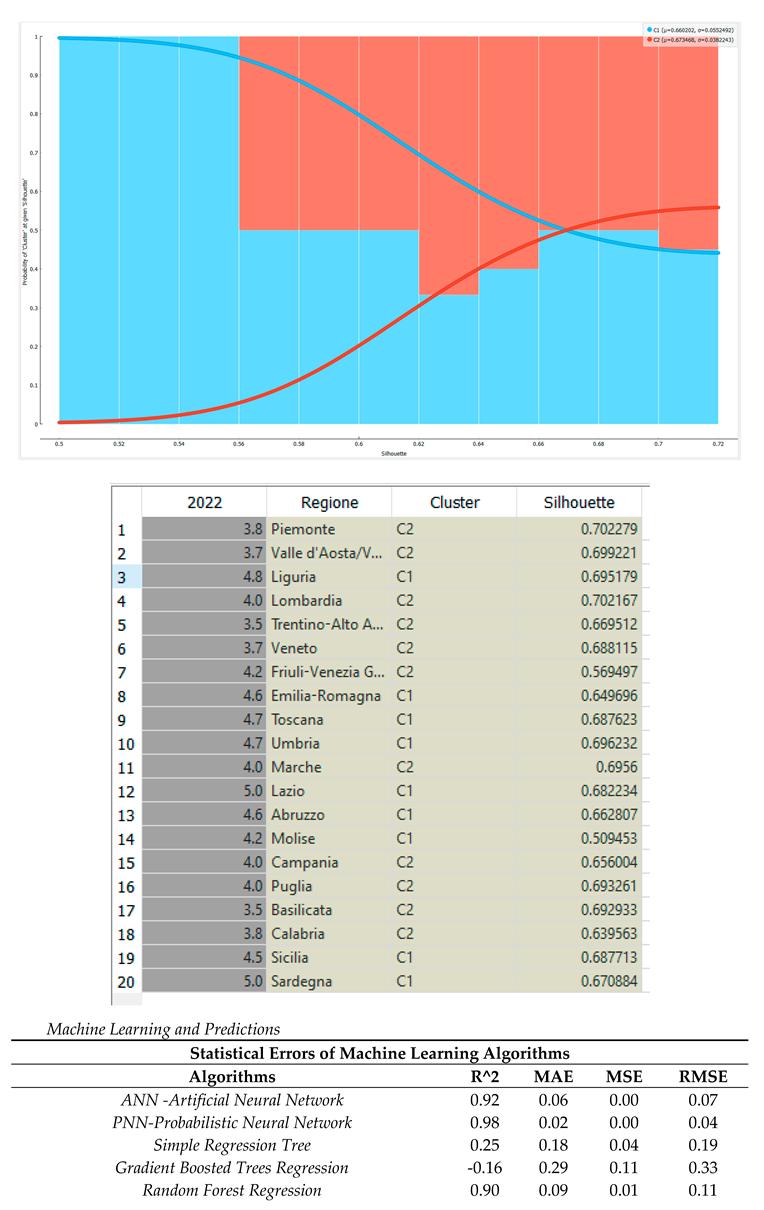
Ranking of the Italian regions by value of PHY in 2022. In 2022, Lazio and Sardinia were in first place for PHY value with a value of 5, followed by Liguria with 4.8. In the middle of the ranking are Friuli Venezia Giulia and Molise with a value of 4.2 and Lombardy with an amount of 4. Veneto closes the ranking with 3.5 and Trentino Alto Adige and Basilicata with 3.5. In 2022, the average number of PHY in the Italian regions was 4.17.
Ranking of the Italian regions by value of the percentage change in the PHY value between 2004 and 2022. Trentino Alto Adige is in first place by value of the percentage change in the PHY value between 2004 and 2022 with an amount equal to +16 .67% equal to +0.5 units, followed by Veneto with an amount of +15.63% equal to 0.5 units and by Emilia Romagna with a value equal to +15.00% equal to 0.6 units . In the middle of the ranking are Liguria with an amount of +11.63% equal to 0.5 units, followed by Puglia with a value of 11.11% equal to 0.4 units, and Friuli Venezia Giulia with a value of +10.53% equal to 0.4 units. Basilicata closes the ranking with a value of +2.94% equal to 0.1 unit, followed by Valle d'Aosta with +2.78% equal to 0.1 unit and Calabria with a change equal to 0.00 %. On average between 2004 and 2022, the value of PHY in the Italian regions grew by 10.20% or by an amount equal to 0.39 units.
Trend of the PHY value in the Italian macro-regions between 2004 and 2022. Considering the Italian macro-areas in 2022 we can see that in first place for PHY value is Central Italy with 4.8, followed by Insular Italy with 4.7, from Southern Italy with 4.2, North East with 4.1, North with 4, North West with 4, South with 4. Considering the rates of change between 2004 and 2022 we can note that the macro-region that has grown the most is the North East with a value of +13.88% equal to 0.5 units, followed by Central Italy with +11.62% equal to 0.5 units, by the North with +11.11% equal to 0.4 units, from the North West with +11.11% equal to 0.4, from insular Italy with +9.3% equal to 0.4, from the South with +8, 1% equal to 0.3 and from Southern Italy with +7.69% equal to 0.3 units. On average, the value of PHY grew in the Italian macro-regions by an amount equal to 10.37%, equal to 0.4 units.
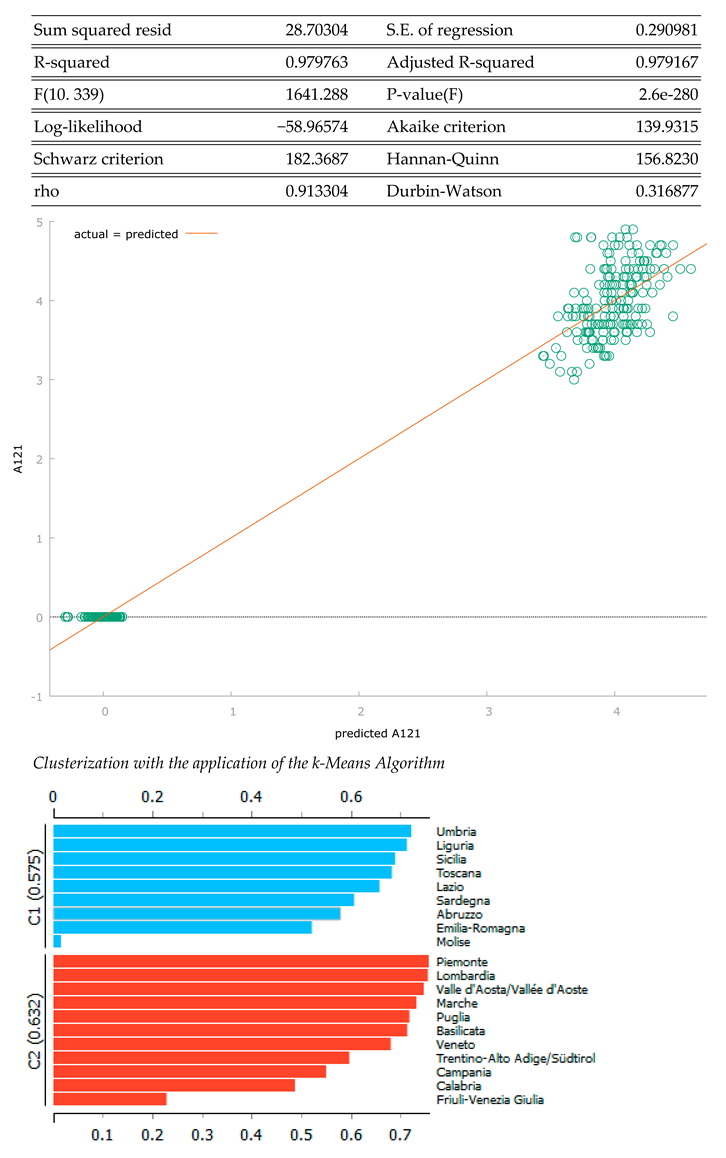
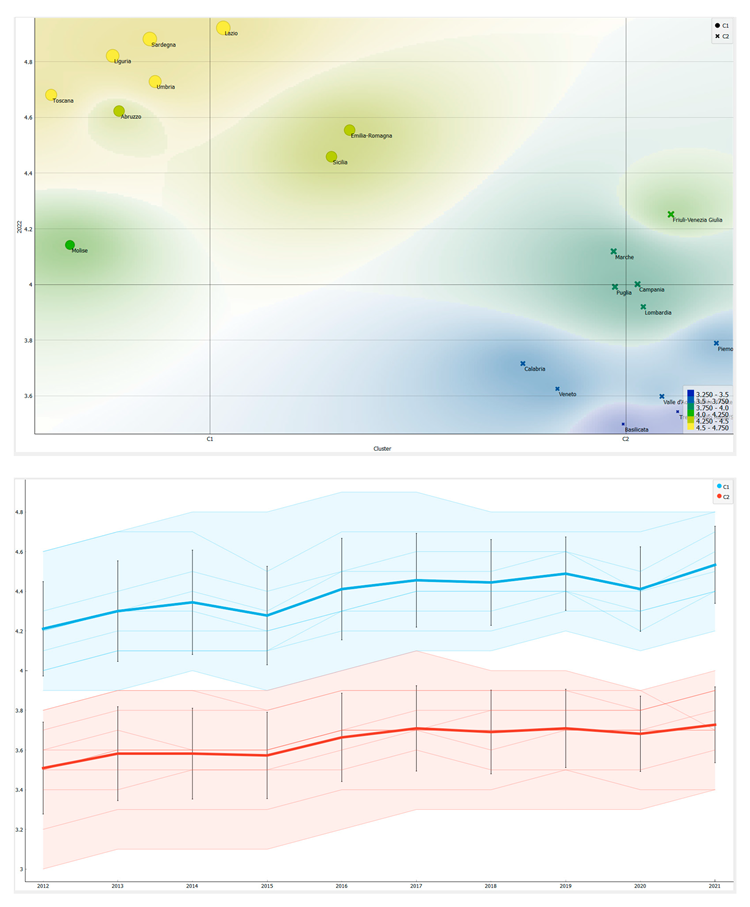
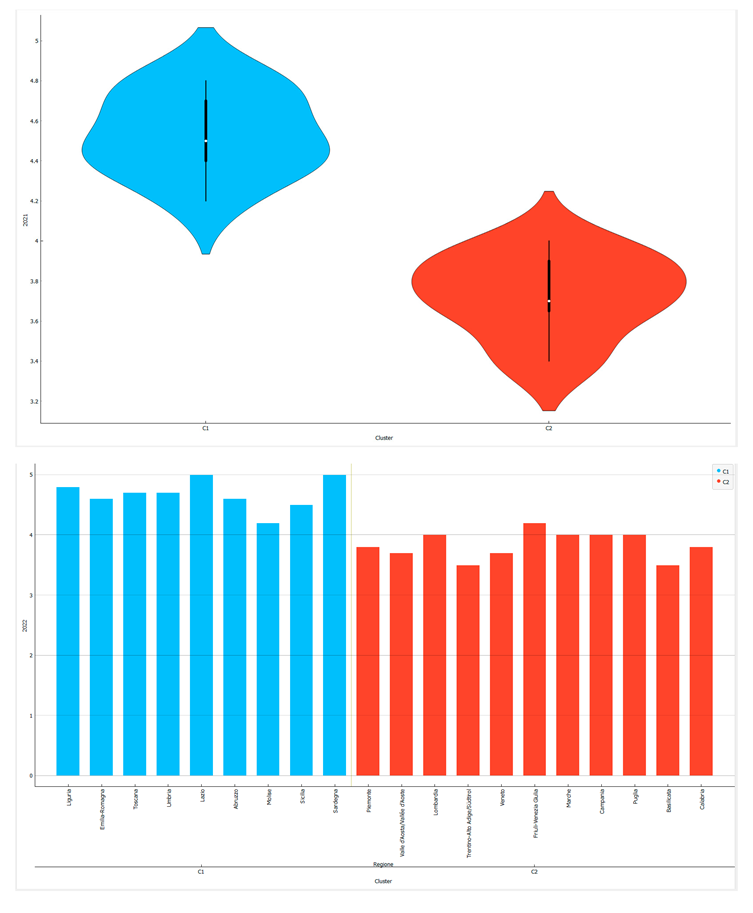
K-Means clusterization optimized with the Silhouette Coefficient. Below we present a clustering with k-Means machine learning algorithm optimized with the Silhouette coefficient. The data show the presence of two clusters, namely:
- Cluster 1-C1: Umbria, Liguria, Sicily, Tuscany, Lazio, Sardinia, Abruzzo, Emilia Romagna, Molise;
- Cluster 2-C2: Piedmont, Lombardy, Valle D'Aosta, Marche, Puglia, Basilicata, Veneto, Trentino-Alto Adige, Campania, Calabria, Friuli Venezia Giulia.
From the point of view of the ordering of the clusters, it appears that the countries of C1 have a median value of PHY equal to 4.7 while the countries of C2 have a median value equal to 3.8. That is, the following ordering of the clusters results. From a geographical point of view, we note that the regions of the Central and insular Italy have higher values of PHY in respect to regions of Northern and Southern Italy. The characteristics of the C1 are peculiar. Indeed, the northern and southern regions do not have much in common from an economic, political and social point of view. It follows that the reasons that can determine a reduction in the value of PHY within the regions are different for the North and for the South. In fact, while, on the one hand, in the case of the North it is possible to hypothesize that the greater efficiency of the work offers incentives to young people to enrol in medical-health study courses, this justification cannot be promoted for Southern Italy. The reason for low PHY values in Southern Italy should instead be traced back to a general inefficiency of the health and education system, which prevents enrolment in medical-scientific universities.
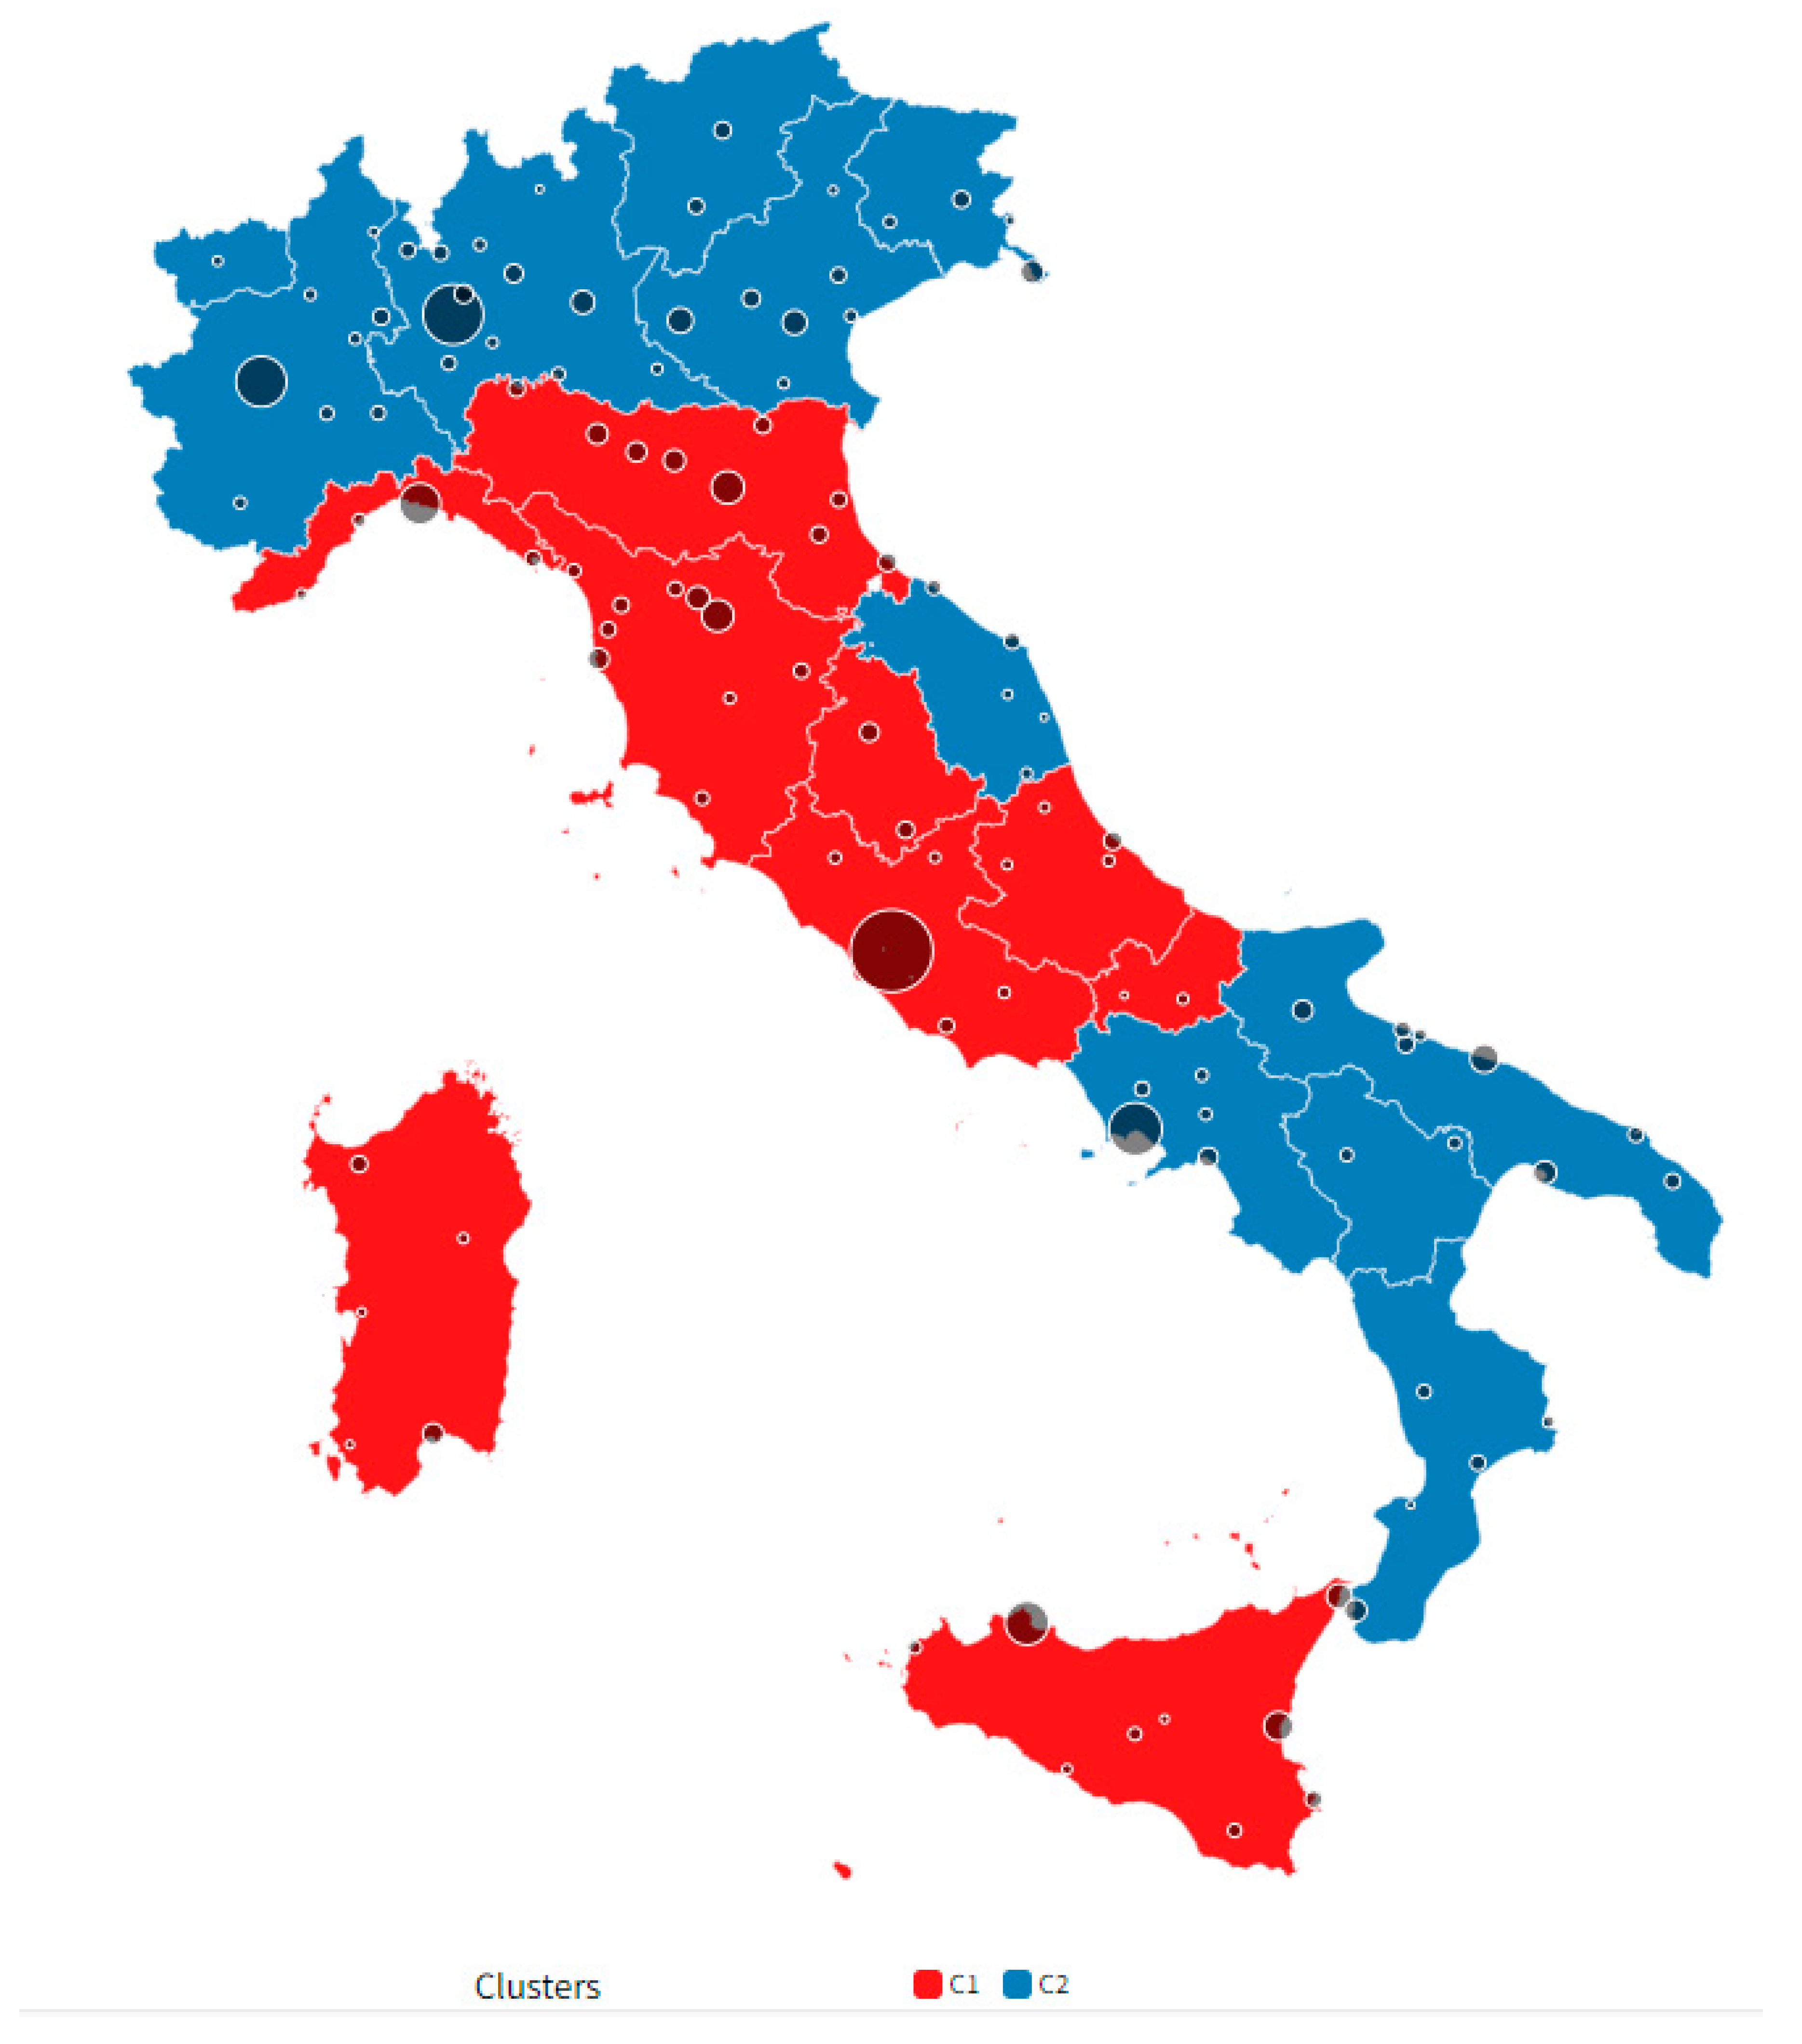
Figure 8.
Clusterization with the application of k-Means algorithm optimized with the Silhouette Coefficient.
Figure 8.
Clusterization with the application of k-Means algorithm optimized with the Silhouette Coefficient.
5. Machine Learning and Predictions
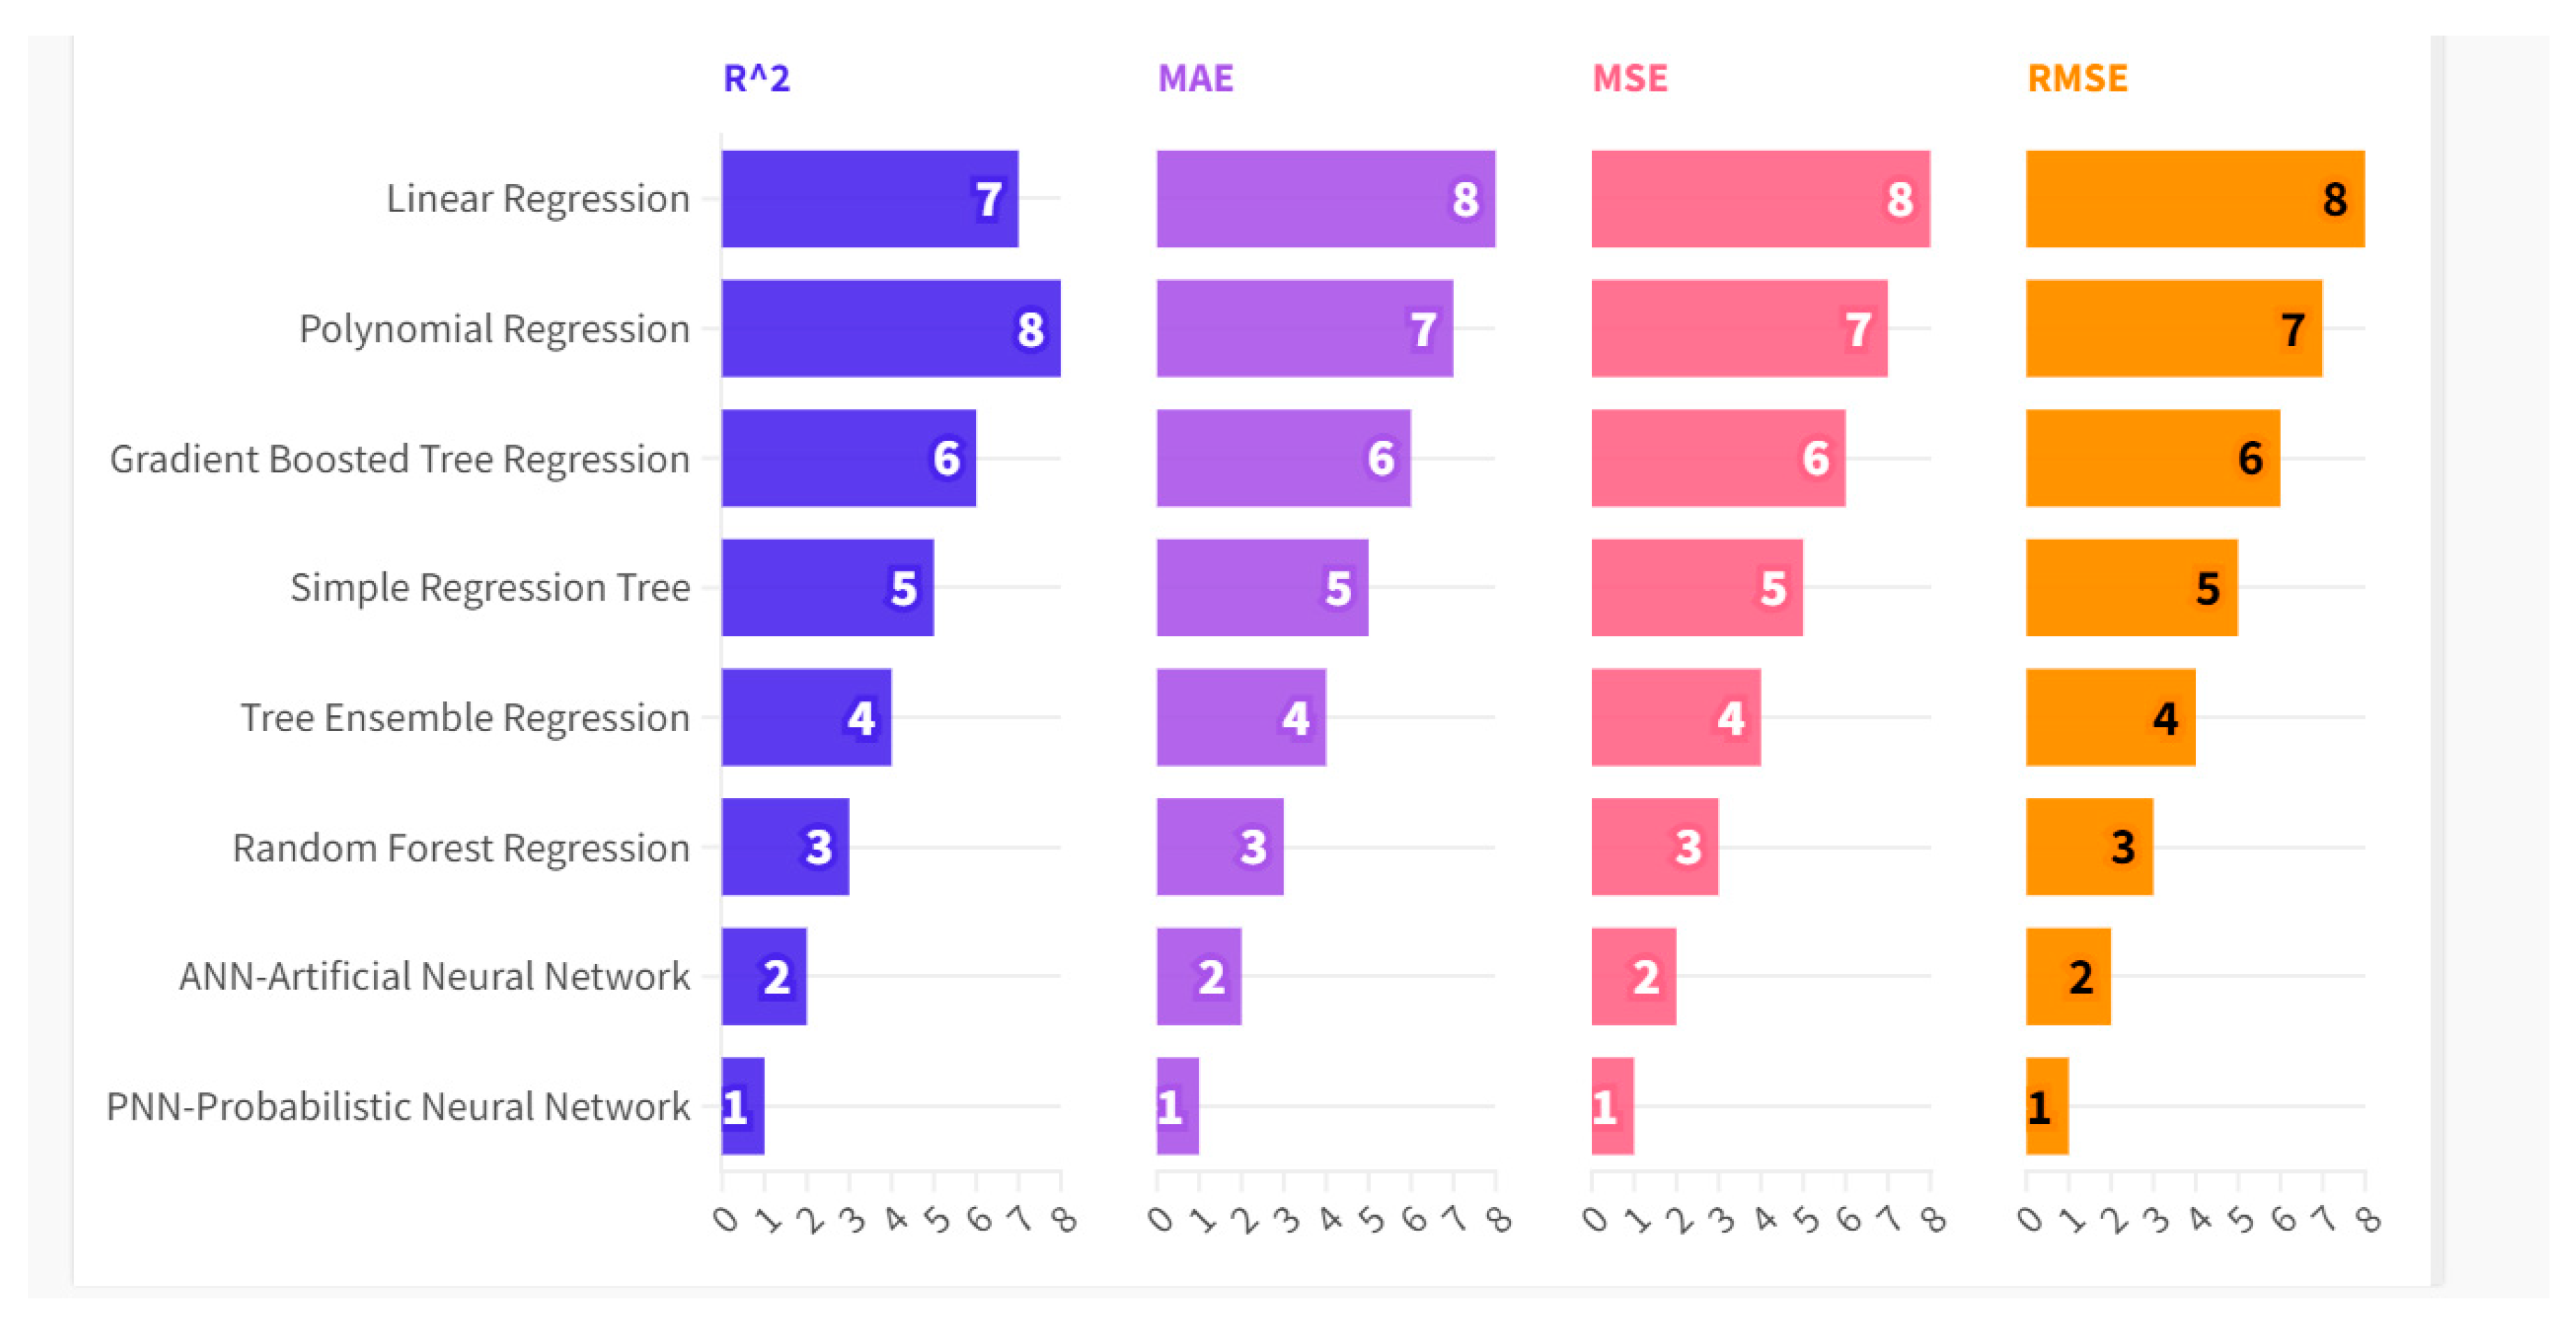
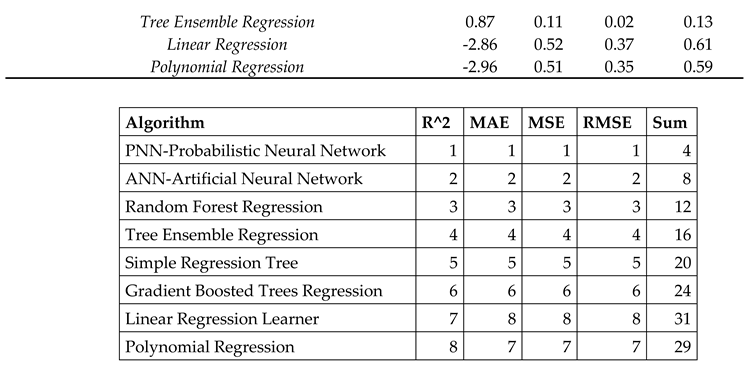
Below we compare eight different machine learning algorithms for predicting the future value of PHY. Specifically, the algorithms were trained with 70% of the data, while the remaining 30% of the data was used for the actual prediction. The algorithms were evaluated according to their ability to maximize the R-squared and to minimize the Mean Average Error-MAE, Mean Squared Error-MSE, and the Root Mean Squared Error-RMSE. Based on the analysis carried out, the following ranking of the algorithms by value of the predictive performance results, i.e.:
- Probabilistic Neural Network-PNN with a payoff value of 4;
- Artificial Neural Network-ANN with a payoff value of 8;
- Random Forest Regression with a payoff value of 12;
- Tree Ensemble Regression with a payoff value of 16;
- Simple Regression Tree with a payoff value of 20;
- Gradient Boosted Tree Regression with a payoff value of 24;
- Linear Regression with a payoff value equal to 31;
- Polynomial Regression with a payoff value of 29.
Figure 9.
Statistical Errors of the Machine Learning Algorithms.
Therefore by applying the PNN-Probabilistic Neural Network algorithm it is possible to predict the following trend of the PHY value, namely:
- Valle d'Aosta, with a PHY value predicted to grow from an amount of 3.7 up to a value of 4 or a change of +8.1%, equal to 0.3 units;
- Trentino Alto Adige with a change in PHY predicted to grow from an amount of 3.5 units up to an amount of 3.7 units or a change equal to a value of 0.2 units equal to 5.7%;
- Piedmont with a predicted PHY variation growing from an amount of 3.5 units up to a value of 3.7 units or equal to a value of 0.2 units equal to +5.7%;
- Umbria with a change in PHY predicted to grow from an amount of 4.7 units up to a value of 4.8 units or a change equal to 0.1 units equal to 2.1%.
There are also 7 Italian regions for which a zero change in the PHY value is predicted, i.e. Lombardy, Friuli Venezia Giulia, Marche, Abruzzo, Molise, Puglia, Calabria. Finally, there are regions for which the PNN-Probabilistic Neural Network algorithm predicts a reduction in the PHY value, i.e.:
- Basilicata with a diminutive variation from an amount of 3.5 units up to a value of 3.4 units or a variation equal to -0.1 units equal to -2.9%;
- Lazio with a variation from an amount of 5 units up to a value of 4.8 units or a variation equal to -0.2 units equal to -4.00%;
- Sardinia with a variation from 5 units to 4.8 units equal to an amount of -0.2 units equivalent to -4.3%;
- Tuscany with a variation from 4.7 units up to a value of 4.5 units or a variation equal to an amount of -0.2 units equal to -4.3%;
- Campania with a variation from an amount of 4.00 units up to a value of 3.8 units or a variation equal to -0.2 units equal to -5.00%;
- Veneto with a variation from 3.7 units up to an amount of 3.5 units or a variation equal to -0.2 units equal to an amount of -5.4%;
- Sicily with a predictive variation decreasing from 4.5 units to 4.2 units or equal to -0.3 units equivalent to -6.7%;
- Emilia Romagna with a variation from 4.6 units up to 4.2 units or equal to -0.4 units equivalent to -8.7%;
- Liguria with a predicted decrease from an amount of 4.8 units down to a value of 3.7 units or equal to a value of -1.1 units equal to -22.9%.
On average the level of PHY is expected to decrease of -2,49% for the italian regions.
6. Conclusions
In this article we have analyzed the value of PHY in the context of ISTAT-BES or the Italian version of ESG principles coined in the context of the UN SDGs objectives. The data analyzed refer to the 20 Italian regions between 2004 and 2022. The results show that the value of PHY grows with social inequalities and with trust for institutions, and decreases with spending on research and development and respect for environment. Our analysis shows that the rich regions of Northern Italy have a lower PHY value than the regions of Central Italy and Insular Italy. Efficiency of the labor market in the northern regions is likely to offer less incentive for young people to embark on a difficult career in the medical sector. We then applied the k-Means algorithm optimized with the Silhouette coefficient and verified the presence of two clusters. The dominant cluster in the sense of PHY comprehend the regions of Central and Insular Italy. Finally we compared eight machine learning algorithms for predicting the future value of PHY. The most efficient algorithm in the prediction turned out to be the PNN. The PHY value is predicted to decrease by an average value of -2.49%.
Funding
The authors received no financial support for the research. authorship. and/or publication of this article.
Data Availability Statement
The data presented in this study are available on request from the corresponding author.
Acknowledgments
We are grateful to the teaching staff of the LUM University “Giuseppe Degennaro” and to the management of the LUM Enterprise s.r.l. for the constant inspiration to continue our scientific research work undeterred.
Declaration of Competing Interest
The authors declare that there is no conflict of interests regarding the publication of this manuscript. In addition. the ethical issues. including plagiarism. informed consent. misconduct. data fabrication and/or falsification. double publication.
Software
The authors have used the following software: Gretl for the econometric models. Orange for clusterization and network analysis. and KNIME for machine learning and predictions. They are all free version without licenses.
Appendix
References
- Michel, J.-P.; Ecarnot, F. The shortage of skilled workers in Europe: its impact on geriatric medicine. Eur. Geriatr. Med. 2020, 11, 345–347. [Google Scholar] [CrossRef] [PubMed]
- Tur-Sinai, N. Zontag, O. Blondheim, A. Weinreb e D. Chernichovsky, «Physicians in Israel: Trends in Characteristics and Training,» State of the nation report: Society, economy and policy in Israel, 2020. [CrossRef]
- Palaniappan, A.; Dave, U.; Gosine, B. Comparing South Korea and Italy’s healthcare systems and initiatives to combat COVID-19. 2020, 44, e53. [CrossRef]
- J. Craig, E. Kalanxhi e S. Hauck, «National estimates of critical care capacity in 54 African countries,» MedRxiv, 2020. [CrossRef]
- Heo, M.-H.; Kwon, Y.D.; Cheon, J.; Kim, K.-B.; Noh, J.-W. Association between the Human Development Index and Confirmed COVID-19 Cases by Country. Healthcare 2022, 10, 1417. [Google Scholar] [CrossRef] [PubMed]
- H. N. Chalise, «South Asia is more vulnerable to COVID-19 pandemic.,» Arch Psychiatr Ment Health , vol. 4, pp. 46-47, 2020. [CrossRef]
- C. Hepburn, «Green Economic Growth for the Democratic Republic of the Congo,» 2021.
- J. G. G. de Alcaniz, J. J. G. G. de Alcaniz, J. Romero-Lopez, R. P. Martinez, V. Lopez-Rodas Sr e E. Costas Sr, «What variables can better predict the number of infections and deaths worldwide by SARS-CoV-2? Variation through time,» Medrxiv, p. [CrossRef]
- Berland, H.; Hughes, D. Is Rural Kansas Prepared? An Assessment of Resources Related to the COVID-19 Pandemic. Kans. J. Med. 2021, 14, 95–102. [Google Scholar] [CrossRef] [PubMed]
- Wang, X.; Fan, L.; Dai, Z.; Li, L.; Wang, X. Predictive Model for National Minimal CFR during Spontaneous Initial Outbreak of Emerging Infectious Disease: Lessons from COVID-19 Pandemic in 214 Nations and Regions. Int. J. Environ. Res. Public Heal. 2022, 20, 594. [Google Scholar] [CrossRef] [PubMed]
- J. S. Y. &. W. H. Zhang, «Analysis of health resource allocation in 11 cities in Jiangxi based on the rank sum ratio,» International Conference on Statistics, Applied Mathematics, and Computing Science, vol. 12163, pp. 143-146, 2022. [CrossRef]
- Msiska, G. 154:poster Challenges of attaining universal health coverage in the sub Saharan Africa. Abstracts 2022, 7. [Google Scholar] [CrossRef]
- L. Vogel, «Virtual care can't fix physician shortages underlying access woes,» CMAJ: Canadian Medical Association journal= journal de l'Association medicale canadienne, vol. 191, n. 35, pp. E975-E976, 2019. [CrossRef]
- Du, Y.; Chen, C.; Zhang, X.; Yan, D.; Jiang, D.; Liu, X.; Yang, M.; Ding, C.; Lan, L.; Hecht, R.; et al. Global burden and trends of rotavirus infection-associated deaths from 1990 to 2019: an observational trend study. Virol. J. 2022, 19, 1–10. [Google Scholar] [CrossRef] [PubMed]
- Brimmo, F.O.; Babatunde, A.O.; Ezefuna, N.N.; Kanu, M.S.; Biziyaremye, P. The need for more medical schools in medically underserved regions in Africa. Ann. Med. Surg. 2022, 84, 104967. [Google Scholar] [CrossRef] [PubMed]
- N. H. Chowdhury, M. A. Hossain e K. U. Ahamad, «What Has Bangladesh Achieved on Child Mortality after MDG implementation?: An Empirical Analysis,» IOSR Journal Of Humanities And Social Science (IOSR-JHSS) , vol. 25, n. 4, pp. 26-30, 2020.
- Davies, J.I.; Reddiar, S.K.; Hirschhorn, L.R.; Ebert, C.; Marcus, M.-E.; Seiglie, J.A.; Zhumadilov, Z.; Supiyev, A.; Sturua, L.; Silver, B.K.; et al. Association between country preparedness indicators and quality clinical care for cardiovascular disease risk factors in 44 lower- and middle-income countries: A multicountry analysis of survey data. PLOS Med. 2020, 17, e1003268. [Google Scholar] [CrossRef] [PubMed]
- Barker, A.K.; Brown, K.; Ahsan, M.; Sengupta, S.; Safdar, N. What drives inappropriate antibiotic dispensing? A mixed-methods study of pharmacy employee perspectives in Haryana, India. BMJ Open 2017, 7, e013190. [Google Scholar] [CrossRef]
- W. Rajagukguk, J. T. Purba, S. Budiono e G. P. Adirinekso, «Regional Economic Development and Stunting: A Panel Data Analysis 2005 and 2010–2019,» Proceedings of the International Conference on Industrial Engineering and Operations Management, 2021.
- W. Rajagukguk, «Economic impact of Physician,» Balkan Journal of Interdisciplinary Research, vol. 6, n. 11, pp. 22-29, 2020.
Disclaimer/Publisher’s Note: The statements, opinions and data contained in all publications are solely those of the individual author(s) and contributor(s) and not of MDPI and/or the editor(s). MDPI and/or the editor(s) disclaim responsibility for any injury to people or property resulting from any ideas, methods, instructions or products referred to in the content. |
© 2023 by the authors. Licensee MDPI, Basel, Switzerland. This article is an open access article distributed under the terms and conditions of the Creative Commons Attribution (CC BY) license (http://creativecommons.org/licenses/by/4.0/).
Copyright: This open access article is published under a Creative Commons CC BY 4.0 license, which permit the free download, distribution, and reuse, provided that the author and preprint are cited in any reuse.


