Submitted:
29 December 2023
Posted:
30 December 2023
You are already at the latest version
Abstract
The pharmaceutical industry is undergoing a shift in processing methods for small-scale production (250-1000 kg/a), leading to an increased focus on continuous production research. Various concepts were developed to overcome challenges in small-scale crystallization for the production of high-quality products. However, further optimization is needed to enhance the industrial applicability of these concepts. This study aims to demonstrate the practical applicability of the Slug Flow Crystallizer (SFC) in the pharmaceutical industry by extending its use to a wider range of substance systems for small-scale API production. Employing an experimental strategy, the research seeks to rapidly assess the SFC's potential for achieving uniform, high-purity product yields, emphasizing the importance of factors such as slug flow stability, residence time distribution, and substance-specific crystallization criteria. This, coupled with our previously published model-based strategy, forms a comprehensive methodology to explore crystallization behavior and modeling for a variety of substance systems within the SFC. The ultimate goal of this study is to showcase the practicality of the SFC in the pharmaceutical industry, enabling the way for its reliable use in long-term, small-scale continuous crystallization and the production of high-quality pharmaceutical products.
Keywords:
Continuous crystallization
; slug flow crystallizer
; high-quality products
; pharmaceuticals
; crystallization modeling
; efficient strategies
1. Introduction
The exploration of crystallization assumes a crucial role in the purification of active pharmaceutical ingredients (APIs) within the pharmaceutical industry. At present, over 90% of APIs exist in crystalline form. Although the pharmaceutical sector is progressively adopting continuous manufacturing processes, batch crystallization remains the prevailing industry standard, thereby imposing constraints on downstream operations [1,2].
Continuous crystallization offers numerous advantages when compared to traditional batch processes and is regarded as a promising avenue for process intensification. It addresses issues related to batch-to-batch variability, ensuring consistent product quality [3,4]. Furthermore, it enables higher space-time yield (STY), thereby increasing capacity while reducing equipment costs and spatial requirements. Spatially separating the nucleation and growth zones can enhance product quality control [5,6,7]. Consequently, continuous crystallization exhibits potential as a feasible option for small-scale API production (250 – 1000 kg a-1) [8]. Achieving the desired product properties necessitates the proper design and operation of a continuous crystallizer. This includes controlling crystal morphology, shape, mean size, and size distribution. A crucial aspect lies in maintaining a narrow residence time distribution (RTD) within the continuous crystallizer. The RTD should ensure similar residence times for all particles in the apparatus, providing equivalent time for desired crystal growth [4,9].
The sophisticated design of the slug flow crystallizer (SFC) presents a concept capable of meeting these requirements. It is a tubular crystallizer characterized by segmented three-phase flow. In its design, a second fluid segment the mother liquor containing crystals into slugs transported through a tubing. The segmentation induces interfaces that evoke internal Taylor vortices through interaction with wall friction during transport, effectively mixing the liquid phase and ensuring particle suspension. This eliminates the necessity for agitators or baffles, thereby minimizing the risk of attrition and primary heterogeneous or secondary nucleation [10,11,12,13,14].
The SFC has been extensively investigated in our prior studies, using the substance system L-alanine/water (Ala/H2O) [12,13,14,15,16,17]. Additionally, the crystal growth and agglomeration behavior of L-alanine in the SFC has been modeled to extrapolate experimental insights [17]. With the aim of extending the applicability of the SFC to small-scale API production, its scope needs to encompass a wider range of substance systems. It is imperative to establish that the apparatus is equally suitable for handling various substance systems, characterized by different particle shapes and structures, as well as variations in suspension and agglomeration behavior.
The development of an efficient strategy has enabled the initial steps in assessing the SFC suitability for a given substance system. This strategy allows for a rapid determination of the SFC's viability for achieving uniform and reproducible product yields with the desired particle size, a narrow particle size distribution, and high purity. The evaluation takes into account factors such as slug flow stability, residence time distribution, and substance-specific crystallization criteria such as the solubility of the solute in the solvent and the temperature dependence. Static contact angle measurements and the dimensionless Capillary number are used to simplify solvent selection for various solid components. By combining static contact angle and capillary number , the study defines areas for dry patterns, transition, and wet patterns, thereby extending the range of SFC applications. Additionally, monitoring solute solubility and dynamic contact angle behavior is emphasized, with temperature-dependent solubility modeling supporting successful crystallization. This strategy, demonstrated for both binary and ternary systems, offers a general approach for assessing different substance systems within the SFC used. [18]
The aim of the study is to transfer previously gained knowledge of continuous slug flow crystallization to new substance systems. Therefore, alongside the guideline for crystallizing and modeling different substance systems, previously provided [17], we intend to combine both approaches to one systematic strategy. This integration will enable us to explore crystallization behavior and modeling for a variety of substance systems within the SFC regardless of the different challenges that each new substance system, for example the solubility or particle morphology, could entail. As a result, this study represents a crucial step toward demonstrating the practicability of the SFC in the pharmaceutical industry. The ultimate objective is to establish the potential for long-term, small-scale continuous crystallization, ensuring the production of high-quality pharmaceutical products, which is necessary to simplify further downstream processes such as formulation.
2. Materials and Analytics
In this section, the investigated substance systems as well as the analytics are presented.
2.1. Substance Systems Used
Different solid compounds were selected for the crystallization inside the crystallizer. Starting from the preselection made in the experimental strategy before [18], l-arginine (Arg, purity ≥ 99.0 %, Merck KGaA, Darmstadt, Germany) and paracetamol (APAP, acetaminophen according to USP, > 99.0 %, Merck KGaA, Darmstadt, Germany) are used. In addition, metformin hydrochlorid (Met, Merck Santé s.a.s., Lyon, France) is utilized as another application example for API production. Deionized, ultrapure and bacteria-free water (Milli-Q®, purified by a Milli-Q® Advantage A10 apparatus of Merck KGaA, total organic carbon content ≤ 3 ppb,) was used as solvent. The binary temperature-dependent solubility equations of Arg/H2O (Equation 1) and APAP/H2O (Equation 2) are given in literature [18] and the solubility curve for Met/H2O (Equation 3) was regressed from gravimetric solubility measurements conducted in this work. The gravimetrically determined concentrations for the substance system Met/H2O were only carried out up to 40 °C, as a step change in solubility was observed at higher temperatures. Accordingly, only the range that ensures a stable form of the solute in the aqueous medium was selected. The solubility curves of the three substance systems in comparison to the solubility of Ala/H2O used in our previous publications are presented in Figure 1 as well as the seed crystals used () of the new tested substance systems. Thus, different particle shapes are examined for crystallization experiments inside the SFC. For the segmentation of the process medium, synthetic air (Grade 5.0, Messer Griesheim) was employed as the immiscible fluid phase to induce slug flow within the tubing.
2.2. Analytics
In this section, the utilized analytical methods are described.
2.2.1. Concentration Analysis
In order to evaluate the concentration reduction during the crystallization processes and to analyze the resulting solid loading, samples are taken (5 - 7 g). The solution or suspension is drawn up directly or through a glass capillary into the syringe and is then filtered through a syringe filter (CHROMAFIL® Xtra PTFE-45/25, 0.45 μm, Macherey-Nagel) into a prepared sample vial. The collected samples were then pre-dried in a drying oven (Thermo Heratherm, Thermo Scientific) at 50 °C for 24 h. Afterwards the pre-dried samples are placed in a vacuum drying oven (VACUtherm, Thermo Scientific) at 50 °C for additional 48 h. The sample vials were weighted empty (), full with solution (), and after drying () using a precision scale (Kern ABP 300-4M, KERN & SOHN GmbH). The ratio of the differences of the masses gives the concentration of the sample according to Equation 4.
2.2.2. Video Analysis of Slug Length and Particle Suspension
To ensure consistent growth conditions and minimize variation in particle size, it is important to produce uniform slugs with a narrow slug length distribution (SLD). To determine the length and distribution of slugs, and to evaluate the suspension behavior of particles within these slugs, image analysis is conducted using videos recorded with a camera (NX300, 18-55mm lens, Samsung) at the end of the tubing. For this purpose, the camera was positioned in front of a photo box through which the end of the tube is passed. A light source is positioned on the other side of the photo box. The camera is manually focused precisely on the FEP tube. Afterward, the in-house analysis tool, developed by Termühlen et al. [12] calculates the SLD represented by the median slug length and the distribution width .
Furthermore, the binary images generated from the videos can also be used to assess the goodness of suspension (GoS) within the slug. By calculating the centroid of the white area in both horizontal and vertical directions and normalizing over the slug length or inner diameter of the tubing, the dimensionless parameters and characterize the horizontal and the vertical suspension behavior of particles within the slug, respectively. A value of > 0.4 in both directions indicates a sufficiently homogeneous suspension of particles. For more details the reader is referred to the literature [12,14,16].
2.2.3. Offline PSD Analysis
Dynamic image analysis was performed using the QICPIC (Sympatec GmbH) to assess the particle size, PSD, and shape. The M6 module with a 2 mm gap was used to detect particles within a specific size range of 5 μm to 1705 μm. The LIXELL wet dispersion module passed a suspension through a flow cell between a laser and a detector, capturing the projection areas of particles over time at a specific frame rate. This technique was applied offline for determining the PSD in suspension experiments, batch crystallization experiments, and continuous crystallization experiments in the SFC.
An in-house MATLAB script using artificial neural network [19,20] is used to evaluate the projection areas measured with respect to PSD and agglomeration degree, taking the particle shape into account. The neural network is able to distinguish between single particles and agglomerates/aggregates for particle sizes larger than 80.6 μm due to image resolution. For characterizing anisotropic particles, two-dimensional characterization parameters such as the minor axis length (MIL) and major axis length (MAL) of an ellipse were utilized. An axis length distribution (ALD) was calculated based on these parameters, which showed a strong correlation to the PSD. A density plot was created to illustrate the probability distribution for particles with a specific MIL and MAL, identifying the most probable values, the characteristic MIL and MAL as the center of mass ( and ). The aspect ratio (AR) can be determined by calculating the quotient of to . [21]
Furthermore, microscopic images were taken using a Leica DM2700 M light microscope equipped with a Leica Flexacam C1 camera to evaluate the particle size and shape qualitatively.
3. Strategy and Experimental Procedures
Currently the development of a continuous crystallization process of a new substance system inside the SFC consumes a lot of material, energy, and time. Therefore, a strategy was developed to minimize the experimental effort while still creating valid results. First, the strategy is presented, followed by the setups and procedures of the respective experiments.
3.1. Strategy for Transferring the Experimental and Model-Based Approach to Crystallization of Different Substance Systems Inside the Slug Flow Crystallizer
Figure 2 shows the actions (squares) and evaluation criteria (rhombuses) per step (1-4) to continuously crystallize a new substance system and to transfer the model to these substance system with a minimal number of experiments necessary. The experimental and model-based approaches presented in section 1, are merged into one strategy. The strategy to continuously crystallize a new substance system in the SFC begins with a suitability check (step 1) by measuring and/or modeling the solubility curve for the new substance system and ensuring the feasibility of a stable slug flow for the tested substance system inside the SFC. Subsequent investigations are conducted to determine the growth rate (step 2) and the optimal particle suspension (step 3). These examinations are necessary to determine suitable operating parameters for the continuous crystallization experiments and modeling (step 4). To transfer the existing model derived for the SFC [17] to a novel substance system, material data is sourced from literature, estimated, or experimentally determined for the use as input into the model. Growth rates are then regressed to experimental batch data, and the validity of the suspension correlation [16] implemented for accurate agglomeration correlation are verified for a new substance system. If necessary, the continuous crystallization experiments conducted for the experimental approach can be used to modify the agglomeration correlation of the model for precise modeling for each substance system.
3.2. Setups and Procedures
3.2.1. Batch Crystallization Experiments
The batch experiments were conducted in a stirred and tempered vessel ( = 500 mL, = 400 rpm). The temperature was controlled using thermostat (CC-505, Huber) and a PT100 sensor placed inside the vessel. First, the aqueous saturated solution was prepared for = 50 °C for the substance systems Arg/H2O and APAP/H2O, and for = 40 °C for Met/H2O according to the regressed solubility curve for the respective substance systems (Equations 1-3). The mixture of solute and solvent was preheated and stirred for one hour at 55 °C to ensure complete dissolution of the solute. Afterwards, a linear cooling rate is applied. In order to evaluate the supersaturation degradation during the crystallization process, two different cooling rates ( = 0.45 K min-1 and κ = 1.8 K min-1) are examined in duplicate each for the respective substance system. Seed crystals ( = 0.01 gsolid gsolution-1) were added at saturation temperature each and concentration samples were taken in 5 K steps until the final temperature of 20 °C ( ambient temperature) was reached. At the final temperature, a sample is taken to analyze the PSD via dynamic image analysis using the QICPIC (see section 2.2.3).
3.2.2. Continuous Slug Flow Experiments
The setup used is shown in Figure 3 and analogous to the setup described in our previous publications [14,16]. Suspension experiments as well as continuous crystallization experiments were carried out in this setup. First, the feed suspension for the respective experiment is prepared. As a feed, a saturated solution is prepared by adding the solute (Arg, APAP, or Met) in excess in ultrapure water at the respective starting temperature and stirring for 48 hours. The solution is then filtrated. 450 mL of the saturated solution is added to the feed vessel ( = 400 rpm). Then the seed crystals of the respective solute ( = 0.01 gsolid gsolution-1, < 200 μm) are added. To start the experiment, the three-way glass valve is turned from the ultrapure water to the feed suspension. The feed suspension is then transported to the T-junction (polypropylene, = 3 mm) by a peristaltic pump (Reglo Digital, 4 channels, 12 rolls, ISMATEC). Here it meets the synthetic air (Type 5.0, Messer Griesheim GmbH). The airflow is regulated with a high-resolution needle valve (NV-001-HR, Bronkhorst) and a flow meter (El-Flow-Select, Bronkhorst). The occurring slug flow is led through a glass box containing gas-free water to be recorded with a video camera (NX300, 18-55mm lens, Samsung) at the end of the tubing so that the slug length, SLD and suspension state can be analyzed (see section 2.2.2). A degressive temperature profile along the tubing can be achieved due to the implemented co-current tube-in-tube construction [13]. The suspension is collected with its respective temperature . at the tubing outlet and analyzed via dynamic image analysis with the QICPIC (see section 2.2.3). Based on the experimental strategy, a hydrophobic tubing material (fluorinated ethylene propylene (FEP), = 3.18 mm) was selected for the SFC setup used, as aqueous solution were selected, in order to obtain the highest possible static three-phase contact angle . This is a prerequisite to generate convex slugs in the flow and accordingly to ensure a narrow residence time distribution of the particles.
In case of suspension experiments the tubing length inside the slug flow zone is = 7.5 m. The and temperatures were chosen according to the ambient temperature. Since influences the particle suspension inside slugs the most [14], only was varied between 20 and 60 mL min-1. The liquid hold-up and the seed loading were held constant at = 0.5 and = 0.01 gsolid gsolution-1. For each operating point the experiments were performed twice for the respective substance system.
The continuous cooling crystallization experiments are conducted inside a 26.5 m tubing from = 50 °C to ambient temperature (). The process parameters were set according to the results from the batch and suspension experiments. Therefore, the total volume flow rates and the cooling rates are variable, leading to different RTs and potential yields for the crystallization process. The process parameters after evaluating the batch and suspension experiments are shown in Table S2.
4. Results and Discussion
4.1. Results of Step 1 – Suitability Check
To be capable of applying the strategy shown in Figure 3, it is necessary to carry out the suitability check for the respective substance system in order to conduct the crystallization in the SFC. Therefore, after checking the availability of the solubility of the solute in the respective solvent (in this case water), the three-phase contact angle , the capillary number for the targeted operating range, and the dynamic slug flow behavior in the apparatus have to be checked according to the procedures described in [18]. For Arg/H2O and APAP/H2O this was already done in our previous publication [18]. For the Met/H2O substance system, this was performed as part of this work. The results are displayed in Table 1.
All substance systems considered in this work and displayed in Table 1 fulfill the criteria for the dry pattern ( > 50° and < 6.3·10−3) set up in [18]. Therefore, all tested substance system are suitable for the cooling crystallization inside the SFC. The images of the slug flow in the apparatus for different volume flow rates for checking and maintaining convex slugs are shown in Figure S1 for the substance system Met/H2O.
4.2. Results of Step 2 – Determine Growth Behavior
The resulting concentration profiles during the batch experiments according to the procedure described in section 3.2.1 are displayed in Figure 4. For all substance systems tested, the supersaturation at ambient temperature ( = 20 °C) are almost completely degraded for the cooling rates considered resulting in high relative yields (Table 2). For Arg/H2O and Met/H2O high solid loadings were obtained due to the high temperature dependency of the solubility compared to APAP/H2O. Furthermore, the difference in concentrations for a temperature level despite different cooling rates is small for Arg/H2O, APAP/H2O and Met/H2O leading to the conclusion, that the influence of the cooling rate on the relative yield and the remaining supersaturation is negligible.
Therefore, the batch crystallization experiments might give an adequate prediction for the relative yield and the remaining supersaturation at even higher cooling rates during the continuous crystallization process inside the SFC. High cooling rates are targeted, to determine the limit of the material system and to achieve high space-time yields for continuous crystallization. Since the systems quickly degrades supersaturation, high local supersaturation will most likely not occur at a higher cooling rate during the course of the continuous crystallization based on the maximum supersaturation level of each substance system at higher cooling rates ( = 1.177, = 1.066, = 1.055). Thus, the risk of occurring wall crystallization in the SFC is lower and a higher cooling rate can be targeted for the continuous experiments. Nonetheless, for the supersaturation degradation of the Met/H2O substance system no clear turning point is detectable in the concentration profile. This indicate that high supersaturation might occur at high cooling rates, and therefore, this could lead to wall crystallization after all. The supersaturation level for the respective temperatures during the experiments of all substance systems tested is shown in Figure S2. The maximum values for are listed in Table 2.
Subsequently, it is checked whether the temperature-dependent substance data for the respective substance system is available and valid. This was successfully carried out for the substance systems Arg/H2O and APAP/H2O. For the substance system Met/H2O, however, the data situation for the temperature-dependent substance system parameters is too uncertain, so that this substance system is not modeled in the framework of this work.
Following the strategy and the procedure described in 3.1, the growth rates for the substance systems Arg/H2O and APAP/H2O were fitted to the concentration profiles obtained by the batch experiments with similar cooling rates as the continuous SFC experiments above. The growth rates were approximated using the model of Burton, Cabrera and Frank (Equation 5) [22] using growth rate constants and and the dependence to the relative supersaturation . The results are shown in Figure 5.
4.3. Results of Step 3 – Determine Optimal Suspension
To obtain an operating point with homogeneous suspension for the continuous crystallization experiments in the SFC and to be able to check and/or modify the agglomeration correlation for the modeling, it is necessary to be able to estimate and adjust the particle suspension state inside the slugs.
First, it is evaluated, whether the suspension correlation developed in our previous publication [16] is valid for different substance systems and can accurately describe the suspension state of Arg/H2O, APAP/H2O and Met/H2O. Therefore and parameters obtained by the image analysis at the end of the tubing (described in section 2.2.2) for the respective suspension experiments are connected with the PSD measurements and the and values in order to calculate the dimensionless numbers necessary for the suspension correlation. To describe the horizontal particle suspension distribution, the length of circulation zone normalized with the median slug length is used. For the vertical particle suspension description, the modified Froude number is utilized. To evaluate the correctness of the suspension correlation, non-homogeneous and homogeneous suspension states has to be set, and therefore, the volume flow rate at which a homogeneously suspended state ( 0.4) is to be expected in the slugs considering the different particle shapes was calculated. The minimum volume flow rate of 40 mL min-1 was calculated on the basis of and values, which correspond to the seed crystals used in the experiments ( = 70 µm, = 105, AR = 1.5). With higher AR, higher volume flow rates has to be set for a constant . Both non-homogeneous suspended states and suspended states have been set in the suspension experiments based on the correlation. The results are displayed in Figure 1.
Figure 6.
Plot of the horizontal represented by over the dimensionless length of circulation zone (left) and of the vertical particle distributions represented by over the modified Froude number (right). The used data are given in Table 3.
Figure 6.
Plot of the horizontal represented by over the dimensionless length of circulation zone (left) and of the vertical particle distributions represented by over the modified Froude number (right). The used data are given in Table 3.
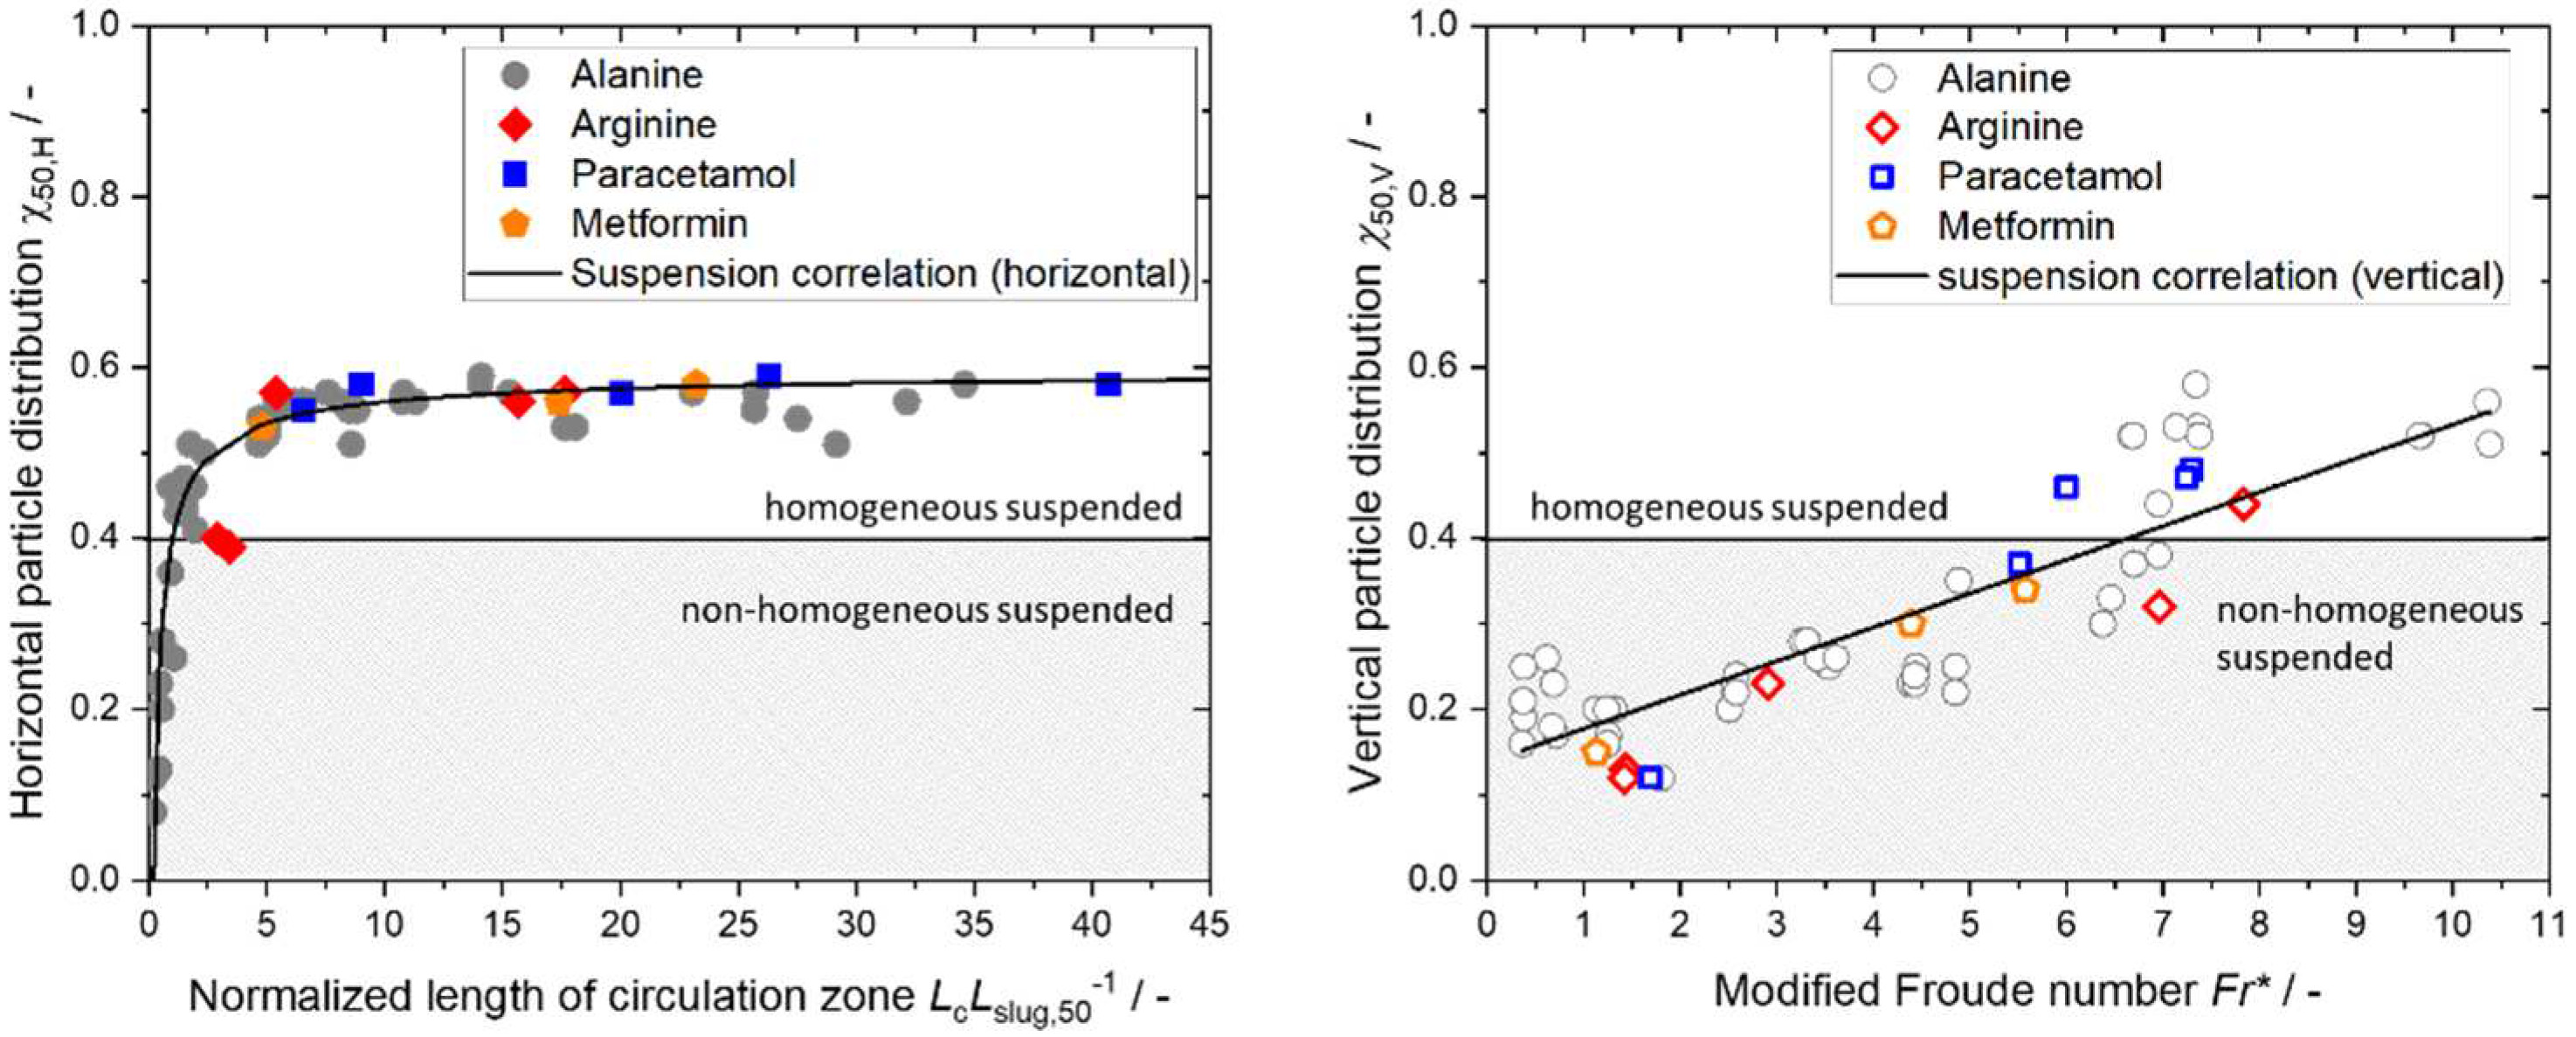
It can be seen, that the use of the dimensionless numbers for the horizontal and vertical particle suspension description, and therefore, the suspension correlation developed [16] is valid for the tested substance systems. Therefore, the suspension correlation is valid for different particle shapes and various substance systems and serves as the basis for assessing the particle suspension state. The specific values of the calculated and experimental GoS parameters ( and ) can be seen in Table 3.

Table 3.
Results of the suspension experiments validating the suspension correlation using the GoS parameters ( and ) and the dimensionless parameters and . The colored experiments can be assigned to the images of the suspension states in Figure 7.
Table 3.
Results of the suspension experiments validating the suspension correlation using the GoS parameters ( and ) and the dimensionless parameters and . The colored experiments can be assigned to the images of the suspension states in Figure 7.
|
/ mL min-1 |
/ - |
/- |
/ - |
/- |
/ - |
/- |
|
|---|---|---|---|---|---|---|---|
| Arg/H2O | 20 | 2.90 | 1.42 | 0.50 | 0.19 | 0.40 | 0.12 |
| 20 | 3.41 | 1.43 | 0.51 | 0.19 | 0.39 | 0.13 | |
| 30 | 5.41 | 2.91 | 0.54 | 0.25 | 0.57 | 0.23 | |
| 40 | 17.64 | 6.96 | 0.57 | 0.41 | 0.57 | 0.32 | |
| 50 | 15.66 | 7.83 | 0.57 | 0.48 | 0.56 | 0.44 | |
| APAP/H2O | 20 | 6.57 | 1.69 | 0.55 | 0.20 | 0.55 | 0.12 |
| 40 | 9.03 | 5.52 | 0.56 | 0.36 | 0.58 | 0.37 | |
| 40 | 20.06 | 6.00 | 0.58 | 0.37 | 0.57 | 0.46 | |
| 60 | 40.71 | 7.30 | 0.58 | 0.43 | 0.58 | 0.48 | |
| 60 | 26.30 | 7.24 | 0.58 | 0.42 | 0.59 | 0.47 | |
| Met/H2O | 20 | 4.81 | 1.13 | 0.53 | 0.18 | 0.53 | 0.15 |
| 40 | 23.20 | 4.39 | 0.58 | 0.31 | 0.58 | 0.30 | |
| 60 | 17.38 | 5.57 | 0.57 | 0.36 | 0.56 | 0.34 |
The particle suspension inside the slugs obtained during the suspension experiments for the respective substance systems are shown in Figure 7. The suspension experiments for all suspension experiments conducted show, that higher volume flow rates lead to a more homogeneous particle suspension inside the slugs and that a non-homogeneous ( = 20 mL min-1) and homogeneous suspension state ( ≥ 40 mL min-1) can be achieved within the process parameters chosen.
For the substance system APAP/H2O, it can be seen in Figure 7, that some of the particles adhere to the gas/liquid interface on the left and are not suspended inside the slug. This phenomenon is expected to cause difficulties in continuous crystallization in the SFC as the particles aggregate and likely form solid bridges due to supersaturation present. Agglomeration of the particles results, leading to broader PSD and affecting the product quality. A microscopic analysis of the APAP seed crystals used showed that the particles aggregate preferably by their small facets and therefore form net-like structures, visible in Figure 8.
It is reported in the literature that different crystal facets of APAP form I show a significant difference in the free energy of adhesion and are therefore more or less likely to form aggregates and ultimately agglomerates [23,24]. The different facets also showed differences in hydrophilicity. The more hydrophobic sides are also the sides with the higher free energy of adhesion. These sides tend to turn away from the water and aggregate with other particles. This is attributed by the authors to differences in the amount and orientation of OH groups at the surfaces. The adhering particles at the interface are also observable for a static droplet of suspension for seed crystals used for the suspension experiments and particles taken from the bulk (Figure 9). For the following experiments and evaluations, the particles adhering to the interfaces are not further regarded.
4.3. Results of Step 4 - Conduct Continuous Crystallization Experiments and Modeling
Since the batch crystallization experiments suggested that a higher cooling rate could be targeted without risking wall crystallization due to high local supersaturation, the chosen temperature gradient for the continuous crystallization experiments were set to maximum possible at the specific ambient temperatures. To grant comparability with previous experiments with the substance system Ala/H2O [13,15] and the batch experiments conducted before (section 4.2) the starting temperature was set to 50 °C for Arg/H2O and APAP/H2O and to 40 °C for Met/H2O. To evaluate the influence of the suspension state on the crystallization, especially on the agglomeration behavior, one operating point with a sufficiently homogeneous suspension state is chosen and one without. Considering the insights gained through the suspension experiments, total volume flow rates of = 20 mL min-1 and = 40 mL min-1 are chosen. The liquid hold-up is kept constant at = 0.5 and the amount of seed crystals remains at = 0.01 gsolid gsolution-1. The process parameters for the respective experiments are shown in Table S1. Images of slugs with the obtained solid loadings during the crystallization process at the end of tubing are shown in Figure 10.
The crystallization experiments were successfully obtained for the substance systems Arg/H2O and APAP/H2O, resulting in convex slugs and a narrow SLD. For the substance system Met/H2O no steady-state operation could be set up, as wall crystallization occurred very quickly along the entire tubing leading to a wall film and concave slugs. As a result, the seed mass, which was previously suspended in the slug, is lost through communicating slugs. Accordingly, a narrow RTD of the particles is not guaranteed. However, the few particles still present in the slug (more difficult to recognize due to the needle shape) are well suspended and grow quickly. Videos of the slugs during the crystallization experiment are attached to the supporting information. Furthermore, the supersaturation is reduced with a delay, so that the apparatus clogged especially at the end of the tubing (Figure S3). Hence, no valid data could be determined regarding the concentrations and PSD for Met/H2O at the end of the tubing. Therefore, the process conditions for this material system should be selected differently.
The results of the concentration samples taken during the continuous crystallization experiments with Arg/H2O and APAP/H2O are shown in Figure 11. The start and end concentrations for the continuous crystallization experiments are in the same order of magnitude like the batch experiments. This indicates that the continuous crystallization in the SFC allows similar supersaturation degradation than in the batch cooling crystallization despite shorter RTs and higher cooling rates. The relative yields are also in the same range.
For both substance systems, agglomerated/aggregated particles were observed for the non-homogeneously suspended state, but also for the homogeneously suspended state inside the slugs. For Arg/H2O, this can be explained by the high solid content in the slug of up to 0.26 gsolid gsolution-1, resulting in a high probability of agglomeration caused to a lot of collisions and high contact times between particles despite internal circulation inside the slug. For APAP/H2O, the agglomerated/aggregated product particles were expected due to the previously observed accumulation of some particle at the gas-liquid interface. The agglomeration degree is higher at a lower volume flow rate than at a higher volume flow rate (qualitatively shown in Figure 12).
Despite the agglomerated product particles crystallization of different substance systems were successfully demonstrated. Therefore, the SFC is able to crystallize all potential chosen solutes fulfilling the requirements of the experimental strategy. In order to achieve high-quality products with a low agglomeration degree regarding the PSD, the next step is to model the various substance systems.
Since crystal growth can now be calculated as dependent on temperature and supersaturation (section 4.2) and the suspension correlation has been validated for the respective substance systems (section 4.3), the model results can be compared with the results of the continuous crystallization consisting of growth and agglomeration inside the SFC. Therefore, the relative yields and the characteristic values of the PSD and are compared (Figure 13). The grey circles represent the results for the characteristic parameters for the substance system Ala/H2O. The agglomeration correlation, which mechanistically links the process conditions and the material properties of the substance system, is based on the results of Ala/H2O [17]. For the substance system Arg/H2O, only growth calculation was possible.
It can be seen that for the substance systems Arg/H2O and APAP/H2O (Figure 13, left) are predicted very well with the SFC model, so that they are close to the parity line. Although only growth was calculated for Arg/H2O, the result for confirms that the agglomeration correlation has only a minor influence on the relative yield and the supersaturation degradation compared to the changes in the characteristic parameters of the PSD. For APAP/H2O, the calculated particle size and its distribution are simulated well as the calculated are similar to the experimental values, and therefore the growth and the agglomeration behavior of the suspended particles are predicted reliably, resulting in data points within the 20 % deviation mark. This is also reflected in the particle size distribution (Figure 14 right, blue). The measured distributions show an increase in the characteristic values compared to the seed crystals for both substance systems, with more agglomeration taking place at a lower volume flow rate caused by the less suspended particles, which can be recognized by the tailing at bigger particle sizes.
For Arg/H2O, the lies near the parity line and the values are underestimated caused by the neglected agglomeration calculation (Figure 13). Furthermore, smaller particles occur, which is not simulated by the model. This can be indicated in Figure 12, for example, where the edges of the particles are rounded and some smaller particles are observed next to the large particles. This indicates that abrasion and breakage occur in the course of the experimental setup. However, this phenomenon is not calculated by the model, so there may be deviations in the calculation of the PSD. Furthermore, a high mass fraction was observed in the slugs leading to many particle interactions, causing abrasion or, in case of long contact times, agglomeration.
5. Conclusions
A shift in processing methods is experienced in the pharmaceutical industry for small-scale production (250 - 1000 kg a-1). Therefore, an increasing emphasis on continuous production research is targeted. While various concepts have been developed for small-scale crystallization for high-quality product manufacturing, further optimization is essential to improve the industrial applicability of these approaches.
This study aims to showcase the practical application of the Slug Flow Crystallizer (SFC) in the pharmaceutical sector by expanding its utilization to a broader range of substance systems to demonstrate the suitability for small-scale API production. Since the crystallization of a new substance system in the SFC and the prediction of the crystallization behavior are very material-, energy- and time-consuming, a structured strategy is presented so that only few experiments are needed for optimal crystallization conditions in the SFC. Therefore, batch experiments were carried out to observe the crystallization behavior of the respective material system or the supersaturation degradation and to regress the growth rate parameters for modeling. Furthermore, the suspension correlation [16] was used to estimate the minimum required total volume flow rate and validated for the new substance systems. Based on this, successful continuous crystallization experiments were carried out for Arg/H2O and APAP/H2O. The transfer of the model to the new substance systems was carried out, in which the relative yield in the crystallization process can be predicted very reliably for all modeled substance systems. The modeling of the PSD was also successfully predicted for the APAP/H2O substance system. For Arg/H2O, however, due to the phenomena of abrasion and breakage occurring in the experiments but not implemented in the model, the PSD could not be predicted reliably. Therefore, the model should be extended in the future in order to be able to use all substance systems, especially the substance systems with high solids content that are attractive for cooling crystallization. For the substance system Met/H2O, however, the data situation for the temperature-dependent substance system parameters was too uncertain, so that this substance system was not modeled in the framework of this work. Furthermore, wall crystallization and clogging of the apparatus was observed during the experiments. This is due to the fact that the operating parameters were not selected appropriately and stable slug flow should be validated according to the strategy but with the static contact measurements at the temperature that is intended for the crystallization experiment. The batch results showed that the supersaturation is degraded more slowly than for the Arg/H2O and APAP/H2O substance systems, which was confirmed in the continuous experiments. Accordingly, experiments with other operating parameters must first be carried out before the model can be adapted to Met/H2O.
By employing the approach delineated in this publication, novel substance systems were efficiently integrated and simulated within the SFC. This method facilitated a swift and resource-effective implementation, allowing for the rapid acquisition of insights into the crystallization behavior of diverse substance systems. Consequently, the continuous crystallizer can be optimized for long-term operation with a minimal number of experiments, ensuring the production of high-quality products promptly.
Supplementary Materials
The following supporting information can be downloaded at the website of this paper posted on Preprints.org.
Author Contributions
Conceptualization, A.C.K. and K.W.; methodology, A.C.K.; investigation, A.C.K. and S.Z.; writing—original draft preparation, A.C.K.; writing—review and editing, K.W.; visualization, A.C.K. and S.Z.; supervision, K.W.; All authors have read and agreed to the published version of the manuscript.
Funding
Our research receives funding by the German Research Foundation (Deutsche Forschungsgemeinschaft—DFG) in the framework of the Priority Programme SPP 2364—Project No. 504676854.
Data Availability Statement
Data is contained within the article or supplementary material.
Acknowledgments
We acknowledge financial support by Deutsche Forschungsgemeinschaft and Technische Universität Dortmund/TU Dortmund University within the funding programme Open Access Costs.
Conflicts of Interest
The authors declare no conflict of interest. The funders had no role in the design of the study; in the collection, analyses, or interpretation of data; in the writing of the manuscript; or in the decision to publish the results.
| Abbreviations | |
| Ala | l-Alanine |
| ALD | Axis length distribution |
| APAP | Acetaminophen/paracetamol |
| API | Active pharmaceutical ingredient |
| Arg | l-Arginine |
| FEP | Fluorinated-ethylene-propylene |
| H2O | Water |
| MAL | Major axis length |
| MALch | Characteristic major axis length |
| Met | Metformin hydrochloride |
| MIL | Minor axis length |
| MILch | Characteristic minor axis length |
| PSD | Particle size distribution |
| RTD | Residence time distribution |
| SFC | Slug flow crystallizer |
| SLD | Slug length distribution |
| STY | Space-time yield |
| Latin Symbols | |
| A | Factor in growth rate equation/m s-1 |
| B | Factor in growth rate eqaution/- |
| Concentration/g g−1 | |
| Saturation concentration/g g−1 | |
| Ca | Capillary number/- |
| d | Diameter/m |
| Modified Froude number | |
| G | Growth rate/m s-1 |
| L | Characteristic length/m |
| Normalized length of circulation zone/- | |
| m | Mass/kg |
| n | Stirrer speed/rpm |
| Q | Volume flow rate/mL min−1 |
| Q3 | Cumulative distribution function/- |
| S | Supersaturation level/- |
| V | Volume/m-3 |
| w | Mass fraction/- |
| Y | Yield/% |
| Greek Symbols | |
| ε | Liquid hold-up/- |
| Three-phase contact angle/° | |
| Temperature/°C | |
| Cooling rate/K min-1 | |
| Residence time/s | |
| Relative supersaturation/- | |
| χ | Goodness of suspension/- |
| Indices | |
| 0 | Initial state |
| 10 | 10 % of the distribution |
| 50 | Median |
| 90 | 90 % of the distribution |
| 90-10 | Width of distribution |
| Saturation | |
| Ala | l-alanine |
| amb | Ambient temperature |
| Arg | l-arginine |
| BCF | Burton, Cabrera and Frank |
| BCF,mod | Modified Burton, Cabrera and Frank |
| dry | Dry solid |
| empty | Empty vessel |
| eq | Equivalent |
| H | Horizontal |
| Inner | |
| L | Liquid |
| Met | Metformin hydrochloride |
| rel | relative |
| SFC,end | Outlet of the SFC |
| SFC,start | Inlet of the SFC |
| slug | Slug |
| solid | Solid phase |
| solution | Solution (liquid phase) |
| stat | static |
| tot | total |
| tubing | Tubing |
| v | vertical |
References
- T. Wang, H. Lu, J. Wang, Y. Xiao, Y. Zhou, Y. Bao, H. Hao, Recent progress of continuous crystallization, Journal of Industrial and Engineering Chemistry 54 (2017) 14–29. [CrossRef]
- Y. Ma, S. Wu, E.G.J. Macaringue, T. Zhang, J. Gong, J. Wang, Recent Progress in Continuous Crystallization of Pharmaceutical Products: Precise Preparation and Control, Org. Process Res. Dev. 24 (2020) 1785–1801. [CrossRef]
- A.S. Myerson, D. Erdemir, A.Y. Lee, Handbook of Industrial Crystallization, Cambridge University Press, 2019.
- A. Mersmann, Crystallization Technology Handbook, CRC Press, 2001.
- A. Lewis, M. Seckler, H. Kramer, G. van Rosmalen, Industrial Crystallization, Cambridge University Press, 2015.
- J.W. Mullin, Industrial Crystallization, Springer US, Boston, MA, 1976.
- Advances in Industrial Crystallization, MDPI, 2021.
- B. Wood, K.P. Girard, C.S. Polster, D.M. Croker, Progress to Date in the Design and Operation of Continuous Crystallization Processes for Pharmaceutical Applications, Org. Process Res. Dev. 23 (2019) 122–144. [CrossRef]
- Z.K. Nagy, N. Yazdanpanah (Eds.), The Handbook of Continuous Crystallization, Royal Society of Chemistry, 2020.
- M.L. Rasche, M. Jiang, R.D. Braatz, Mathematical modeling and optimal design of multi-stage slug-flow crystallization, Computers & Chemical Engineering 95 (2016) 240–248. [CrossRef]
- M. Jiang, Z. Zhu, E. Jimenez, C.D. Papageorgiou, J. Waetzig, A. Hardy, M. Langston, R.D. Braatz, Continuous-Flow Tubular Crystallization in Slugs Spontaneously Induced by Hydrodynamics, Crystal Growth & Design 14 (2014) 851–860. [CrossRef]
- M. Termühlen, B. Strakeljahn, G. Schembecker, K. Wohlgemuth, Characterization of slug formation towards the performance of air-liquid segmented flow, Chemical Engineering Science 207 (2019) 1288–1298. [CrossRef]
- M. Termühlen, M.M. Etmanski, I. Kryschewski, A.C. Kufner, G. Schembecker, K. Wohlgemuth, Continuous slug flow crystallization: Impact of design and operating parameters on product quality, Chemical Engineering Research and Design 170 (2021) 290–303. [CrossRef]
- M. Termühlen, B. Strakeljahn, G. Schembecker, K. Wohlgemuth, Quantification and evaluation of operating parameters’ effect on suspension behavior for slug flow crystallization, Chemical Engineering Science 243 (2021) 116771. [CrossRef]
- C. Steenweg, A.C. Kufner, J. Habicht, K. Wohlgemuth, Towards Continuous Primary Manufacturing Processes—Particle Design through Combined Crystallization and Particle Isolation, Processes 9 (2021) 2187. [CrossRef]
- A.C. Kufner, N. Westkämper, H. Bettin, K. Wohlgemuth, Prediction of Particle Suspension State for Various Particle Shapes Used in Slug Flow Crystallization, ChemEngineering 7 (2023) 34. [CrossRef]
- A.C. Kufner, M. Rix, K. Wohlgemuth, Modeling of Continuous Slug Flow Cooling Crystallization towards Pharmaceutical Applications, Processes 11 (2023) 2637. [CrossRef]
- A.C. Kufner, A. Krummnow, A. Danzer, K. Wohlgemuth, Strategy for Fast Decision on Material System Suitability for Continuous Crystallization Inside a Slug Flow Crystallizer, Micromachines 13 (2022). [CrossRef]
- S. Heisel, J. Ernst, A. Emshoff, G. Schembecker, K. Wohlgemuth, Shape-independent particle classification for discrimination of single crystals and agglomerates, Powder Technology 345 (2019) 425–437. [CrossRef]
- S. Heisel, M. Rolfes, K. Wohlgemuth, Discrimination between Single Crystals and Agglomerates during the Crystallization Process, Chem Eng & Technol 41 (2018) 1218–1225. [CrossRef]
- C. Steenweg, J. Habicht, K. Wohlgemuth, Continuous Isolation of Particles with Varying Aspect Ratios up to Thin Needles Achieving Free-Flowing Products, Crystals 12 (2022) 137. [CrossRef]
- W.K. Burton, N. Cabrera, F.C. Frank, The growth of crystals and the equilibrium structure of their surfaces, Phil. Trans. R. Soc. Lond. A 243 (1951) 299–358. [CrossRef]
- J.Y.Y. Heng, A. Bismarck, A.F. Lee, K. Wilson, D.R. Williams, Anisotropic surface energetics and wettability of macroscopic form I paracetamol crystals, Langmuir the ACS journal of surfaces and colloids 22 (2006) 2760–2769. [CrossRef]
- J.Y.Y. Heng, A. Bismarck, D.R. Williams, Anisotropic surface chemistry of crystalline pharmaceutical solids, AAPS PharmSciTech 7 (2006) 84. [CrossRef]
Figure 1.
Solubility curves of l-arginine (red), paracetamol (blue), metformin hydrochloride (orange) compared to l-alanine (black) in water. The lines represent the regression curves, whereas the symbols display the measured concentrations. The seed crystals used are shown on the right for l-arginine (top), paracetamol (middle) and metformin hydrochloride (bottom).
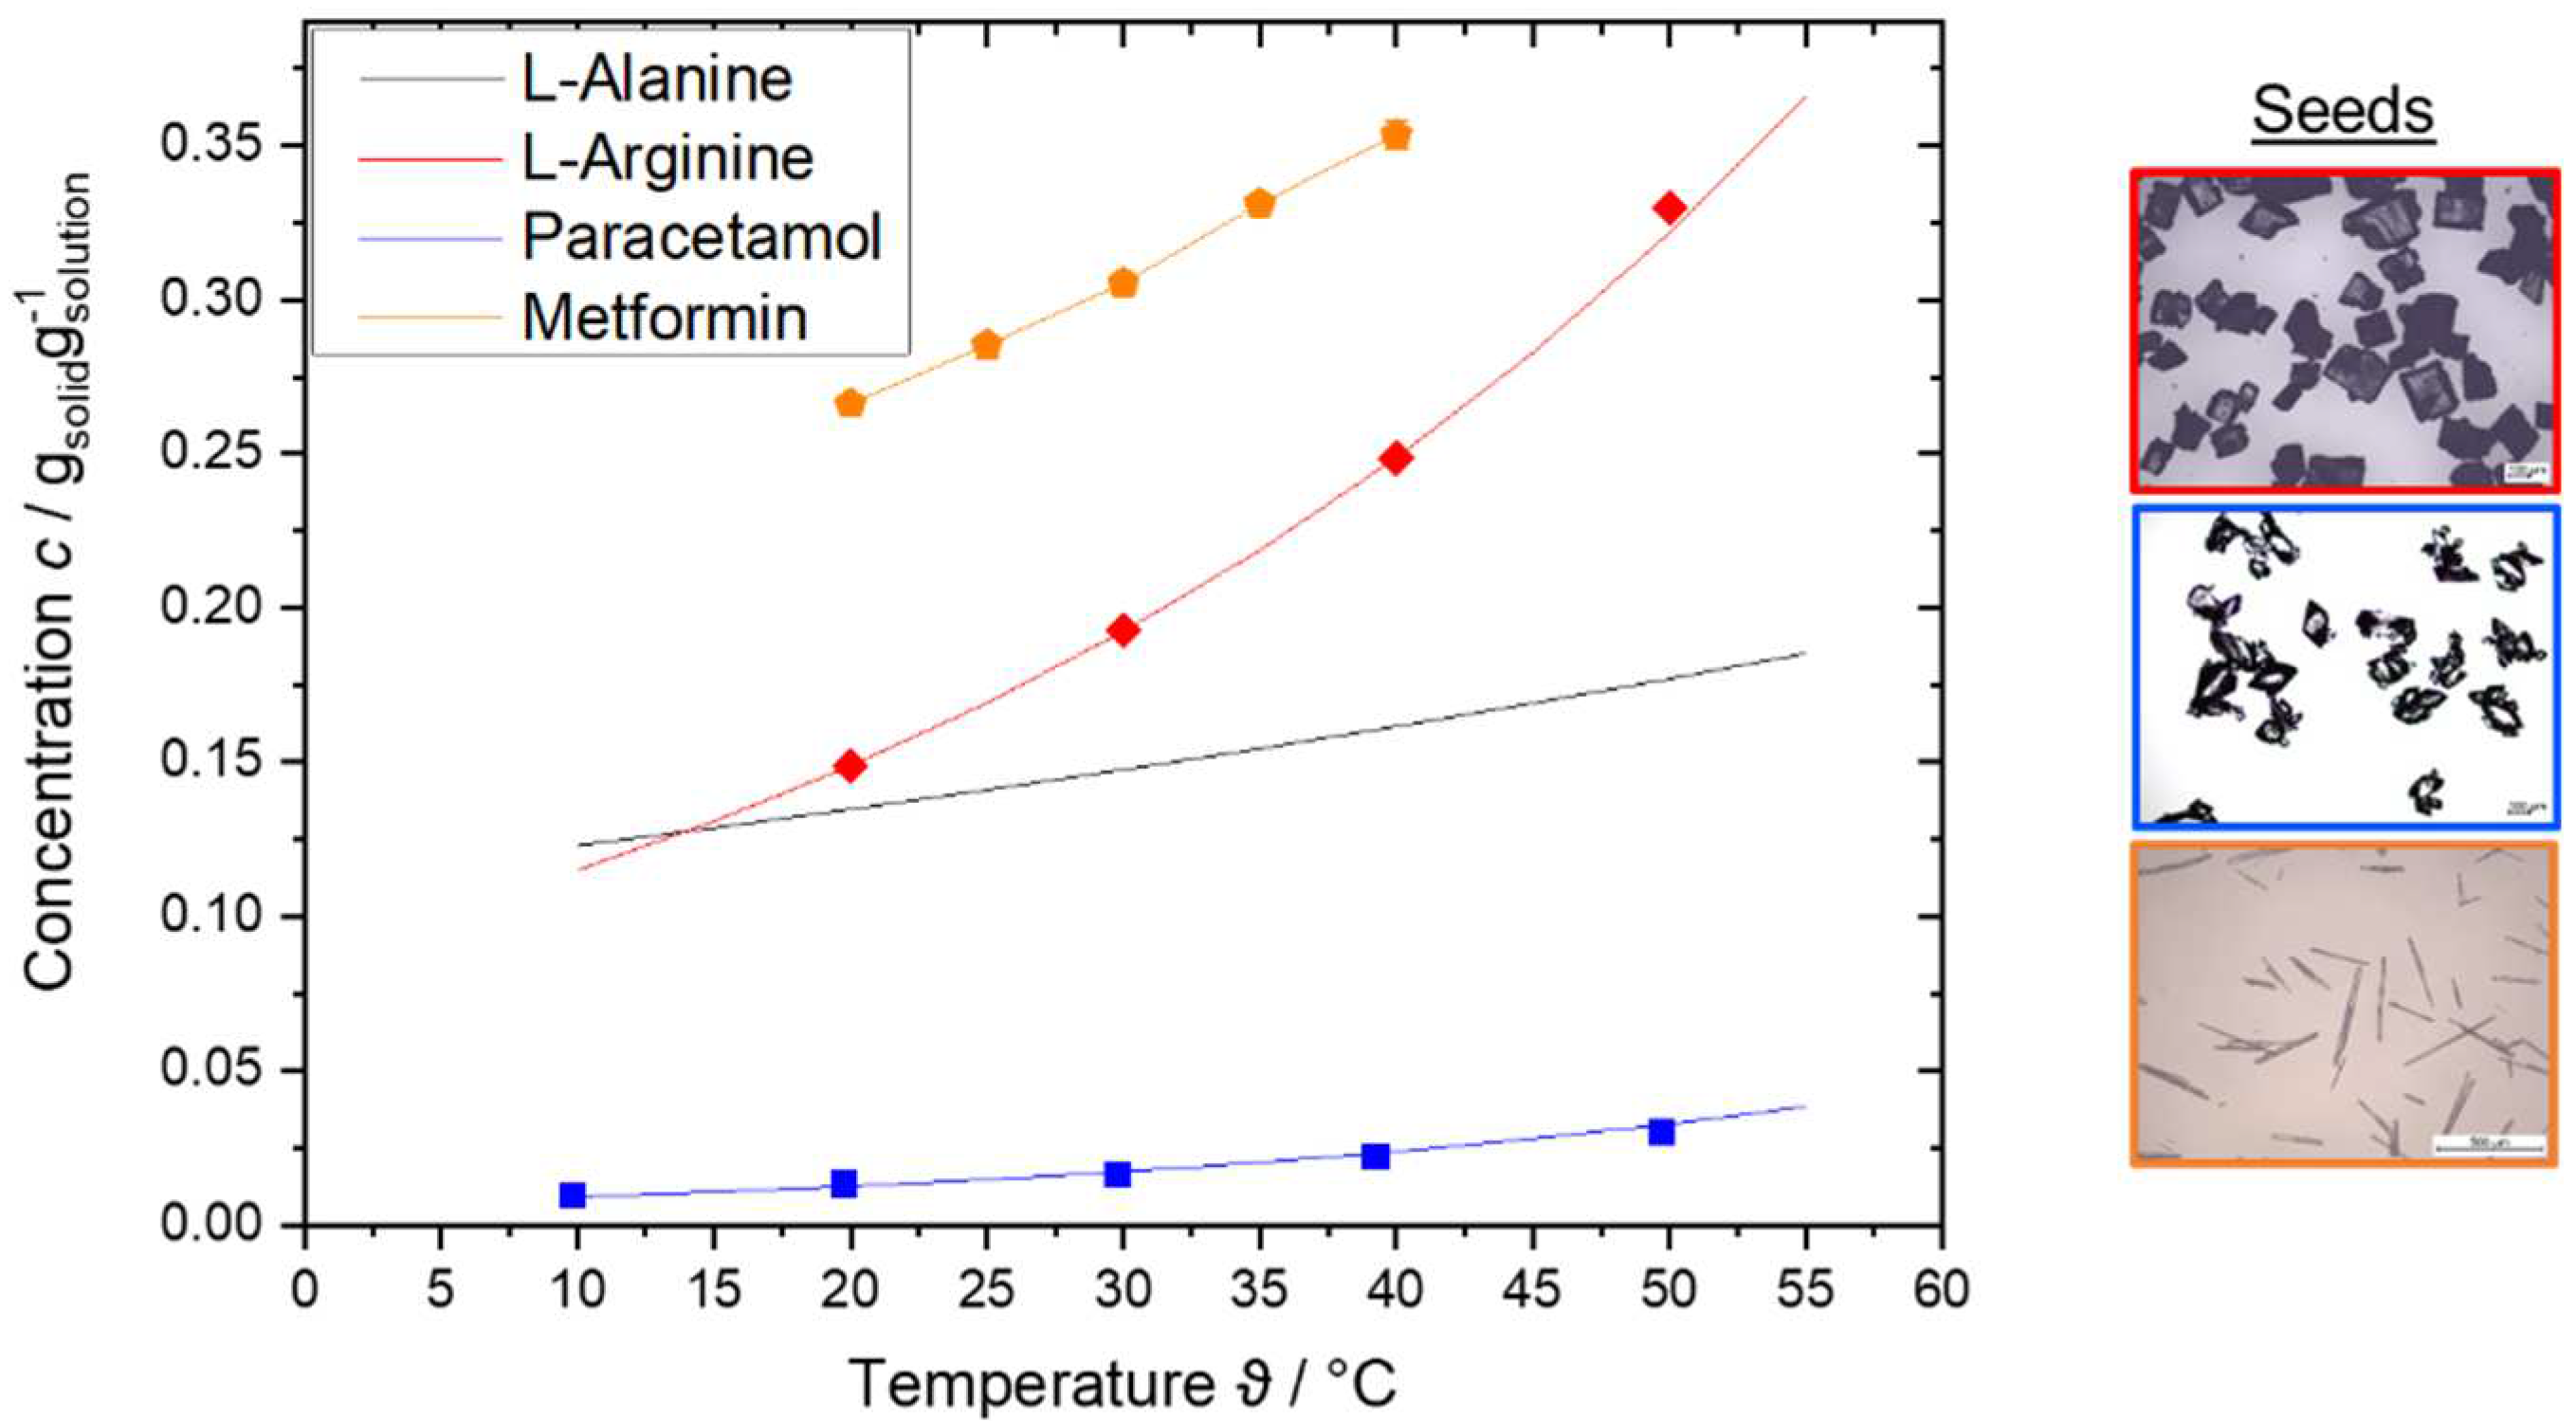
Figure 2.
Strategy based on the experimental [18] and model-based [17] approaches to enable slug flow crystallization for a new substance system with minimal number of experiments.
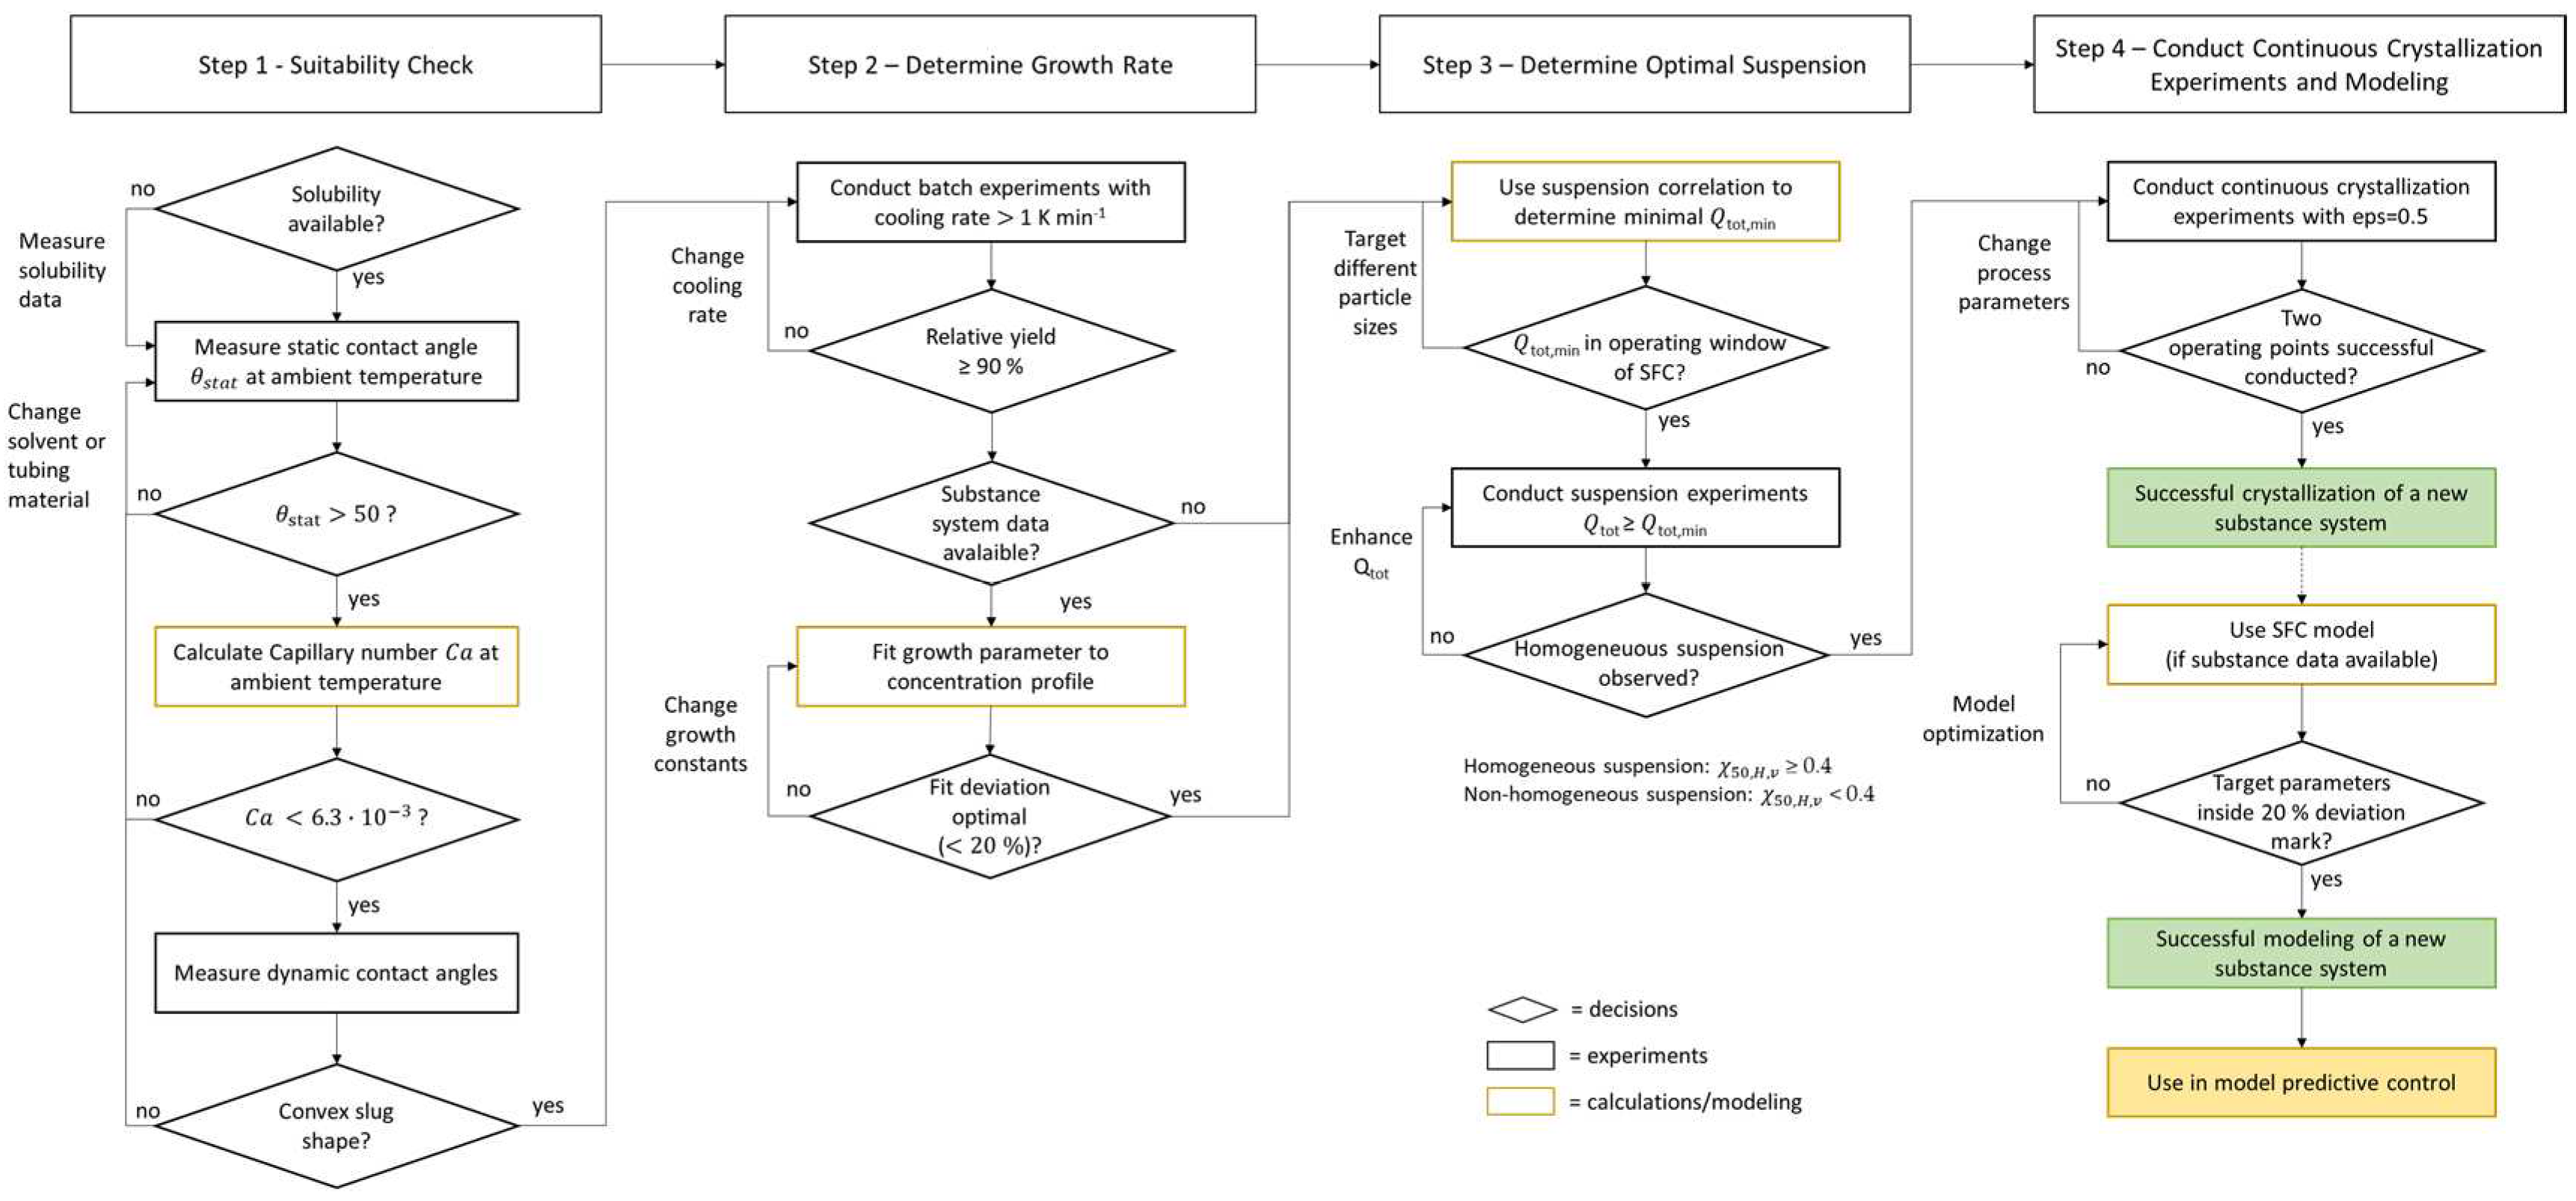
Figure 3.
Experimental setup for the suspension and continuous crystallization experiments using the SFC.
Figure 3.
Experimental setup for the suspension and continuous crystallization experiments using the SFC.
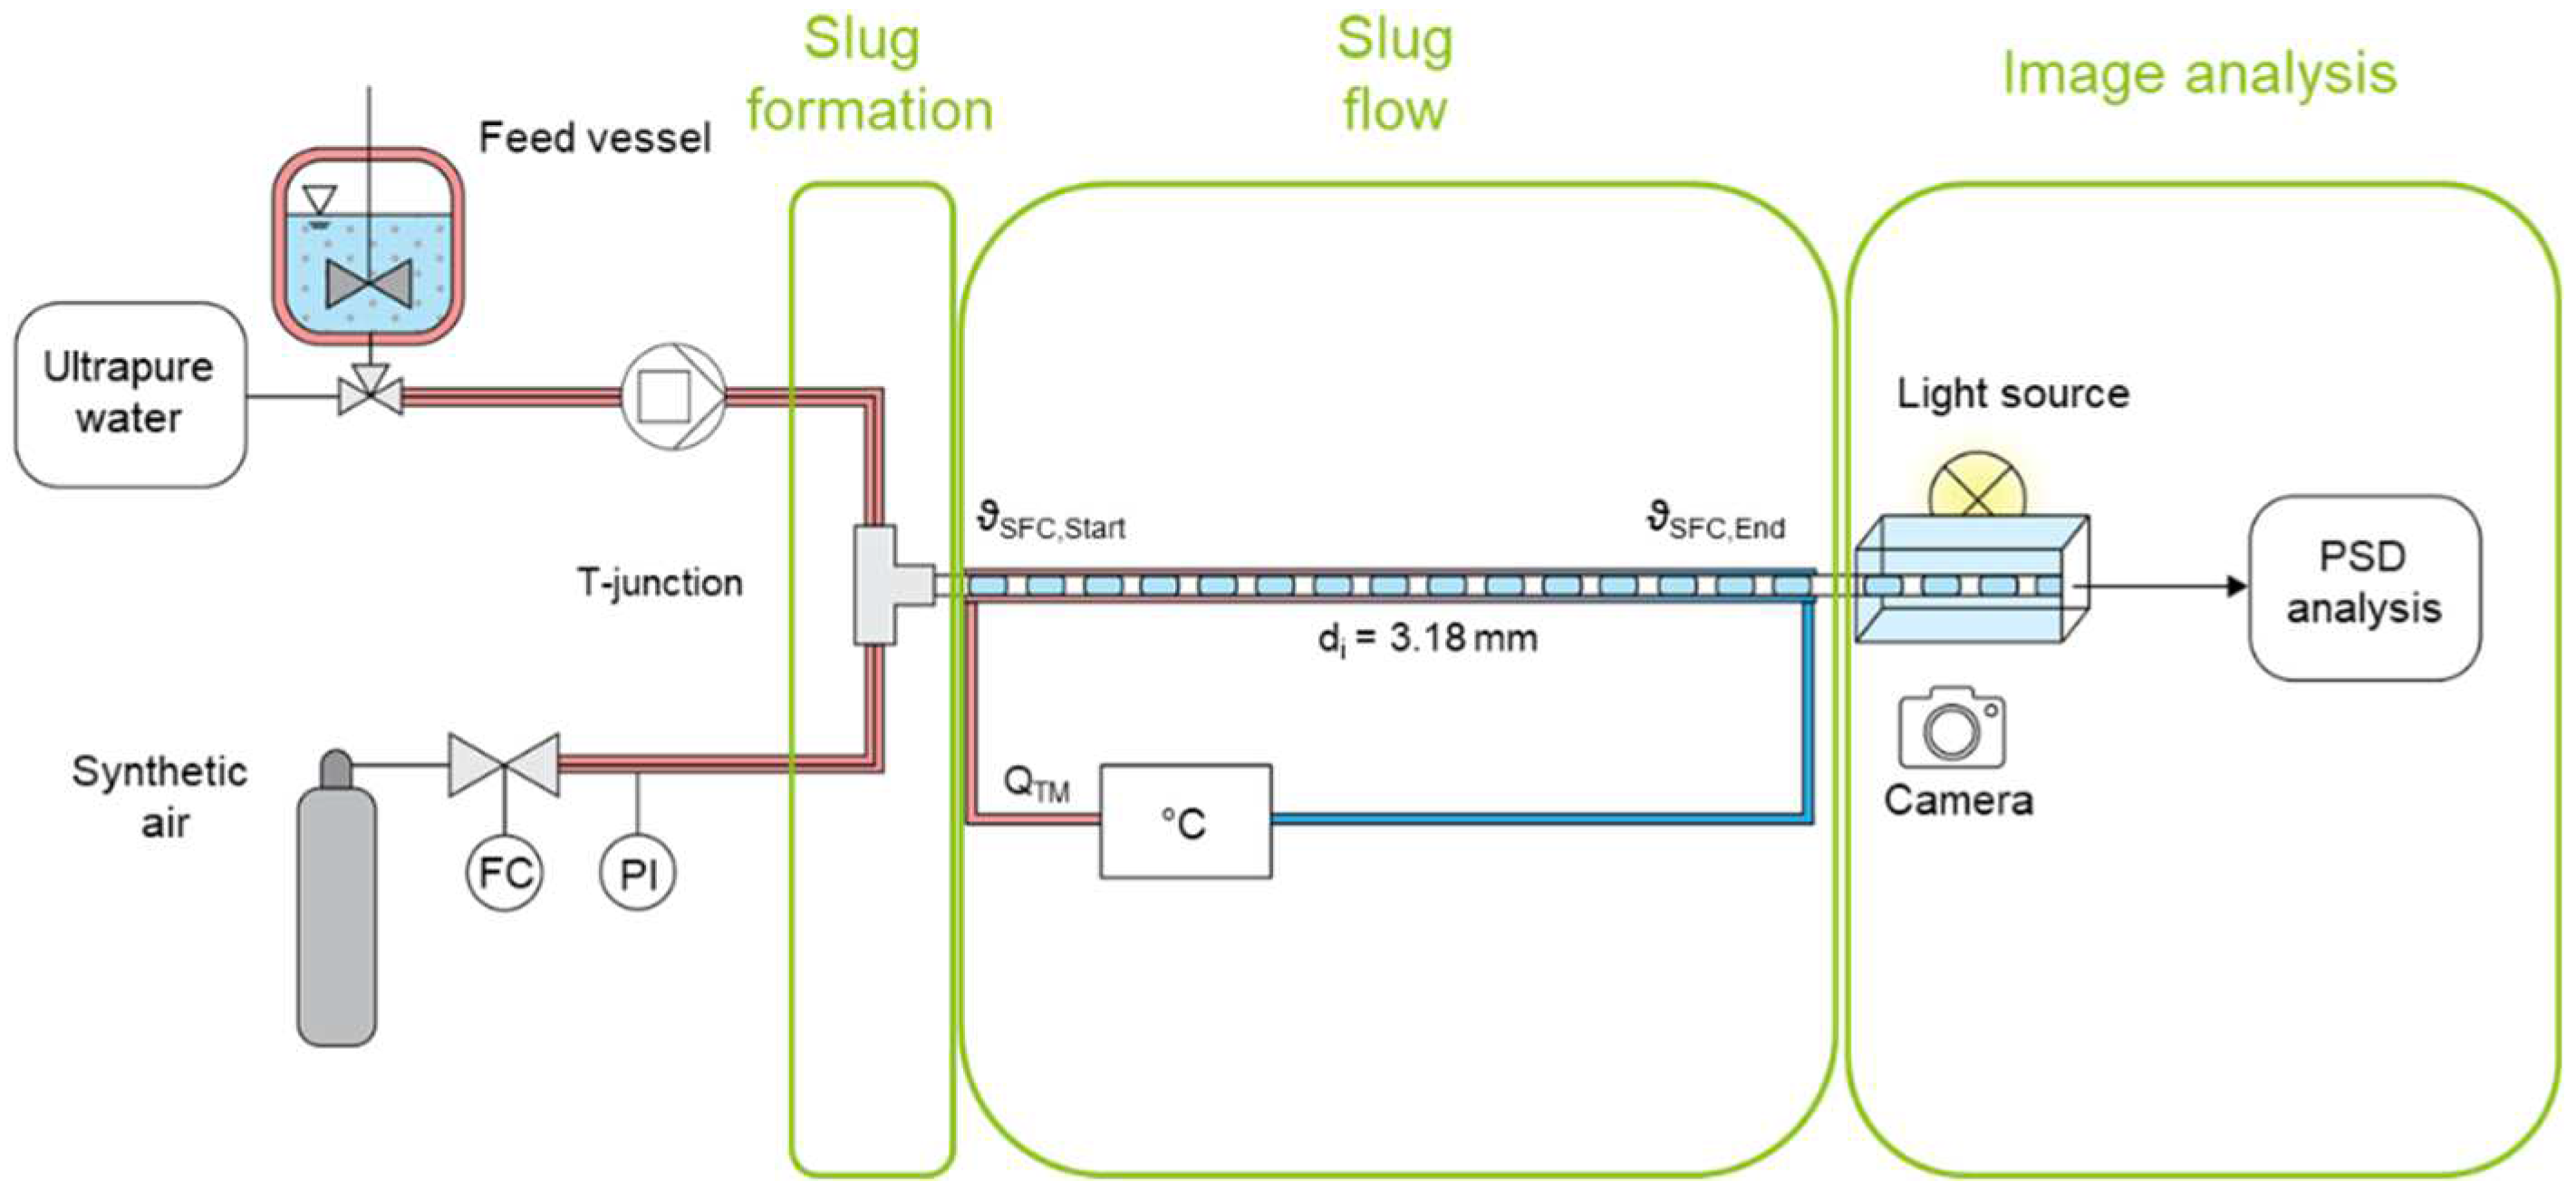
Figure 4.
Concentration profiles during batch experiments with varying cooling rate for the substance systems Arg/H2O (red), Met/H2O (orange), and APAP/H2O (blue). Please note that the solubility for the latter is an order of magnitude lower than the others, see also Figure 1. The solid lines represent the solubility curves according to equations 1-3.
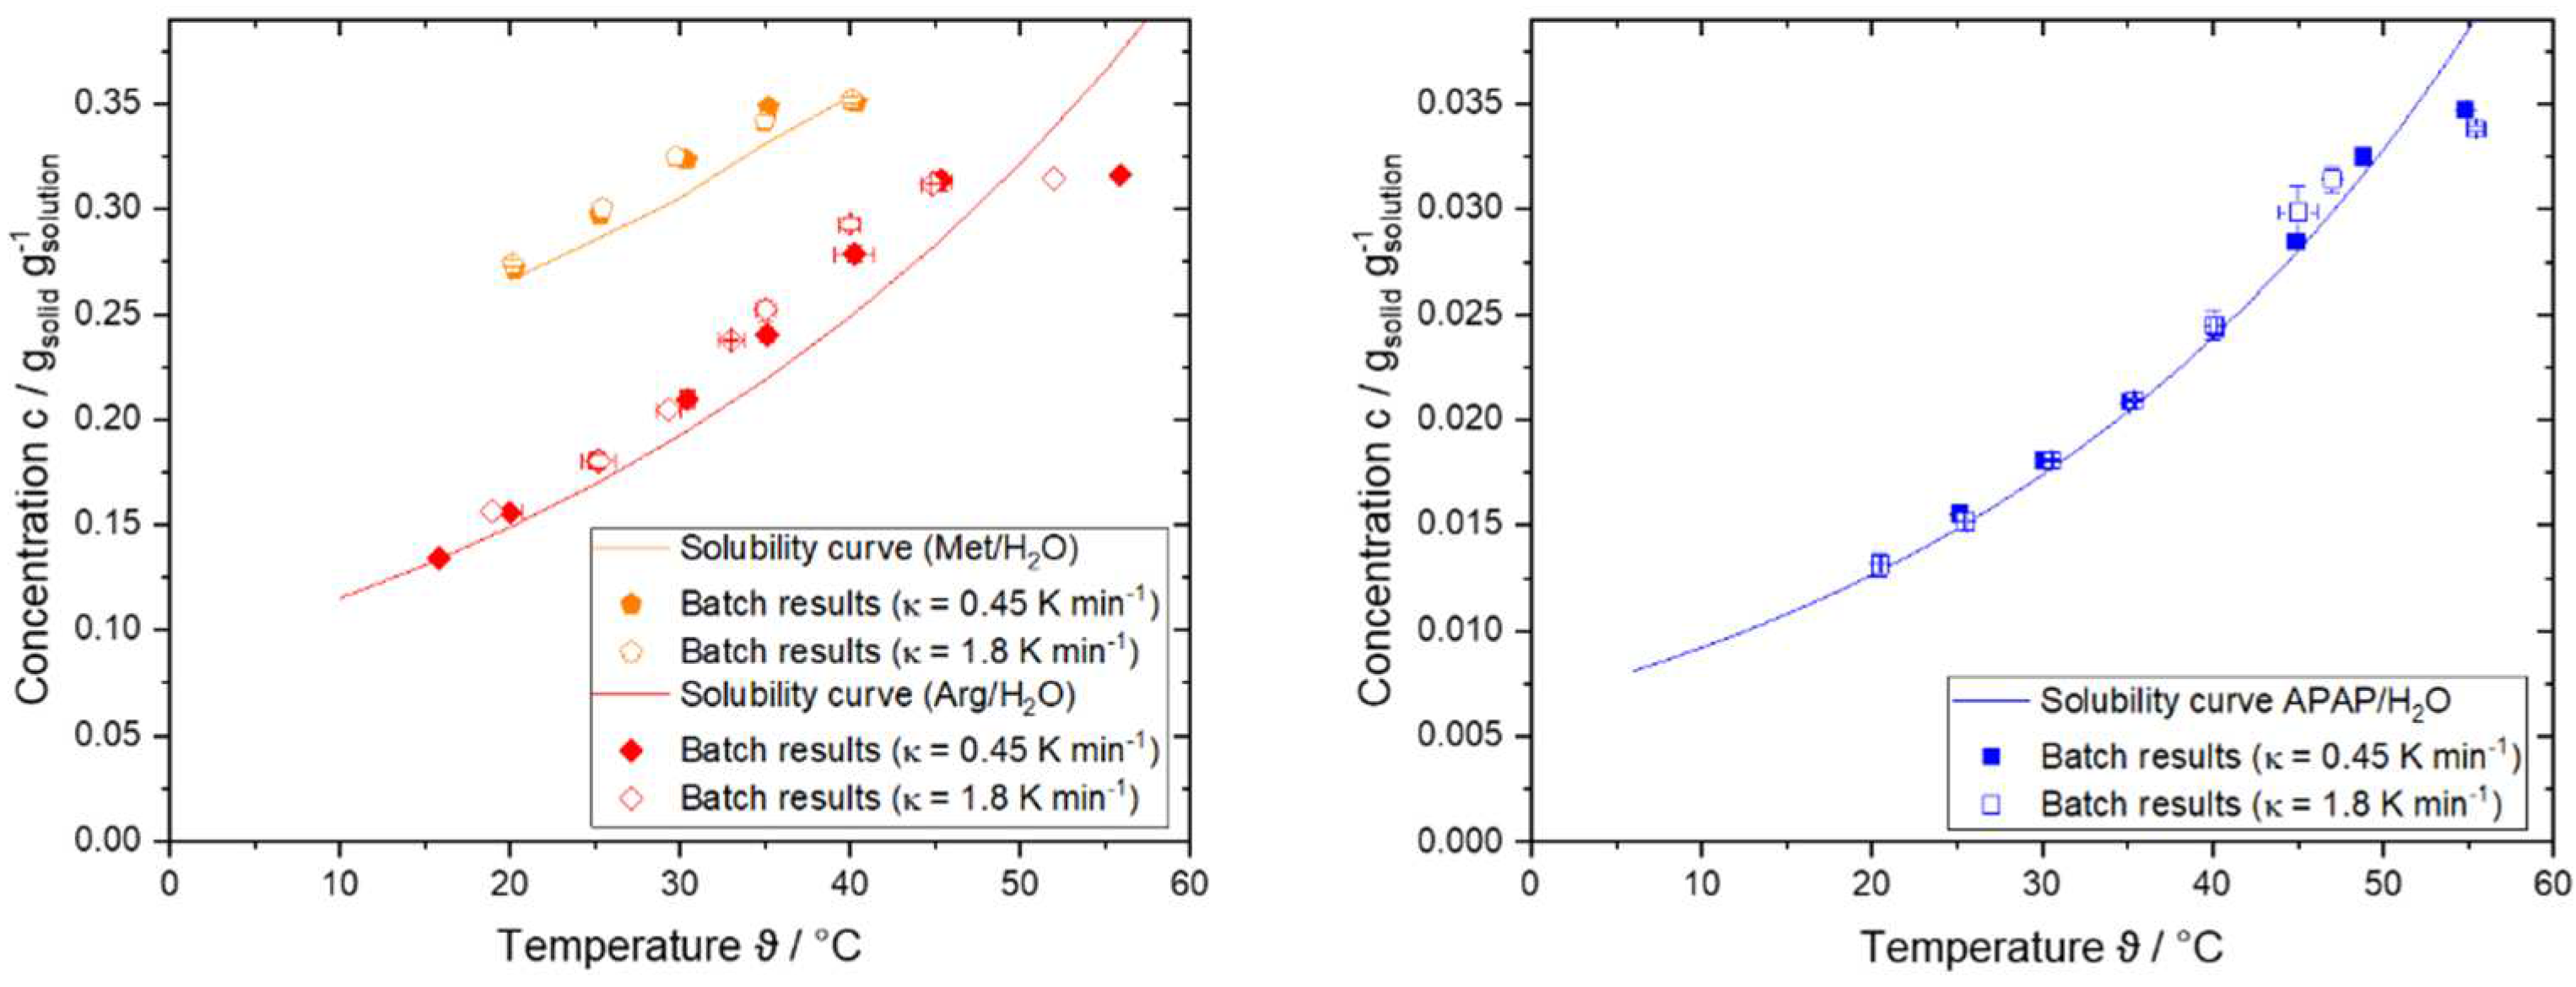
Figure 5.
Results of the regressed growth constants and the resulting concentration profiles to describe growth behavior of Arg/H2O (left, red) and APAP/H2O (right, blue). The used growth model and fitted parameters are displayed.
Figure 5.
Results of the regressed growth constants and the resulting concentration profiles to describe growth behavior of Arg/H2O (left, red) and APAP/H2O (right, blue). The used growth model and fitted parameters are displayed.
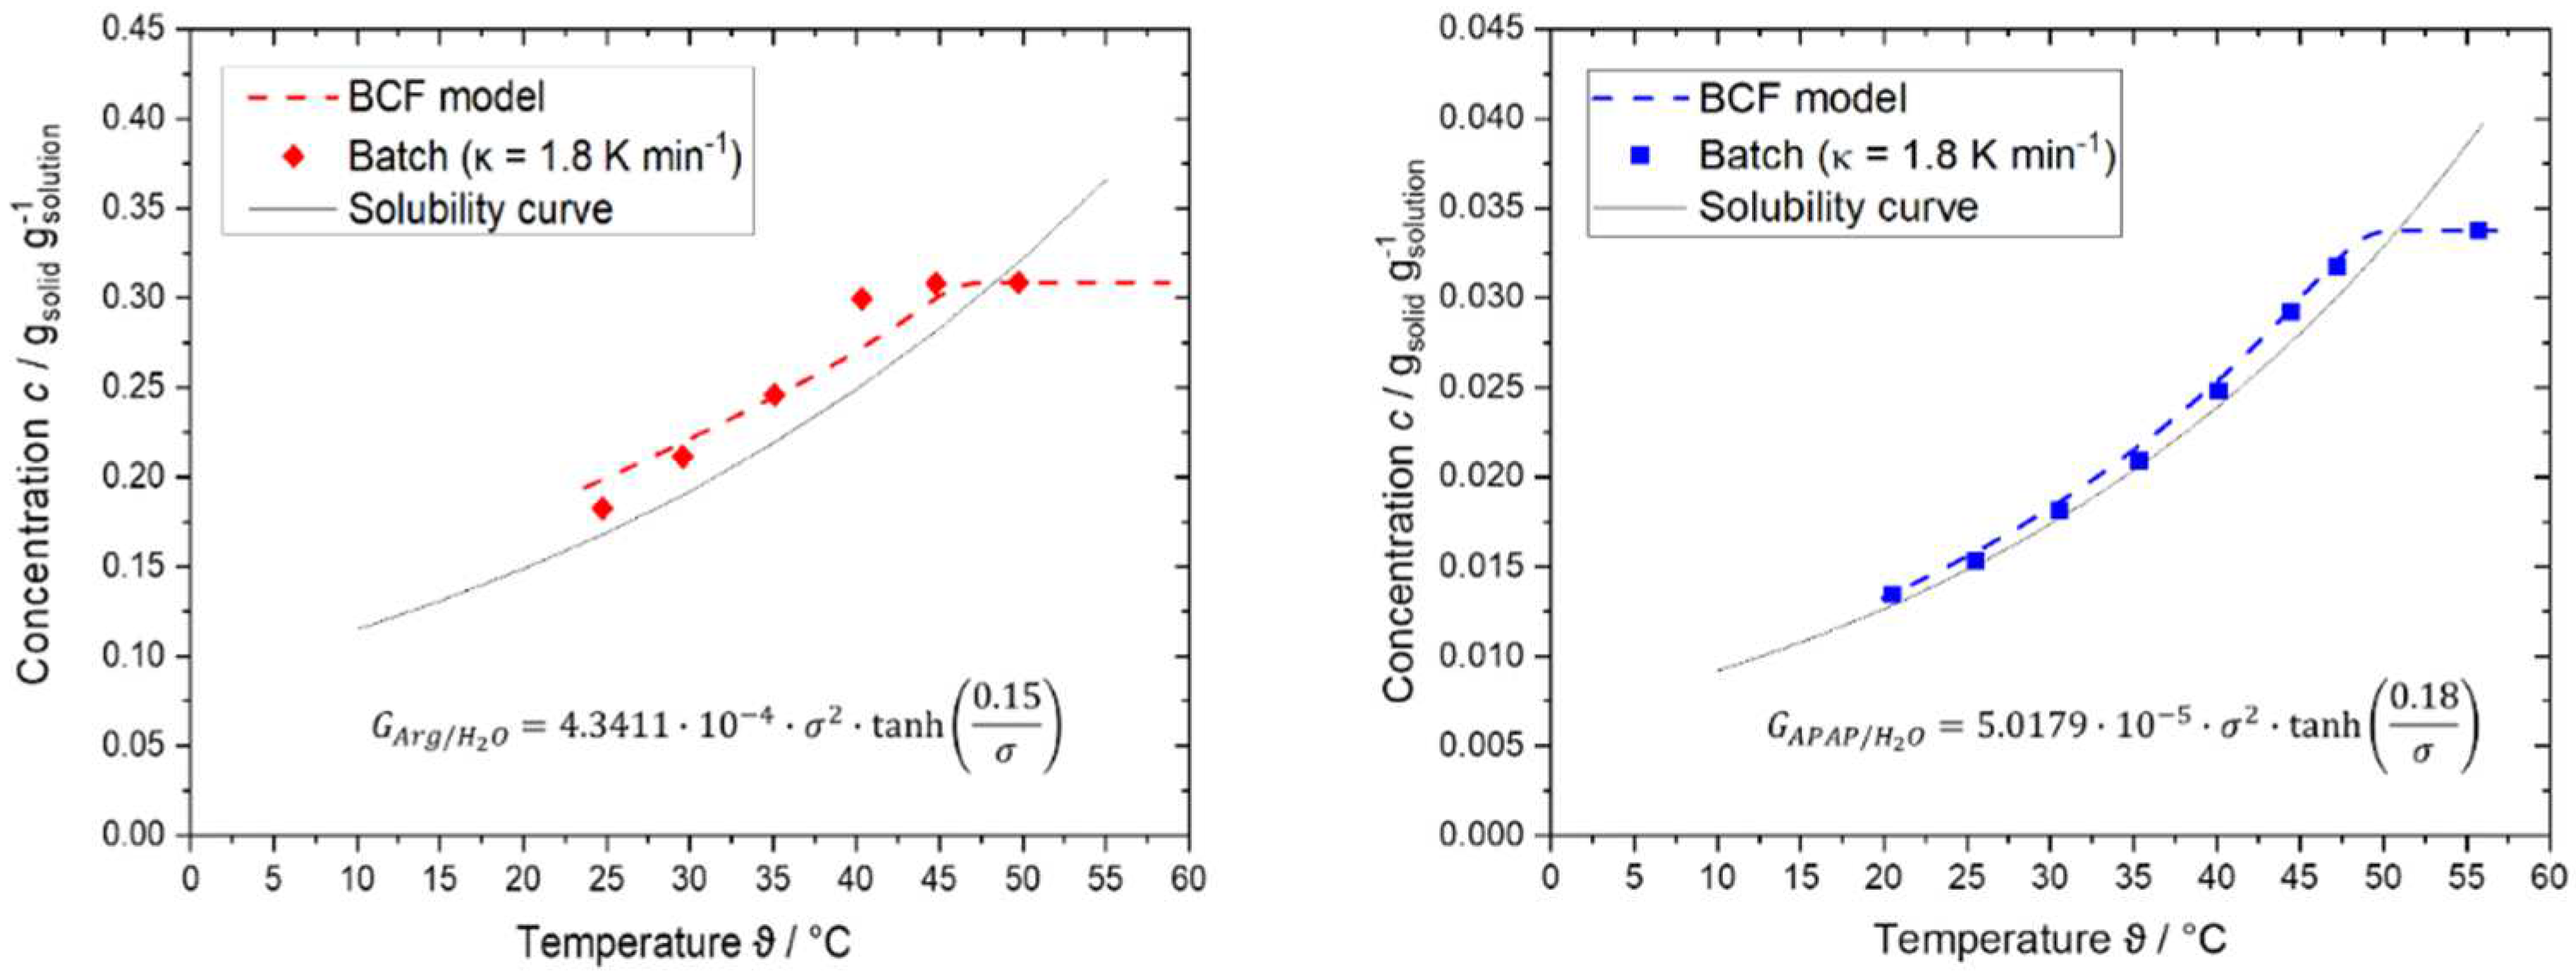
Figure 7.
Particle suspension inside the slugs in dependence of total volume flow rate during the suspension experiments with Arg/H2O (left, red), APAP/H2O (middle, blue) and Met/H2O (right, orange). The seed loading = 0.01 gsolid gsolution-1 and liquid hold-up = 0.5 were held constant.
Figure 7.
Particle suspension inside the slugs in dependence of total volume flow rate during the suspension experiments with Arg/H2O (left, red), APAP/H2O (middle, blue) and Met/H2O (right, orange). The seed loading = 0.01 gsolid gsolution-1 and liquid hold-up = 0.5 were held constant.
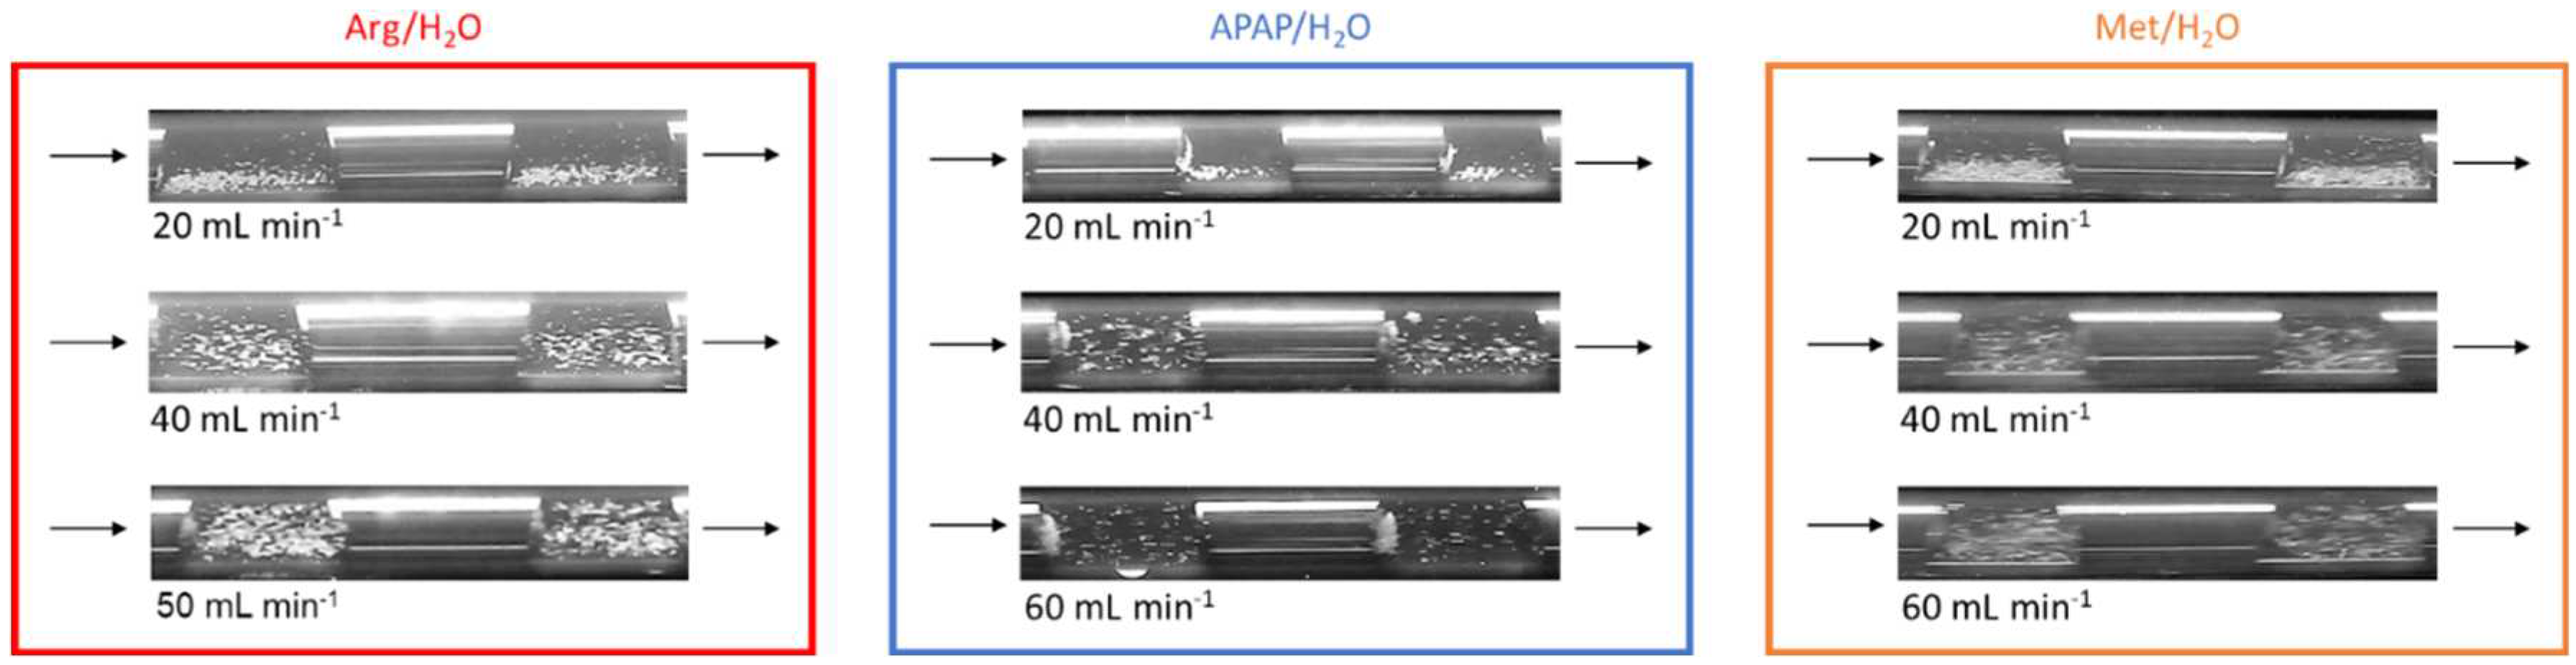
Figure 8.
APAP seed crystals in saturated aqueous solution under the light microscope. It is visible that the smaller facets of the crystals tend to aggregate while the larger surfaces stay free.
Figure 8.
APAP seed crystals in saturated aqueous solution under the light microscope. It is visible that the smaller facets of the crystals tend to aggregate while the larger surfaces stay free.
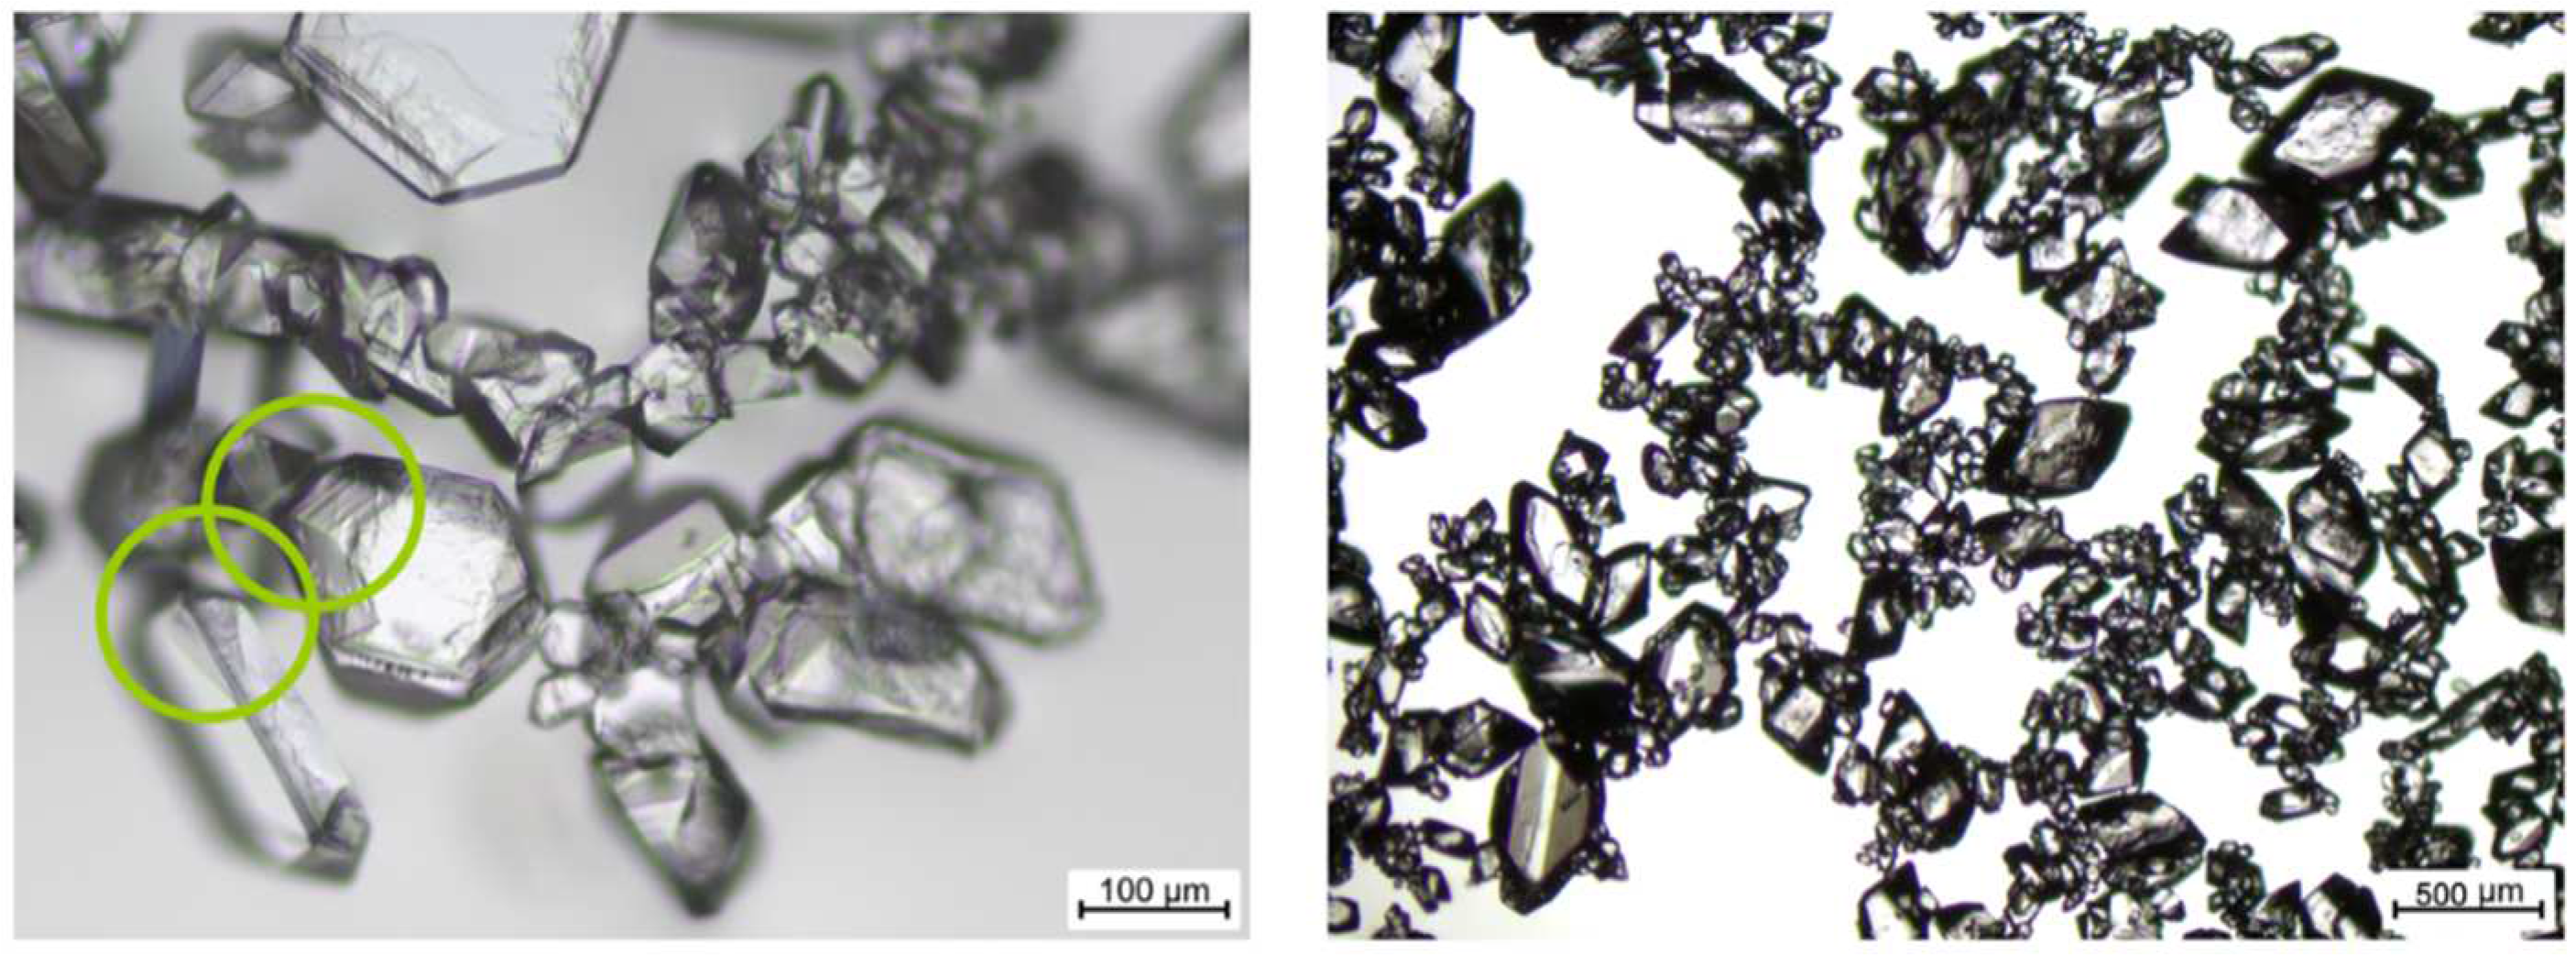
Figure 9.
Images of single droplets of APAP/H2O suspension. It is visible, that the particles adhere to the droplet’s surface. Picture a) shows a suspension of seed crystals used for the suspension experiments in a saturated solution, b) shows milled particles from the bulk originated from the producer suspended in a saturated solution.
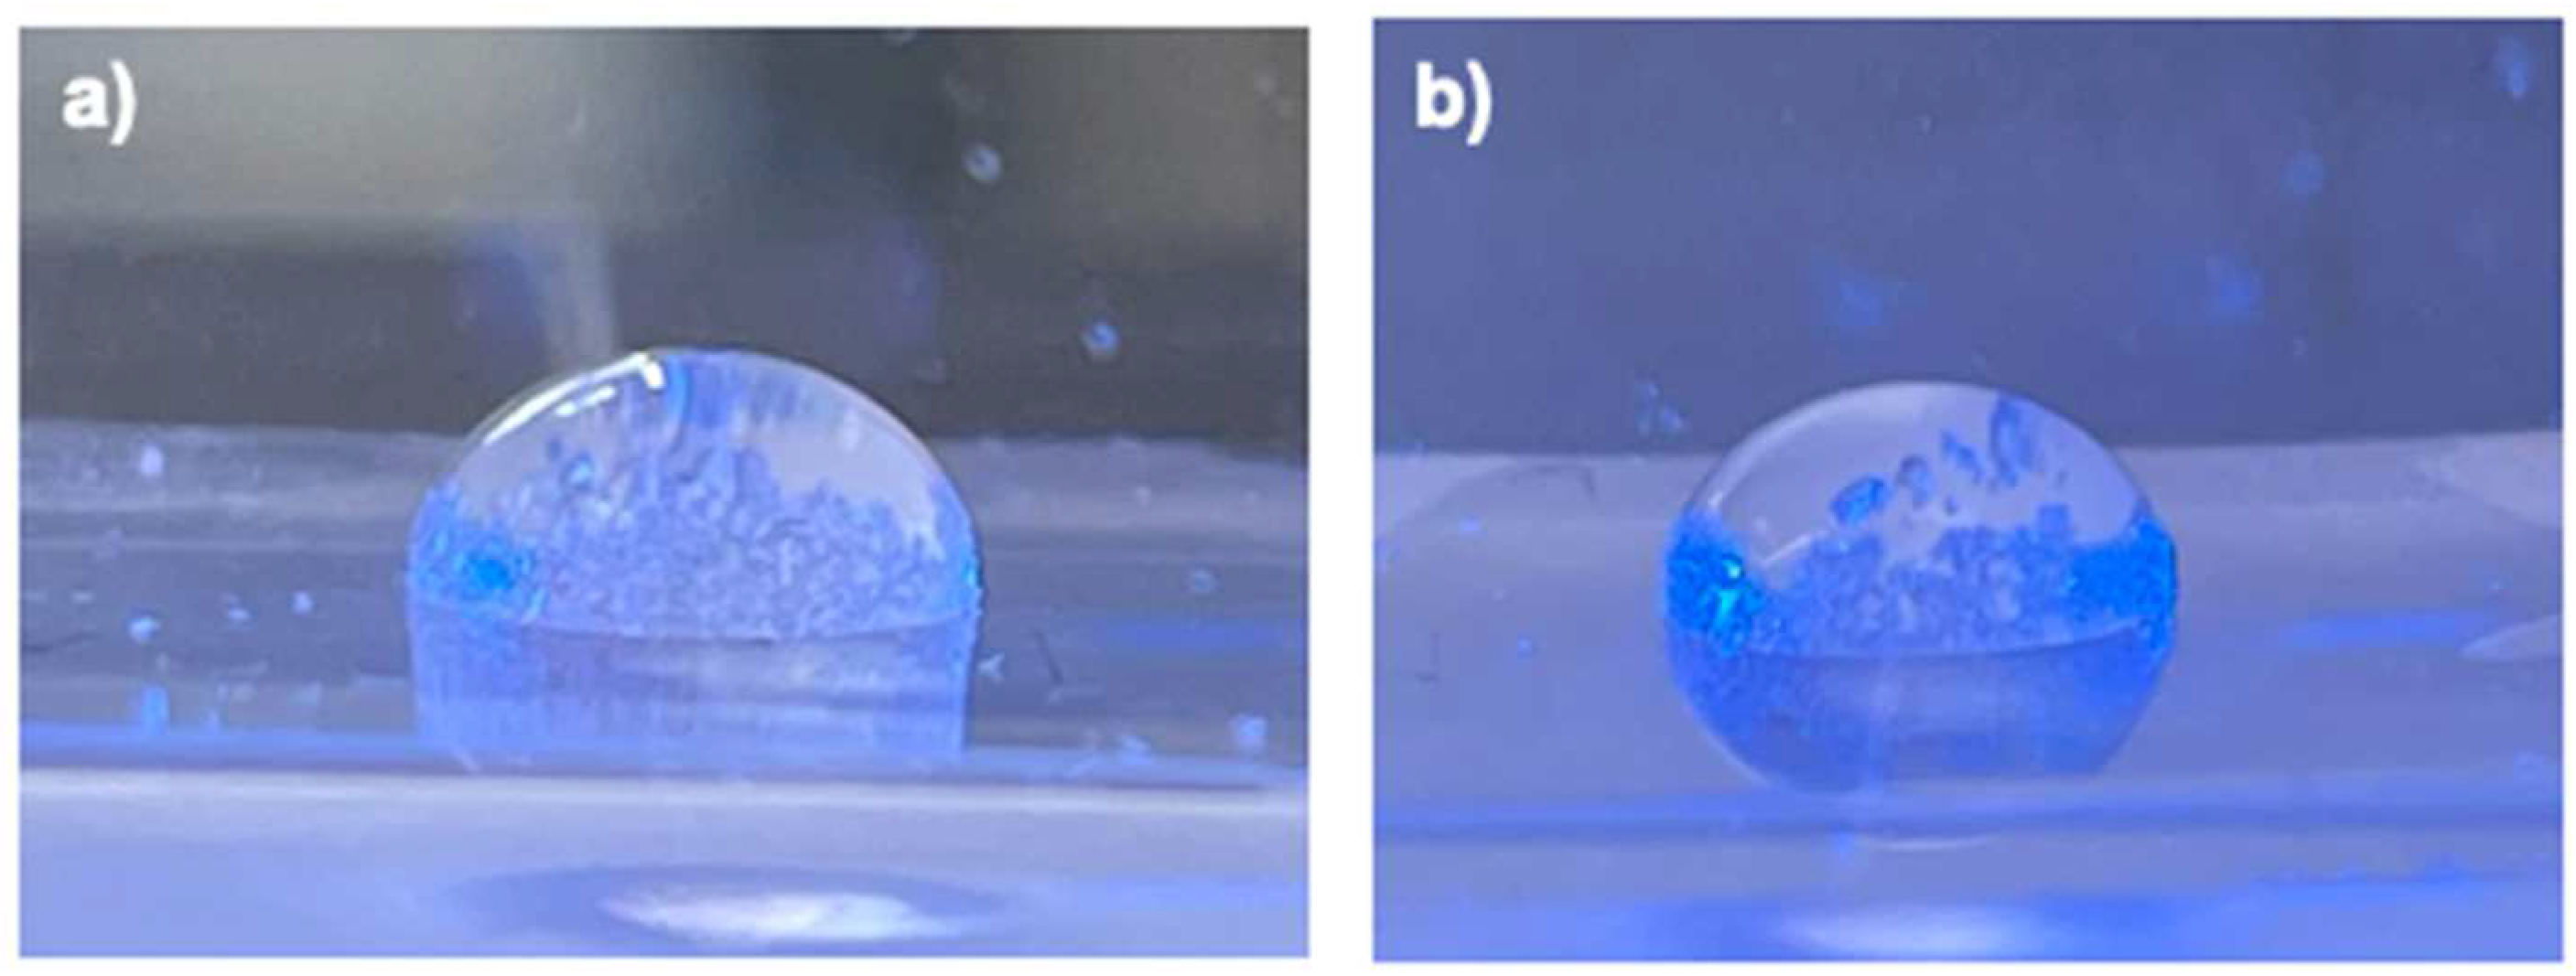
Figure 10.
Images of slugs during the crystallization process for Arg/H2O (red), APAP/H2O (blue) and Met/H2O (orange) recorded at a tubing length of = 12 m at = 20 mL min-1. Videos of slugs during the crystallization process can be seen in the supporting information.
Figure 10.
Images of slugs during the crystallization process for Arg/H2O (red), APAP/H2O (blue) and Met/H2O (orange) recorded at a tubing length of = 12 m at = 20 mL min-1. Videos of slugs during the crystallization process can be seen in the supporting information.
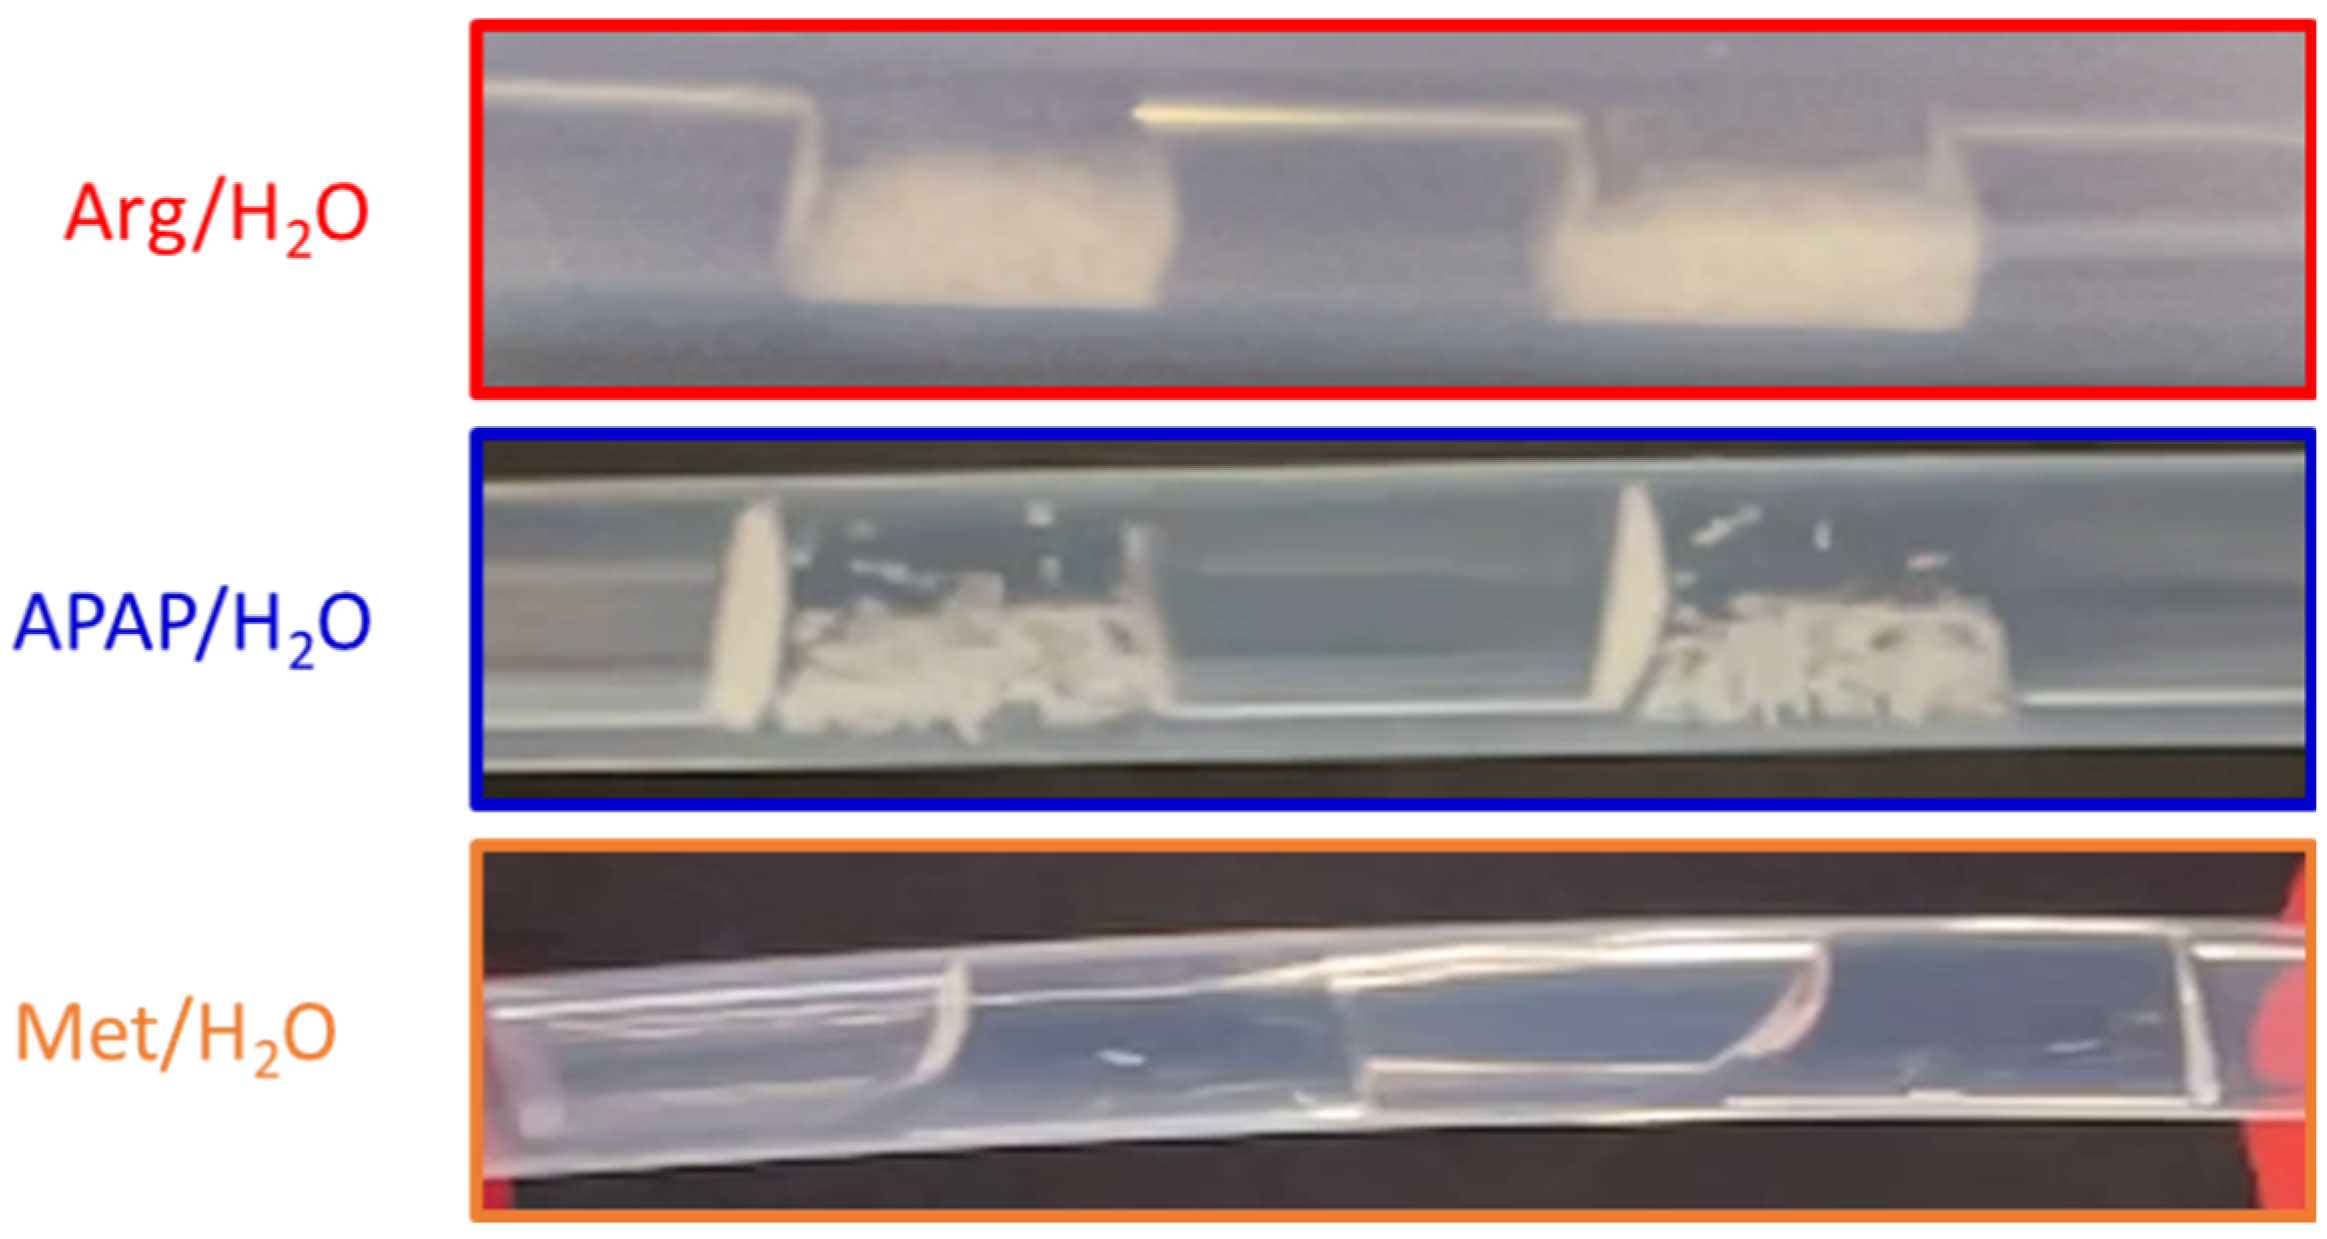
Figure 11.
Concentration profiles of the continuous experiments compared to the batch results for the substance system Arg/H2O (top left, red) and APAP/H2O (bottom left, blue) and the resulting product particles for the experiment using = 40 mL min-1.
Figure 11.
Concentration profiles of the continuous experiments compared to the batch results for the substance system Arg/H2O (top left, red) and APAP/H2O (bottom left, blue) and the resulting product particles for the experiment using = 40 mL min-1.
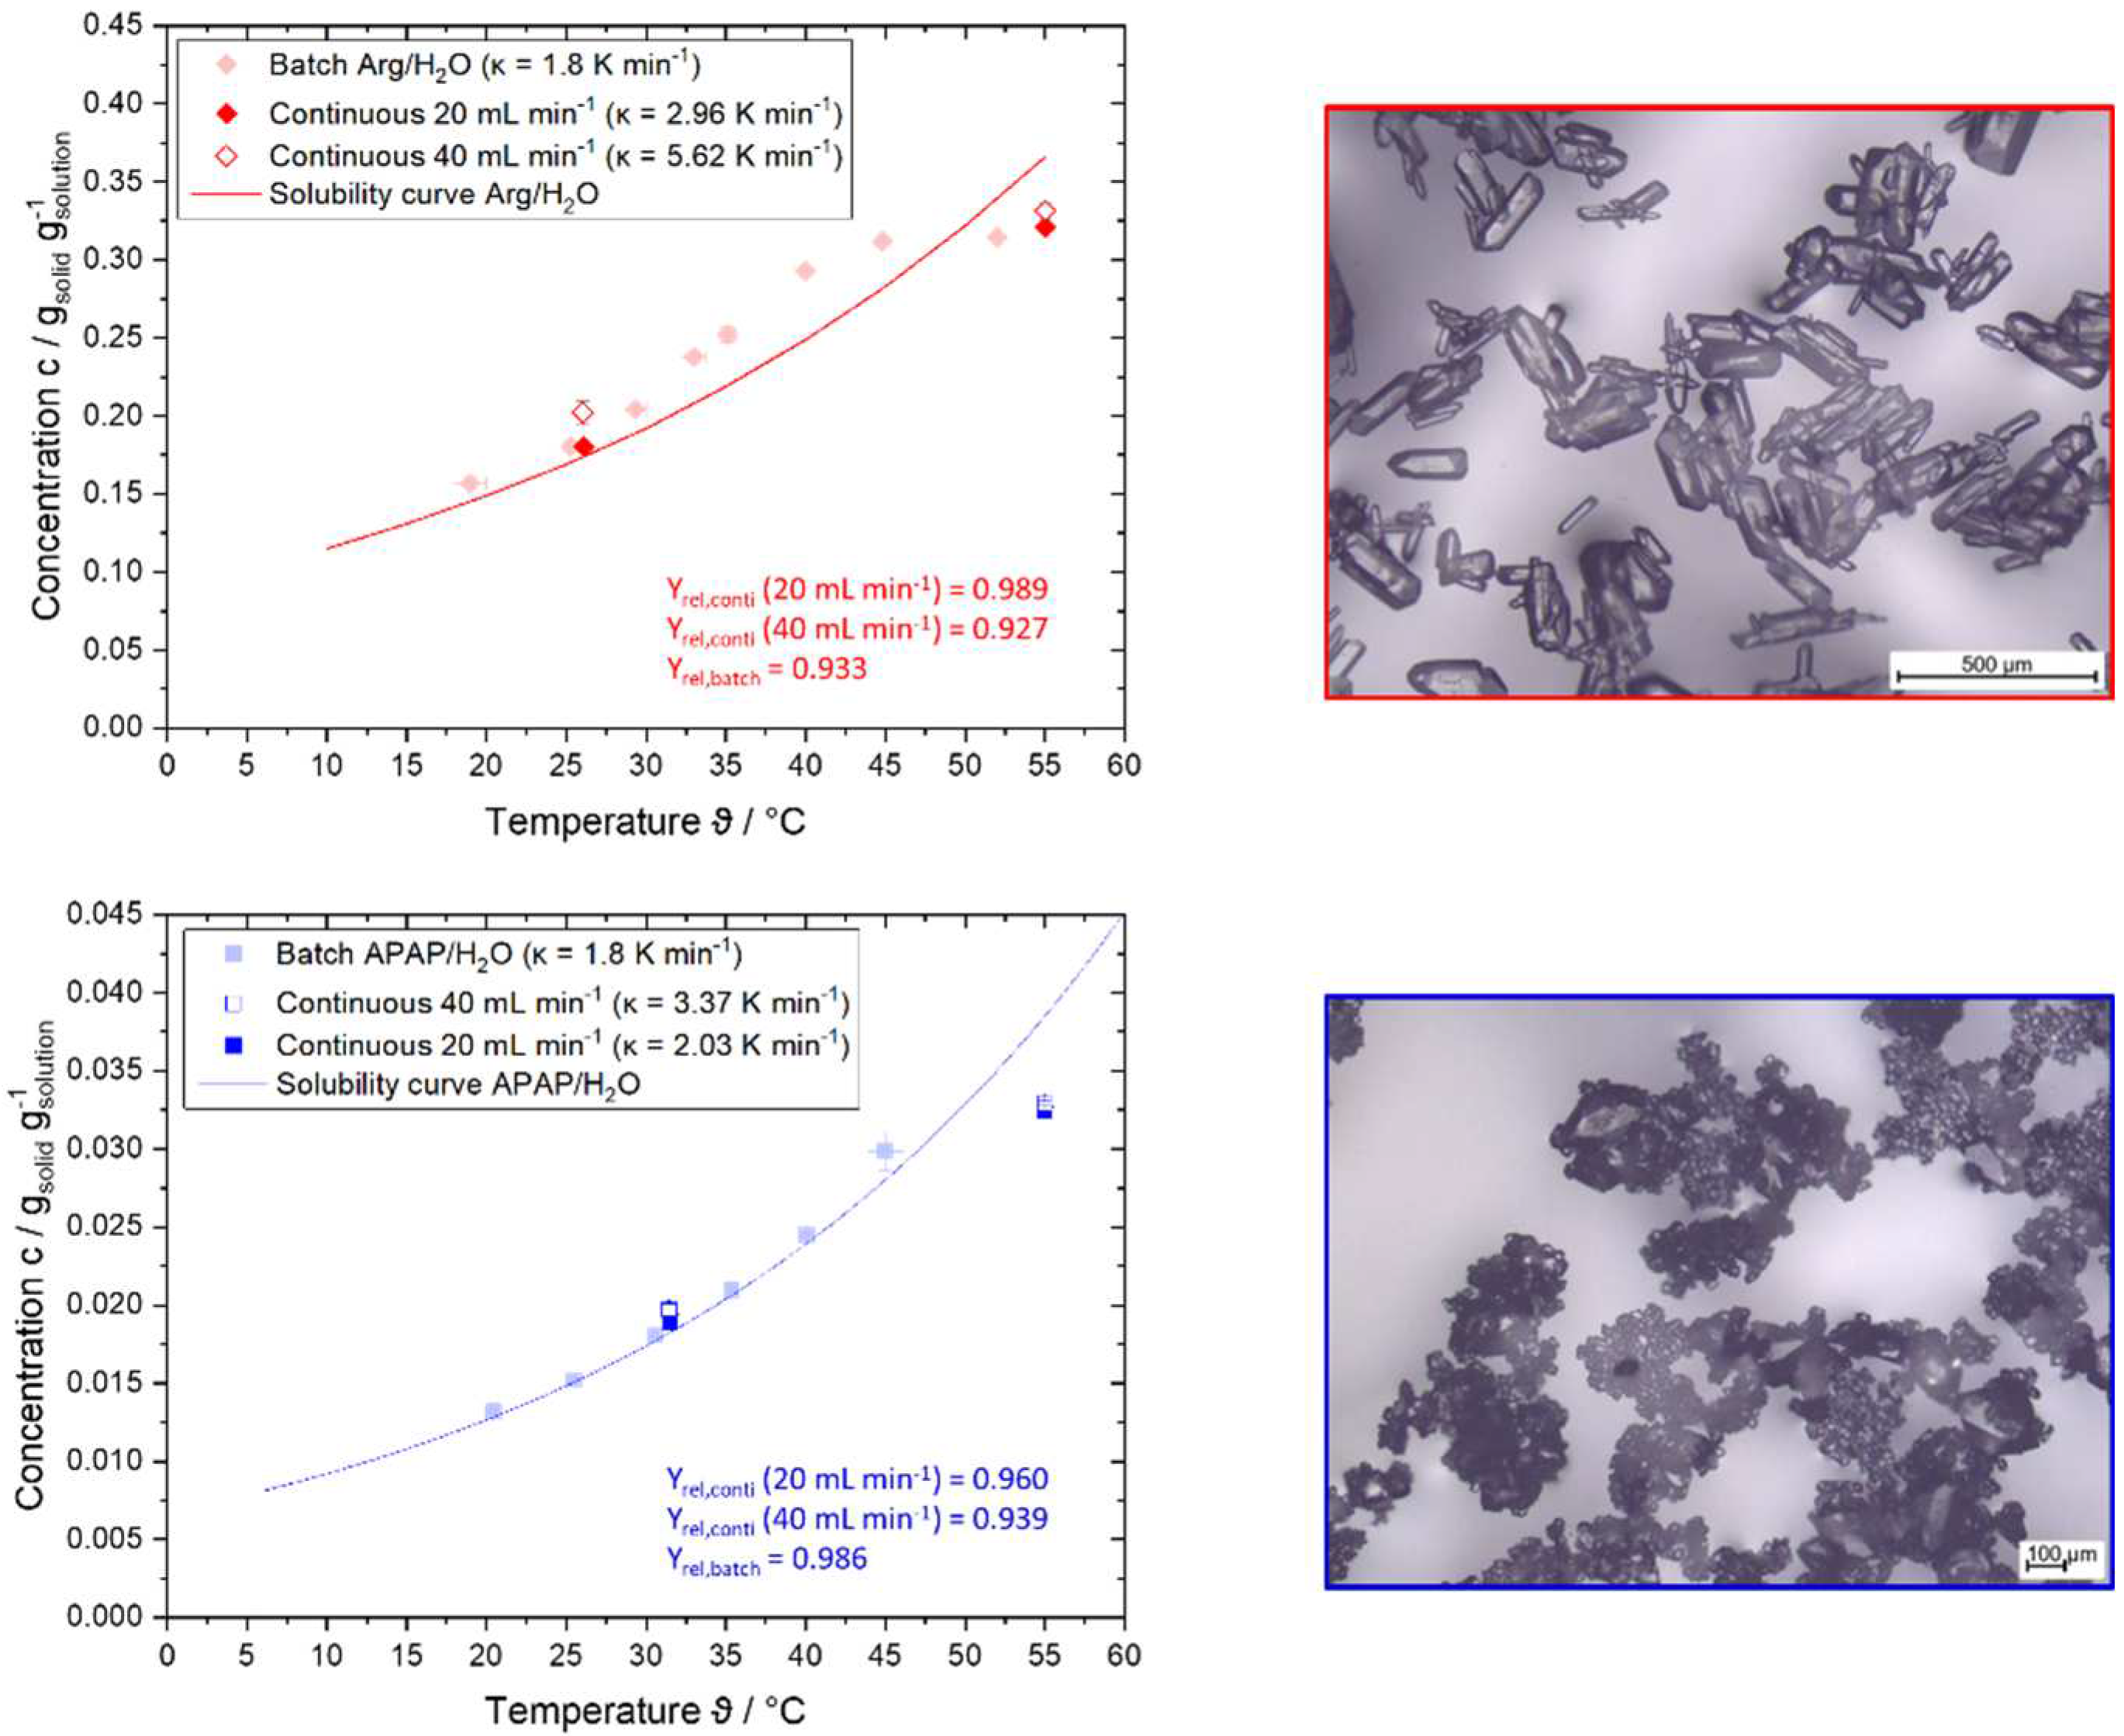
Figure 12.
Microscopic images of product particles (substance system: Arg/H2O) after continuous crystallization inside the SFC for a total volume flow rate of = 20 mL min-1 (left) and = 40 mL min-1 (right). The samples were taken at the end of the SFC ( = 26.5 m).
Figure 12.
Microscopic images of product particles (substance system: Arg/H2O) after continuous crystallization inside the SFC for a total volume flow rate of = 20 mL min-1 (left) and = 40 mL min-1 (right). The samples were taken at the end of the SFC ( = 26.5 m).
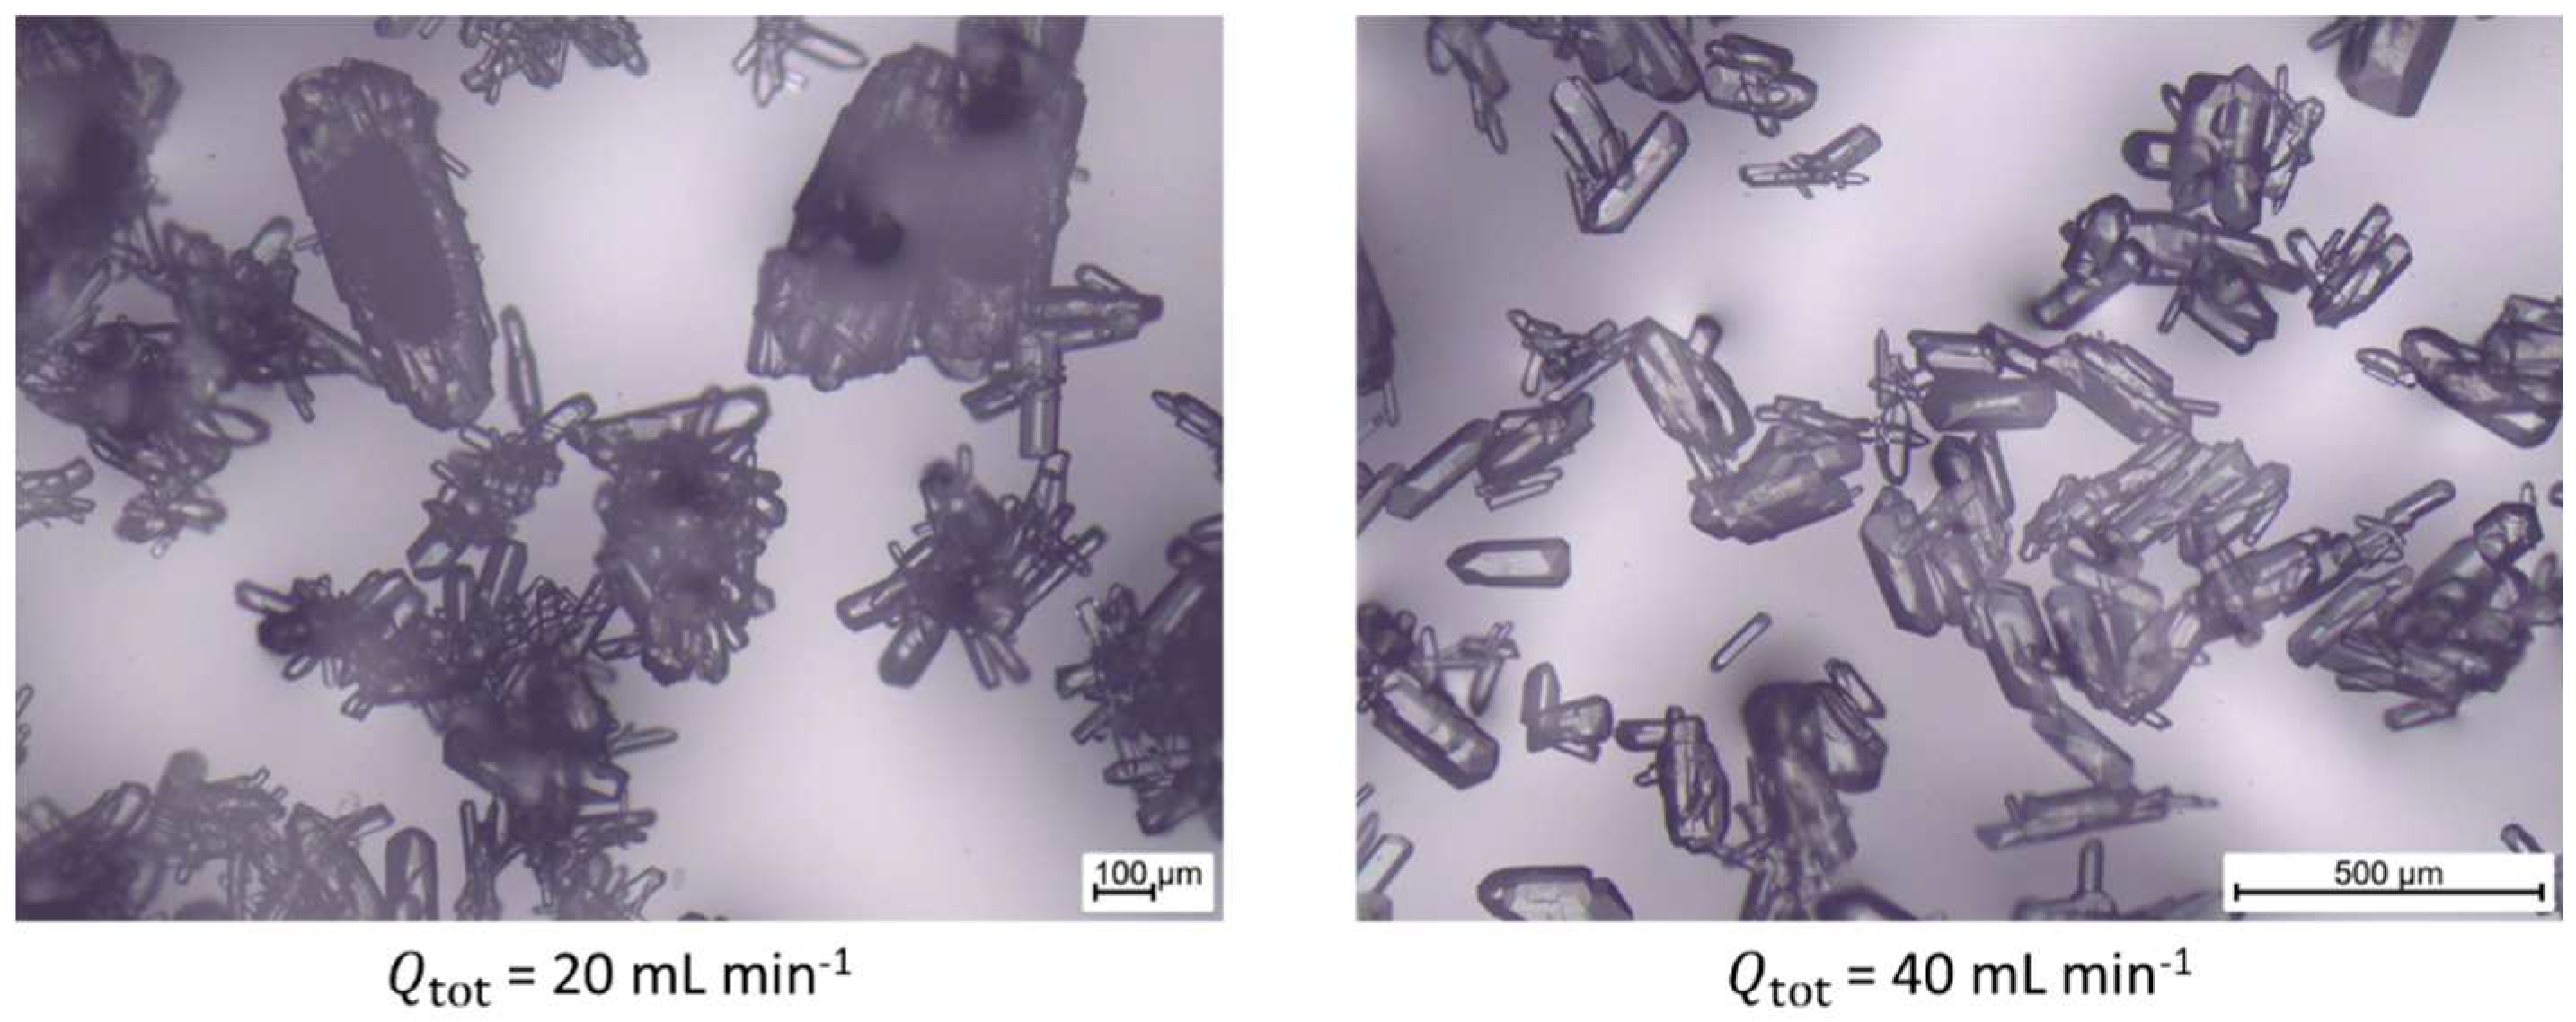
Figure 13.
Parity plots comparing the calculated and measured target parameters of the continuous crystallization process relative yields (left) and the characteristic values of the PSD (middle) and (right). The solid lines represent the ideal parity line and the dashed lines is the 20 % deviation mark.
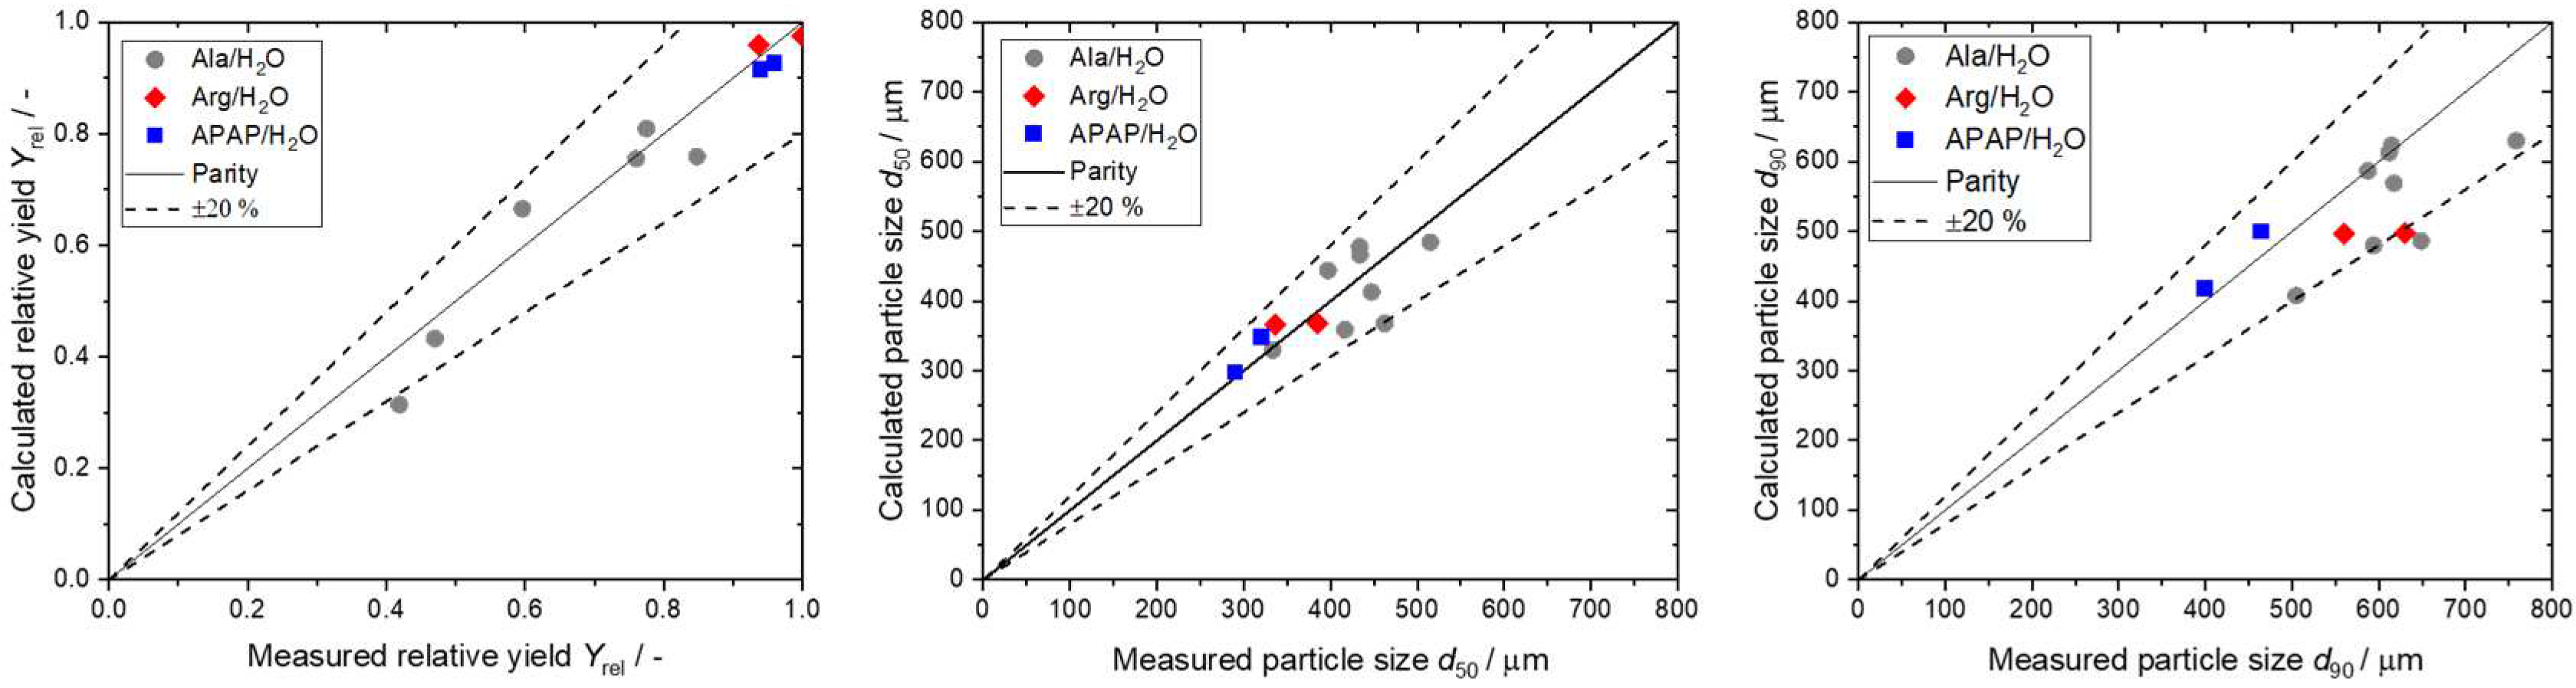
Figure 14.
Measured and calculated cumulative distributions for Arg/H2O (left, red) and APAP/H2O (right, blue).
Figure 14.
Measured and calculated cumulative distributions for Arg/H2O (left, red) and APAP/H2O (right, blue).
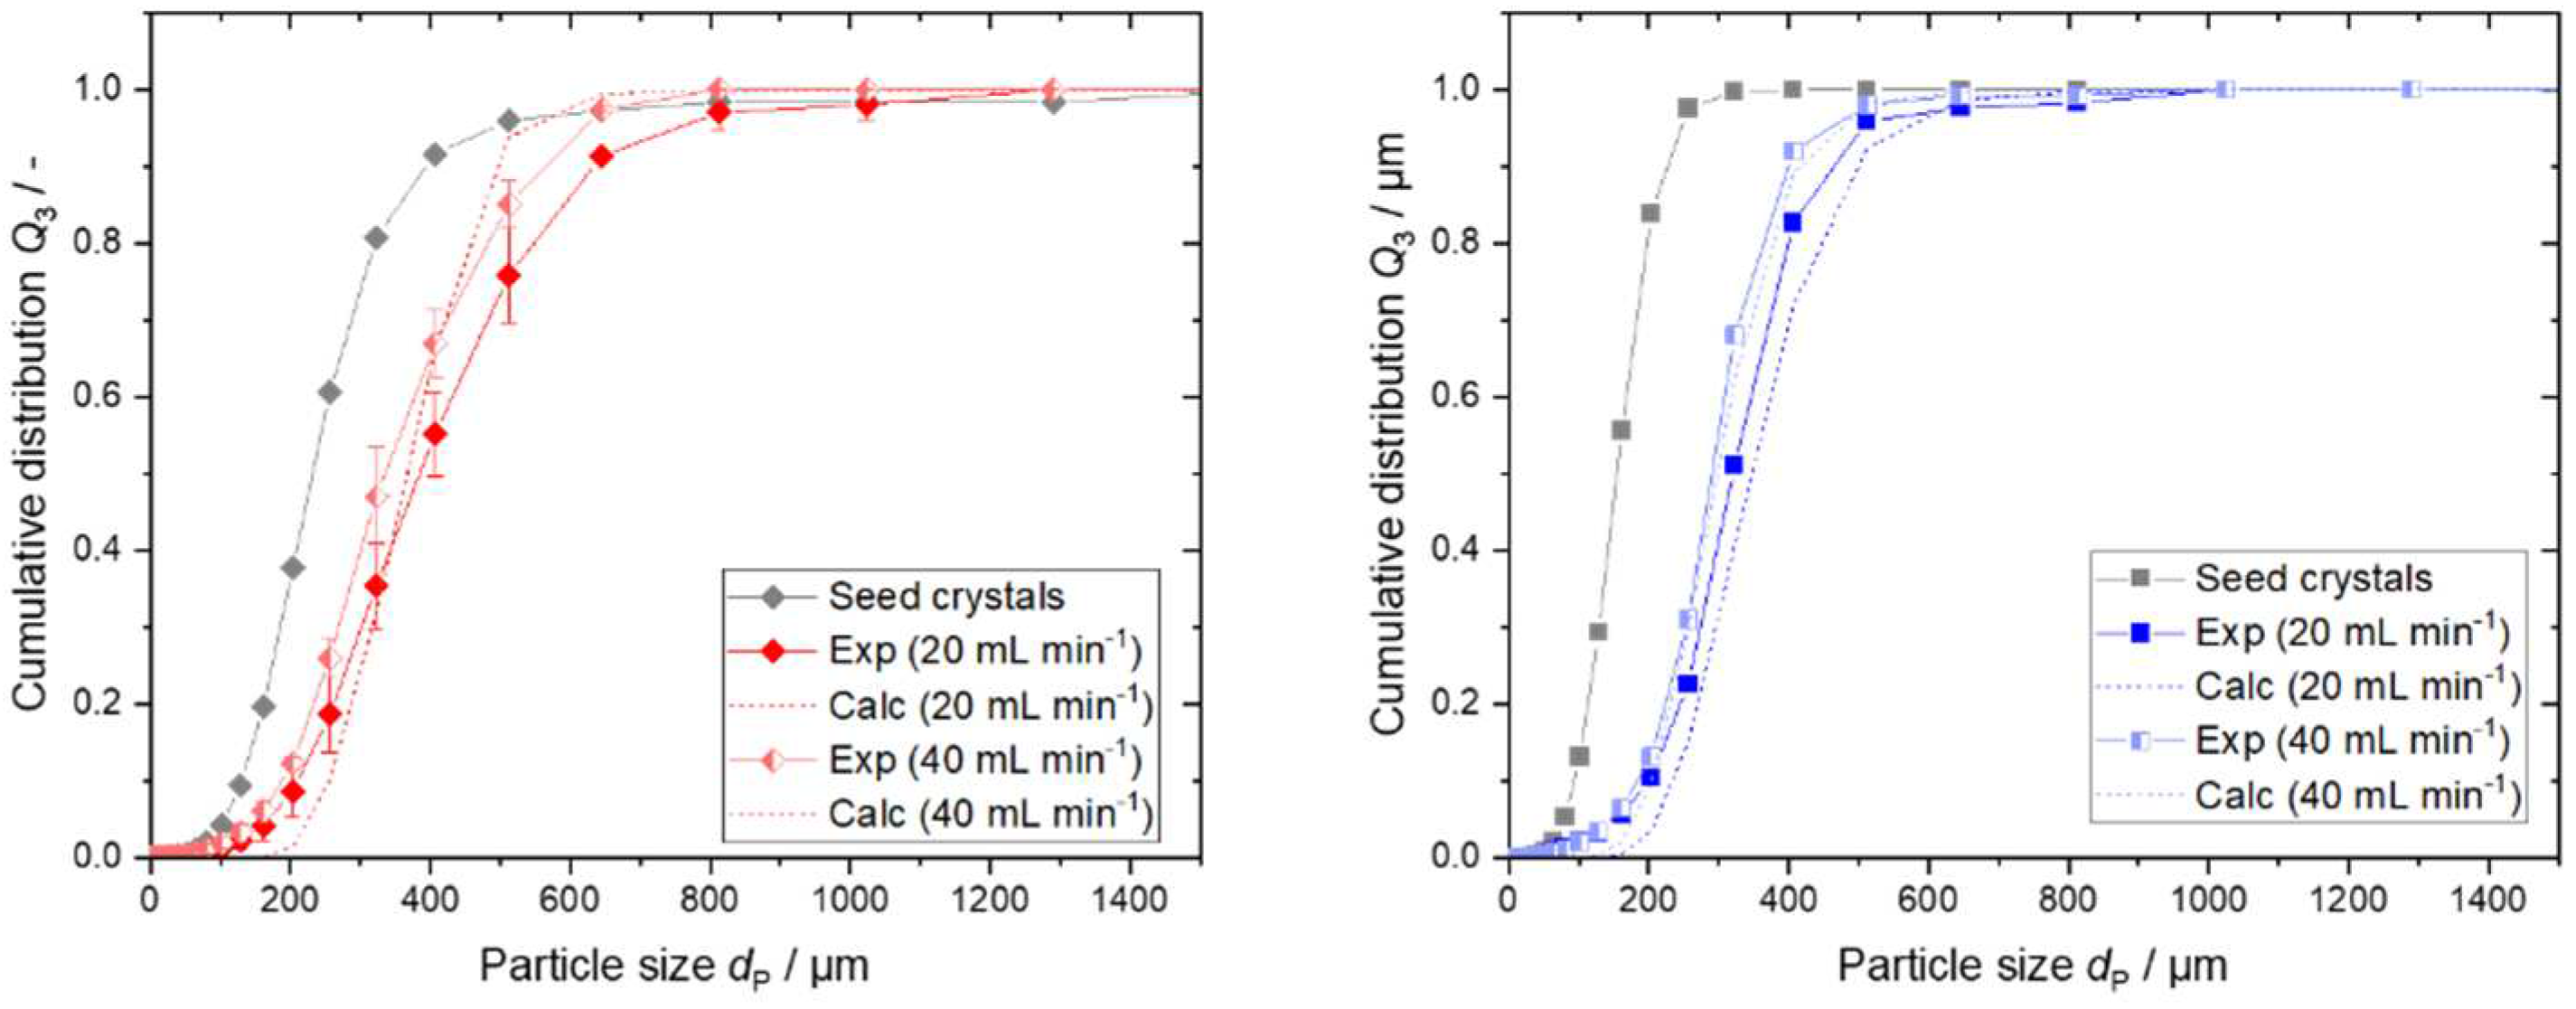
Table 1.
Results of the static contact angle measurements and the calculation of the capillary number . Furthermore, the slug shape resulting from the dynmaic contact angle review are given. The results for the substance systems Arg/H2O and APAP/H2O were taken from the literature [18], whereas the results of Met/H2O were obtained in this work.
| Static contact angle / ° |
Capillary number Ca / - |
Slug shape | |
|---|---|---|---|
| Arg/H2O | 93.26 ± 1.22 ° [18] | 8.7·10−4 [18] | Convex |
| APAP/H2O | 90.61 ± 1.62 ° [18] | 6.3·10−4 [18] | Convex |
| Met/H2O | 101.4 ± 1.99 ° | 2.76·10−3 | Convex |
Table 2.
Relative yields and the maximum supersaturation levels obtained during the batch crystallization experiments for the respective substance systems and cooling rates.
Table 2.
Relative yields and the maximum supersaturation levels obtained during the batch crystallization experiments for the respective substance systems and cooling rates.
|
/ K min-1 |
/ - |
/ - |
|
|---|---|---|---|
| Arg/H2O | 0.45 K min-1 | 1.112 | 0.937 ± 0.02 |
| 1.8 K min-1 | 1.177 | 0.933 ± 0.05 | |
| APAP/H2O | 0.45 K min-1 | 1.042 | 0.987 ± 0.012 |
| 1.8 K min-1 | 1.066 | 0.986 ± 0.014 | |
| Met/H2O | 0.45 K min-1 | 1.055 | 0.903 ± 0.01 |
| 1.8 K min-1 | 1.054 | 0.894 ± 0.04 |
Disclaimer/Publisher’s Note: The statements, opinions and data contained in all publications are solely those of the individual author(s) and contributor(s) and not of MDPI and/or the editor(s). MDPI and/or the editor(s) disclaim responsibility for any injury to people or property resulting from any ideas, methods, instructions or products referred to in the content. |
© 2023 by the authors. Licensee MDPI, Basel, Switzerland. This article is an open access article distributed under the terms and conditions of the Creative Commons Attribution (CC BY) license (http://creativecommons.org/licenses/by/4.0/).
Copyright: This open access article is published under a Creative Commons CC BY 4.0 license, which permit the free download, distribution, and reuse, provided that the author and preprint are cited in any reuse.


