
Submitted:
27 December 2023
Posted:
27 December 2023
You are already at the latest version
Abstract
Interpolyelectrolyte complexes Eudragit® EPO/L100 received in different pH were characterized by different degree of swelling in mimicking fasted stomach medium (0.1 M HCl) and saved their shape during 6 hours of the experiment. The microenvironmental changes in IPECs structure during swelling testing were inves-tigated using FT-IR spectroscopy, thermal and elemental analysis. Both samples of IPECs during swelling were transformed to a similar structure with approximately the same composition. IPEC samples showed bioadhesive properties that was not significantly different from the positive control (Carbopol) in the test with the mucin compacts. The release rate of metronidazole (class I BCS) from IPEC matrices increased with the increasing degree of swelling. IPEC 1 provided 49.62 ± 6.20% and IPEC 2 – 87.69 ± 5.15 % of metronidazole release after 6 hours in mimicking fasted stomach medium (0.1 M HCl). Total amount of released acyclovir (class III BCS) from IPEC 1 was 25.76 ± 5.67 % and from IPEC 2 was 21.48 ± 5.00 %. Release of both drugs was controlled by relaxation of polymeric chains in matrices according to the Peppas-Sahlin model. According to the received results, investigated interpolymer complexes are perspective for further evalua-tion as carriers for gastroretentive bioadhesive systems.
Keywords:
interpolyelectrolyte complexes
; Eudragit®
; gastroretentive systems
; drug delivery systems
; bioadhesive systems
; metronidazole
; acyclovir
1. Introduction
Gastroretentive drug delivery systems (GRDDS) are used for site-specific drug release and systematic action in the upper part of the gastrointestinal tract (GIT) specially for the drugs having absorption window in the stomach [1,2] and local action for treatment of the inflammatory or cancerous diseases and eradication Helicobacter pylori [3,4]. There are several technologies to achieve increasing drug residence in the upper part of the GIT, such as magnetic systems [5], mucoadhesive systems [6,7], expandable systems [8], floating systems [9,10], high-density systems [11,12], polymeric fibrous [13,14] and ion-exchange resins [15].
Bioadhesive gastroretentive drug delivery systems are on the way to prolong the drug residence time in the upper part of the GIT. It’s known that polymers for bioadhesive systems include hydrogen-bond forming groups such as carboxyl, hydroxyl, amide and sulfate groups. Bioadhesive GRDDS action is based on a complex process with several mechanisms, including electrical theory, adsorption, wetting, diffusion, and fracture theories [16,17]. Bioadhesive polymers such as Carbopol®, chitosan, hydroxypropyl methylcellulose (HPMC) and sodium carboxymethyl cellulose (CMC-Na) are usually used for such type of GRDDS [18,19,20]. However, several polymer excipients must be used to ensure required gastroretentive effect. For example, Naseem at el. developed gastroretentive formulations consisting of osmotically controlled polymer, hydrophilic polymer, hydrophilic gums, gel forming polymers, mucoadhesive polymers with microcrystalline cellulose [6]. Zhu et al. provided results of assessment bioadhesive gastroretentive minitablets containing HPMC, Carbopol® 971P, microcrystalline cellulose and aerosil [18] Development of gastroadhesive matrix systems based on a combination of Eudragit® E100, CMC-Na and locust bean gum was reported by Ngwuluka et al. [21]. This study focused on developing a gastroretentive drug delivery system employing a triple-mechanism interpolymeric blend matrix comprising high density, swelling, and bioadhesiveness for the enhanced site-specific zero-order delivery of levodopa in Parkinson’s disease.
The combination of oppositely charged types of methacrylate copolymers, including their blends, in order to control the site and time of drug release from oral drug delivery systems (DDS) was discussed in previously published reviews [22,23]. A comprehensive analysis of the physico-chemical principles behind the intermacromolecular interactions that govern the mechanism for regulating the drug release rate from oral DDS based on chemically complementary Eudragit® grades copolymers was published by our research group [24,25].
Investigation of the interpolyelectrolyte complexes (IPEC) based on oppositely charged Eudragit® copolymers have been actively carried out last fifteen [26,27,28,29,30,31,32,33,34,35,36,37,38,39,40,41,42]. The main reason of this fact is structure of this (meth)acrylate copolymers, Eudragits contain oppositely charged groups due to which reaction of polycomplex formation is possible.
Initially the influence of the combination of two oppositely charged polymers Eudragit® EPO (EPO) and Eudragit® L100 (L100) was studied for oral controlled DDS [29]. These grades were combined in the polycomplex matrix system because of their hydrophilic-hydrophobic properties that could be suitable in colon-specific controlled DDS. The combination of two pH-dependent copolymers EPO/L100 at necessary molar ratio can provide the required diffusion transport properties and controlled drug release. Definitely, the assessment of possible structural and compositional differences in the IPEC matrices during their stay in the mimicking gastrointestinal tract (GIT) tested media indicates that the analyzed samples were relatively stable during passage through all tested solutions and could be characterized as self-healing systems. FTIR analysis indicated that samples were not stable in strongly acidic gastric mimicking medium due to disappearance of the interpolymer ionic bonds (lack of the characteristic band at 1560 cm−1), but the bonds were restored to the initial level already at pH 5.8 as the pH rises.
However, swelling testing of the polycomplex systems using gastric mimicking conditions showed that all IPEC samples were characterized by an unexpected stability within strongly acidic medium in spite of the destroying of ionic bonds. The IPEC-1, close to equimolar (Z = [EPO]/[L100] = 1.02)) and IPEC-3, contains a 2-fold excess of EPO (Z = 2) matrices dissolved completely after 5 hours most likely due to transformation of a water insoluble stoichiometric polycomplex into nonstoichiometric soluble IPECs. And the IPECs would simply be converted back to individual copolymers which would form a precipitate in acidic media (L100), but this was never observed. In case of IPEC-2, has correspondingly an intermediate composition (Z = 1.49) been stable during 24 hours.
Thus, taking into account our results we decided to follow this interesting idea and do additional experiments focused in finding the most perspective, bioadhesive IPEC samples for the development of sustained gastroretentive drug delivery mediated by oppositely charged Eudragit® EPO and Eudragit® L100 polyelectrolyte matrix, which we have recently studied [43].
It’s also known that IPECs contain ionized groups of the individual polymers in the defective areas of their structure and therefore using IPEC can provide bioadhesive effect for drug delivery system [44,45].
Moreover, we have established that EPO exhibits mucoadhesive properties and retains the dye on mucosal surface better compared to free sodium fluorescein. The retention properties of EPO solutions containing sodium fluorescein were studied on freshly excised sheep nasal mucosa, irrigated with artificial nasal fluid using low-through test. Approximately, 3.19 ± 1.40% of fluorescence remained on nasal mucosa after 60 min washing. This good retention of the dye mediated with EPO on mucosal surfaces is likely to be related to its cationic nature that ensures electrostatic attraction of this polymer to negatively charged mucosal surface [46].
Recently, we have also reported that better retention properties of IPECs based on Eudragit® EPO/ Eudragit® L100-55 copolymers compared to pure EPO is possibly related to their insoluble nature and slower elimination from the mucosal surface [47].
The aim of this study was to investigate possibility of application two samples IPECs based on Eudragit® EPO and Eudragit® L100 previously chosen as a prospective carrier for GRDDS by additional evaluating of swelling, bioadhesiveness and release properties for the enhanced gastro-specific delivery.
Metronidazole (MZ) and Acyclovir (ACR) were used as a model drugs. The main absorption site of ACR is the upper part of GIT. Moreover, it has short half-life of approximately 2.5 h [48]. Therefore, development of GRDDS of ACR may improve its bioavailability.
On the other hand, MZ is antibacterial drug which is used for treatment of chronic bacterial infection caused by Helicobacter pylori and plays an important role in the development of peptic ulcers and gastric carcinoma [49]. Development of dosage form of MZ with localized action in stomach can also help in solving the problem of increasing effectiveness of pharmacotherapy of these diseases.
2. Materials and Methods
2.1. Materials
EPO is polycation, terpolymer of dimethylamino-ethyl methacrylate with methyl methacrylate and butyl methacrylate (mole ratio 2: 1: 1, MW 150 000 g/mol), L100 is polyanion, copolymer of methacrylic acid and methyl methacrylate (mole ratio 1: 1, MW 135 000 g/mol) were used for preparation of IPECs and physical mixtures (PhM). These copolymers were generously provided by Evonik Industries AG (Darmstadt, Germany). MZ and ACR were purchased from Merck (Sigma-Aldrich, St.Louis, MO, USA). Mucin isolated from pig stomachs (type II) (Merck group, Sigma-Aldrich, St.Louis, MO, USA) and fragments of the pig stomach mucosa were used to study bioadhesive properties.
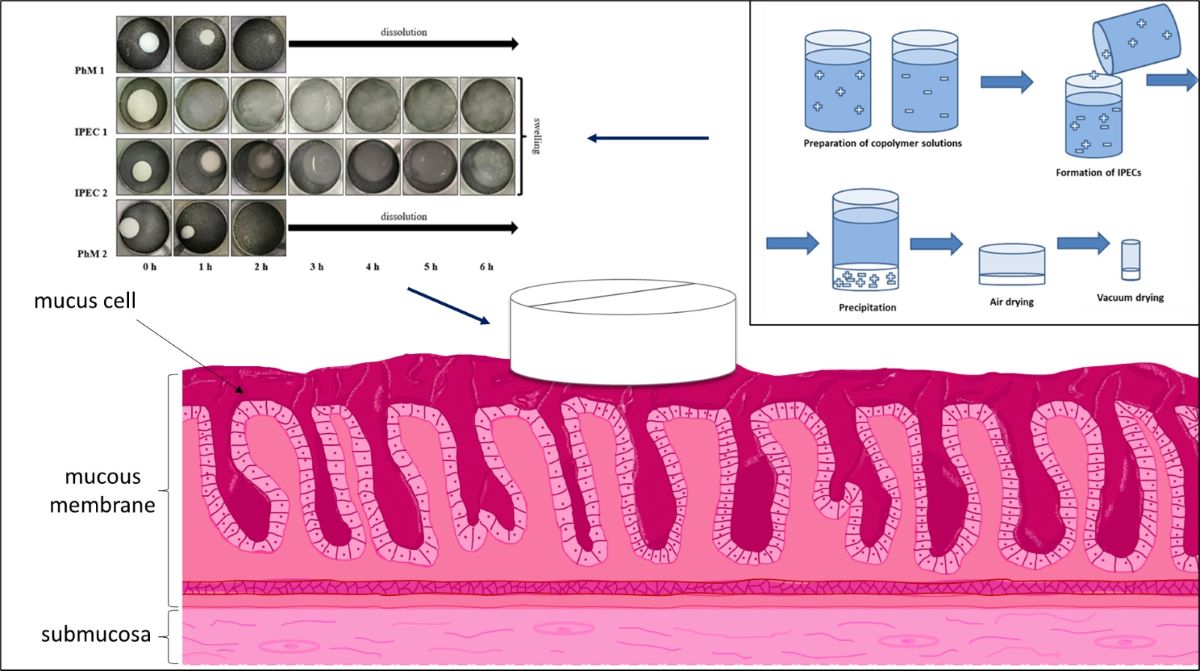
2.2. Preparation of solid interpolyelectrolyte complexes (IPEC) and physical mixtures (PhM)
Preparation of solid IPECs based on Eudragit® copolymers was carried out in an aqueous solution under pH 6.0 (IPEC 1) and pH 6.5 (IPEC 2) according to the method which was described earlier [29]. The powders of vacuum-dried (vacuum oven VD 23, Binder GmbH, Tuttlingen, Germany) IPEC samples were previously grinded using automatic accessory for mixing and grinding ShakIR (Pike Technologies, Madison, WI, USA) before pressing them into the matrices.
Physical mixtures (PhM) were prepared by mixing powders of copolymers EPO and L100 using automatic accessory for mixing and grinding ShakIR (Pike Technologies, Madison, WI, USA).
2.3. Preparation of tablets
Matrices of IPEC and PhM for studying swelling ability (100 mg, 8 mm in diameter), were obtained by pressing on a PressPRO 15-ton programmable automated hydraulic press for IR spectroscopy (Pike Technologies, Madison, WI, USA) at a pressure of 2.45 MPa.
Tablets for analysis of drug release contained a mixture of IPEC or PhM (50 mg) and model drug (100 mg) 8 mm in diameter were pressed on a PressPRO 15-ton programmable automated hydraulic press for IR spectroscopy (Pike Technologies, Madison, WI, USA) at a pressure of 2.45 MPa.
2.4. Determination of the degree of swelling of matrices.
The study of the swelling ability was carried out in mimicking fasted stomach medium (0.1 M HCl) at a temperature of 37 ± 0.5 °C for 6 hours. The polymeric matrix was placed in a tarred basket, which was immersed into a thermostatic bath IC control eco 18с (IKA® Werke GmbH, Staufen, Germany). The total volume of the medium was 40 mL. The basket was removed from the medium every 30 min and the matrix was carefully dried using a filter study and weighed.
The degree of swelling (H%) was calculated by the formula:
in which m1 is the mass of the dry sample; m2 is mass of swollen sample.
H% = ((m2 - m1) / m1) ∙ 100,
2.5. Elemental Analysis
The compositions of the IPEC samples and IPEC samples after swelling assessment were investigated by elemental analysis using a CHNS/O Elemental analyzer Thermo Flash 2000 (Thermo Fisher Scientific, Paisley, UK) and calculated as Z = [EPO]:[L100] (mol/mol). The vacuum dried samples (at 40 °C for 2 days) were weighed into a crucible on a XP6 Excellence Plus XP micro balance (Mettler Toledo, Greifensee, Switzerland). The crucibles with samples were packed and placed into the combustion reactor via autosampler. Temperature in the oven was 900 °C, and a gas flow rate was 10 mL/min. Calibration of the instrument was performed with atropine standard (Thermo Fisher Scientific, Paisley, UK). Eager Xperience Data Handling Software (version 1.3.07/2014) was used to analyze the results. All measurements were performed in triplicate.
2.6. Fourier Transformed Infrared (ATR-FTIR) Spectroscopy
ATR-FTIR spectra were recorded by a Nicolet iS5 FTIR spectrometer (Thermo Scientific, Waltham, MA, USA) using the iD5 smart single bounce ZnSe ATR crystal. The spectra were analyzed using OMNIC spectra software (version 8.2.387).
2.7. Thermal Analysis
Modulated DSC (mDSC) measurements were carried out using a Discovery DSC™ (TA Instruments, New Castle, DE, USA), equipped with a refrigerated cooling system (RCS90). TRIOS™ software (version 3.1.5.3696) was used to analyze the DSC data (TA Instruments, New Castle, DE, USA). Tzero aluminum pans (TA Instruments, New Castle, DE, USA) were used in all calorimetric studies. The empty pan was used as a reference and the mass of the reference pan and of the sample pans were taken into account. Dry nitrogen was used as a purge gas through the DSC cell at 50 mL/min. Indium and n-octadecane standards were used to calibrate the DSC temperature scale; enthalpic response was calibrated with indium. Calibration of heat capacity was done using sapphire. Initially the samples were cooled from room temperature to 0 °C, then kept at 0 °C for 5 min and analyzed from 0 to 250 °C. The heating rate was 2 °C/min with 40 s period and 1 °C amplitude. Glass transition temperatures were determined using the reversing heat flow signals. All measurements were performed in triplicate.
2.8. Study of model drug release
The study of the release of MZ and ACR from tablets based on the IPECs and PhMs was carried out using the Flow-Through cell apparatus on a CE 7 Smart device (Sotax AG, Aesch, Switzerland) in mimicking fasted stomach medium (0.1 M HCl; 37 ± 0.5 °C), at a biorelevant flow rate of 8 ml / min in an open cycle [41] for 6 hours. The amount of released MZ and ACR were estimated by UV spectrophotometer Evolution 220 (Thermo Scientific, Waltham, MA, USA) at a wavelength of 274 nm (MZ) and 202 nm (ACR) respectively. The concentration of drugs in the release medium was calculated based on calibration curves. Release profiles were fitted using Microsoft Excel Office software according to the Peppas-Sahlin model [50].
2.9. Analysis of bioadhesive properties
IPEC and PhM adhesion was studied on a TA.XTplus texture analyzer (Stable Micro Systems, Surrey, UK). Mucin compacts and fragments of the pig stomach mucosa were used as substrates for adhesion. Mucin compacts were obtained by pressing on a 15-ton microprocessor controlled automated hydraulic press for IR spectroscopy (Pike Technologies, Madison, WI, USA) at a pressure of 2.45 MPa using 13 mm die for IR spectroscopy (Pike Technologies, Madison, WI, USA). Pig stomach tissue was received from abattoir immediately after animal slaughter and transferred in a polystyrene container with dry ice. Stomach tissues were defrosted and excised to 3 x 3 cm sections. Bioadhesive properties on the pig stomach mucosa were studied in the acidic medium (0.1 M HCl). IPEC or PhM compacts were attached to the probe, while mucin compacts or stomach tissue were placed on the platform. Carbopol® 2020 (Carbopol) was used as a reference (positive control). The parameters settings of analysis with mucin compacts are [21]: pre-test speed (0.5 mm/s); test speed (0.1 mm/sec); post-test speed (0.1 mm/s); applied force (0.1 N); trigger force (0.1 N); contact time (60 s) and return distance (10 mm). The parameters settings of analysis with pig stomach tissue are: pre-test speed (1 mm/s); test speed (0.1 mm/sec); post-test speed (0.1 mm/s); applied force (0.1 N); trigger force (0.1 N); contact time (60 s) and return distance (10 mm). The data was captured through Texture Exponent Software (Version 3.2). The peak force was used to assess the gastroadhesivity of the matrices. The peak force is the maximum force required to detach the membrane or the tissue from the matrices [21].
2.10. Statistical analysis
All experiments were carried out in triplicate. Microsoft Excel Office software was used for statistical analysis. Mean values ± standard deviations were calculated using one-way analysis of variance (ANOVA) and t-Test (Two-Sample Assuming Equal Variances), where probability was p < 0.05 as a significant criterion.
3. Results and Discussion
3.1. Composition Study
Compositional differences of the synthesized IPECs were observed using elemental analysis (Table 1). The fraction of polycation (EPO) incorporated in the polycomplex increased as the pH of the reaction medium rises. IPEC 1 (synthesized at pH 6.0) had a composition close to equimolar (Z = [EPO]/[L100] = 1.02). IPEC 2 (synthesized at pH 6.5) contained a 1.5-fold excess of EPO (Z = 1.49). Thus, the polycomplexes were enriched with the less ionized component (EPO) – IPEC 2.
Eudragit copolymers are amorphous substances and have a characteristic glass transition temperature (Tg) [22,24]. mDSC was used to confirm the structural differences between prepared IPECs, as well as to evaluate the chemical homogeneity of the polymer systems by the absence of microdomains of free copolymers. Both IPECs were characterized by the presence of one Tg, which was higher than for EPO (52.1±1.3 °C) but lower than for L100 (193.3 ± 1.8 °C).
3.2. Assessment of the IPEC behavior in acidic medium
Assessment of the behavior of IPEC matrices without drug in mimicking biological liquids media is necessary for prediction of the possibility of application IPEC as carriers for DDS. The behavior of matrices based on IPEC Eudragit® EPO/L100 in comparison with matrices based on PhMs was investigated under the conditions mimicking medium of the fasted stomach (0.1 M HCl). It was noted that matrices based on PhMs dissolved after 2 hours in an acidic medium. Matrices based on IPECs retained their shape, increased in size, and transformed into a hydrogel structure withstood the entire 6 hours of the experiment (Figure 1). Based on the comparison of swelling profiles (Figure 2), it can be concluded that matrices of IPEC 2 were characterized by slower increase of the degree of swelling in the first hours of exposure to the medium. However, the degree of swelling of the matrix based on IPEC 2 was higher (851.53 %) than that of IPEC 1 (481.54 %) by the end of the experiment.
The different behavior of matrices based on PhMs and IPECs is most likely explained by the structure of IPEC stabilized by intermacromolecular ionic bonds between ionized dimethylamino groups of EPO and carboxylate groups of L100. The presence of these bonds has been proven by a new characteristic band at 1560 cm-1 in the FTIR spectrum of IPECs. The FTIR spectra (Figure 3 and Figure 4) of the obtained IPEC 1 and IPEC 2 show that the intensity of the characteristic band at 1560 cm–1 decreased with an increasing residence time of the IPEC matrices in mimicking fasted stomach medium (0.1 M HCl).
On the other hand, significant peak broadening at approximately 2520−2478 cm−1 can be assigned to the interpolymer absorption band which resulted from hydrogen bonding interaction of the dimethylamino groups or the carbonyl of EPO with the hydroxyls from the carboxylic groups of L100. Another new wide band between 2350 and 2750 cm−1 in the IPECs spectrum indicates the occurrence of different dimeric and monomeric forms of the ammonium cation, which, in turn, may be associated with water molecules. This fact is consistent with our previous studies [29].
We applied mDSC to analyze the behavior of IPEC matrices during passing them in fasted stomach mimicking medium. Immersion of the IPEC 1 matrices up to 6 h leads to a sharp increase of the Tg from 117.4±0.2 to 170.6±0.1 °C. Moreover, all mDSC thermograms show only one Tg, which indicates that both IPECs were not desintagrated to individual copolymers due to the absence of microdomains of them.
A possible composition changes of the synthesized IPECs were found using elemental analysis. Table 2 illustrates that the sample containing an excess of EPO (IPEC 2, Z = 1.49) lost significant amount of polycation that caused compositional changes in the polycomplex. Thus, during testing only one-third of the EPO was retained relative to L100 (Z = 0.5). In case of equimolar sample (IPEC 1) it was similar compositional and structural changes, but with less leaching of EPO from the polycomplex matrix. Comparative analysis of the Tg values indicated that the process of EPO leaching during residence in mimicking fasted stomach medium correlates well with the compositional changes of the tested polycomplex system and concurs with previously published results [29].
According to the received swelling assessment results such intrastructural processes that occur with IPEC matrices were not a limiting factor and allowed the matrices to stay in an acidic mimicking fasted stomach medium for 6 hours. It may indicate the prospects for further studies of IPEC data as carriers for GRDDS.
3.3. Analysis of bioadhesive properties
There are two stages in adhesion process: contact and consolidation. On the first stage contact between tablet and mucosa happens, polymer swells and melts. There is a bond formation between the polymer and mucin on the second stage [21,51].
In the bioadhesive properties study there was a difference in mucoadhesion using mucin compacts and mucosa tissue. Mucin compacts can be used for checking the ability to adhere on the mucosa but they do not imitate a real tissue properly, as we proved. The contact of the tablet and mucin compact is tight, and there is a high experimental reproducibility. Adhesion of Carbopol (positive control) was found not to be significantly different from IPECs and PhMs. Results of studying Peak Positive Force of tablets on mucin compacts are shown on Figure 5.
So, all samples can adhere on the mucosa surface. And we studied the adhesion on the pig stomach tissue. Figure 6 shows Peak Positive Force results on pig stomach mucosa. The adhedion on the mucosa tissue depends on different factors: contact surface, hydration, part of the stomach, etc. Carbopol had a better adhesion on stomach mucosa than IPECs and PhMs. But in case of excellent adhesive properties of gastroretentive systems, they can be adhesive to throat or esophagus and cause damage [51].
3.4. Study of drug release
MZ and ACR are both characterized by high solubility in bioliquids of gastrointestinal tract. MZ is a class I type of drug according to the biopharmaceutical classification system (BCS) [52,53]. ACR is a class III type drug of BCS [54,55].
According to the received results (Figure 7) release profiles of MZ had similar characters for all samples with the total amount of released drug more than 49.62 ± 6.20% for matrices based on IPEC 1 and 87.69 ± 5.15 % for matrices based on IPEC 2. Amount of released MZ from both PhMs were around 50%. These results are consistent with previously published data regarding theophylline, which has good solubility in biological fluids of the GIT and belongs to the I class of BCS [29]. The release rate of MZ increased with the increasing degree of swelling.
Matrices based on PhMs provided less 20% release of ACR to the acidic medium after 6 hours (Figure 8). Total amount of released ACR from IPEC 1 was 25.76 ± 5.67 % and from IPEC 2 was 21.48 ± 5.00 %. Despite the close values of ACR concentration in dissolution medium to the end of the experiment, the profiles were different for matrices based on IPEC 1 and IPEC 2. IPEC 2 provided fast release of ACR during 1 hour with followed drug concentration reaching the plateau. Release profile of ACR from IPEC 1 matrices can be characterized like prolonged with gradual drug release during 6 hours.
Release data were fitted according to the Peppas−Sahlin equation (1) to understand the mechanisms underlying the release of the MZ and ACR from polycomplex matrix systems [50].
where Q is the fraction of the drug released at time t, K1 and K2 are kinetic constants, m is diffusional exponent.
The Peppas-Sahlin model takes into account the interrelated effects of Fickian diffusion and Case-II-transport. The K1 value demonstrates the contribution Fickian diffusion, while the K2 value is related with both dissolution and relaxation of polymers chains [56].
Table 3 and Table 4 and Figure 9 and Figure 10 show the Peppas-Sahlin model experimental data analysis. Release of MZ from IPEC 2 exceeded 60% after first hour therefore data is not provided.
According to the value of R2 the Peppas-Sahlin model may be taken into consideration for explanation the drug release mechanism.
Relaxation contribution/ Fickian contribution (R/F) ratio was calculated by using the received parameters (Figure 11 and Figure 12). R/F > 1 for both complexes with MZ and ACR that showed that the erosion dominates during the process of both drugs release. The drug release for MZ and ACR are controlled by relaxation of polymeric chains in matrices. That is more increasing R/F ratio values for release MZ in ACR from IPEC 1 matrices with time indicates the increasing relaxational contribution [57].
4. Conclusions
Interpolyelectrolyte complexes Eudragit® EPO/L100 were characterized by different degree of swelling in mimicking fasted stomach medium (0.1 M HCl). The degree of swelling of the matrix based on IPEC 2 was higher than matrix based on IPEC 1 by the end of the experiment. However, matrices of both samples saved their shape during 6 hours of the experiment. Matrices based on physical mixtures of the same polyelectrolytes dissolved after 2 hours in the same conditions. The composition of IPEC was changed insignificantly after 6 hours in mimicking fasted stomach medium (0.1 M HCl). The assessment of possible structural and compositional differences in the formulation of polycomplexes during their stay in the tested media indicates that, the analyzed samples are self-healing systems. Intrastructural processes that occurred with IPEC matrices were not a limiting factor and allow the matrices to stay in an acidic medium for 6 hours.
The release rate of MZ (class I BCS) from IPEC matrices increased with the increasing degree of swelling. IPEC 1 provided prolonged release of MZ in mimicking fasted stomach medium (0.1 M HCl). Matrices based on both IPECs provided slow release of ACR (class III BCS) in acidic medium with total amount of released drug less than 30% for the 6 hours of the experiment. Release of both drugs was controlled by relaxation of polymeric chains in matrices according to the Peppas-Sahlin model. In vitro swelling and release experiments for prepared IPECs showed the potential of this polycomplexes as a controlled release carrier for gastroretentive delivery, due to comparable swelling properties in acidic medium mimicking fasted stomach environment. IPEC samples showed bioadhesive properties that was not significantly different from the positive control (Carbopol) in the test with the mucin compacts.
According to the received results, investigated polycomplexes are perspective for further evaluation as carriers for gastroretentive bioadhesive systems.
Author Contributions
D.S.G. carried out synthesis and physico-chemical characterization of interpolyelectrolite complexes, assessment of bioadhesive properties, swelling and drug release, wrote and corrected the article. A.V.S. performed elemental analysis, mathematical modeling of drug release, wrote and corrected the article. R.I.M. was responsible for conceptualization and research methodology, as well as reviewed and corrected the article. The article was written with the participation of all co-authors. All authors have read and agreed to the published version of the manuscript.
Funding
The study was carried out with the financial support of the Russian Science Foundation (RSF) in the framework of research project No 23-15-00263 (G.D.S., S.A.V. and M.R.I.).
Institutional Review Board Statement
Not applicable.
Informed Consent Statement
Not applicable.
Data Availability Statement
Data is contained within the article.
Acknowledgments
The authors are grateful to Evonik Ind. (Darmstadt, Germany) for donating samples of Eudragit® copolymers. The authors are also grateful to Dr. Alexander Sitenkov and Shamil Nasibullin for their help in physico-chemical assessment of IPEC samples.
Conflicts of Interest
The authors declare no conflict of interest.
References
- Alqahtani, A.A.; Mohammed, A.A.; Fatima, F.; Ahmed, M.M. Fused Deposition Modelling 3D-Printed Gastro-Retentive Floating Device for Propranolol HCl Tablets. Polymers 2023, 15, 3554. [CrossRef]
- Patel, M.; Shelke, S.; Shaikh, F.; Surti, N.; Panzade, P.; Panjwani, D. Gastroretentive Floating Microsponges of Mitiglinide: Design, Preparation, and Pharmacokinetic Evaluation. J. Pharm. Innov. 2023, 14. [CrossRef]
- Malladia, M.; Jukanti, R. Formulation development and evaluation of a novel bi-dependent clarithromycin gastroretentive drug delivery system using Box-Behnken design. J. Drug Deliv. Sci. Technol. 2016, 35, 134-145. [CrossRef]
- Uboldi, M.; Melocchi, A.; Moutaharrik, S.; Palugan, L.; Cerea, M.; Foppoli, A.; Maroni, A.; Gazzaniga, A.; Zema, L. Administration strategies and smart devices for drug release in specific sites of the upper GI tract. J. Contr. Rel. 2022, 348, 537–552. [CrossRef]
- Awasthi, R.; Kulkarni, G.T. Decades of research in drug targeting to the upper gastrointestinal tract using gastroretention technologies: Where do we stand? Drug Deliv. 2016, 23, 378–394. [CrossRef]
- Naseem, F.; Shah, S.U.; Rashid, S.A.; Farid, A.; Almehmadi, M.; Alghamdi, S. Metronidazole Based Floating Bioadhesive Drug Delivery System for Potential Eradication of H. pylori: Preparation and In Vitro Characterization. Polym. J. 2022, 14, 519. [CrossRef]
- Sravya, V.; Suresh, K.P.; Jagannath, P.V.; Sunitha, Ch. Formulate gastroretentive floating bioadhesive drug delivery system of nizatidine by direct compression technique. World J. Pharm. Sci. 2022, 10, 59–73. [CrossRef]
- Altreuter, D.H.; Kirtane, A.R.; Grant, T.; Kruger, C.; Traverso, G.; Bellinger, A.M. Changing the pill: developments toward the promise of an ultra-long-acting gastroretentive dosage form. Exp. Opin. Drug Deliv. 2018, 15, 189-1198. [CrossRef]
- Zhang, Ch.; Tang, J.; Liu, D.; Li, X.; Cheng, L.; Tang, X. Design and evaluation of an innovative floating and bioadhesive and multiparticulate drug delivery system based on hollow structure. Int. J. Pharm. 2016, 503, 41-55. [CrossRef]
- Patel, K.; Chouksey, R. A Recent Advantage on Gastroretentive Drug Delivery System: An Overview. Res. J. Pharm. Technol. 2023, 15, 36–44. [CrossRef]
- Pawar, V. K.; Kansal, Sh.; Asthana, Sh.; Chourasia, M. K. Industrial perspective of gastroretentive drug delivery systems: Physicochemical, biopharmaceutical, technological and regulatory consideration. Exp. Opin. Drug Deliv. 2012, 9, 551-565. [CrossRef]
- Tripathi, J.; Thapa, P.; Maharjan, R.; Jeong, S.H. Current State and Future Perspectives on Gastroretentive Drug Delivery Systems. Pharmaceutics 2019, 11, 193. [CrossRef]
- Singh, B.; Sharma, V.; Mohan, M.; Rohit; Sharma, P.; Ram, K. Design of ciprofloxacin impregnated dietary fiber psyllium-moringa gum-alginate network hydrogels via green approach for use in gastro-retentive drug delivery system, Bioact. Carbohydr. Diet. Fiber 2023, 29, 100345. [CrossRef]
- Farhaj, S.; Conway, B.R.; Ghori, M.U. Nanofibres in Drug Delivery Applications. Fibers 2023, 11, 21. [CrossRef]
- Jeong, S.H.; Park, K. Development of sustained release fast-disintegrating tablets using various polymer-coated ion-exchange resin complexes. Int. J. Pharm. 2008, 353, 195–204. [CrossRef]
- Das, S.; Kaur, S.; Rai, V. K. Gastro-retentive drug delivery systems: a recent update on clinical pertinence and drug delivery. Drug Deliv.Transl. Res. 2021, 11, 1849–1877. [CrossRef]
- Pal, R.; Pandey, P.; Nogai, L.; Arushi; Anand, A.; Suthar, Pa.; Keskar, M. S.; Kumar, V. The Future Perspectives and Novel Approach on Gastro Retentive Drug Delivery System (GRDDS) with Current State. Can. J. Clin. Pharmacol. 2023, 30, 594–613. [CrossRef]
- Zhu, X.; Qi, X.; Wu, Z.; Zhang, Z.; Xing, J.; Li, X. Preparation of multiple-unit floating-bioadhesive cooperative minitablets for improving the oral bioavailability of famotidine in rats, Drug Deliv. 2014, 21, 459–466. [CrossRef]
- Darbasizadeha, B.; Motasadizadehb, H.; Foroughi-Niac, B.; Farhadnejad, H. Tripolyphosphate-crosslinked chitosan/poly (ethylene oxide) electrospun nanofibrous mats as a floating gastro-retentive delivery system for ranitidine hydrochloride. J. Pharm. Biomed. Anal. 2018, 153, 63–75. [CrossRef]
- Meng, S.; Wang, S.; Piao, M.G. Prescription Optimization of Gastroretentive Furosemide Hollow-Bioadhesive Microspheres via Box-Behnken Design: In Vitro Characterization and in Vivo Evaluation. J. Drug Deliv. Sci. Technol. 2022, 70, 103235. [CrossRef]
- Ngwuluka, N.C.; Choonara, Y.E.; Modi, G.; du Toit, L.C.; Kumar, P.; Ndesendo, V.M.K.; Pillay V.A. Design of an Interpolyelectrolyte Gastroretentive Matrix for the Site-Specific Zero-Order Delivery of Levodopa in Parkinson’s Disease. AAPS PharmSciTech. 2013, 14, 605–619. [CrossRef]
- Gallardo, D.; Skalsky, B.; Kleinebudde, P. Controlled release solid dosage forms using combinations of (meth)acrylate copolymer. Pharm. Dev. Technol. 2008, 13, 413–423. [CrossRef]
- Siepmann, F.; Siepmann, J.; Walther, M.; MacRae, R. J.; Bodmeier, R. Polymer blends for controlled release coatings. J. Control. Rel. 2008, 125, 1−15. [CrossRef]
- Mustafin, R.I. Interpolymer combinations of chemically complementary grades of Eudragit copolymers: A new direction in the design of peroral solid dosage forms of drug delivery systems with controlled release (review). Pharm. Chem. J. 2011, 45, 285–295. [CrossRef]
- Moustafine, R.I. Role of macromolecular interactions of pharmaceutically acceptable polymers in functioning oral drug delivery systems. Russ. J. Gen. Chem. 2014, 84, 364-367. [CrossRef]
- Moustafine, R.I.; Kabanova, T.V.; Kemenova, V.A.; Van den Mooter, G. Characteristics of interpolyelectrolyte complexes of Eudragit E100 with Eudragit L100. J. Control. Rel. 2005, 103, 191–198. [CrossRef]
- Moustafine, R. I.; Zaharov, I. M.; Kemenova, V. A. Physicochemical characterization and drug release properties of Eudragit E PO/Eudragit L100-55 interpolyelectrolyte complexes. Eur. J. Pharm. Biopharm. 2006, 63, 26−36. [CrossRef]
- Moustafine, R.I.; Bobyleva, V.L.; Bukhovets, A.V.; Garipova, V.R.; Kabanova, T.V.; Kemenova, V.A.; Van den Mooter, G. Structural transformations during swelling of polycomplex matrices based on countercharged (meth)acrylate copolymers (Eudragit® EPO/Eudragit® L100-55). J. Pharm. Sci. 2011, 100, 874−885. [CrossRef]
- Moustafine, R.I.; Bukhovets, A.V.; Sitenkov, A.Y.; Kemenova, V.A.; Rombaut, P.; Van den Mooter, G. Eudragit® E PO as a complementary material for designing oral drug delivery systems with controlled release properties: comparative evaluation of new interpolyelectrolyte complexes with countercharged Eudragit® L100 copolymers. Mol. Pharm. 2013, 10, 2630–2641. [CrossRef]
- Moustafine, R.I.; Sitenkov, A.Y.; Bukhovets, A.V.; Nasibullin, Sh.F.; Appeltans, B.; Kabanova, T.V.; Khutoryanskiy, V.V.; Van den Mooter, G. Indomethacin-containing interpolyelectrolyte complexes based on Eudragit® E PO/S 100 copolymers as a novel drug delivery system. Int. J. Pharm. 2017, 524, 121–133. [CrossRef]
- Sauer, D.; McGinity, J.W. Properties of theophylline tablets dry powder coated with Eudragit E PO and Eudragit L 100−55. Pharm. Dev. Technol. 2009, 16, 632−641. [CrossRef]
- Obeidat, W. M.; Abu Znait, A. H.; Sallam, A. A. Novel combination of anionic and cationic polymethacrylate polymers for sustained release tablet preparation. Drug Dev. Ind. Pharm. 2008, 34, 650−660. [CrossRef]
- Obeidat, W. M.; Abu Znait, A. H.; Sallam, A. A. Sustained release tablets containing soluble polymethacrylates: Comparison with tableted polymethacrylate IPEC polymers. AAPS PharmSciTech. 2010, 11, 54−63. [CrossRef]
- Bani-Jaber, A. H.; Alkawareek, M. J.; Al-Gousous, J. J.; Abu Helwa, A. Y. Floating and sustained-release characteristics of efferverscent tablets prepared with a mixed matrix of Eudragit L100-55 and Eudragit E PO. Chem. Pharm. Bull. 2011, 59. [CrossRef]
- Bani-Jaber, A. H.; Al-Aani, L.; Alkhatib, H.; Al-Khalidi, B. Prolonged intragastric drug delivery mediated by Eudragit E carrageenan polyelectrolyte matrix tablets. AAPS PharmSciTech. 2011, 12, 354−361. [CrossRef]
- Quinteros, D. A.; Manzo, R. H.; Allemandi, D. A. Interaction between Eudragit E100 and anionic drugs: Addition of anionic polyelectrolytes and their influence on drug release performance. J. Pharm. Sci. 2011, 100, 4664−4673. [CrossRef]
- Wulff, R., Leopold, C.S. Coatings from blends of Eudragit® RL and L55: A novel approach in pH-controlled drug release. Int. J. Pharm. 2014, 476, 78–87. [CrossRef]
- Wulff, R., Leopold, C.S. Coatings of Eudragit® RL and L55 blends: Investigations on the drug release mechanism. AAPS PharmSciTech. 2016, 17, 493–503. [CrossRef]
- Garcíaa, M.C.; Martinellic, M.; Ponced, N.E.; Sanmarcoe, L.M.; Aokie, M.P.; Manzo, R.H.; Jimenez-Kairuz, A.F. Multi-kinetic release of benznidazole-loaded multiparticulate drug delivery systems based on polymethacrylate interpolyelectrolyte complexes. Eur. J. Pharm. Sci. 2018, 120, 107–122. [CrossRef]
- Sester, C.; Ofridam, F.; Lebaz, N.; Gagnière, E.; Mangin, D.; Elaissari, A. pH-Sensitive methacrylic acid–methyl methacrylate copolymer Eudragit L100 and dimethylaminoethyl methacrylate, butyl methacrylate, and methyl methacrylate tri-copolymer Eudragit E100. Polym. Adv. Technol. 2020, 31, 440–450. [CrossRef]
- Bukhovets, A.V., Fotaki, N., Khutoryanskiy, V.V., Moustafine, R.I. Interpolymer complexes of Eudragit® copolymers as novel carriers for colon-specific drug delivery. Polymers 2020, 12, 1459. [CrossRef]
- Bukhovets, A.V.; Sitenkov, A.Y.; Moustafine, R.I. Comparative evaluation study of polycomplex carriers based on Eudragit® EPO/S100 copolymers prepared in different media. Polym. Adv. Technol. 2021, 32, 2761–2769. [CrossRef]
- Gordeeva, D.S.; Sitenkova, A.V.; Moustafine, R.I. Interpolyelectrolyte complexes based on Eudragit® copolymers as carriers for bioadhesive gastroretentive metronidazole delivery system. Drug Dev. Reg. 2020, 9, 72–76. [CrossRef]
- Lankalapalli, S.; Kolapalli, V.R.M. Polyelectrolyte complexes: A review of their applicability in drug delivery technology. Ind. J. Pharm. Sci. 2009, 71, 481–487. [CrossRef]
- De Robertis, S.; Bonferoni, M.C.; Elviri, L.; Sandri, G.; Caramella, C.; Bettini, R. Advances in oral controlled drug delivery: the role of drug—polymer and interpolymer non-covalent interactions. Exp. Opin. Drug Deliv. 2015, 12, 441–453. [CrossRef]
- Porfiryeva, N.N.; Nasibullin, S.F.; Abdullina, S.G.; Tukhbatullina, I.K.; Moustafine, R.I.; Khutoryanskiy, V.V. Acrylated Eudragit® E PO as a novel polymeric excipient with enhanced mucoadhesive properties for application in nasal drug delivery. Int. J. Pharm. 2019, 562, 241−248. [CrossRef]
- Porfiryeva, N.N.; Semina, I.I.; Salakhov, I.A.; Moustafine, R.I.; Khutoryanskiy, V.V. Mucoadhesive and mucus-penetrating interpolyelectrolyte complexes for nose-to-brain drug delivery. Nanomedicine: NBM 2021, 37, 102432. [CrossRef]
- Shin, S.; Kim, T.H.; Jeong, S.W.; Chung, S.E.; Lee, D.Y.; Kim, D.H.; Shin, B.S. Development of a gastroretentive delivery system for acyclovir by 3D printing technology and its in vivo pharmacokinetic evaluation in Beagle dogs. PLoS ONE 2017, 14, e0216875. [CrossRef]
- Farshforoush, P.; Ghanbarzadeh, S.; Gpganian, A.M.; Hamishehkar, H. Novel metronidazole-loaded hydrogel as a gastroretentive drug delivery system. Iran. Polym. J. 2017, 26, 895–901. [CrossRef]
- Peppas, N.; Sahlin, J. A simple equation for the description of solute release. III. Coupling of diffusion and relaxation. Int. J. Pharm. 1989, 57, 169–172. [CrossRef]
- Boddupalli, B.M.; Mohammed, Z.N.; Nath, R.A.; Banji, D. Mucoadhesive drug delivery system: An overview. J. Adv. Pharm. Technol. Res. 2010, 1, 381−387. [CrossRef]
- Zhang, S.; Fang, M.; Zhang, Q.; Li, X.; Zhang, T. Evaluating the bioequivalence of metronidazole tablets and analyzing the effect of in vitro dissolution on in vivo absorption based on PBPK modeling. Drug Dev. Ind. Pharm. 2019, 45, 1646–1653. [CrossRef]
- 53. Sulistiawati; Dwipayanti, K.S.; Azhar, M.; Rahman, L.; Pakki, E.; Himawan, A.; Permana, A.D. Enhanced skin localization of metronidazole using solid lipid microparticles incorporated into polymeric hydrogels for potential improved of rosacea treatment: An ex vivo proof of concept investigation, Int. J. Pharm. 2022, 628, 122327. [CrossRef]
- Wu, F.; Cristofoletti, R.; Zhao, L.; Rostami-Hodjegan, A. Scientific considerations to move towards biowaiver for biopharmaceutical classification system classIII drugs: How modeling and simulation can help. Biopharm. Drug Dispos. 2021, 42, 118–127. [CrossRef]
- Mady, O.I.; Osman, M.A.; Sarhan, N.I.; Shatla, A.A.; Haggag, Y.A.; Bioavailability enhancement of acyclovir by honey: Analytical and histological evidence. J. Drug Deliv. Sci. Technol. 2023, 80, 104155. [CrossRef]
- Filippova, N.I.; Teslev, A.A. Application of mathematical modeling in the evaluation of in vitro drug release. Drug Dev. Reg. 2017, 4, 218–226.
- Unagollaa, J.M.; Jayasuriya, A.C. Drug transport mechanisms and in vitro release kinetics of vancomycin encapsulated chitosan-alginate polyelectrolyte microparticles as a controlled drug delivery system. Eur. J. Pharm. Sci. 2018, 114, 199–209. [CrossRef]
Figure 1.
External appearance of IPECs and PhMs matrices during the swelling test.
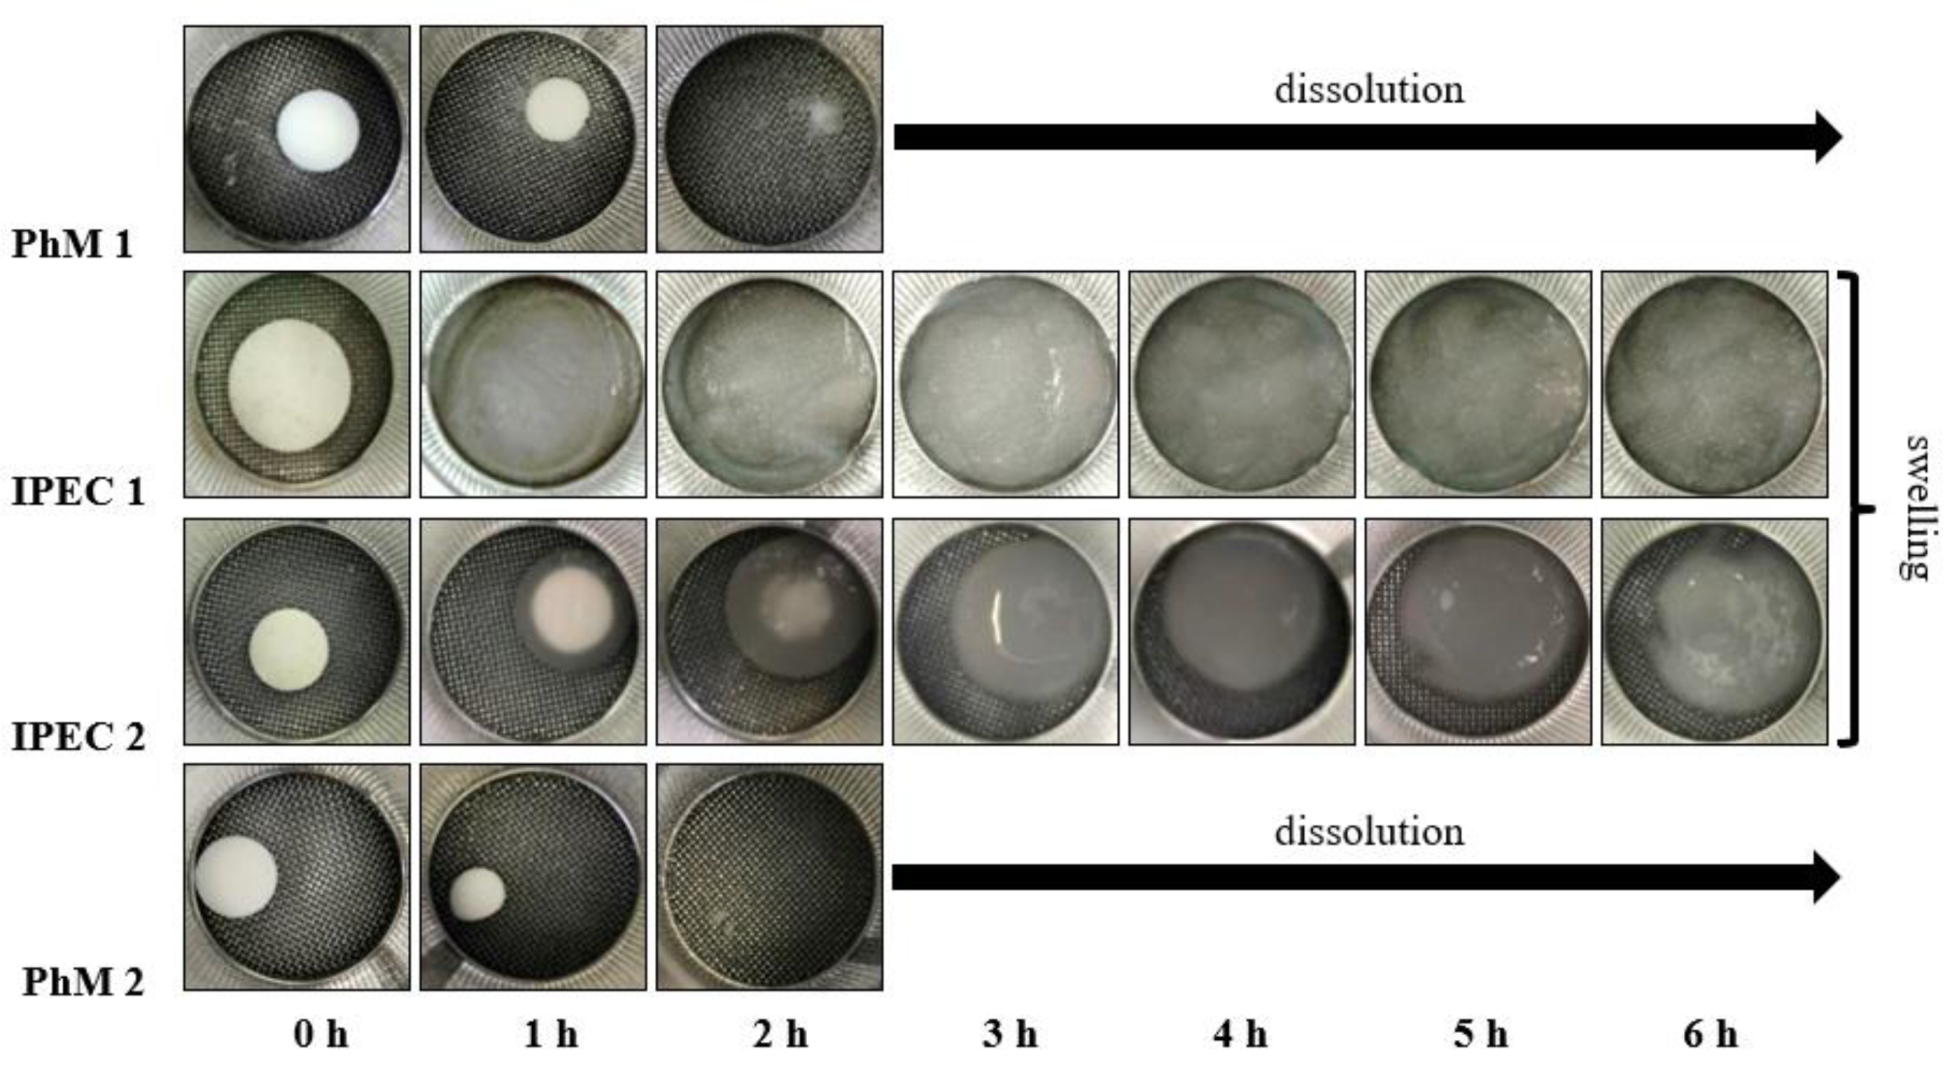
Figure 2.
Swelling profiles of IPEC and PhM matrices in mimicking fasted stomach medium (0.1 M HCl).
Figure 2.
Swelling profiles of IPEC and PhM matrices in mimicking fasted stomach medium (0.1 M HCl).
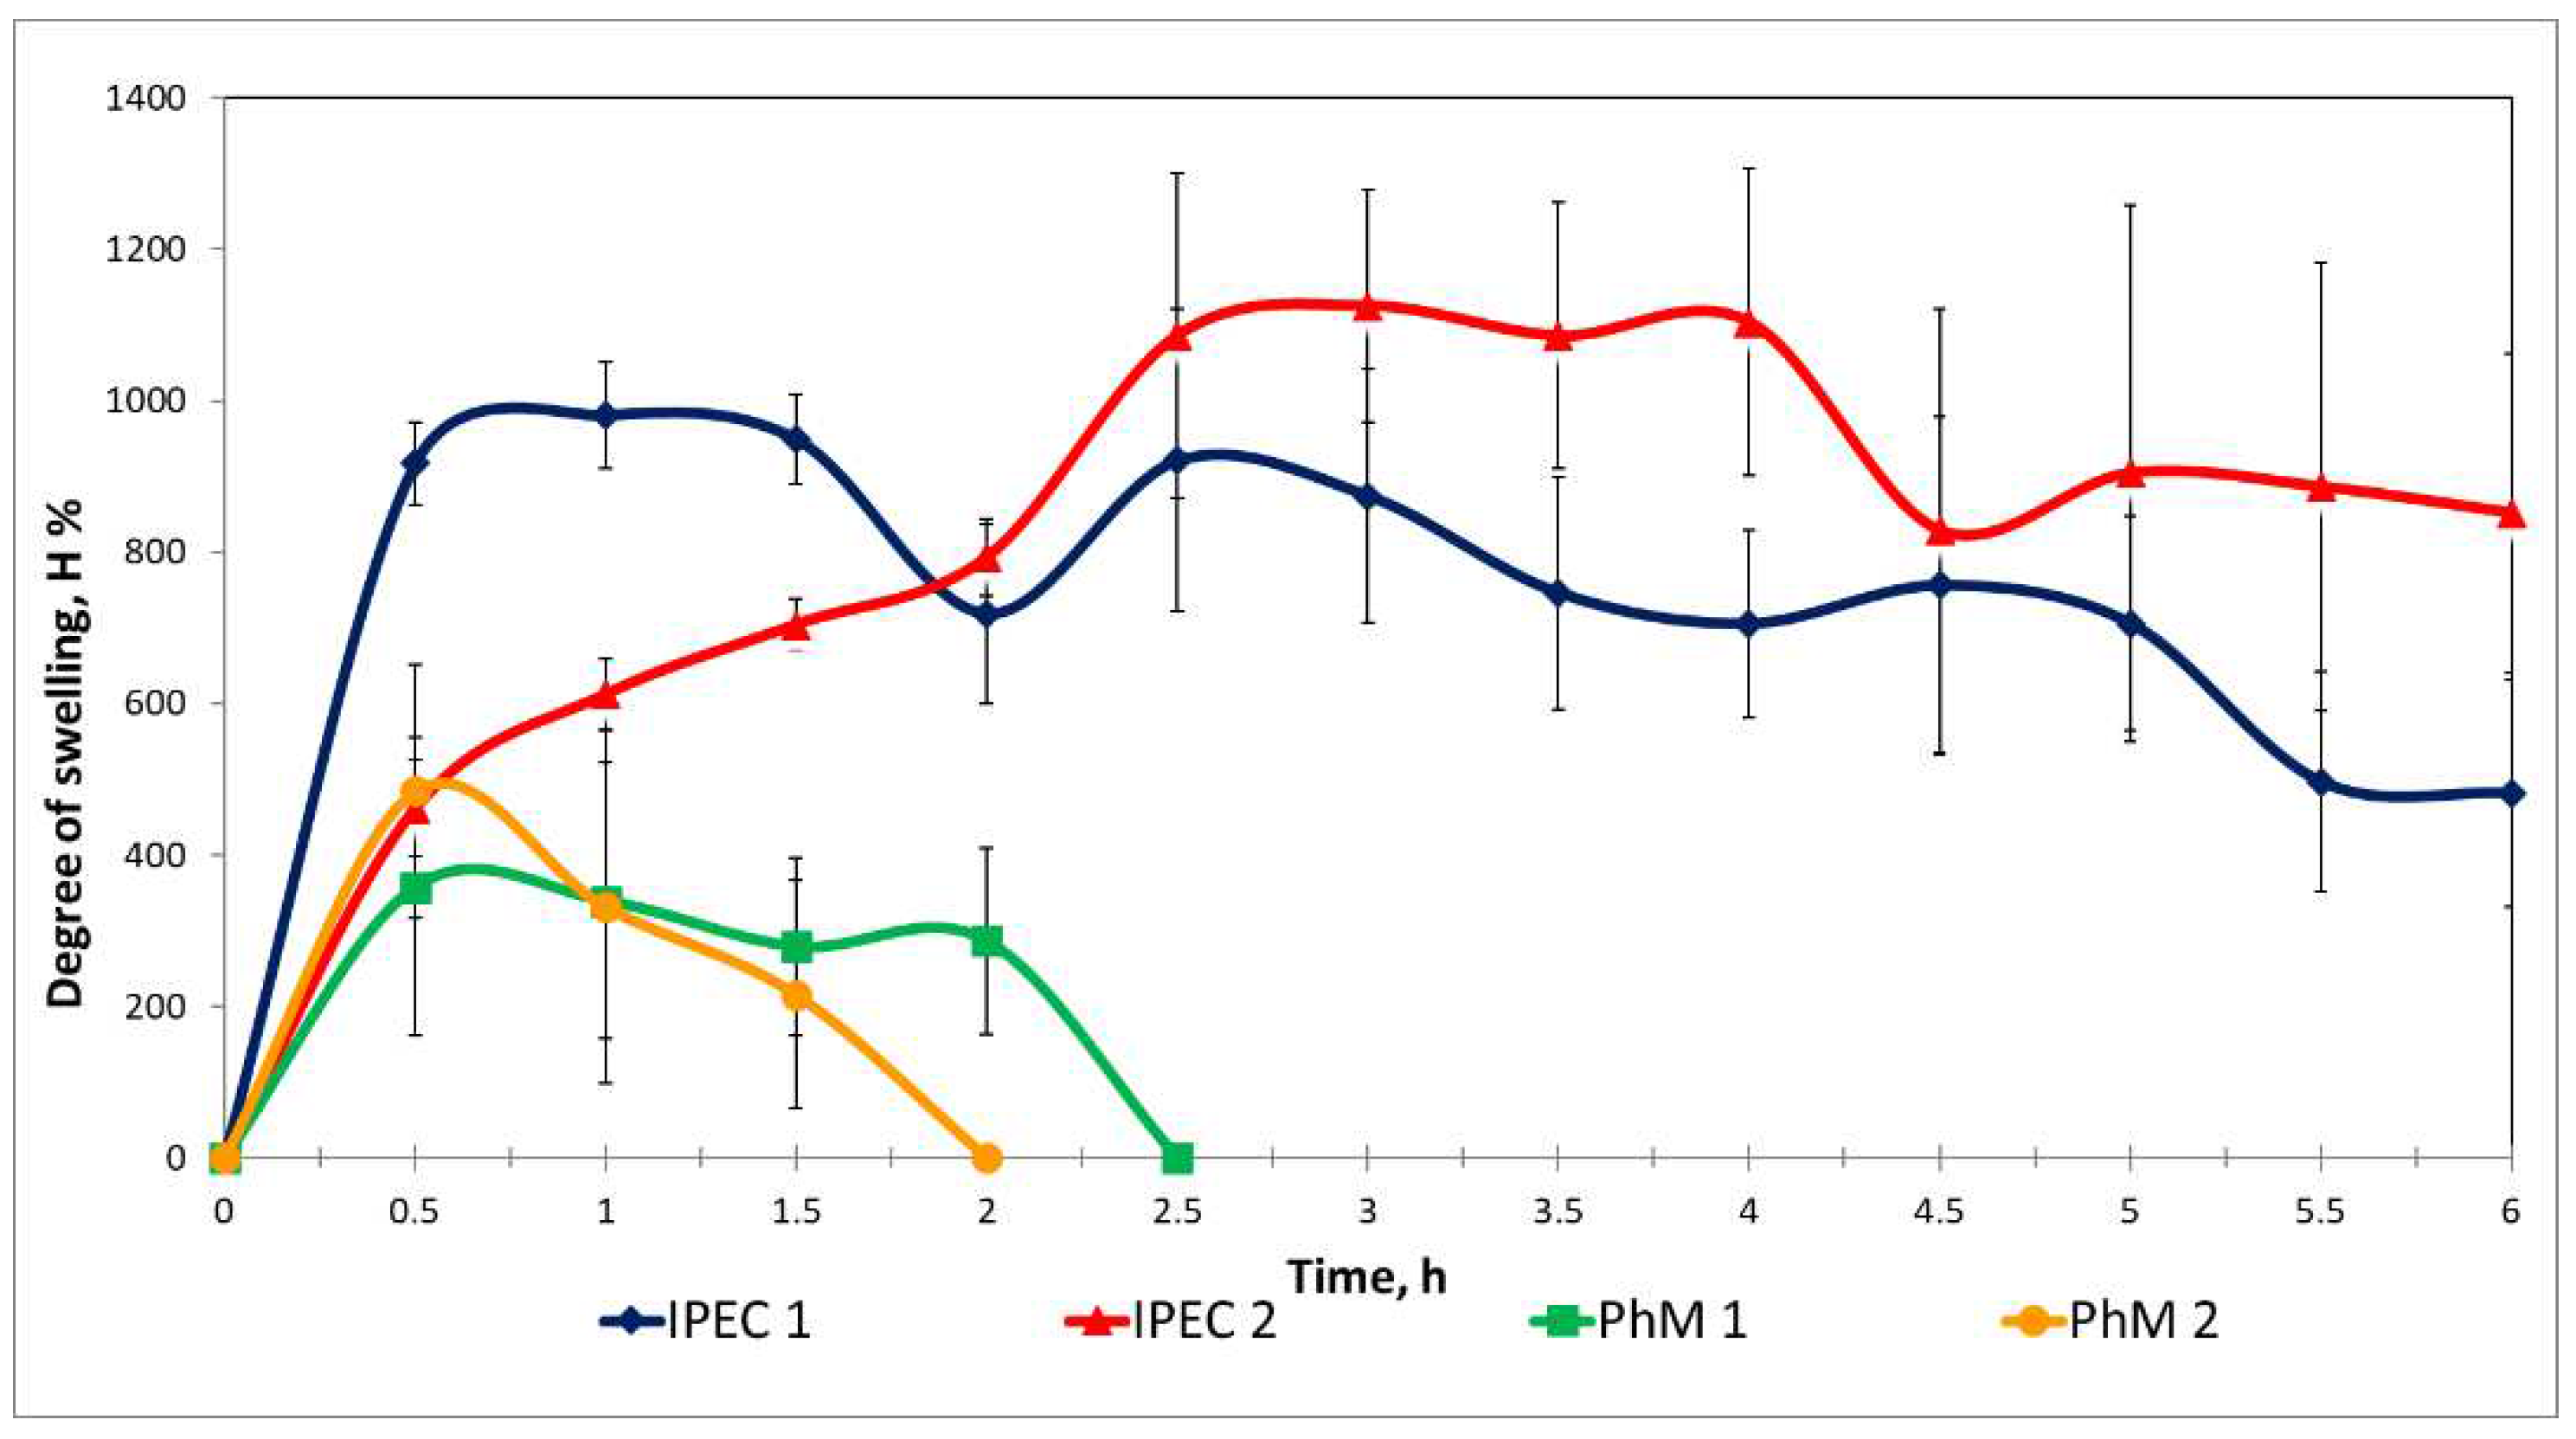
Figure 3.
FTIR-spectra of IPEC 1 after swelling in mimicking fasted stomach medium (0.1 M HCl).
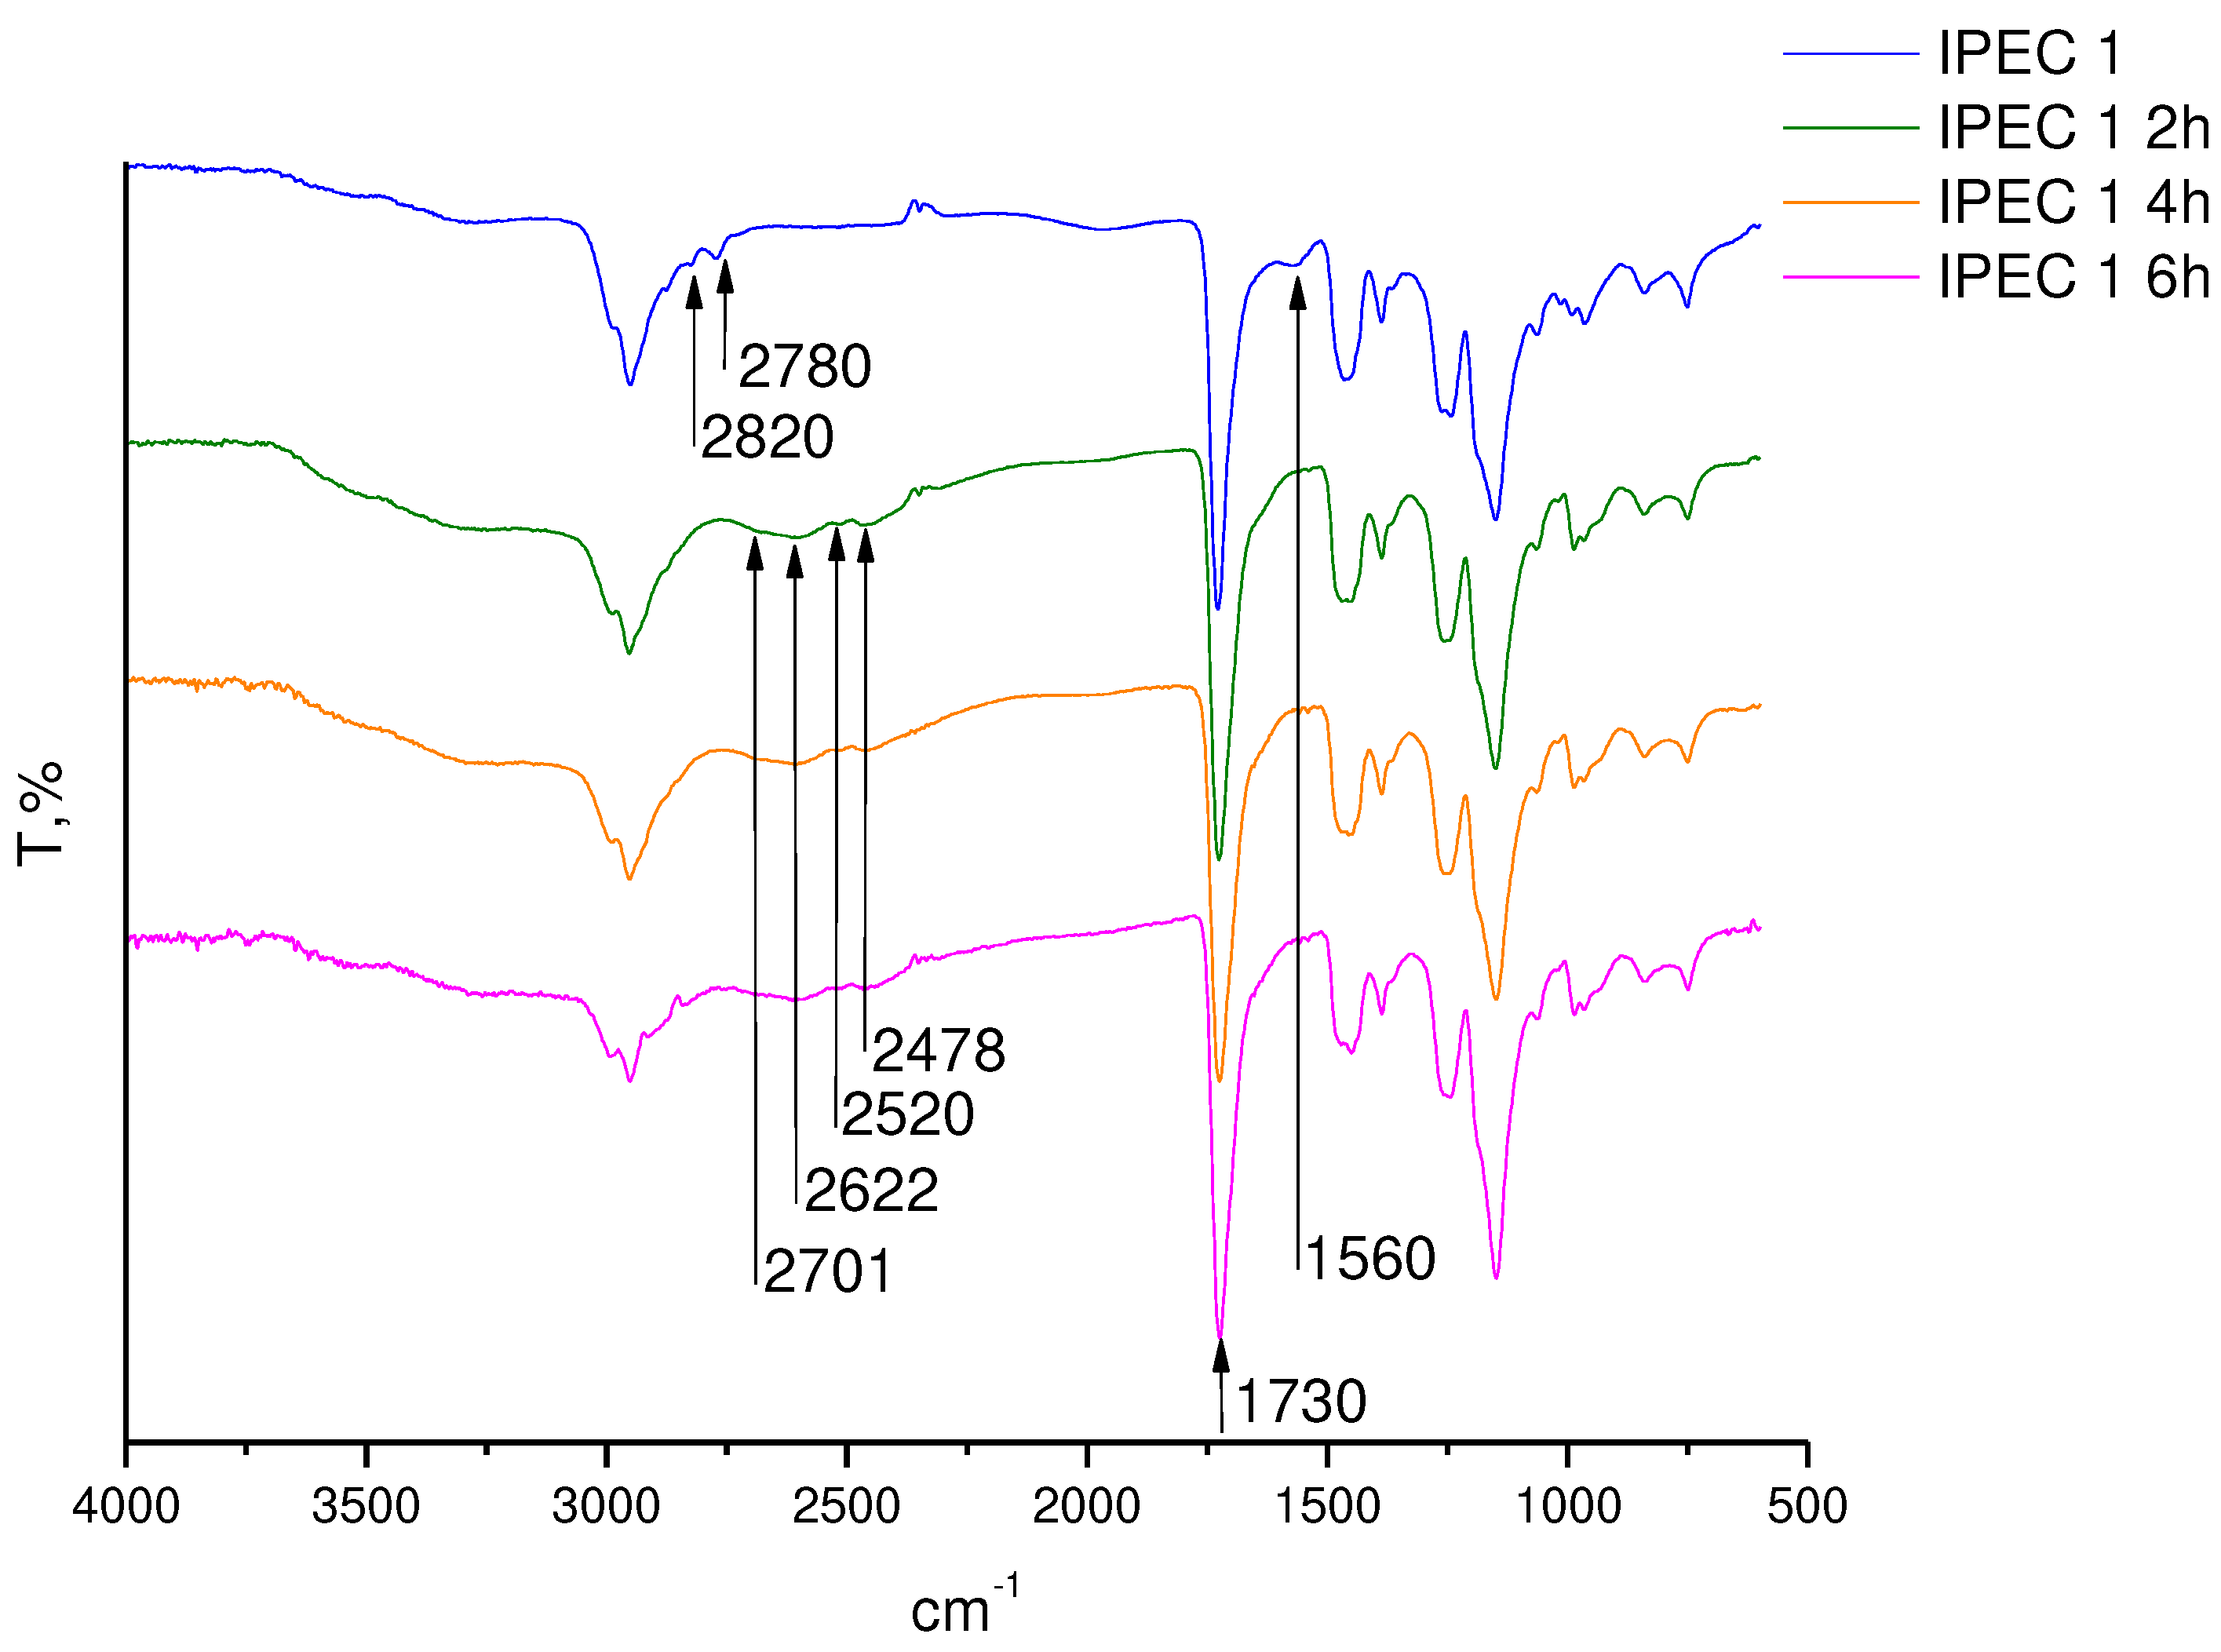
Figure 4.
FTIR-spectra of IPEC 2 after swelling in mimicking fasted stomach medium (0.1 M HCl).
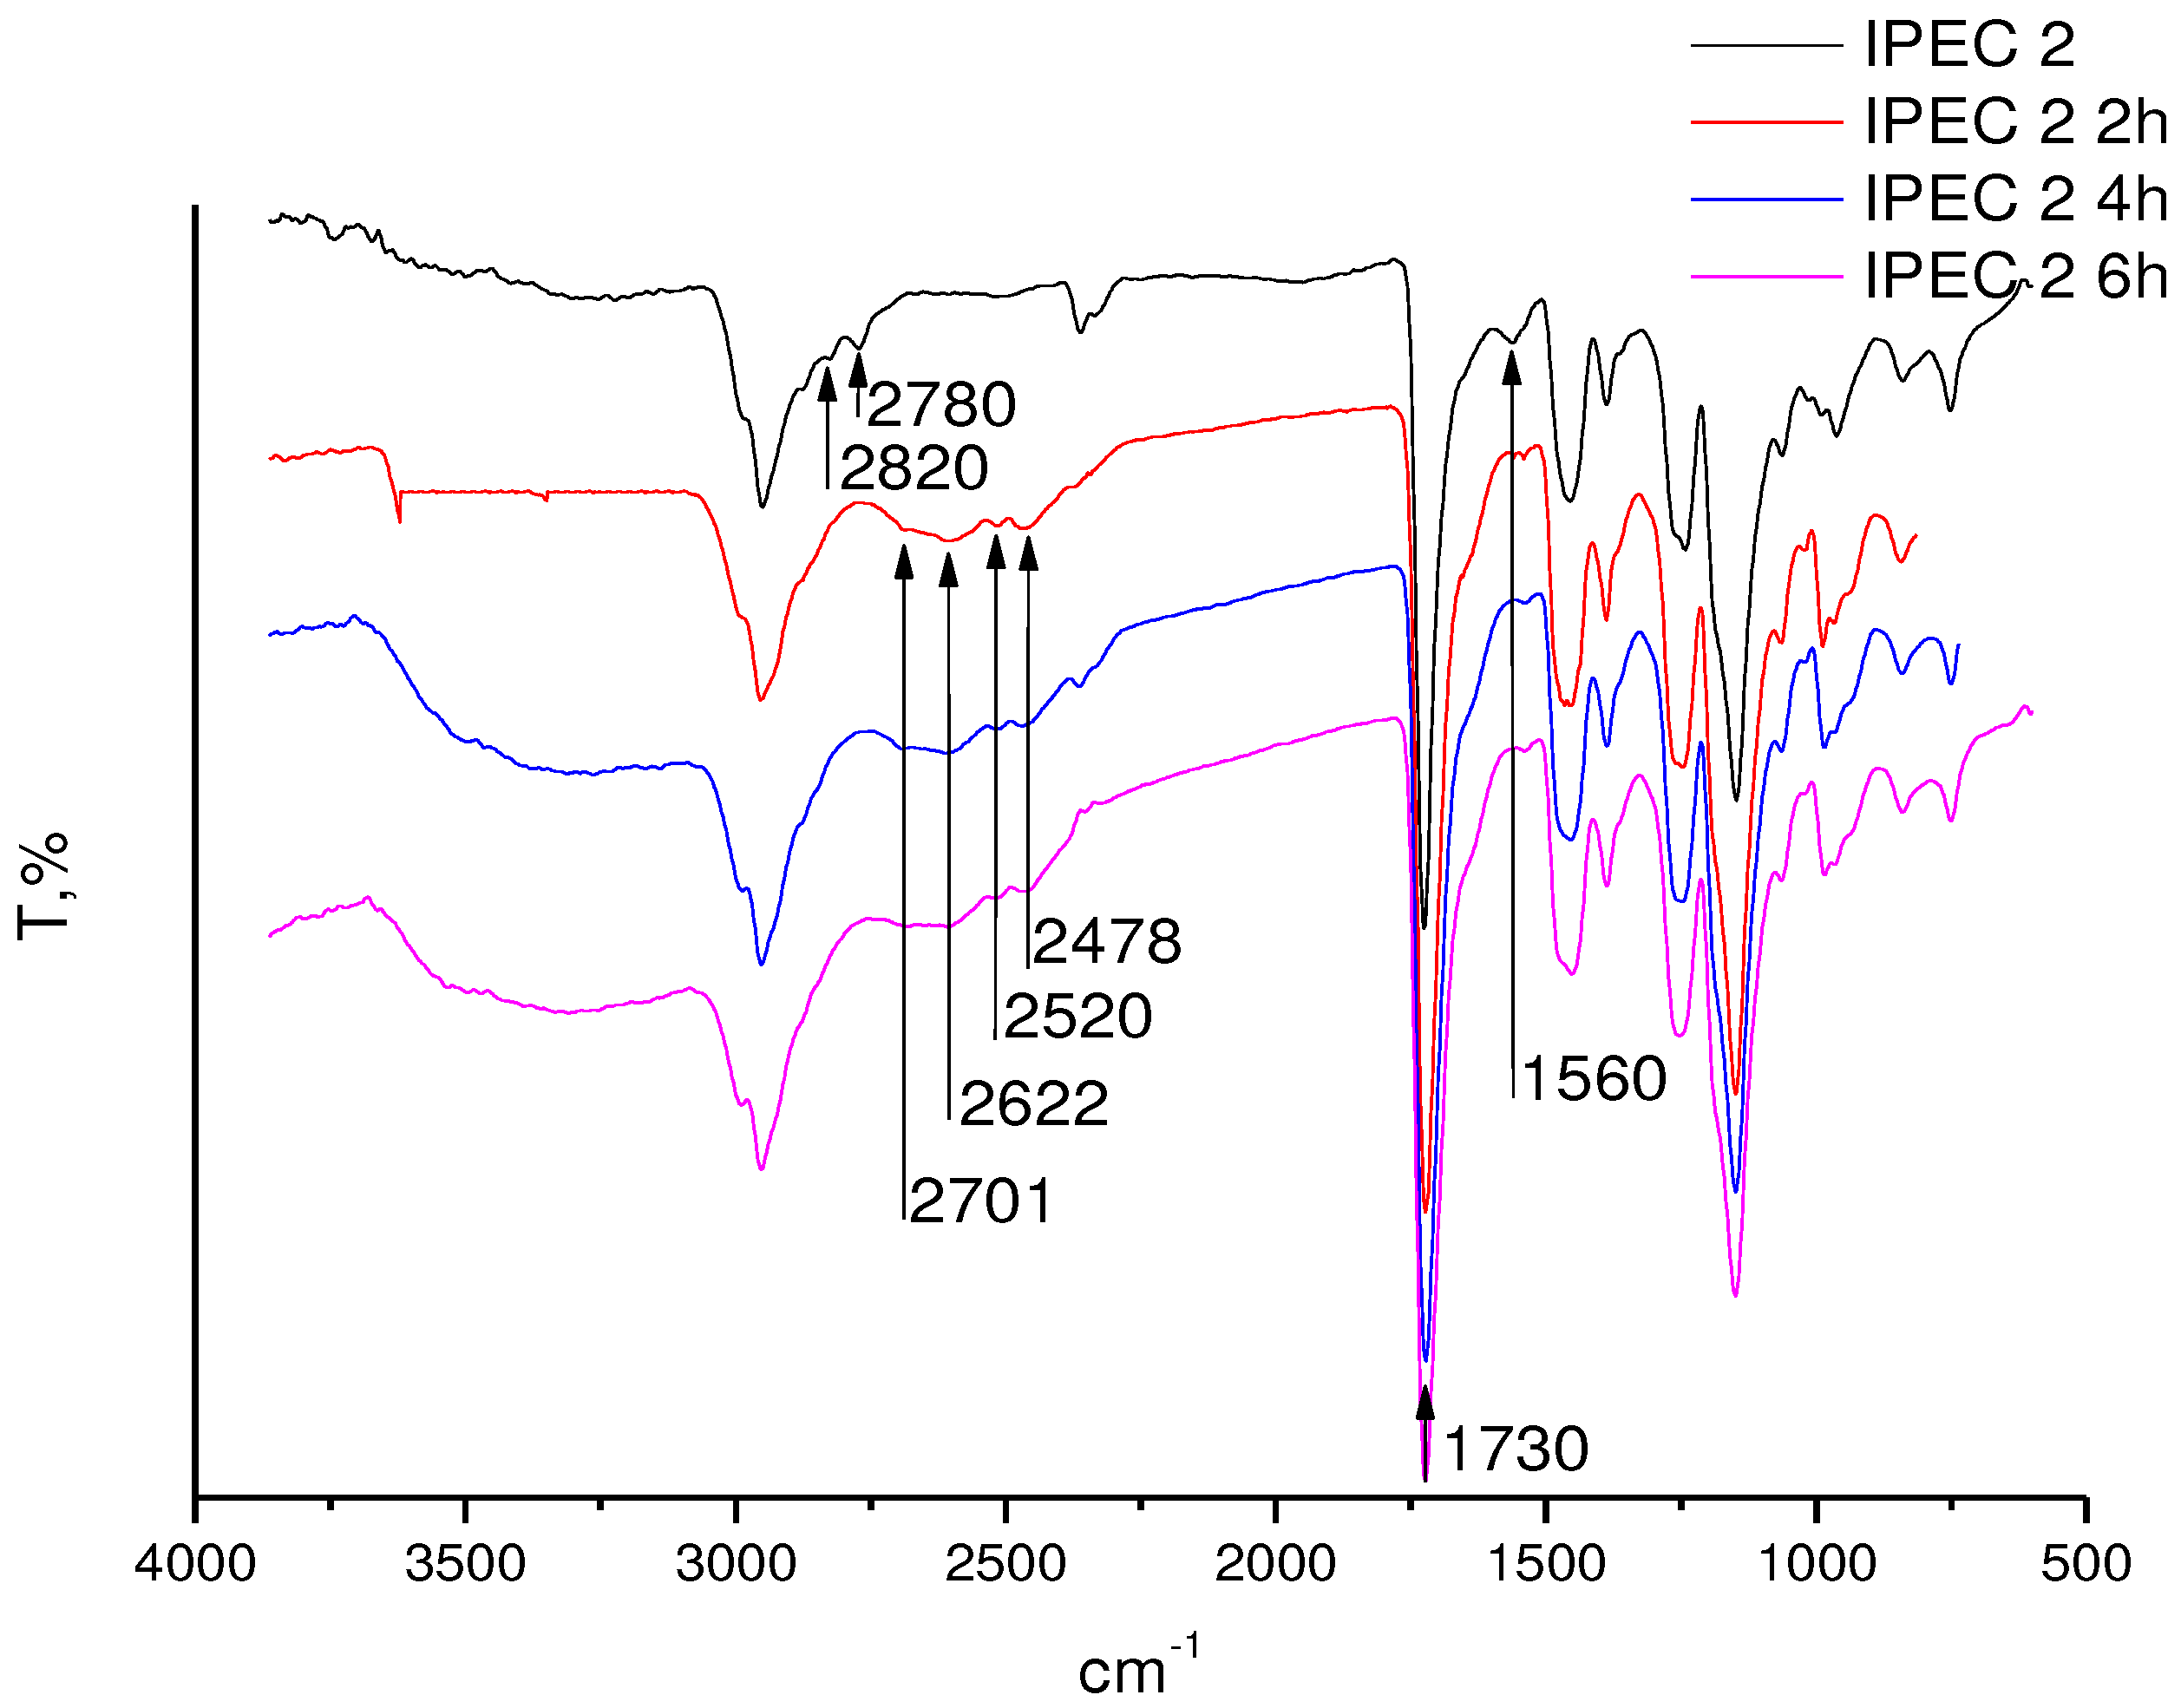
Figure 5.
Results of measuring peak positive force of IPECs and PhMs from mucin compacts (N) (n = 3, mean ± SD, “ns” represents not significant).
Figure 5.
Results of measuring peak positive force of IPECs and PhMs from mucin compacts (N) (n = 3, mean ± SD, “ns” represents not significant).
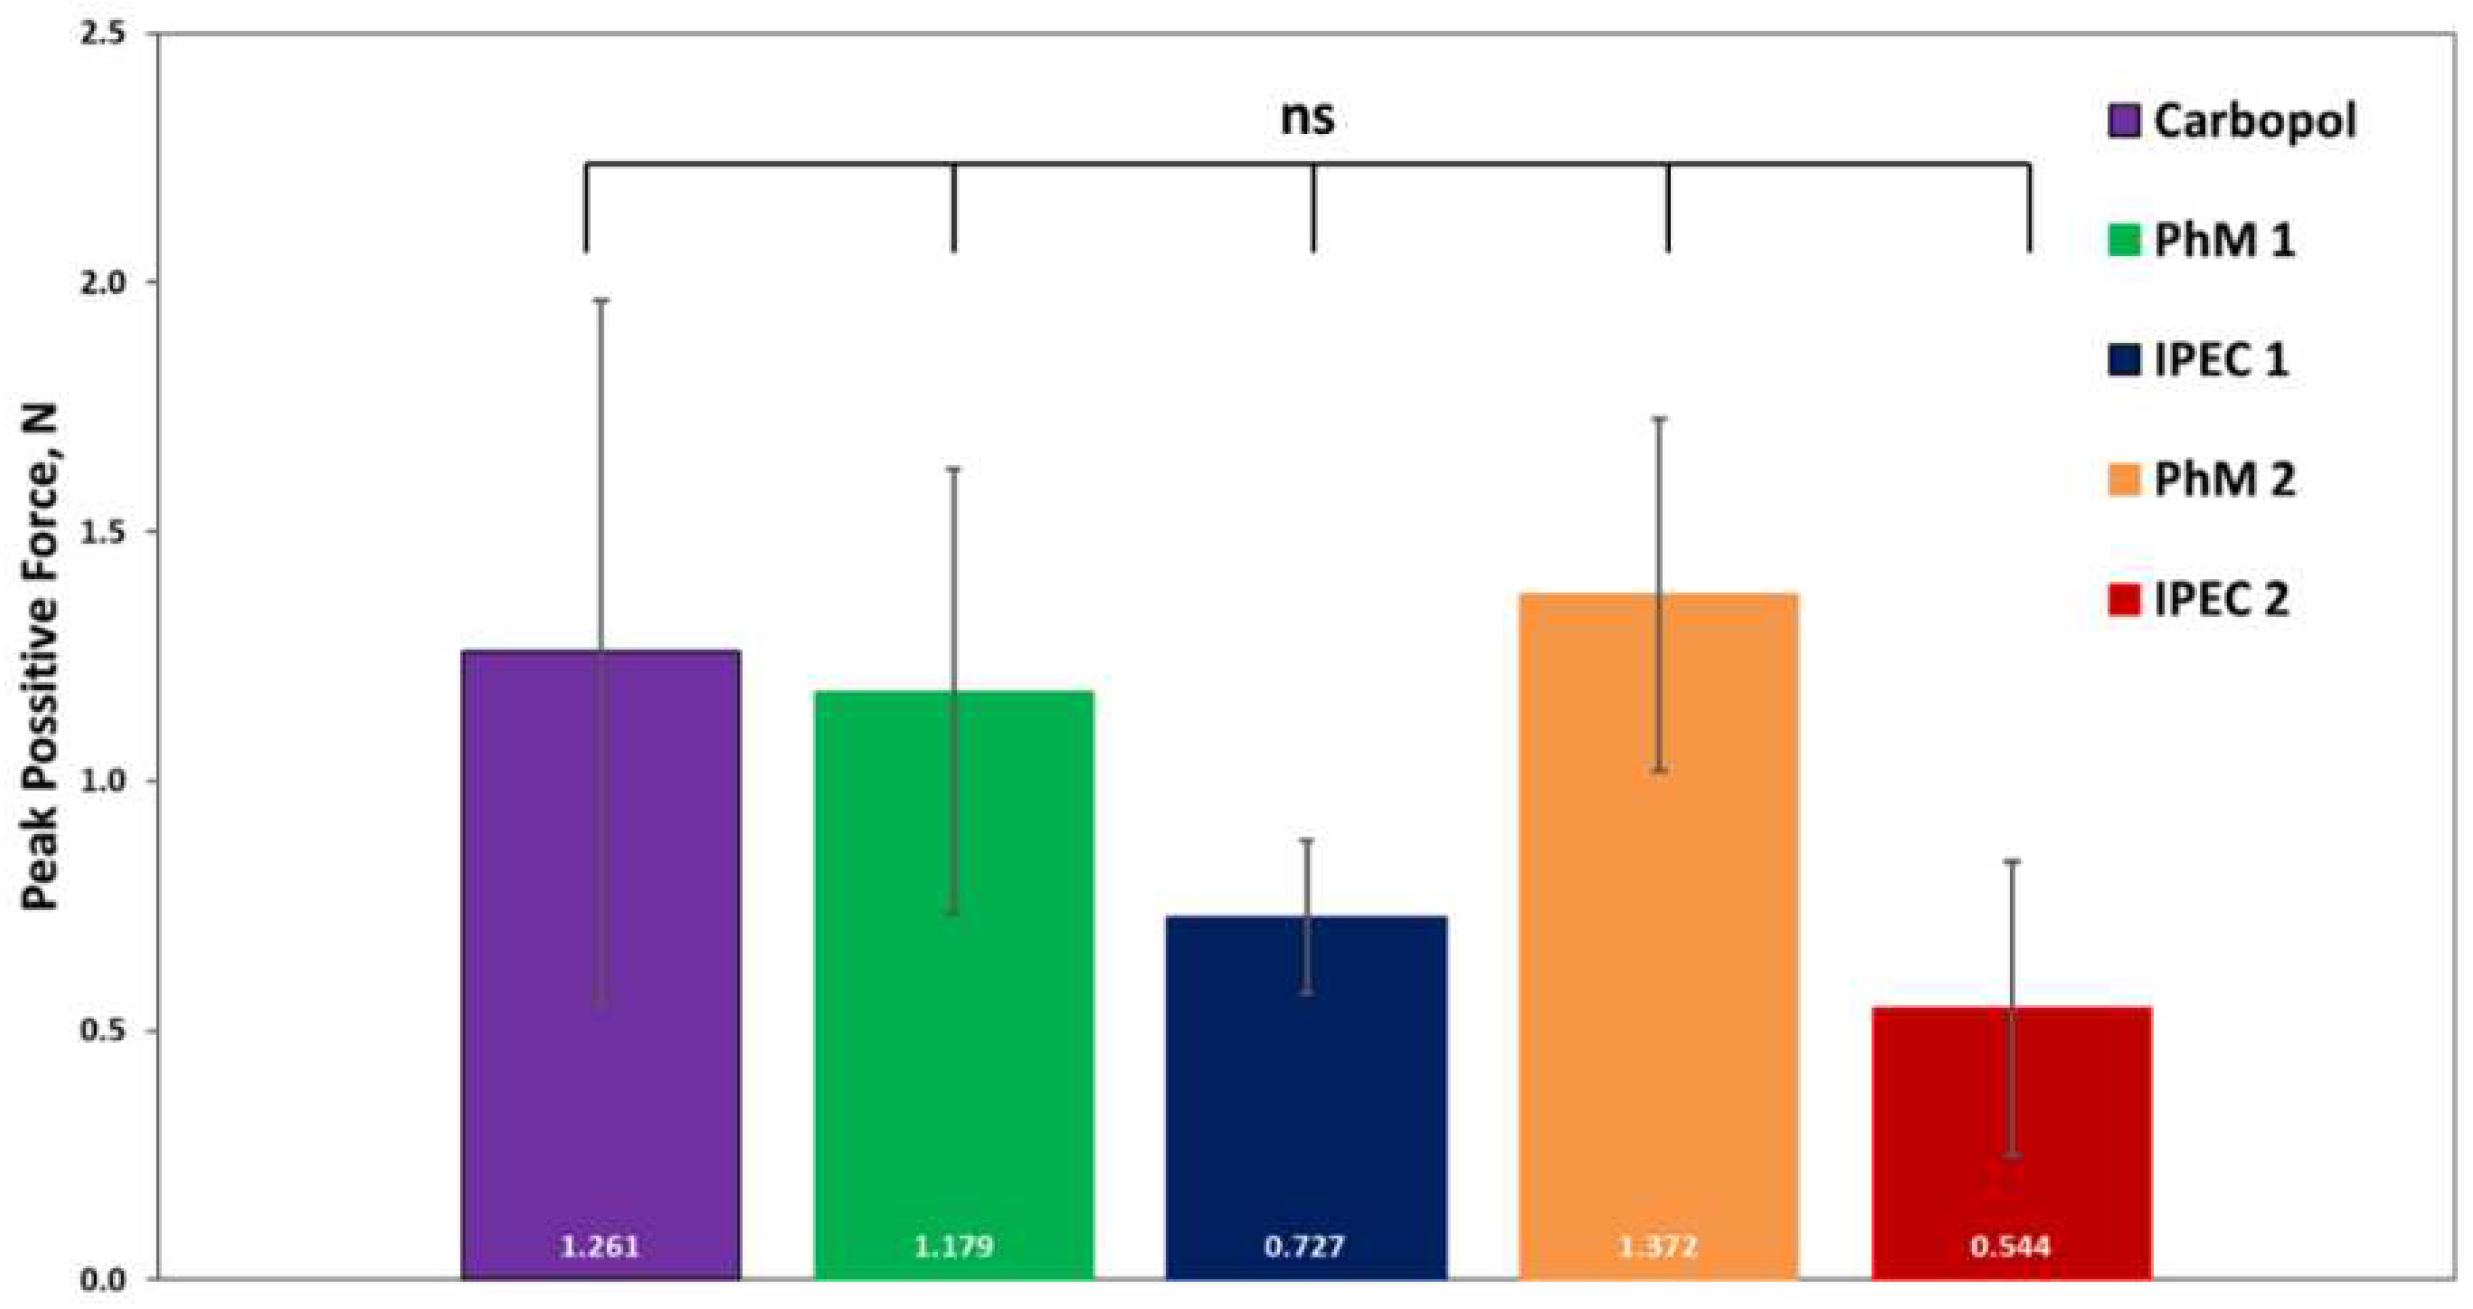
Figure 6.
Results of measuring peak positive force of IPECs and PhMs from pig stomach mucosa (N) (n = 3, mean ± SD, “*” represents p < 0.05, “ns” represents not significant).
Figure 6.
Results of measuring peak positive force of IPECs and PhMs from pig stomach mucosa (N) (n = 3, mean ± SD, “*” represents p < 0.05, “ns” represents not significant).
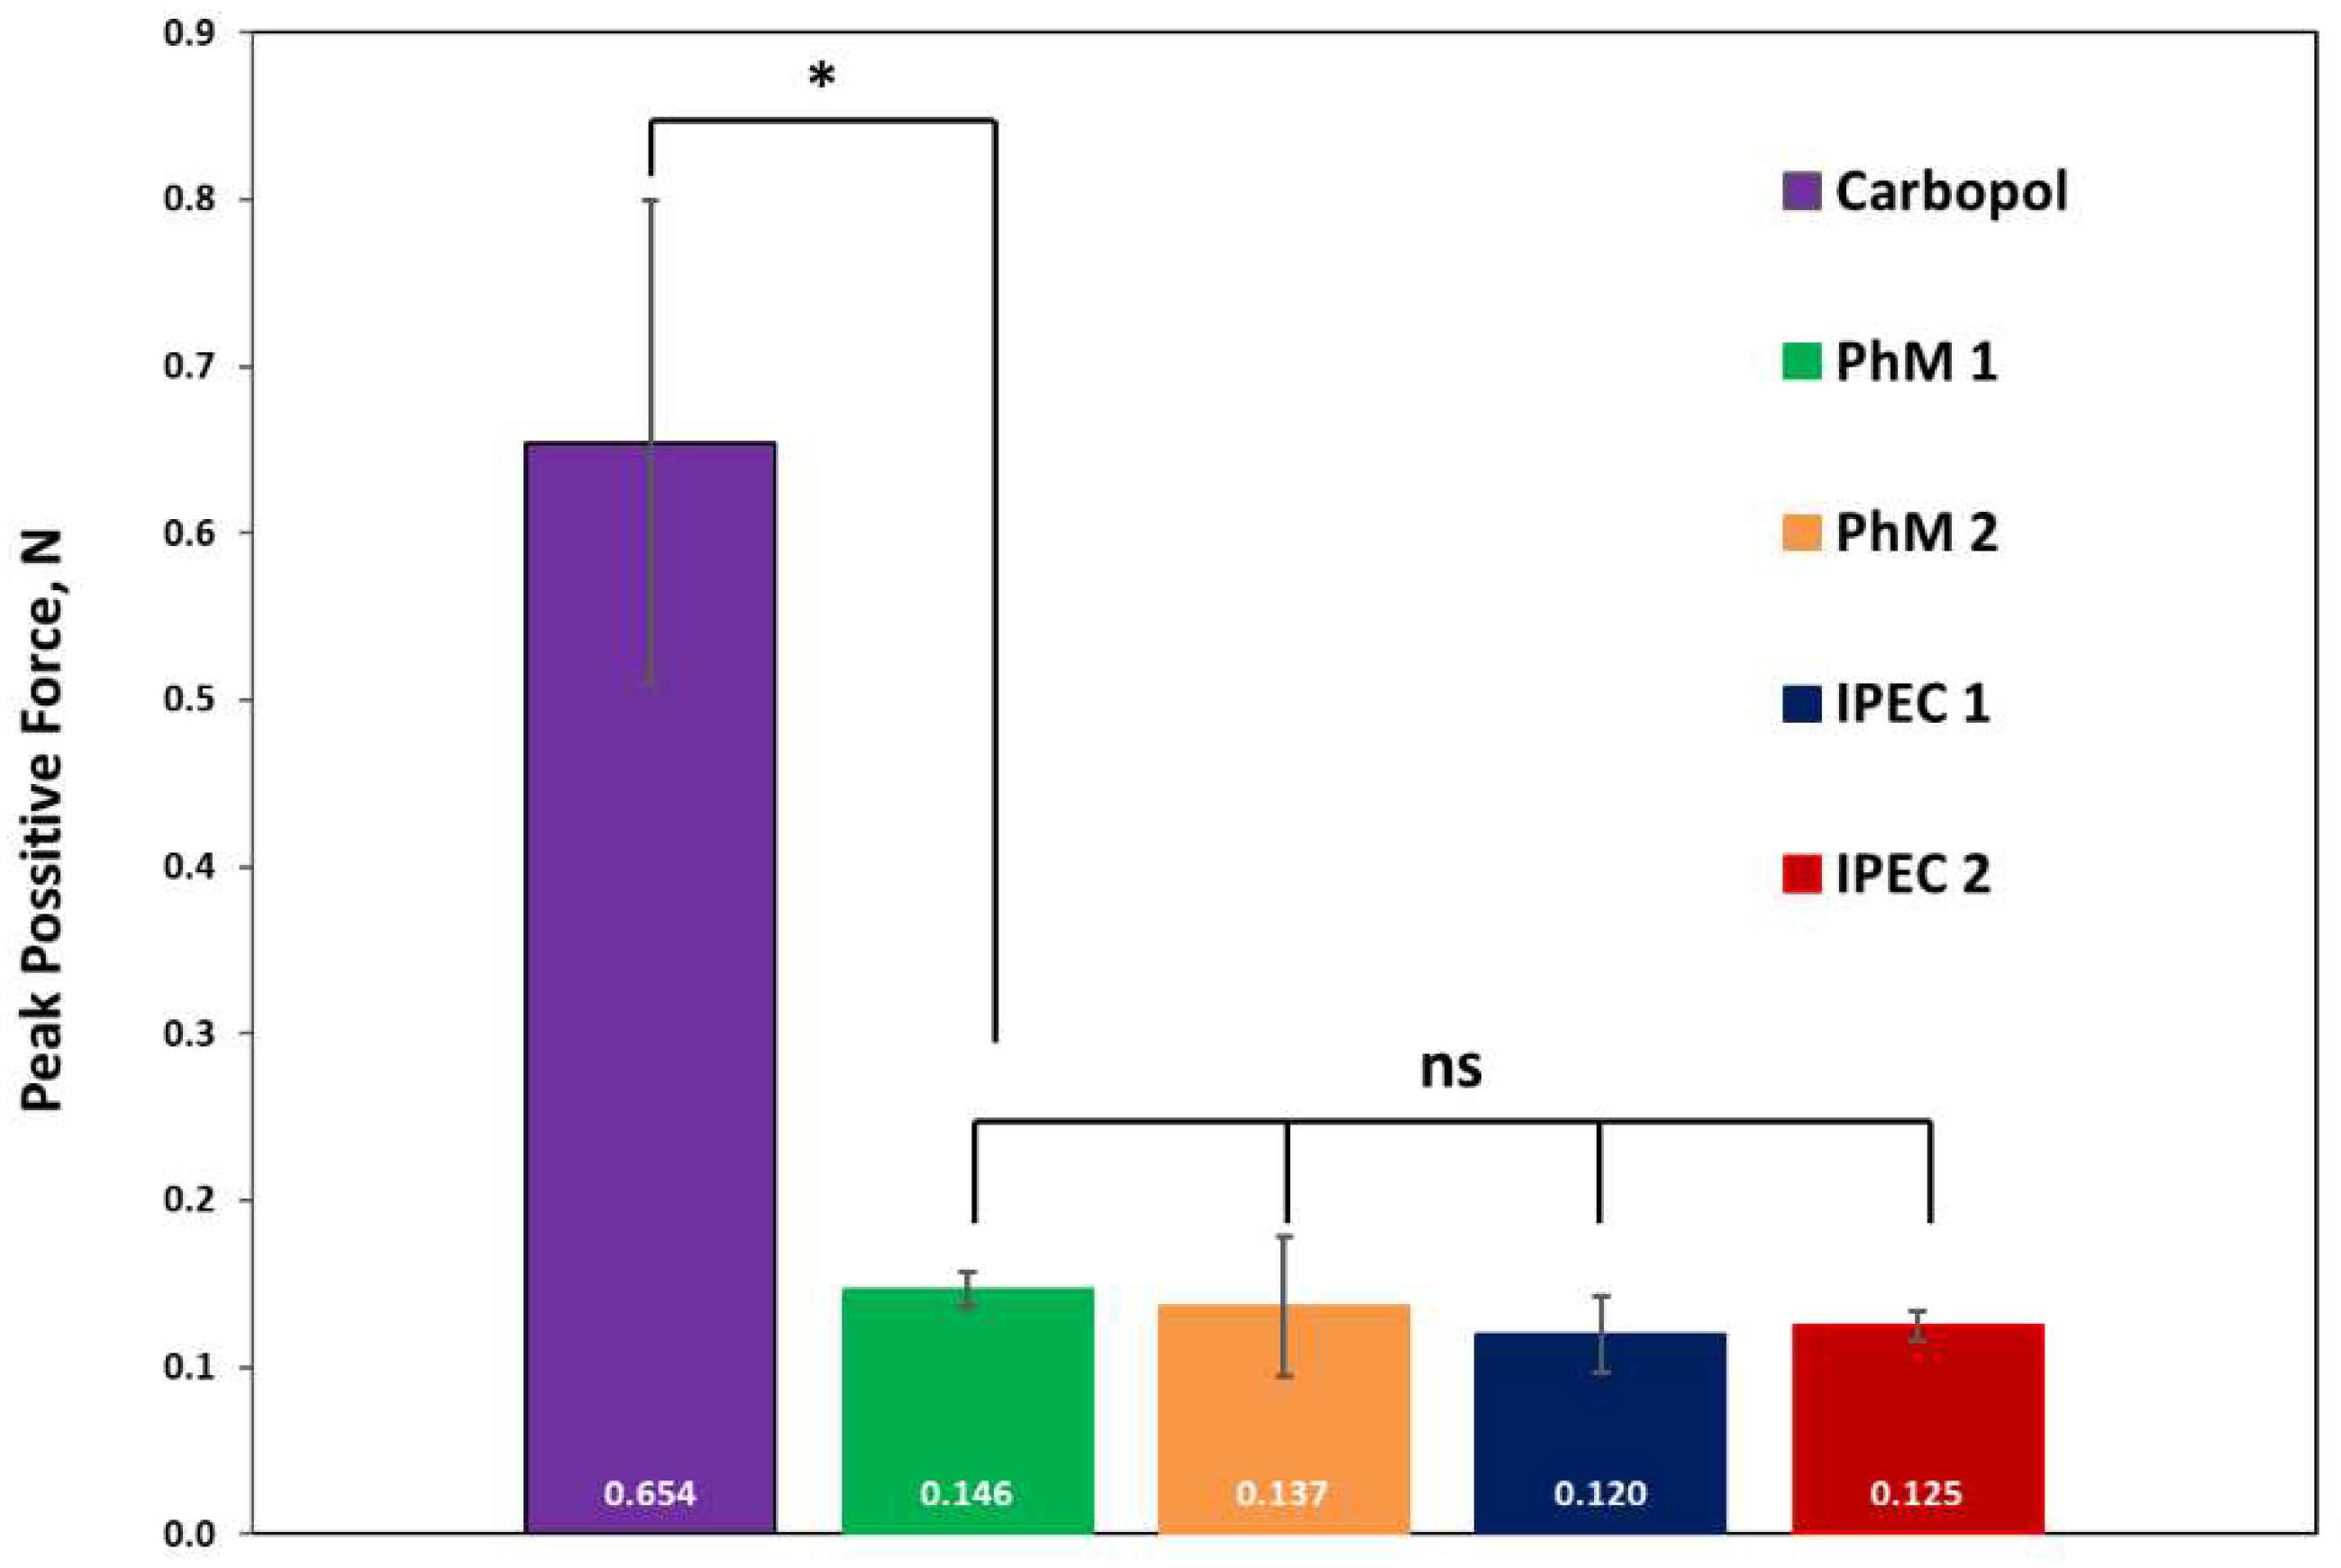
Figure 7.
Release profiles of metronidazole from IPEC and PhM matrices in mimicking fasted stomach medium (0.1 M HCl).
Figure 7.
Release profiles of metronidazole from IPEC and PhM matrices in mimicking fasted stomach medium (0.1 M HCl).
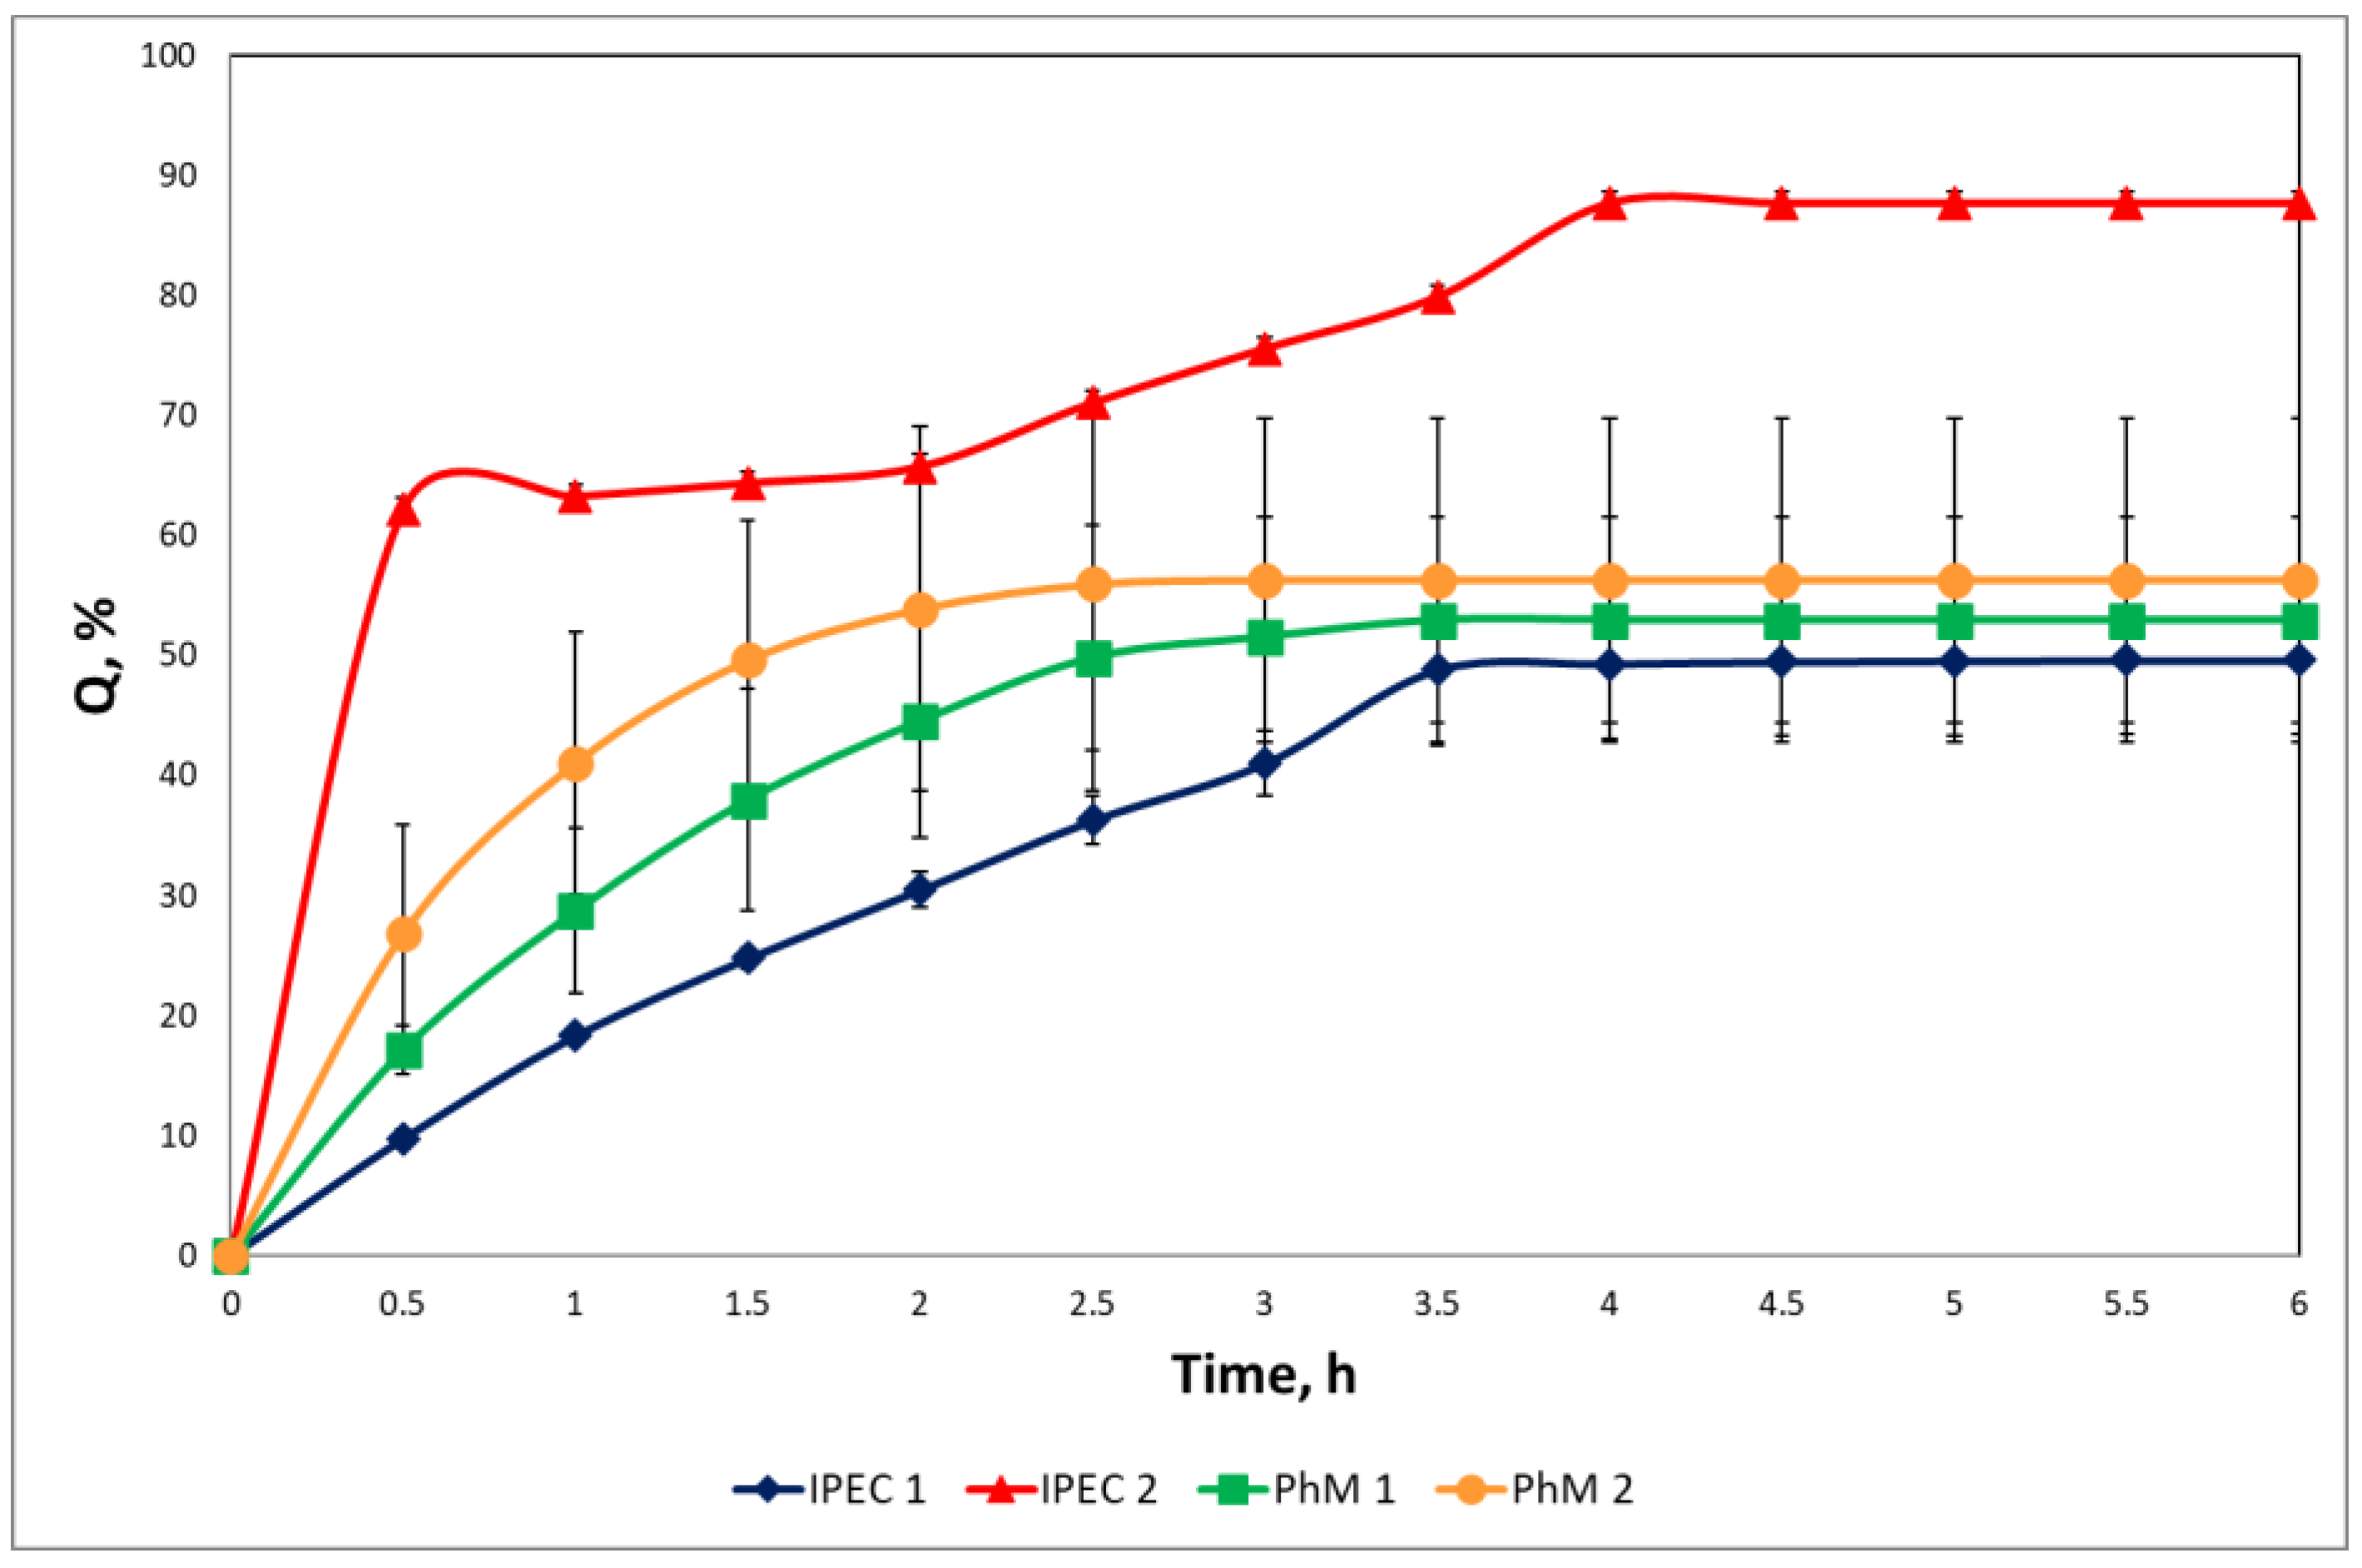
Figure 8.
Release profiles of acyclovir from IPEC and PhM matrices in mimicking fasted stomach medium (0.1 M HCl).
Figure 8.
Release profiles of acyclovir from IPEC and PhM matrices in mimicking fasted stomach medium (0.1 M HCl).
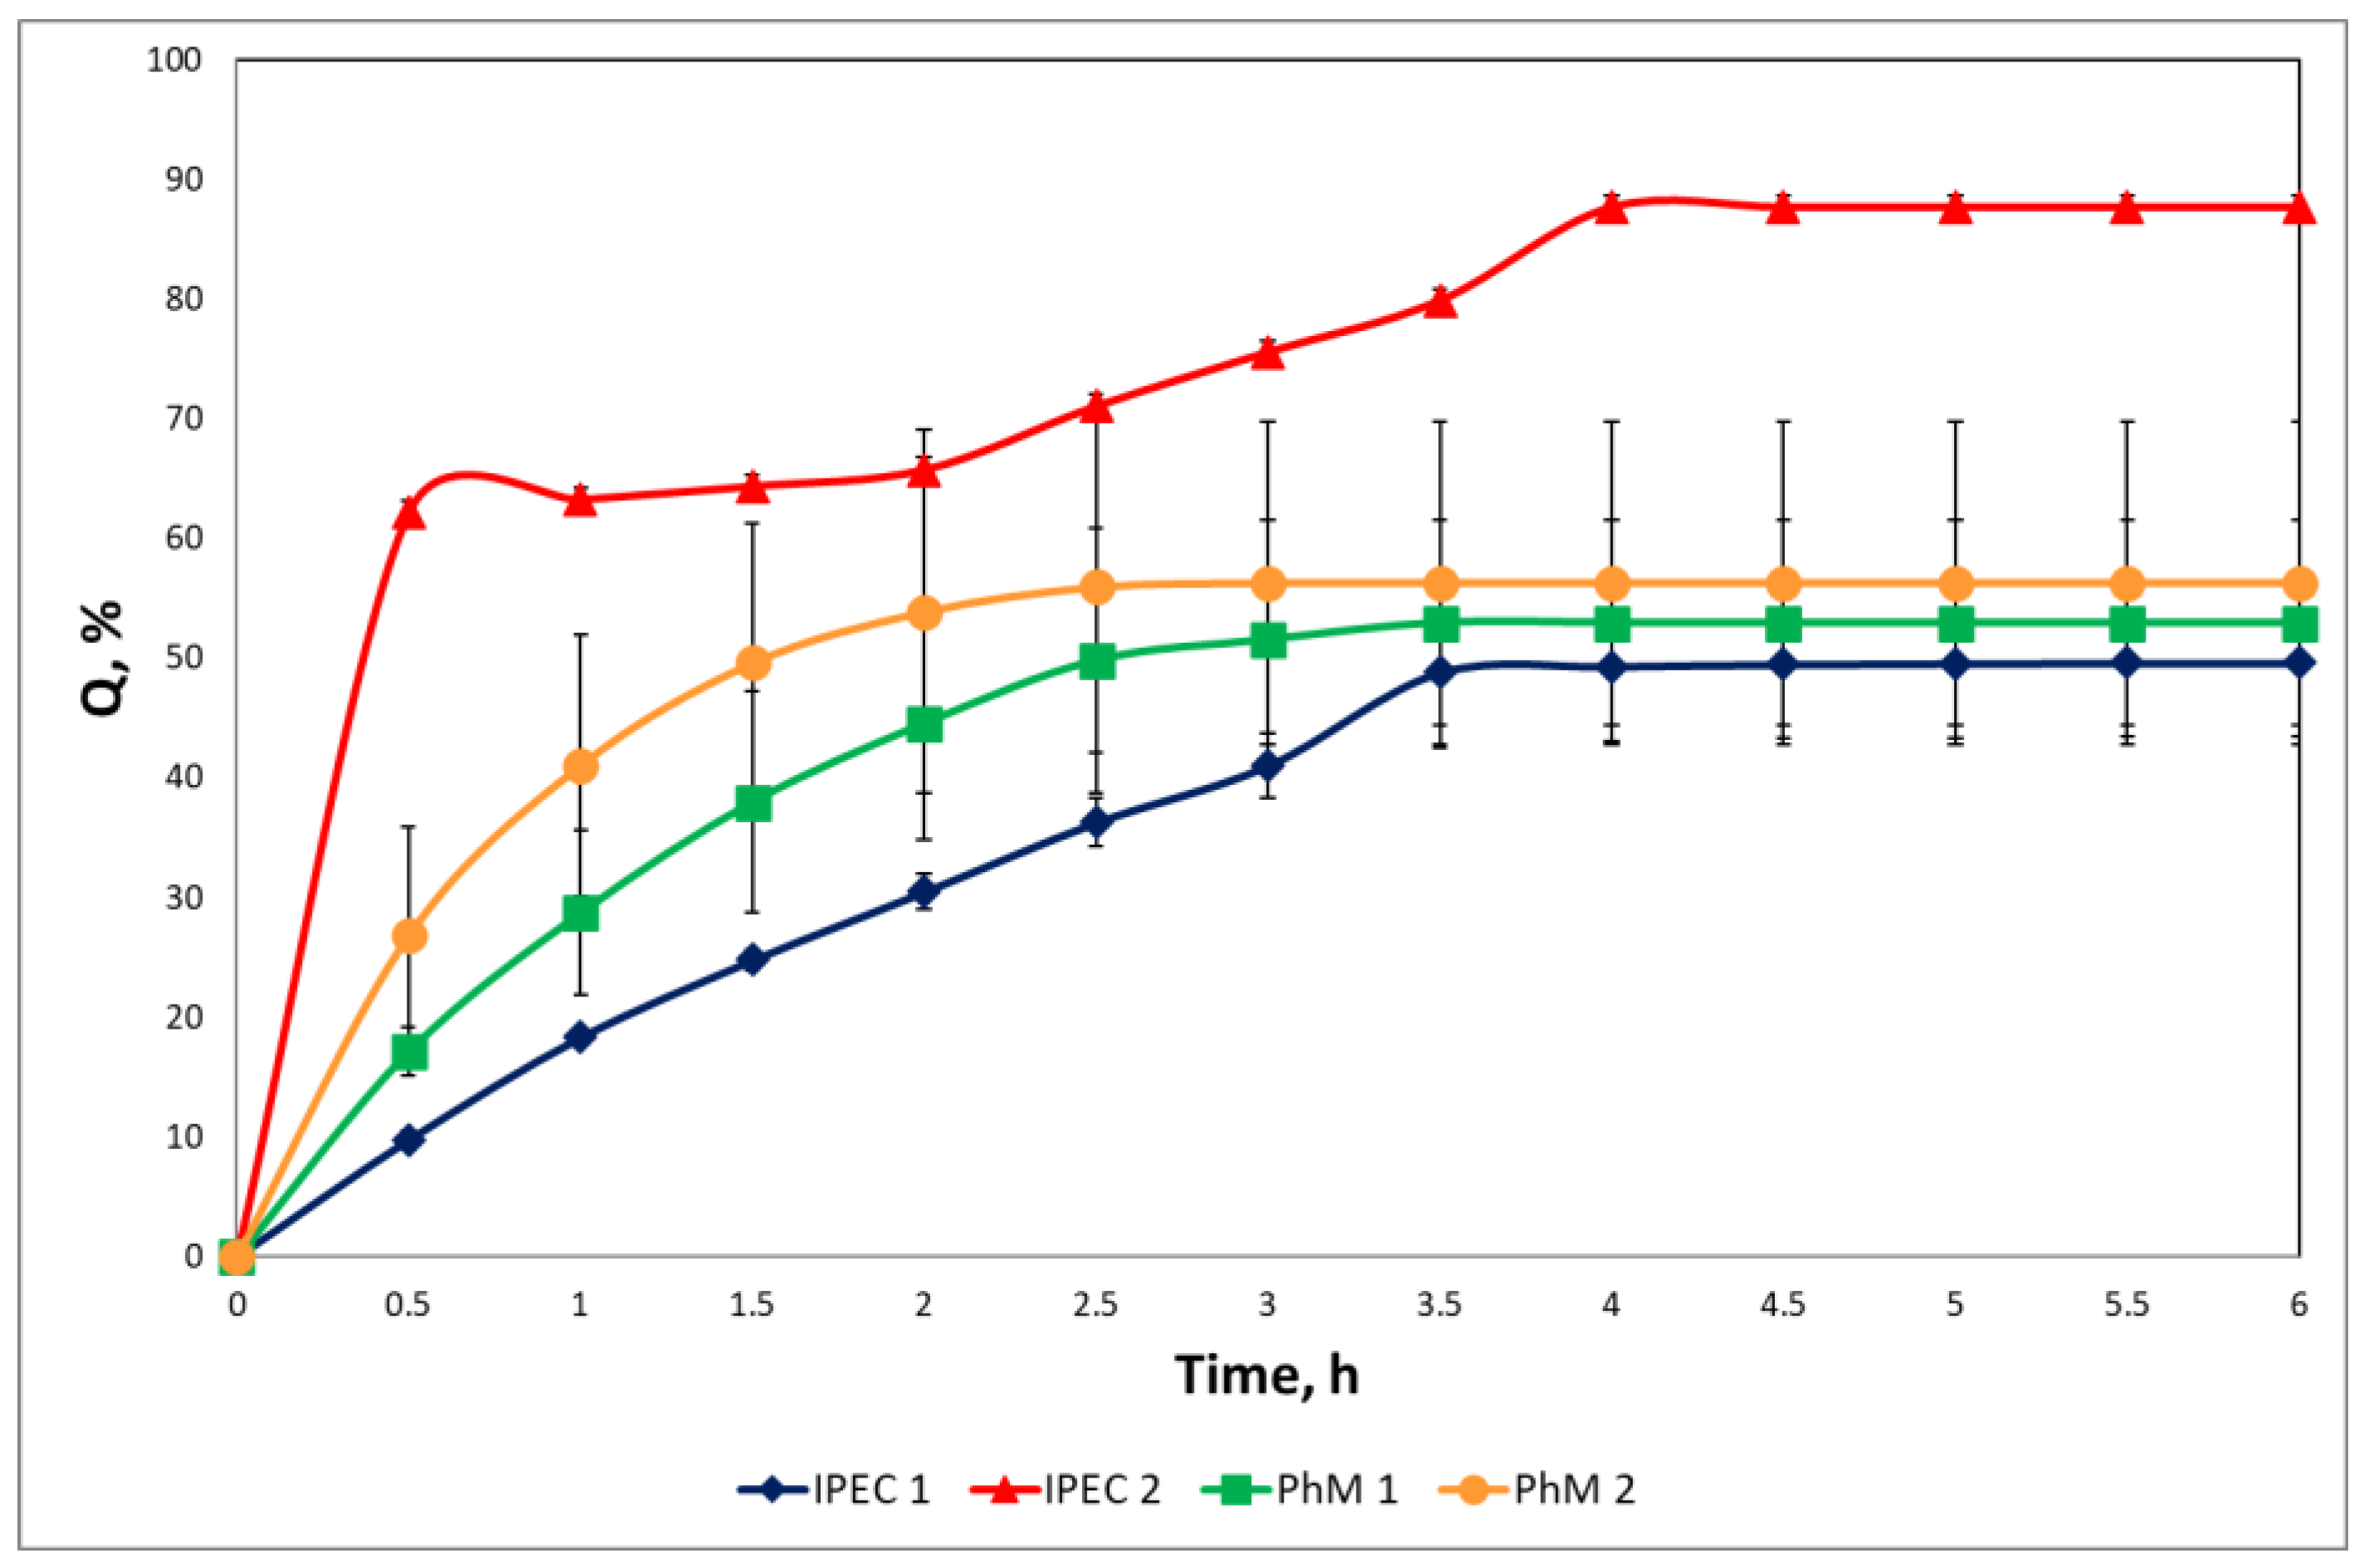
Figure 9.
Release of MZ from matrix based on IPEC 1 in mimicking fasted stomach medium (0.1 M HCl). Experimental data points and predicted data from Peppas-Sahlin model.
Figure 9.
Release of MZ from matrix based on IPEC 1 in mimicking fasted stomach medium (0.1 M HCl). Experimental data points and predicted data from Peppas-Sahlin model.
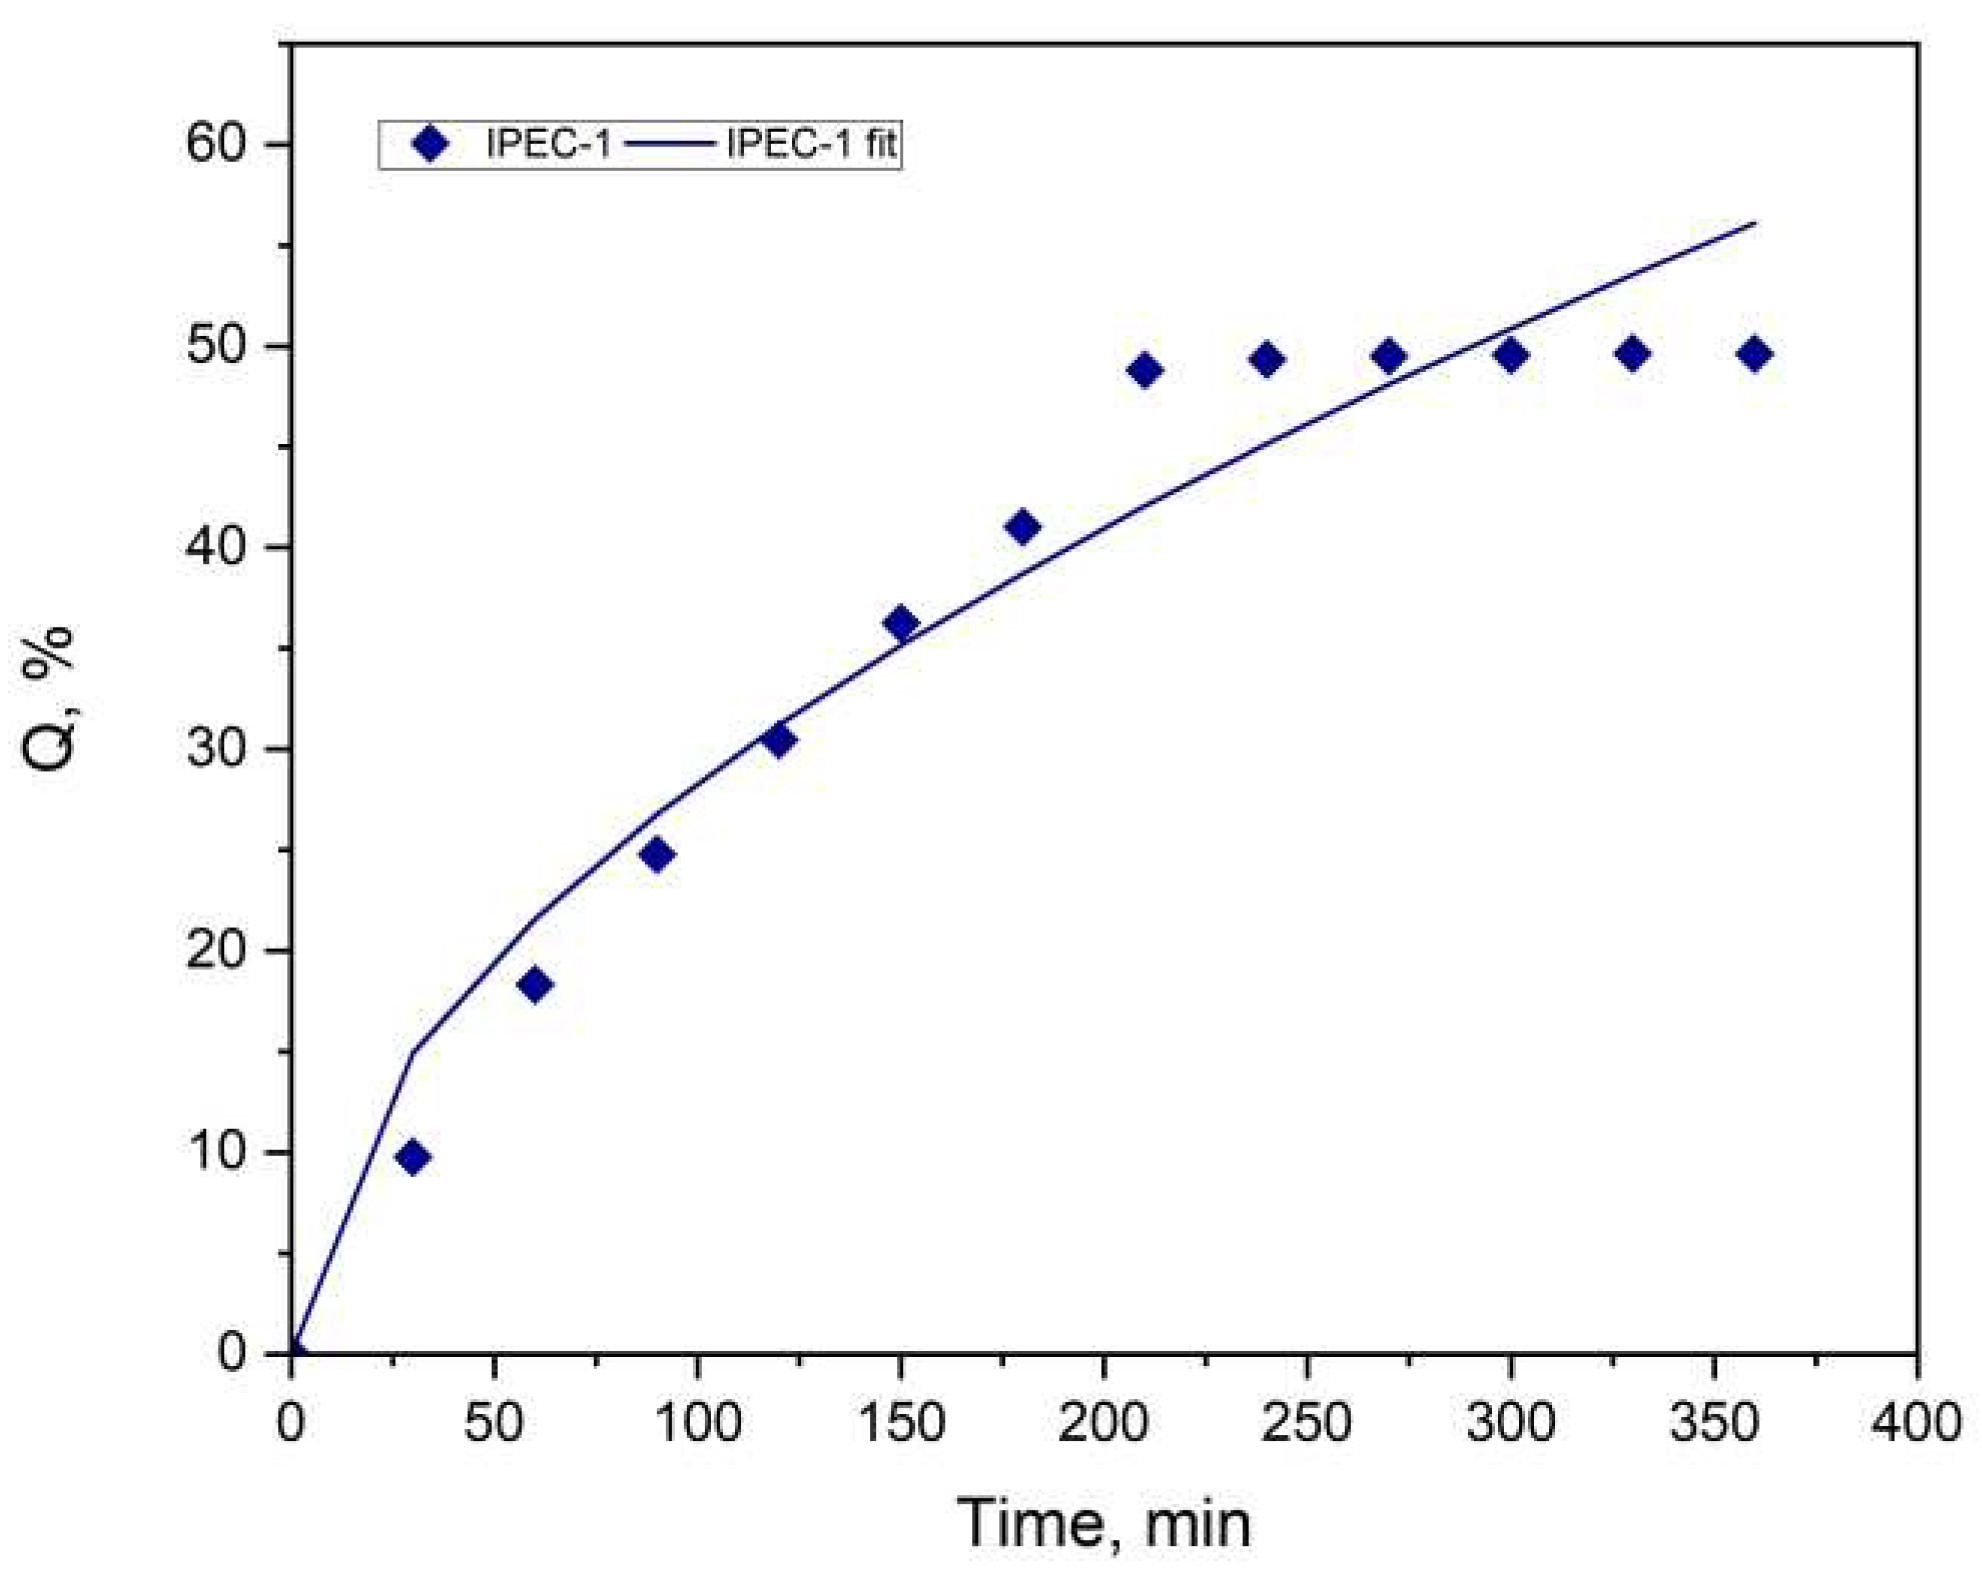
Figure 10.
Release of ACR from matrix based on IPEC 1 and IPEC 2 in mimicking fasted stomach medium (0.1 M HCl). Experimental data points and predicted data from Peppas-Sahlin model.
Figure 10.
Release of ACR from matrix based on IPEC 1 and IPEC 2 in mimicking fasted stomach medium (0.1 M HCl). Experimental data points and predicted data from Peppas-Sahlin model.
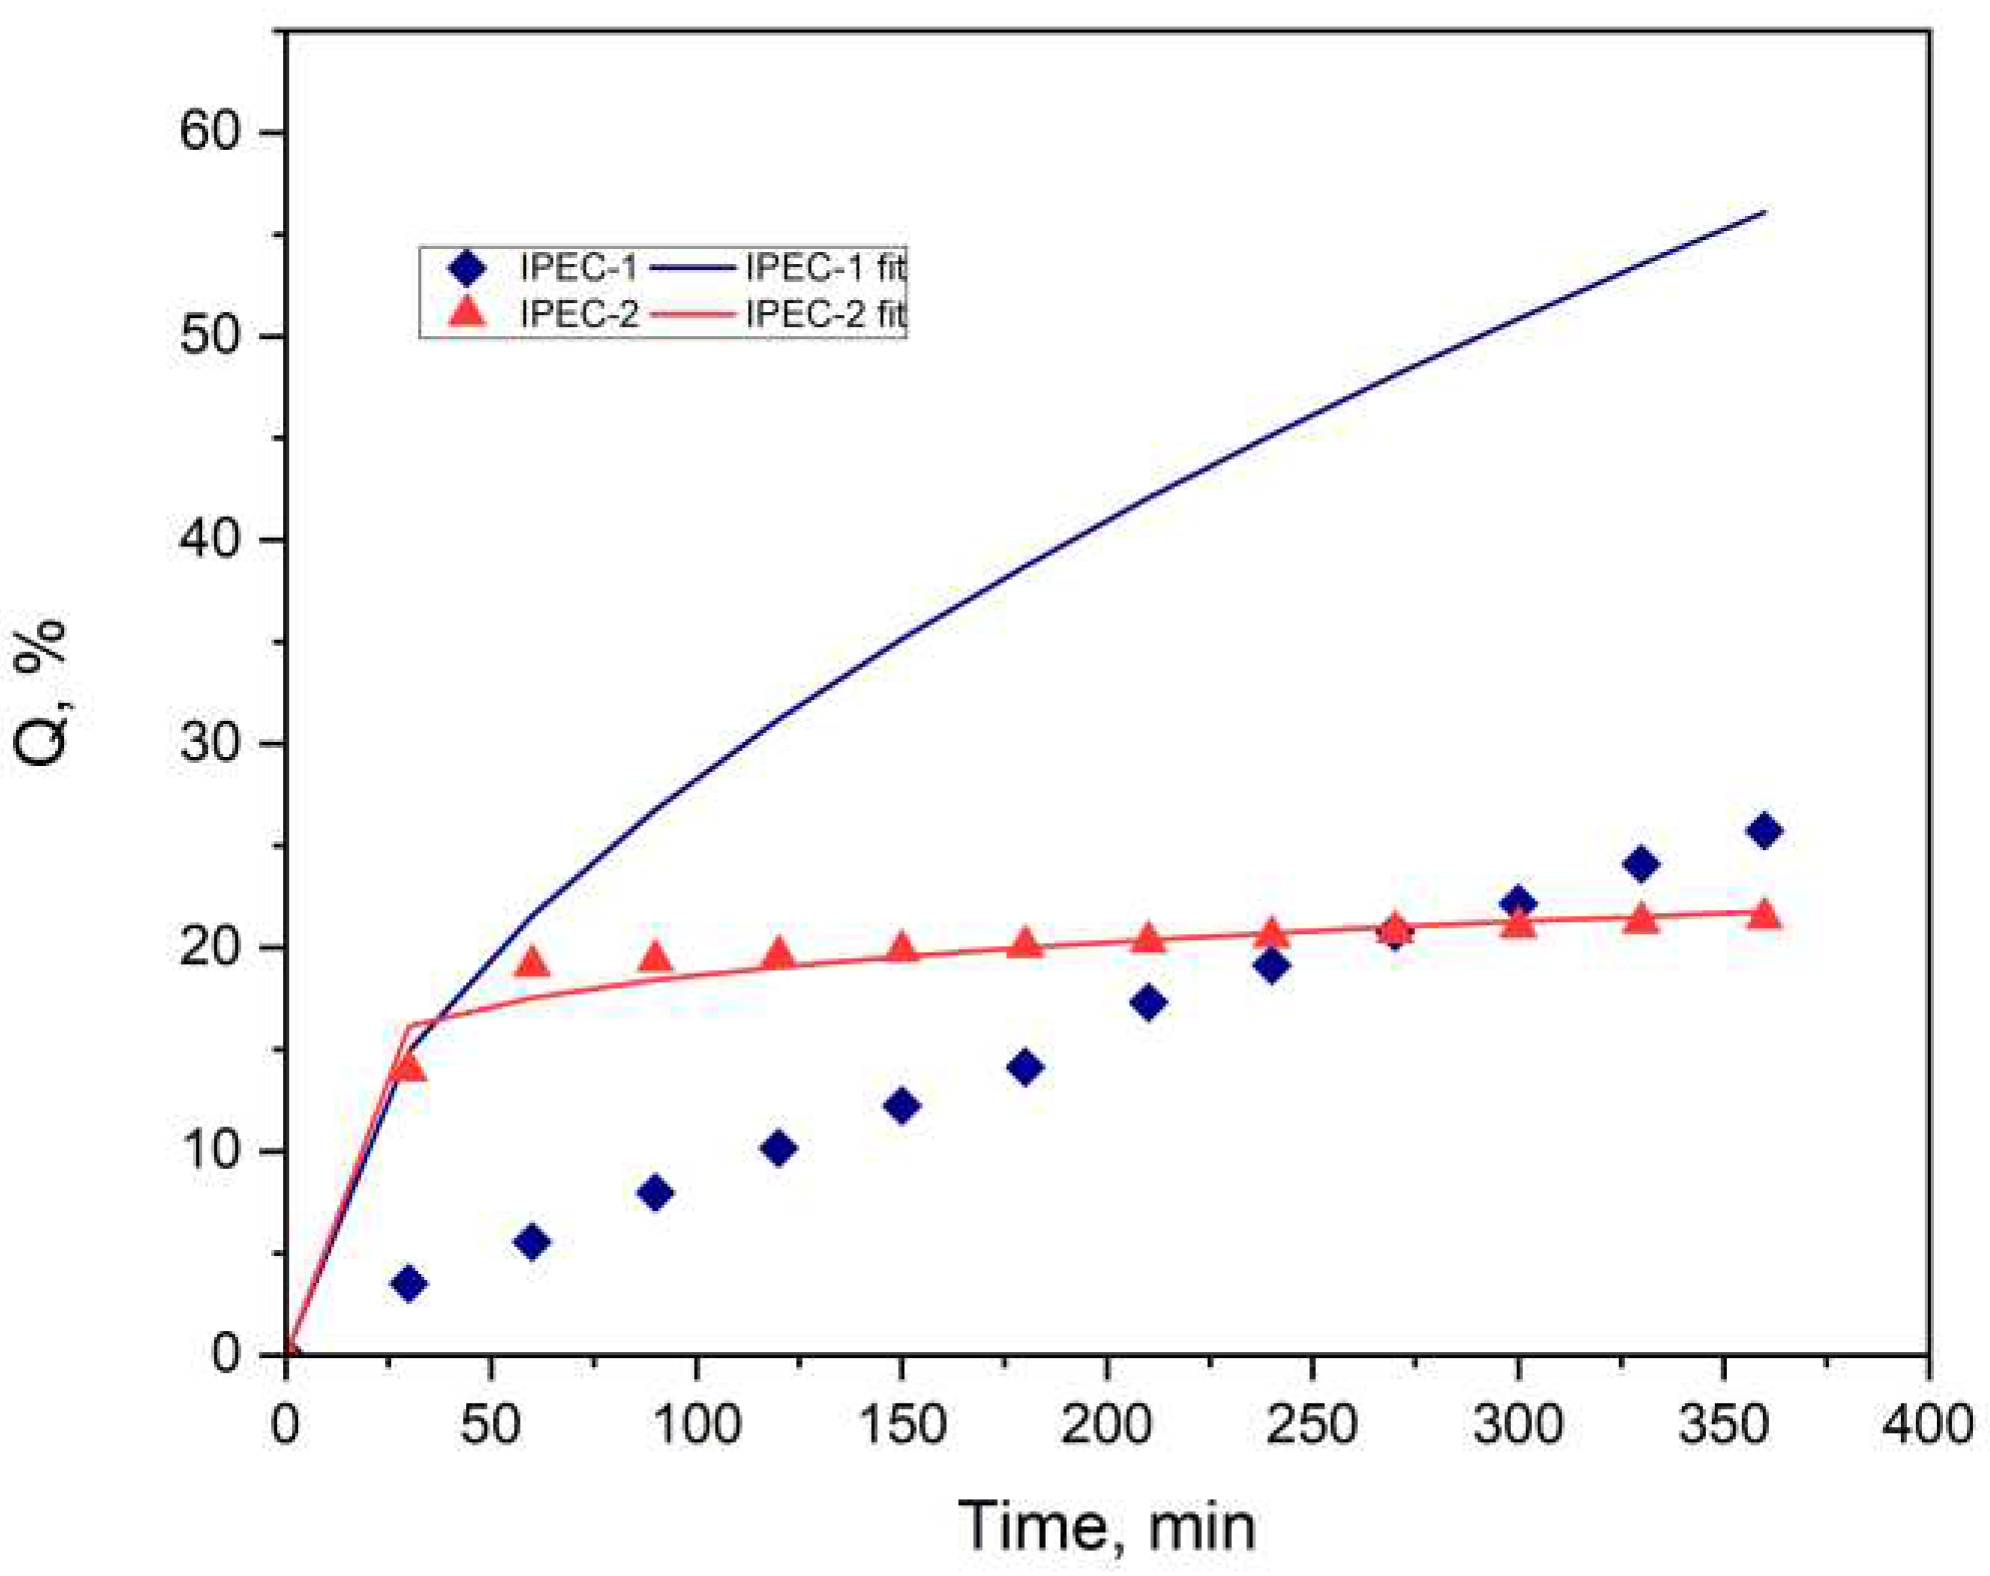
Figure 11.
Relaxation contribution (R)/Fickian Contribution (F) ratio with respect to time for metronidazole release.
Figure 11.
Relaxation contribution (R)/Fickian Contribution (F) ratio with respect to time for metronidazole release.
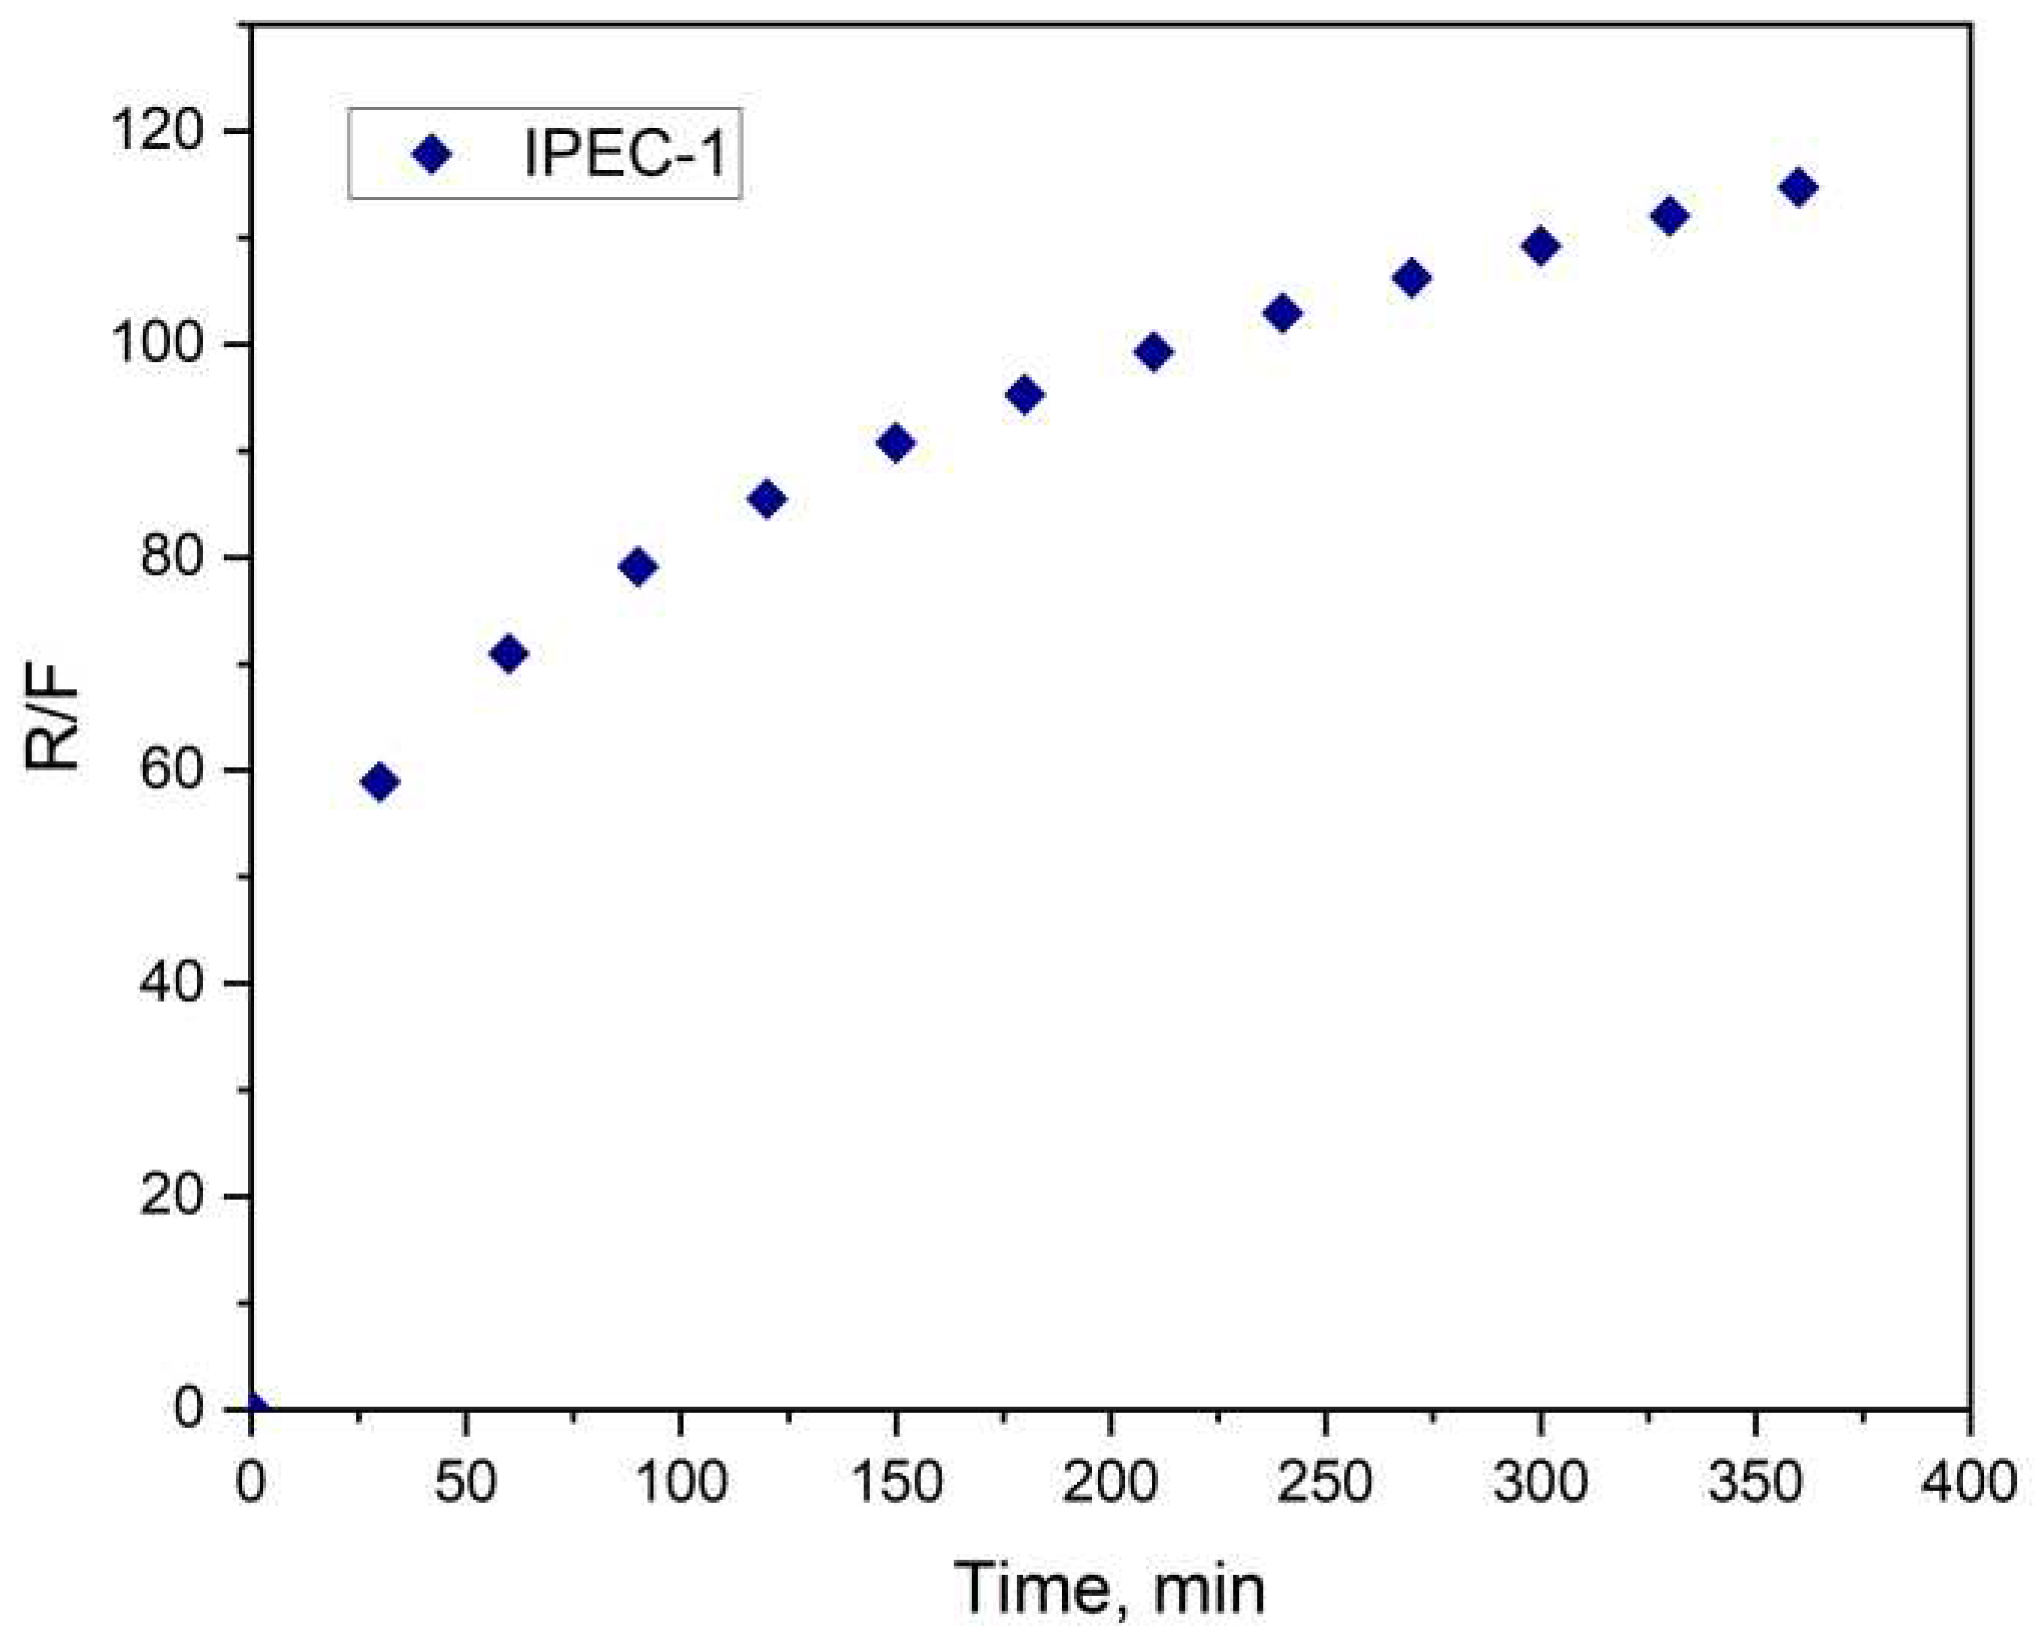
Figure 12.
Relaxation contribution (R)/Fickian Contribution (F) ratio with respect to time for acyclovir release.
Figure 12.
Relaxation contribution (R)/Fickian Contribution (F) ratio with respect to time for acyclovir release.
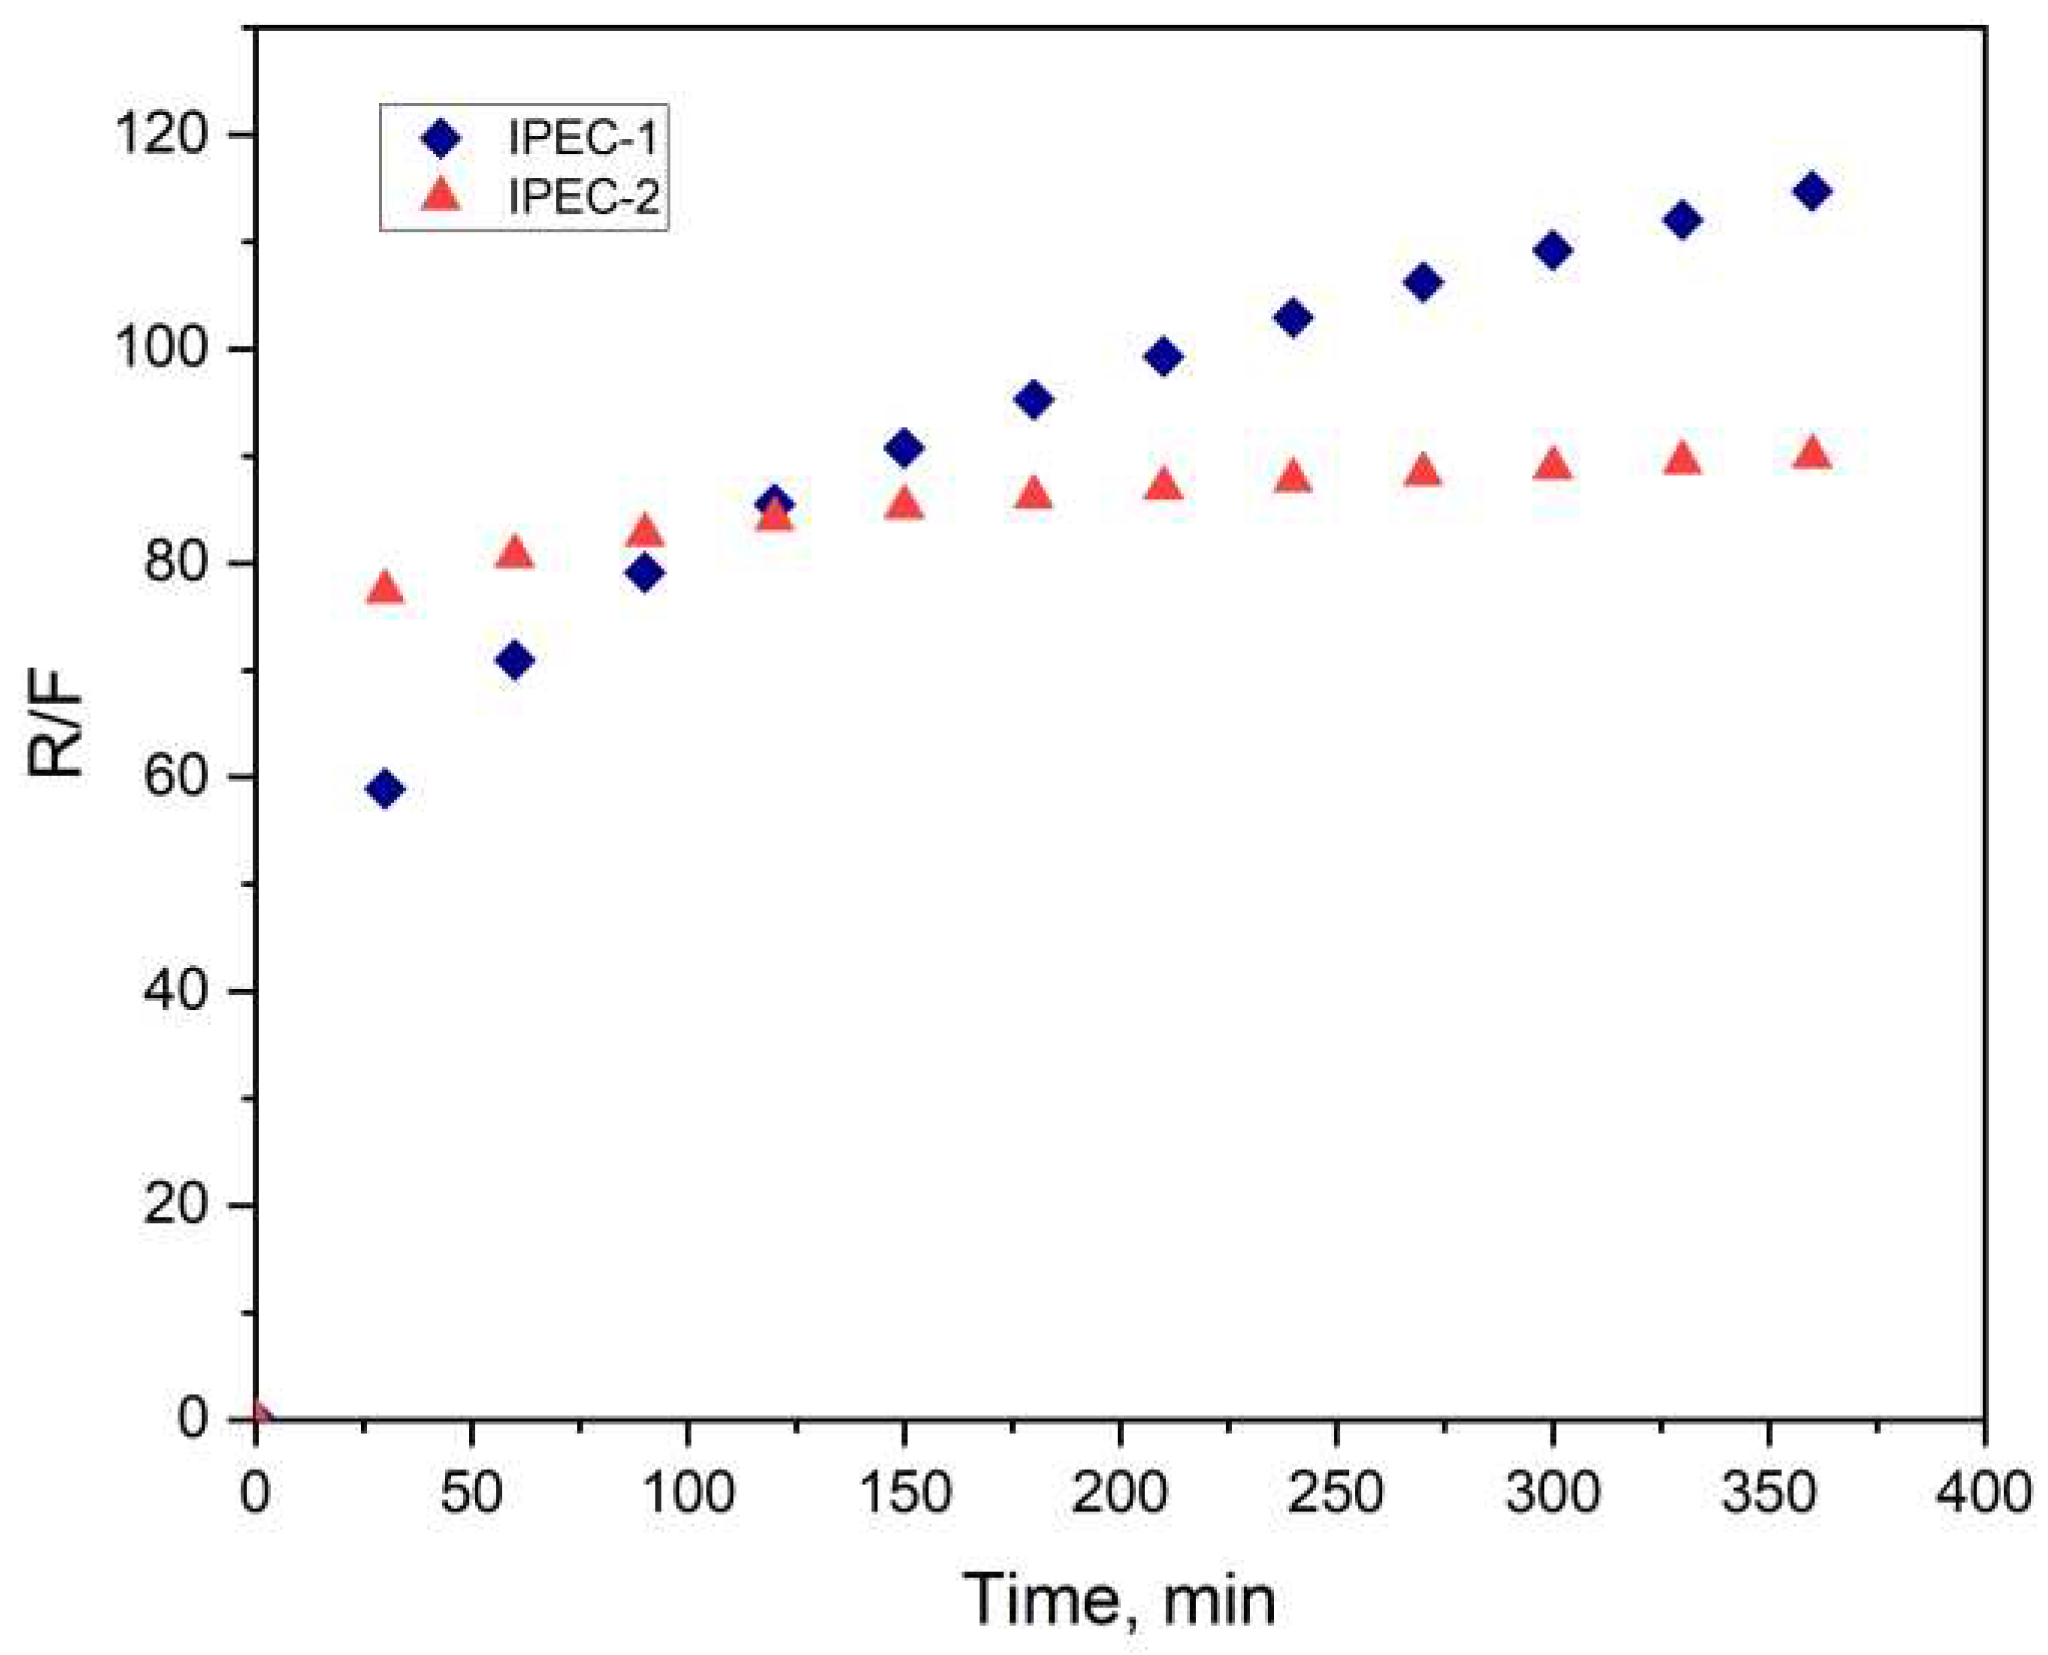

Table 1.
Characteristics of IPEC EPO/L100 systems.
| Sample symbol | pH at which IPEC was obtained | IPEC composition | Tg value, °C |
|
| Z =[EPO]/[L100] | EPO:L100(mol/mol) | |||
| IPEC 1 | 6.0 | 1.02 | 1:0.98 | 146.6±0.3 |
| IPEC 2 | 6.5 | 1.49 | 1:0.67 | 117.4±0.2 |
Table 2.
Results of the thermal and elemental analysis for IPEC samples after swelling in mimicking fasted stomach medium (0.1 M HCl).
Table 2.
Results of the thermal and elemental analysis for IPEC samples after swelling in mimicking fasted stomach medium (0.1 M HCl).
| Sample | Glass transition, °C | Elemental analysis | |
| Тg | CompositionZ=EPO:L100 (mol/mol) | N,% | |
| IPEC 1 2 h | 165.8±0.1 | 1:1.17 | 2.84±0.16 |
| IPEC 1 4 h | 170.7±0.1 | 1:1.11 | 2.91±0.26 |
| IPEC 1 6 h | 170.6±0.1 | 1:1.08 | 3.11±0.10 |
| IPEC 2 2 h | 169.5±0.1 | 1:1.22 | 2.78±0.11 |
| IPEC 2 4 h | 172.3±0.5 | 1:1.47 | 2.54±0.12 |
| IPEC 2 6 h | 173.9±0.3 | 1:1.27 | 2.75±0.31 |
Table 3.
Results obtained from fitting experimental MZ release data to Peppas-Sahlin model.
| Parameters | IPEC 1 |
| m | 0.2681 |
| K1 | 0.1000 |
| K2 | 2.3675 |
| R2 | 0.9762 |
Table 4.
Results obtained from fitting experimental ACR release data to Peppas-Sahlin model.
| Parameters | IPEC 1 | IPEC 2 |
| m | 0.2681 | 0.0605 |
| K1 | 0.1000 | 0.1675 |
| K2 | 2.3676 | 10.5505 |
| R2 | 0.9813 | 0.9892 |
Disclaimer/Publisher’s Note: The statements, opinions and data contained in all publications are solely those of the individual author(s) and contributor(s) and not of MDPI and/or the editor(s). MDPI and/or the editor(s) disclaim responsibility for any injury to people or property resulting from any ideas, methods, instructions or products referred to in the content. |
© 2023 by the authors. Licensee MDPI, Basel, Switzerland. This article is an open access article distributed under the terms and conditions of the Creative Commons Attribution (CC BY) license (http://creativecommons.org/licenses/by/4.0/).
Copyright: This open access article is published under a Creative Commons CC BY 4.0 license, which permit the free download, distribution, and reuse, provided that the author and preprint are cited in any reuse.


