Submitted:
25 December 2023
Posted:
26 December 2023
You are already at the latest version
Abstract
In Thailand, there are several bus fleets—predominantly diesel buses—which is an internal combustion engine (ICEs) in circulation. These fleets are consumed a lot of energy and cause pollution, especially by emitting GHGs and PM2.5. Battery electric buses (BEBs) have been proposed to address these issues. BEB fleets still have a high initial cost, which is why most fleet governance agencies, such as the Bangkok Mass Transit Authority (BMTA), are facing investment decisions. This study aims to develop an energy model for the BMTA BEB fleet by using their real operating data. The methodology for the development of the investment model with two steps is described; there is a BMTA bus route analysis step and a fleet management and charging design step. The output is illustrated in terms of the maximum number of BEBs that can be operated on a sample route with the minimum number of chargers. Interesting results were obtained with the first step: Two of the five BMTA bus routes can be changed into BEBs in phases with a limit of 200 kWh for the energy requirements for every two rounds. The results from the second step demonstrated that the maximum number of BEBs for the two routes was 13, with four charger plugs of charger, thus requiring 150 kW per plug. The charging profile peaked at 600 kW from 4:00 to 8:00 p.m. These results show the potential of the model for fleet design and investment decisions. The sample results from the models illustrate energy savings and cost evaluations for fleet management and design. Compared with diesel buses, THB 10.44 million per year can be saved in terms of energy costs by using a BEB fleet. An optimization model was used to assess the savings incurred due to the investment cost. More than 37% of the costs were saved. A full economic investigation should be carried out in the future. These results show only the energy used when the fleet has already been transformed into a BEB fleet in phases. The emphasis of battery size investigation and energy used were illustrated. They only depict an economic validation of the model, but do not refer to such projects’ feasibility, and the model has not yet been fully validated.
Keywords:
battery electric bus (BEB)
; energy model
; energy saving cost
; fleet management and charging system design model
; route analysis model
; uncertain operating data
1. Introduction
Most environmental problems are caused by combustion in the transportation sector. GHG emissions are some of the main destroyers of the environment [1]. Electric vehicles (EVs) are widely known as a solution. EVs are categorized into four types; there are hybrid electric vehicles (HEVs), plug-in hybrid electric vehicles (PHEVs), battery electric vehicles (BEVs), and fuel cell electric vehicles (FCEVs) [2]. The introduction of EVs not only has a positive effect on the environment, but also has a positive effect on energy efficiency [3]. The positive effect of EVs on grid energy management systems requires energy modeling and design [4]. Charging management systems for EVs and their design are important [5].
In Thailand, internal combustion engine (ICE) vehicles are the main cause of GHG emissions. The energy sector generates 74.35% of the GHGs, and the transportation sector is responsible for 25% [6]. Thailand’s Nationally Determined Contribution Roadmap for Mitigation 2021–2030 (NDC Roadmap 2021–2030) targets a reduction in GHG emissions to approximately 41 MtCO2eq in 2030 [6]. It is challenging to achieve the transformation of a public transportation system, and battery electric buses (BEBs) are the key. BEBs are the key to making public transportation environmentally friendly, but they are not seen as friendly by investors. Most of the operators of bus fleets in Thailand—especially the Bangkok Mass Transit Authority (BMTA), the government operator of Bangkok’s buses operator—are not ready to invest due to the financial feasibility. In the metropolis of Bangkok, Thailand, more than 800,000 people per day use the BMTA. The financial feasibility of a BEB fleet would be determined by its management and design. The BMTA has a plan to replace and improve its service with 2511 BEBs in the future [7]. This will cause much energy consumption and require the fleet’s operations to be optimized.
Many studies have attempted to develop energy models for managing and designing BEB fleets. Most of them were focused on energy modeling based on the relationship of the battery size, charger capacity, and operating schedule, as well as the minimization of the investment and operating cost. Developments concern the model’s objective, type of optimization, solution, and evaluation [8]. Interesting models that are widely used include flow-based models, which show the potential optimizations of oil and gas station locations [9,10,11,12], and network equilibrium models, which show potential optimizations of EV charging station location [13,14]. Some studies have attempted to mix their models with business models and policy recommendation models [15,16]. One study developed an electric bus fleet management and design model [17]. This model used the bus route characteristics, electric bus specifications, charging time, driving characteristics, energy consumption, and a simulation of the situation as input data. Mixed-integer non-linear programming (MILP) and the grouping genetic algorithm (GGA) were used as calculation models. The results showed the high potential of the mixed model for two bus routes, which were long-range and short-range. The method’s complexity and non-flexibility were the limitations of the model. Most studies are very complex, may not offer the best and most practical solutions, and do not research enough in terms of finances and the economy.
Moreover, several studies have attempted to adapt the performance of battery electric buses and illustrated this in terms of the total cost of ownership (TCO) of the battery electric buses in comparison with ICE buses and non-strategic BEB management. The results showed that the TCO of a BEB fleet could be improved by more than 13% by co-optimizing the battery size and charging infrastructure [18]. Another study showed that energy management strategies for battery electric bus fleets can reduce the TCO by between 15 and 25% [19]. Some studies found that a fleet could be optimized by overnight charging to avoid bus operation problems during the day [20]. These studies were focused on the optimization charging schedule to minimize the operation cost but did not emphasize an overview of the fleet, which may affect the investment cost, operating cost, and operating conditions.
An important aspect of the management of BEB fleets and chargers is the infrastructure, which includes charging system, investment decisions, and charging management, as these have an impact on the operating cost and can be used for the evolution of the schedules and routes of BEB fleets in the future. The aim of this study was to apply a simple energy model for BEB management and design to be an investment model. The investment model was divided into two steps: route analysis and fleet management and charging design. The BMTA service, which operates on fixed schedules, was used as a case study to simulate a situation as an input for the model. The investment and operating energy cost savings were used to validate the model, and simple financial modeling was applied to further illustrate the case study.
2. Materials and Methods
The investment model development flow was started by (1) collecting the data as an input parameter, (2) BMTA route analysis step, (3) BEB and charger design step, and (4) investment modelling and economic feasibility. The output from each process were the initiative input data, possibility route on the sample fleet, the number of BEBs, the number of chargers, and charging profile, and investment and operating cost comparison for step (1), (2), (3), and (4), respectively.
This section is divided into three subsections that describe the data collection, BMTA route analysis step, and fleet management and charging design step. Each subsection expands upon more details.
- (1) Data collection
The scope of the BMTA’s services includes one area, that is, BMTA Bus Operation Division 1 Zone 1: Bangkhen Depot, in which 5 routes are operated with conventional buses. These are routes 107, 129, A1, 95, and 543. The characteristics of each bus route were collected from global positioning system (GPS) data and a questionnaire directed at the operators. The results were obtained in terms of the number of service rounds per day, service distance per round, service time per round, average speed, average acceleration, idle time, number of bus stops, and BEB specifications for the simulation. Most of the EVs were battery electric buses. According to the BMTA’s specifications, they should be 12-meter buses with a battery capacity of around 100 - 300 kWh, a seat capacity of 30 seats, a maximum capacity of 50 passengers, and a curb weight limited to 16,000 kg. A power diagram of a BEB was designed with 650 VDC for the main battery load and 24 VDC for the auxiliary components. The traction motor and air conditioning system were considered as the main loads for the battery. The velocity profiles were collected through GPS tracking, operating in real time with 10 values per second. These parameters were enough for the investment model development.
- (2) BMTA route analysis step
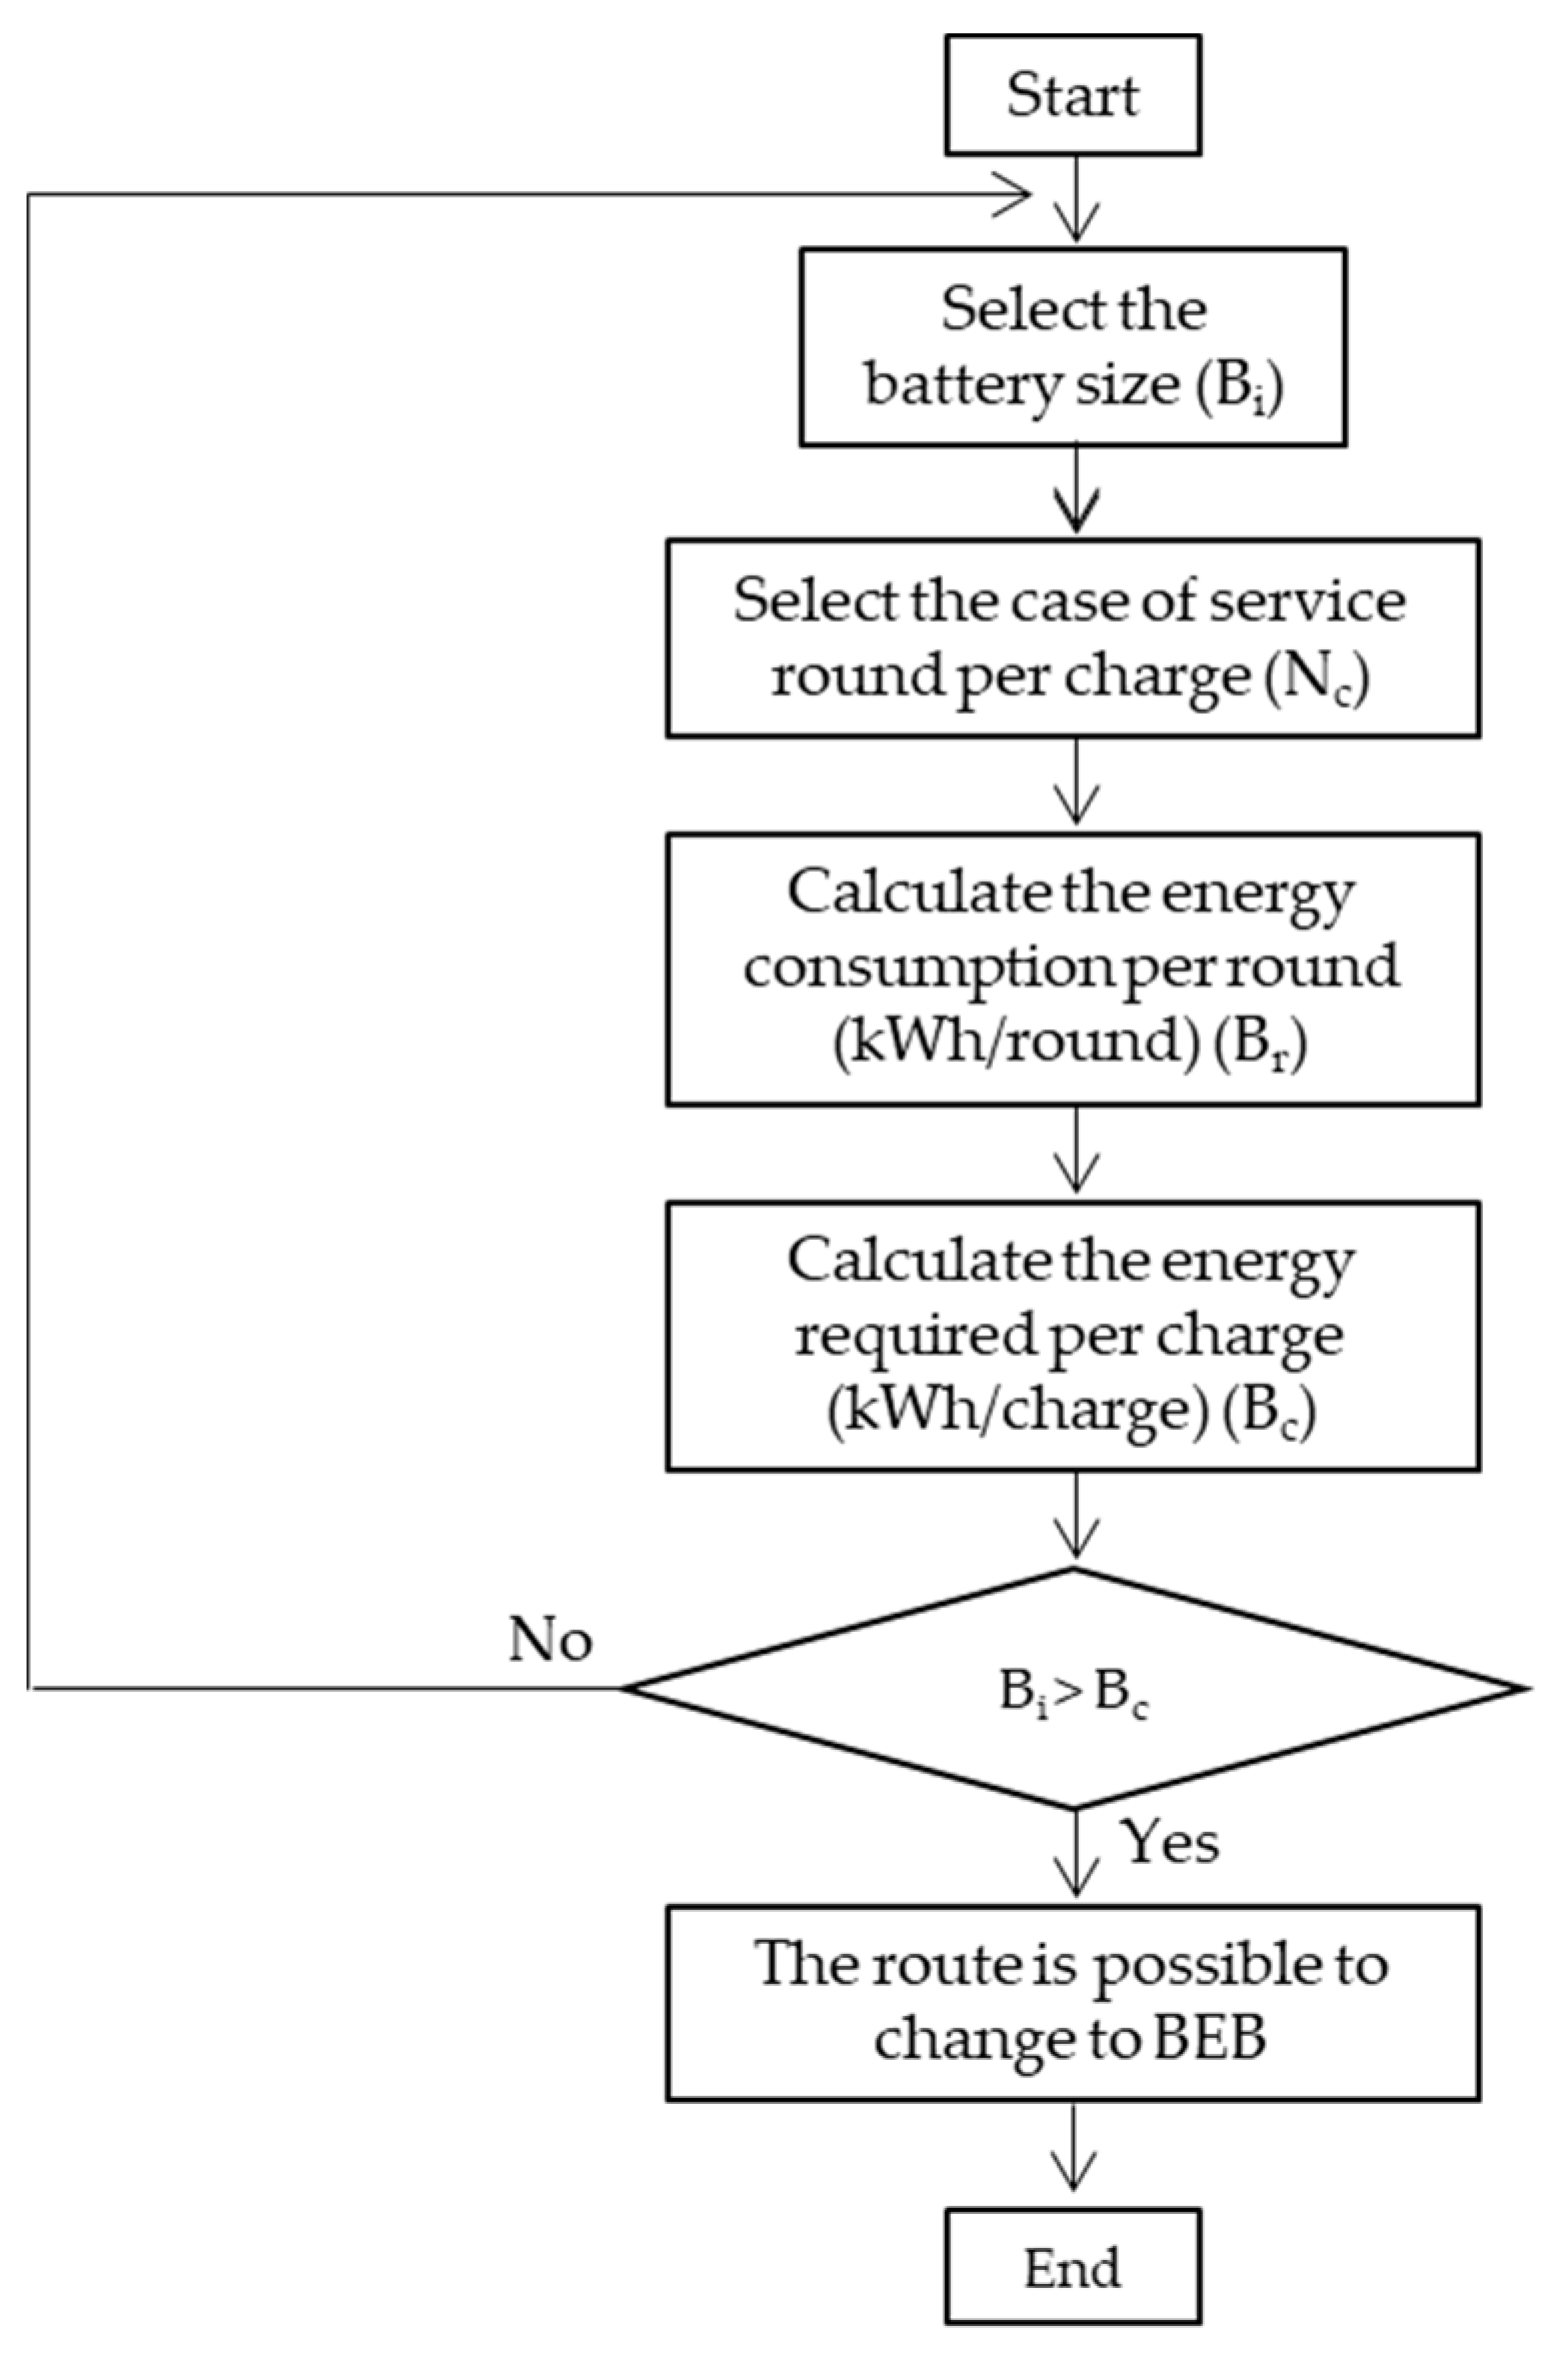
The objective of this step was to find possible routes on which it would be possible to change conventional buses into BEBs. The battery sizing, BEB specification and the BMTA route characteristics were the calculation criteria. The calculation flow was processed as shown in Figure 1, and the following assumptions were made. The model began with battery size case 1, a number of rounds per charge of 1, and a route of 107; n = 1 refers to the possibility of transforming the route for use of an EV (n). The limitation of a BEB’s battery capacity was related to the energy required to operate the BEB under the constraint of the number of rounds per charge. The possible BEB change routes, which could involve a large amount of data, was filtered as the model objective.
The assumptions
- -
- The charging was planned for the daytime with a quick DC charge, and there were no charging limitations.
- -
- The BEB energy consumption (Ec) was 1.23 kWh/km [18], which was under the condition of a regenerative braking system. This was averaged for all bus routes.
- -
- The traction battery capacity was categorized into capacities—150 kWh and 200 kWh—which were the possible installed capacities in the BEBs. This parameter was defined by Bi.
- -
- The service trips were divided into two cases. There were 5 rounds per charge or 2 rounds per charge. This parameter was defined by Nc.
- -
- The service routes 107, 129, A1, 95, and 543 represent the sampling fleet.
The sensitivity parameters were the BEB battery capacity and the routes. The step was started by the route selection. The service round in each route was defined, the number of rounds for each route was Nc, the energy consumption in each route was Br, and each charge required the energy as Bc. The constraint of Bi > Bc means that it is possible to change to a BEB and is shown in terms of the possible route. If this condition is not met, it is not recommended to change to BEB, under the limitation of battery size.
Figure 1.
The BMTA route analysis flowchart.
- (3) Fleet management and charging design step
The results for the possible EV route from the previous step were used in this step as the input data. As the outcomes of the previous step were routes, which usually involve large amounts of data, they were filtered to minimize the input data. The possible routes were input into the fleet management and charging design step by using the route characteristics and operating requirements. The output of the step was illustrated in the form of an operation timetable, the maximum number of BEBs in the sample route and the number of chargers required. The step was processed as shown in Figure 2, and the following assumptions were made.
The model assumptions
- -
- The BEBs started with a full battery charge each day.
- -
- The BEBs were operated every day.
- -
- The service time in each service round (Tdrive) needed to be more than the running frequency (Tfq); if this requirement was not met, it is not calculation.
- -
- All the chargers were installed at the original station (Bangkhen Depot).
The sensitivity parameters of this step were the charging capacity (power of the chargers) and the traction battery capacity. The fixed parameters were the energy consumption of the BEBs and the average speed for each route. The variable parameters were the starting time (T0), vehicle range per round (Sr), running frequency (Tfq), ending time on each day (Tend), and number of service rounds per day. The definitions of the step parameters are shown in Table 1.
Variable parameters were also explored, such as the total required energy (Et), and time per charge, as shown in equations (1) – (2).
Total required energy: Et = Ec × Nr × Rs
Time per charge: Tc = Bi/Pc
The number of BEBs and chargers, operating timetable and charging profile were defined by hand, starting from T0 and running until Tend. The results demonstrated the energy cost savings of the BEBs compared to that of diesel engine buses. These were used to compare the investment models with a simple financial analysis. The model was started with the route and service characteristics as the input data and attempted to generate a timetable for the BEBs. The BEB timetable was related to the number of BEBs, and the number of chargers required.
Figure 2.
The fleet management and charging design flowchart.
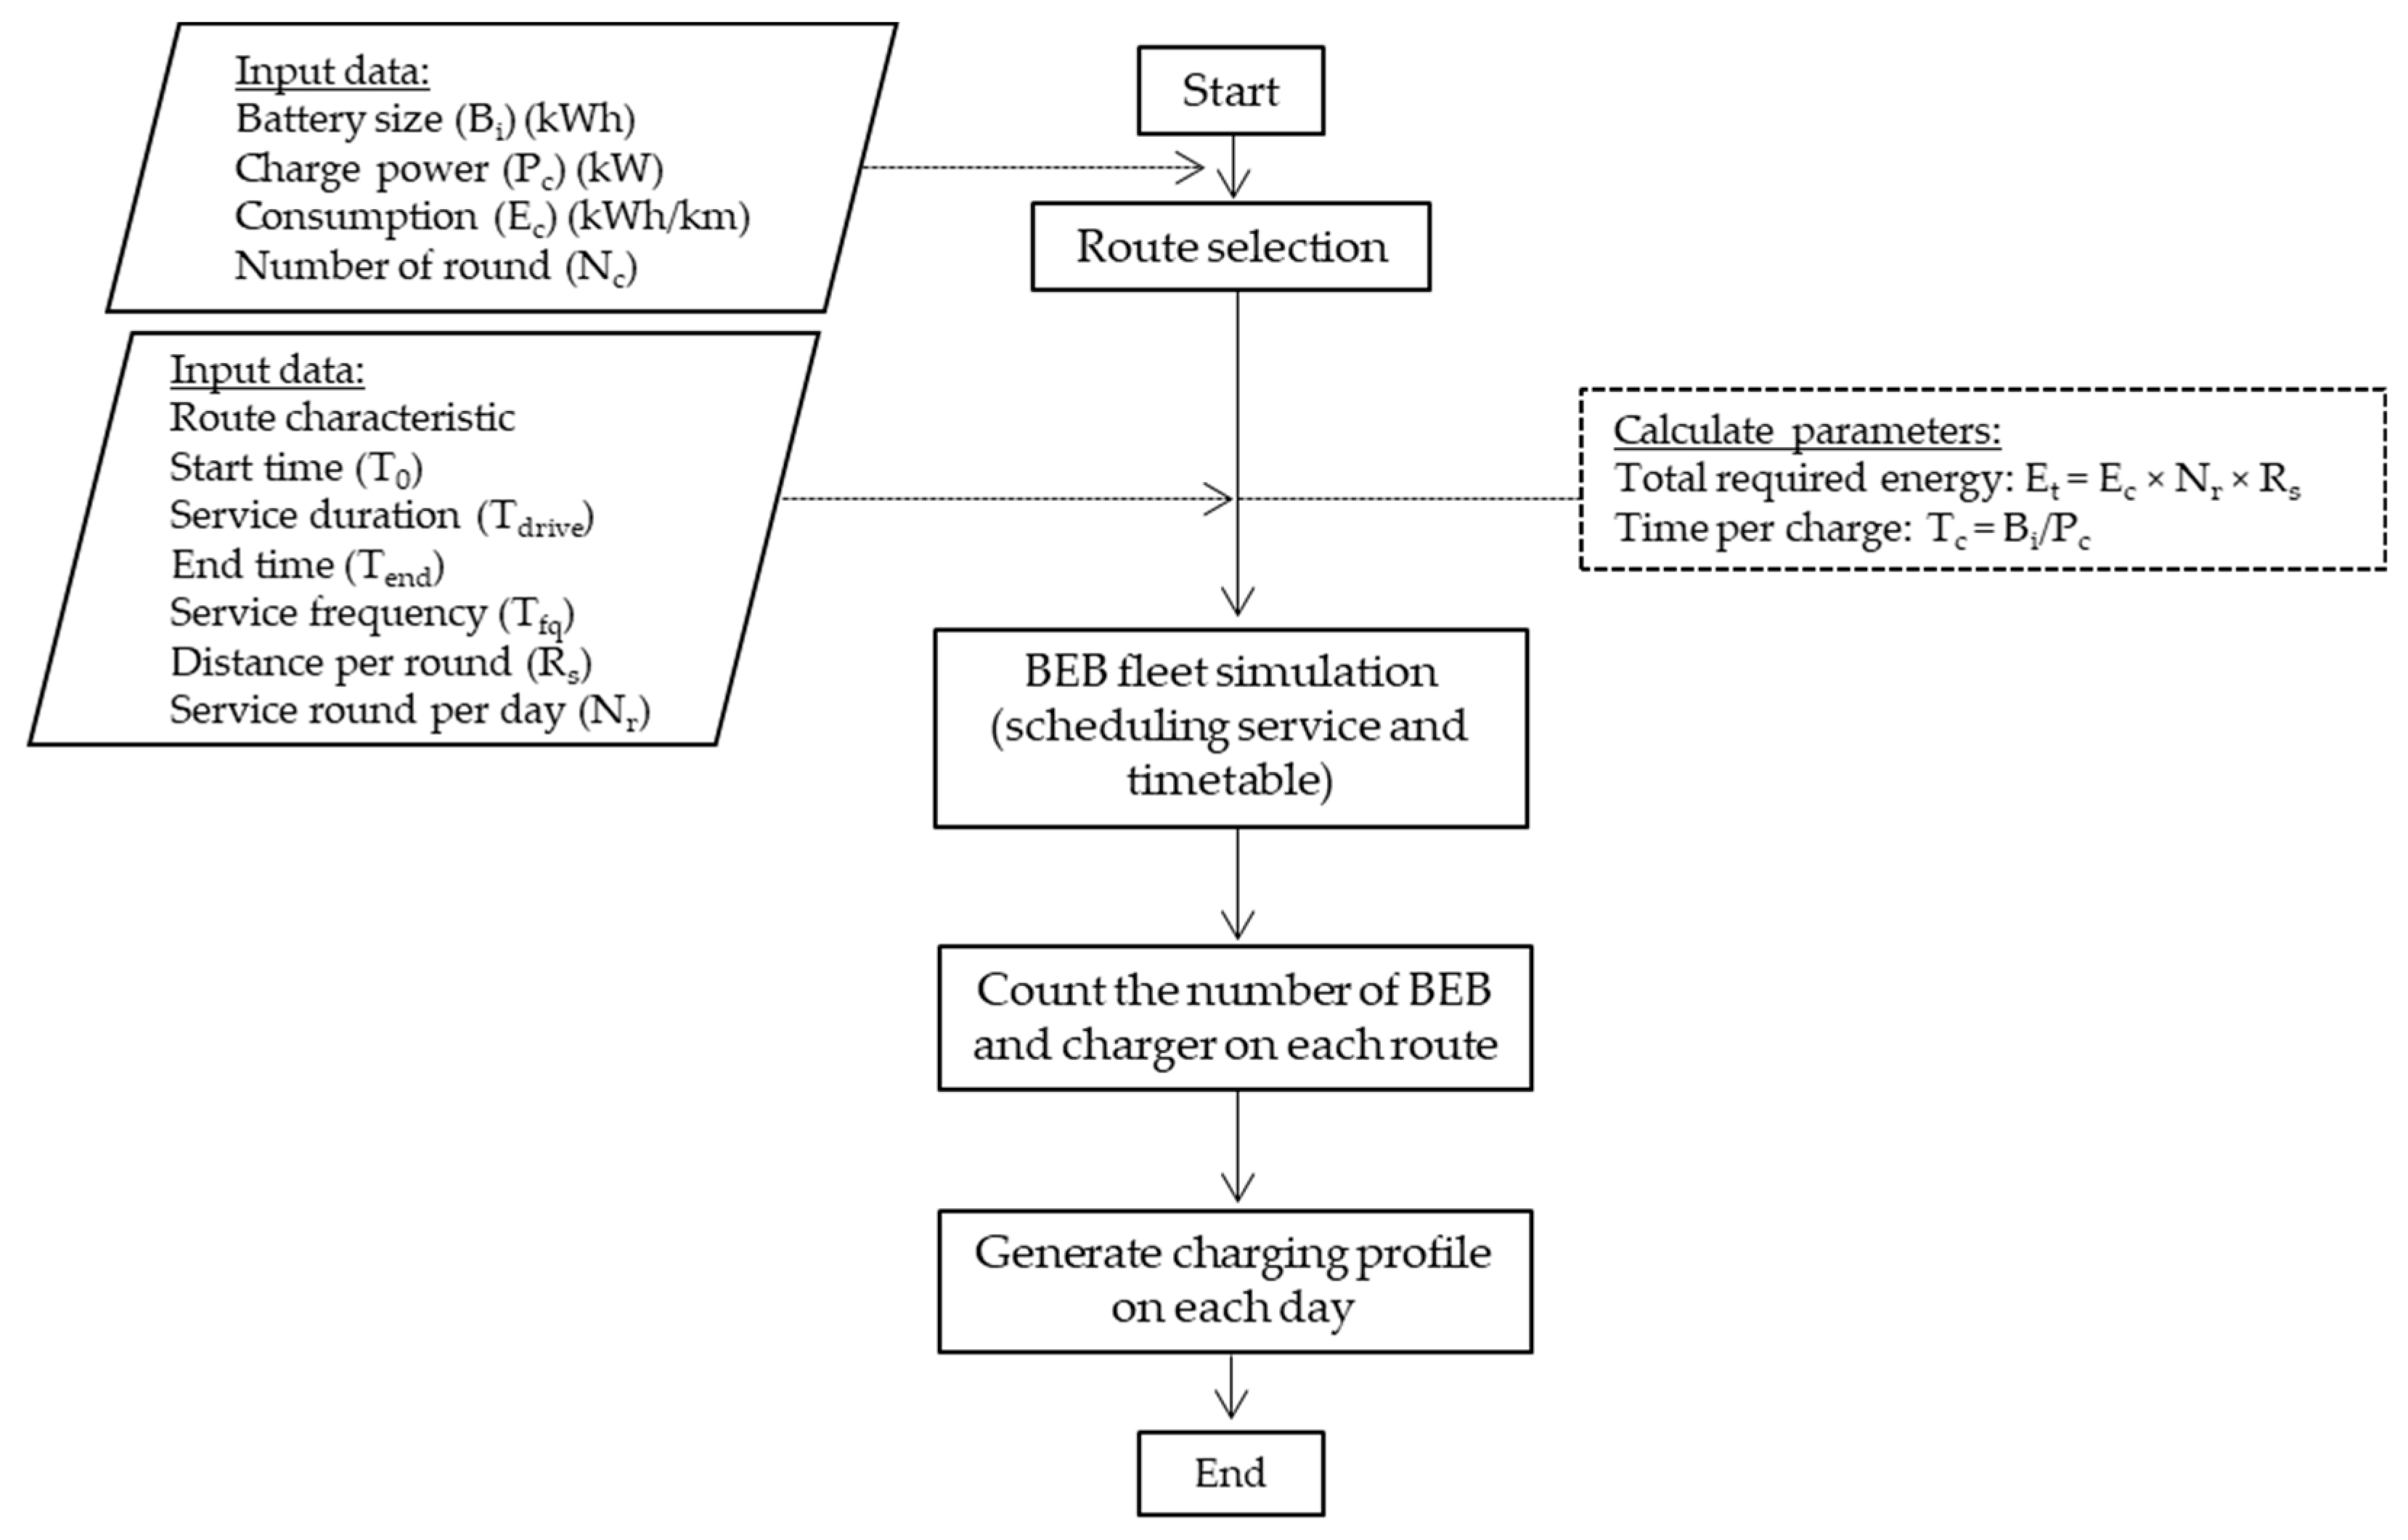

Table 1.
The parameter definition.
| Parameters | Unit | Description | Parameter type |
|---|---|---|---|
| Bc | kWh/charge | Energy consumption per round of charge | Calculation |
| Bi | kWh | Battery installed capacity | Input |
| Br | kWh/round | Energy consumption per round | Calculation |
| Ec | kWh/km | Energy consumption | Input |
| Et | kWh/day | Total energy required per day | Calculation |
| Nc | - | Number of rounds per charge | Input |
| Nr | Round/day | Number of rounds per day | Input |
| Rs | km/round | Service distance per round | Calculation |
| T0 | - | Start time | Input |
| Tc | hours | Charge duration | Calculation |
| Tdrive | hours | Drive duration | Input |
| Tend | - | End time | Input |
| Tfq | hours | Service frequency | Input |
3. Results and discussion
The results from the BMTA route analysis step showed the five routes that operated out of the Bangkhen Depot. On average, five rounds were operated per day for 107, 129, 95, and 543, and an average of seven rounds per day were operated for A1. The routes of 107, 129, 95, and 543 were longer and had a lower frequency, and the route of A1 was shorter and had a higher frequency. An energy consumption of approximately 1.23 kWh/km was estimated when using all BEBs with a regenerative braking system according to the BTMA route characteristics [21]. The results are shown in Table 2 and Table 3, which refer to different charging strategies. Overnight charging and daytime charging were considered with two charges per day. The results showed the possibility of using BEBs on each route operating out of the Bangkhen Depot. A BEB battery capacity of 150 kWh would not be recommended when switching operation to BEBs, but this switch could be made if the BEBs operated with 200 kWh of battery capacity, but the fleet was limited to two rounds per charge. This was applicable to routes 543 and 107. Routes 543 and 107 required less than 200 kWh for every two rounds. These routes were designed in the next step.
Table 2.
Analysis of the BMTA routes considering the overnight charging strategy.
| Route | Br (km/round) |
Nc (rounds/charge) |
Bc (km/charge) | Ec (kWh/km) |
Et (kWh/day) |
|---|---|---|---|---|---|
| 543 | 80 | 5 | 400 | 1.23 | 492 |
| 107 | 76 | 5 | 380 | 1.23 | 467 |
| 129 | 102 | 5 | 510 | 1.23 | 627 |
| A1 | 62 | 7 | 434 | 1.23 | 534 |
| 95 | 104 | 5 | 520 | 1.23 | 640 |
Table 3.
Analysis of the BMTA routes considering the daytime charging strategy.
| Route | Br (km/round) |
Nc (rounds/charge) |
Bc (km/charge) | Ec (kWh/km) |
Et (kWh/day) |
|---|---|---|---|---|---|
| 543 | 80 | 2 | 160 | 1.23 | 197 |
| 107 | 76 | 2 | 152 | 1.23 | 187 |
| 129 | 102 | 2 | 204 | 1.23 | 251 |
| A1 | 62 | 2 | 186 | 1.23 | 229 |
| 95 | 104 | 2 | 208 | 1.23 | 256 |
The results from the BMTA route analysis step showed the possibility of operating with BEBs on routes 543 and 107, which began at the Bangkhen Depot. These routes were confirmed to be limited to two rounds, as they illustrated the lowest service distance per round. For route 543, it would be possible to switch to BEBs with two rounds per charge beginning at 5:00 a.m. and ending at 11:00 p.m. while taking 3 hours per loop. Route 107 started at 4:30 a.m. and ended at 9:45 p.m. while taking 2 hours and 40 minutes per loop. The time schedules on routes 543 and 107 are shown in Table 4.
Table 4.
BEB schedule.
| Route | Start time (T0) | Time per loop (Tdrive) | End of operation (Tend) | Vehicle range per round (Rs km/round) |
Number of rounds per day (Nr, round/day) | Vehicle range per day (km/day) |
|---|---|---|---|---|---|---|
| 543 | 5.00 a.m. | 3 hr | 11.00 p.m. |
80 | 5 | 400 |
| 107 | 4.30 a.m. | 2 hr 40 min |
9.45 p.m. |
76 | 5 | 380 |
The parameters in Table 4 were used as input data for the fleet management and design model. The model’s results are illustrated in Figure 3 and Figure 4 for routes 543 and 107, respectively; the “Go” symbol indicates that the BEB is running, and the “C” symbol indicates that the BEB is charging. The service characteristics were expanded into the total energy required for the system when routes 543 and 107 were operated with BEBs. The traction batteries of the BEBs on these routes had a capacity of 200 kWh, the power of the chargers was 150 kW (using fast DC charging and that was completed within 90 minutes for the 200 kWh battery capacity), and the bus timetable involved a departure frequency of 1 hour.
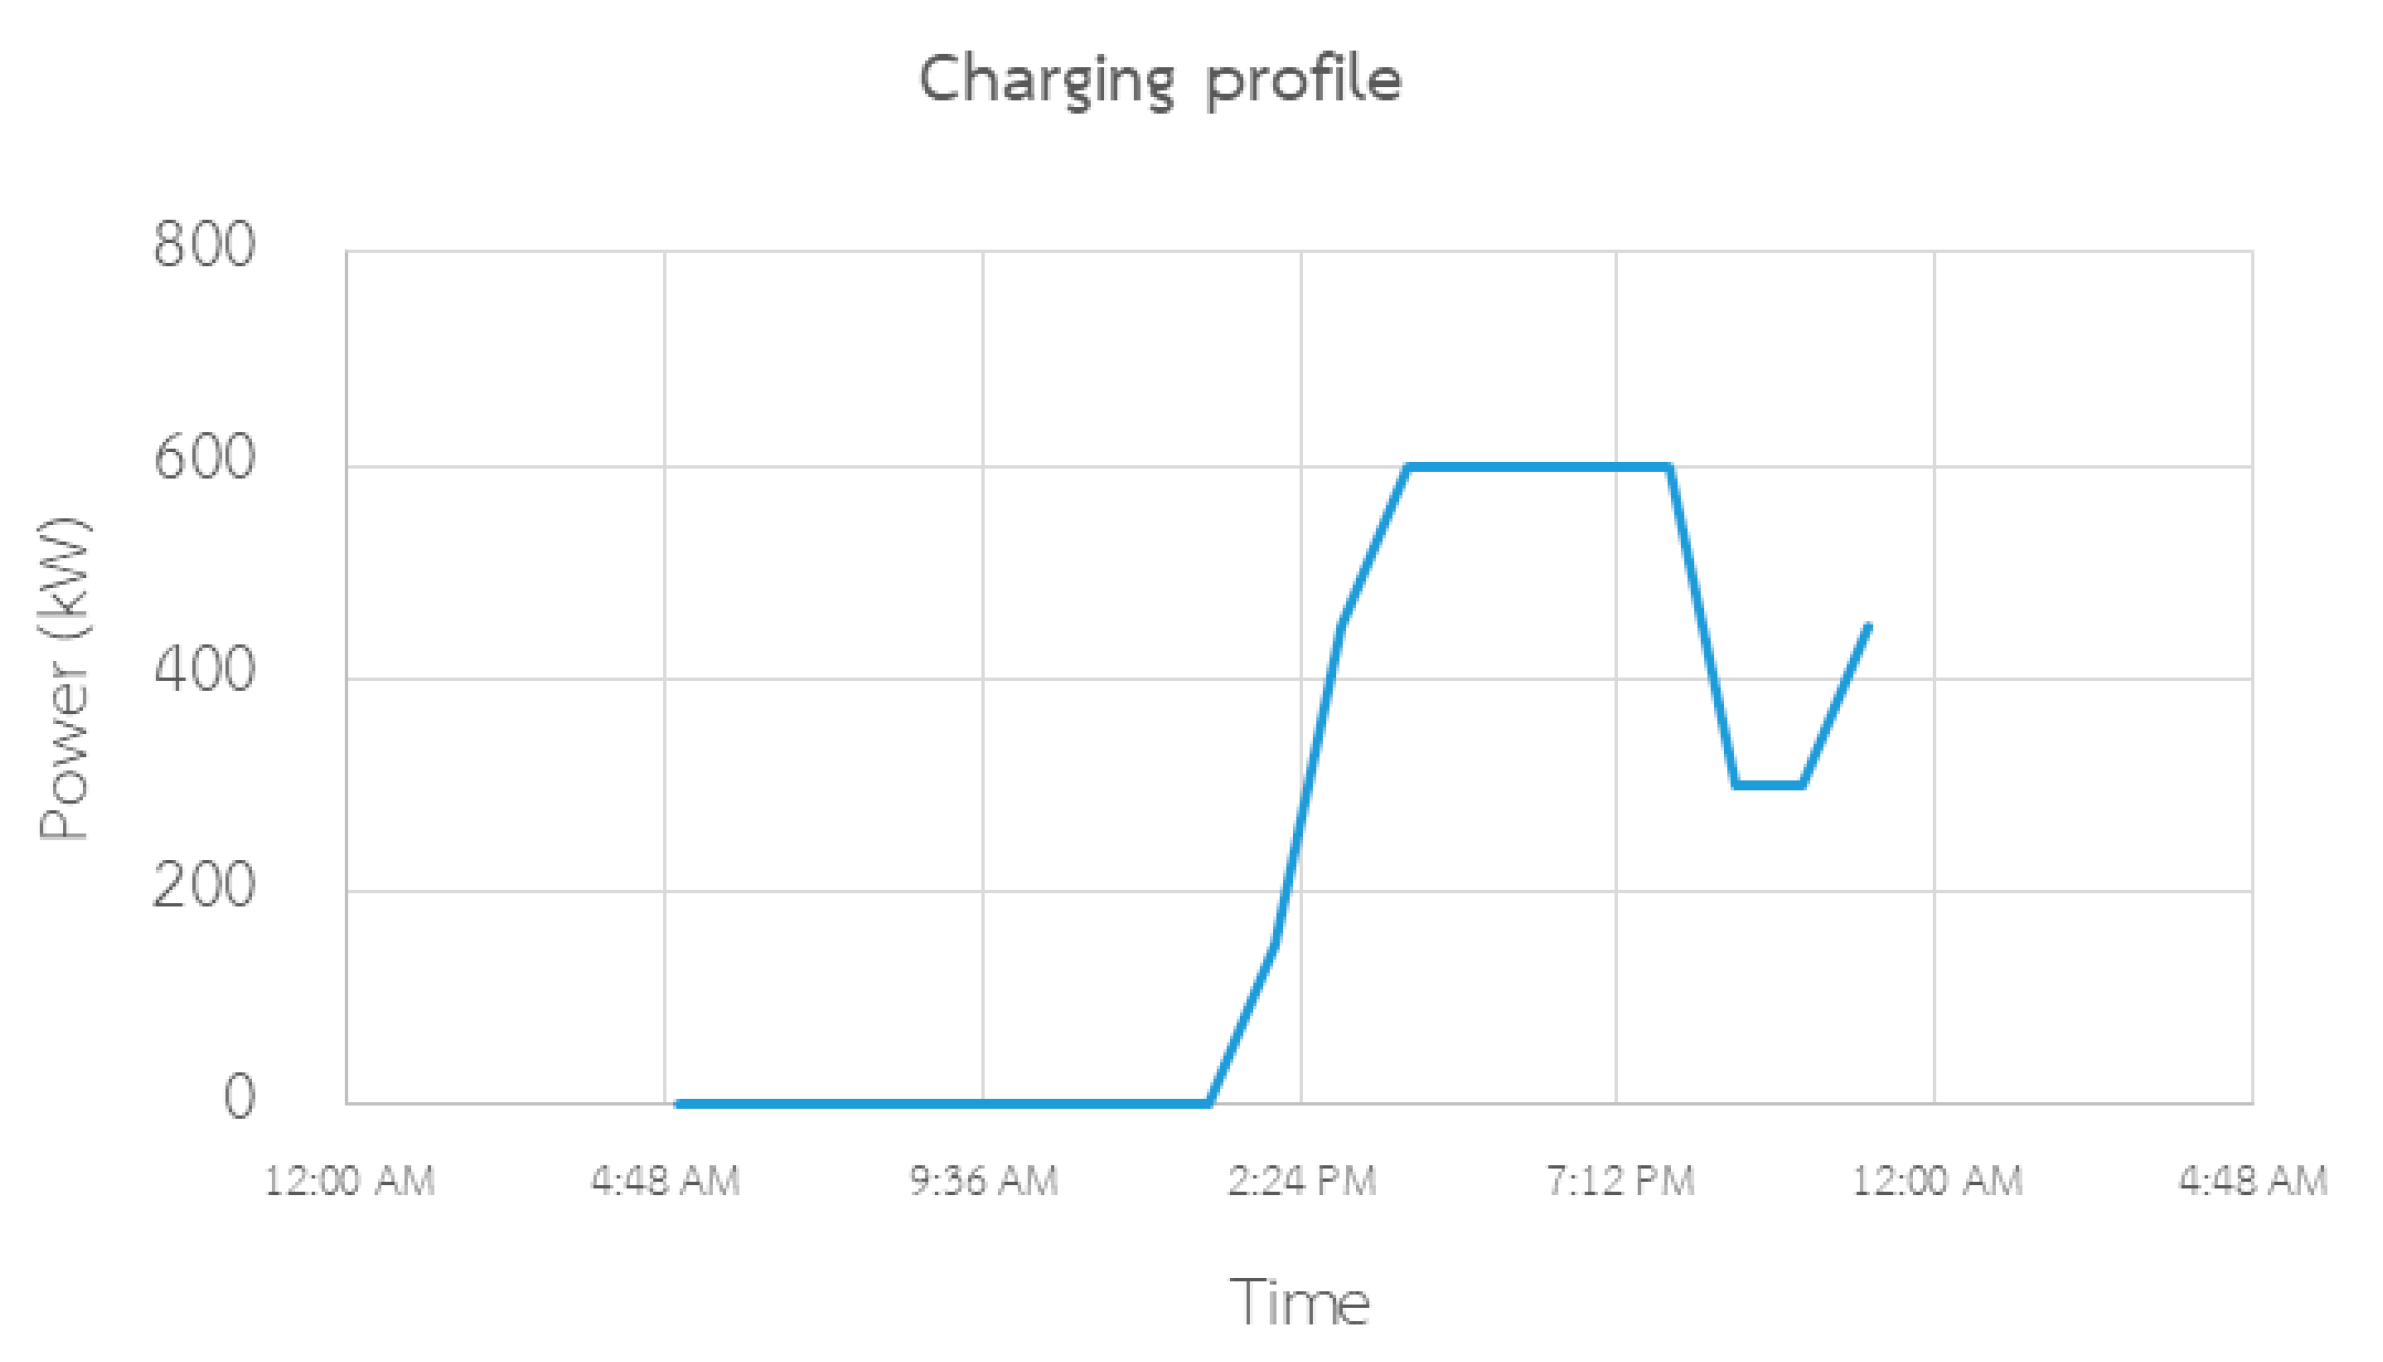
After applying these conditions and constraints, it was found that six BEBs and seven BEBs were required for routes 543 and 107, respectively, thus comprising a BEB fleet. The fleet was required to have 150 kW of charging power with four available slots, which could be either four plugs of a charging system or four chargers. The charging profile peaked at 600 kW in the period of 4:00–8:00 p.m. as shown in Figure 5. The sharing of the charger resources was proved by these results. Fleet management and design can be optimized with this model. The first BEB started charging from 2:00 p.m. and finished at 11.00 p.m. every day. For routes 543 and 107, most of the BEBs could be charged once daily, with one BEB being charged twice. At the end of each day, ten BEBs required overnight charging for either route 543 or route 107, while two BEBs already had fully charged batteries.
Figure 3.
Timetable for running and charging BEBs on route 543.
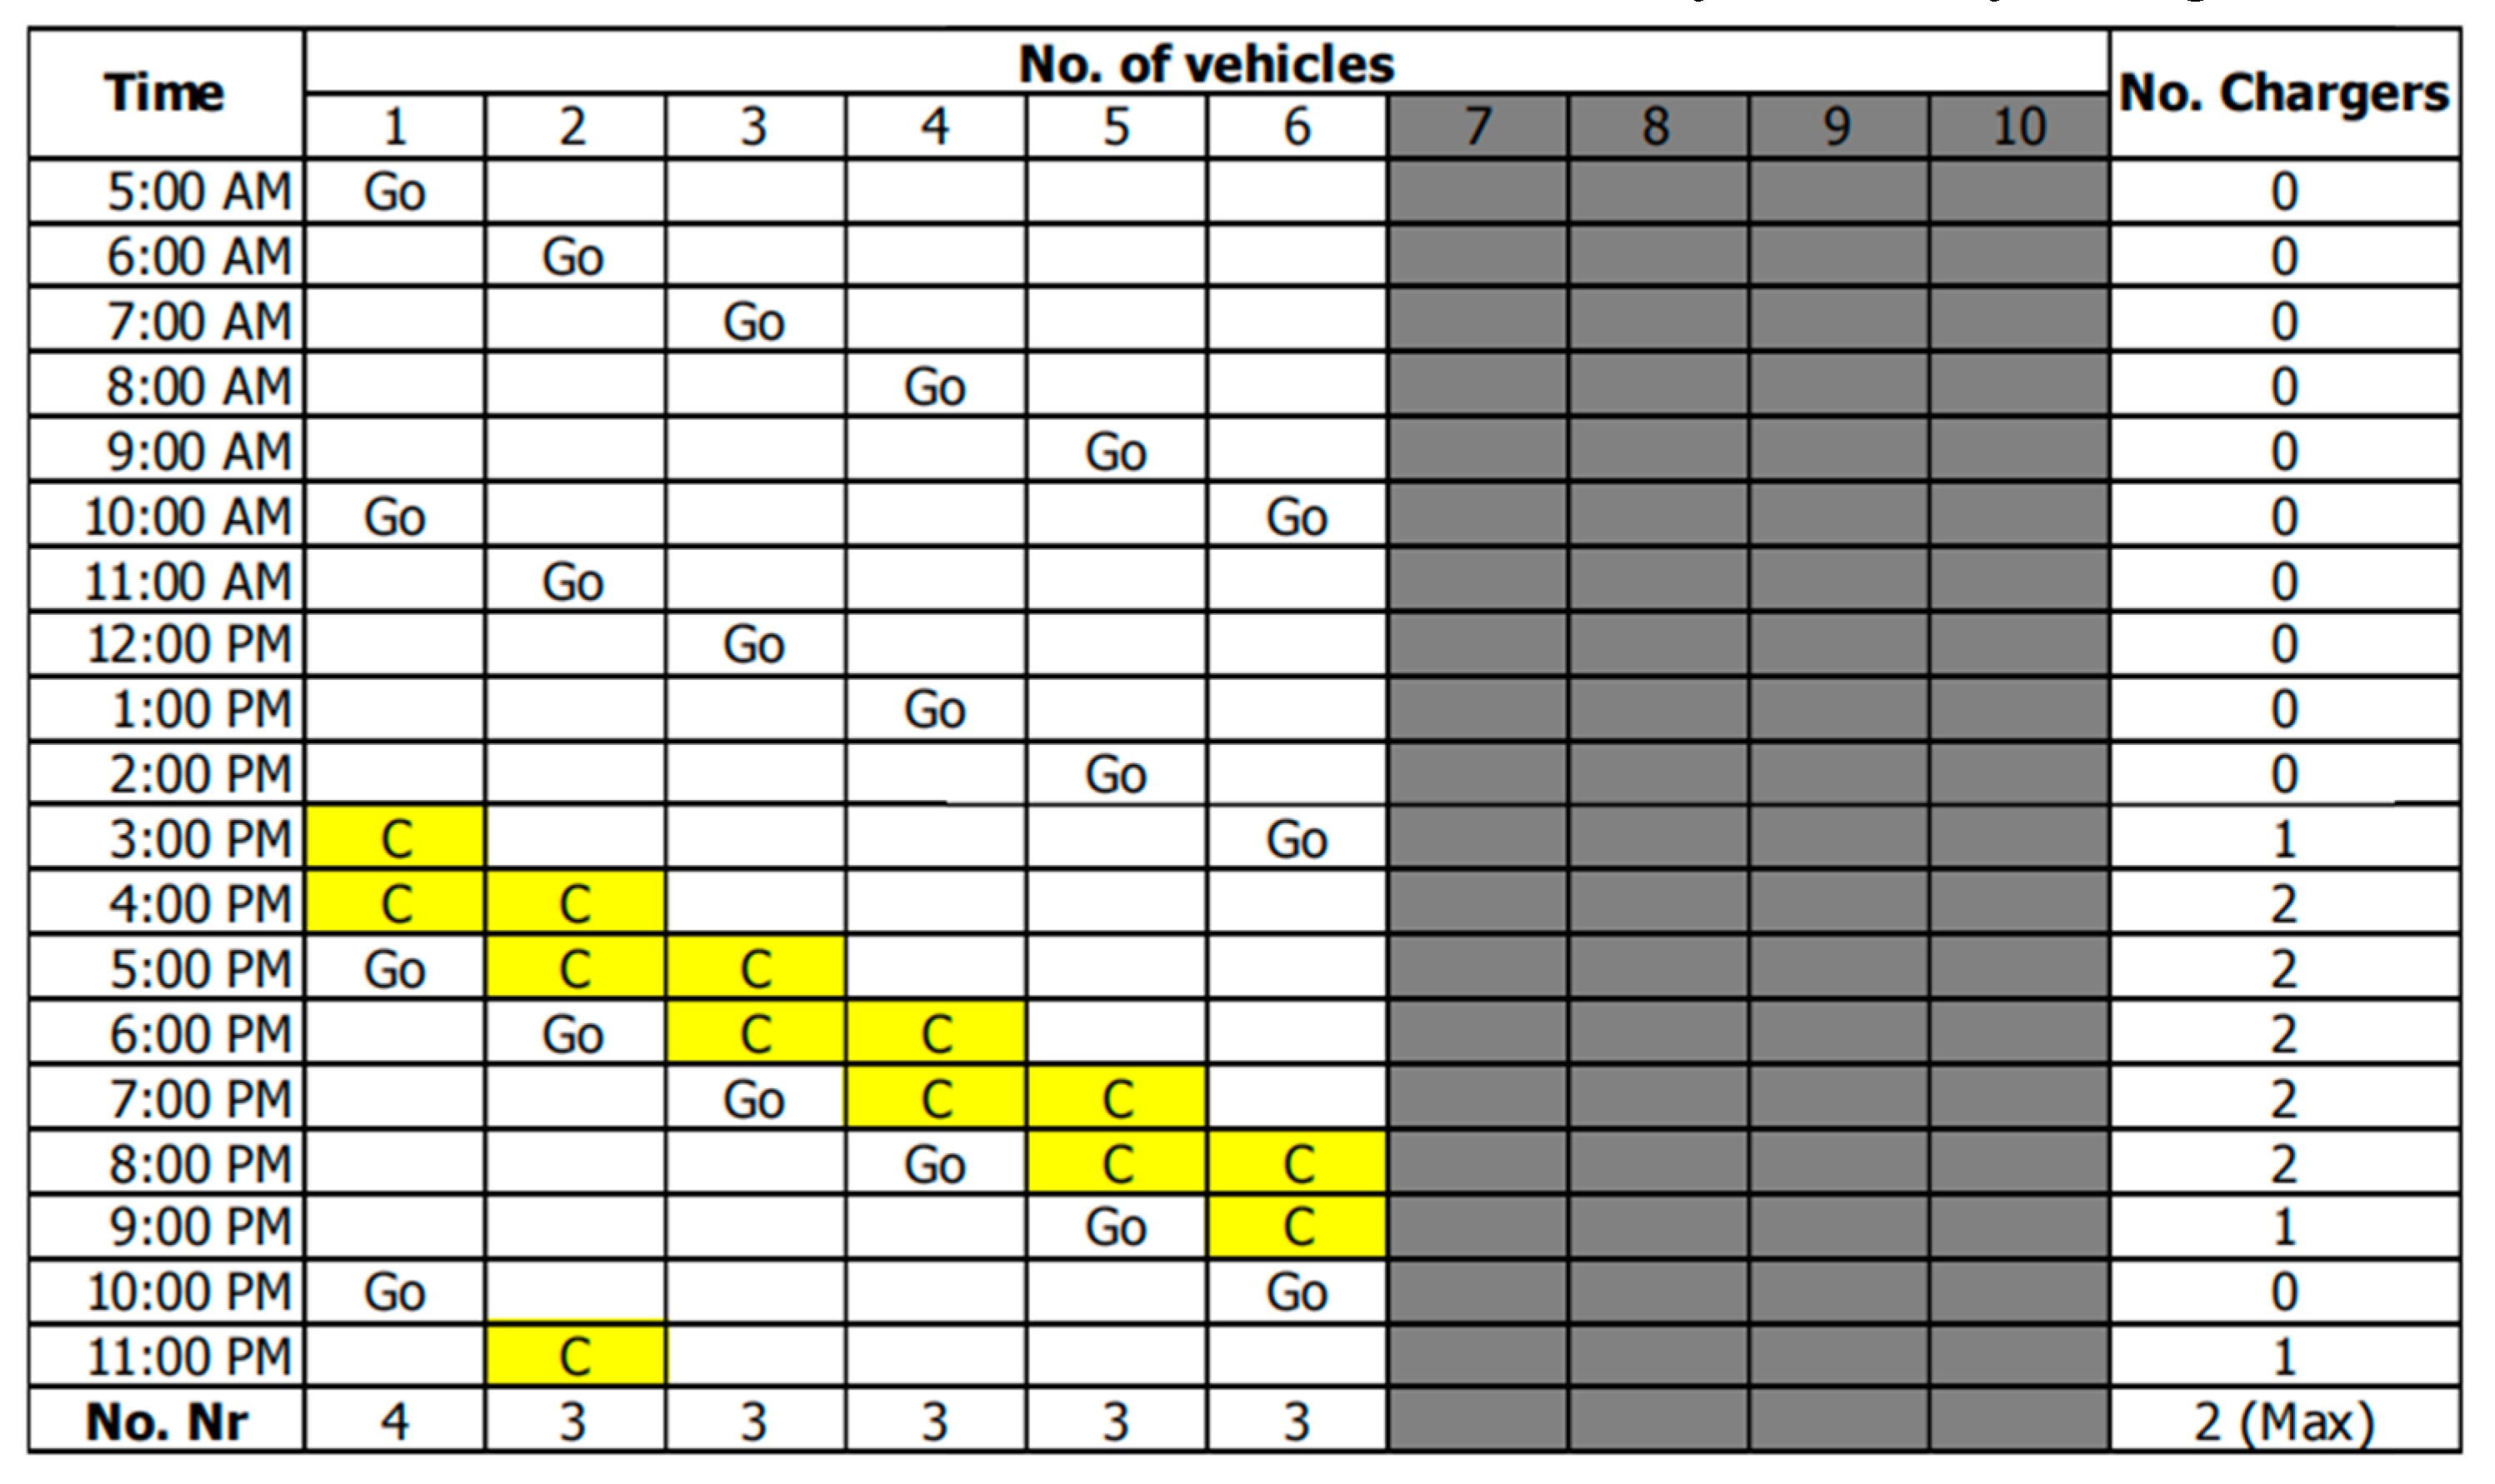
Figure 4.
Timetable for running and charging BEBs on route 107.
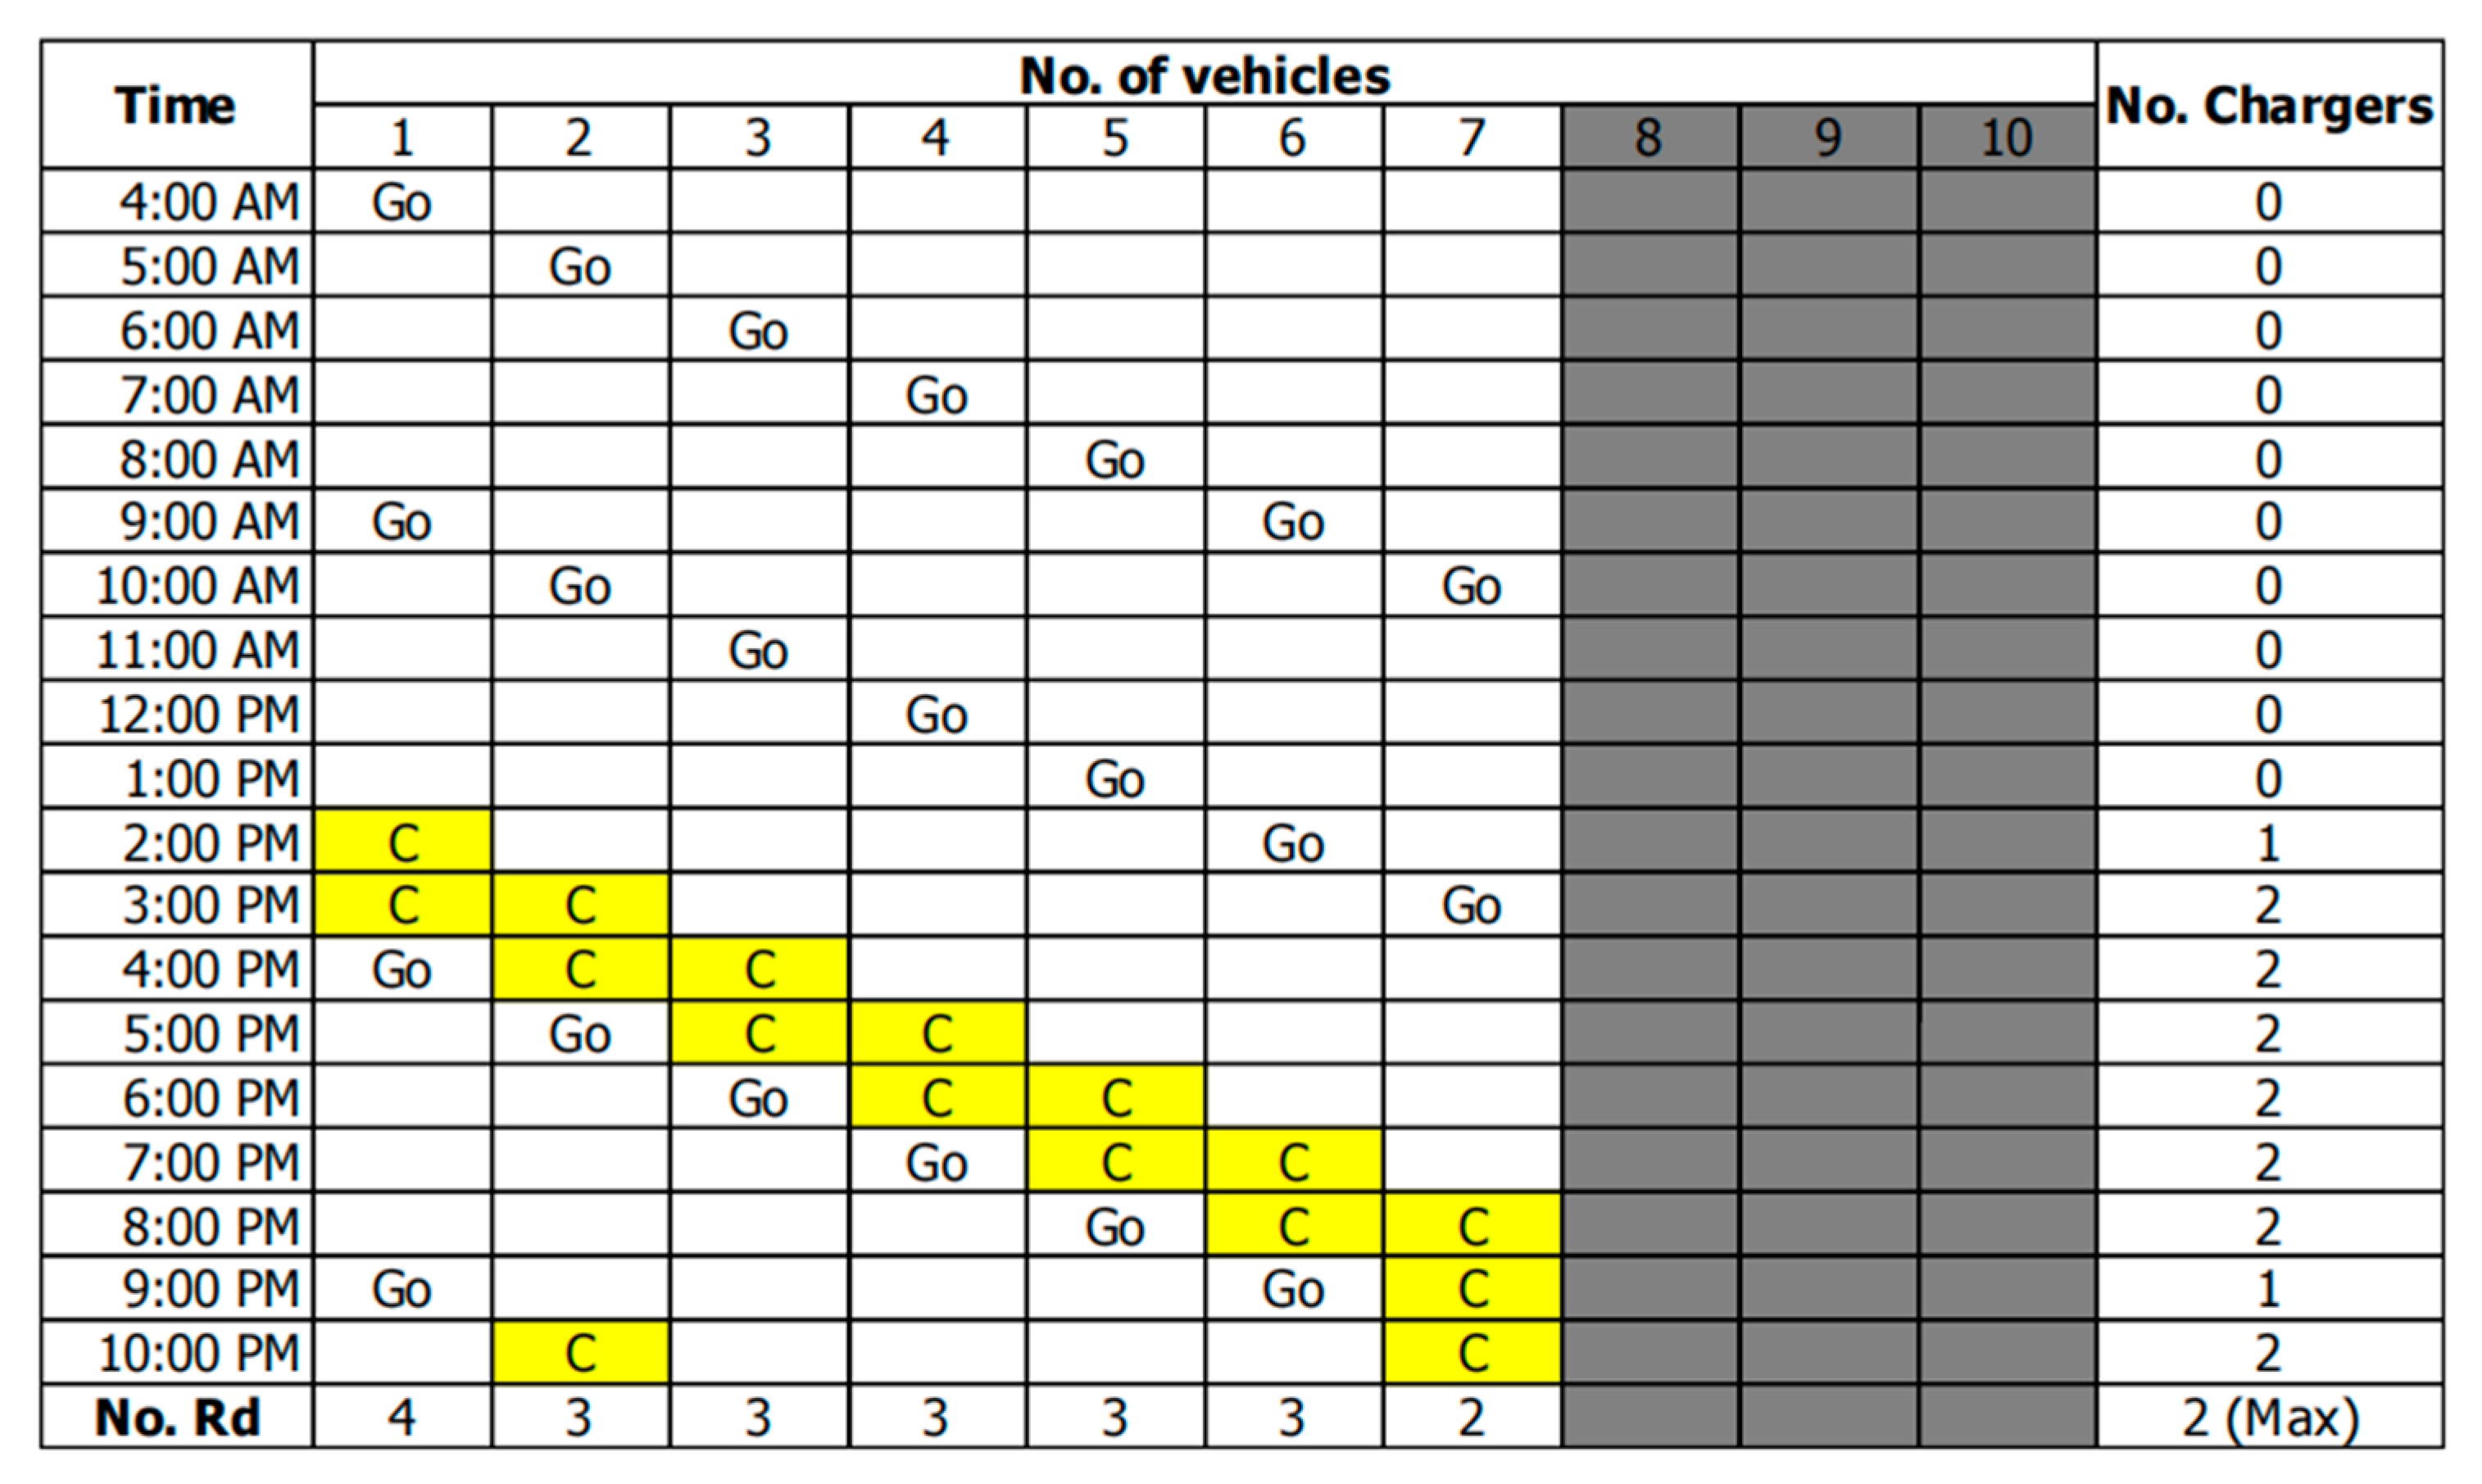
Figure 5.
Charging profile.
Thirteen BEBs, the timetables, and four chargers were used for the model validation. The model needed save costs. The daily charging energy at the terminal, the total charging energy at the end of each day, the total vehicle range per year, and the average total vehicle range per year are illustrated in Table 5 and Table 6. The average total vehicle ranges per year were 146,000 km/year and 138,720 km/year for routes 543 and 107, respectively. The fleet energy management and design still involved a traction battery capacity of 200 kWh and a charging power of 150 kW. On route 543, five BEBs were charged one time per day, and one BEB was charged at the end of the day. On route 107, five BEBs were charged one time per day, and two BEBs were charged again at the end of the day. At the end of each day, it was necessary to charge five BEBs each for route 543 and route 107. These show the differences in the charging required at different times, which affected the charging cost. The characteristics of operating a diesel bus were assumed and used for comparison.
Finally, the energy cost savings when using the BEB fleet design and management were validated, as shown in Table 7 and Table 8. Route A1 was assumed to use seven BEBs in the fleet with a total charging energy of 400 kWh per vehicle per day, and this was used for the verification and confirmation of the model. Routes 543 and 107 were also assessed in terms of energy savings, but route A1 did not provide savings. Route A1 is not recommended for BEB operation. The amount of energy saved on routes 543 and 107 was better than that saved with diesel buses. A total of 10.44 million baht per year were saved. These results require further study in terms of the economic scale and total ecosystem cost. The initial cost, which was the price of either the diesel bus or electric bus, the fuel cost, which was the price of either diesel oil or electricity, and other investment costs, such as that of the charging infrastructure, were used as sensitivity parameters for the calculation of the economic model.
Another way to optimize the model results was to consider the investment cost. The two scenarios for the investment cost were compared. The first scenario was business as usual (BAU), in which the BMTA fleet normally operated on routes 543 and 107 with 5 buses and 15 buses, respectively, and chargers (150 kW) were prepared for the operation of all buses. The second scenario was that of optimization of the sharing of buses and charging resources. The investment costs in the scenarios are shown in Table 9. In the BAU case, there were 20 buses and 10 chargers in total (at least for the operation of 20 buses). The investment cost in the BAU case was more than 37% greater than that in the optimization scenario. The reason for the cost savings was the optimization of the number of BEBs and the sharing of charging system resources between the different routes. This was the only investigation of investment costs. For more information on investment decisions, the total lifetime cost of the product may be used.
4. Conclusions
The route analysis model demonstrated that the buses on BMTA routes 543 and 107 can be switched to BEBs with a battery capacity of 200 kWh. A daytime charging strategy with which BEBs could operate at for least two rounds per charge was applied in a simulation.
Six and seven were the minimum numbers of BEBs for routes 543 and 107, respectively. These BEBs can be operated instead of conventional buses out of the Bangkhen Depot. A 150 kW charger with four plugs, which is the optimal investment, is required for this fleet. A peak of 600 kW on each day from 4:00 to 8:00 p.m. was calculated. This proved the optimization of the design with the minimum numbers of BEBs and chargers, which directly affects investment decisions. This demonstrates the potential of this fleet management and design model.
The parameters of the model that had effects on the optimization of fleet management and design were the BEB energy consumption (Ec, kWh/km), traction battery capacity (Bat_size, kWh), charging capacity (Pc, kW), and number of rounds per day (Nr, round per day). These parameters had variable effects on the number of BEBs (nBEB, vehicle), the BEB timetable, and the number of chargers (nCh, charger).
The results of the model for the management and design of BEB fleets for routes 543 and 107 were compared with those of a diesel bus to validate the model. The model should be used to determine cost savings with respect to the conventional system. A simple financial analysis was conducted, and the model results were found to save an annual 10.44 million baht in energy costs when using a BEB fleet instead of a diesel bus fleet. Only these BMTA routes saved energy costs through BEB operation. These results are only those of the model’s validation; they do not represent a final assessment or financial modeling of project feasibility. The optimization of the total number of BEBs and the sharing of charging system resources saved more than 37% of the investment costs with respect to the original scenario.
The results of this study show the greatness and simplicity of this energy model for BEB fleet management and design optimization. Most of these results can be used for investment decisions, which is a very important thing. The sharing of charging resources was applied. However, these models are still limited to a lack of consideration of the charging strategy after the end of daily service, and the peak of charging was considered as a peak hour, which will influence the operating cost. The rescheduling of BEB operations and charging systems was not included in this study. The total lifetime cost of a BEB fleet was also not included. These should be considered for more decision effectiveness.
Acknowledgements
The valuable data came from the Bangkok Mass Transit Authority (BMTA). This work was supported by the School of Energy, Environment, and Materials (SEEM), King Mongkut’s University of Technology Thonburi (KMUTT), and the National Energy Technology Center (ENTEC), National Science and Technology Development Agency (NSTDA).
References
- Bo MacInnis and Jon A. Krosnick, Surveying American Public Opinion Climate Change and the Environment, Climate Insights 2020, Page 23 (2020).
- Evanthia A.Nanaki, Electric Vehicles for Smart Cities, Electric Vehicles for Smart Cities, 13-49 (2021). [CrossRef]
- Janos LucianBreuer, Remzi Can Samsun, Detlef Stolten, Ralf Peters, how to reduce the greenhouse gas emissions and air pollution caused by light and heavy-duty vehicles with battery-electric, fuel cell-electric and centenary trucks, Environment International, Vol. 152, 106474 (2021). [CrossRef]
- Hamidreza Shamsi, Manh-Kien Tran, Shaghayegh Akbarpour, Azadeh Maroufmashat, Michael Fowler, Macro-Level optimization of hydrogen infrastructure and supply chain for zero-emission vehicles on a Canadian corridor, Journal of Cleaner Production, Vol. 289, 125163 (2021). [CrossRef]
- International Energy Agency (IEA), Global EV Outlook 2019 Scaling-up the transition to electric mobility, (2019).
- The Office of Transport and Traffic Policy and Planning (OTP), National Greenhouse Gas Reduction Action Plan 2021-2030 in the field of transport, (2021).
- The Office of Transport and Traffic Policy (OTP), Thailand Greenhouse Gas Reduction Action Plan 2021 – 2030, (2016).
- Alexander Kunith, Roman Mendelevitch, Dietmar Göhlich, Electrification of a city bus network—An optimization model for cost-effective placing of charging infrastructure and battery sizing of fast-charging electric bus systems. International Journal of Sustainable Transportation, 11 (10), 707–720 (2017). [CrossRef]
- Yongxi Huang, Shengyin Li, Sean Qian, Optimal deployment of alternative fueling stations on transportation networks considering deviation paths, Networks and Spatial Economics, 15 (1), 183–204 (2015). [CrossRef]
- Wei Tu, Qingquan Li, Zhixiang Fangd, Shih-lung Shaw, Baoding Zhou, Xiaomeng Chang, Optimizing the locations of electric taxi charging stations: a spatial–temporal demand coverage approach, Transportation Research Part C: Emerging Technologies, 65, 172–189 (2016). [CrossRef]
- Christopher Upchurcha, Michael Kuby, Comparing the p-median and flow-refueling models for locating alternative-fuel stations, Journal of Transport Geography, 18 (6), 750–758 (2010). [CrossRef]
- Julian Hof, Michael Schneider, Dominik Goeke, Solving the battery swap station location-routing problem with capacitated electric vehicles using an AVNS algorithm for vehicle-routing problems with intermediate stops, Transportation Research Part B: Methodological, 97, 102–112 (2017). [CrossRef]
- Fang He, Di Wua, Yafeng Yin, Yongpei Guan, Optimal deployment of public charging stations for plug-in hybrid electric vehicles, Transportation Research Part B: Methodological, 47, 87–101 (2013). [CrossRef]
- Fang He, Yafeng Yin, Jing Zhou, Deploying public charging stations for electric vehicles on urban road networks, Transportation Research Part C: Emerging Technologies, 60, 227–240 (2015). [CrossRef]
- Yu (Marco) Nie, Mehrnaz Ghamami, A corridor-centric approach to planning electric vehicle charging infrastructure, Transportation Research Part B: Methodological, 57, 172–190 (2013). [CrossRef]
- Yu (Marco) Nie, Mehrnaz Ghamami, Ali Zockaie, Feng Xiao, Optimization of incentive policies for plug-in electric vehicles, Transportation Research Part B: Methodological, 84, 103–123 (2016).
- Matthias Rogge, Evelien van der Hurk, Allan Larsen, Dirk Uwe Sauer, Electric bus fleet size and mix problem with optimization of charging infrastructure, Applied Energy, 211, 282-295 (2018). [CrossRef]
- Hussein Basma, Marc Haddad, Charbel Mansour, Maroun Nemer, Pascal Stabat, Evaluation of the techno-economic performance of battery electric buses: Case study of a bus line in Paris, Research in Transportation Economics, 95, 101207 (2022). [CrossRef]
- Hussein Basma, Energy management strategies for battery electric bus fleet, International Council on Clean Transportation (2020).
- Adnane Houbbadi, Rochdi Trigui, Serge Pelissier, Eduardo Redondo-Iglesias, Tanguy Bouton, Optimal scheduling to manage an electric bus fleet overnight charging, Energies, 12, 2727 (2019). [CrossRef]
- Sorawit Wanitanukul, Kuskana Kubaha, Roongrojana Songprakorp, Effect of regenerative braking system on state of charge and energy consumption of battery electric buses under uncertainty driving condition, Proceedings of the 11th International Conference on Materials Science and Technology, 29-31 August 2022, 54-60 (2022).
- Shaojun Zhang, Ye Wu, Huan Liu, Ruikun Huang, Liuhazi Yang, Zhenhua Li, Lixin Fu, Jiming Hao, Real-world fuel consumption and CO2 emission of urban public buses in Beijing, Applied Energy, 113, 1645 – 1655 (2014). [CrossRef]
Table 5.
Daily charging energy and vehicle range per year per vehicle.
| Route | Daily round | Daily charge | Charging energy | Energy at the end of the day | Daily range (km/day) | Yearly range (km/year) |
|---|---|---|---|---|---|---|
| 543 | 3 | 1 | 200 kWh | 200 kWh | 400 | 146,000 |
| 107 | 3 | 1 | 200 kWh | 200 kWh | 380 | 138,700 |
Table 6.
Total charging energy and vehicle range per year for the fleet.
| Route | Total BEB | Chargers | Total daily charging at the terminal | Total charging energy at the end of the day | Total vehicle range per day (km/day) | Total range per year (km/year) |
|---|---|---|---|---|---|---|
| 543 | 6 | 2 | 1,400 kWh | 1,000 kWh | 2,400 | 876,000 |
| 107 | 7 | 2 | 1,600 kWh | 1,000 kWh | 2,660 | 970,900 |
Table 7.
Financial model for the diesel fleet simulation.
| Vehicle type | Diesel bus | ||
|---|---|---|---|
| Route | 543 | 107 | A1 (assumed) |
| Fuel cost per year | |||
| Range per day (km/day) | 400 | 380 | 434 |
| Fuel consumption (km/L) [22] | 3.07 | 3.07 | 3.07 |
| Fuel cost (baht/L) | 30.00 | 30.00 | 30.00 |
| Number of vehicles (buses) | 6 | 7 | 7 |
| Total fuel cost per day (baht/day) | 23,529 | 26,078 | 29,784 |
| Total fuel cost per year (baht/year) | 8,588,235 | 9,518,627 | 10,871,275 |
Table 8.
Financial model for the BEB fleet simulation.
| Vehicle type | BEB | ||
|---|---|---|---|
| Route | 543 | 107 | A1 (assumed) |
| Energy cost per year | |||
| Number of vehicles (BEBs) | 6 | 7 | 7 |
| Daily charging energy (kWh/day) | 1,400 | 1,600 | 2,800 |
| Electricity price (peak hour) (baht/kWh) | 5.00 | 5.00 | 5.00 |
| Charging energy at the end of day (kWh/day) | 1,000 | 1,000 | 1,000 |
| Electricity price (off-peak hour) (baht/kWh) | 3.00 | 3.00 | 3.00 |
| Total energy cost per day (baht/day) | 10,000 | 11,000 | 14,800 |
| Total energy cost per year (baht/yr) | 3,650,000 | 4,015,000 | 6,205,000 |
| Energy saving (baht/year) | 4,938,235 | 5,503,627 | 4,666,275 |
Table 9.
The investment cost in each scenario.
| Scenarios | Number of BEBs | Number of chargers | Total investment cost (million THB) | |
| 543 | 107 | |||
| Cost (Million THB/unit) |
7 | 7 | 1.5 | - |
| BAU | 5 | 15 | 10 | 155 |
| This study | 6 | 7 | 4 | 97 |
Disclaimer/Publisher’s Note: The statements, opinions and data contained in all publications are solely those of the individual author(s) and contributor(s) and not of MDPI and/or the editor(s). MDPI and/or the editor(s) disclaim responsibility for any injury to people or property resulting from any ideas, methods, instructions or products referred to in the content. |
© 2023 by the authors. Licensee MDPI, Basel, Switzerland. This article is an open access article distributed under the terms and conditions of the Creative Commons Attribution (CC BY) license (http://creativecommons.org/licenses/by/4.0/).
Copyright: This open access article is published under a Creative Commons CC BY 4.0 license, which permit the free download, distribution, and reuse, provided that the author and preprint are cited in any reuse.


