
Submitted:
23 December 2023
Posted:
25 December 2023
You are already at the latest version
Abstract
We analyzed mineralogical characteristics, and major as well as rare earth element concentrations from a cryptotephra layer in sediments of the infilled maar of Auel (Eifel, Germany). The results of detailed geochemical analyses of clinopyroxenes and their glassy rim of the specific layer are most similar to those from the Campanian Ignimbrite (CI) Tephra occurrence in a loess section at Urluia (Romania). Both records show idiomorphic green clinopyroxenes and formation of twisted minerals up to millimeter scale. The cryptotephra in the Auel core has an age of around 39,940 yr b2k in the ELSA-20 chronology, almost identical to the latest Ar/Ar dates for the Campanian Ignimbrite/Y5 eruption. These observations suggest that parts of the CI ash cloud were transported also northwestward into Central Europe, whereas the main branch of the CI ash plume was transported from southern Italy towards the NE, E and SE.
Keywords:
Eifel maar sediments
; Campanian Ignimbrite Tephra
; Marine Isotope Stage 3
; Greenland Interstadial 9
; Heinrich Event 4
; green clinopyroxene.
1. Introduction
The Eifel is a low mountain range in western Germany, which is characterized by intraplate volcanism [1]. The volcanic Eifel can be divided into three areas: the High Eifel with volcanic activity from the Tertiary and the Western and Eastern Eifel, which have the only two Quaternary volcanic fields in Germany. A special feature of volcanism in the Eifel is the existence of various maars. At present there are still six maar lakes and about 60 infilled maars in the western Eifel [2]. Since 1998 the investigation of paleoclimatic changes in the Eifel volcanic area is carried out in the ELSA (Eifel Laminated Sediment Archive) project at Johannes Gutenberg University Mainz using various drill cores from Eifel maars (https://elsa-project.de).
The Campanian Ignimbrite (CI) ash is a phonolithic to trachytic tuff from a Late Pleistocene volcanic event, apparently the largest eruption during Marine Isotope Stage 3 (MIS 3) in Europe (Silleni et al. [3] and references therein). It is derived from the Phlegraean Fields in Campania region (Central Italy) (Figure 1). A huge caldera shapes the landscape of the Phlegraean Fields consisting of a subaerial and a submerged part and covering a total area exceeding 200 km2. This characeteristic structure formed during two major caldera collapses related to the eruptions of the Campanian Ignimbrite and the younger Neapolitan Yellow Tuff (e.g. Pabst et al. [4]). Gases from plinian eruptions can be transported many kilometers into the atmosphere, or even into the stratosphere. Fisher and Schmincke [5] described a plinian character of the eruption. Fedele et al. [6] calculate the volume of the magma to be at least 200 km3. Fisher et al. [7] mention that the original pyroclastic flow covered an area of 30,000 km2 and a bulk volume of up to 500 km3. Around 39.85 ± 0.14 ka years ago, the largest eruption of the Campanian Y5-tephra (CI/Y5) finally occurred in the extensive Phlegraean Fields [8]. A related tephra deposit was first dated in marine sediments of the Mediterranean by oxygen isotope stratigraphy that resulted in an interpolated age of about 38,000 yr BP [9]. Ar/Ar dates by De Vivo [10] shifted the age to 39.28 ± 0.11 ka, improved by Giaccio et al. [8] to 39.85 ± 0.14 ka (40Ar/39Ar). Lin et al. [11] attribute the CI/Y5 to a bipolar sulfate spike at 39,915 yr b2k and 39,869 yr b2k, which fits the latest Ar/Ar dates very well. The ice core of North Greenland Ice Core Project (NGRIP) was checked for glass shards at that time interval, but respective particles were not found. Based on a study by Silleni et al. [3] the total erupted bulk volume estimate is 457–660 km3 (181–265 km3 dry rock equivalent (DRE)). This volume corresponds to a eruption magnitude of 7.7 – 7.8 and to a Volcanic Explosivity Index (VEI) of 7, which makes the eruption at ca. 40 ka to the largest in Europe during the entire Quaternary.
The CI/Y5 is a clear temporal marker of Quaternary stratigraphy in different countries [3] in the form of sedimentary records including marine records [12,13] terrestrial sequences [14], cave environments [6,15], and lake records [16]. Beside the impressive and landscape shaping proximal record , the supra-regional dimension of this event was first recognized by the widespread tephra records in the marine realm. In their review paper, Keller et al. [17] defined stratigraphic zones to which the tephras from marine sediments of the central and eastern Mediterranean were assigned. They proposed a scheme (from V to Z), in which the tephra which we now know originated from the Campi Flegrei was named Y5 and related to the eruption center of Ischia Island of the Campanian vulcanological province. Proximal to the eruption center, the event left behind mainly cooled pyroclastic flows (ignimbrites) and is therefore also named as such, Campanian Ignimbrite eruption. However, a more complex record is also found proximally on a scale of at least 100 km around the Campi Flegrei, which begins with a Plinian phase (in turn complex in structure but quantitatively subordinate) and ends with the products of the Campanian ignimbrite eruption, the CI-phase [18,19]. Distally, only tephra deposits are found in the marine as well as in the continental realm, which in turn can also have a complex stratigraphic structure. Even at distances of 1000 km, the sequence begins with tephras of the Plinian phase and then be abruptly overlaid by products (mostly glass ashes) of the CI, the Campanian co-ignimbrite tephra [20]. The total amount of tephras of the CI clearly predominate spatially and thus also quantitatively. It is assumed that the final caldera formation (collapse) as a result of the partial emptying of the magma chamber is responsible for the CI and thus for the proximal pyroclastic flows and the widespread distal glass tephras [3]. Hence, looking from outside Italy on the products of the CI in a distal stratigraphic archive we are always dealing with the CI layer very probably dominated by the Campanian co-ignimbrite tephra. Silleni et al. [3] explain that it is difficult to estimate a deposit volume as accurate data may be lacking, e.g., due to the thinning of ash layers, which is essentially the issue. Distal tephra from the CI-eruption were described so far in Italy, North Africa, over large parts of the eastern European continent as far as Kostenki at the Don River in Russia, in the central and eastern Mediterranean Sea, and the Black Sea (Figure 1A; for review see i.e. [3,14,21,22,23,24,25,26]). The CI is widespread in southern Romania and northern Bulgaria often found in loess-paleosoil sequences (LPS), fluvial and cave deposits and was identified by the characterist geochemical fingerprint of the well-preserved glass shards (e.g. Tsanova et al. [27]). It can reach thicknesses from several decimeters up to more than 1 meter [24]. However, an unequivocal airfall is known from a LPS located in a quarry (Figure 2) about one kilometer southwest of the village of Urluia (Romania). The sample used in this study was taken from the base layer of the airfall strata. The age of the tephra layer was determined by optically stimulated luminescence (OSL) dating of the surrounding loess. Samples just below the tephra, revealed ages ranging from 38.7 ± 3.3 ka to 41.1 ± 3.4 ka [24].
Geochemical and mineralogical composition of the proximal Campanian Ignimbrite eruption products were analyzed in several studies (Fedele et al. [18] and references therein; [28]). In decreasing order of abundance minerals of alkali feldspar, plagioclase, clinopyroxene, biotite, magnetite and apatite are typical phenocrysts of the dominantly glassy matrix. Next to the ubiquitous glass, a greenish clinopyroxene (cpx) is characteristic for these deposits. Further analyses can be found by Tomlinson et al. [29] and also by Civetta et al. [21]. Veres et al. [14], for example, examined glass shards in different locations in Romania (Caciulatesti, Draganesti-Olt, Daneasa and Lunca). The chemical composition can be compared with the values from Italy. SiO2 also dominates here with 58 – 62wt%, followed by around 7 – 10wt% K2O and 3.5 – 7wt% Na2O. Traces of CaO and FeO are also present here.
Figure 1.
(A) Schematic view on the distribution of the CI tephra in Europe (open orange line to the north-east, see also [30,31,32,33,34]); Campi Flegrei as eruption site (orange dot); Eifel Lake sediment cores (red star); created with QGIS, base map WorldTerrain by USGS, Esri, TANA, DeLorme, and NPS. (B) Eifel (orange-colored marking) and analyzed locations of cores AU3 & AU4 in Auel maar and cores DE3 & DE4 in Dehner maar (C) as well as core JW3 in Jungferweiher (D).
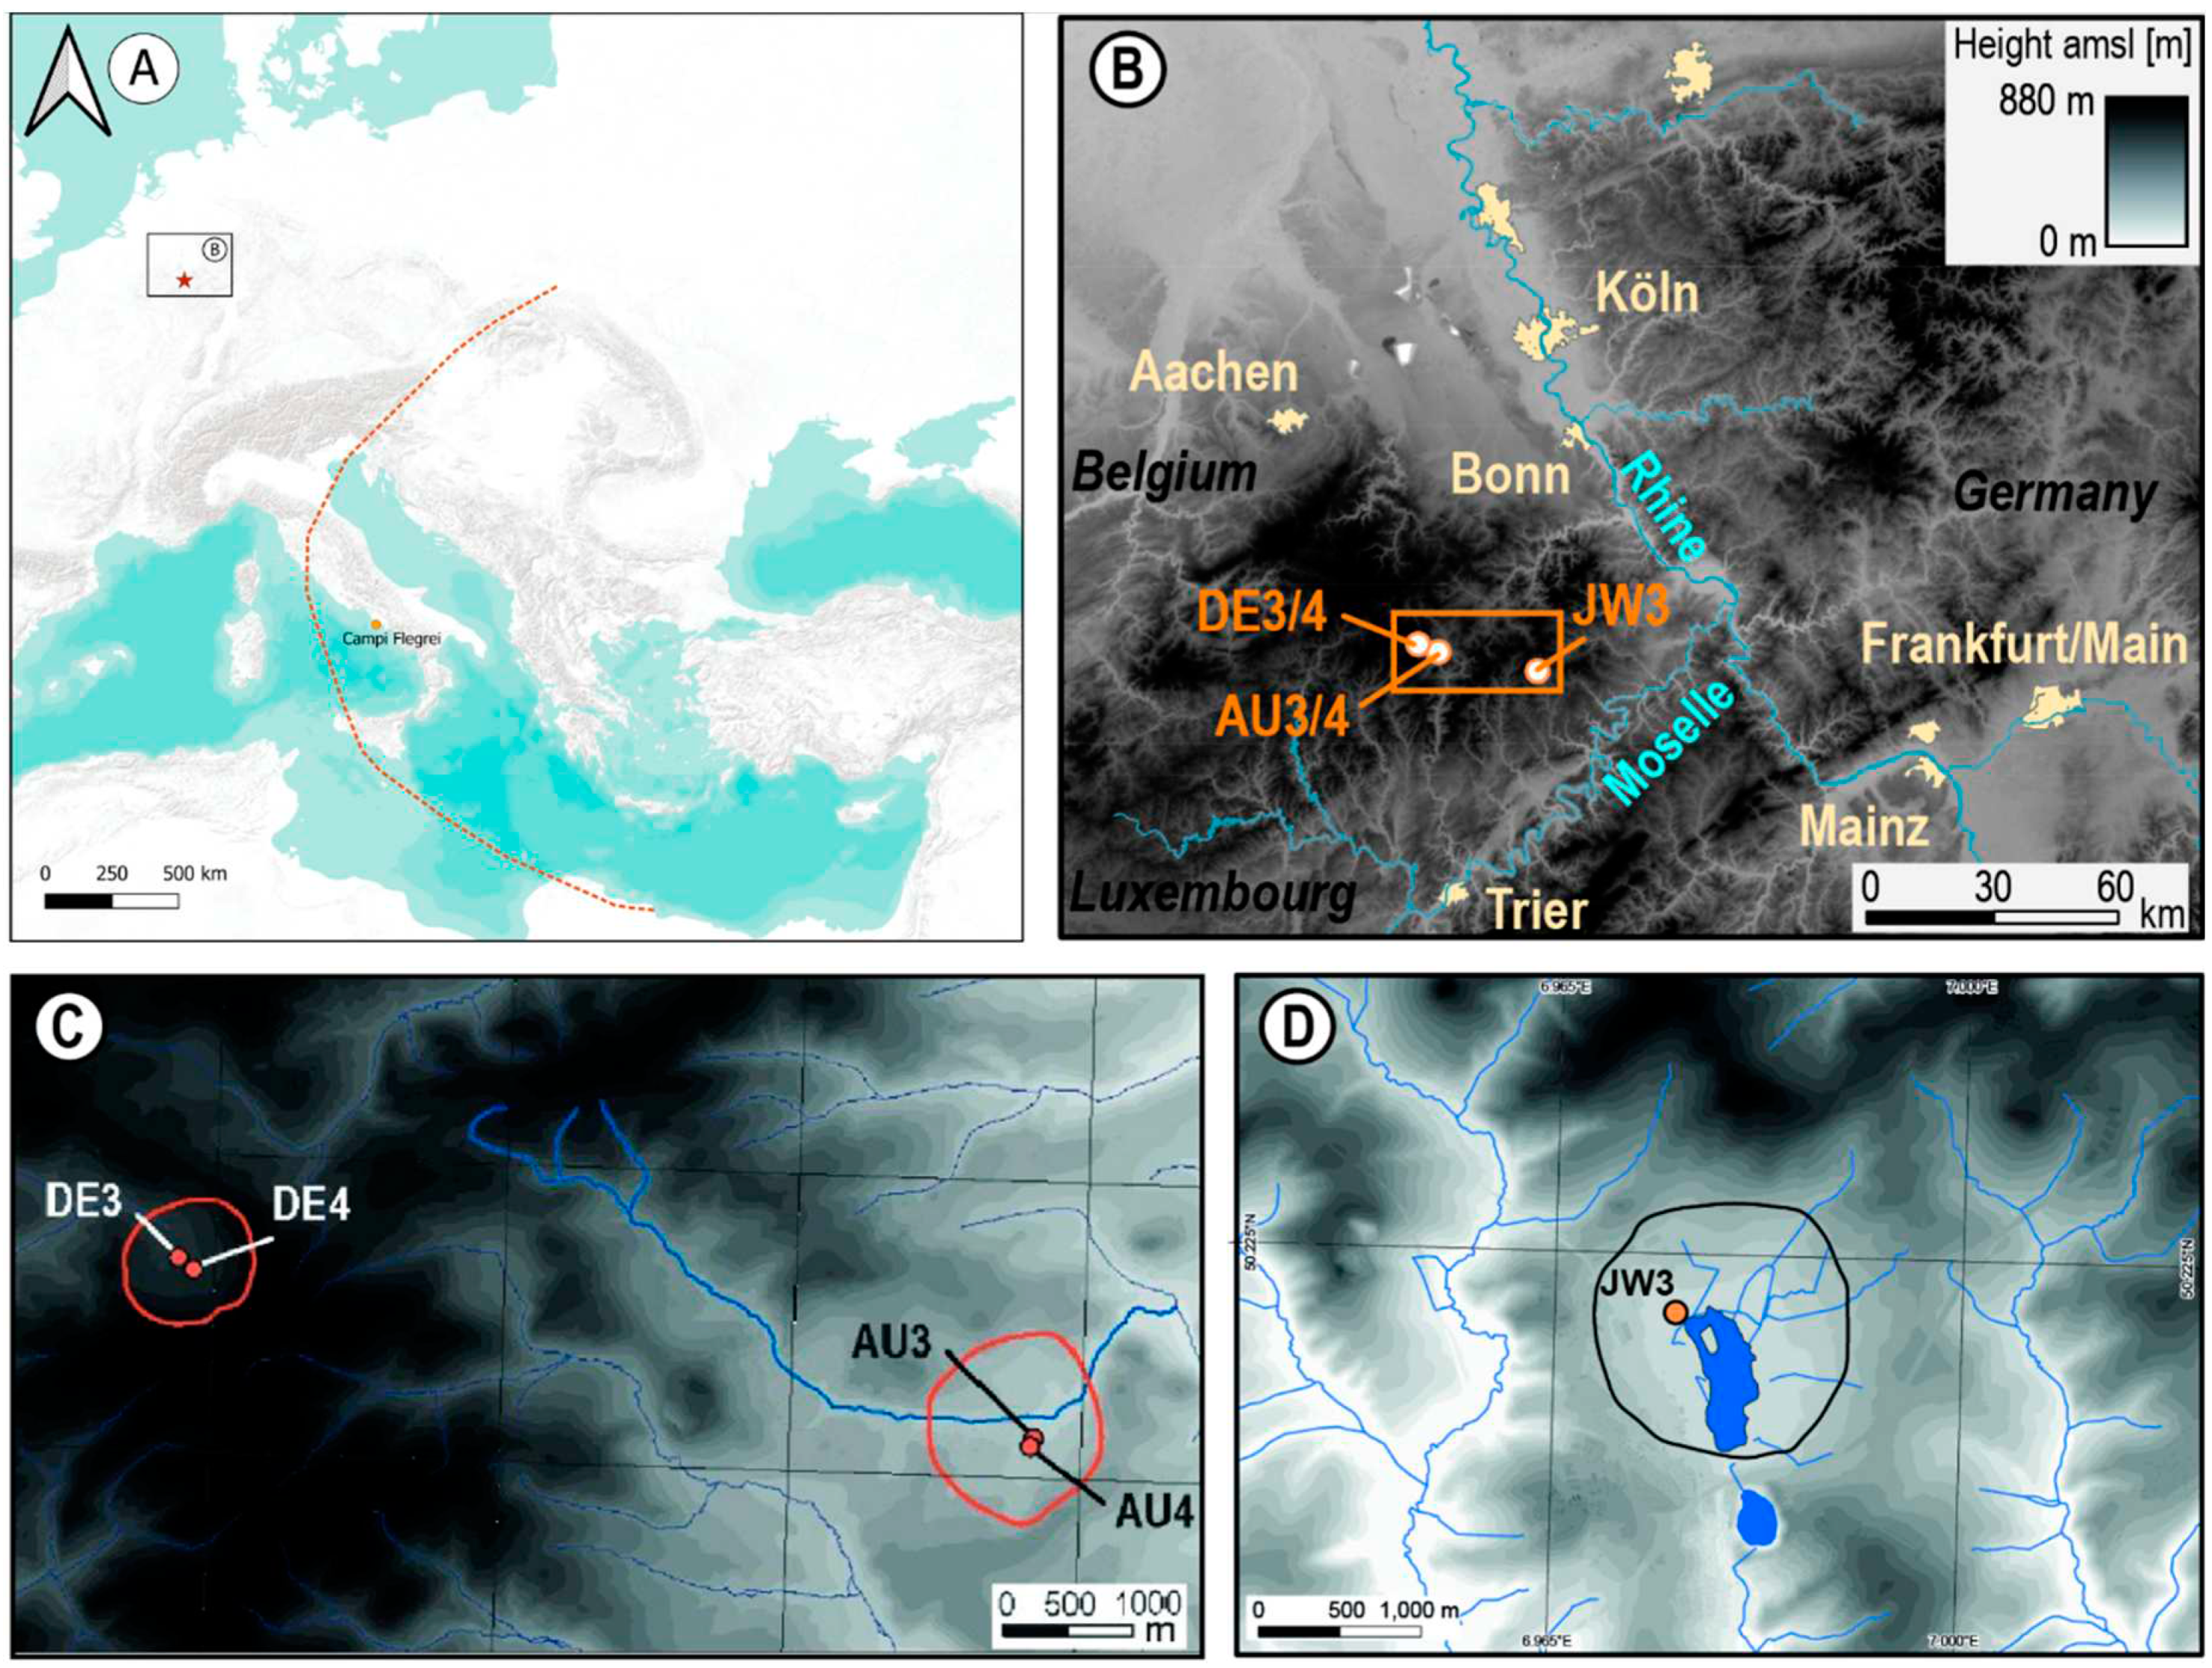
Figure 2.
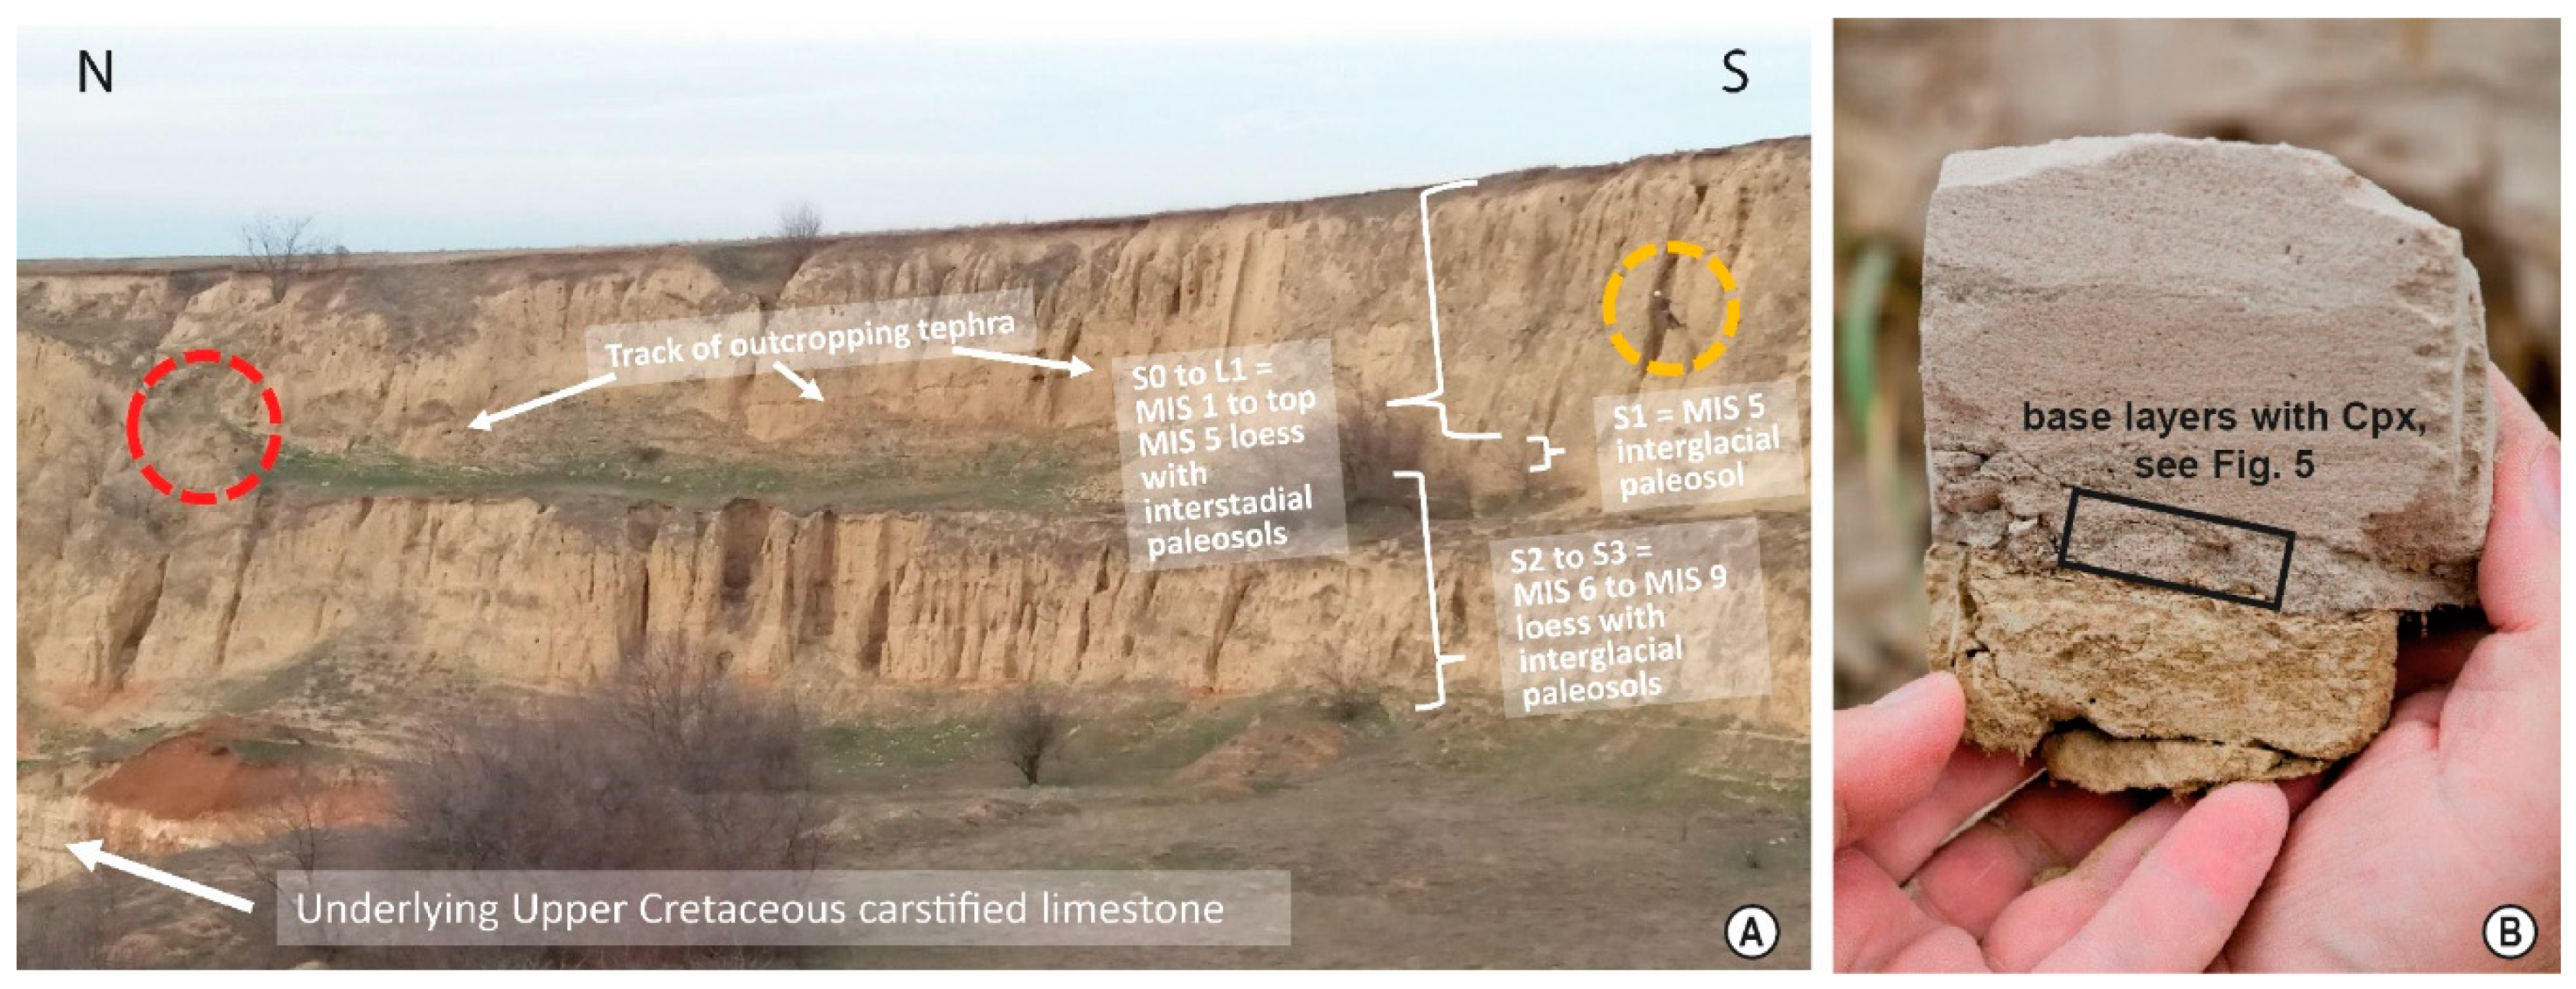
View of the Urluia loess deposit looking east (A). The CI airfall layer is an up to more than one-meter-thick section in the massive loess deposits, which represent the last glacial cycle (compare to Figure 3 in Fitzsimmons et al. [24]; [35]). On the right edge of the image, the stages (MIS 1-9) are also marked. The red circle shows the point at which the sample was taken from the base of the tephra layer, which is up to a thickness of one meter. Laterally, the tephra thins out towards the south and usually only appears as cryptotephra mixed with loess. Part B displays a sample from the base layer of the tephra in direct contact to the underlying loess – similar to that used in this study (beige sediment hold by a left hand = loess and greyish material with sandy appearance = tephra; black frame indicates the analyzed basal layer). For Pleistocene loess stratigraphy we refer to Marković et al. [36].
Figure 2.
View of the Urluia loess deposit looking east (A). The CI airfall layer is an up to more than one-meter-thick section in the massive loess deposits, which represent the last glacial cycle (compare to Figure 3 in Fitzsimmons et al. [24]; [35]). On the right edge of the image, the stages (MIS 1-9) are also marked. The red circle shows the point at which the sample was taken from the base of the tephra layer, which is up to a thickness of one meter. Laterally, the tephra thins out towards the south and usually only appears as cryptotephra mixed with loess. Part B displays a sample from the base layer of the tephra in direct contact to the underlying loess – similar to that used in this study (beige sediment hold by a left hand = loess and greyish material with sandy appearance = tephra; black frame indicates the analyzed basal layer). For Pleistocene loess stratigraphy we refer to Marković et al. [36].
Up to this study, a potential CI fallout was not observed in central Europe. Either the CI plume did not reach that far north or west respectively, or it was not observed due to the lack of high sedimentation rate geoarchives of MIS 3 in central Europe. MIS 3 lakes in Northern Europe were overrun by the glaciers of the Last Glacial Maximum (LGM), and lakes in the Alpine foreland by respective mountain glaciers and their meltwater runoff. However, the so called Neapolitan Yellow Tuff (NYT) a late glacial tephra layer stemming from the same eruption centre and dated to 14.9 ka was recognized in lake Längsee in the south-eastern Alps (Austria) [37,38]. This finding indicates that there are atmospheric circulation patterns through which volcanic ash such as NYT can be transported directly northwards from the Campi Flegrei to Central Europe. The only MIS 3 lakes in northern central Europe with fine-grained sediments associated with the CI appear to be the maar lakes of the Eifel (Germany), where MIS 3 sediments were recovered by Sirocko et al. [2,39,40,41] in at least seven sites (c.f. Albert and Sirocko [42]).
2. Materials and Methods
2.1. Samples
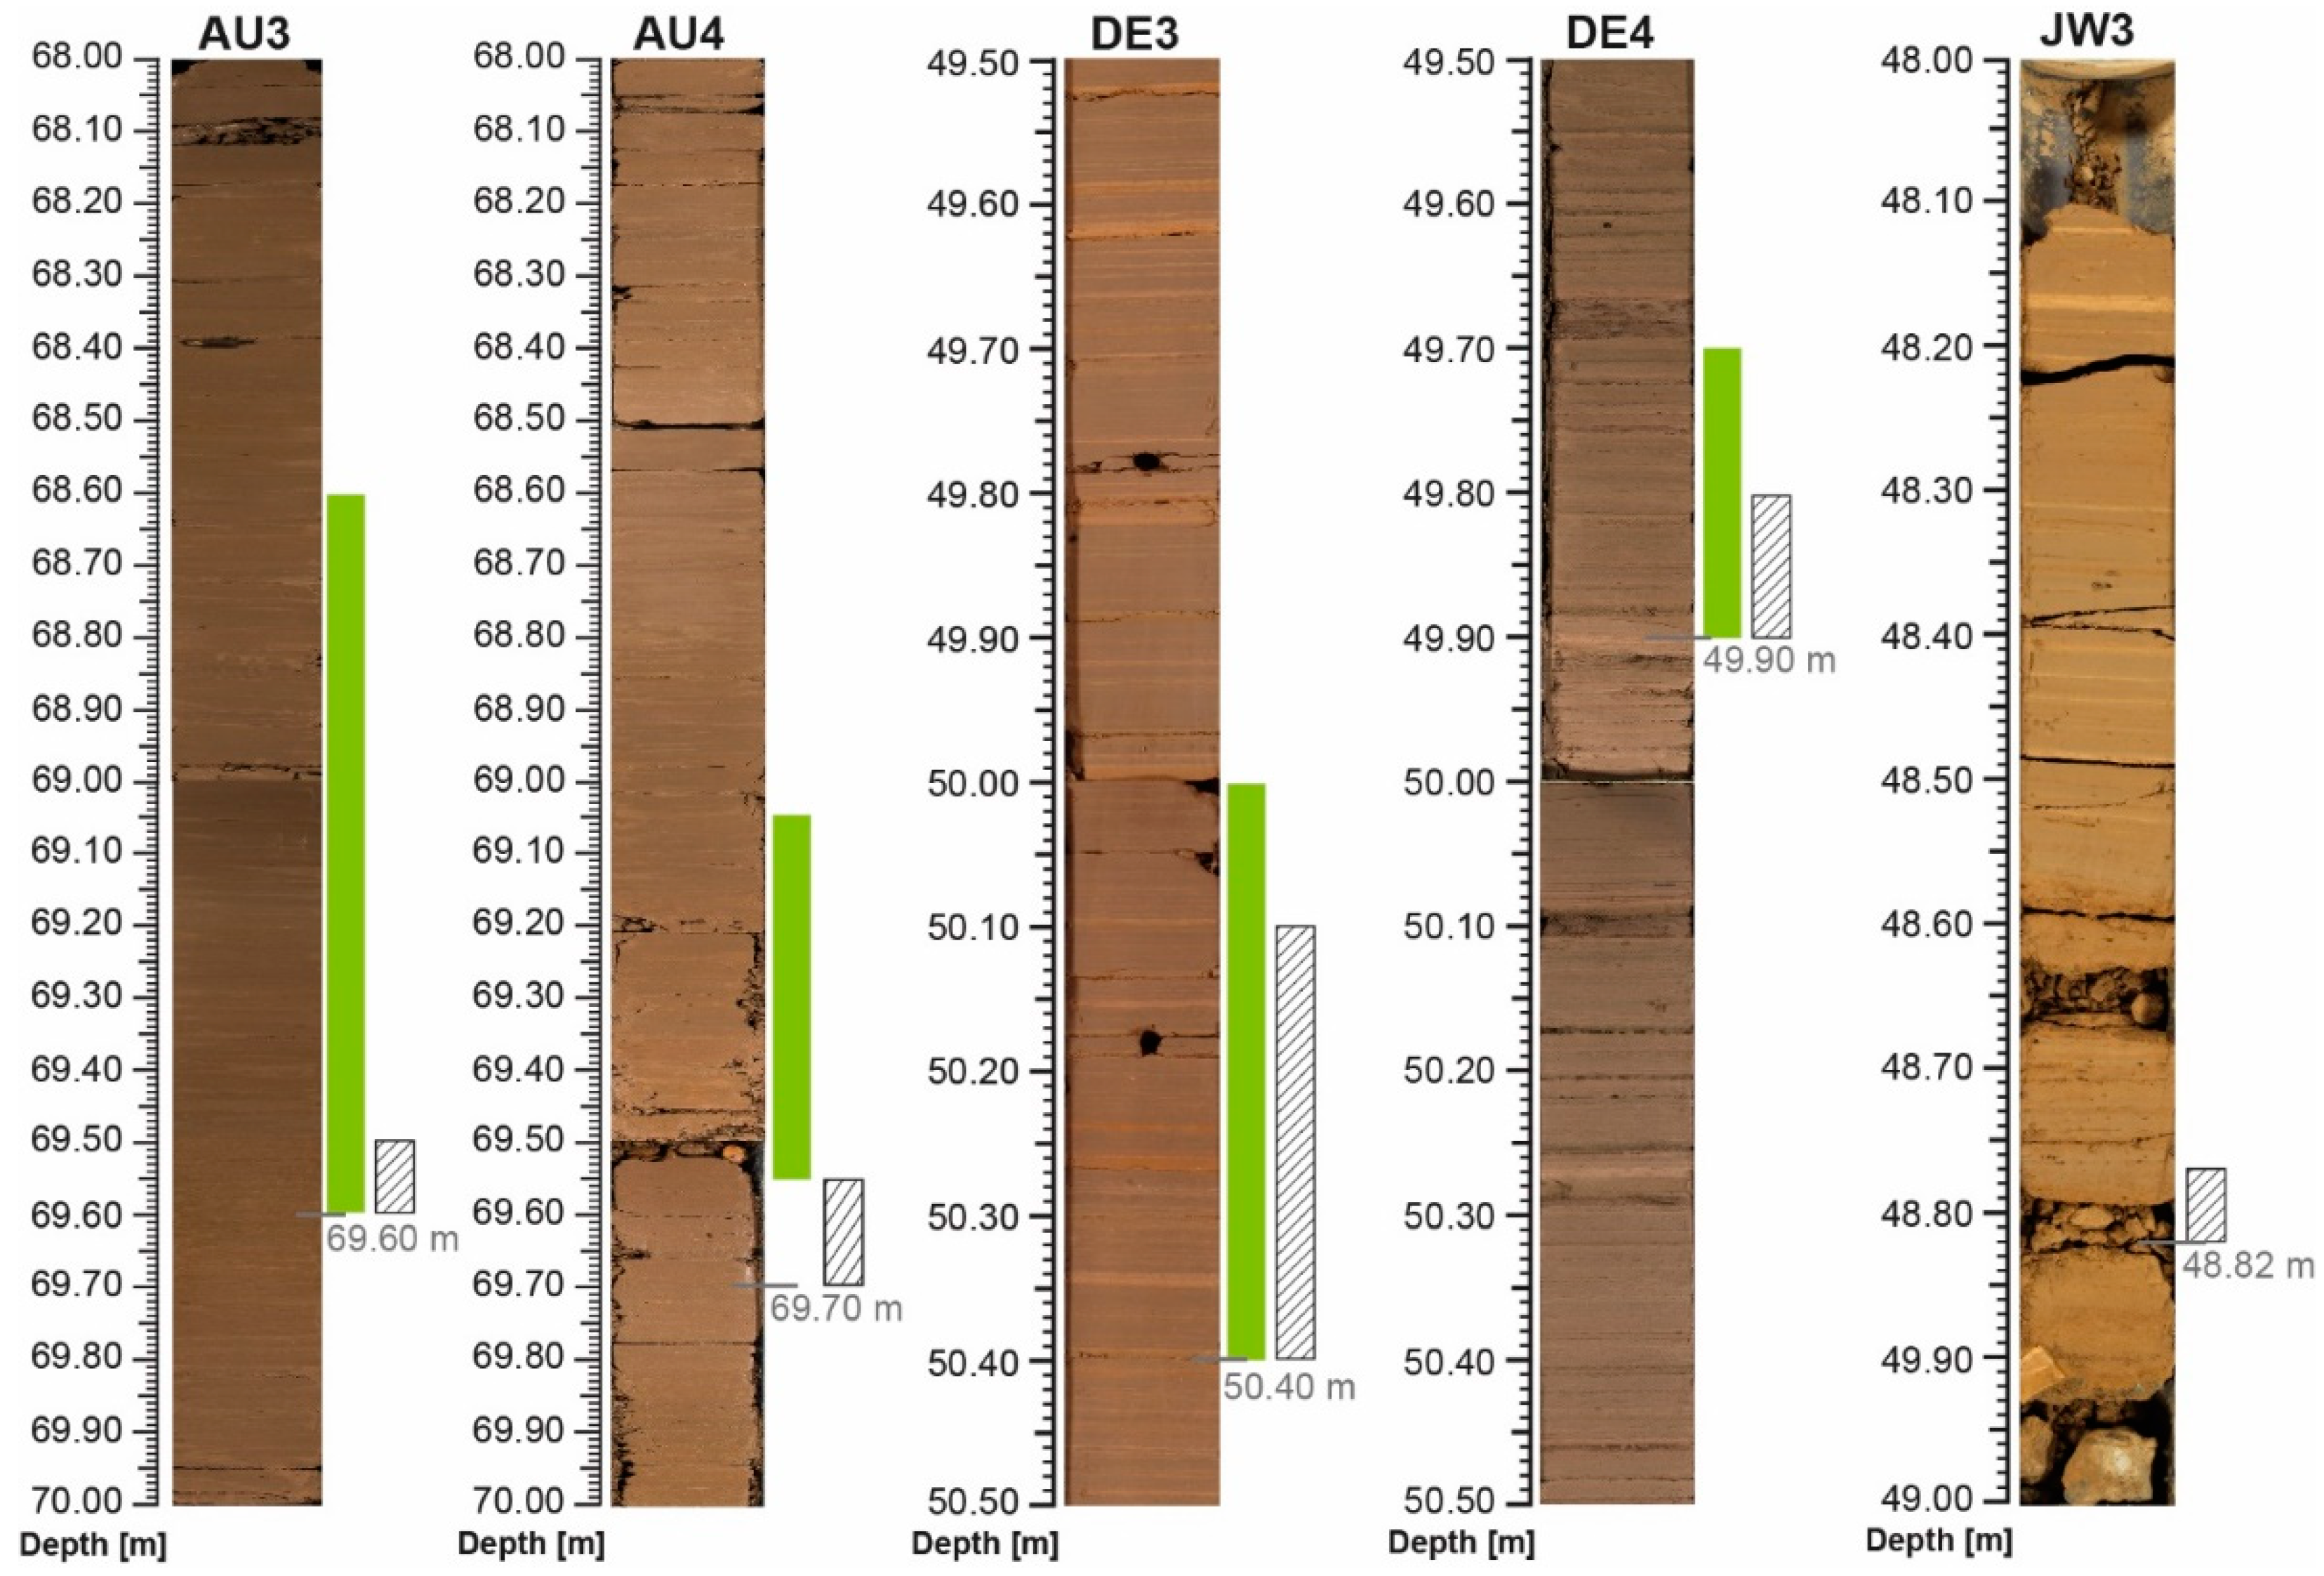
The samples investigated in this study were taken from drill cores of infilled maar lakes from the Eifel region (Germany) and from a loess sequence on the Dobrogea Plateau in SE Romania close to the Black Sea. The Romanian site was chosen for comparison beacause, like the cryptotephra found in the Eifel, it represents a distal occurrence of the CI; however, there it is a thick and un-reworked tephra deposit. The drill cores AU3 and AU4 are from the infilled maar lake at Auel (Eifel, Germany) as well as drill cores DE3 and DE4 from the Dehner infilled maar (Figure 1C) and JW3 of Jungferweiher (Figure 1D). Photos of the respective core section are documented in Figure 3. The same cores were used to construct the ELSA-20 chronology [41] which is the base for the age as described later in this paper. The AU3 core has a length of 102 m and coordinates of 50.2825 °N and 6.5951 °E (456 m above sea level) while AU4 has a length of 104.50 m and coordinates of 50.2821 °N and 6.5949 °E (457 m above sea level). The Eifel area at the Dehner maar, whose drill cores provide a comparison, is 100 m higher. DE3 core (50.2928 °N and 6.5066 °E) has a length of 88 m and is located at 565.37 m above sea level. The 75 m thick DE4 core (50.2923 °N and 6.5073 °E) has a similar location at 566 m above sea level. A blue-green stripe in the thin section DE4 49.70 – 49.80 m as a good feature for the analysis (Figure 12). A comparison also shows the depth of 48.00 – 49.00 m of core JW3 (length of 78 m) in the Jungferweiher (50.2210 °N, 6.9771 °E) at 435 m above sea level, in which twisted minerals were found at around 48.80 m (Figure 3). The analysis of this core and its stratigraphy is discussed in Sirocko et al. [1]. The only visible indicating for a CI-tephra in the cores is a green-blueish sediment hue at 49.78 m in core DE4. However, the cryptotephra is not visible to the naked eye in the DE3, and AU3 as well as AU4.
Figure 3.
Photographs of lake sediment cores from Auel maar, Dehner maar and Jungferweiher (green markings define presence of cpx, dashed markings show the twisted minerals). The age in these selected parts is determined to be about 40,000 to 39,000 yr b2k (Sirocko et al., unpublished).
Figure 3.
Photographs of lake sediment cores from Auel maar, Dehner maar and Jungferweiher (green markings define presence of cpx, dashed markings show the twisted minerals). The age in these selected parts is determined to be about 40,000 to 39,000 yr b2k (Sirocko et al., unpublished).
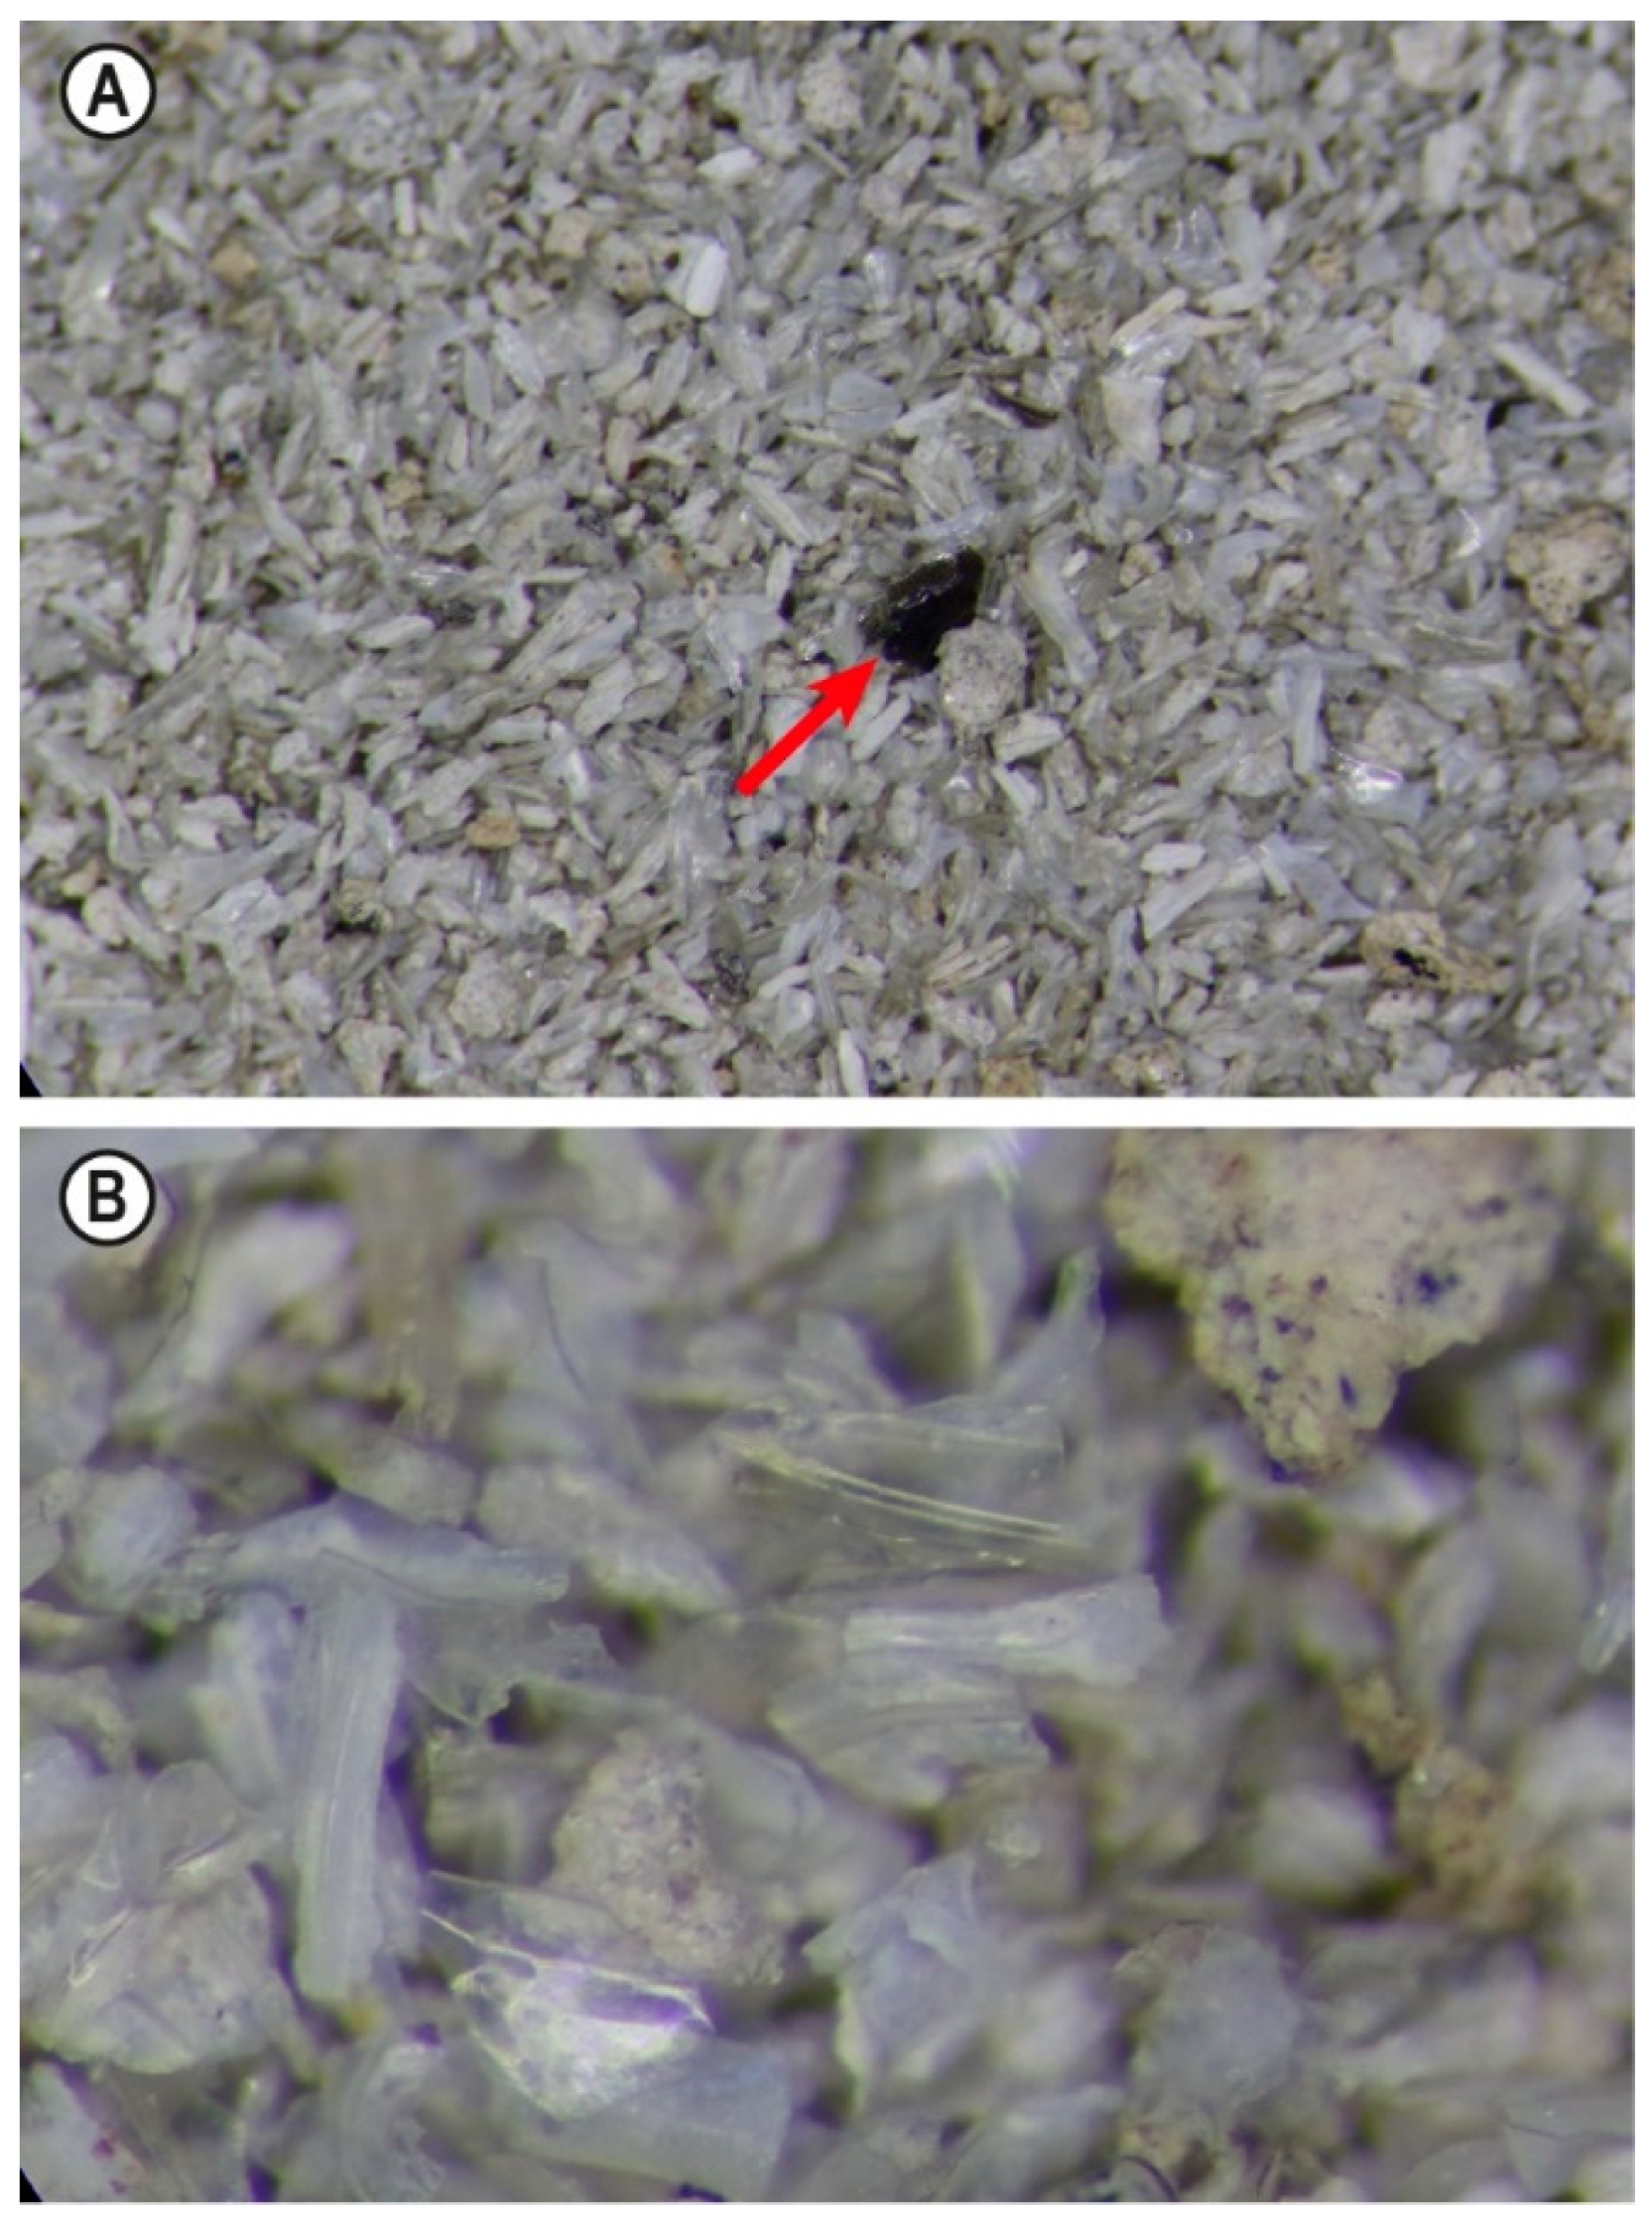
The sample at Urluia (south-eastern Romania) was taken from an extensive LPS on the Dobrogea Plateau separating the Lower Danube steppe landscape from the Black Sea. The CI layer is found in the upper part of a loess package stratigraphical ranging from Middle Pleistocene (≥MIS 11) to Holocene (44.0947 °N, 27.9021 °E) [43,44] and situated at about 110 m above sea level [45]. Figure 4 shows a scatter sample of the tephra from Urluia. In addition to the glasses, pumice aggregates are also visible.
Figure 4.
Incident light images of a scatter sample of the tephra from Urluia; only particles larger than 125 µm are shown. In Part A, the red arrow points to a dark green cpx imbedded in glass shards and pumice fragments. The photo of Part B was taken with 60x magnification showing glass shards and pumice; the latter is rich in Fe-Ti-oxides (black inclusions) (Photos by Philipp Schulte, RWTH Aachen University).
2.2. Optical analysis
Mineral grains in the dried fraction >150 µm were analyzed under a binocular (M3Z binocular from WILD, Heerbrugg, Switzerland) with a zoom range of 6.5x – 40x. The samples of AU3, AU4 and DE3 were analyzed in 10 cm increments. The same counting was done in 1 cm increments for core DE4, where a recrystallized blueish layer is well visible at 49.78 m, mineral grains are shown in Figure 5.
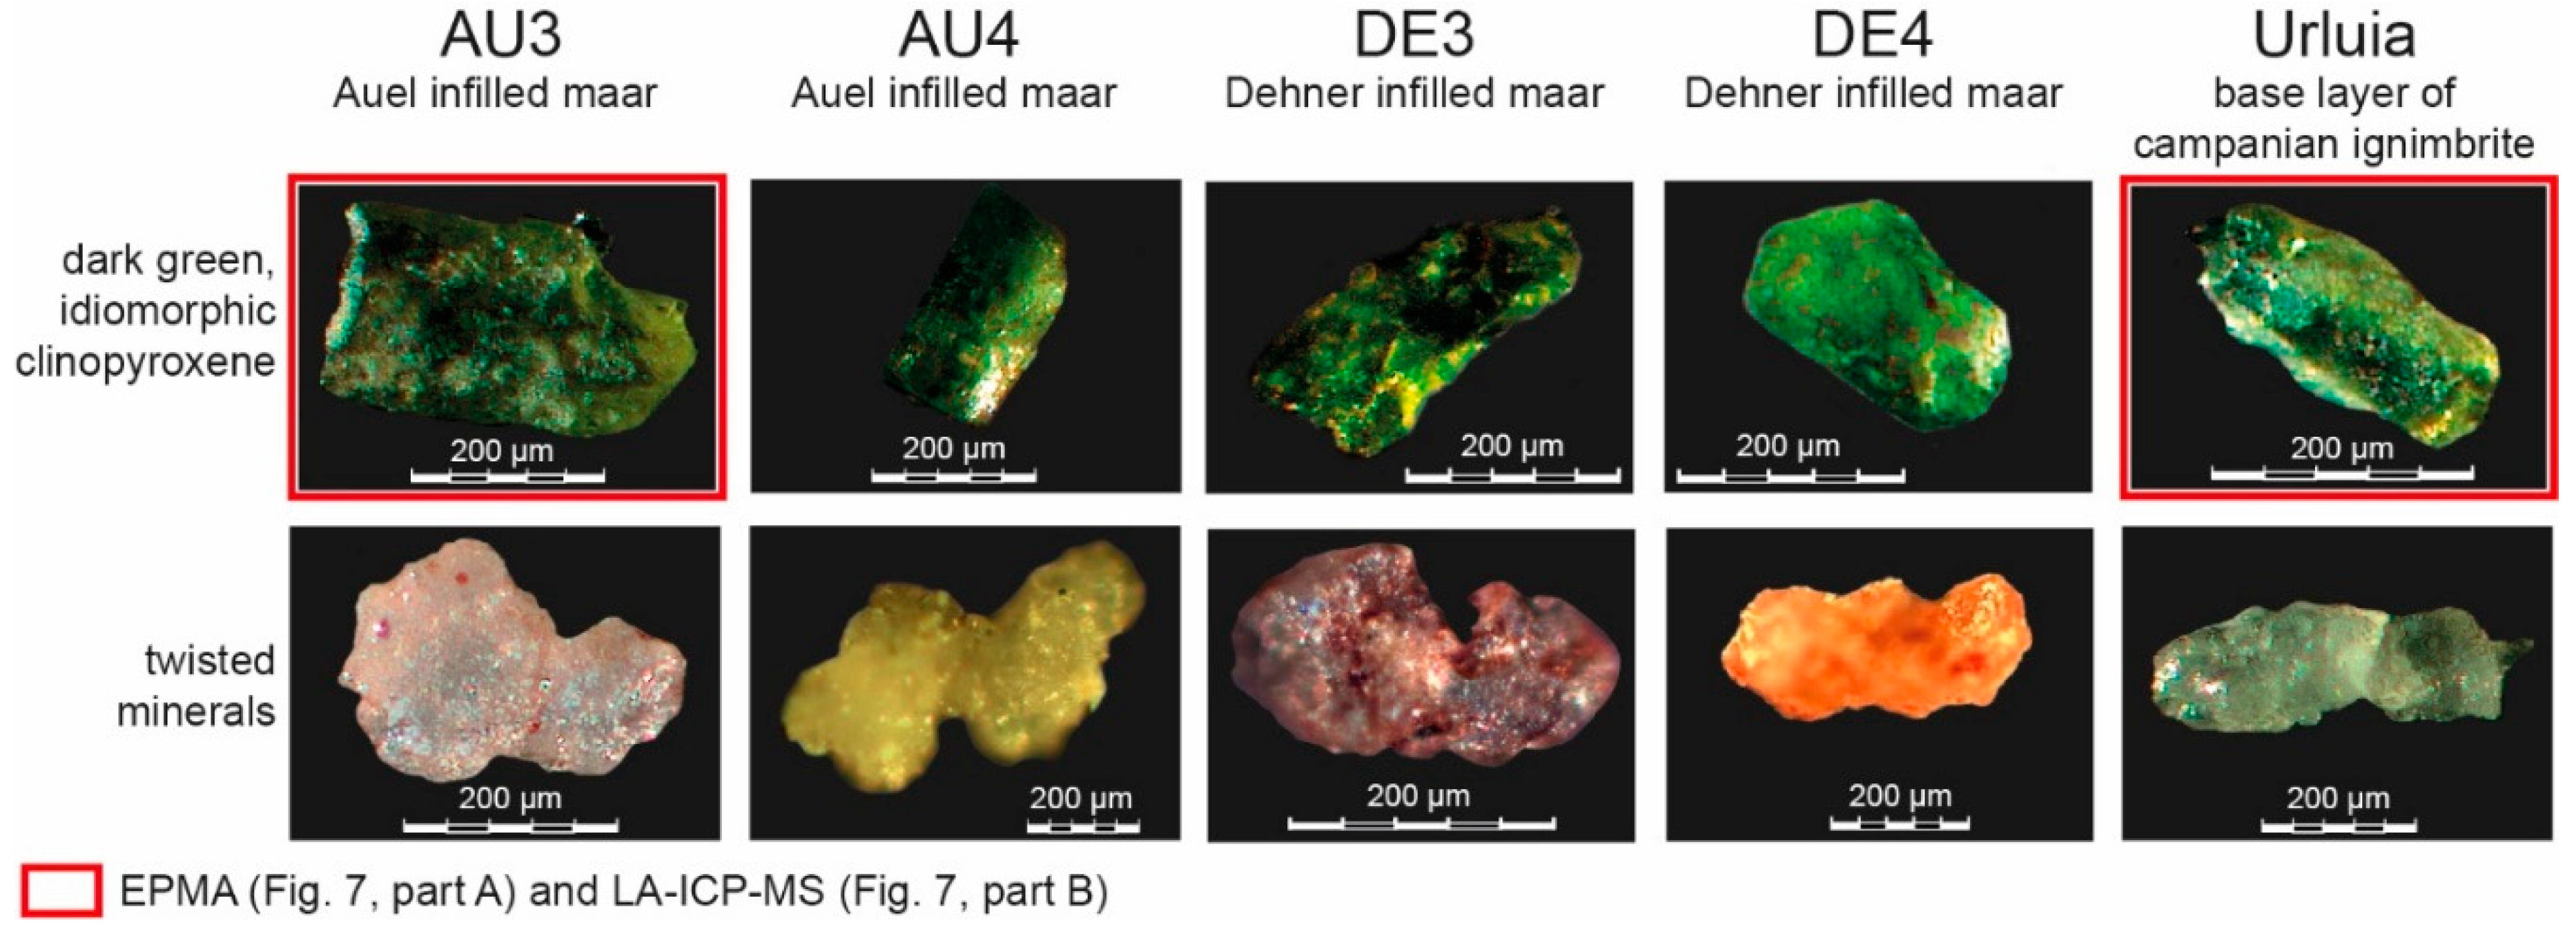
The optical analysis was used to screen the entire sand fraction of the mineral grains, but in particular greenish clinopyroxenes (cpx) and twisted minerals were counted. Greenish cpx can occasionally appear in Eifel tephra deposits, but the twisted minerals appear to be unique and have not been documented for any of the other tephra in the ELSA cores, see Sirocko et al. [1]. Cpx generally occurs as euhedral to subhedral crystals (up to 1 mm in size) with a homogeneous pale green color, suggesting textural equilibration with the host glass [46]. The twisted minerals were given this particular form by mechanical stress in the plastic state. The twisting processes apparently involved several different minerals but showed the same habit in Auel and Urluia. To further document that these minerals in Urluia and the Eifel lake sediment cores are indeed from the same source, we analyzed the geochemistry of greenish cpx in both the Eifel cores and the Urluia sample (Figure 5).
Figure 5.
Overview of minerals in the Eifel drill cores of Auel maar and Dehner maar (Germany) as well as in the loess deposit Urluia (Romania). The red-marked pictures indicate the cpx samples used for geochemical analysis (Figure 7).
Figure 5.
Overview of minerals in the Eifel drill cores of Auel maar and Dehner maar (Germany) as well as in the loess deposit Urluia (Romania). The red-marked pictures indicate the cpx samples used for geochemical analysis (Figure 7).
2.3. In situ Reflectance Spectroscopy (ISRS, Corg(chlorins))
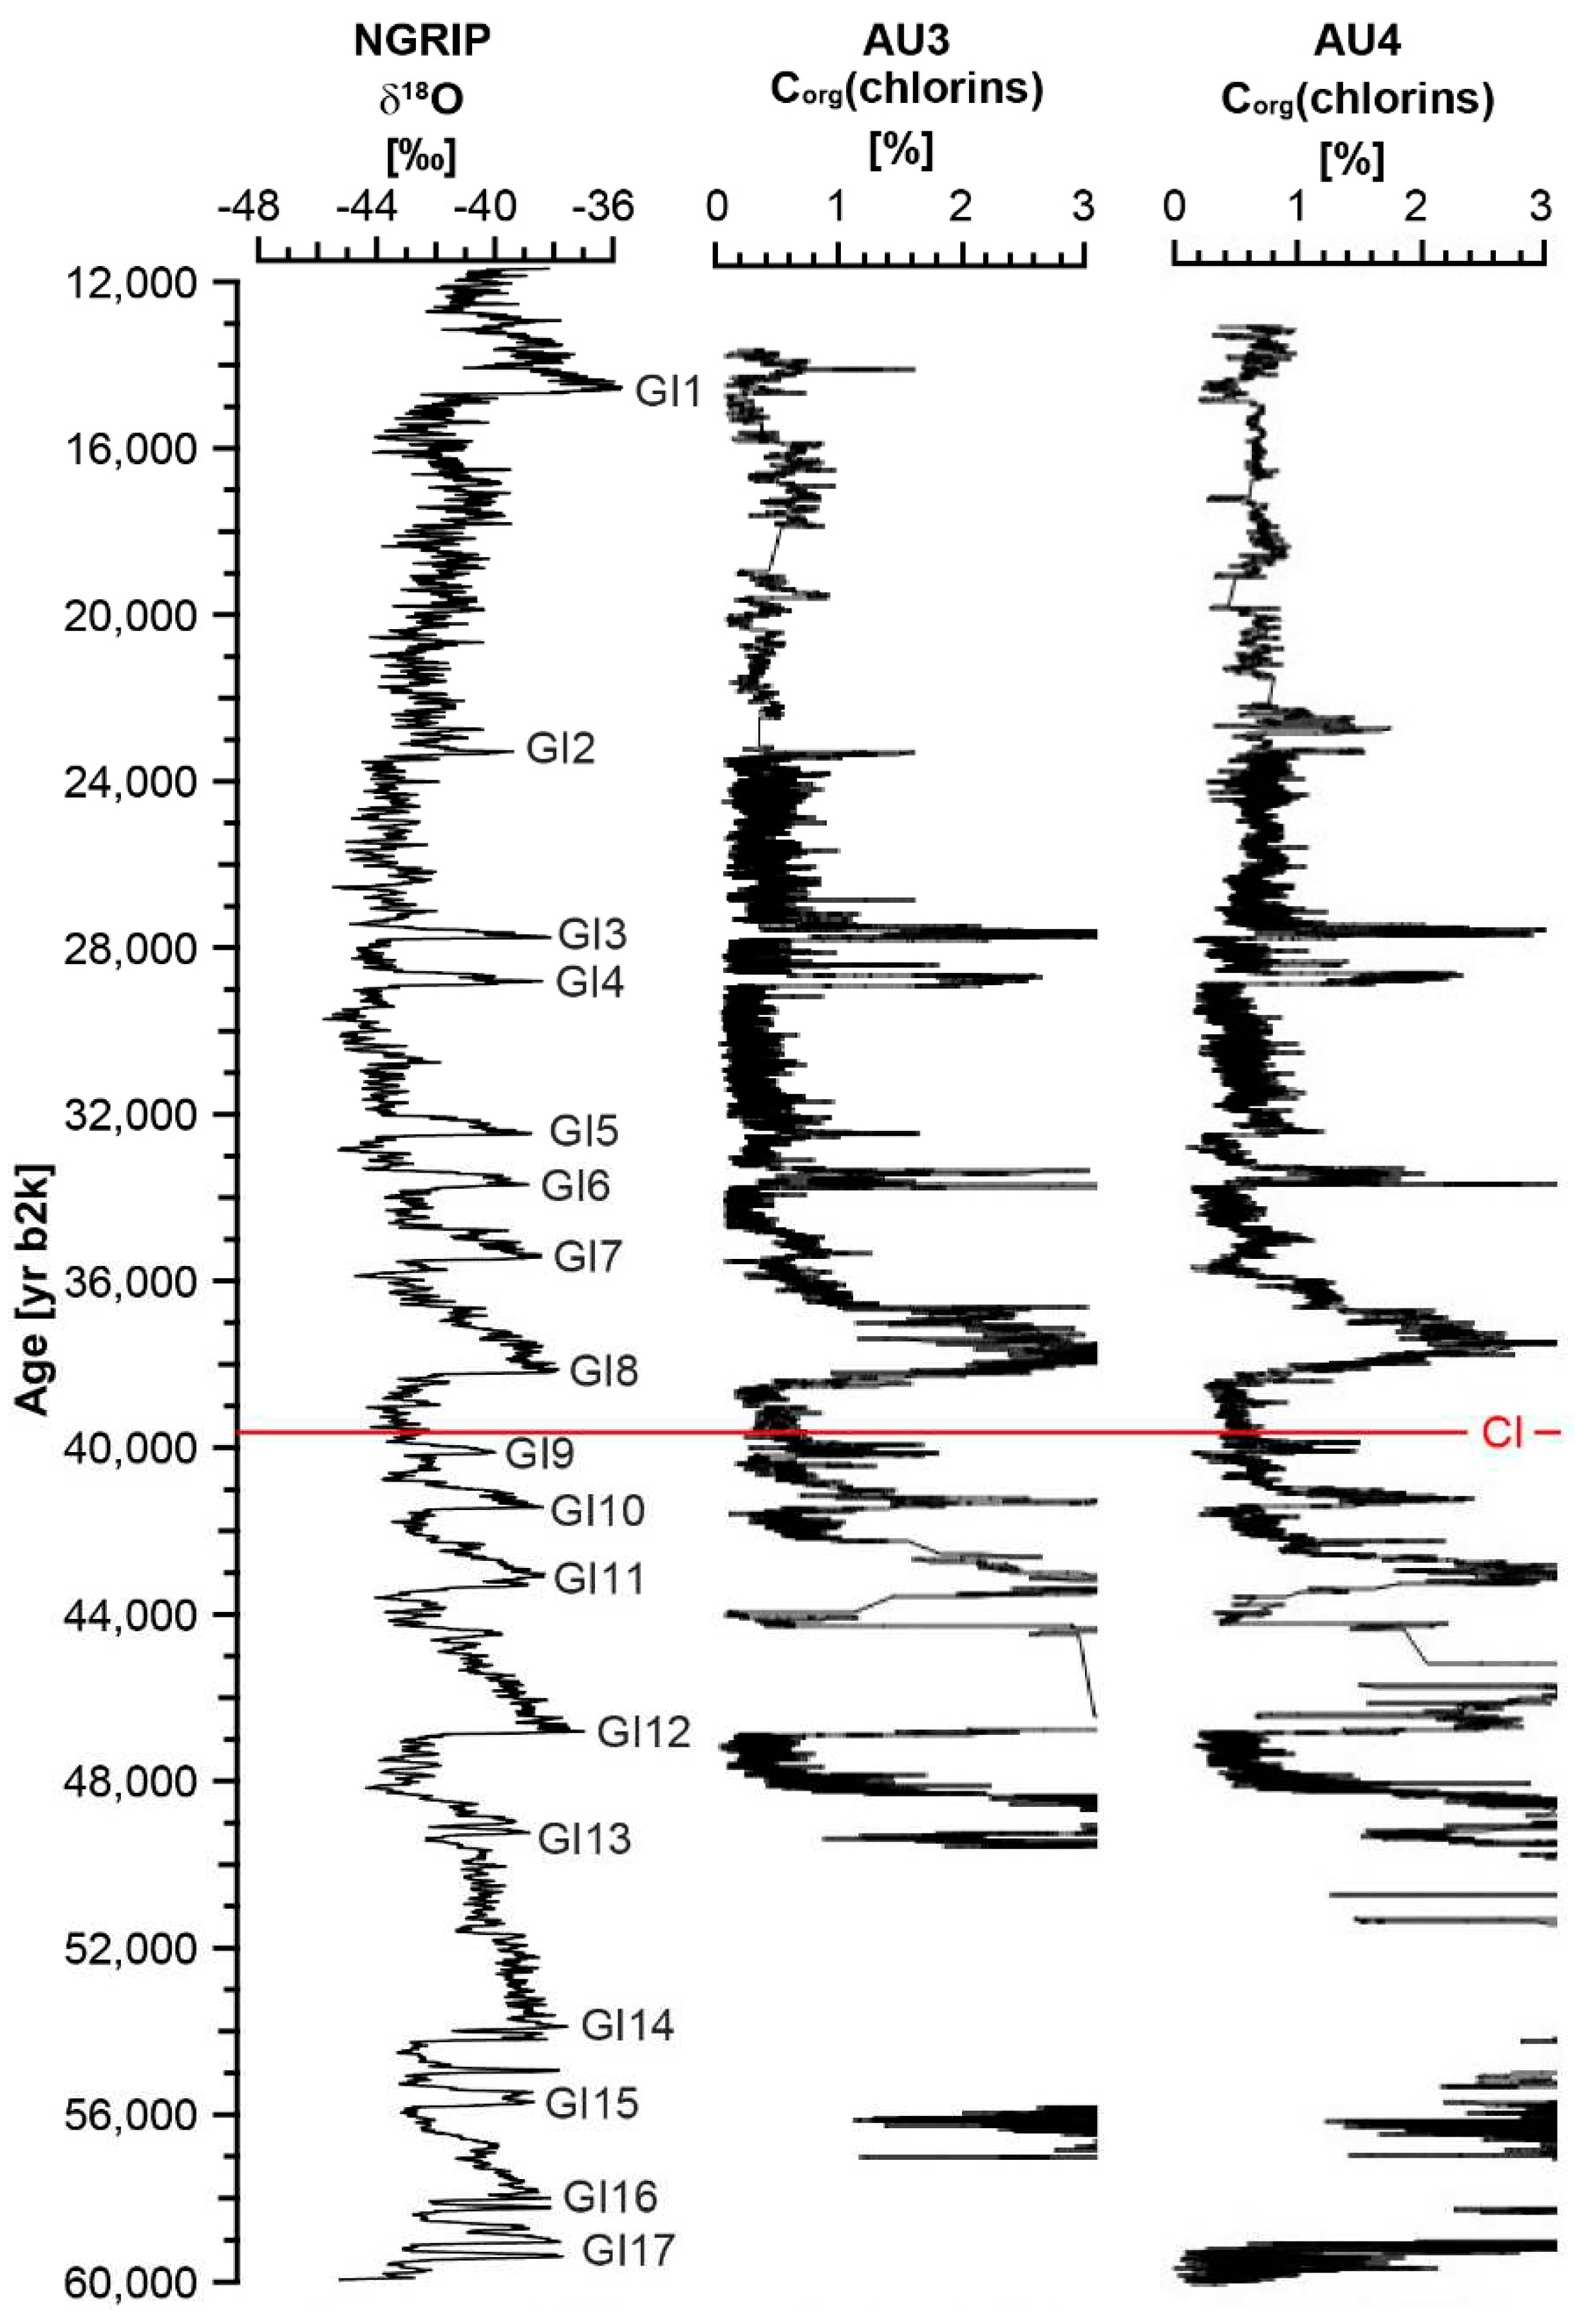
Figure 9 and Figure 11 present Corg(chlorins) values which were analyzed with mm resolution along the cores AU3 and AU4, marked against age [yr b2k], while Figure 10 is plotted against depth [m]. Corg(chlorins) are calculated from the reflectance of the sediment surface in discrete 10 nm steps, which reveals an absorption at 670 nm, caused by the chlorophyll derivates from diatoms and chrysophytes. The method was developed by Rein and Sirocko [47] and recently adapted by Sirocko et al. [41] for the two Auel cores. Details on the method were documented in the above publication. The resultant curves for AU3 and AU4 reveal a pronounced Corg(chlorins) maximum for GI8 at 37,000 yr b2k [41] but also the spike of GI9 (Figure 9). The sediment section between these interstadials, which are known to bracket the CI were evaluated for the occurrence of greenish cpx.
2.4. Geochemistry
The geochemistry studies were carried out both at the Institute for Geosciences of Johannes Gutenberg University (Mainz) and at the Bayerisches Geoinstitut (Bayreuth University Campus).
The analysis in Mainz is divided into electron probe microanalysis (EPMA) and then laser ablation-inductively coupled plasma-mass spectrometry (LA-ICP-MS). For the former, a dark green, idiomorphic cpx from AU3 core and the Urluia sample were selected (Figure 5, red-marked pictures). The preparation of the cpx samples and EPMA analysis were carried out according to the method of Reed [48] using a Leica DMRX point logger (objective: PL Fluotar 5x/0.12P ∞/-/B) which was equipped with an automatic X,Y stage. Overall, 20 EPMA readings were carried out, 14 with AU3 and 5 from Urluia.
Trace element analysis for rare earth elements (REE) was performed using LA-ICP-MS according to Prelević et al. [49]. The analysis of the elements was carried out using an Agilent 7500ce ICP-MS coupled to NewWave NWR 193 (ArF Excimer Laser 193). After EPMA analysis, two uniform green cpx were selected for this analysis, one from the AU3 core (EPMA sample 10) in the Eifel region (Germany) and the other (EPMA sample 14) from the loess deposit in Urluia. These two cpx were placed in an argon plasma, melted and evaporated to almost dryness over a period of four days in closed Savillex beakers with concentrated hydrofluoric acid. The so prepared cpx samples were used for mass spectrometry analysis.
The utilized LA-ICP-MS system consisted of an Elan DRC-e quadrupole mass spectrometer (Perkin Elmer Instruments, Canada) attached to a Geolas M 193nm ArF Excimer Laser system (Coherent Inc., USA). Technical details about this system can be found in Günther et al. [50]. Pyroxene was ablated using a laser beam of 40 µm in diameter. The laser was operated at a frequency of 10 Hz and an output energy of 80 mJ, which results in an energy density of ca. 10 J/cm2 at the sample surface. The sample chamber was flushed with helium gas at a rate of 0.4 l/min, to which Ar was added on the way to the ICP-MS. Instrument background was measured for 30 seconds before each analysis, and the sample was measured for another 30 seconds. The masses Na23, Mg25, Al27, Si29, P31, K39, Ca42, Sc45, Ti49, V51, Mn55, Fe57, Rb85, Y89, Zr90, Nb93, Cs133, Ba137, La139, Ce140 were measured with a dwell time of 10ms, whereas V51, Sm147, Dy163, Er167 , Lu175 and Ta181 were measured with a dwell time of 20 ms. Integrated signal intensities were referenced to NIST SRM 610 glass [51] according to routines described in Longerich et al. [52]. Calculated element ratios were then turned into absolute values by normalizing all major and minor element oxides to 100 wt%.
Furthermore, analyses were processed with the aid of micro X-ray fluorescence (µXRF). The data used were generated with an Avaatech X-ray fluorescence core scanner at the Max Planck Institute for Chemistry in Mainz; the method is described in Richter et al. [53] and also mentioned in Sirocko et al. [41].
2.5. Pollen
3. Results
Both the green clinopyroxenes (cpx) as well as the twisted minerals were observed in the base layer of the CI airfall at Urluia (Figure 4), and also in the Eifel cores in the sediment section subsequent to GI9. The optical analysis of tephra in the cores of the Auel maar revealed green cpx at depths of 68.60 – 69.60 m in AU3, and 69.05 – 69.55 m in AU4. The base of these depths corresponds to an age of about 39,850 ± 150 yr b2k on the ELSA-20 chronology [41]. Twisted minerals were detected in AU3 at 69.50 – 69.60 m, and 69.55 – 69.70 m in AU4). In addition, the green cpx from both Auel cores and Urluia show frequently a glassy rim. The results of the EPMA showed an almost identical composition to the CI glasses known from distal tephra deposits [14,18].
Apparently, the twisted minerals are exclusively associated with the first phase of the eruption. Furthermore, Kendrick et al. [57] pointed out that shear forces occur in the conduit during the eruption process deforming minerals in the crystal mash particularly with the type of magma from which the CI originated. On the one hand, this may lead to fracturing, but also to plastic deformation depending on the physical state of the magma in the eruption conduit (viscous, plastic, brittle). In addition, Arbaret et al. [58] present the results of deformation experiments of melts produced in the laboratory, in which fractured deformation of minerals occurs producing seemingly “twisted” minerals. Further investigations are necessary to clarify the process which leads to the formation of twisted minerals found in our samples.
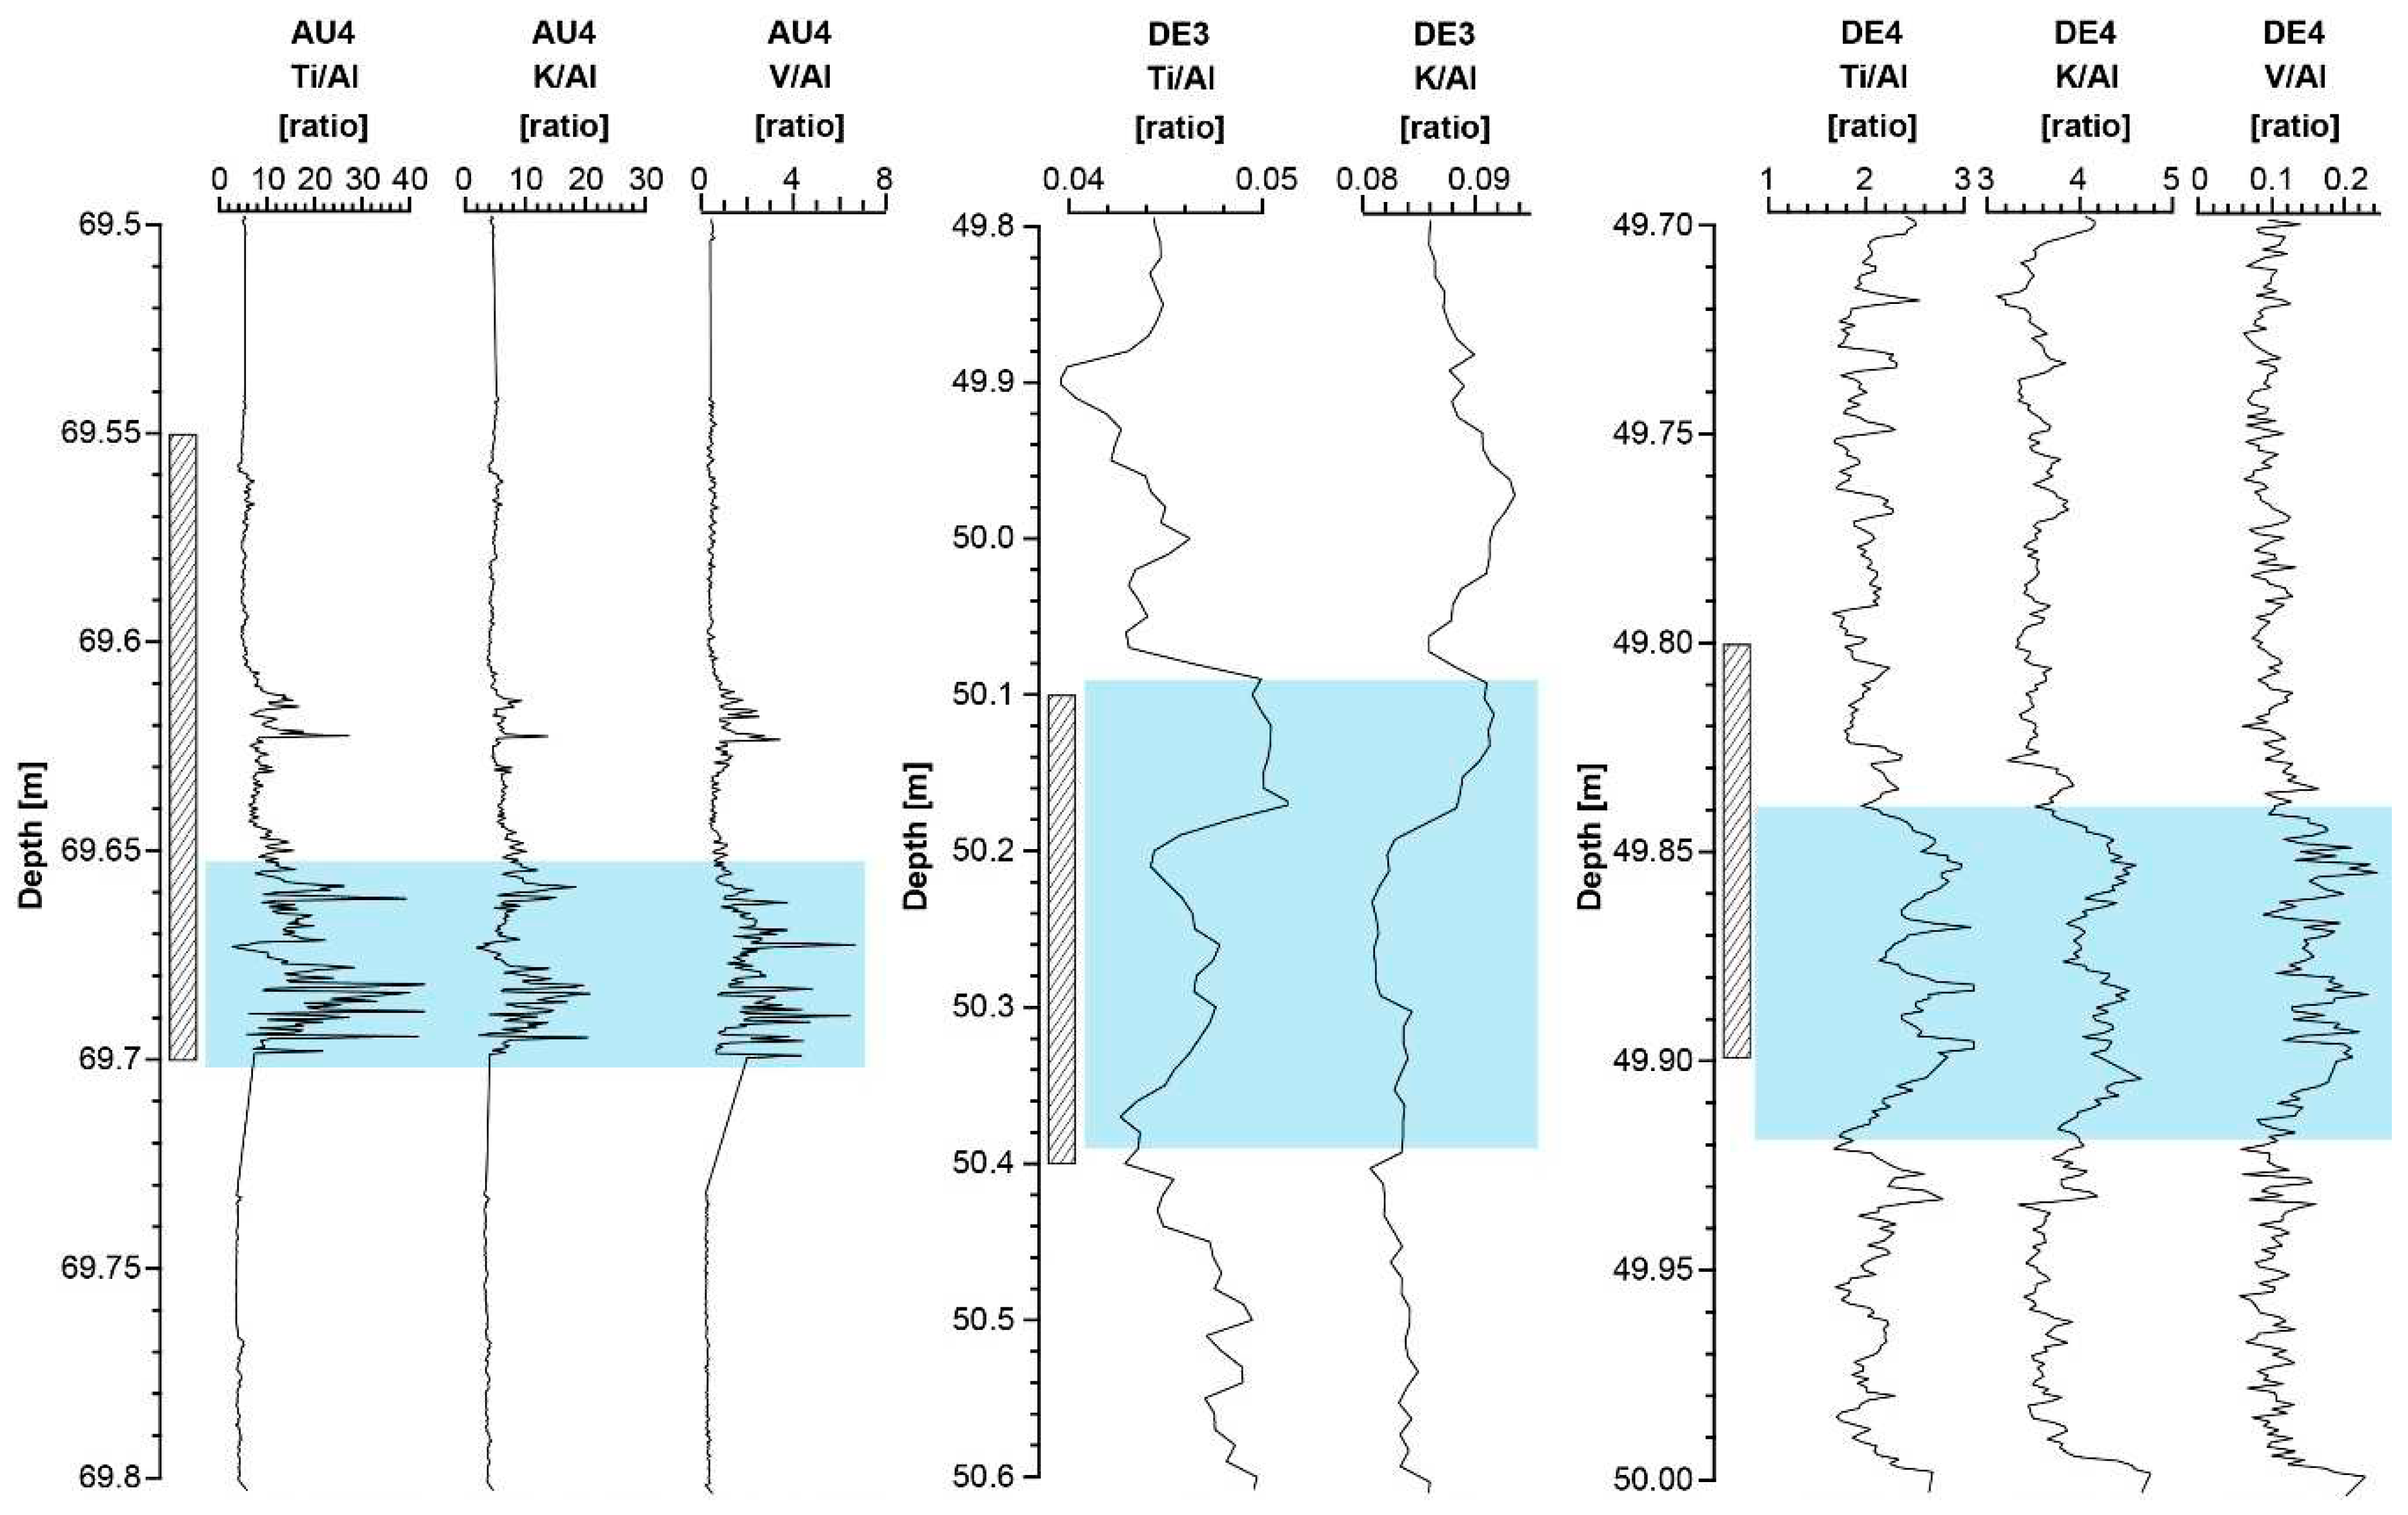
Figure 6 shows the ratios of the chemical elements in the Eifel drill cores AU4, DE3, and DE4. The elements are titanium (Ti), potassium (K) and vanadium (V) contents, which are plotted against aluminium (Al). The stratigraphic record in these Eifel drill cores reveals increased element ratios of Ti/Al, K/Al and V/Al indicative for cryptotephra occurrence (e.g. Tomlinson et al. [29]). No vanadium was found in the DE3 core. The depth range in each of the three cores is chosen so that special features in the chemical ratios can be recognized in comparison to the minerals. In the AU4 core, the depth range is in the 69-70 m range. It is noticeable that in this meter in all three diagrams (Ti/Al, K/Al, V/Al) the increase in values consistently occurs at a similar depth (69.60-69.70 m). The field with the occurrences of the twisted minerals, which in turn are found in the first phase of the eruption, is also located in this area. The same applies to the cores of the Dehner Maar. In the DE3 core, the area of the twisted minerals is even only in the field of the higher values of Ti/Al and K/Al. In the DE4 core, twisted minerals can be found 2 cm after the values of the chemical ratios of Ti/Al, K/Al and V/Al increase. This also harmonizes well. Overall, it is therefore noticeable that with the increase in Ti/Al, K/Al and V/Al, the presence of twisted minerals in particular was also recognized.
Figure 6.
Element ratios in the Eifel drill cores AU4, DE3, and DE4 indicative for cryptotephra occurrence. (blue area = increase and field of the higher values of the chemical ratios; dashed strip = twisted minerals). The values of the AU4 core are from Sirocko et al. [41].
Figure 6.
Element ratios in the Eifel drill cores AU4, DE3, and DE4 indicative for cryptotephra occurrence. (blue area = increase and field of the higher values of the chemical ratios; dashed strip = twisted minerals). The values of the AU4 core are from Sirocko et al. [41].
3.1. Geochemical analysis
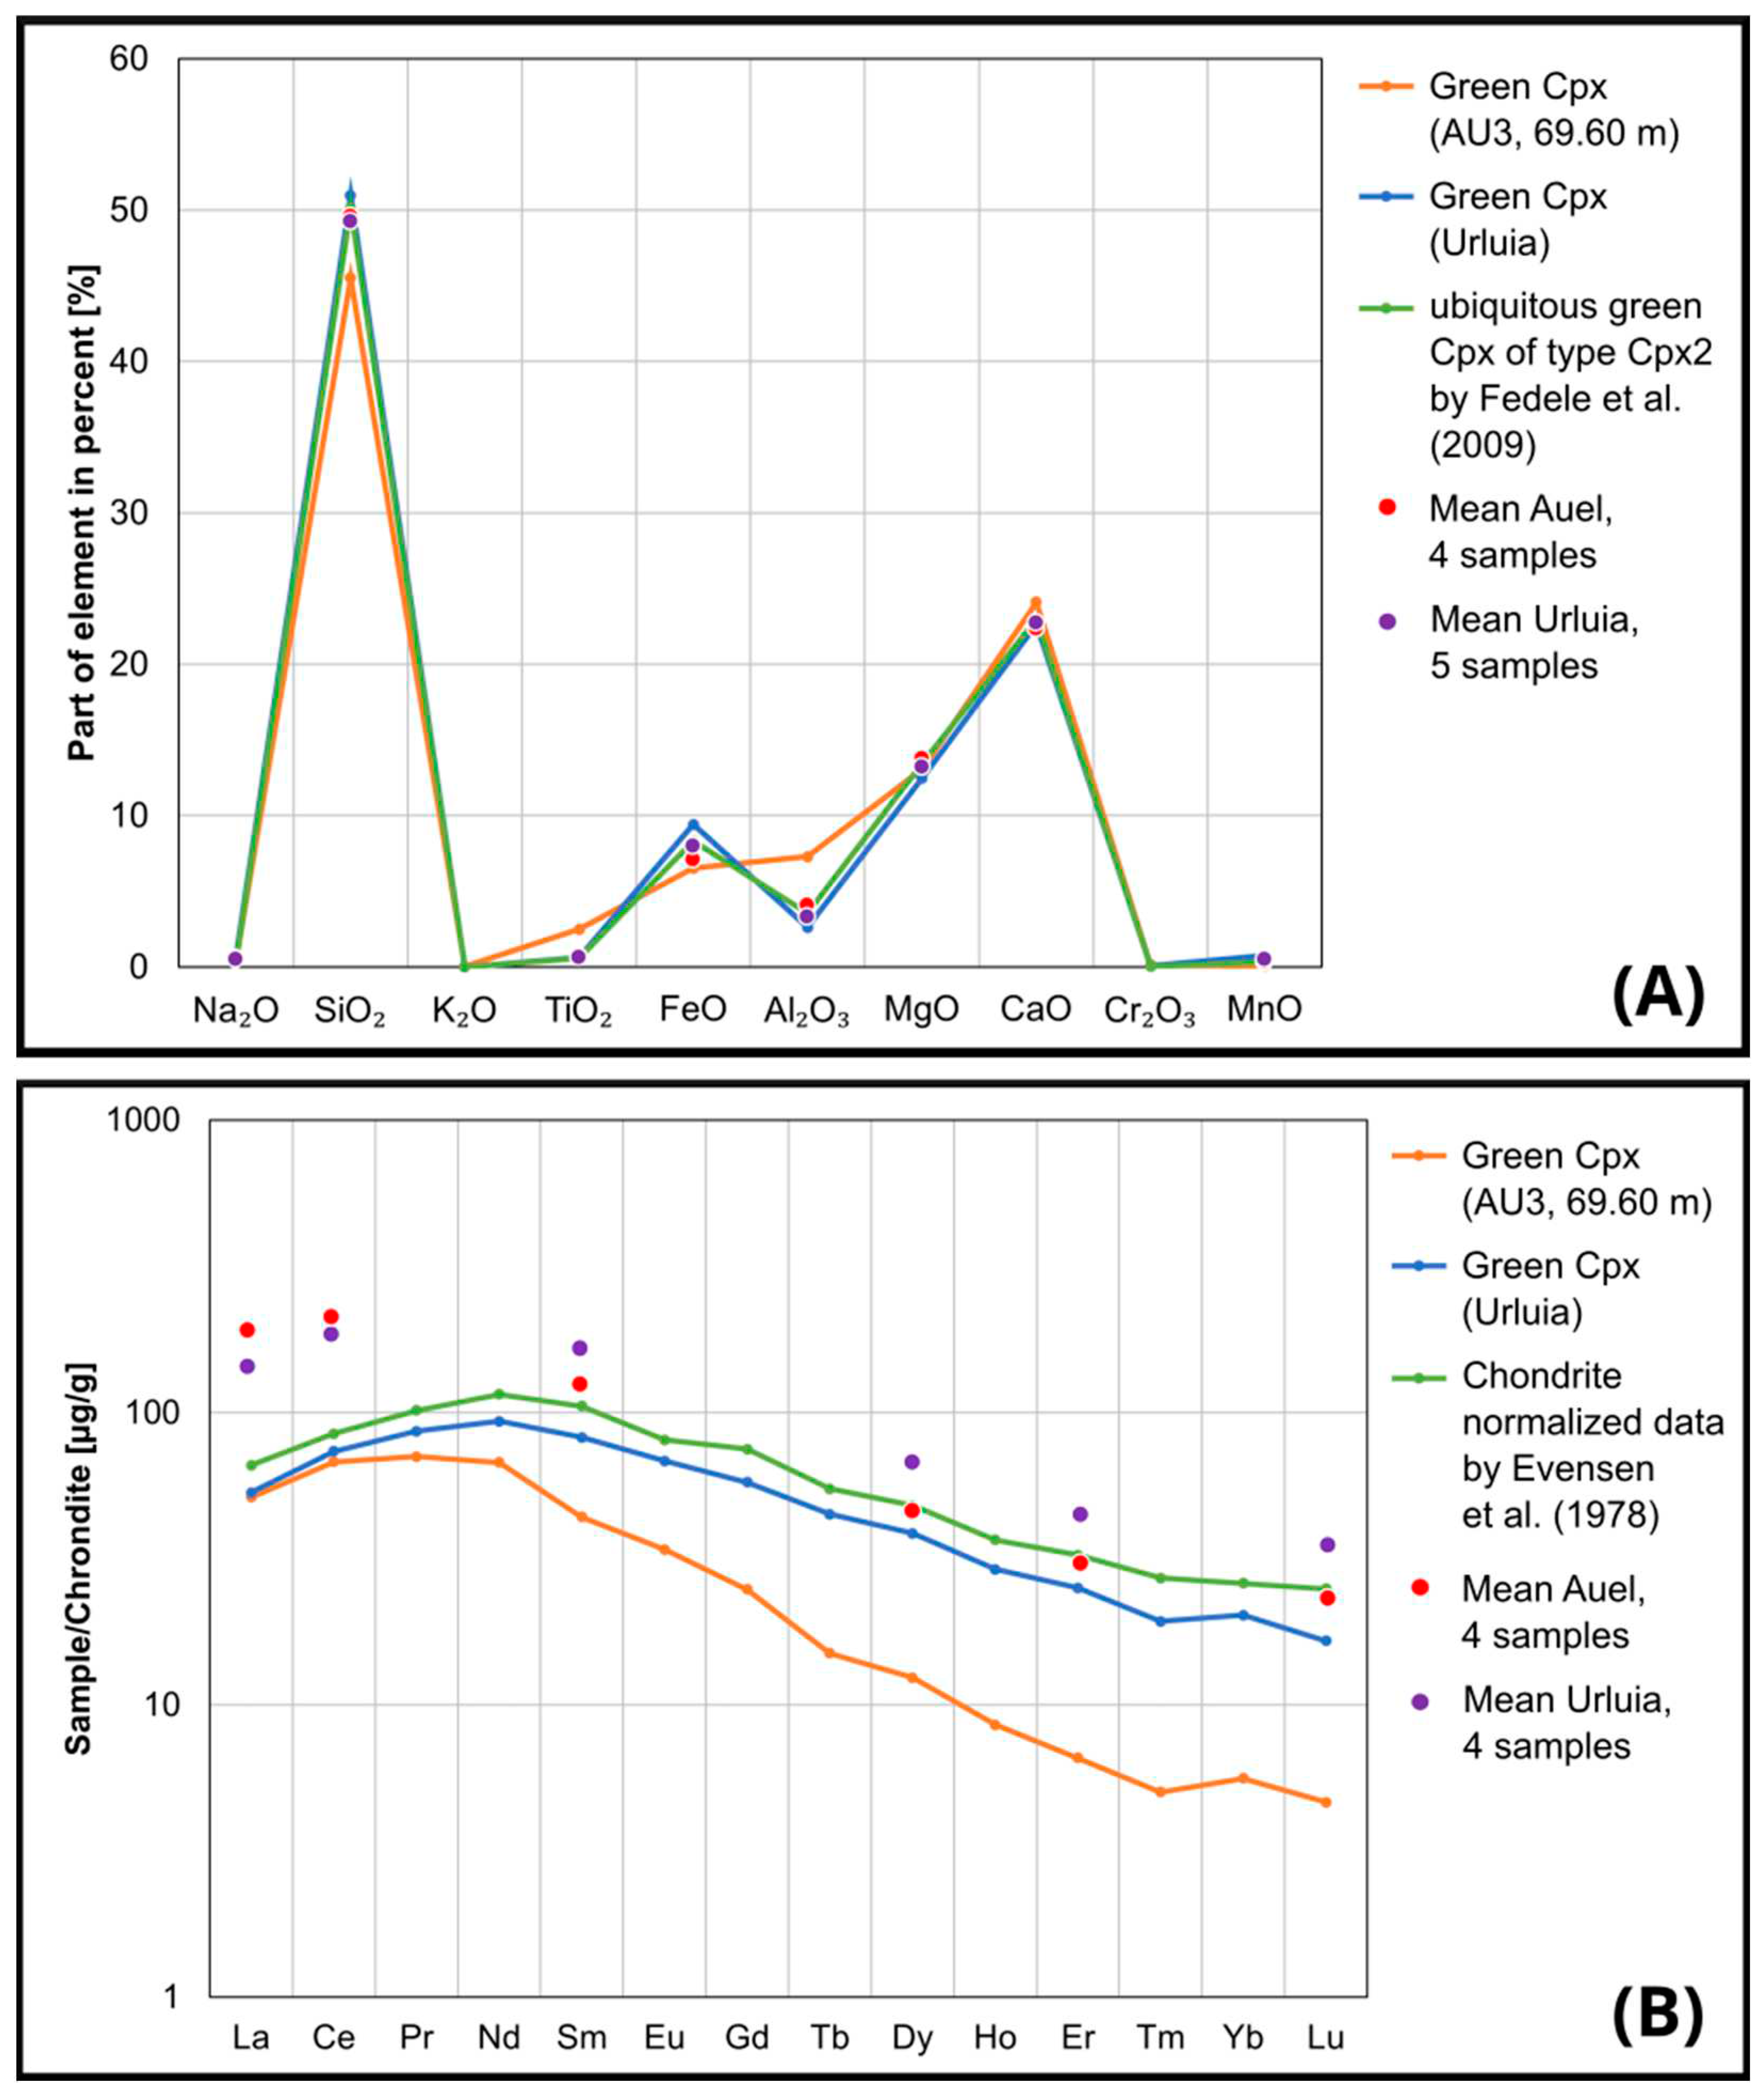
The results of EPMA and LA-ICP-MS on green cpx from AU3 core and Urluia demonstrate a comparable distribution of main elements (Figure 7A) and a similar rare earth element spectrum (Figure 7B). Both samples contain about 50% SiO2 as well as high CaO (>20%) and MgO (>10%) values. Additionally, FeO and Al2O3 were found in both samples with slightly different values of about 8% for FeO and Al2O3 in the Eifel cpx and 10% (FeO) and only 3% (Al2O3) in the cpx from Urluia. The sample from AU3 (depth of 69.50 – 69.60 m) and the base layer from Urluia were analyzed by EPMA and LA-ICP-MS. The measurements of the chemical composition of the glassy rims here show that the glass particles also have a high proportion of SiO2 (60.01 %). However, it is noticeable that the glass also contains 6.18% Na2O and 7.24% K2O (c.f. Figure 7). This is proof that the volcanic glasses do not originate from the Eifel region, as this is low in potassium. The obtained values are confirmed by Wulf et al. [59] presenting and discussing geochemical data of volcanic glass from tephras in lake records from northern Greece.
Figure 7.
Main element (A) and trace element contents (B) in sample 10 (AU3) and sample 14 (Urluia) compared with data from Fedele et al. [46] (green line). REE data is normalized to chondrite employing data from Evensen et al. [60]. Mean values from Auel and Urluia measurements are marked as points.
The major elements composition of cpx and glass presented in Figure 7A as well as Table A4, and Table A1, Table A2a-b show the overall good agreement of the chemical composition obtained from Auel (AU), Urluia (URL) and the Phlegraean Fields. For the latter, compositional data of glass from the most voluminous Welded Grey Ignimbrite (WGI) from the study of Fedele et al. [18] were selected. Moreover, for the glass data the average was only calculated from samples for which all elemental analyses were above the detection limit (38 data sets). Despite increasing relative differences with decreasing absolute element concentrations, the compositions lie within the known variation range of the CI eruption products and thus suggest a common origin of minerals and glass. In addition, it should not be forgotten that 1) the data come from different laboratories and that 2) the mean values are hardly comparable from a statistical point of view.
In Figure 7B and Table A3 average rare earth elements (REE) compositions of cpx (LA-ICP-MS data) for samples from the Breccia Museo formation (Phlegraean Fields; e.g. Fedele et al. [61]) are shown in comparison to results obtained for cpx from Auel cores and Urluia. The Breccia Museo Formation was interpreted as a proximal facies of the CI eruption products. The Cpx2-type clinopyroxenes of this sample set are most widespread in trachytes and less abundant in trachyphonolites and originated therefore from a less evolved trachytic magma [46].
It is remarkable that the pattern of relative trace element concentrations of green cpx are comparable in both samples (AU3 and Urluia) in the entire REE spectrum (Figure 7B and Table A5) with slight lower element concentrations in the green cpx from AU3 (Eifel). In both cpx samples 14 rare elements were detected with highest concentrations (µg/g) of Nd (≈100 in Urluia / 90 in the Eifel), Pr (90 / 80), Sm (90 / 70), Ce (80 / 80), Eu (80 / 60), La (70 / 70), Gd (75 / 50) and decreasing content values for trace elements Tb, Dy, Ho, Er, Tm, Yb, and Lu with up to 25 µg/g (Urluia) and 8 µg/g (AU3), respectively.
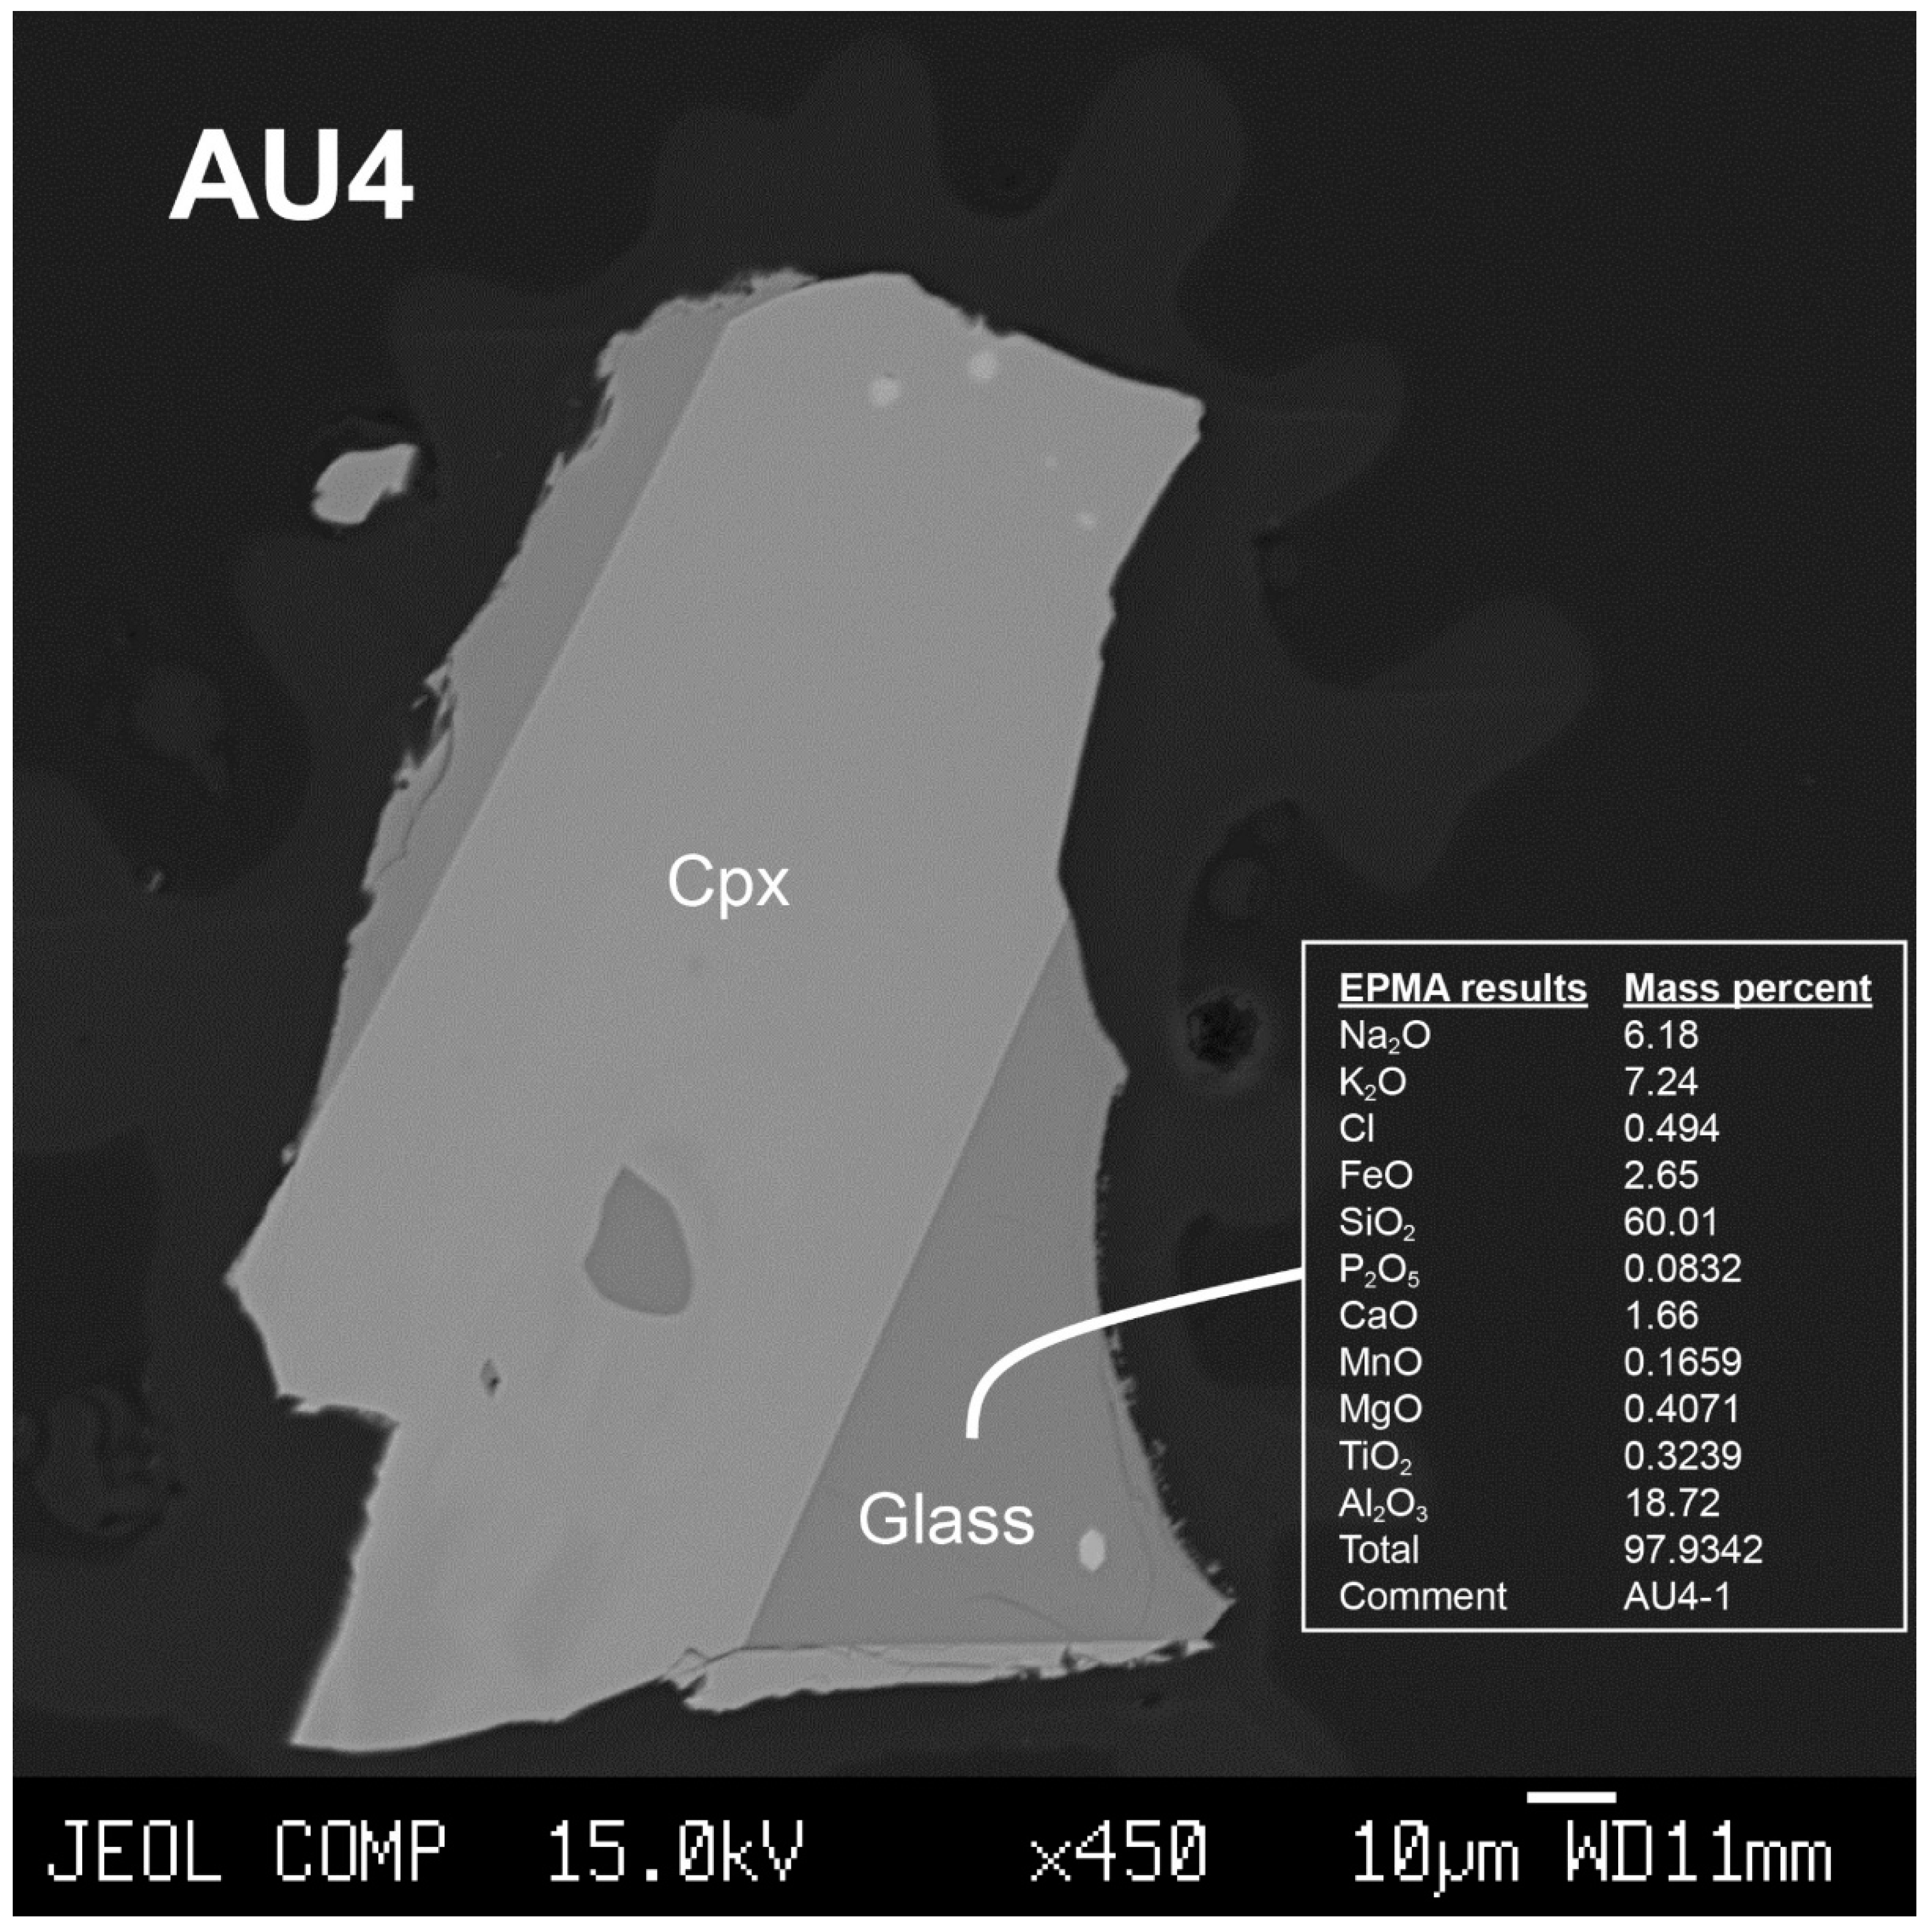
Green cpx from both drill cores of Auel (AU3 and AU4) and Urluia show frequently a glassy rim, which represents a sample of the magma at the moment of eruption. The results of the EPMA showed an almost identical composition to the CI glasses known from proximal CI and distal tephra deposits [14,18,29,45]. A back scatter electron (BSE) image of a cpx with glassy rim from AU4 and respective EPMA data are shown in Figure 8.
Figure 8.
BSE image of a cpx with glassy rim from drill core AU4 including EPMA results of the glass.
Figure 8.
BSE image of a cpx with glassy rim from drill core AU4 including EPMA results of the glass.
3.2. Stratigraphy
The first stratigraphy for an Auel core was published for AU2 [2]. Stratigraphy of cores AU3 and AU4 were analyzed in 1 mm steps and revealed now all Greenland interstadials almost perfectly [41]. The curves of organic carbon (Corg(chlorins)) from the investigated Eifel cores (AU3, AU4) are plotted here again in comparison to the oxygen isotope (δ18O) from the North Greenland Ice Core Project (NGRIP) (Figure 9). The Corg(chlorins) maxima in the interstadial around the time of the CI are well detectable. Figure 10 shows the intervals where greenish cpx and twisted minerals are visible in the sieved fraction >150 µm. The twisted minerals are concentrated in a small section, which we interpret to be the base of the CI fallout; a correlation suggested by the similarity of greenish cpx and twisted minerals in Urluia and the layer at 69.55 m in AU4. The greenish cpx in the core is observed over an interval of 20 cm following the initial airfall, which we interpret to have been caused by bioturbation or subsequent erosion of ash particles from the catchment into the lake.
Figure 9.
ELSA data (Corg(chlorins)) in Auel maar (AU3, AU4) [41] in comparison to the NGRIP (δ18O) [62]. Corg(chlorins) data were smoothed with a 12 pt mean and δ18O with a 40 pt running mean, respectively. The position of the CI layer is marked as a red line.
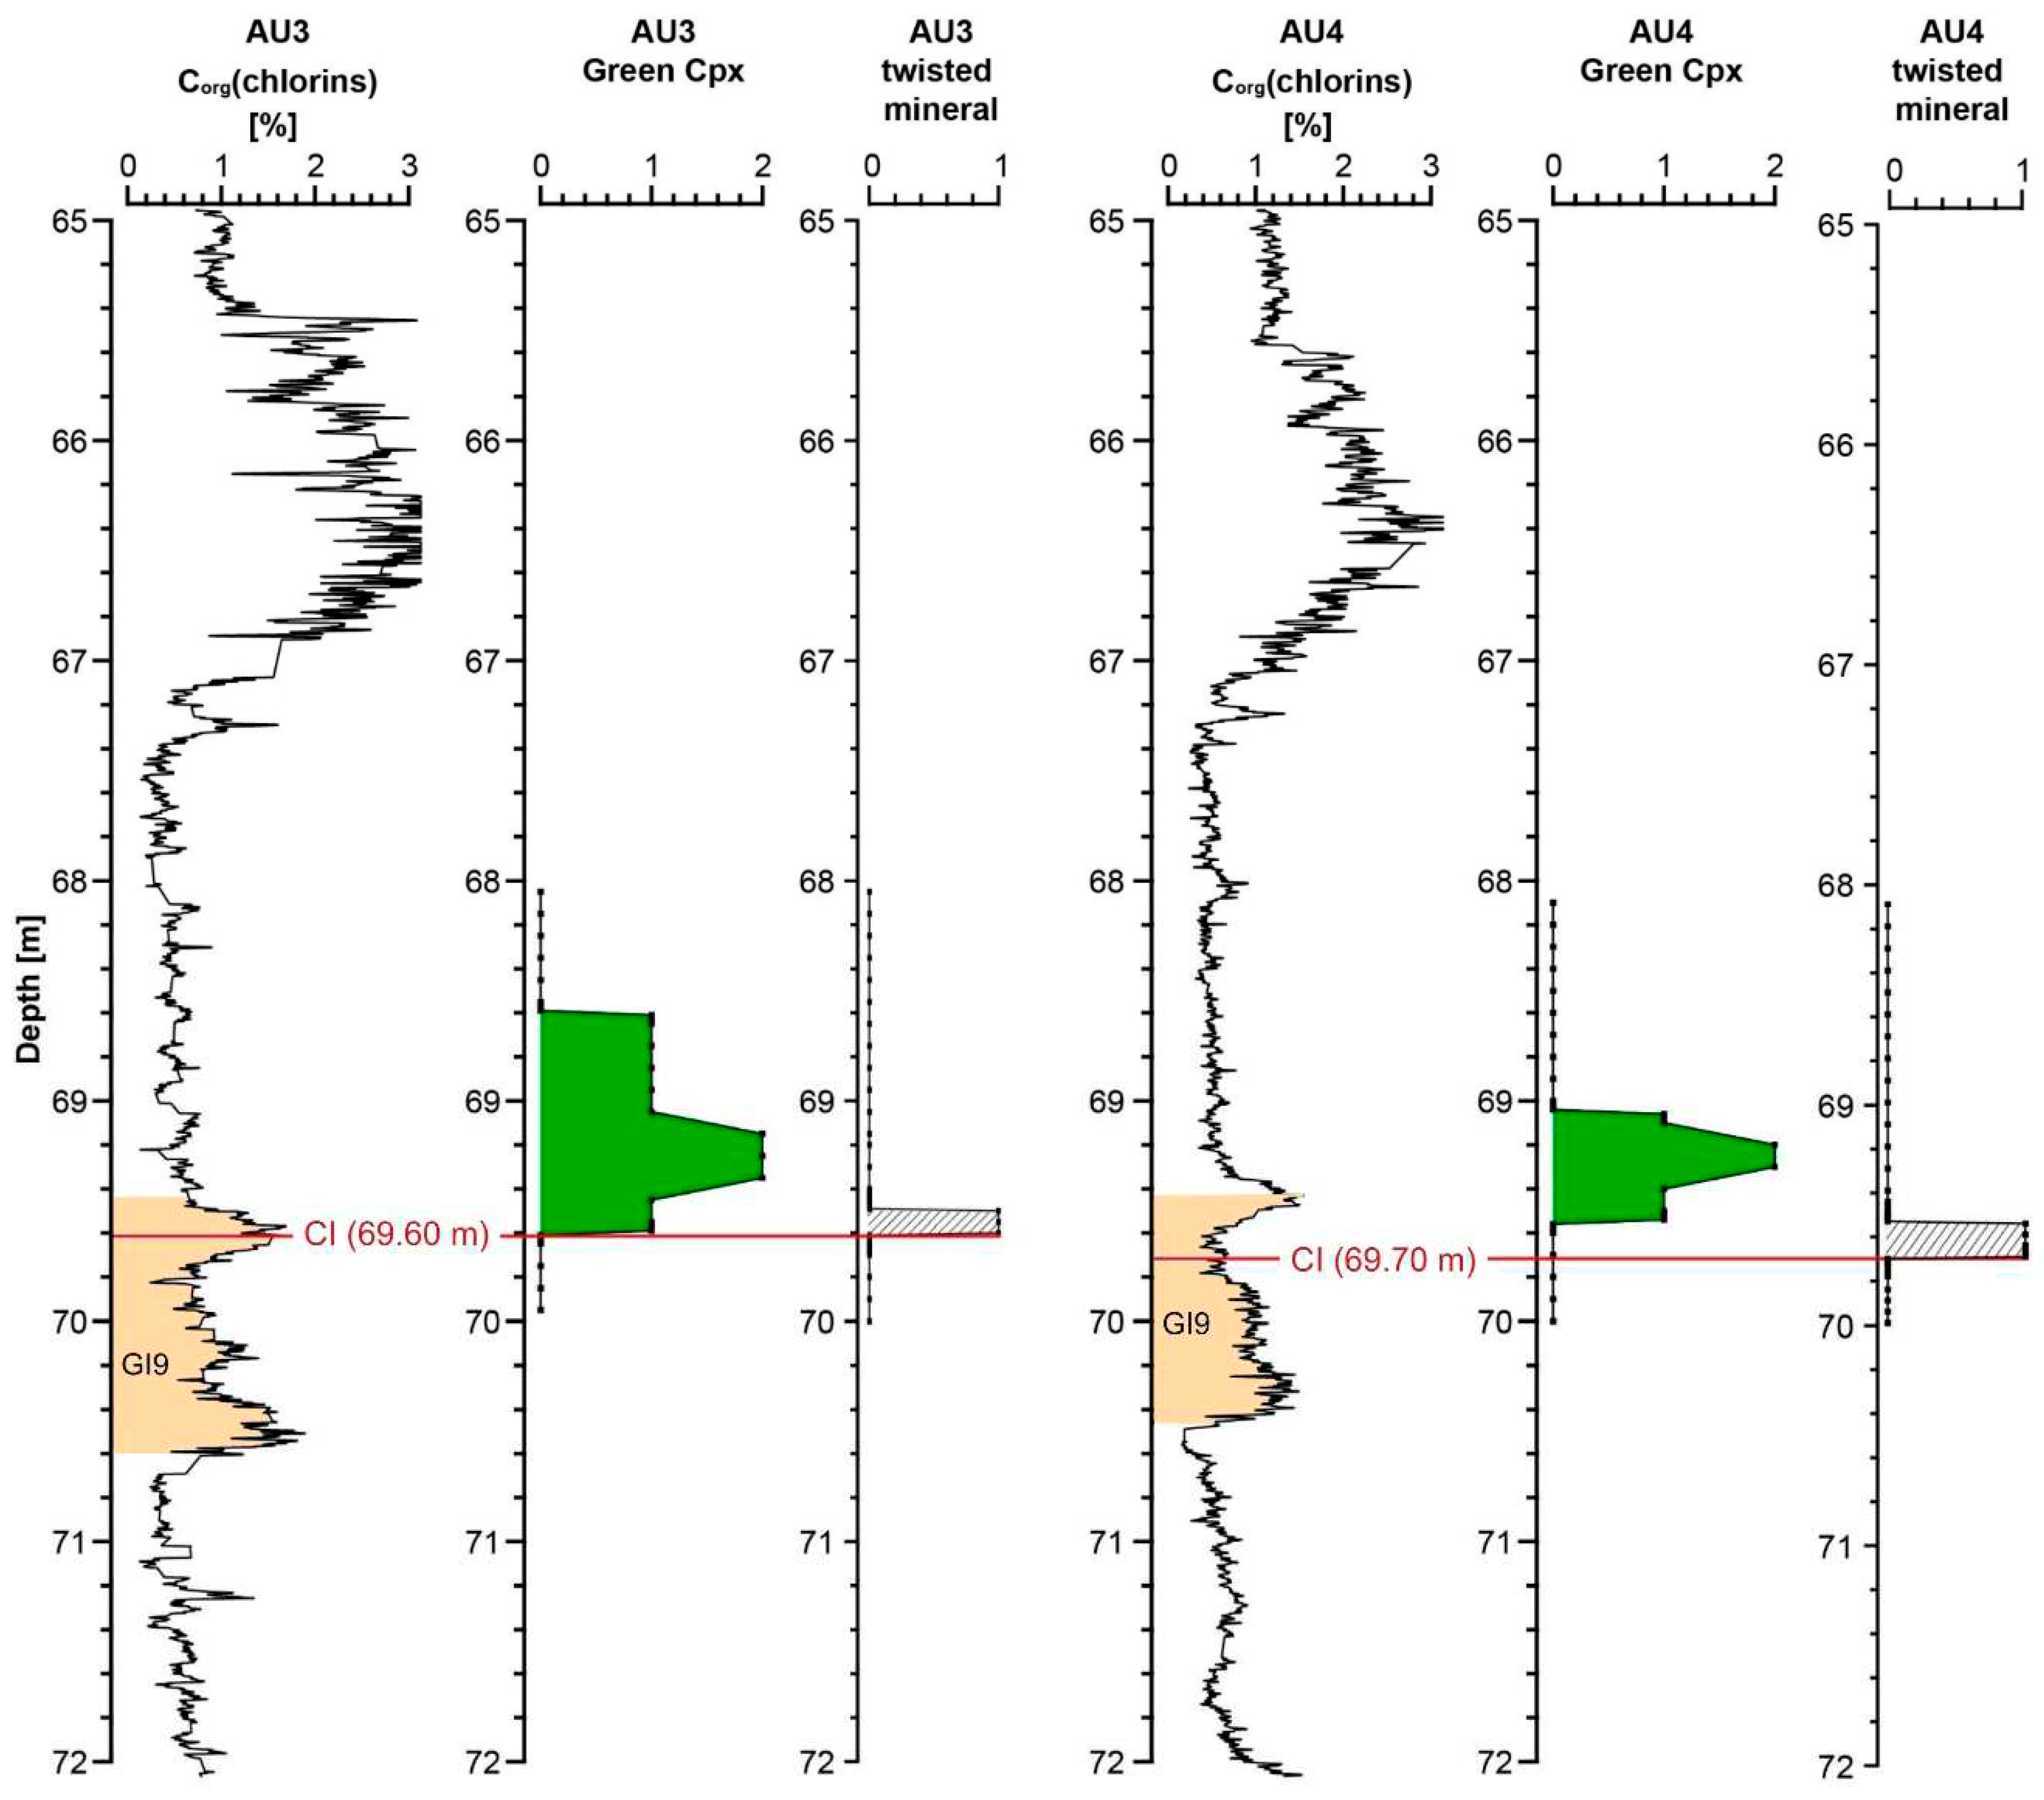
The Corg(chlorins) values are presented in Figure 10 and Figure 11 with the sections of the greenish cpx and twisted minerals highlighted. Figure 10 shows the cpx section and twisted minerals in all cores versus depth, Figure 11 versus age. Twisted minerals are found in both cores (AU3: 69.50 – 69.60 m; AU4: 69.55 – 69.70 m), but only in the deeper area and thus in the older period. It is striking that the CI layers of both cores are located at the depth in relation to a Corg(chlorins) rise.
Figure 10.
ELSA data (Corg(chlorins) of drill cores taken from Sirocko et al. [41], occurrence of cpx and twisted minerals) in Auel maar against depth [m]. Cpx is marked as a green area (numbers define quantity). Locations of the twisted minerals are indicated in dashed markings (numbers define presence). Corg(chlorins) data were smoothed with a 5 pt running mean. CI is marked as a reddish line.
The data of Figure 11 are the same as Figure 10, but now plotted versus age on the ELSA-20 chronology. We observe at depth of the CI layer an increase of Corg(chlorins), which is well visible in AU3 and AU4, but not completely well in the cores from Dehner maar (Figure 12). Dehner Maar has no inlet and thus does not receive nutrients from the catchment, which is the dominating source of the Corg(chlorins) in Auel. Chlorins are degradation products of chlorophyll, for example from fossil Chrysophyceae, and are biomarker pigments [63]. As Chrysophyceae occur in freshwater, Auel is ideal for observing the interstadials of MIS 3 while the Dehner maar is not very sensitive to this process. This explains the differences of the Dehner Corg(chlorins) records in comparison to the Auel records (Figure 10, Figure 11 and Figure 12).
Figure 11.
ELSA data (Corg(chlorins) of drill cores taken from Sirocko et al. [41], occurrence of cpx and twisted minerals) in Auel maar against age [yr b2k]. For a simile, there is an additional plot of NGRIP [62]. Cpx is marked as a green area (numbers define quantity). Localities of the twisted minerals are indicated in dashed markings (numbers define presence). Corg(chlorins) data were smoothed with a 5 pt mean and δ18O with a 10 pt mean. CI is marked as a reddish line.
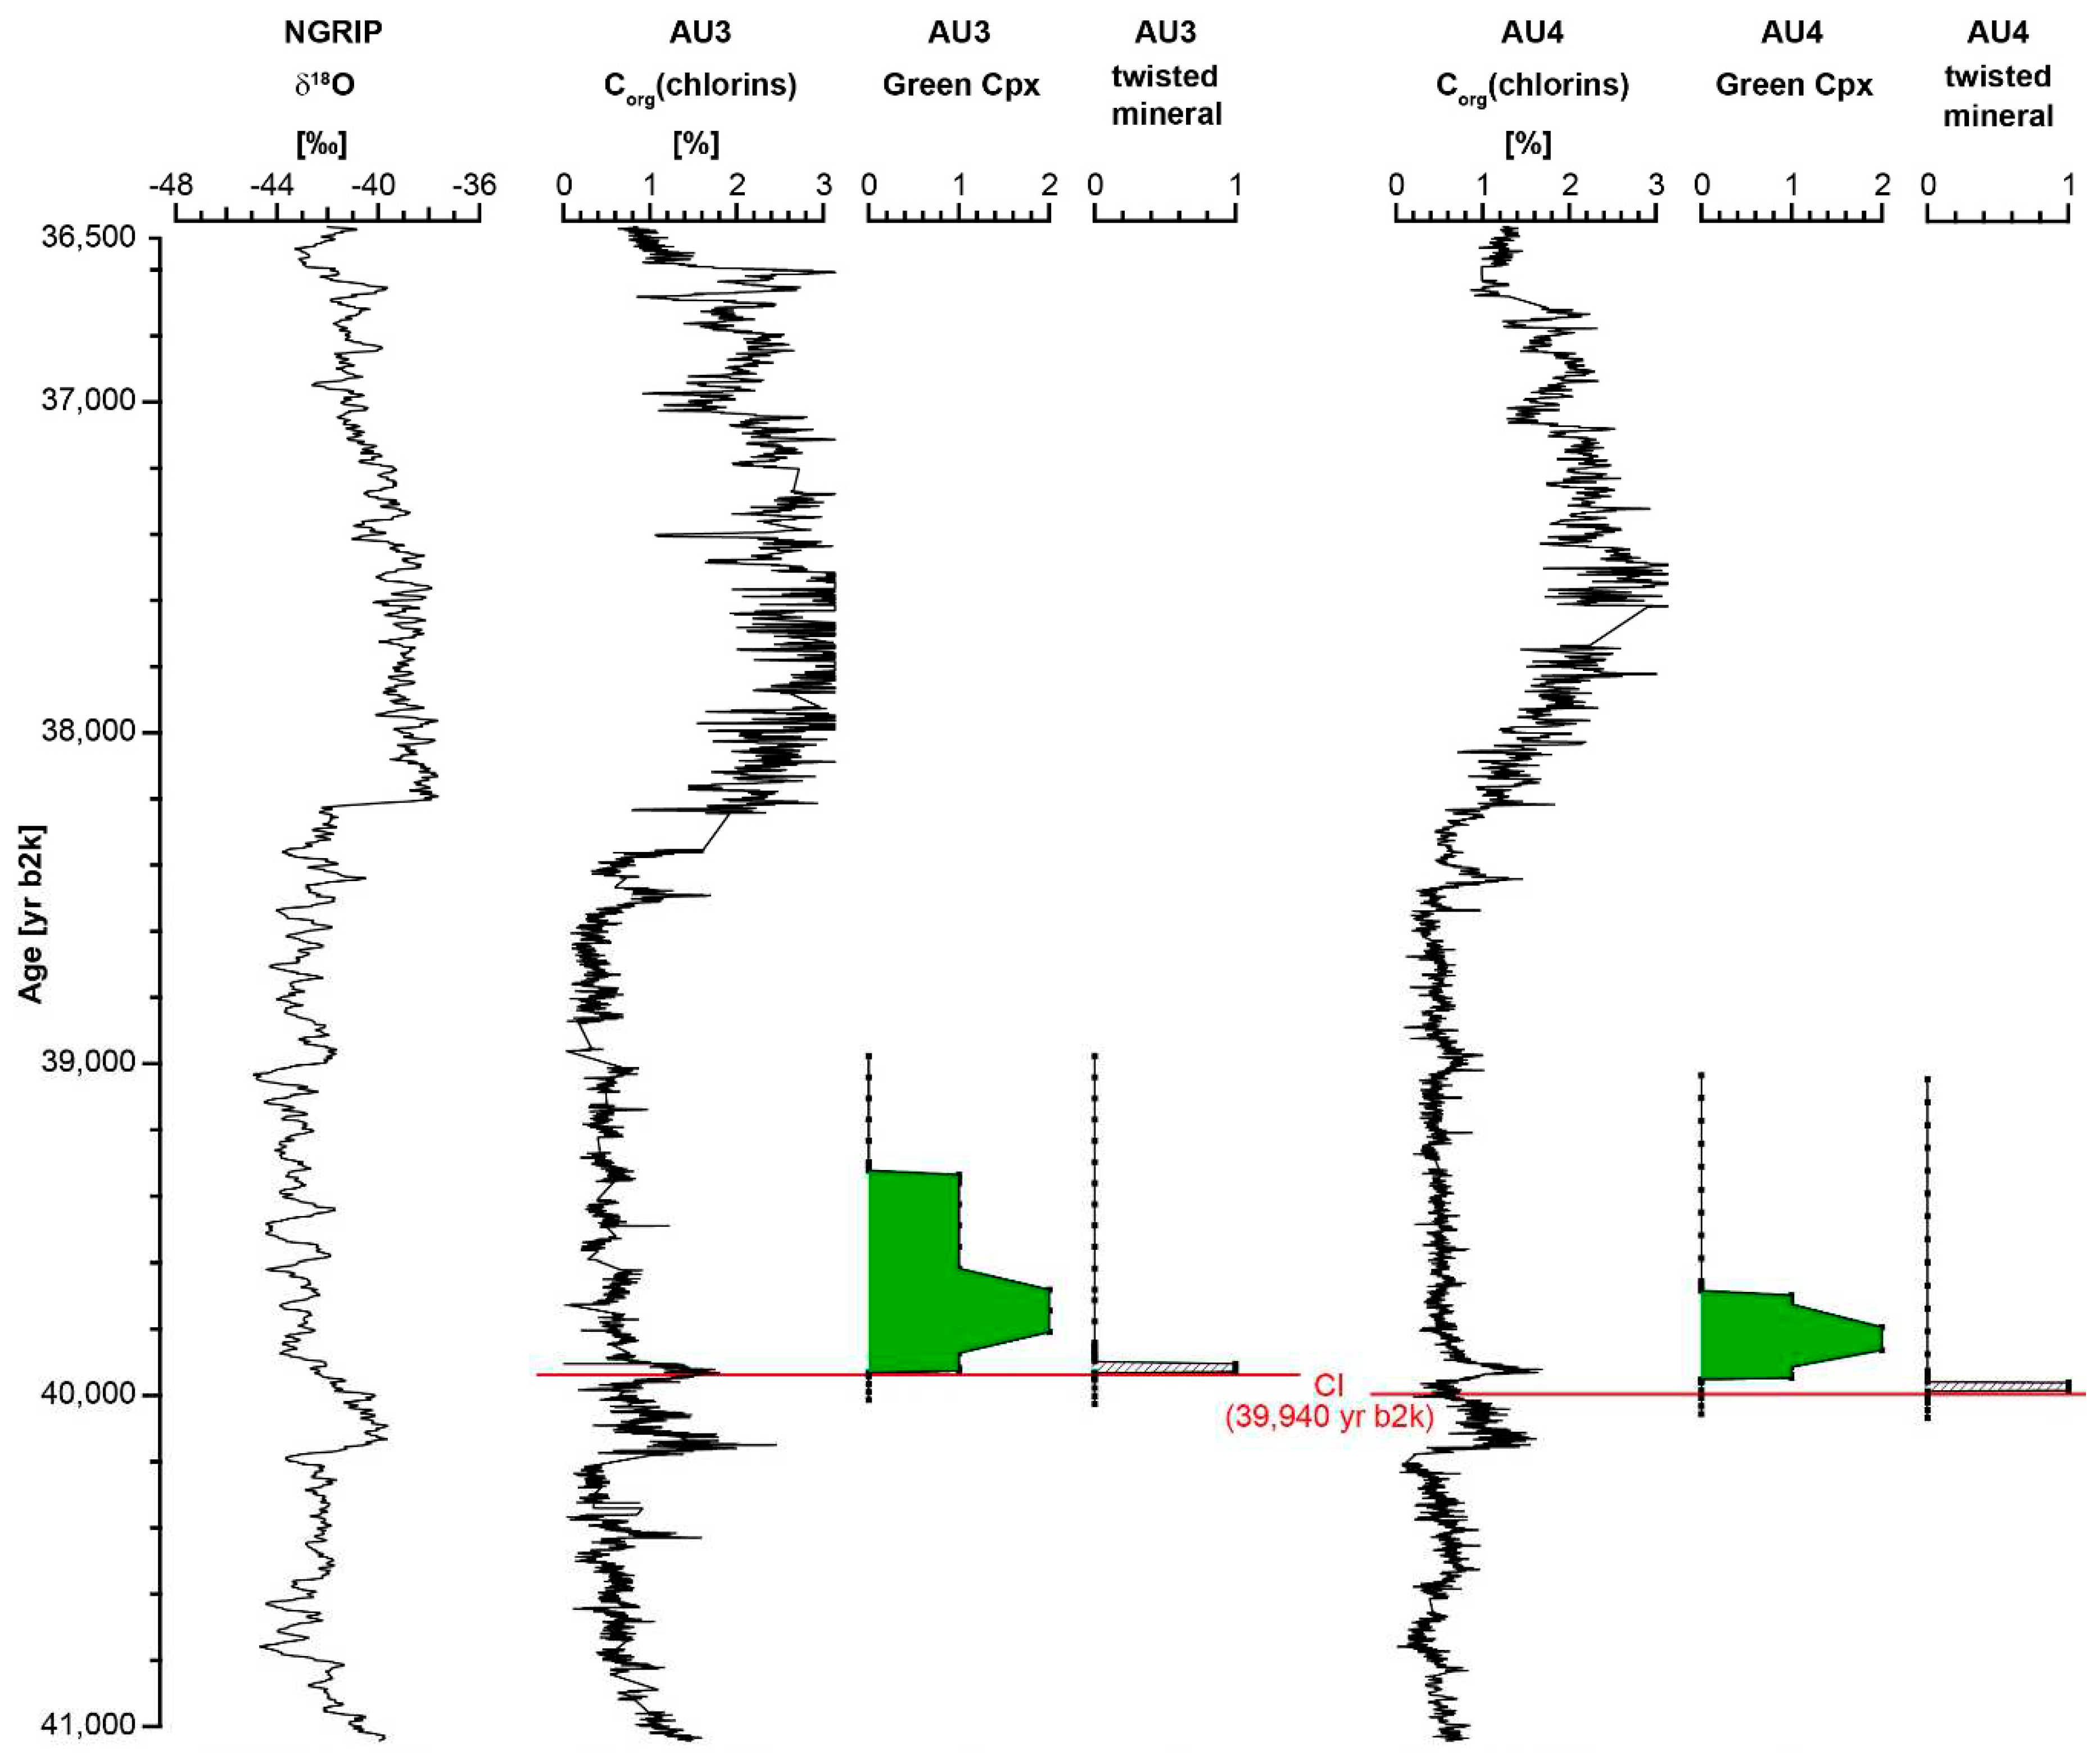
Figure 12 presents the stratigraphic position of the greenish cpx and the twisted minerals in the Dehner maar (cores DE3 and DE4) versus depth [m]. Here, too, it is noticeable that the twisted minerals can be found in the lower area, i.e. the older part. Overall, the depth in the Dehner maar defines a range between 49.70 – 50.40 m and is therefore slightly younger than GI9.
Figure 12.
ELSA data (Corg(chlorins) of drill cores, occurrence of cpx and twisted minerals) in Dehner maar against depth [m]. Corg(chlorins) data were smoothed with a 5 pt running mean.
Figure 12.
ELSA data (Corg(chlorins) of drill cores, occurrence of cpx and twisted minerals) in Dehner maar against depth [m]. Corg(chlorins) data were smoothed with a 5 pt running mean.

3.3. Result summary
The results above have documented the depth of the CI at 68.60 – 69.60 m in core AU3, 69.05 – 69.70 m in AU4, 50.00 – 50.40 m in DE3 and 49.70 – 49.90 m in DE4. The first appearance of twisted minerals on the ELSA-20 chronology after Sirocko et al. [41] appears to be the most probable depth representing the time of eruption. The curves of Figure 3, Figure 4, Figure 5, Figure 6, Figure 7, Figure 8 and Figure 9 reveal the CI several cm at the end of GI9, thus in the time interval of 39,900 – 39,950 yr b2k, which is the time window also dated by Ar/Ar dating [8,10]. The ELSA-20 stratigraphy places the fallout layer at an age of 39,850 yr b2k ± 150 years. The end of GI9 was dated in the Greenland ice to 39,940 yr b2k according to the GICC05 time scale [62]. The CI thus appears to have occurred about 50 years before the end of GI9 but taken into account the 150 years error of the ELSA-20 stratigraphy in could be even 200 years after the end of GI9.
4. Discussion
The geochemical and mineralogical composition of the proportion of the CI ash cloud, which has reached central Europe, allows inference on the dynamics of the cloud transport. This is however a topic, which needs much more detailed geochemical and isotopical analysis, which we are planning to undertake in a future study. In this paper and a special issue of QUATERNARY about the MIS 3 climate and vegetation, we will finally evaluate, if, or what, environmental changes were associated with the fallout in central Europe. The second part of the discussion will then deal with timing of the eruption relative to global processes, in particular insolation, paleomagnetism, and North Atlantic hydrographic changes.
4.1. Environmental change associated with the Campanian Y5-tephra
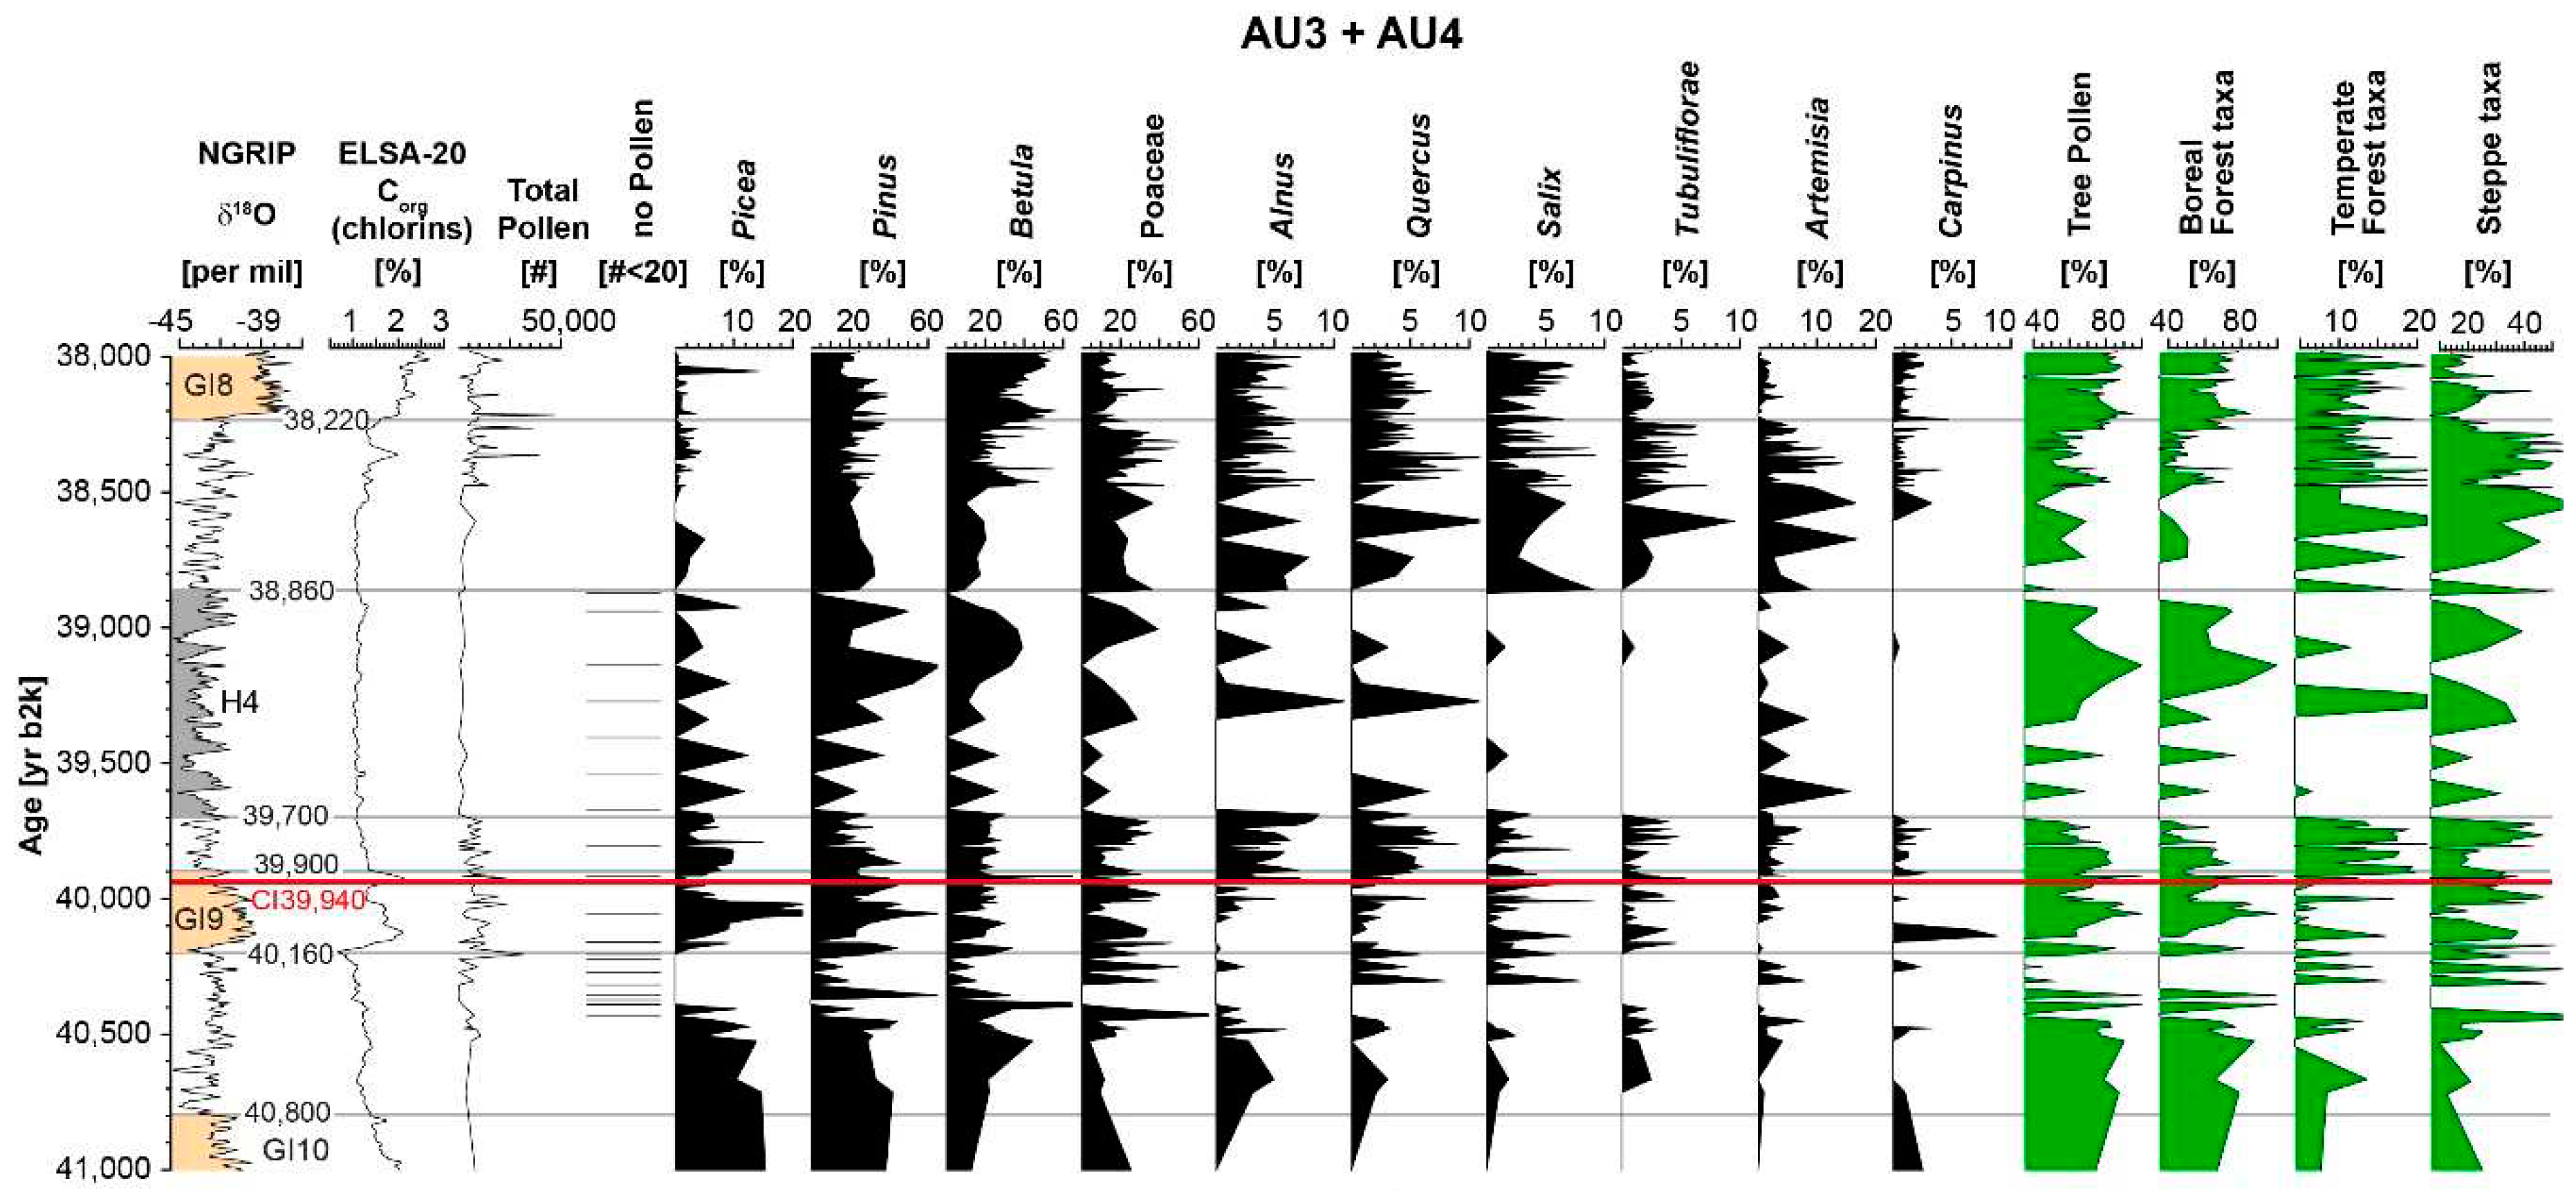
The Figure 13 and Figure 14 present the pollen in the millennia before and after the CI event. Figure 13 presents selected pollen taxa on the depth scale. Figure 14 presents the same data on the ELSA-20 chronology. Full documentation of the pollen is given in Britzius et al. [56]. Albert et al. [64] documented that the reaction of the lake temperature to warming is instantaneously and tightly related, best visible by the very similar shape of maxima and minima in both the NGRIP δ18O and the AU3 Corg(chlorins). Cold stadials caused tree populations to decline and steppe taxa to expand, whereas during warmer interstadials, trees dominated the pollen spectrum [56]. During both stadial and interstadial conditions, boreal and temperate taxa stayed present, varying only in the proportion of the total pollen sum.
Figure 14 documents that pollen in the decades before the CI are the same as during GI9. Boreal tree taxa (Picea, Pinus, and Betula) as well as pollen of Poaceae are dominant throughout the total 68.00 – 72.00 m depth range, temperate taxa build up to about 20% of the total terrestrial pollen sum from 70.80 to 70.30 m and 69.40 to 68.90 m. These derived mainly from typical trees of the flood plains like Alnus and Salix, but also Quercus (Figure 13). All taxa continue to be present in the decades after the CI; thus, we infer that the environmental change caused by the eruption and deposition of small amounts of ash particles was minimal in the Eifel region. This is different to the airfall regions in eastern Europe, where the airfall is locally preserved in more than 1 m thickness, for example in Urluia.
Tree pollen and Corg(chlorins) show 2 peaks during GI9, one before the CI layer with a duration of about 100 years, and one directly after the CI event. The pollen do not indicate any principle change of the vegetation following the CI eruption, but, on the contrary, the second increase of bioproductivity at least in the lake of Auel, where we observe a Corg maximum around 69.05 m in AU4, not following the tight relation between Greenland and the Eifel (compare Albert et al. [64]). A possible explanation for the local Auel anomaly may hint to a positive effect of the airfall on the lake diatoms by the input of potassium (K) to the lake water.
A pronounced change in the pollen is observed i.e. about 39,700 yr b2k, and thus about 240 years after the CI eruption according to the ELSA-20 chronology. At this time, Poaceae, Alnus, Quercus and Salix decrease strongly or even disappear from the pollen spectrum. Instead, Artemisia spread. This pattern could be indeed caused by a climate deterioration at 39,700 yr b2k, thus 200 years after the end of GI9, 240 years after the CI, but about contemporaneous with the onset of the Heinrich Event 4 (H4) cold spell in the North Atlantic. A precise date for the H4 onset could not be derived from the marine sediment itself, it is thus our ELSA AU4 record, which suggests, that the onset of H4 was between 39,900 and 39,700 yr b2k, which is consistent to results of Rasmussen et al. [62]. The CI was thus not directly associated with the onset of the H4 events.
The CI tephra might have however changed the soil properties in the Eifel volcanic landscape. The decades immediately after the CI show an increase of Quercus and Alnus, which results in an increase of the Temperate Forest summary curve (Figure 14). This increase of temperate taxa during the transition into a cold stadial is unexpected. Thus, we infer that oak and elm might have benefitted from the potassium (K) of the ash deposits. The increase of these two trees is paralleled by a Corg(chlorins) maximum, one of the very few, which are not paralleled by a maximum in the Greenland ẟ18O. Thus, the Corg(chlorins) maximum subsequent to the CI layer could be caused by increase of Si and K in the river water, draining the catchment of Auel. This pattern could be indeed attributed to the CI airfall, resulting in spread of oak and elm trees via K-fertilisation – seasonal decay of leaves producing Nitrate and Phosphate, causing increases in nutrient runoff into the lake system. This must not be the only possible interpretation for the environmental change after the GI but would explain all observed features in the vegetation and the lake Corg(chlorins) content.
Figure 13.
Change of pollen composition in AU4 (for total pollen sequence of the Auel core see Britzius et al. [56]) before, during and after CI layer, compared to Corg(chlorins) [41] against depth [m]. Corg(chlorins) data were smoothed with a 10 pt running mean. Pollen are shown as the percentages of the total terrestrial pollen sum. No pollen show the samples, where there were only very few pollen preserved and thus less than 20 grains counted.
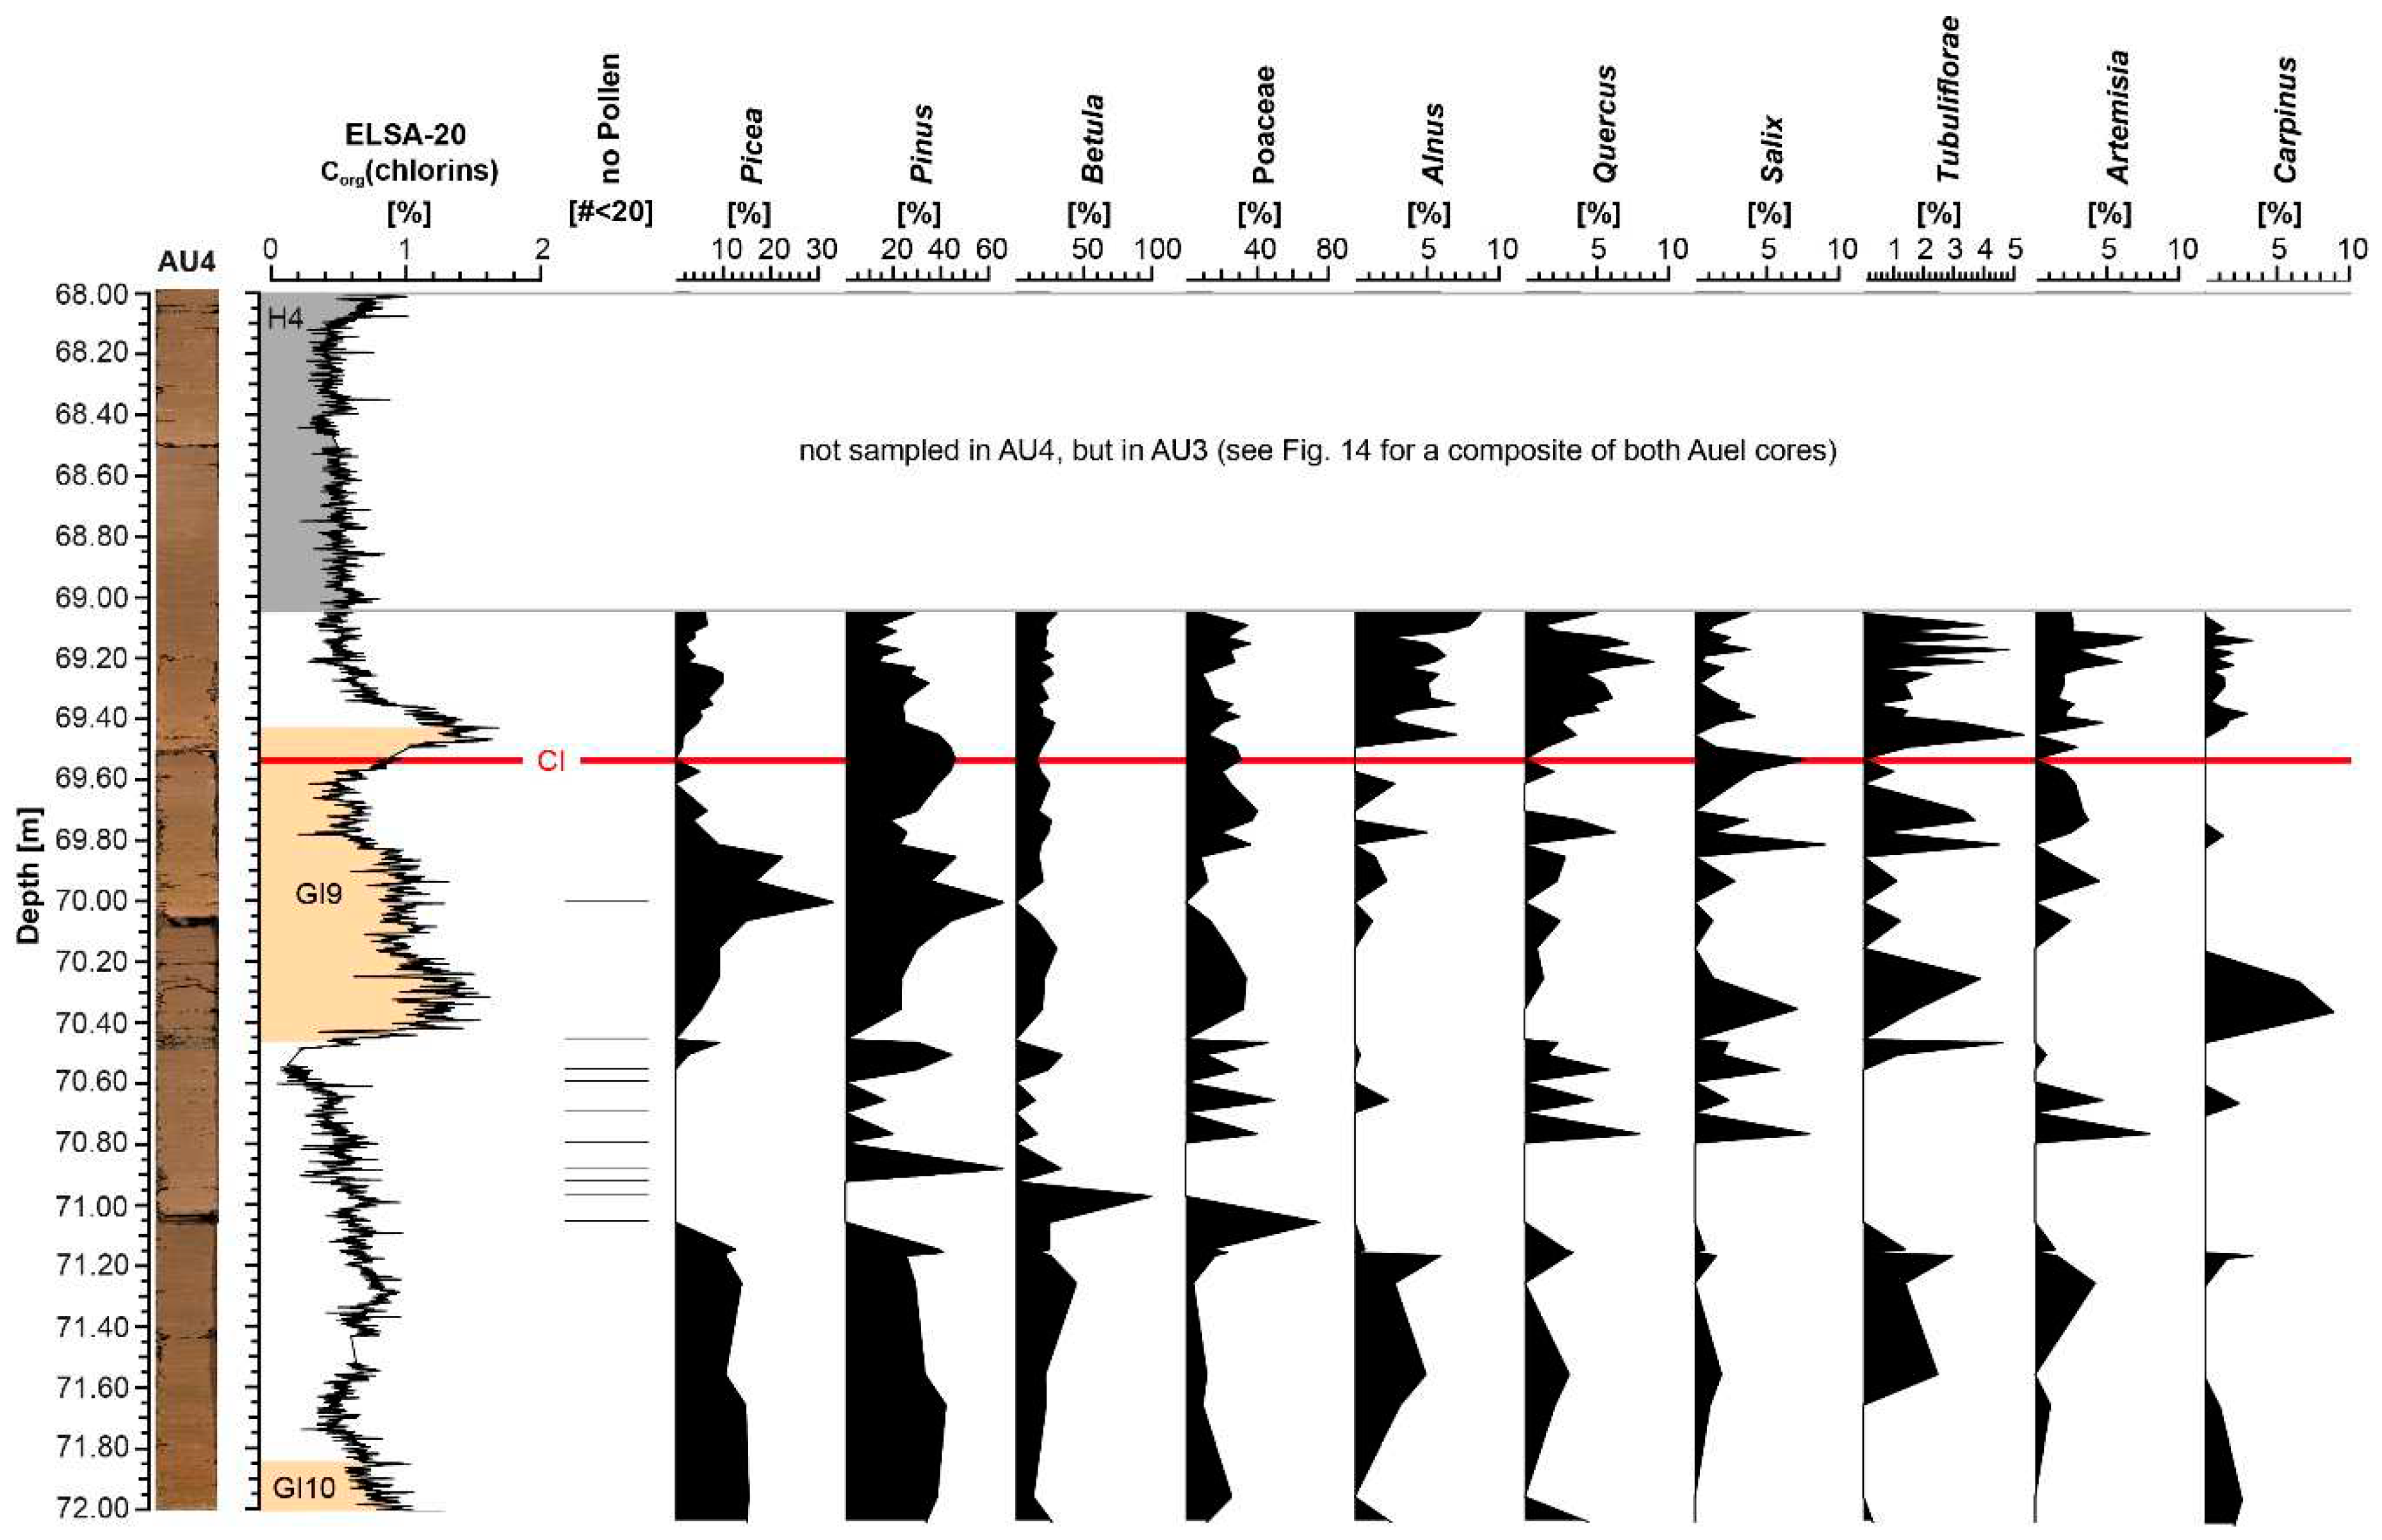
Figure 14.
Change of pollen percentages in AU3 and AU4 (for total pollen sequence see Britzius et al. [56]) before, during and after CI layer, compared to Corg(chlorins) [41] against age [yr b2k]. Corg(chlorins) data were smoothed with a 5 pt and δ18O data [62] with a 10 pt running mean, respectively. Pollen are shown as the percentages of the total terrestrial pollen sum. No pollen indicates the samples, where there were only very few pollen preserved and thus than 20 grains counted.
4.2. Comparison to the global climate between 45,000 and 35,000 yr b2k
Massive volcanic eruptions with S-rich ashes reaching the stratosphere are known to potentially effect the climate on a global scale; see the recent example of Pinatubo in 1991, that cooled the Earth temperature for about two years. Costa et al. [65] confirm that injection of such aerosols into the stratosphere can lead to an extended volcanic winter. The CI eruption, however, was not as effective. It was difficult to detect the fingerprint of the CI in the Greenland ice at all, but now it is suspected at 39,900 years in the NGRIP record, see chapter 3.2.
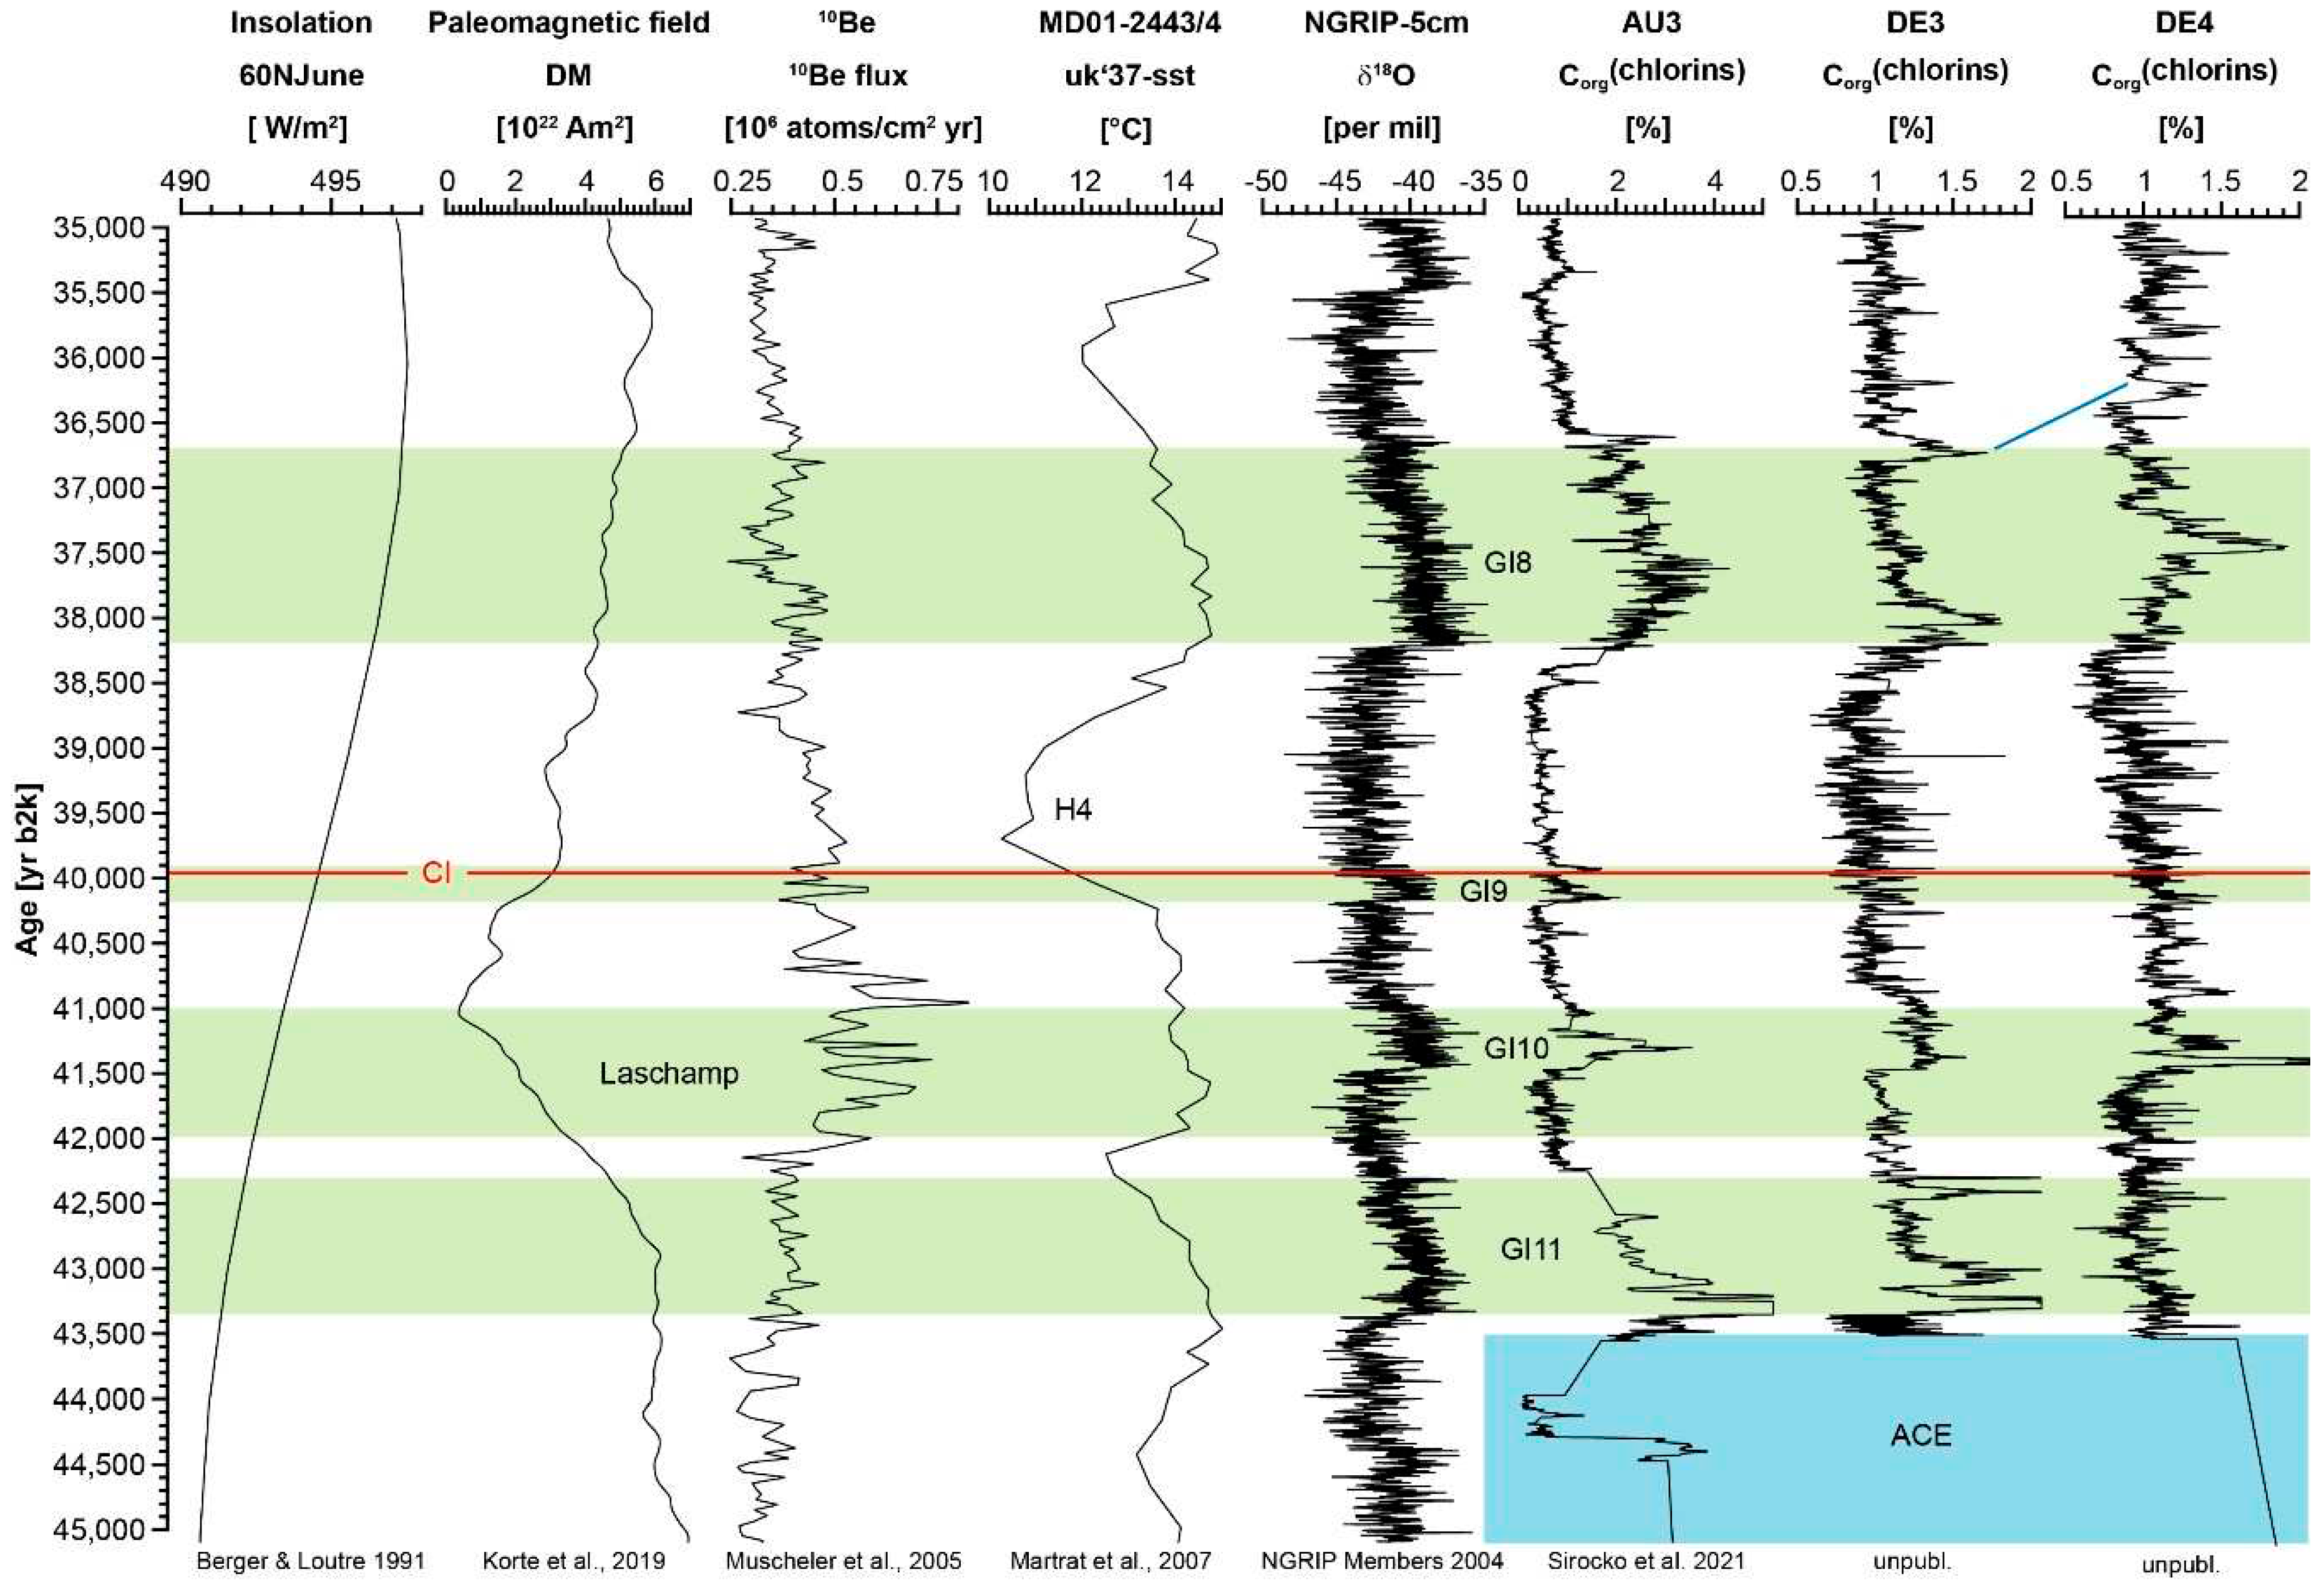
Figure 15 presents several records of globally important climate related curves. All of these records, except NGRIP, do not have the resolution to detect a potential impact from the CI layer. The geomagnetic intensity, with its pronounced minimum during the Laschamp event, centred at 41,000 yr b2k, was already increasing for several centuries. The H4 events, representing decay of the North American ice sheet started with the CI in the marine curve of Martrat et al. [66]. The time resolution of the marine record is however not sufficient to resolve this event even with century resolution. The pollen auf AU3, presented above had indicated that the environment in the Eifel remained stable for 240 years even after the CI event; thus it is unlikely that the CI caused the cooling of the H4.
Figure 15.
Comparison with global analyses contemporaneous to the timing of the CI [yr b2k]. The ages of NGRIP and the additional events (GI9, GI8, as well as H4) are based on Rasmussen et al. [62]. Since all events take a certain period of time, the onset is shown here in each case. It also can be seen that the CI occurs after the interstadial period GI9, and coincides with the onset of H4, a cold stadial. δ18O is smoothed with a 10 pt mean. Berger and Loutre [67] measured insolation at 60°N, the values from SST are from Martrat et al. [66]. Korte et al. [68] define a global paleomagnetic field, and Muscheler et al. [69] provide beryllium measurements. The comparison to the Corg(chlorins) values of AU3 core is from Sirocko et al. [41]. ACE means Auel Cooling Event (compare Albert and Sirocko [42]).
5. Conclusions
The study of the lead/lag relations between the CI fallout and the Eifel vegetation indicates that the CI ash reached indeed central Europe, but the environmental effect was not strong, potentially with a slight effect on soil nutrient contents.
We do not see a direct relation of the CI to any process on the global time scales, but this might be at least partially caused by the lack of indeed annual/decadal resolution records for the time of the CI.
The CI event occurred however in a millennium after intense changes in the global magnetic field strength effecting the intensity of solar radiation, which reached the Earth’s surface. The CI occurred however decades or even centuries before the massive changes in the North Atlantic during the onset of the H4 event.
Author Contributions
Conceptualization: F.Si., F.Sc., U.H.; Methodology: F.Sc., F.Si., U.H.; Validation: U.H., D.V.; Formal Analysis: F.Sc., U.H.; Resources: F.Si., U.H.; Data Curation: F.Sc., F.Si., U.H., S.B.; writing—original draft preparation: F.Sc., U.H., S.B., D.V., F.Si.; Funding Acquisition: F.Si. All authors have read and agreed to the published version of the manuscript.
Funding
This research was funded by the Johannes Gutenberg University of Mainz.
Data Availability Statement
All data will be downloadable at the website of this project (https://elsa-project.de).
Acknowledgments
The authors thank Klaus Schwibus as well as Frank Dreher for their experience and valuable discussions, and Petra Sigl for the graphical design. Furthermore, the technical support at the Johannes Gutenberg University through the laboratory equipment by Dr. Stephan Buhre (EPMA) and Dr. Regina Mertz (LA-ICP-MS) is appreciated. Dr. Monika Korte (GFZ Potsdam) contributed by calculating the models of magnetic field strength for the locations of the investigated sites. The authors thank the team form the microprobe lab at the Bayerische GeoInstitut namely Anke Potzel and Detlef Krauße for the constant and crucial support during EPMA. We are particulary indebted to Raphael Njul for the careful and precise sample preparation. With great effort, Dr. Philipp Schulte and the team from the sedimentology lab of the Chair of Physical Geography and Geoecology of the RWTH Aachen University succeeded in isolating the heavy mineral fraction from the tephra at Urluia. Also thanks to Florian Thiery for map and graphical design additions.
Conflicts of Interest
The authors declare no conflict of interest.
Appendix A

Table A1.
EPMA results of major elements (in mass percent) of green single cpx minerals from Auel maar lake and Urluia outcrop compared to data from the Phlegraean Fields [46]. Only the most ubiquous green cpx of type Cpx2 from the data set of Fedele et al. [46].
| Sample ID | SiO2 | TiO2 | Al2O3 | FeO | MnO | MgO | CaO | Na2O |
|---|---|---|---|---|---|---|---|---|
| Auel (AU) | ||||||||
| AU-1 | 50.13 | 0.29 | 4.38 | 6.60 | 0.12 | 14.05 | 22.23 | 0.66 |
| AU-2 | 49.54 | 0.63 | 3.76 | 8.37 | 0.39 | 13.20 | 22.60 | 0.43 |
| AU-3 | 48.70 | 1.16 | 5.53 | 4.44 | 0.10 | 14.91 | 22.43 | 0.54 |
| AU-4.2 | 49.87 | 0.65 | 2.57 | 8.90 | 0.78 | 12.84 | 22.15 | 0.64 |
| Mean* | 49.56 | 0.68 | 4.06 | 7.08 | 0.35 | 13.75 | 22.35 | 0.57 |
| Urluia (URL) | ||||||||
| URL-1 | 49.10 | 0.54 | 3.47 | 8.11 | 0.44 | 13.23 | 22.55 | 0.43 |
| URL-2 | 49.95 | 0.40 | 2.68 | 7.52 | 0.42 | 13.61 | 23.06 | 0.49 |
| URL-4 | 48.17 | 0.71 | 4.05 | 8.51 | 0.41 | 12.80 | 22.69 | 0.48 |
| URL-6.2 | 49.39 | 0.65 | 2.39 | 9.24 | 0.83 | 12.11 | 22.87 | 0.60 |
| URL-6.3 | 49.53 | 0.82 | 3.98 | 6.33 | 0.36 | 14.31 | 22.36 | 0.45 |
| Mean** | 49.23 | 0.63 | 3.31 | 8.00 | 0.49 | 13.21 | 22.71 | 0.49 |
| Phlegraean Fields, c.f. Fedele et al. [46] | ||||||||
| Mean*** | 50.10 | 0.58 | 3.57 | 8.31 | 0.35 | 13.46 | 22.98 | 0.34 |
* Mean AU, 4 samples; **Mean URL, 5 samples; ***Mean Phlegraean Fields, 11 samples
Table A2a.
EPMA results of major elements (in mass percent) of glass from Auel maar lake and Ur-luia outcrop compared to data from the Phlegraean Fields [46].
Table A2a.
EPMA results of major elements (in mass percent) of glass from Auel maar lake and Ur-luia outcrop compared to data from the Phlegraean Fields [46].
| Sample ID | Na2O | K2O | Cl | FeO | SiO2 | P2O5 |
|---|---|---|---|---|---|---|
| Urluia (URL) | ||||||
| URL-3.2 | 8.88 | 5.18 | 0.59 | 3.52 | 55.27 | 0.00 |
| URL-5 | 4.29 | 8.42 | 0.39 | 2.72 | 60.47 | 0.07 |
| URL-6.1 | 4.68 | 8.02 | 0.51 | 3.04 | 58.03 | 0.04 |
| URLb_4-3 | 6.04 | 7.60 | 0.64 | 2.76 | 59.26 | 0.06 |
| URL_1-1a | 4.18 | 8.47 | 0.35 | 2.99 | 60.12 | 0.10 |
| Mean* | 5.61 | 7.54 | 0.50 | 3.01 | 58.63 | 0.05 |
| Auel** | 6.18 | 7.24 | 0.49 | 2.65 | 60.01 | 0.08 |
| Phlegraean Fields, c.f. Fedele et al. [46] | ||||||
| Mean*** | 4.53 | 8.42 | 2.84 | 59.78 | 0.20 | |
* Mean Urluia, 5 points; ** Auel (AU-4.1, single point); ***Mean Phlegraean Fields, 38 samples
Table A2b.
EPMA results of major elements (in mass percent) of glass from Auel maar lake and Ur-luia outcrop compared to data from the Phlegraean Fields [46].
Table A2b.
EPMA results of major elements (in mass percent) of glass from Auel maar lake and Ur-luia outcrop compared to data from the Phlegraean Fields [46].
| Sample ID | CaO | MnO | MgO | TiO2 | Al2O3 | Total |
|---|---|---|---|---|---|---|
| Urluia (URL) | ||||||
| URL-3.2 | 1.30 | 0.42 | 0.19 | 0.35 | 22.51 | 98.21 |
| URL-5 | 1.98 | 0.12 | 0.56 | 0.31 | 18.39 | 97.72 |
| URL-6.1 | 2.07 | 0.18 | 0.58 | 0.44 | 17.87 | 95.46 |
| URLb_4-3 | 1.73 | 0.24 | 0.33 | 0.42 | 18.43 | 97.50 |
| URL_1-1a | 2.12 | 0.10 | 0.52 | 0.35 | 18.03 | 97.33 |
| Mean* | 1.84 | 0.21 | 0.44 | 0.37 | 19.05 | 97.25 |
| Auel** | 1.66 | 0.17 | 0.41 | 0.32 | 18.72 | 97.93 |
| Phlegraean Fields, c.f. Fedele et al. [46] | ||||||
| Mean*** | 1.96 | 0.22 | 0.47 | 0.38 | 18.18 | |
* Mean Urluia, 5 points; ** Auel (AU-4.1, single point); ***Mean Phlegraean Fields, 38 samples
Table A3.
Average REE (in ppm and normalized to chondrite) compositions of cpx (LA-ICP-MS da-ta) for samples type Cpx2 [46] from the Phlegraean Fields.
Table A3.
Average REE (in ppm and normalized to chondrite) compositions of cpx (LA-ICP-MS da-ta) for samples type Cpx2 [46] from the Phlegraean Fields.
| Element | Mean Phlegraean Fields11 samples | Chondrite normalized data [60] |
|---|---|---|
| La | 16.18 | 66.16 |
| Ce | 54.09 | 84.80 |
| Pr | 9.82 | 101.88 |
| Nd | 54.82 | 115.70 |
| Sm | 16.22 | 105.31 |
| Eu | 4.68 | 80.71 |
| Gd | 15.32 | 74.98 |
| Tb | 2.05 | 54.86 |
| Dy | 12.25 | 48.19 |
| Ho | 2.08 | 36.75 |
| Er | 5.40 | 32.55 |
| Tm | 0.70 | 27.23 |
| Yb | 4.31 | 26.10 |
| Lu | 0.63 | 24.99 |
Table A4.
Parts of elements in percent from AU3 (69.60 m) compared to data from Urluia.
| Oxides | Green Cpx (AU3, 69.60 m) | Green Cpx (Urluia) |
|---|---|---|
| Na2O | 0.33 | 0.65 |
| SiO2 | 45.52 | 50.98 |
| K2O | 0.02 | 0.02 |
| TiO2 | 2.50 | 0.64 |
| FeO | 6.52 | 9.41 |
| Al2O3 | 7.29 | 2.62 |
| MgO | 13.06 | 12.47 |
| CaO | 24.10 | 22.63 |
| Cr2O3 | 0.14 | 0.07 |
| MnO | 0.10 | 0.74 |
Table A5.
Measurements of REE [µg/g] from AU3 (69.60 m) compared to data from Urluia.
| Element | Green Cpx (AU3, 69.60 m) | Green Cpx (Urluia) |
|---|---|---|
| La | 51.39 | 53.31 |
| Ce | 67.97 | 73.85 |
| Pr | 70.77 | 86.54 |
| Nd | 67.60 | 93.42 |
| Sm | 43.96 | 82.34 |
| Eu | 34.06 | 68.42 |
| Gd | 24.87 | 57.81 |
| Tb | 15.03 | 44.94 |
| Dy | 12.40 | 38.65 |
| Ho | 8.55 | 29.10 |
| Er | 6.59 | 25.18 |
| Tm | 5.04 | 19.30 |
| Yb | 5.61 | 20.30 |
| Lu | 4.65 | 16.58 |
References
- Sirocko, F.; Krebsbach, F.; Albert, J.; Britzius, S.; Schenk, F.; Förster, M.W. Relation between the Central European Climate Change and the Eifel Volcanism during the Last 130,000 Years: The ELSA-23 Tephra Stack. Quaternary, submitted.
- Sirocko, F.; Knapp, H.; Dreher, F.; Förster, M.W.; Albert, J.; Brunck, H.; Veres, D.; Dietrich, S.; Zech, M.; Hambach, U.; et al. The ELSA-Vegetation-Stack: Reconstruction of Landscape Evolution Zones (LEZ) from Laminated Eifel Maar Sediments of the Last 60,000 Years. Global and Planetary Change 2016, 142, 108–135. [Google Scholar] [CrossRef]
- Silleni, A.; Giordano, G.; Isaia, R.; Ort, M.H. The Magnitude of the 39.8 Ka Campanian Ignimbrite Eruption, Italy: Method, Uncertainties and Errors. Front. Earth Sci. 2020, 8, 543399. [Google Scholar] [CrossRef]
- Pabst, S.; Wörner, G.; Civetta, L.; Tesoro, R. Magma Chamber Evolution Prior to the Campanian Ignimbrite and Neapolitan Yellow Tuff Eruptions (Campi Flegrei, Italy). Bull Volcanol 2008, 70, 961–976. [Google Scholar] [CrossRef]
- Fisher, R.V.; Schmincke, H.-U. Pyroclastic Rocks; Springer Science & Business Media, 2012. [Google Scholar]
- Fedele, F.G.; Giaccio, B.; Isaia, R.; Orsi, G. The Campanian Ignimbrite Eruption, Heinrich Event 4, and Palaeolithic Change in Europe: A High-Resolution Investigation. Geophysical Monograph Series 2003, 139, 301–325. [Google Scholar] [CrossRef]
- Fisher, R.V.; Orsi, G.; Ort, M.; Heiken, G. Mobility of a Large-Volume Pyroclastic Flow — Emplacement of the Campanian Ignimbrite, Italy. Journal of Volcanology and Geothermal Research 1993, 56, 205–220. [Google Scholar] [CrossRef]
- Giaccio, B.; Hajdas, I.; Isaia, R.; Deino, A.; Nomade, S. High-Precision 14C and 40Ar/39Ar Dating of the Campanian Ignimbrite (Y-5) Reconciles the Time-Scales of Climatic-Cultural Processes at 40 Ka. Sci Rep 2017, 7, 45940. [Google Scholar] [CrossRef] [PubMed]
- Thunell, R.; Federman, A.; Sparks, S.; Williams, D. The Age, Origin, and Volcanological Significance of the Y-5 Ash Layer in the Mediterranean. Quat. res. 1979, 12, 241–253. [Google Scholar] [CrossRef]
- De Vivo, B.; Rolandi, G.; Gans, P.B.; Calvert, A.; Bohrson, W.A.; Spera, F.J.; Belkin, H.E. New Constraints on the Pyroclastic Eruptive History of the Campanian Volcanic Plain (Italy). Mineralogy and Petrology 2001, 73, 47–65. [Google Scholar] [CrossRef]
- Lin, J.; Svensson, A.; Hvidberg, C.S.; Lohmann, J.; Kristiansen, S.; Dahl-Jensen, D.; Steffensen, J.P.; Rasmussen, S.O.; Cook, E.; Kjær, H.A.; et al. Magnitude, Frequency and Climate Forcing of Global Volcanism during the Last Glacial Period as Seen in Greenland and Antarctic Ice Cores (60–9 Ka). Clim. Past 2022, 18, 485–506. [Google Scholar] [CrossRef]
- Paterne, M.; Kallel, N.; Labeyrie, L.; Vautravers, M.; Duplessy, J.; Rossignol-Strick, M.; Cortijo, E.; Arnold, M.; Fontugne, M. Hydrological Relationship between the North Atlantic Ocean and the Mediterranean Sea during the Past 15-75 Kyr. Paleoceanography 1999, 14, 626–638. [Google Scholar] [CrossRef]
- Ton-That, T.; Singer, B.; Paterne, M. 40Ar/39Ar Dating of Latest Pleistocene (41 Ka) Marine Tephra in the Mediterranean Sea: Implications for Global Climate Records. Earth and Planetary Science Letters 2001, 184, 645–658. [Google Scholar] [CrossRef]
- Veres, D.; Lane, C.S.; Timar-Gabor, A.; Hambach, U.; Constantin, D.; Szakács, A.; Fülling, A.; Onac, B.P. The Campanian Ignimbrite/Y5 Tephra Layer – A Regional Stratigraphic Marker for Isotope Stage 3 Deposits in the Lower Danube Region, Romania. Quaternary International 2013, 293, 22–33. [Google Scholar] [CrossRef]
- Giaccio, B.; Isaia, R.; Fedele, F.G.; Di Canzio, E.; Hoffecker, J.; Ronchitelli, A.; Sinitsyn, A.A.; Anikovich, M.; Lisitsyn, S.N.; Popov, V.V. The Campanian Ignimbrite and Codola Tephra Layers: Two Temporal/Stratigraphic Markers for the Early Upper Palaeolithic in Southern Italy and Eastern Europe. Journal of Volcanology and Geothermal Research 2008, 177, 208–226. [Google Scholar] [CrossRef]
- Narcisi, B. Tephrochronology of a Late Quaternary Lacustrine Record from the Monticchio Maar (Vulture Volcano, Southern Italy). Quaternary Science Reviews 1996, 15, 155–165. [Google Scholar] [CrossRef]
- Keller, J.; Ryan, W.B.F.; Ninkovich, D.; Altherr, R. Explosive Volcanic Activity in the Mediterranean over the Past 200,000 Yr as Recorded in Deep-Sea Sediments. Geol Soc America Bull 1978, 89, 591. [Google Scholar] [CrossRef]
- Fedele, L.; Scarpati, C.; Sparice, D.; Perrotta, A.; Laiena, F. A Chemostratigraphic Study of the Campanian Ignimbrite Eruption (Campi Flegrei, Italy): Insights on Magma Chamber Withdrawal and Deposit Accumulation as Revealed by Compositionally Zoned Stratigraphic and Facies Framework. Journal of Volcanology and Geothermal Research 2016, 324, 105–117. [Google Scholar] [CrossRef]
- Scarpati, C.; Perrotta, A. Stratigraphy and Physical Parameters of the Plinian Phase of the Campanian Ignimbrite Eruption. Geological Society of America Bulletin 2016, 128, 1147–1159. [Google Scholar] [CrossRef]
- Smith, V.C.; Isaia, R.; Engwell, S.L.; Albert, Paul. G. Tephra Dispersal during the Campanian Ignimbrite (Italy) Eruption: Implications for Ultra-Distal Ash Transport during the Large Caldera-Forming Eruption. Bull Volcanol 2016, 78, 45. [Google Scholar] [CrossRef]
- Civetta, L.; Orsi, G.; Pappalardo, L.; Fisher, R.V.; Heiken, G.; Ort, M. Geochemical Zoning, Mingling, Eruptive Dynamics and Depositional Processes — the Campanian Ignimbrite, Campi Flegrei Caldera, Italy. Journal of Volcanology and Geothermal Research 1997, 75, 183–219. [Google Scholar] [CrossRef]
- Engwell, S.L.; Sparks, R.S.J.; Carey, S. Physical Characteristics of Tephra Layers in the Deep Sea Realm: The Campanian Ignimbrite Eruption. SP 2014, 398, 47–64. [Google Scholar] [CrossRef]
- Fedele, F.G.; Giaccio, B.; Hajdas, I. Timescales and Cultural Process at 40,000 BP in the Light of the Campanian Ignimbrite Eruption, Western Eurasia. Journal of Human Evolution 2008, 55, 834–857. [Google Scholar] [CrossRef] [PubMed]
- Fitzsimmons, K.E.; Hambach, U.; Veres, D.; Iovita, R. The Campanian Ignimbrite Eruption: New Data on Volcanic Ash Dispersal and Its Potential Impact on Human Evolution. PLoS ONE 2013, 8, e65839. [Google Scholar] [CrossRef] [PubMed]
- Nowaczyk, N.R.; Arz, H.W.; Frank, U.; Kind, J.; Plessen, B. Dynamics of the Laschamp Geomagnetic Excursion from Black Sea Sediments. Earth and Planetary Science Letters 2012, 351–352, 54–69. [Google Scholar] [CrossRef]
- Wacha, L. Luminescence Dating of Loess from the Island of Susak in the Northern Adriatic Sea and the “Gorjanović Loess Section” from Vukovar in Eastern Croatia, Freie Universität Berlin, 2011.
- Tsanova, T.; Veres, D.; Hambach, U.; Spasov, R.; Dimitrova, I.; Popov, P.; Talamo, S.; Sirakova, S. Upper Palaeolithic Layers and Campanian Ignimbrite/Y-5 Tephra in Toplitsa Cave, Northern Bulgaria. Journal of Archaeological Science: Reports 2021, 37, 102912. [Google Scholar] [CrossRef]
- Masotta, M.; Mollo, S.; Freda, C.; Gaeta, M.; Moore, G. Clinopyroxene–Liquid Thermometers and Barometers Specific to Alkaline Differentiated Magmas. Contrib Mineral Petrol 2013, 166, 1545–1561. [Google Scholar] [CrossRef]
- Tomlinson, E.L.; Smith, V.C.; Albert, P.G.; Aydar, E.; Civetta, L.; Cioni, R.; Çubukçu, E.; Gertisser, R.; Isaia, R.; Menzies, M.A.; et al. The Major and Trace Element Glass Compositions of the Productive Mediterranean Volcanic Sources: Tools for Correlating Distal Tephra Layers in and around Europe. Quaternary Science Reviews 2015, 118, 48–66. [Google Scholar] [CrossRef]
- Thiery, F.; Schenk, F. Modelling of Uncertainty in Geo Sciences Sites. Squirrel Papers 2023, 5(1), #4. [CrossRef]
- Thiery, F.; Schenk, F. CI Site Instances Collection. Squirrel Papers 2023, Research Squirrel Engineers, via @campanian-ignimbrite-geo, https://research-squirrel-engineers.github.io/campanian-ignimbrite-geo/Site_collection/index.html.
- Thiery, F.; Schenk, F. Campanian Ignimbrite Geo Locations. Squirrel Papers 2023, 5(2), #2. [CrossRef]
- Thiery, F.; Schenk, F.; Baars, S. Dealing with Doubts: Site Georeferencing in Archaeology and in the Geosciences. Squirrel Papers 2023, 5(1), #6. [CrossRef]
- Thiery, F. Semantic Modelling Using LOD Techniques of Uncertainty, Vagueness and Ambiguities in the Archaeological Domain. Squirrel Papers 2023, 5(5), #3. [CrossRef]
- Obreht, I.; Zeeden, C.; Hambach, U.; Veres, D.; Marković, S.B.; Bösken, J.; Svirčev, Z.; Bačević, N.; Gavrilov, M.B.; Lehmkuhl, F. Tracing the Influence of Mediterranean Climate on Southeastern Europe during the Past 350,000 Years. Sci Rep 2016, 6, 36334. [Google Scholar] [CrossRef]
- Marković, S.B.; Stevens, T.; Kukla, G.J.; Hambach, U.; Fitzsimmons, K.E.; Gibbard, P.; Buggle, B.; Zech, M.; Guo, Z.; Hao, Q.; et al. Danube Loess Stratigraphy — Towards a Pan-European Loess Stratigraphic Model. Earth-Science Reviews 2015, 148, 228–258. [Google Scholar] [CrossRef]
- Deino, A.L.; Orsi, G.; De Vita, S.; Piochi, M. The Age of the Neapolitan Yellow Tuff Caldera-Forming Eruption (Campi Flegrei Caldera – Italy) Assessed by 40Ar/39Ar Dating Method. Journal of Volcanology and Geothermal Research 2004, 133, 157–170. [Google Scholar] [CrossRef]
- Schmidt, R.; Van Den Bogaard, C.; Merkt, J.; Müller, J. A New Lateglacial Chronostratigraphic Tephra Marker for the South-Eastern Alps: The Neapolitan Yellow Tuff (NYT) in Längsee (Austria) in the Context of a Regional Biostratigraphy and Palaeoclimate. Quaternary International 2002, 88, 45–56. [Google Scholar] [CrossRef]
- Sirocko, F.; Seelos, K.; Schaber, K.; Rein, B.; Dreher, F.; Diehl, M.; Lehne, R.; Jäger, K.; Krbetschek, M.; Degering, D. A Late Eemian Aridity Pulse in Central Europe during the Last Glacial Inception. Nature 2005, 436, 833–836. [Google Scholar] [CrossRef] [PubMed]
- Sirocko, F.; Dietrich, S.; Veres, D.; Grootes, P.M.; Schaber-Mohr, K.; Seelos, K.; Nadeau, M.-J.; Kromer, B.; Rothacker, L.; Röhner, M.; et al. Multi-Proxy Dating of Holocene Maar Lakes and Pleistocene Dry Maar Sediments in the Eifel, Germany. Quaternary Science Reviews 2013, 62, 56–76. [Google Scholar] [CrossRef]
- Sirocko, F.; Martínez-García, A.; Mudelsee, M.; Albert, J.; Britzius, S.; Christl, M.; Diehl, D.; Diensberg, B.; Friedrich, R.; Fuhrmann, F.; et al. Muted Multidecadal Climate Variability in Central Europe during Cold Stadial Periods. Nat. Geosci. 2021, 14, 651–658. [Google Scholar] [CrossRef]
- Albert, J.; Sirocko, F. Evidence for an Extreme Cooling Event Prior to the Laschamp Geomagnetic Excursion in Eifel Maar Sediments. Quaternary 2023, 6, 14. [Google Scholar] [CrossRef]
- Thiery, F.; Schenk, F. How to Locate the Campanian Ignimbrite Site Urluia Based on Literature? How to Provide and Publish This Data in a FAIR Way? Squirrel Papers 2023, 5(1), #5. [CrossRef]
- Thiery, F.; Schenk, F. CI Site 52: Urluia (Romania). Squirrel Papers 2023, Research Squirrel Engineers, via @campanian-ignimbrite-geo, http://fuzzy-sl.squirrel.link/data/cisite_52. /.
- Obreht, I.; Hambach, U.; Veres, D.; Zeeden, C.; Bösken, J.; Stevens, T.; Marković, S.B.; Klasen, N.; Brill, D.; Burow, C.; et al. Shift of Large-Scale Atmospheric Systems over Europe during Late MIS 3 and Implications for Modern Human Dispersal. Sci Rep 2017, 7, 5848. [Google Scholar] [CrossRef]
- Fedele, L.; Zanetti, A.; Morra, V.; Lustrino, M.; Melluso, L.; Vannucci, R. Clinopyroxene/Liquid Trace Element Partitioning in Natural Trachyte–Trachyphonolite Systems: Insights from Campi Flegrei (Southern Italy). Contrib Mineral Petrol 2009, 158, 337–356. [Google Scholar] [CrossRef]
- Rein, B.; Sirocko, F. In-Situ Reflectance Spectroscopy - Analysing Techniques for High-Resolution Pigment Logging in Sediment Cores. International Journal of Earth Sciences 2002, 91, 950–954. [Google Scholar] [CrossRef]
- Reed, S.J.B. Electron Microprobe Analysis and Scanning Electron Microscopy in Geology, 2nd ed.; Camebridge University Press, 2005. [Google Scholar]
- Prelević, D.; Akal, C.; Romer, R.L.; Mertz-Kraus, R.; Helvac, C. Magmatic Response to Slab Tearing: Constraints from the Afyon Alkaline Volcanic Complex, Western Turkey. Journal of Petrology 2015, 56, 527–562. [Google Scholar] [CrossRef]
- Günther, D.; Frischknecht, R.; Heinrich, C.A.; Kahlert, H.-J. Capabilities of an Argon Fluoride 193 Nm Excimer Laser for Laser Ablation Inductively Coupled Plasma Mass Spectometry Microanalysis of Geological Materials. J. Anal. At. Spectrom. 1997, 12, 939–944. [Google Scholar] [CrossRef]
- Jochum, K.P.; Weis, U.; Stoll, B.; Kuzmin, D.; Yang, Q.; Raczek, I.; Jacob, D.E.; Stracke, A.; Birbaum, K.; Frick, D.A.; et al. Determination of Reference Values for NIST SRM 610–617 Glasses Following ISO Guidelines. Geostandard Geoanalytic Res 2011, 35, 397–429. [Google Scholar] [CrossRef]
- Longerich, H.P.; Jackson, S.E.; Günther, D. Inter-Laboratory Note. Laser Ablation Inductively Coupled Plasma Mass Spectrometric Transient Signal Data Acquisition and Analyte Concentration Calculation. J. Anal. At. Spectrom. 1996, 11, 899–904. [Google Scholar] [CrossRef]
- Richter, T.O.; Van Der Gaast, S.; Koster, B.; Vaars, A.; Gieles, R.; De Stigter, H.C.; De Haas, H.; Van Weering, T.C.E. The Avaatech XRF Core Scanner: Technical Description and Applications to NE Atlantic Sediments. SP 2006, 267, 39–50. [Google Scholar] [CrossRef]
- Berglund, B.E.; Ralska-Jasiewiczowa, M. Pollen Analysis and Pollen Diagrams. In Handbook of Holocene Palaoecology and Palaeohydrology; 1986; pp. 455–484. [Google Scholar]
- Fægri, K.; Iversen, J. Textbook of Pollen Analysis; 4th ed.; 1989.
- Britzius, S.; Dreher, F.; Maisel, P.; Sirocko, F. Vegetation Patterns during the Last 132,000 Years from Sediment Cores from Six Eifel Maars: The ELSA Stack 24 Pollen. Quaternary, submitted.
- Kendrick, J.E.; Lavallée, Y.; Mariani, E.; Dingwell, D.B.; Wheeler, J.; Varley, N.R. Crystal Plasticity as an Indicator of the Viscous-Brittle Transition in Magmas. Nat Commun 2017, 8, 1926. [Google Scholar] [CrossRef] [PubMed]
- Arbaret, L.; Bystricky, M.; Champallier, R. Microstructures and Rheology of Hydrous Synthetic Magmatic Suspensions Deformed in Torsion at High Pressure. J. Geophys. Res. 2007, 112, 2006JB004856. [Google Scholar] [CrossRef]
- Wulf, S.; Hardiman, M.J.; Staff, R.A.; Koutsodendris, A.; Appelt, O.; Blockley, S.P.E.; Lowe, J.J.; Manning, C.J.; Ottolini, L.; Schmitt, A.K.; et al. The Marine Isotope Stage 1–5 Cryptotephra Record of Tenaghi Philippon, Greece: Towards a Detailed Tephrostratigraphic Framework for the Eastern Mediterranean Region. Quaternary Science Reviews 2018, 186, 236–262. [Google Scholar] [CrossRef]
- Evensen, N.M.; Hamilton, P.J.; O’Nions, R.K. Rare-Earth Abundances in Chondritic Meteorites. Geochimica et Cosmochimica Acta 1978, 42, 1199–1212. [Google Scholar] [CrossRef]
- Fedele, L.; Scarpati, C.; Lanphere, M.; Melluso, L.; Morra, V.; Perrotta, A.; Ricci, G. The Breccia Museo Formation, Campi Flegrei, Southern Italy: Geochronology, Chemostratigraphy and Relationship with the Campanian Ignimbrite Eruption. Bull Volcanol 2008, 70, 1189–1219. [Google Scholar] [CrossRef]
- Rasmussen, S.O.; Bigler, M.; Blockley, S.P.; Blunier, T.; Buchardt, S.L.; Clausen, H.B.; Cvijanovic, I.; Dahl-Jensen, D.; Johnsen, S.J.; Fischer, H.; et al. A Stratigraphic Framework for Abrupt Climatic Changes during the Last Glacial Period Based on Three Synchronized Greenland Ice-Core Records: Refining and Extending the INTIMATE Event Stratigraphy. Quaternary Science Reviews 2014, 106, 14–28. [Google Scholar] [CrossRef]
- Meyerhöfer, M. Plankton-Pigmente Und Deren Abbauprodukte Als Biomarker Zur Beschreibung Und Abschätzung Der Phytoplankton-Sukzession Und -Sedimentation Im Nordatlantik. Berichte aus dem Institut für Meereskunde an der Christian-Albrechts-Universität Kiel 1994, 251. [Google Scholar]
- Albert, J.; Zander, P.; Grosjean, M.; Sirocko, F. Fine-Tuning of Sub-Annual Resolution Spectral Index Time Series from Eifel Maar Sediments, Western Germany, to the NGRIP 3 δ18O Chronology, 26–60 Ka. Quaternary, submitted.
- Costa, A.; Folch, A.; Macedonio, G.; Giaccio, B.; Isaia, R.; Smith, V.C. Quantifying Volcanic Ash Dispersal and Impact of the Campanian Ignimbrite Super-eruption. Geophysical Research Letters 2012, 39, 2012GL051605. [Google Scholar] [CrossRef]
- Martrat, B.; Grimalt, J.O.; Shackleton, N.J.; de Abreu, L.; Hutterli, M.A.; Stocker, T.F. Four Climate Cycles of Recurring Deep and Surface Water Destabilizations on the Iberian Margin. Science 2007, 317, 502–507. [Google Scholar] [CrossRef] [PubMed]
- Berger, A.; Loutre, M.F. Insolation Values for the Climate of the Last 10 Million Years. Quaternary Science Reviews 1991, 10, 297–317. [Google Scholar] [CrossRef]
- Korte, M.; Brown, M.C.; Panovska, S.; Wardinski, I. Robust Characteristics of the Laschamp and Mono Lake Geomagnetic Excursions: Results From Global Field Models. Front. Earth Sci. 2019, 7, 86. [Google Scholar] [CrossRef]
- Muscheler, R.; Beer, J.; Kubik, P.W.; Synal, H.-A. Geomagnetic Field Intensity during the Last 60,000 Years Based on 10Be and 36Cl from the Summit Ice Cores and 14C. Quaternary Science Reviews 2005, 24, 1849–1860. [Google Scholar] [CrossRef]
Disclaimer/Publisher’s Note: The statements, opinions and data contained in all publications are solely those of the individual author(s) and contributor(s) and not of MDPI and/or the editor(s). MDPI and/or the editor(s) disclaim responsibility for any injury to people or property resulting from any ideas, methods, instructions or products referred to in the content. |
© 2023 by the authors. Licensee MDPI, Basel, Switzerland. This article is an open access article distributed under the terms and conditions of the Creative Commons Attribution (CC BY) license (http://creativecommons.org/licenses/by/4.0/).
Copyright: This open access article is published under a Creative Commons CC BY 4.0 license, which permit the free download, distribution, and reuse, provided that the author and preprint are cited in any reuse.


