Submitted:
19 December 2023
Posted:
20 December 2023
You are already at the latest version
Abstract
Multiple sources influence air quality and regional climate in complicated atmospheric emission situations like urban agglomerations. To resolve pollution plumes and source influences in polluted areas, a comprehensive chemical fingerprinting of sources utilizing non-methane hydrocarbons (NMHCs) and the identification of acceptable tracer molecules and emission ratios is required, in contrast to pristine locations, where reliance on a single or a few chemical tracers is frequently sufficient. We have characterized the prevalence of NMHCs fingerprints in the urban areas and quantified the correlation of windspeed with the concentration of these pollutants. eNose sensors and Air quality management stations provide the data to identify the emission sources of such pollutants. Based on our analysis, the average NMHC concentration in 2021 has been recorded 0.424 ppm at point 1 AQMS whereas at point 2 AQMS it was 0.256 ppm. Such outcomes could be attributed to the proximity of emissions sources, the direction and speed of the wind, or both. Moreover, traffic can be a major contributor to pollution levels in any urban area. More research based on a larger dataset is required before definitive conclusions can be drawn, and viable solutions can be proposed.
Keywords:
eNose
; Volatile organic compound
; non-methane hydrocarbons
; pollution
; Air quality monitoring station
; UAE
Introduction:
Volatile organic compounds (VOC) are the common term for hydrocarbon emissions, measured as non-methane hydrocarbons (NMHC). NMHC are an important class of VOC that affect atmospheric chemistry and contribute to the formation of secondary organic aerosols and tropospheric ozone (O3). Ozone at ground level is a primary focus of air quality regulations due to its impact on air quality, human health, and climate. There is a plethora of pyrogenic, anthropogenic and biogenic sources of the production of NMHC. In urban areas, vehicle emissions, industrial emissions, and fugitive solvent evaporation are the primary sources of anthropogenic emissions (Kumar et al., 2020). An estimated 169 megatonne of NMHC are released into the atmosphere annually as a result of anthropogenic activities (Bourtsoukidis et al., 2020). Additionally, marine transportation is a potential source of NMHC because it results in more emissions per ton-kilometre travelled than land-based modes of transportation. Evaporation during tanker loading operations accounts for fifty percent of all NMHC emissions produced by shipping. NMHC can trigger respiratory tract allergies, especially the eyes, nose, and throat. Short-term effects include irritability and restlessness, while long-term effects include damage to the liver and other organs (Boon, 2007).
Toxic chemical contamination in the environment has become a major concern for both developed and developing countries in the modern world. Rapid advancements in IoT and sensor technology, including electronic nose, have sparked a renewed interest in air quality monitoring. Many electronic systems have been developed for the detection and identification of odours, flavours, and the analysis of volatile organic compounds; these systems are commonly referred to as "eNose" systems. These systems use an array of chemical gas sensors and pattern recognition to mimic the human sense of smell (Figure 1) (Bambang Dwi Kuncoro et al., 2012). eNoses can be used to detect the presence of reactive trace gases in industrial gas emissions. Since the released trace gases may have some odorous content, the eNose can detect the presence of industrial odours in the atmosphere (Bootsma et al., 2014).Through a wireless data communications link, the eNoses are connected to a remote computer system, where special software can interpret the signals in real time.
This study focused on assessing the prevalence of NMHC signatures in metropolitan areas and evaluating the association of windspeed with the concentration of these pollutants. eNose sensors and air quality management stations offer the data necessary to identify the origin of the pollutants that are being emitted.
Materials and methods
Data collection and analysis
The data has been collected from multiple sources, including point 1 AQMS and eNose data. For continuous monitoring of air quality and environmental odours, there are applied 86 fixed eNoses from Comon Invent company, covering the industrial zone and several residential areas in Fujairah, while another 7 wind vanes and 2 mobile eNoses are stationed in close proximity to the point 1 and point 2 air quality monitoring stations (AQMS) (Comon Invent,). All AQMS and eNose networks are owned and operated by Fujairah Environment Authority (FEA). FEA has provided related data for the study.
NMHC concentration, wind direction and wind speed data retrieval from point 1 AQMS
Point 1 AQMS is located near to both residential and commercial. Measurements were taken hourly during the day and night in 2021 for NMHC concentrations in ppm, wind direction in degrees, and wind speed in metres per second.
Data retrieval from eNose sensors
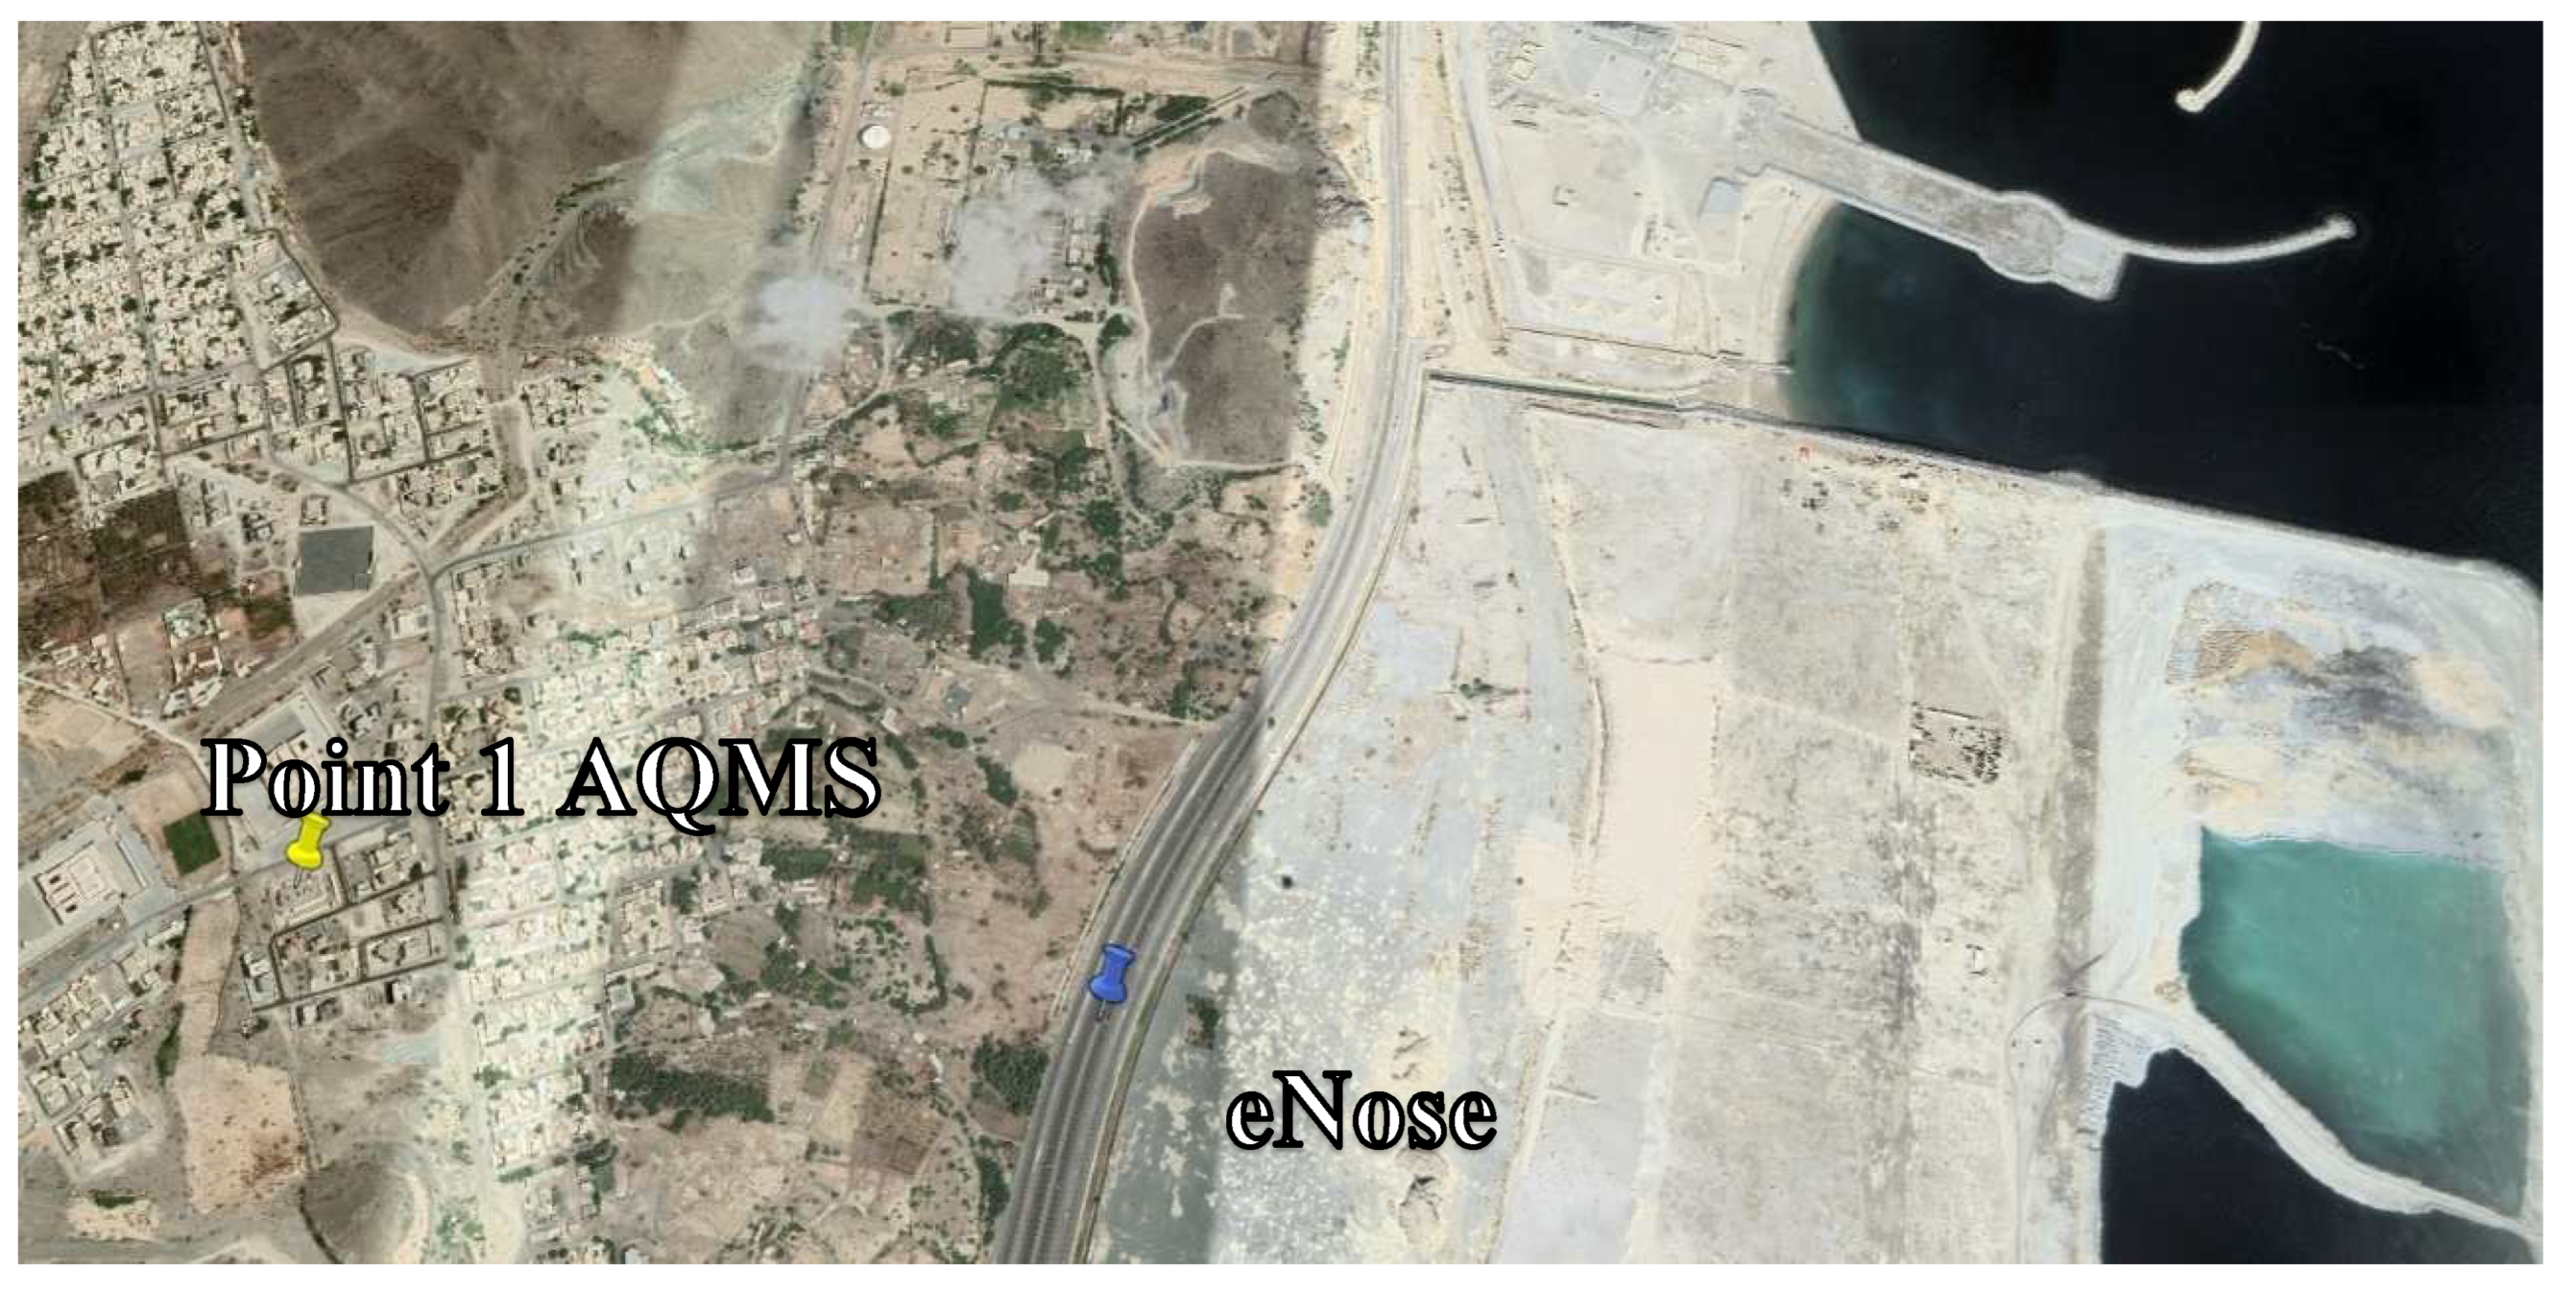
Considering the position of point 1 AQMS and the prevailing winds, a suitable site was found for the eNose sensors. The readings from every eNose sensor have been collected in decibel unit (dB) for 2021 (Comon Invent, n.d.). Measurements from point 1 AQMS data and the eNose data have been averaged over the course of an hour using Python programming. The eNose provides readings on a minute-by-minute basis (Google Colab , 2014).
Figure 2.
Location of point 1 AQMS and eNose using Google Earth Pro.
Results:
Comparison between wind direction and the NMHC concentrations
Measurements taken by Point 1 AQMS reveal a correlation between the prevailing wind direction and the highest 100 values of NMHC concentration in ppm (Figure 3). The wind direction ranges between 0 and 350 degrees. Most of the largest concentrations of NMHC, as seen in Figure 3, are found in the southeast. NMHC concentrations peak at 21.22 ppm when the wind is blowing at 130 degrees (southeast).
Comparison between eNose and Point 1 AQMS measurements.
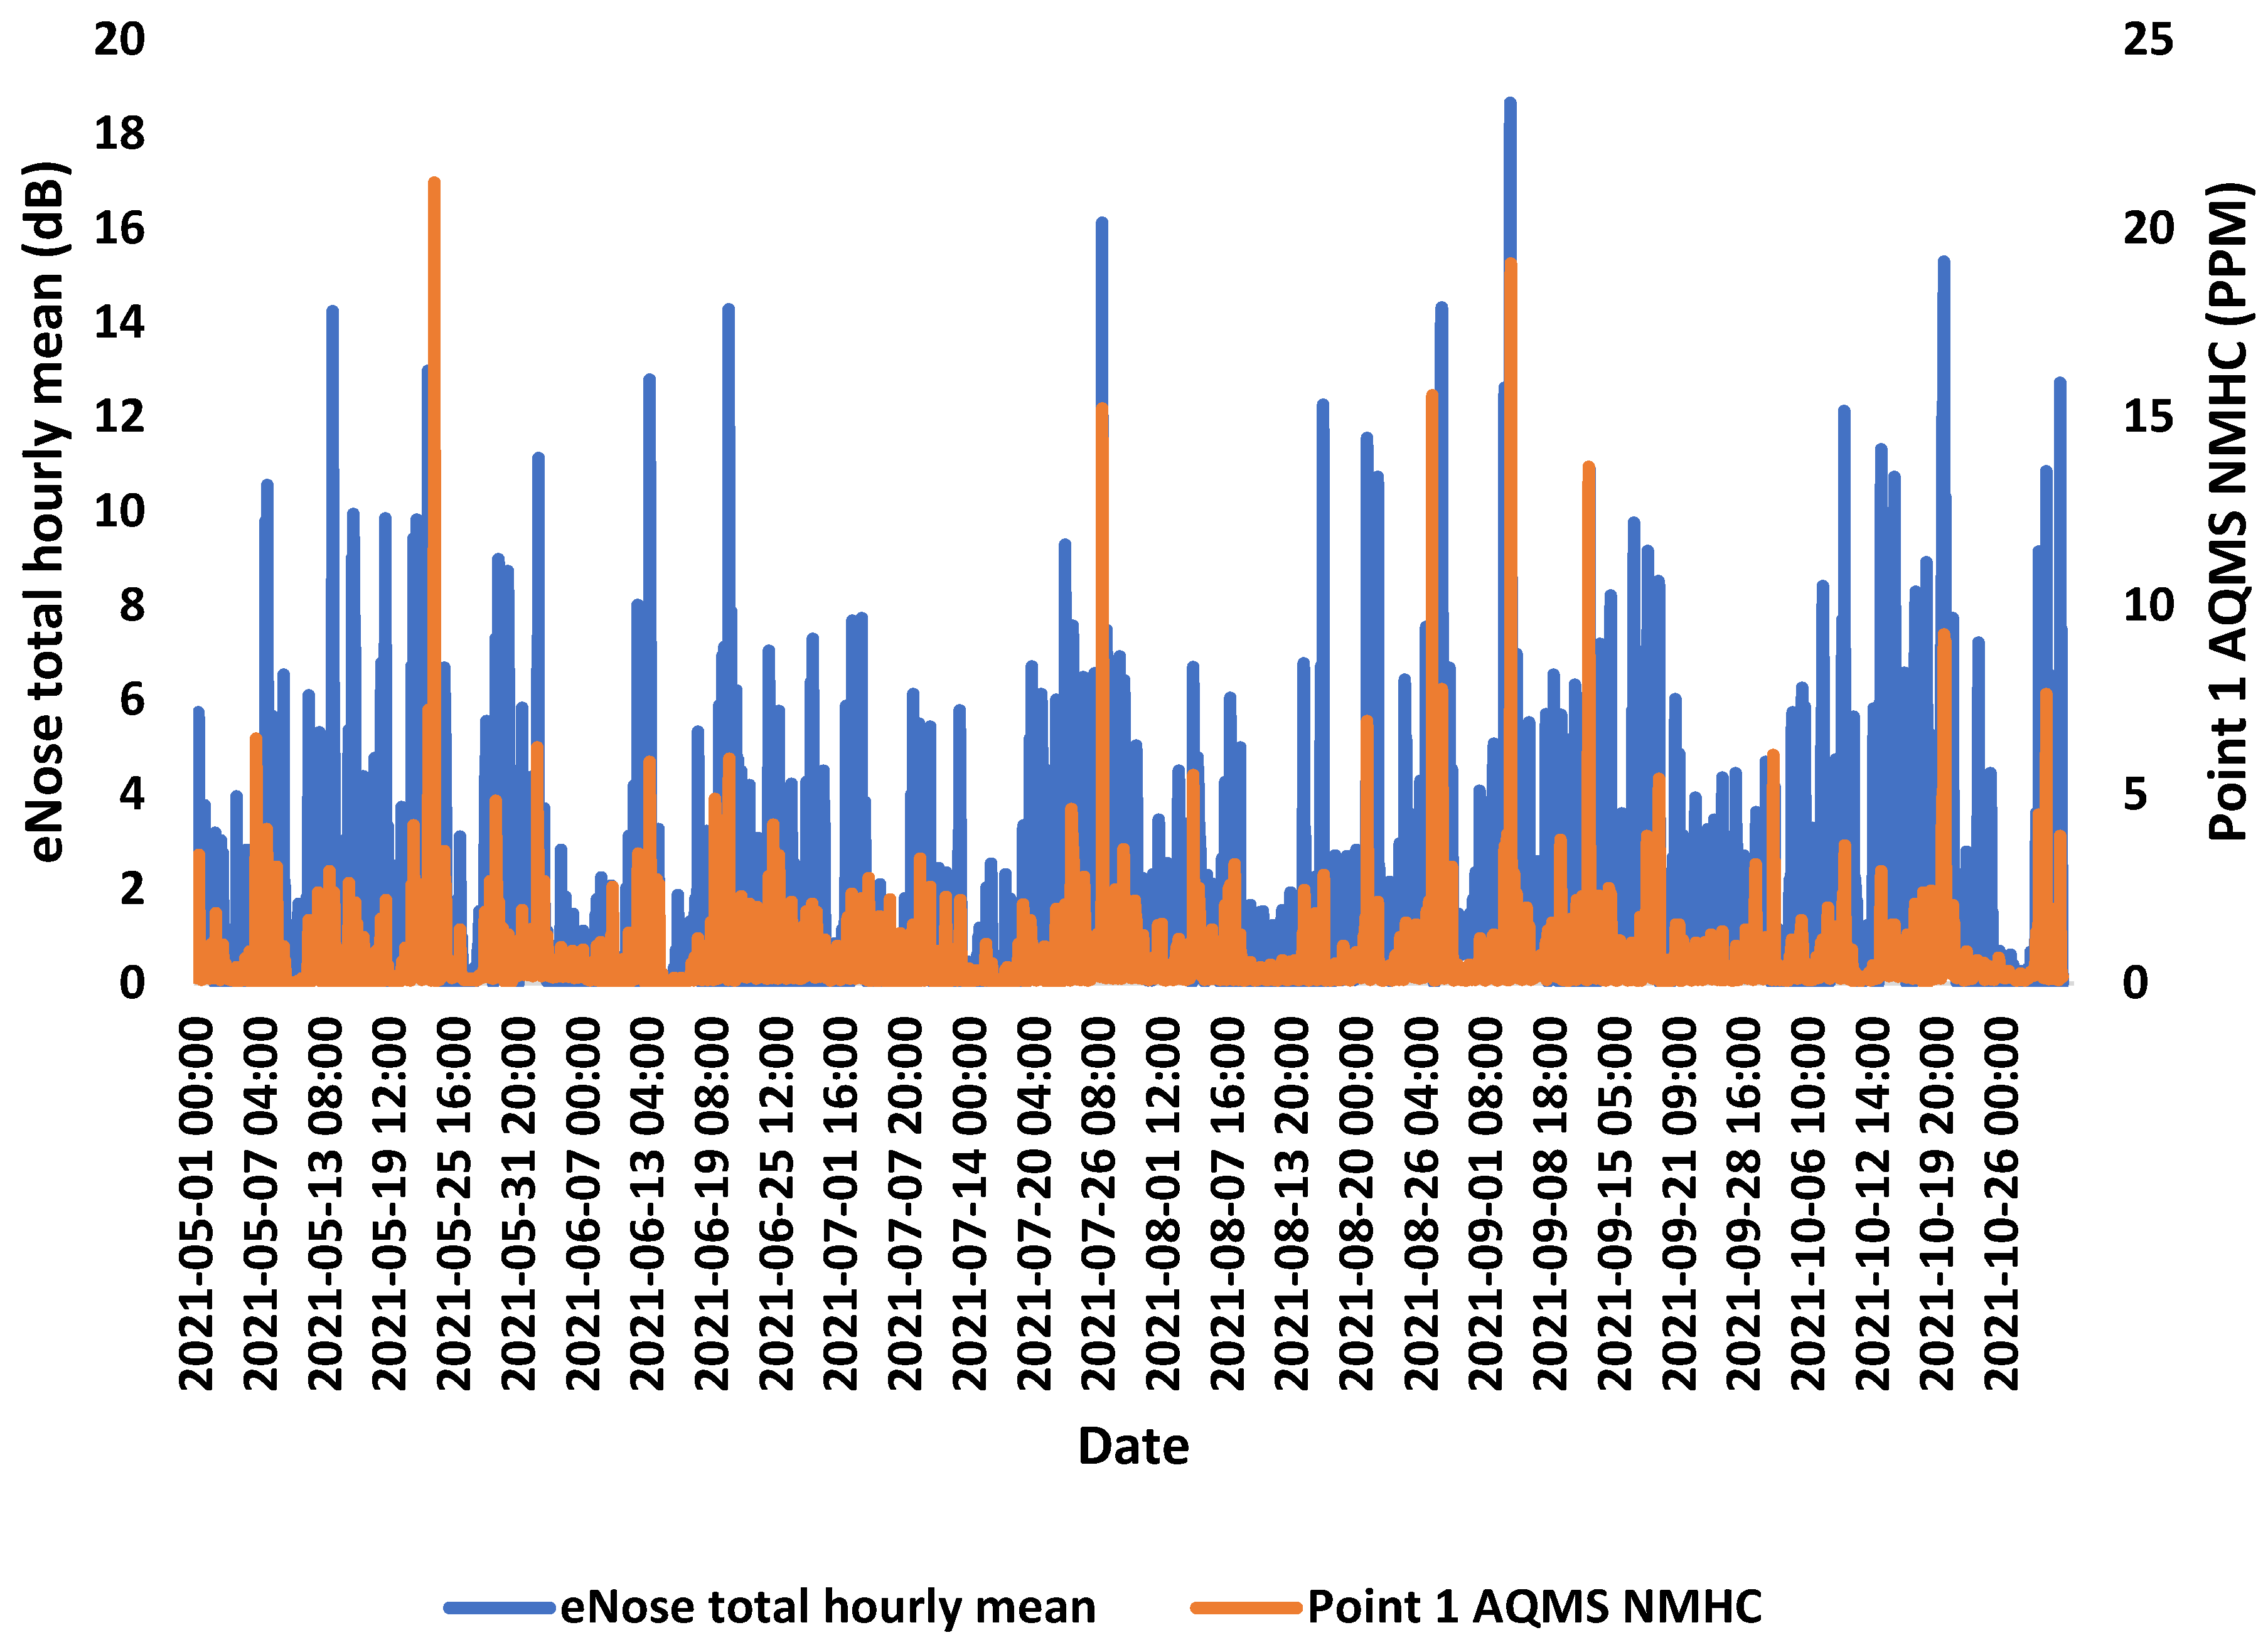
Similarities in pattern between eNose sensor sums in decibel units and NMHC concentrations in parts per million (ppm) from point 1 AQMS between May 2021 and October 2021 were observed for various dates. The NMHC content may occasionally peak while the eNose does not. The highest NMHC content was recorded at 21.22 ppm at 10:00 PM on May 23, 2021, whereas the highest overall eNose sensor dB reading was recorded at 18.6675 dB at 8:00 PM on September 3, 2021 (Figure 4). In general, more extreme values or peaks were observed at night.
Figure 4.
The total hourly mean noise level measured by the eNose sensor (blue line) is plotted against the NMHC concentration in ppm measured by point 1 AQMS (orange line) during the months of May through October 2021 (on the horizontal axis).
Figure 4.
The total hourly mean noise level measured by the eNose sensor (blue line) is plotted against the NMHC concentration in ppm measured by point 1 AQMS (orange line) during the months of May through October 2021 (on the horizontal axis).
Comparison between wind speed vs. point 1 AQMS measurements and wind speed vs. eNose sensor data
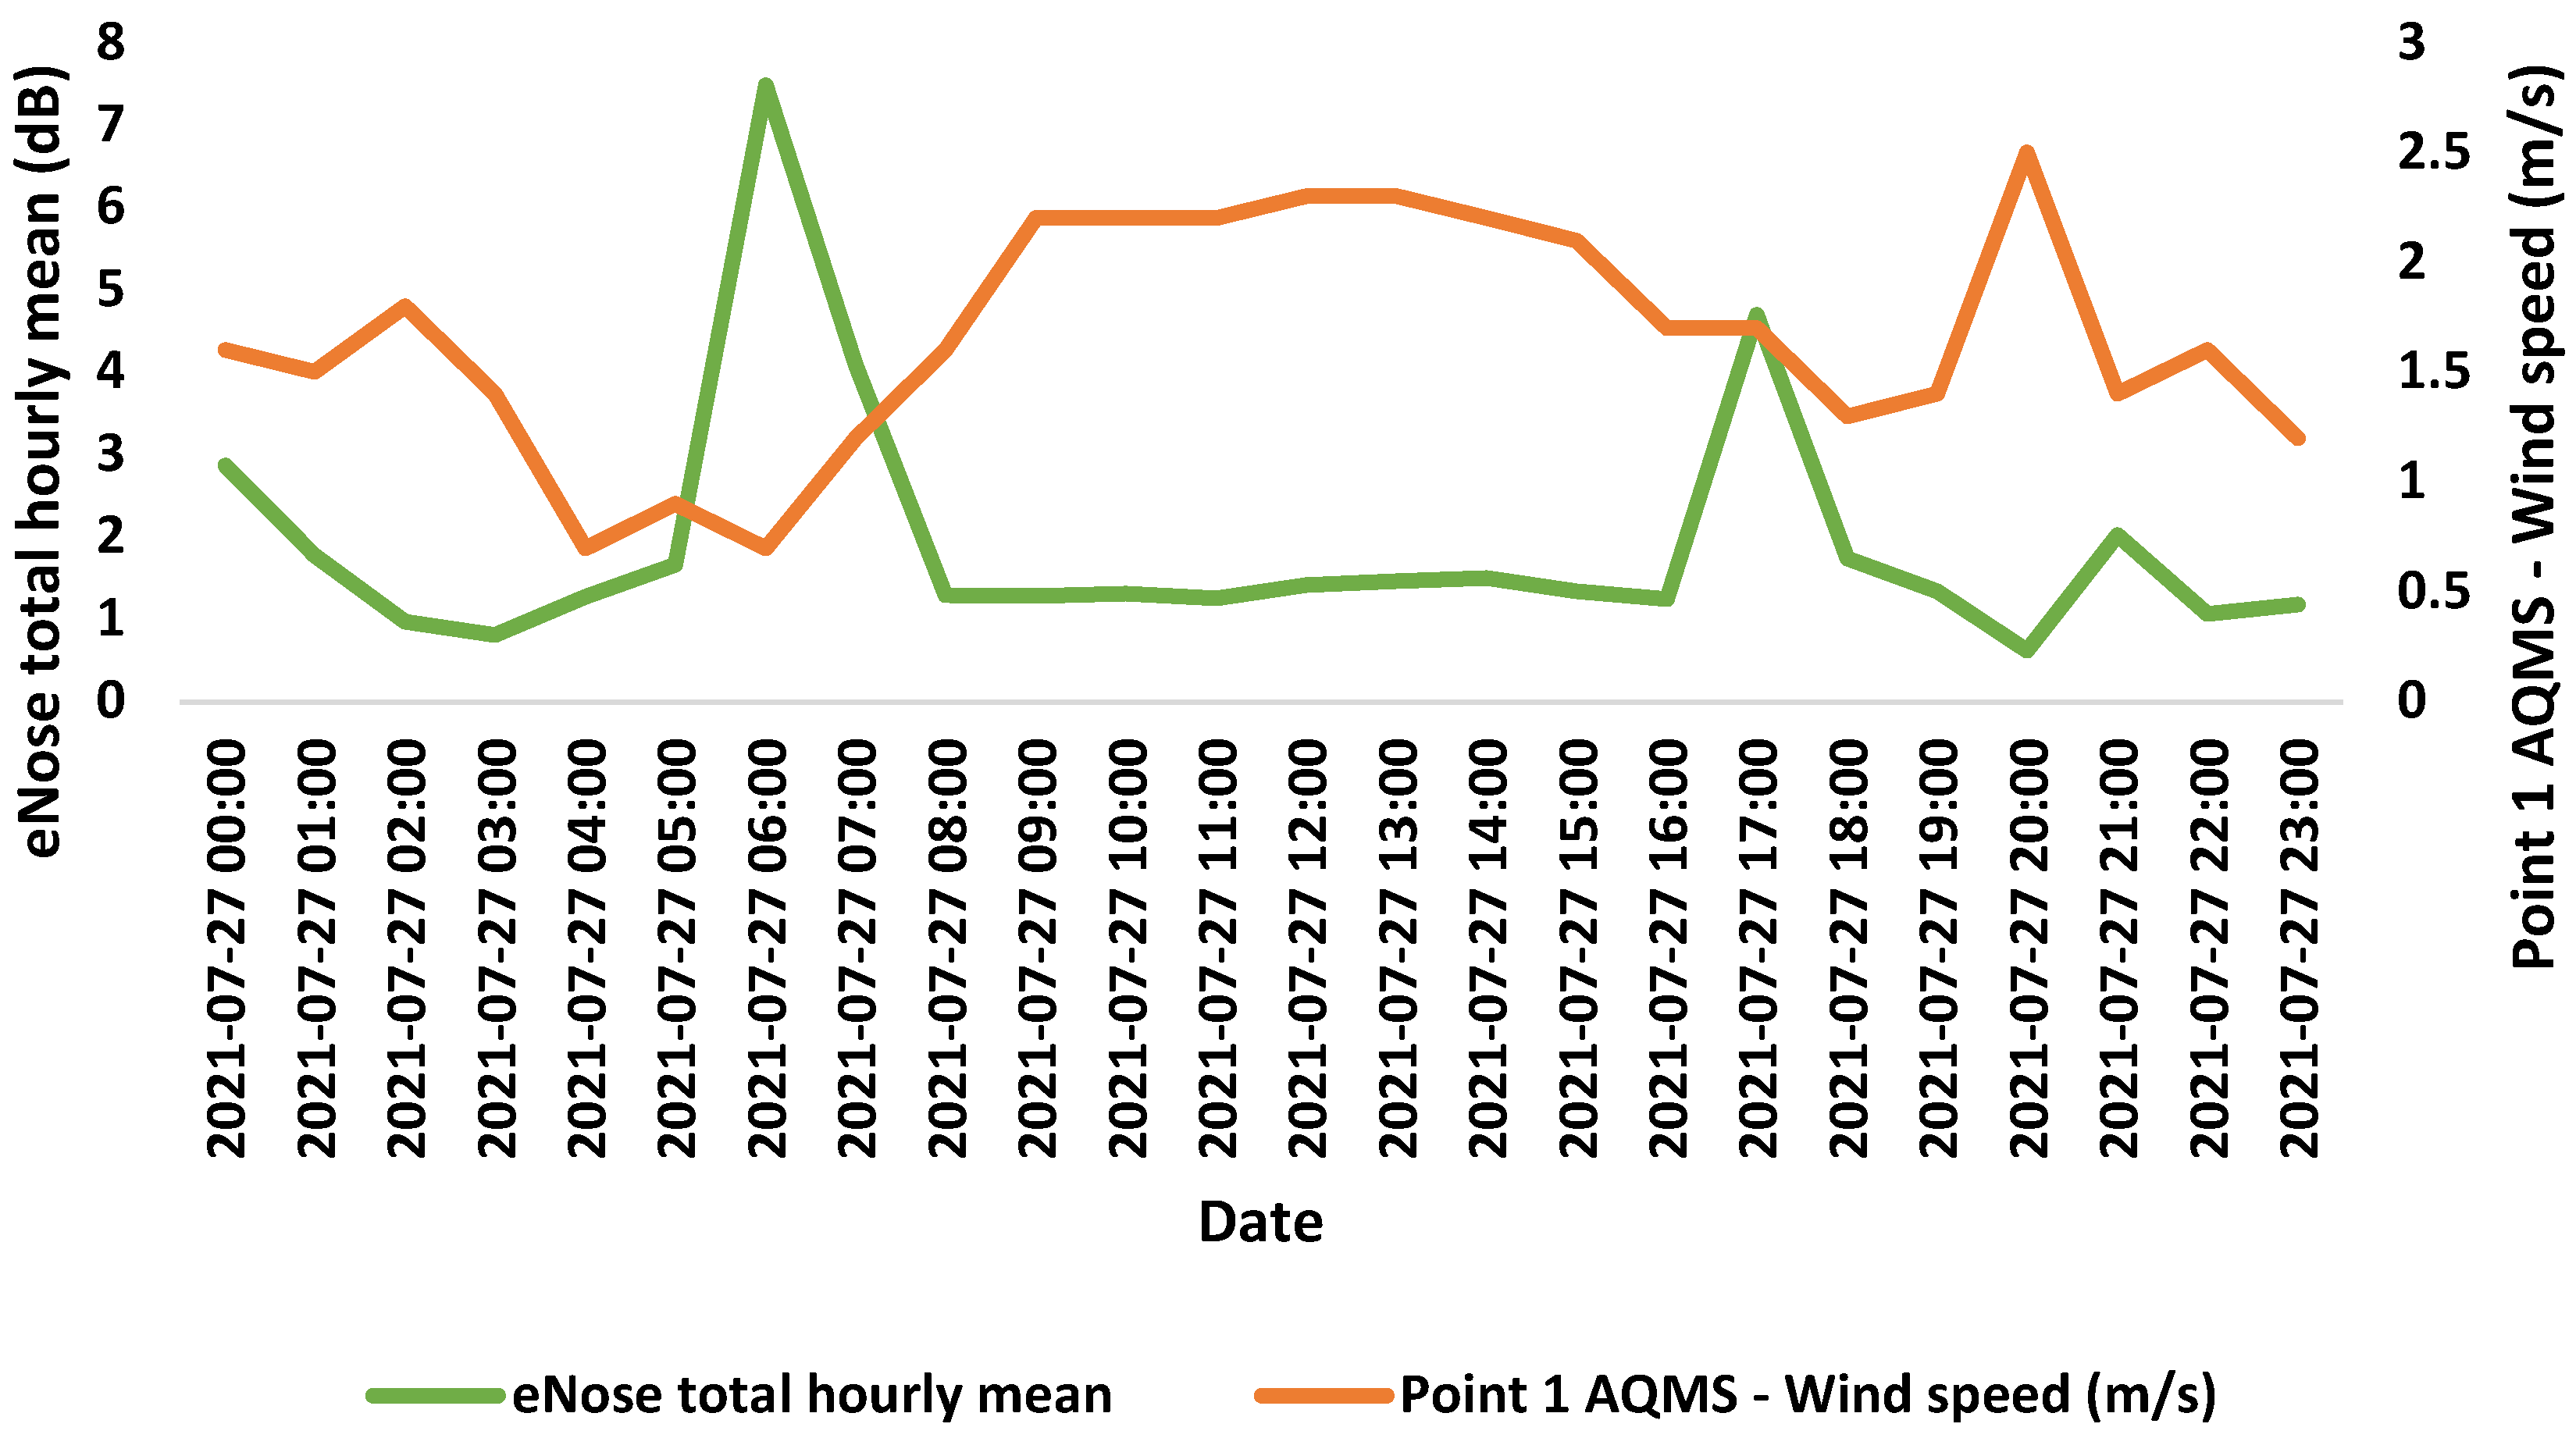
The blue line in Figure 5 represents the NMHC concentration measured by point 1 AQMS, in parts per million, whereas the orange line represents the wind speed measured in metres per second on July 27, 2021. Figure 6 presents a contrast between the total hourly mean of the eNose sensor (represented by the green line) and wind speed measurements measured in metres per second (represented by the orange line) on the same day. The eNose and AQMS readings shows similar average trend distribution. NMHC concentrations are highest around 7:00 AM, while eNose values are highest on average at 6:00 AM. In addition, there is a significant concentration of NMHC at 6:00 p.m. since the wind speed is low. There are stronger winds throughout the day and weaker winds at night. Average readings from an eNose or AQMS are inversely related to the velocity of the wind. Low values of both the mean eNose and AQMS measurement patterns are recorded during the day.
Discussion:
point 1 AQMS has the highest average of NMHC concentration in 2021 that equals to 0.424 ppm compared to Point 2 AQMS measurement which is 0.256 ppm. The direction and velocity of the wind, as well as the proximity of the emissions sources, could be the contributing factors. point 1 is located more closely to the sources that generate NMHC, such as ship loading activities. Given its proximity to point 1 AQMS, the eNose site location was selected. The wind can transport air pollution away from its source and disperse it in other areas (Bishop, 2021). Highest NMHC concentrations in 2021 has been observed in May, when the wind was gusting from the southeast at a level of 21.22 parts per billion (ppb). Additionally, the emission could potentially be caused by traffic. Comparing sensor total eNose and point 1 AQMS measurements, the results indicate that both share the same pattern on certain dates, with maxima occurring virtually at the end of each month. To get better results, the S2 sensor of the eNose could be compared to the NMHC concentration of point 1 AQMS rather that the total eNose sensor values since S2 is less sensitive compared to the other three sensors so there is no huge changes in the pattern and could give more accurate results when it comes to NMHC. Higher wind speeds lead to a greater dispersion of the pollution, which decreases its concentrations. The study demonstrates the correlation between wind speed and point 1 AQMS data and the eNose sensor confirming that higher concentrations of pollutants will be present at lower wind speeds. The concentration is highest at night, when the wind is calmest, and lowest during the day, when the wind is at its strongest; this pattern holds true for both the eNose and the point 1 measurements.
Conclusion:
Rapid advances in IoT and sensor technologies, including electronic nose have revived air quality monitoring. This study examined NMHC signatures in urban regions and the relationship between windspeed and pollution concentrations. Interestingly, the study reveals the association between wind speed, wind direction, point 1 AQMS data, and the eNose sensor, demonstrating that there would be higher amounts of pollutants at lower wind speeds. Moreover, traffic can be a major contributor to pollution levels. However, in order to make firm findings and provide workable solutions, more study based on a larger dataset is required.
Conflicts of Interest
The authors declare that they have no conflict of interests.
References
- Google Colab. 2014. Available online: https://colab.research.google.com/.
- Bambang Dwi Kuncoro, C. , Armansyah, A., Saad, N. H., Jaffar, A., Low, C. Y., & Kasolang, S. Wireless e-Nose sensor node: State of the art. Procedia Engineering 2012, 41, 1405–1411. [Google Scholar] [CrossRef]
- Bishop, S. wind speed and direction. 2021. Available online: https://www.clarity.io/blog/air-quality-measurements-series-wind-speed-and-direction.
- Boon, B. Report on maritime transport and the environment for Latin America. CEPAL, División de Recursos Naturales e Infraestructura. 2007. [Google Scholar]
- Bootsma, S. , Leuwerink, T., & Bilsen, I. Online air monitoring with enoses at the TATA Steel plant in the Netherlands. Chemical Engineering Transactions 2014, 40, 79–84. [Google Scholar] [CrossRef]
- Bourtsoukidis, E. Ernle, L., Crowley, J. N., Lelieveld, J., Paris, J.-D., Pozzer, A., Walter, D., Williams, J. Non Methane Hydrocarbon (C2-C8) sources and sinks around the Arabian Peninsula. 2020. [Google Scholar] [CrossRef]
- comon invent. 2022. Available online: https://www.comon-invent.com/ (accessed on 9 October 2022).
- Karakaya, D. , Ulucan, O., & Turkan, M. (2020). Electronic Nose and Its Applications: A Survey. In International Journal of Automation and Computing (Vol. 17, Issue 2, pp. 179–209). Chinese Academy of Sciences. [CrossRef]
- Kumar, A. , Sinha, V., Shabin, M., Hakkim, H., Bonsang, B., & Gros, V. Non-methane hydrocarbon (NMHC) fingerprints of major urban and agricultural emission sources for use in source apportionment studies. Atmospheric Chemistry and Physics 2020, 20, 12133–12152. [Google Scholar] [CrossRef]
Figure 1.
An analogy of the biological olfactory system to the electronic nose technology (Karakaya et al., 2020).
Figure 1.
An analogy of the biological olfactory system to the electronic nose technology (Karakaya et al., 2020).
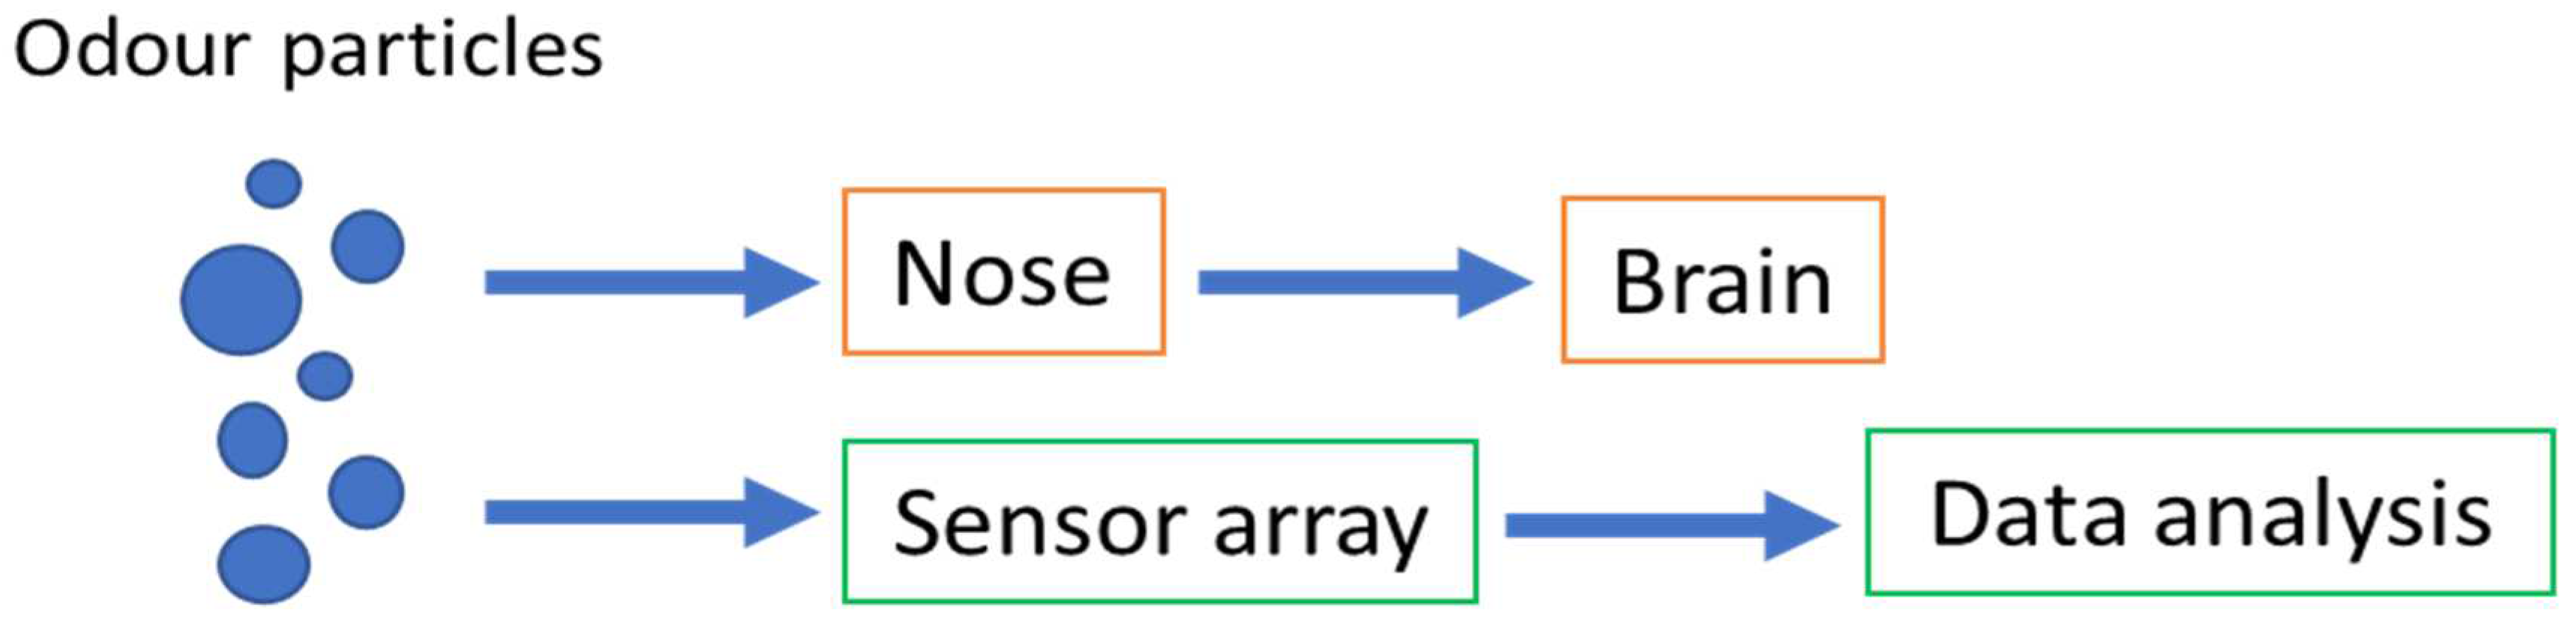
Figure 3.
Quantification of the relationship between wind direction and NMHC concentration. Horizontal axis: wind direction in degrees; vertical axis: NMHC concentrations in ppm.
Figure 3.
Quantification of the relationship between wind direction and NMHC concentration. Horizontal axis: wind direction in degrees; vertical axis: NMHC concentrations in ppm.
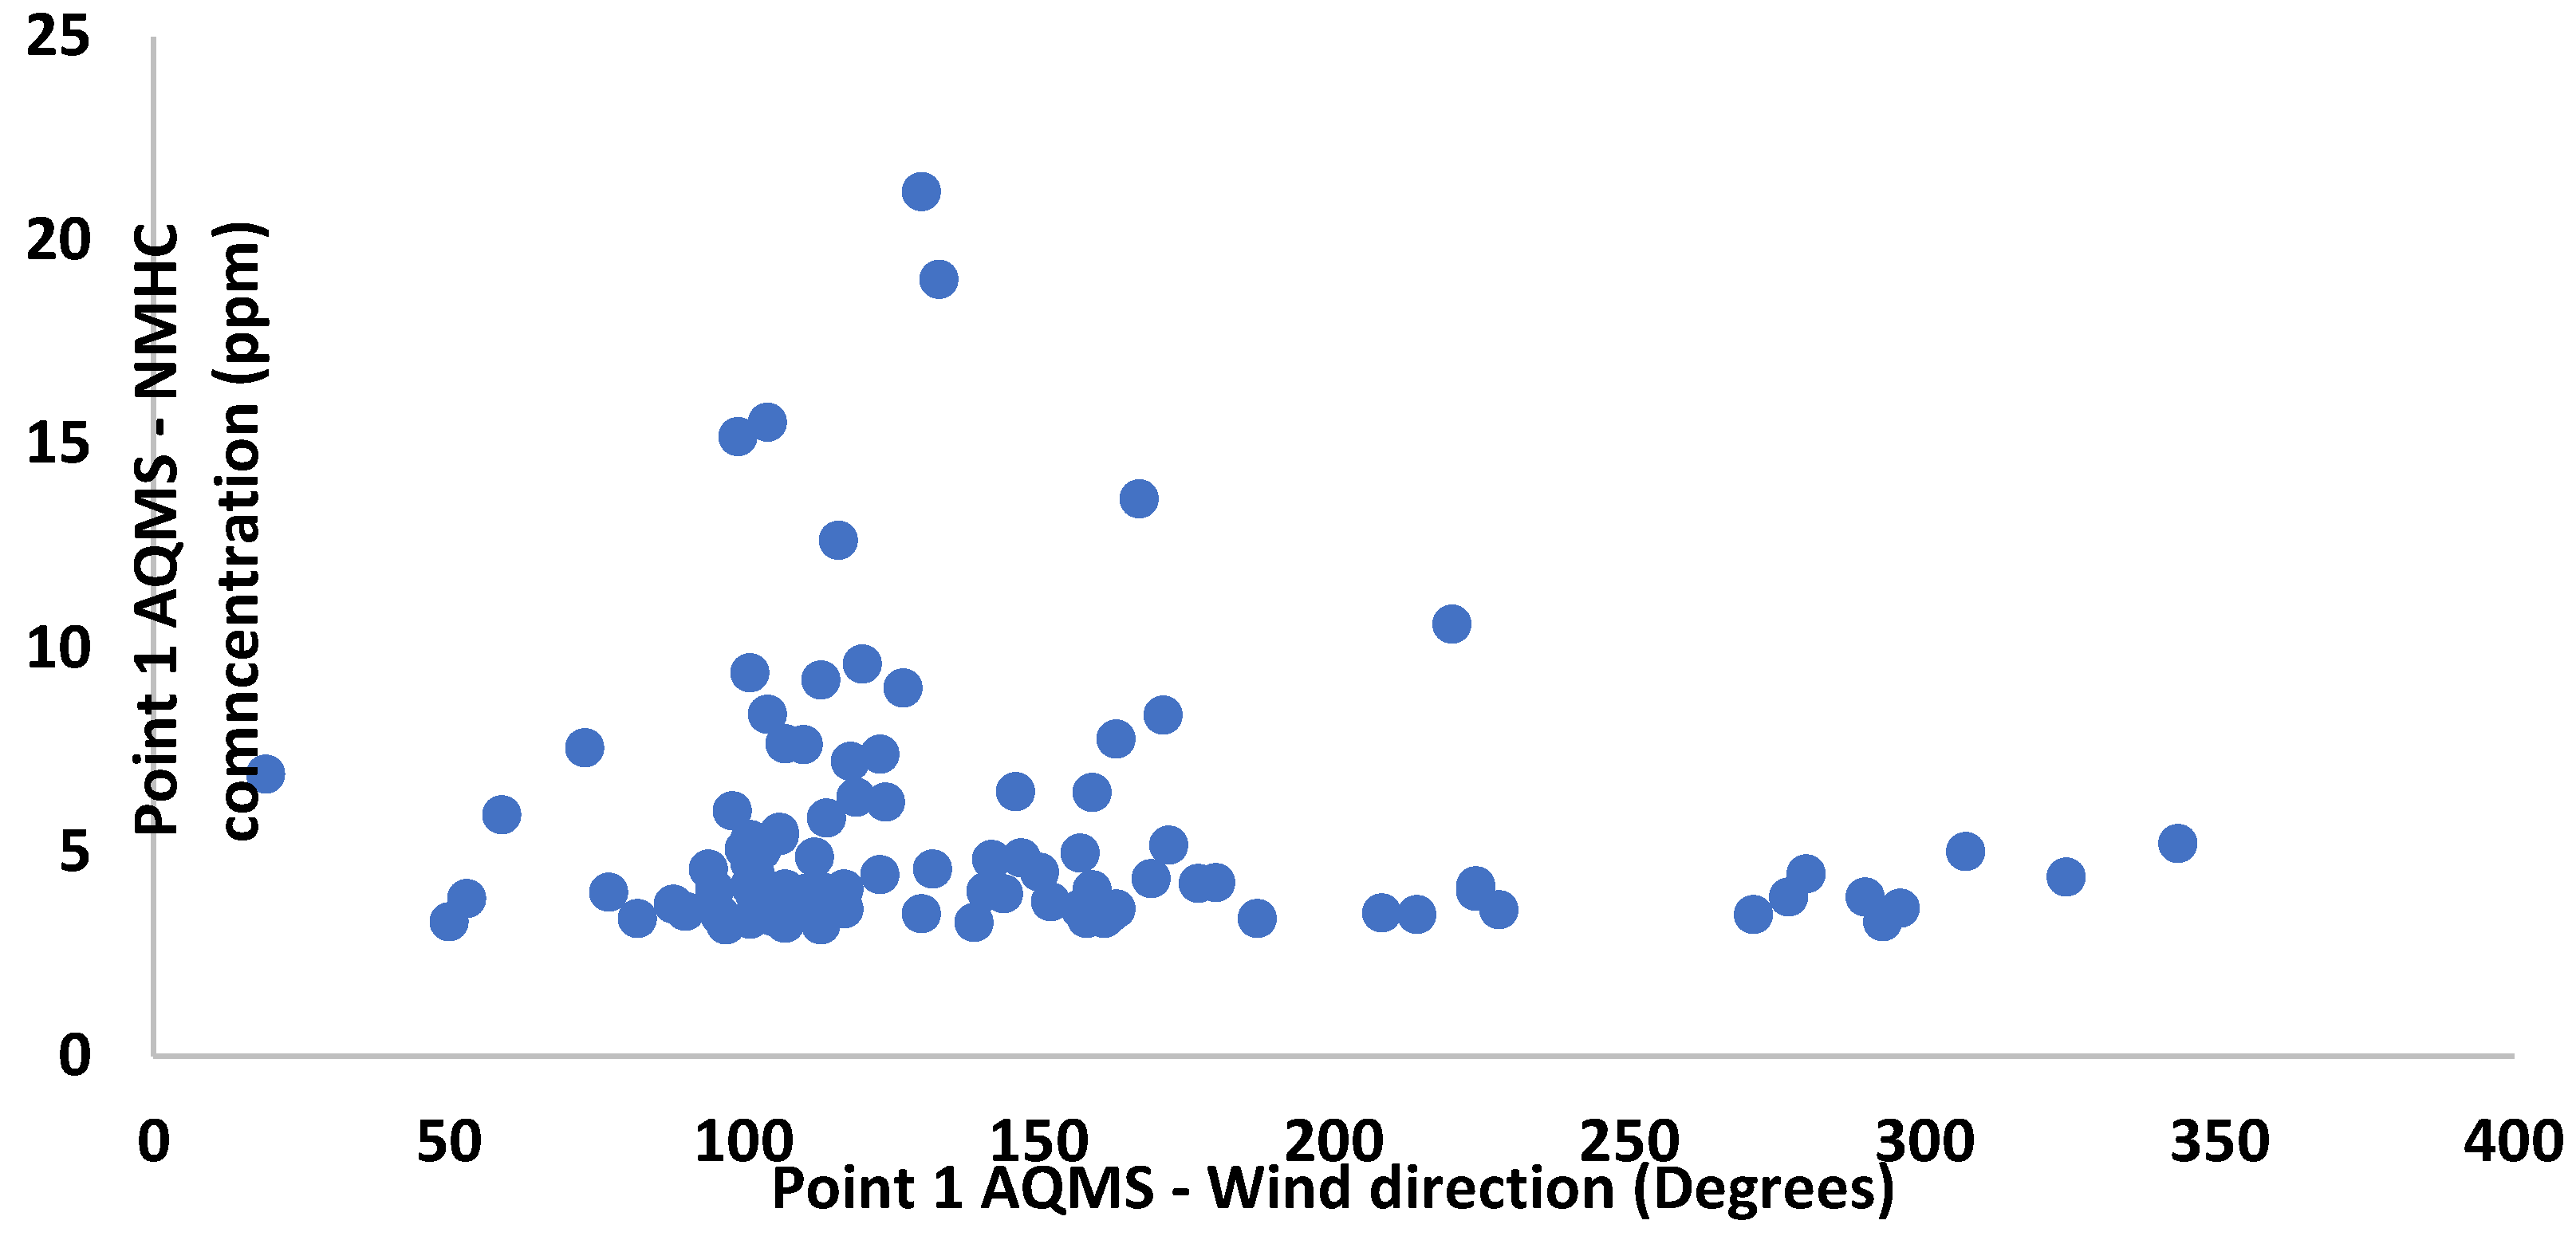
Figure 5.
Comparison of the NHMC and windspeed. Point 1 AQMS's NMHC concentration in ppm (blue line) is displayed in the major vertical axis (on the left), along with the date on the horizontal axis and wind speed in m/s (orange line).
Figure 5.
Comparison of the NHMC and windspeed. Point 1 AQMS's NMHC concentration in ppm (blue line) is displayed in the major vertical axis (on the left), along with the date on the horizontal axis and wind speed in m/s (orange line).
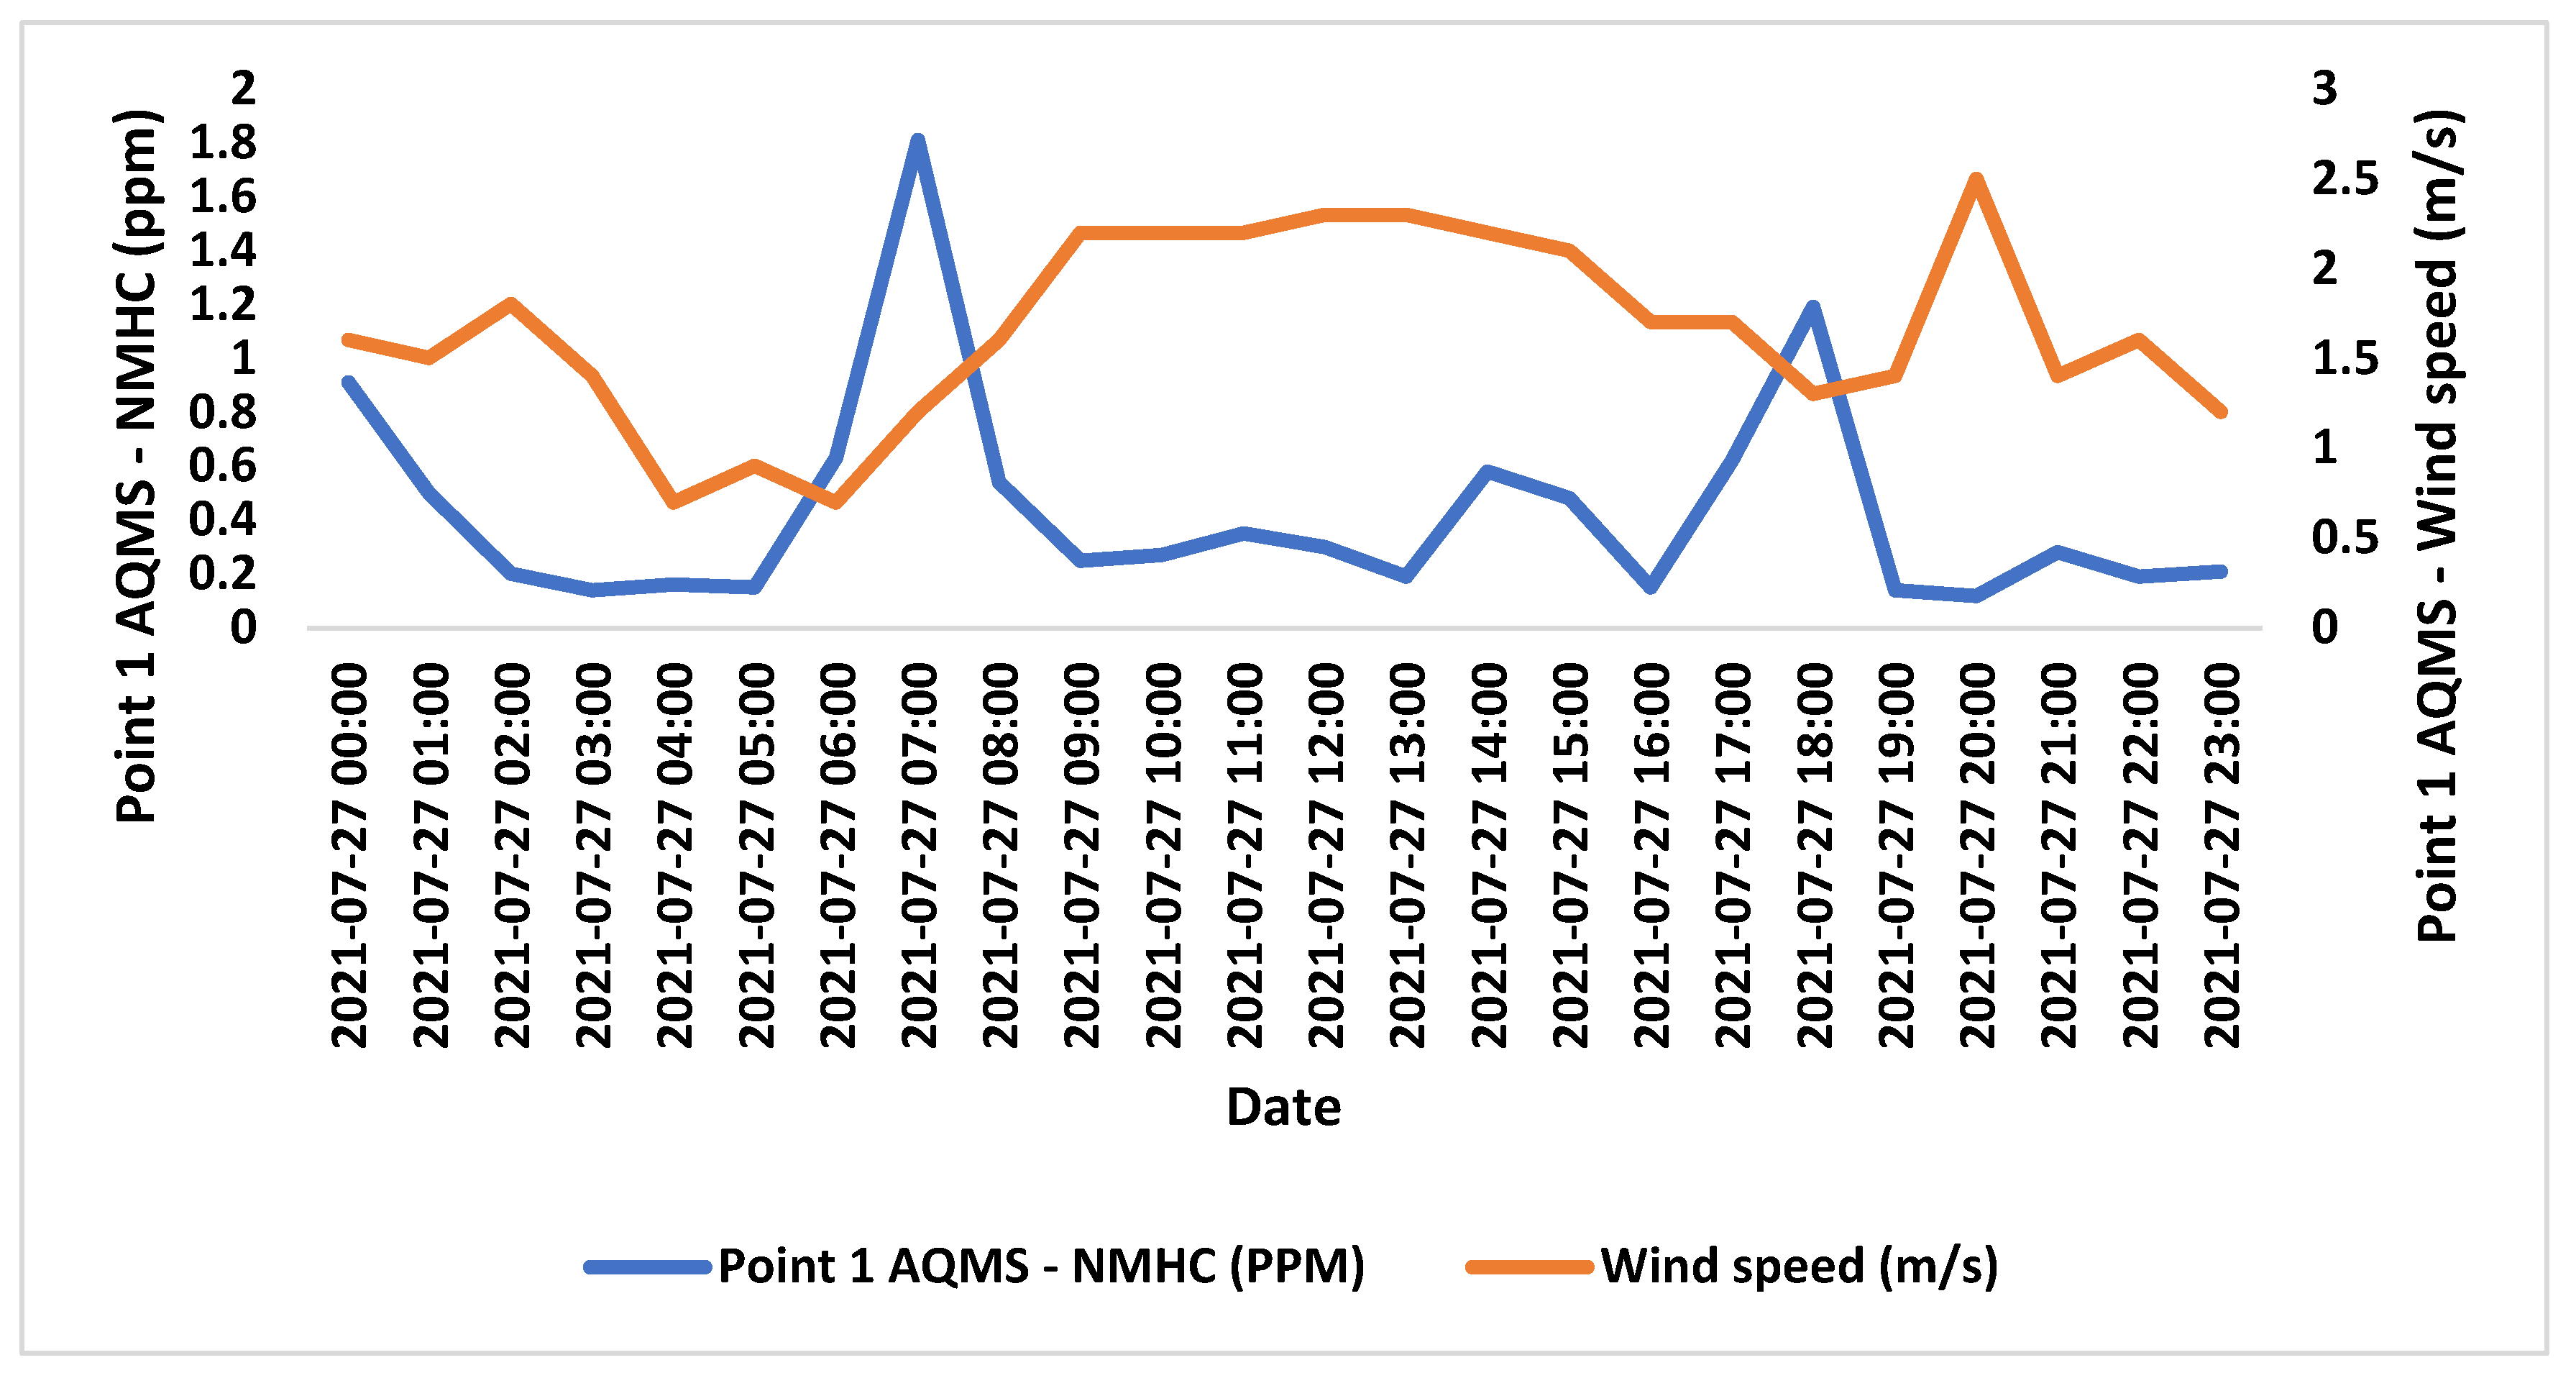
Figure 6.
Quantifying the relationship between eNose sensor data and windspeed. eNose sensor total hourly mean (green line) in dB unit shown in primary vertical axis (on the left), wind speed in m/s from point 1 AQMS (orange line) shown in secondary vertical axis (on the right) and the date on horizontal axis.
Disclaimer/Publisher’s Note: The statements, opinions and data contained in all publications are solely those of the individual author(s) and contributor(s) and not of MDPI and/or the editor(s). MDPI and/or the editor(s) disclaim responsibility for any injury to people or property resulting from any ideas, methods, instructions or products referred to in the content. |
© 2023 by the authors. Licensee MDPI, Basel, Switzerland. This article is an open access article distributed under the terms and conditions of the Creative Commons Attribution (CC BY) license (http://creativecommons.org/licenses/by/4.0/).
Copyright: This open access article is published under a Creative Commons CC BY 4.0 license, which permit the free download, distribution, and reuse, provided that the author and preprint are cited in any reuse.


